Article

Comparative Evaluation of Sustainable Design Based on Step-Wise Weight Assessment Ratio Analysis (SWARA) and Best Worst Method (BWM) Methods: A Perspective on Household Furnishing Materials

by
Sarfaraz Hashemkhani Zolfani
1 and
Prasenjit Chatterjee
2,*
1
School of Engineering, Catholic University of the North, Larrondo 1281, Coquimbo, Chile
2
Department of Mechanical Engineering, MCKV Institute of Engineering, Howrah 711204, West Bengal, India
*
Author to whom correspondence should be addressed.
Submission received: 17 December 2018 / Revised: 28 December 2018 / Accepted: 5 January 2019 / Published: 10 January 2019

Abstract

:
For a few years, there has been an increasing consciousness to design structures that are concurrently economic and environmentally responsive. Eco-friendly inferences of building designs include lower energy consumption, reduction in CO2 emissions, assimilated energy in buildings and enhancement of indoor air quality. With the aim of fulfilling design objectives, designers normally encounter a situation in which the selection of the most appropriate material from a set of various material alternatives is essential. Sustainability has been developing as a new concept in all human activities to create a better balance between social, environmental and economic issues. Designing materials based on the sustainability concept is a key step to enable a better balance because there is no need to re-structure phases and procedures to make the system more efficient in comparison to previous models. Some of the most commonly used materials are household furnishing materials, which can be electrical devices, kitchen gears or general furnishing materials. The volume of production and consumption of these materials is considerable, therefore a newer sustainable plan for a better designed system is justifiable. In the literature, the application of multi-attribute decision-making (MADM) methods has been found to be very suitable for evaluating materials and developing general plans for them. This study contributes by applying two approaches based on MADM methods for weighting the criteria related to the sustainable design of household furnishing materials. Step-Wise Weight Assessment Ratio Analysis (SWARA) and Best Worst Method (BWM) are two specialized and new methods for weighting criteria with different approaches. This paper has not only investigated the weighting of important and related criteria for sustainable design but has also evaluated the similarities and differences between the considered weighting methods. A comparative study of SWARA and BWM methods has never been conducted to date. The results show that, except pairwise comparisons, SWARA and BWM are certainly similar and in some cases SWARA can be more accurate and effective.

1. Introduction

Rapid movements of a large number of populations from rural to urban areas and socio-economic changes that transform the agricultural human society into an industrial society, involving the extensive economic re-organization intensify the rate of resource deficiency and ecological contamination globally. Due to uncontrolled urbanization, environmental degradation has been occurring very quickly, causing land insecurity, water quality degradation and air and noise pollution, along with severe waste disposal issues. However, due to urbanization and economic globalization, the manufacturing and construction industries are becoming the fastest developing sectors everywhere. Superior financial affordability of consumers led to an increased requirement for improved life, better aesthetics and comfort level, which ultimately asserts high demands for the interior features in terms of artifact materials [1]. Interior designers have incredible influence by deciding the types of materials and products to be used to make a viable, endurable and ecologically-clean living environment. A home designed for energy efficiency will have the advantage of the site, sunlight and natural breezes. Conventionally, the interior designing job has been confined to conformist practice, focusing only on style and extravagant design while ignoring energy savings, toxic emissions, the harmful effects on customers’ psychophysical health, and environmental pollution. However, recent trends in interior design have seen a spectacular move towards design policies that not only focus on the creation of art, beauty and taste, but also a healthy and sustainable environment for consumers to live and work in [2]. Thus, sustainability is a big trend in today’s construction industry for energy use, resource efficiency, material selection, safety and life-cycle management, for developing an environmentally responsible environment.
Green or sustainable household furnishing material selection plays a considerable role in the entire interior design process to ensure better product performance and diminished life-cycle impact to the surroundings and individuals’ health. Green or sustainable household furnishing materials generally refer to all the physical substances that are accumulated to craft the building interior. The primary advantages of using sustainable household furnishing materials in indoor environments are the reduction of health costs, increased employee productivity in work areas and greater shrinkage in operation and maintenance costs. In addition, these materials also help to reduce the adverse impacts associated with their processing, fabrication, installation, recycling and removal. Today, most buildings are constructed from a variety of materials that have specific functionalities and multipart assembly requirements. However, selecting the most appropriate decoration material for a particular industrial application, considering multi-perspective criteria, is not an easy task and is a great challenge for the interior decorators. Architects need to consider a range of selection criteria including some basic requirements like visuals, acoustic, tactile along with environmental requirements including energy consumption, low carbon emission features, recyclability and regional reachability, reduction of cost, meeting legal requirements, accounting for operating conditions and making the new product more competitive. There are a number of reasons for the evaluation and selection of the best suited material for a given case study. These include making improvements in service performance, reduction of cost, meeting the new legal requirements, accounting for the operating conditions, making the new product more competitive, to name a few [3]. On the other hand, inappropriate material selection frequently leads to early product failure with reduced efficiency, recurrence of processes, substantial financial loss and pitiable product performance, there by negatively affecting the output, effectiveness, environment and status of the organization.
Under these circumstances, a mechanism is required to explore the alternative candidates and identify the best one. Although sustainable design has become a leading concern in the interior design business, evaluation and selection of sustainable materials in real practice is limited due to the complexities involved. The optimal solution must satisfy the decision maker’s (DM’s) objectives, which are often conflicting in nature. For this purpose, the DMs need to deal with a large amount of data to arrive at the decision with the most consensus. The complexity of an engineering difficulty can be eased with the development of a well-structured decision-support tool that can deliberate multiple conflicting criteria [4]. The existing literature is flooded with numerous applications of classical and trial and error-based methods while many engineering industries are reforming their evaluation and measurement systems by adopting advanced decision-making methodologies. A multi-attribute decision-making (MADM) method can thus be a useful approach to the process of material assessment and selection [5]. The MADM methods have the potential to determine a ranking pre-order of the considered material alternatives from the first ranked to the last ranked in the presence of several mutually confounding properties. As all MADM problems include multiple criteria that have different importance levels due to the preferences of the DMs, the determination of criteria weights is one of the significant issues. The problem of choosing an appropriate technique for estimating criteria weights is very important as this directly affects the outcome of the entire evaluation and selection process. That is why numerous weight elicitation methods have been developed in order to confront this cognitive issue. The purpose of this paper is to compare the results of variability between the criteria priorities for Stepwise Weight Assessment Ratio Analysis (SWARA) and Best-Worst Method (BWM) for weight elicitation and to make suggestions about the conditions of using these two methods for sustainable material selection problems. It is the first time that SWARA is compared with BWM, and this makes the study different and unique.
The paper is organized as follows: Section 2 presents the literature review on sustainable material selection; Section 3 presents the research gap; in Section 4, detailed mathematical formulations of the considered methods have been presented; a comparative study between the considered methods for a sustainable household furnishing material selection problem has been discussed in Section 5 and Section 6 concludes the paper.

2. Literature Review

Numerous studies have already been directed in addressing material selection problems using different ranking and optimization techniques. However, the literature shows many fewer works that deal with the problems on green materials’ selection, particularly, there is no convincing ground of scientific research on comprehensive and holistic approaches used by design engineers for the assessment of household furnishing materials [6]. Thus, the aim of this section is to study past research on sustainable material selection to understand their weaknesses and enable the DMs to reduce subjectivity and uncertainty to ensure clearer support for a strong framework. Some basic models like the Leadership in Energy and Environmental Design (LEED), an extensively deployed building assessment system and Building Research Establishment Environmental Assessment Methods (BREEAM), the foremost sustainability evaluation strategy are vastly used for materials assessment and performance prediction. The LEED system boosts the utilization of materials that have a good amount of recycled content, fast renewable periods, accountable garnering management, low poisonous substance and proper solar reflectance and emissivity indices. Whereas the BREEAM system evaluates the environmental impacts of various construction materials and considers environmental issues. User-defined weighting is also incorporated to derive the values of different environmental impacts. However, due to the lack of flexibility and requirement of superior technical expertise, the use of LEED and BREEAM systems are limited and most designers and architects select such materials based on their past knowledge, experience and perception, thereby limiting the practical applications and result in considerable disappointment. Also these tools are only environment conscious and neglect economic and social concerns when selecting materials. Castro-Lacouture et al. [7] projected a mixed integer optimization (MIO) model incorporating different constraints to maximize the values achieved in the LEED rating system. Zhou et al. [8] developed a multi-objective optimization (MOO) model for sustainable material selection through an integrated artificial neural network (ANN) and genetic algorithm (GA) approach while considering mechanical properties, process, cost, performance and environment related factors. Rahman et al. [9] employed the technique of ranking preferences by similarity to the ideal solution (TOPSIS) method to develop an integrated model for optimizing the roof material selection process. Maniya and Bhatt [10] advocated the use of a preference selection index (PSI) method to search for an appropriate material that fits with the engineering requirements. Akadiri et al. [11] presented a fuzzy extended analytical hierarchy process (FEAHP) for building material selection. Florez and Lacouture [12] explored the applicability of a MIO framework while considering the potential impact of cost constraints, design considerations; environmental requirements along with some subjective factors to help the DMs in selecting the best green material for construction projects. Baharetha et al. [13] highlighted that durability, reuse, efficient energy usage, maintainability and lower negative environment impacts are the predominant factors for a sustainable material selection process. Ribeiro et al. [14] suggested a comprehensive life cycle assessment (LCA) model for four commercial biodegradable polymers. Hosseinijou et al. [15] proposed social-LCA process for building material selection. The proposed methodology was also capable for comparative products assessment. Van der Velden et al. [16] employed a material selection model based on LCA for a wearable smart textile device to promote sustainability while considering resource diminution cost, carbon footprint and human health as the major indicators. However, LCA is very intricate to implement in real life applications, attributable to the complexities involved in data acquisition and data quality control. Zhao et al. [17] used an integrated MADM approach encompassing AHP and Grey relational analysis (GRA) methods for sustainable design of a plastic pipe. Ma et al. [18] used a combined Entropy, TOPSIS and LCA approach for an automotive material selection application. Bhowmik et al. [19] also adopted Entropy-TOPSIS model to evaluate energy-efficient materials considering some predefined material properties. Criteria weights were calculated using the Entropy method, whereas TOPSIS was applied to rank the alternative materials.
The material selection process frequently considers some archetypal factors like light weight, economic manufacturing, product function, quality, performance and aesthetics and customer satisfaction. Less attention has been paid to the environmental and social impacts of the building materials. Nowadays, the advancement of the material selection process has moved towards social and sustainable criteria. Even though the principal material selection is the same for both sustainable and regular materials, the presence of a diverse range of criteria makes the selection process quite complex and time consuming. Table 1 shows that criteria for selecting sustainable materials can be grouped into three major dimensions or criteria levels. The first dimension (economic sustainability) indicates planned designs, which can avoid the requirements of major future restorations and thus reduce costs associated with energy use, water use and maintenance. The second dimension (social sustainability) mainly helps to prevent injuries through incorporating built-in safety attributes to provide adjustability and consolation for people of alternative capabilities in distinct life phases. The third and last dimension (environmental sustainability) is intended to reduce greenhouse gas emissions, proper utilization of water and energy along with reduced waste. However, the relative significance of these attributes is very challenging to estimate.

3. Research Gap

By summarizing and exploring the existing literature, two major conclusions can be drawn. First of all, a comprehensive hierarchical structure for sustainable material criteria has never been developed by the earlier researchers and also several social and environmental dimensions have been overlooked. Secondly, for estimating criteria weights for sustainable material selection issues, previous studies have mainly adopted the Entropy and AHP methods for different assessment rationales [11,17,18,19]. However, a weighting method like AHP uses pairwise comparisons for preference input and it is based on the DM’s knowledge about the problem. DMs usually have different persuasion, background, and knowledge levels and can hardly arrive at conformity on the relative importance of criteria which ultimately lead to deviations of criteria weights due to the involvement of subjective factors. While the objective weighting method, Entropy, is based on inherent criteria information, which has the ability to reduce man-made errors and make results in more accord with facts. The smaller the entropy value is, the smaller the disorder degree of the system is small. The Entropy method is particularly suitable for those situations in which either decision matrix is purely cardinal, or the ordinal values are converted to the comparable numbers or appropriate scales.
Since criteria weight has an enormous influence on the outcome of any MADM method, the sole pivotal dilemma is to evaluate the weights of different material characteristics. Additionally, the rationality of the weight estimation has an evidential effect on the consistency and precision of the computational results. Therefore, there is a need for an unambiguously acceptable methodology to guide the DMs to determine the criteria weights. Thus, this research aims to evaluate the sustainable material selection design and planning more objectively and realistically by introducing a hierarchical structure of the sustainable material selection criteria, as shown in Figure 1.

4. Comparative Methodologies

MADM has been developing new perspectives and methods. Mostly, new contributions on methods can be categorized in two sections. The first section mainly focuses on developing criteria weighting techniques, while the other section is centering on the ranking of alternatives. The most commonly used methods for estimating criteria weights are AHP (Saaty [41]) and the Analytic Network Process (ANP) (Saaty [42,43]), whereas, among the new criteria weight determination approaches, SWARA (Kersuliene et al. [44]), Factor Relationship (FARE) (Ginevicius, [45]), BWM (Rezaei, [46]), Extended SWARA (Hashemkhani Zolfani et al. [47]), and Full Consistency Method (FUCOM) (Pamucar et al. [48]) are worth mentioning. There are also some studies that focused on the applications of different MADM methods in sustainability challenges and decisions [49,50,51,52,53]. This section highlights some of the key factors for product comparison or selection and provides a tangible basis for fixing priorities with a view to tarnish the environmental footprint of any building. Generically, product-to-product demarcations are likely to be ambiguous when it deals with construction and casing or envelope materials. Product-to-product comparisons are more pragmatic for interior finishes, outfit products and interior decorations. For instance, springy or pliable floor coverings can freely be analyzed and compared with each other as far as installation materials, product cleaning, expected service life and end of a product’s life are pondered. Window systems are usually mobilized to a construction site as pre-assembled elements that can be mutually compared in terms of thermal performance and other criteria, without too much regard for eclectic system speculations. However, this strategy will fail when scores are assigned to evaluate building materials in different rating systems. This is due to the fact that material scores germinate from a concurrent apprehension of environmental issues that does not necessarily go with the objective analysis. For example, according scores for recycled content in products presumes reduced environmental hazards. However, it may not always stand practical, and recycling for any specific application may have congenial impacts. It is well established that reuse or recycling can conserve hazardous waste dump, but at the same time, there is a likelihood of consuming more energy and detrimental upsets on air and water quality. The center of interest on recycling defines these unfavorable footprints and utterly gives additional weightage to solid waste and resource depletion issues as compared to global warming traits. Early conceptual design decisions are mostly concentrated to the initial material related environmental consequences of a building due to the considerations of fundamental structure and envelope elements. These are customarily the towering mass elements with remarkable manufacturing and transportation domination. Thus, it makes acceptable perception to allocate higher weightage to the environmental implications of materials at the initiation of the design procedure.
Except SWARA, other methods are based on pairwise comparisons, although there are big differences in the way of calculating the criteria weights. For example, the original BWM method, based on a non-linear model, is used only for the estimation of criteria weights [46,54]. Also, there is a simplified BWM method based on a linear model. SWARA is a policy-based method which works on weighting criteria depending up on their priority. This priority can be arranged by policy makers on the basis of descriptive future scenarios and current regulations and strategic plans [55,56,57,58].
BWM and SWARA have similar ideas with different perspectives and have not been reported yet. The notion of identifying the best and worst criterion in the BWM method is very similar to the first step of the SWARA method. When criteria are prioritized on a policy basis, a preference order emerges, which helps in identifying the best and worst criteria. When these two criteria are identified, the same pairwise comparisons as used in the SWARA method are accomplished due to similar expert opinions. BWM somehow is also a link to connect these two perspectives in weighting criteria and this research study attempted to work on this idea to check the results of SWARA and BWM methods in a single framework. During the past few years, there have been a significant number of studies associated with the applications of SWARA and BWM implementations which can be found in References [59,60].

4.1. Best Worst Method (BWM)

As one of the latest MADM methods, BWM can efficiently tackle the inconsistency derived from pairwise comparisons. This method is more consistent in comparison to the AHP, ANP, FARE and Simple Multi-Attribute Rating Technique (SMART) methods [61,62]. The BWM method has been cited 249 times-based on Google scholar information (until 19 November 2018). BWM has been applied in different studies and fields including supplier selection and development [63]; water management [64]; complex bundling configurations [65]; urban sewage sludge application [66]; social sustainability of supply chains [54]; measuring logistics performance [67]; identifying success factors [68]; cloud service selection [69]; evaluating university-industry doctoral projects [70].
The structure and basic steps of BWM method is as follows [46,71]:
Step 1: Selecting and identifying criteria in a common way; literature review, expert ideas and other probable ways.
Step 2. Identifying and selecting the best and worst criteria based on experts’ ideas and opinions.
Step 3. Designing the preferences matrix based of comparing best criterion over all others by applying numbers ranging between 1 and 9.
A b = ( a 1 B , a 2 B , a 3 B , a n B )
Step 4. Designing the preferences matrix based of comparing worst criterion over all others by applying numbers between 1 and 9.
A b = ( a 1 W , a 2 W , a 3 W , a n W )
Step 5. Finding the relative importance of criteria through calculation of final and optimal weights (w1*, w2*, w3*, ….wn*) by solving the following optimization model.
M i n max j { | ( w B / w j ) a B j | , | ( w j / w w ) a j w | }
Subject to j w j = 1
Model (3) can easily be converted to Model (4) to find out the optimal weights (w1*, w2*, w3*, ….wn*) and the optimal value of reliability level (ξ*):
M i n ξ | w B w j a B j | ξ   f o r   a l l   j | w j w w a j w | ξ   f o r   a l l   j j w j = 1 w j 0   f o r   a l l   j
where wB and ww indicate the weights of the best and the worst criteria respectively. aBj is the preference of the most important (best) criterion over criterion j and ajw is the preference of criterion j over the least important (worst) criterion.
Step 6. Estimating the consistency ratio (Ksi) to verify the reliability level of the pairwise comparisons using Equation (4).
Similar to the AHP method, a consistency index (CI), as shown in Table 2, helps to determine the Ksi value. A smaller Ksi value (close to zero) indicates superior consistency, whereas, a higher Ksi value (close to one) indicates inferior consistency made during pairwise comparisons [46].
K s i = ξ * C I
aBW in Table 2 indicates the preference of the best criterion over the worst criterion. It is important to mention that CR in the AHP method is basically used to substantiate the validity of comparisons, but in BWM, its main function is to find the degree of reliability of the pairwise comparisons, thus provides more conformable results. Also, BWM employs many fewer comparisons (2n − 3) by forming comparison-vectors. This phenomena assures more reliability of the weights obtained by BWM as compared to the weights of AHP method. These advantages of BWM method have led the foundation of selecting it for sustainable material selection assessment. In addition to this, in BWM, no fractional numbers are used which makes the computation easier for the DMs. Rezai [46,71] statistical validated that BWM computes criteria weights appreciably better than AHP in terms of CR, total divergence and agreement.

4.2. Step-Wise Weight Assessment Ratio Analysis (SWARA)

In this method, DMs have an essential portrait of evaluations and calculation of criteria weights. The basic characteristic of this method is the assessment of expert opinion on the importance of the considered criteria for estimating their weights. Experts select the importance of each criterion and rank them in order of preference by employing their inherent experience, understanding and information. Based on this method, criterion having the highest importance is given rank 1, while the criterion with the least importance attains the last rank. The overall ranks to the group of experts are determined according to the average values. Based on Google scholar information, this method (Kersuliene et al. [44]) has been cited 210 times (until 13 December 2018). The application of the SWARA method has been developing and some of latest studies based on the SWARA method application include the evaluation of chemical wastewater purification [72]; investigating supply chain management competitive strategies [73]; evaluating construction projects [74]; flood susceptibility assessment [75]; sustainable third-party reverse logistics provider evaluation [76]; pharmacological therapy selection [77]; assessment of the railway management [78]; competency-based IT personnel selection [79].
SWARA steps are summarized as follows [80,81,82]:
Step 1. Sorting of criteria based on policy and expert opinion or some standards.
Step 2. Providing relative importance between criteria:
Initiating from the second criterion, experts exhibit the corresponding importance of jth criterion in congruence with the previous (j − 1) criterion through comparative importance of average value (sj) ratio.
Step 3. Computation of coefficient k j :
k j = { 1 j = 1 s j + 1 j > 1
Step 4. Determination of recalculated weight w j :
w j = { 1 j = 1 x j 1 k j j > 1
Step 5. Calculation of final criteria weights:
q j = w j k = 1 n w j

5. Comparative Results

This research focuses on a comparative study on criteria weight estimation using SWARA and BWM methods for sustainable household furnishing material selection problem. This part is designed according to the available literature and adopted methodologies to assess the outputs of SWARA and BWM methods. Accordingly, five experts with at least five years of experience have been selected. To be very specific, as the main intention of this comparative analysis is to check the model of thinking of the DMs for the two different weight elicitation methods; therefore, questionnaires of SWARA and BWM methods were delivered to the experts at the same time. The most critical points of their ideas have been presented in the Appendix A. In brief, all five experts had to answer the questionnaires at the same time, but they could select one to answer first. Also, they had the opportunity to change their opinions after finishing the first questionnaire if required. Sustainable development needs a great balance between its economic, social and environmental dimensions, therefore, the proper integration between these three dimensions is an imperative need for policy-making. The main idea is to meet the boundaries and the best scenario which is aligning with 2030 agenda for sustainable development and 17 related goals [83].
Eventually, economic dimension received a weight of 0.333, social dimension received a weight of 0.333 and environment dimension received a weight of 0.334 and final weights of the sub-criteria under the three dimensions have been calculated and tabulated. The final results based on each sustainable material selection dimension are presented below. Detail calculations of SWARA and BWM methods have been added in the Appendix B.

5.1. Economic Dimension

In this section, final weights for main economic dimension as calculated using the SWARA and BWM methods-based on the opinions of the five experts are first presented in Table 3, Table 4, Table 5, Table 6 and Table 7 respectively. Computations of final weights based on each expert’s idea are presented separately as this study intents to analyze the similarities and differences of the two above mentioned methods. From Table 3, Table 4, Table 5, Table 6 and Table 7, it is observed that there are no differences in sub-criteria priorities in the SWARA and BWM methods for economic dimension. In both the cases, C1-1 (initial costs) and C1-4 (maintenance cost) emerge out as the most and least important criteria under economic dimension.

5.2. Social Dimension

Similar to the economic dimension, calculations and final weights of all sub-criteria in social dimension are exhibited in Table 8, Table 9, Table 10, Table 11 and Table 12 which reflect no alterations in the priorities of the different sub-criteria under this dimension, as opined by the five experts. These tables also indicate that among the four sub-criteria, C2-1 (safety and security) becomes the most prominent criteria, whereas C2-4 (functionality) is the least important criteria.

5.3. Environmental Dimension

Finally, the necessary information and final weights based on both the BWM and SWARA methods for the considered sub-criteria of environmental dimension are presented in Table 13, Table 14, Table 15, Table 16 and Table 17. It is observed that that there are no considerable differences in the sub-criteria priorities as provided by the group of experts through the SWARA and BWM methods. It is also perceived that C3-6 (decomposition) and C3-7 (upgrades possibility) criteria received the maximum and minimum weights respectively.

6. Discussion and Conclusions

Conventional engineering optimization and statistical approaches are applied often on the basis of a well-developed and structured problem. Solution of engineering problems with only one objective or criterion is very easy to acquire, however, most of the real life problems consist of conflicting objectives and multiple criteria, making the process more perplexed and time consuming. It is well accepted that the weight calculation methods used for solving different MADM problems have a vital contribution to defining the criteria importance and obtaining the best and satisfying results for the DMs. In this paper, two different approaches—namely SWARA and BWM—with similar methodological structures have been adopted for computation of criteria weights for sustainable housing material selection design. The main idea is to see the differences in results. In this regard, five separated ideas based on expert opinion have been compared directly. Accordingly, after finishing the questionnaires by the experts, authors examined the general inklings of them about the two different questionnaires. In SWARA method, experts have more options to show the weightage of each criterion in comparison to the other more important criteria. The DMs can probably have a clearer idea about what they want to demonstrate in terms of criteria weights. BWM first identifies the most preferable and the least favorable criteria to make pairwise comparisons between each of them and the other considered criteria. Finally, it solves a linear optimization model to deduce the criteria weights. In BWM, the DMs probably follow the same structure as SWARA specially when there are not so many criteria for evaluation. This research is carried out with specific goals, descriptions and surveys since it endeavors to reckon the key elements in sustainable housing material evaluation process development. Moreover, in real time situations, DMs or the experts have limited domain of knowledge and expertise to present and express their ideas precisely. In case of having so many criteria, it will be certainly complicated to express the differences and priorities based on some linguistic variables or qualitative numbers. In brief, it can be said that although SWARA and BWM have different mathematical approaches, there are some similarities between them and there are some advantageous in SWARA method when the general approach (pairwise comparison or policy based) is not a big challenge and deal. SWARA and BWM methods more preferable than the AHP method which requires n(n − 1)/2 pairwise criteria comparisons, thus complicating the application of this method. Especially, when the number of criteria is large, it becomes practicality unfeasible to perform such huge consistent pairwise comparisons in the AHP method. Also, as mathematical transitivity in the pairwise criteria comparisons is extremely important to consider the deviation from transitivity results in an increase in inconsistency in case of AHP method. However, the major issue in any decision-making process is not only finding the best alternative or criteria priorities, rather more emphasis should be given on appropriately guiding the DMs toward identifying the critical components, and proper structuring of the problem considering relevant criteria and decision alternatives. Therefore, the establishment of a comprehensive appraisal system and defining crucial decision-making points is an important and necessary step. As in this paper, equal weights for the three major three sustainable dimensions have been assumed which may also be changed as per the requirements of the DMs and the effects may also be observed in further research. Furthermore, comparative studies with other weight elicitation approaches like decision making trial and evaluation laboratory (DEMATEL), the resistance to change method and full consistency method (FUCOM) may be carried out for exploration of knowledge-base.

Author Contributions

Main idea, conceptualization, methodology, identifying criteria, interviews, appendix, calculations, discussion and editing and writing–original draft by S.H.Z.; Introduction, literature review, research gap, conclusion, editing and writing-original draft by P.C.

Funding

This research received no external funding.

Conflicts of Interest

The authors declare no conflict of interest.

Appendix A

Experts’ opinions:
Expert 1
It feels like this research is doing something similar. The idea is tricky and hard to say whether the idea is completely same or not, but it seems for comparing limited criteria, one has to follow the same route. It is hard to say someone will do it for 100% but definitely for limited criteria, it should be common.
Expert 2
It seems you have two different perspectives which can lead you to a wider area. It is harder to make a proper decision in complex and larger problems based on pairwise comparisons. I think normal decisions aren’t challenging and both ideas are really practical and helpful. When you have more chance to show that the exact differences of criteria, I guess you can manage a better decision while pairwise comparison is also interesting.
Expert 3
In the case of creating a ranking for the criteria, I could definitely have enough concentration of the topic and lastly, I knew what probably will happen as results.
Expert 4
When you have so many criteria, it will be really hard to do a pairwise comparison. You don’t have so many differences based on a scale like 1–9.
Expert 5
Feel more concentrated when you are making decision based on a priority. How can I be sure about my assessment while I just have limited numbers to compare all criteria based on a pairwise comparison.

Appendix B

Detail calculations:
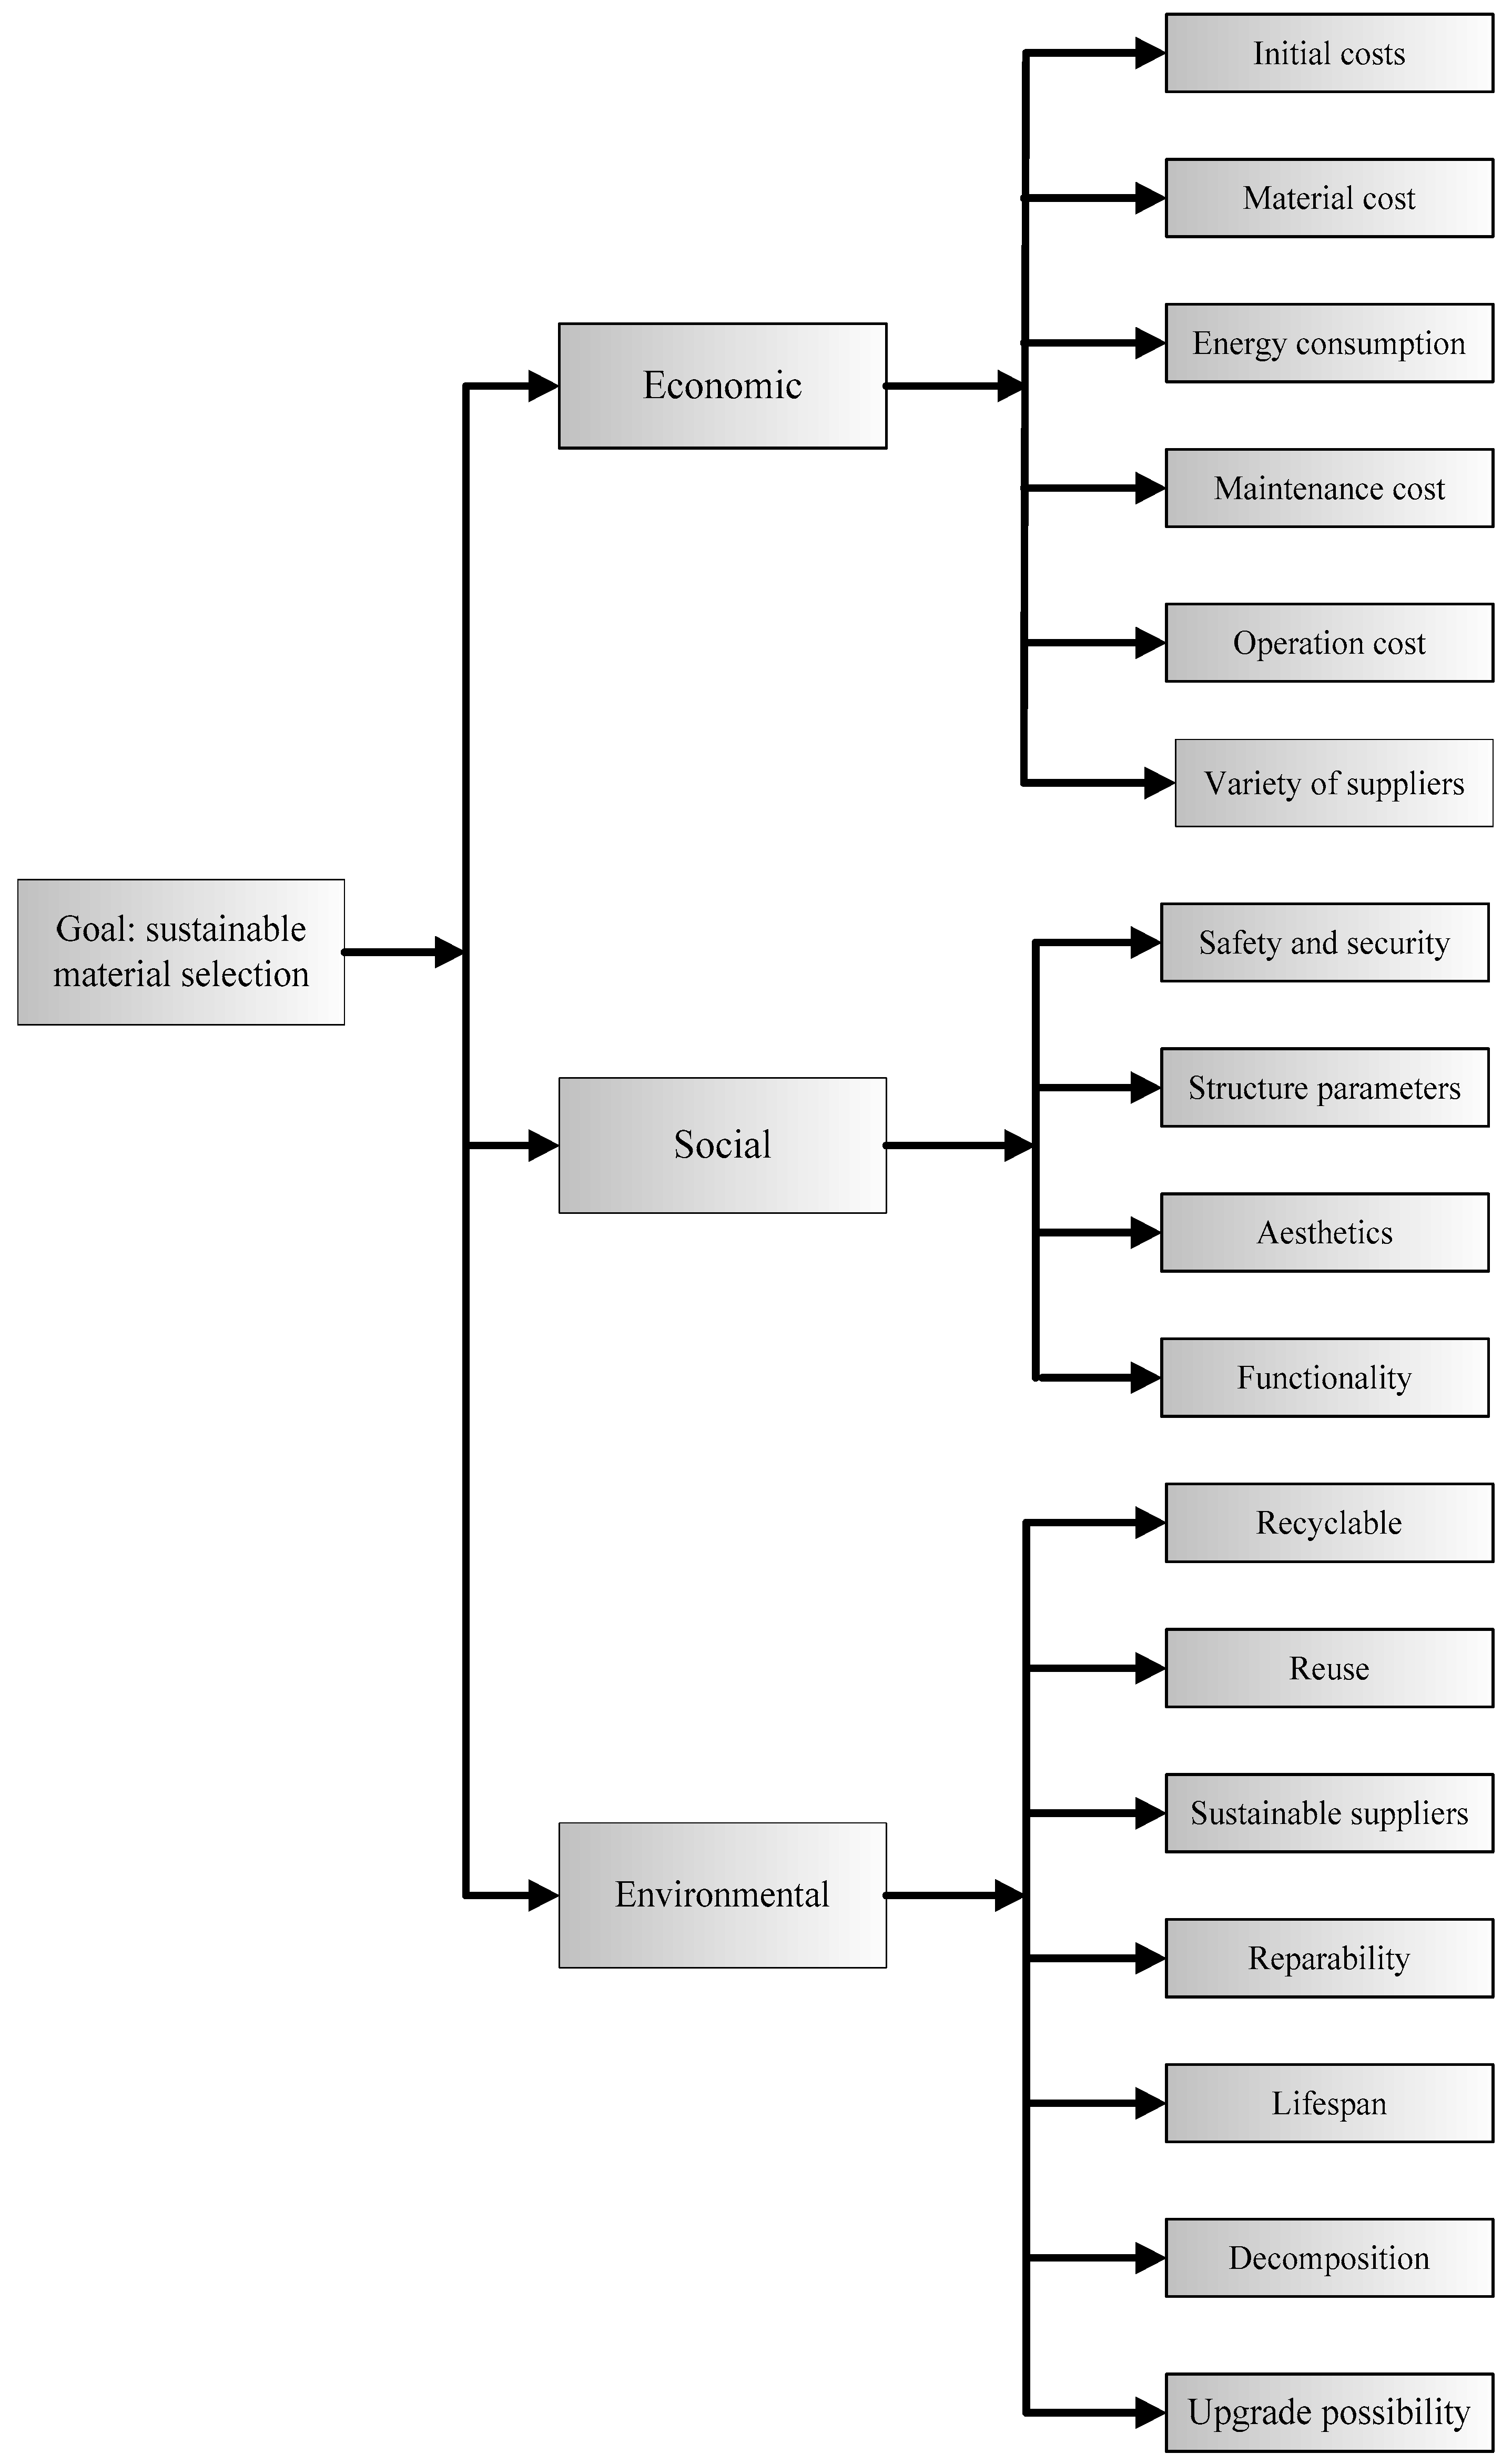
Economic dimension:
Table A1. Final weights of economic dimension based on SWARA (Expert number 1).
CriteriaThe Comparative Importance of Average Value
Sj
Coefficient
Kj = Sj + 1
Recalculated Weight
w j = x j 1 k j
Weight
q j = w j w j
Final Weight
C1-1-110.2230.075
C1-20.151.150.870.1940.064
C1-50.11.10.7910.1770.058
C1-60.21.20.660.1480.05
C1-30.11.10.60.1350.045
C1-40.11.10.5460.1230.041
Table A2. Best criterion to other criteria for economic dimension based on BWM method (Expert number 1).
Best to OthersC1-1C1-2C1-3C1-4C1-5C1-6
C1-1125634
Table A3. Other criteria to the worst criterion for economic dimension based on BWM method (Expert number 1).
Others to the WorstC1-4
C1-17
C1-26
C1-33
C1-41
C1-54
C1-65
Table A4. Final results and weights of main criteria for economic dimension based on BWM method (Expert number 1).
WeightC1-1C1-2C1-3C1-4C1-5C1-6
0.3620.2320.0930.0430.1540.116
Final weight0.1210.0770.0310.0140.0510.039
Ksi0.101
Table A5. Comparative results (Expert number 1).
WeightC1-1C1-2C1-3C1-4C1-5C1-6
SWARA0.0750.0640.0450.0410.0580.05
BWM0.1210.0770.0310.0140.0510.039
Priority based on SWARA125634
Priority based on BWM125634
Table A6. Final weights of economic dimension based on SWARA (Expert number 2).
CriteriaThe Comparative Importance of Average Value
Sj
Coefficient
Kj = Sj + 1
Recalculated Weight
w j = x j 1 k j
Weight
q j = w j w j
Final Weight
C1-1-110.2350.078
C1-20.21.20.8330.1960.065
C1-50.151.150.7250.1700.057
C1-60.151.150.6300.1480.049
C1-30.11.10.5730.1340.045
C1-40.151.150.4980.1170.039
Table A7. Best criterion to other criteria for economic dimension based on BWM method (Expert number 2).
Best to OthersC1-1C1-2C1-3C1-4C1-5C1-6
C1-1136745
Table A8. Other criteria to the worst criterion for economic dimension based on BWM method (Expert number 2).
Others to the WorstC1-4
C1-16
C1-25
C1-32
C1-41
C1-53
C1-64
Table A9. Final results and weights of main criteria for economic dimension based on BWM method (Expert number 2).
WeightC1-1C1-2C1-3C1-4C1-5C1-6
0.4320.1800.0900.0540.1350.108
Final weight0.1440.0600.0300.0180.0450.036
Ksi0.108
Table A10. Comparative results (Expert number 2).
WeightC1-1C1-2C1-3C1-4C1-5C1-6
SWARA0.0780.0650.0450.0390.0570.049
BWM0.1440.0600.0300.0180.0450.036
Priority based on SWARA125634
Priority based on BWM125634
Table A11. Final weights of economic dimension based on SWARA (Expert number 3).
CriteriaThe Comparative Importance of Average Value
Sj
Coefficient
Kj = Sj + 1
Recalculated Weight
w j = x j 1 k j
Weight
q j = w j w j
Final Weight
C1-1-110.2240.075
C1-20.11.10.9090.2040.068
C1-50.151.150.7910.1770.059
C1-60.151.150.6870.1540.051
C1-30.21.20.5730.1280.043
C1-40.151.150.4980.1120.037
Table A12. Best criterion to other criteria for economic dimension based on BWM method (Expert number 3).
Best to OthersC1-1C1-2C1-3C1-4C1-5C1-6
C1-1126734
Table A13. Other criteria to the worst criterion for economic dimension based on BWM method (Expert number 3).
Others to the WorstC1-4
C1-17
C1-26
C1-32
C1-41
C1-53
C1-65
Table A14. Final results and weights of main criteria for economic dimension based on BWM method (Expert number 3).
WeightC1-1C1-2C1-3C1-4C1-5C1-6
0.3770.2330.0780.0410.1550.116
Final weight0.1250.0780.0260.0140.0520.039
Ksi (BWM)0.089
Table A15. Comparative results (Expert number 3).
WeightC1-1C1-2C1-3C1-4C1-5C1-6
SWARA0.0750.0680.0430.0370.0590.051
BWM0.1250.0780.0260.0140.0520.039
Priority based on SWARA125634
Priority based on BWM125634
Table A16. Final weights of economic dimension based on SWARA (Expert number 4).
CriteriaThe Comparative Importance of Average Value
Sj
Coefficient
Kj = Sj + 1
Recalculated Weight
w j = x j 1 k j
Weight
q j = w j w j
Final Weight
C1-1-110.2180.072
C1-20.11.10.9090.1980.066
C1-50.11.10.8260.1800.060
C1-60.151.150.7190.1560.052
C1-30.21.20.5990.1300.043
C1-40.11.10.5440.1180.039
Table A17. Best criterion to other criteria for economic dimension based on BWM method (Expert number 4).
Best to OthersC1-1C1-2C1-3C1-4C1-5C1-6
C1-1126645
Table A18. Other criteria to the worst criterion for economic dimension based on BWM method (Expert number 4).
Others to the WorstC1-4
C1-16
C1-25
C1-33
C1-41
C1-54
C1-63
Table A19. Final results and weights of main criteria for economic dimension based on BWM method (Expert number 4).
WeightC1-1C1-2C1-3C1-4C1-5C1-6
0.4020.2440.0810.0520.1220.098
Final weight0.1340.0810.0270.0170.0410.033
Ksi (BWM)0.087
Table A20. Comparative results (Expert number 4).
WeightC1-1C1-2C1-3C1-4C1-5C1-6
SWARA0.0720.0660.0430.0390.0600.052
BWM0.1340.0810.0270.0170.0410.033
Priority based on SWARA125634
Priority based on BWM125634
Table A21. Final weights of economic dimension based on SWARA (Expert number 5).
CriteriaThe Comparative Importance of Average Value
Sj
Coefficient
Kj = Sj + 1
Recalculated Weight
w j = x j 1 k j
Weight
q j = w j w j
Final Weight
C1-1-110.2360.078
C1-20.151.150.8700.2050.068
C1-50.21.20.7250.1710.057
C1-60.21.20.6040.1420.047
C1-30.11.10.5490.1290.043
C1-40.11.10.4990.1180.039
Table A22. Best criterion to other criteria for economic dimension based on BWM method (Expert number 5).
Best to OthersC1-1C1-2C1-3C1-4C1-5C1-6
C1-1136745
Table A23. Other criteria to the worst criterion for economic dimension based on BWM method (Expert number 5).
Others to the WorstC1-4
C1-17
C1-26
C1-33
C1-41
C1-56
C1-64
Table A24. Final results and weights of main criteria for economic dimension based on BWM method (Expert number 5).
WeightC1-1C1-2C1-3C1-4C1-5C1-6
0.4300.1850.0920.0440.1380.111
Final weights0.1430.0610.0310.0150.0460.037
Ksi (BWM)0.124
Table A25. Comparative results (Expert number 5).
WeightC1-1C1-2C1-3C1-4C1-5C1-6
SWARA0.0780.0680.0430.0390.0570.047
BWM0.1430.0610.0310.0150.0460.037
Priority based on SWARA125634
Priority based on BWM125634
Social dimension:
Table A26. Final weights of social dimension based on SWARA (Expert number 1).
CriteriaThe Comparative Importance of Average Value
Sj
Coefficient
Kj = Sj + 1
Recalculated Weight
w j = x j 1 k j
Weight
q j = w j w j
Final Weight
C2-1-110.3160.105
C2-20.21.20.8330.2640.088
C2-30.151.150.7250.2290.076
C2-40.21.20.6040.1910.064
Table A27. Best criterion to other criteria for social dimension based on BWM method (Expert number 1).
Best to OthersC2-1C2-2C2-3C2-4
C2-11234
Table A28. Other criteria to the worst criterion for social dimension based on BWM method (Expert number 1).
Others to the WorstC2-4
C2-15
C2-24
C2-33
C2-41
Table A29. Final results and weights of main criteria for social dimension based on BWM method (Expert number 1).
WeightC1C2C3C4
0.4550.2730.1820.091
Final weight0.1510.0910.0610.030
Ksi (BWM)0.091
Table A30. Comparative results (Expert number 1).
WeightC1-1C1-2C1-3C1-4
SWARA0.1050.0880.0760.064
BWM0.1510.0910.0610.030
Priority based on SWARA1234
Priority based on BWM1234
Table A31. Final weights of social dimension based on SWARA (Expert number 2).
CriteriaThe Comparative Importance of Average Value
Sj
Coefficient
Kj = Sj + 1
Recalculated Weight
w j = x j 1 k j
Weight
q j = w j w j
Final Weight
C2-1-110.3010.100
C2-20.11.10.9090.2730.091
C2-30.21.20.7580.2280.076
C2-40.151.150.6590.1980.066
Table A32. Best criterion to other criteria for social dimension based on BWM method (Expert number 2).
Best to OthersC2-1C2-2C2-3C2-4
C2-11357
Table A33. Other criteria to the worst criterion for social dimension based on BWM method (Expert number 2).
Others to the WorstC2-4
C2-16
C2-25
C2-34
C2-41
Table A34. Final results and weights of main criteria for social dimension based on BWM method (Expert number 2).
WeightC1C2C3C4
0.5580.2230.1400.070
Final weight0.1860.0770.0460.023
Ksi (BWM)0.140
Table A35. Comparative results (Expert number 2).
WeightC1-1C1-2C1-3C1-4
SWARA0.1000.0910.0760.066
BWM0.1860.0770.0460.023
Priority based on SWARA1234
Priority based on BWM1234
Table A36. Final weights of social dimension based on SWARA (Expert number 3).
CriteriaThe Comparative Importance of Average Value
Sj
Coefficient
Kj = Sj + 1
Recalculated Weight
w j = x j 1 k j
Weight
q j = w j w j
C2-1-110.103
C2-20.21.20.8330.086
C2-30.11.10.7580.078
C2-40.21.20.6310.065
Table A37. Best criterion to other criteria for social dimension based on BWM method (Expert number 3).
Best to OthersC2-1C2-2C2-3C2-4
C2-11346
Table A38. Other criteria to the worst criterion for social dimension based on BWM method (Expert number 3).
Others to the WorstC2-4
C2-16
C2-24
C2-33
C2-41
Table A39. Final results and weights of main criteria for social dimension based on BWM method (Expert number 3).
WeightC1C2C3C4
0.5500.2140.1600.076
Final weight0.1830.0710.0530.025
Ksi (BWM)0.092
Table A40. Comparative results (Expert number 3).
WeightC1-1C1-2C1-3C1-4
SWARA0.1030.0860.0780.065
BWM0.1830.0710.0530.025
Priority based on SWARA1234
Priority based on BWM1234
Table A41. Final weights of social dimension based on SWARA (Expert number 4).
CriteriaThe Comparative Importance of Average Value
Sj
Coefficient
Kj = Sj + 1
Recalculated Weight
w j = x j 1 k j
Weight
q j = w j w j
Final Weight
C2-1-110.3180.106
C2-20.151.150.8700.2760.092
C2-30.251.250.6960.2210.074
C2-40.21.20.5800.1840.061
Table A42. Best criterion to other criteria for social dimension based on BWM method (Expert number 4).
Best to OthersC2-1C2-2C2-3C2-4
C2-11345
Table A43. Other criteria to the worst criterion for social dimension based on BWM method (Expert number 4).
Others to the WorstC2-4
C2-15
C2-24
C2-33
C2-41
Table A44. Final results and weights of main criteria for social dimension based on BWM method (Expert number 4).
WeightC1C2C3C4
0.5360.2180.1630.084
Final weight0.1780.0720.0540.028
Ksi (BWM)0.117
Table A45. Comparative results (Expert number 4).
WeightC1-1C1-2C1-3C1-4
SWARA0.1060.0920.0740.061
BWM0.1780.0720.0540.028
Priority based on SWARA1234
Priority based on BWM1234
Table A46. Final weights of social dimension based on SWARA (Expert number 5).
CriteriaThe Comparative Importance of Average Value
Sj
Coefficient
Kj = Sj + 1
Recalculated Weight
w j = x j 1 k j
Weight
q j = w j w j
Final Weight
C2-1-110.3030.101
C2-20.11.10.9090.2760.092
C2-30.21.20.7580.2300.076
C2-40.21.20.6310.1910.064
Table A47. Best criterion to other criteria for social dimension based on BWM method (Expert number 5).
Best to OthersC2-1C2-2C2-3C2-4
C2-11245
Table A48. Other criteria to the worst criterion for social dimension based on BWM method (Expert number 5).
Others to the WorstC2-4
C2-15
C2-24
C2-33
C2-41
Table A49. Final results and weights of main criteria for social dimension based on BWM method (Expert number 5).
WeightC1C2C3C4
0.4870.2890.1450.079
Final weight0.1620.0960.0480.026
Ksi (BWM)0.092
Table A50. Comparative results (Expert number 5).
WeightC1-1C1-2C1-3C1-4
SWARA0.1010.0920.0760.064
BWM0.1620.0960.0480.026
Priority based on SWARA1234
Priority based on BWM1234
Environmental dimension:
Table A51. Final weights of environment dimension based on SWARA (Expert number 1).
CriteriaThe Comparative Importance of Average Value
Sj
Coefficient
Kj = Sj + 1
Recalculated Weight
w j = x j 1 k j
Weight
q j = w j w j
Final Weight
C3-6-110.2210.074
C3-10.21.20.8330.1840.061
C3-50.151.150.7250.1600.053
C3-20.21.20.6040.1330.045
C3-40.11.10.5490.1210.040
C3-30.251.250.4390.0970.032
C3-70.151.150.3820.0840.028
Table A52. Best criterion to other criteria for environment dimension based on BWM method (Expert number 1).
Best to OthersC3-1C3-2C3-3C3-4C3-5C3-6C3-7
C3-62465317
Table A53. Other criteria to the worst criterion for environment dimension based on BWM method (Expert number 1).
Others to the WorstC3-7
C3-16
C3-24
C3-32
C3-43
C3-55
C3-67
C3-71
Table A54. Final results and weights of main criteria for environment dimension based on BWM method (Expert number 1).
WeightC3-1C3-2C3-3C3-4C3-5C3-6C3-7
0.2090.1050.0700.0840.1390.3530.041
Final weight0.0700.0350.0230.0280.0470.1180.014
Ksi (BWM)0.066
Table A55. Comparative results (Expert number 1).
WeightC3-1C3-2C3-3C3-4C3-5C3-6C3-7
SWARA0.0610.0450.0320.0400.0530.0740.028
BWM0.0700.0350.0230.0280.0470.1180.014
Priority based on SWARA2465317
Priority based on BWM2465317
Table A56. Final weights of environment dimension based on SWARA (Expert number 2).
CriteriaThe Comparative Importance of Average Value
Sj
Coefficient
Kj = Sj + 1
Recalculated Weight
w j = x j 1 k j
Weight
q j = w j w j
Final Weight
C3-6-110.2240.075
C3-10.21.20.8330.1860.062
C3-50.251.250.6670.1490.050
C3-20.11.10.6060.1360.045
C3-40.151.150.5270.1180.039
C3-30.21.20.4390.0980.033
C3-70.11.10.3990.0890.030
Table A57. Best criterion to other criteria for environment dimension based on BWM method (Expert number 2).
Best to OthersC3-1C3-2C3-3C3-4C3-5C3-6C3-7
C3-62455316
Table A58. Other criteria to the worst criterion for environment dimension based on BWM method (Expert number 2).
Others to the WorstC3-7
C3-16
C3-24
C3-32
C3-44
C3-55
C3-67
C3-71
Table A59. Final results and weights of main criteria for environment dimension based on BWM method (Expert number 2).
WeightC3-1C3-2C3-3C3-4C3-5C3-6C3-7
0.2100.1050.0840.0840.1400.3360.042
Final weight0.0700.0350.0280.0280.0470.1120.014
Ksi (BWM)0.084
Table A60. Comparative results (Expert number 2).
WeightC3-1C3-2C3-3C3-4C3-5C3-6C3-7
SWARA0.0620.0450.0330.0390.0500.0750.030
BWM0.0700.0350.0280.0280.0470.1120.014
Priority based on SWARA2465317
Priority based on BWM2455317
Table A61. Final weights of environment dimension based on SWARA (Expert number 3).
CriteriaThe Comparative Importance of Average Value
Sj
Coefficient
Kj = Sj + 1
Recalculated Weight
w j = x j 1 k j
Weight
q j = w j w j
Final Weight
C3-6-110.2080.070
C3-10.11.10.9090.1890.063
C3-50.151.150.7910.1650.055
C3-20.21.20.6590.1370.046
C3-40.21.20.5490.1140.038
C3-30.151.150.4770.0990.033
C3-70.151.150.4150.0860.029
Table A62. Best criterion to other criteria for environment dimension based on BWM method (Expert number 3).
Best to OthersC3-1C3-2C3-3C3-4C3-5C3-6C3-7
C3-62455316
Table A63. Other criteria to the worst criterion for environment dimension based on BWM method (Expert number 3).
Others to the WorstC3-7
C3-16
C3-24
C3-32
C3-44
C3-55
C3-67
C3-71
Table A64. Final results and weights of main criteria for environment dimension based on BWM method (Expert number 3).
WeightC3-1C3-2C3-3C3-4C3-5C3-6C3-7
0.2100.1050.0840.0840.1400.3360.042
Final weights0.0700.0350.0280.0280.0470.1120.014
Ksi (BWM)0.084
Table A65. Comparative results (Expert number 3).
WeightC3-1C3-2C3-3C3-4C3-5C3-6C3-7
SWARA0.0620.0450.0330.0390.0500.0750.030
BWM0.0700.0350.0280.0280.0470.1120.014
Priority based on SWARA2465317
Priority based on BWM2455317
Table A66. Final weights of environment dimension based on SWARA (Expert number 4).
CriteriaThe Comparative Importance of Average Value
Sj
Coefficient
Kj = Sj + 1
Recalculated Weight
w j = x j 1 k j
Weight
q j = w j w j
Final Weight
C3-6-110.2190.073
C3-10.151.150.8700.1900.064
C3-50.251.250.6960.1520.051
C3-20.11.10.6320.1390.046
C3-40.21.20.5270.1150.039
C3-30.151.150.4580.1000.034
C3-70.21.20.3820.0840.028
Table A67. Best criterion to other criteria for environment dimension based on BWM method (Expert number 4).
Best to OthersC3-1C3-2C3-3C3-4C3-5C3-6C3-7
C3-62476318
Table A68. Other criteria to the worst criterion for environment dimension based on BWM method (Expert number 4).
Others to the WorstC3-7
C3-17
C3-23
C3-32
C3-44
C3-55
C3-68
C3-71
Table A69. Final results and weights of main criteria for environment dimension based on BWM method (Expert number 4).
WeightC3-1C3-2C3-3C3-4C3-5C3-6C3-7
0.2160.1080.0620.0720.1440.3610.036
Final weight0.0720.0360.0210.0240.0480.1210.012
Ksi (BWM)0.072
Table A70. Comparative results (Expert number 4).
WeightC3-1C3-2C3-3C3-4C3-5C3-6C3-7
SWARA0.0640.0460.0340.0390.0510.0730.028
BWM0.0720.0360.0210.0240.0480.1210.012
Priority based on SWARA2465317
Priority based on BWM2465317
Table A71. Final weights of environment dimension based on SWARA (Expert number 5).
CriteriaThe Comparative Importance of Average Value
Sj
Coefficient
Kj = Sj + 1
Recalculated Weight
w j = x j 1 k j
Weight
q j = w j w j
Final Weight
C3-6-110.2120.071
C3-10.21.20.8330.1770.059
C3-50.11.10.7580.1610.054
C3-20.151.150.6590.1400.047
C3-40.151.150.5730.1210.041
C3-30.21.20.4770.1010.034
C3-70.151.150.4150.0880.029
Table A72. Best criterion to other criteria for environment dimension based on BWM method (Expert number 5).
Best to OthersC3-1C3-2C3-3C3-4C3-5C3-6C3-7
C3-63587418
Table A73. Other criteria to the worst criterion for environment dimension based on BWM method (Expert number 5).
Others to the WorstC3-7
C3-17
C3-24
C3-33
C3-43
C3-55
C3-67
C3-71
Table A74. Final results and weights of main criteria for environment dimension based on BWM method (Expert number 5).
WeightC3-1C3-2C3-3C3-4C3-5C3-6C3-7
0.1750.1050.0660.0750.1310.4080.042
Final weight0.0580.0350.0220.0250.0440.1360.014
Ksi (BWM)0.116
Table A75. Comparative results (Expert number 5).
WeightC3-1C3-2C3-3C3-4C3-5C3-6C3-7
SWARA0.0590.0470.0340.0410.0540.0710.029
BWM0.0580.0350.0220.0250.0440.1360.014
Priority based on SWARA2465317
Priority based on BWM2465317

References

  1. Tian, G.; Zhang, H.H.; Feng, Y.X.; Wang, D.Q.; Peng, Y.; Jia, H.F. Green decoration materials selection under interior environment characteristics: A grey-correlation based hybrid MCDM method. Renew. Sustain. Energy Rev. 2018, 81, 682–692. [Google Scholar] [CrossRef]
  2. Hayles, C.S. Environmentally sustainable interior design: A snapshot of current supply of and demand for green, sustainable or Fair Trade products for interior design practice. Int. J. Sustain. Built Environ. 2015, 4, 100–108. [Google Scholar] [CrossRef] [Green Version]
  3. Farag, M.M. Quantitative methods of materials selection. In Handbook of Materials Selection; Kutz, M., Ed.; John Wiley & Sons: Hoboken, NJ, USA, 2002; pp. 3–24. [Google Scholar]
  4. Cables, E.; Lamata, M.T.; Verdegay, J.L. RIM-reference ideal method in multi criteria decision making. Inf. Sci. 2016, 337–338, 1–10. [Google Scholar] [CrossRef]
  5. Yazdani, M.; Jahan, A.; Zavadskas, E.K. Analysis in Material Selection: Influence of Normalization Tools on COPRAS-G. Econ. Comput. Econ. Cybern. Stud. Res. 2017, 51, 59–74. [Google Scholar]
  6. Ogunkah, I.; Yang, J. Investigating Factors Affecting Material Selection: The Impacts on Green Vernacular Building Materials in the Design-Decision Making Process. Buildings 2012, 2, 1–32. [Google Scholar] [CrossRef] [Green Version]
  7. Castro-Lacouture, D.; Sefair, J.; Flórez, L.; Medaglia, A.L. Optimization model for the selection of materials using a LEED-based green building rating system in Colombia. Build. Environ. 2009, 44, 1162–1170. [Google Scholar] [CrossRef]
  8. Zhou, C.C.; Yin, G.F.; Hu, X.B. Multi-objective optimization of material selection for sustainable products: Artificial neural networks and genetic algorithm approach. Mater. Des. 2009, 30, 1209–1215. [Google Scholar] [CrossRef]
  9. Rahman, S.; Srinath, P.; Henry, O.; Yaxin, B. A knowledge-based decision support system for roofing materials selection and cost estimating: A conceptual framework and data modelling. In Proceedings of the 25th Annual ARCOM Conference, Nottingham, UK, 7–9 September 2009. [Google Scholar]
  10. Maniya, K.; Bhatt, M.G. A selection of material using a novel type decision-making method: Preference selection index method. Mater. Des. 2010, 31, 1785–1789. [Google Scholar] [CrossRef]
  11. Akadiri, P.O.; Olomolaiye, P.O.; Chinyio, E.A. Multi-criteria evaluation model for the selection of sustainable materials for building projects. Autom. Constr. 2013, 30, 113–125. [Google Scholar] [CrossRef]
  12. Florez, L.; Castro-Lacouture, D. Optimization model for sustainable materials selection using objective and subjective factors. Mater. Des. 2013, 46, 310–321. [Google Scholar] [CrossRef]
  13. Baharetha, S.M.; Al-Hammad, A.A.; Alshuwaikhat, H.M. Towards a unified set of sustainable building materials criteria. In Proceedings of the International Conference on Sustainable Design, Engineering, and Construction, Fort Worth, TX, USA, 7–9 November 2013; pp. 732–740. [Google Scholar]
  14. Ribeiro, I.; Peças, P.; Henriques, E. A life cycle framework to support material selection for Ecodesign: A case study on biodegradable polymers. Mater. Des. 2013, 51, 300–308. [Google Scholar] [CrossRef]
  15. Hosseinijou, S.A.; Mansour, S.; Shirazi, M.A. Social life cycle assessment for material selection: A case study of building materials. Int. J. Life Cycle Assess. 2014, 19, 620–645. [Google Scholar] [CrossRef]
  16. Van der Velden, N.M.; Kuusk, K.; Köhler, A.R. Life cycle assessment and eco-design of smart textiles: The importance of material selection demonstrated through e-textile product redesign. Mater. Des. 2015, 84, 313–324. [Google Scholar] [CrossRef]
  17. Zhao, R.; Su, H.; Chen, X.; Yu, Y. Commercially available materials selection in sustainable design: An integrated multi-attribute decision making approach. Sustainability 2016, 8, 79. [Google Scholar] [CrossRef]
  18. Ma, F.; Zhao, Y.; Pu, Y.; Li, J. A comprehensive multi-criteria decision making model for sustainable material selection considering life cycle assessment method. IEEE Access 2018, 6, 58338–58354. [Google Scholar] [CrossRef]
  19. Bhowmik, C.; Gangwar, S.; Bhowmik, S.; Ray, A. Optimum Selection of Energy-Efficient Material: A MCDM-Based Distance Approach. In Soft Computing Applications. Studies in Computational Intelligence; Ray, K., Pant, M., Bandyopadhyay, A., Eds.; Springer: Singapore, 2018; p. 761. [Google Scholar]
  20. Sahamir, S.R.; Zakaria, R.; Rooshdi, R.R.; Adenan, M.A.; Shamsuddin, S.M.; Abidin, N.I.; Ismail, N.A.; Aminudin, E. Multi-Criteria Decision Analysis for Evaluating Sustainable Lifts Design of Public Hospital Buildings. Chem. Eng. Trans. 2018, 63, 199–204. [Google Scholar]
  21. Moghtadernejad, S.; Chouinard, L.E.; Mirza, M.S. Multi-criteria decision-making methods for preliminary design of sustainable facades. J. Build. Eng. 2018, 19, 181–190. [Google Scholar] [CrossRef]
  22. Lewandowska, A.; Branowsk, B.; Joachimiak-Lechman, K.; Kurczewski, P.; Selech, J.; Zablocki, M. Sustainable Design: A Case of Environmental and Cost Life Cycle Assessment of a Kitchen Designed for Seniors and Disabled People. Sustainability 2017, 9, 1329. [Google Scholar] [CrossRef]
  23. He, B.; Niu, Y.; Hou, S.; Li, F. Sustainable design from functional domain to physical domain. J. Clean. Prod. 2018, 197, 1296–1306. [Google Scholar] [CrossRef]
  24. Ping, L.X. Application of green concept in mechanical design and manufacture. In IOP Conference Series: Earth and Environmental Science; IOP Publishing: Bristol, UK, 2017; Volume 94, p. 012128. [Google Scholar]
  25. Halstenberg, F.A.; Buchert, T.; Bonvoisin, J.; Lindow, K.; Stark, R. Target-oriented Modularization-Addressing Sustainability Design Goals in Product Modularization. Procedia CIRP 2015, 29, 603–608. [Google Scholar] [CrossRef]
  26. Go, T.F.; Wahab, D.A.; Hishamuddin, H. Multiple generation life-cycles for product sustainability: The way forward. J. Clean. Prod. 2015, 95, 16–29. [Google Scholar] [CrossRef]
  27. Rosen, M.A.; Kishawy, H.A. Sustainable Manufacturing and Design: Concepts, Practices and Needs. Sustainability 2012, 4, 154–174. [Google Scholar] [CrossRef] [Green Version]
  28. Zhang, C.; Xie, G.; Liu, C.; Lu, C. Assessment of soil erosion under woodlands using USLE in China. Front. Earth Sci. 2011, 5, 150–161. [Google Scholar] [CrossRef]
  29. Chiu, M.C.; Chu, C.H. Review of sustainable product design from life cycle perspectives. Int. J. Precis. Eng. Manuf. 2012, 13, 1259–1272. [Google Scholar] [CrossRef]
  30. Sonego, M.; Soares Echeveste, M.E.; Debarba, H.G. The role of modularity in sustainable design: A systematic review. J. Clean. Prod. 2018, 176, 196–209. [Google Scholar] [CrossRef]
  31. Jilcha, K.; Kitaw, D. Industrial occupational safety and health innovation for sustainable development. Eng. Sci. Technol. 2016, 20, 372–380. [Google Scholar] [CrossRef]
  32. Bachman, L.R. Sustainable Design and Postindustrial Society: Our Ethical and Aesthetic Crossroads. Enquiry 2016, 13, 30–38. [Google Scholar] [CrossRef]
  33. Cimatti, B.; Campana, G.; Carluccio, L. Eco Design and Sustainable Manufacturing in Fashion: A Case Study in the Luxury Personal Accessories Industry. Procedia Manuf. 2017, 8, 393–400. [Google Scholar] [CrossRef]
  34. Beck, L.A. New as Renewal: A Framework for Adaptive Reuse in the Sustainable Paradigm. Master’s Thesis, University of Massachusetts Amherst, Amherst, MA, USA, 2014. [Google Scholar]
  35. Raoufi, K.; Park, K.; Hasan Khan, M.T.; Haapala, K.R.; Psenka, C.E.; Jackson, K.L.; Okudan Kremer, G.E. A Cyber Learning Platform for Enhancing Undergraduate Engineering Education in Sustainable Product Design. J. Clean. Prod. 2018, 211, 730–741. [Google Scholar] [CrossRef]
  36. Yan, J.; Feng, C. Sustainable design-oriented product modularity combined with 6R concept: A case study of rotor laboratory bench. Clean Technol. Environ. Policy 2014, 16, 95–109. [Google Scholar] [CrossRef]
  37. Qian, X.; Zhang, H.C. Design for Environment: An Environmentally Conscious Analysis Model for Modular Design. IEEE Trans. Electron. Packag. Manuf. 2009, 32, 164–175. [Google Scholar] [CrossRef]
  38. Foley, J.T.; Cochran, D.S. Manufacturing System Design Decomposition: An Ontology for Data Analytics and System Design Evaluation. Procedia CIRP 2017, 60, 175–180. [Google Scholar] [CrossRef]
  39. Zhang, X.; Zhao, Y.; Sun, Q.; Wang, C. Decomposition and Attribution Analysis of Industrial Carbon Intensity Changes in Xinjiang. China. Sustainability 2017, 9, 459. [Google Scholar] [CrossRef]
  40. Lumsakul, P.; Sheldrick, L.; Rahimifard, S. The Sustainable Co-Design of Products and Production Systems. Procedia Manuf. 2018, 21, 854–861. [Google Scholar] [CrossRef]
  41. Saaty, T.L. The Analytical Hierarchy Process; McGraw-Hill: New York, NY, USA, 1980. [Google Scholar]
  42. Saaty, T.J. Decision Making in Complex Environments, The Analytical Hierarchy Process for Decision Making with Dependence and Dependence and Feedback; RWS Publications: Pittsburgh, PA, USA, 1996. [Google Scholar]
  43. Saaty, T.L. Fundamentals of analytic network process. In Proceedings of the International Symposium on the Analytic Hierarchy Process, Japan, Kobe, 12–14 August 1999; pp. 348–379. [Google Scholar]
  44. Keršulienė, V.; Zavadskas, E.K.; Turskis, Z. Selection of rational dispute resolution method by applying new step-wise weight assessment ratio analysis (SWARA). J. Bus. Econ. Manag. 2010, 11, 243–258. [Google Scholar] [CrossRef]
  45. Ginevicius, R. A New Determining Method for the Criteria Weights in Multi-Criteria Evaluation. Int. J. Inf. Technol. Decis. Mak. 2011, 10, 1067–1095. [Google Scholar] [CrossRef]
  46. Rezaei, J. Best-worst multi-criteria decision-making method. Omega 2015, 53, 49–57. [Google Scholar] [CrossRef]
  47. Hashemkhani Zolfani, S.; Yazdani, M.; Zavadskas, E.K. An extended stepwise weight assessment ratio analysis (SWARA) method for improving criteria prioritization process. Soft Comput. 2018, 22, 7399–7405. [Google Scholar] [CrossRef]
  48. Pamucar, D.; Stevic, Z.; Sremac, S. A New Model for Determining Weight Coefficients of Criteria in MCDM Models: Full Consistency Method (FUCOM). Symmetry 2018, 10, 393. [Google Scholar] [CrossRef]
  49. Govindan, K. Application of multi-criteria decision making/operations research techniques for sustainable management in mining and minerals. Resour. Policy 2015, 46, 1–5. [Google Scholar] [CrossRef]
  50. Zavadskas, E.K.; Govindan, K.; Antucheviciene, J.; Turskis, Z. Hybrid multiple criteria decision-making methods: A review of applications for sustainability issues. Econ. Res. 2016, 29, 857–887. [Google Scholar] [CrossRef]
  51. Kumar, A.; Sah, B.; Singh, A.R.; Deng, Y.; He, X.; Kumar, P.; Bancal, R.C. A review of multi criteria decision making (MCDM) towards sustainable renewable energy development. Renew. Sustain. Energy Rev. 2017, 69, 596–609. [Google Scholar] [CrossRef]
  52. Siksnelyte, I.; Zavadskas, E.K.; Streimikiene, D.; Sharma, D. An Overview of Multi-Criteria Decision-Making Methods in Dealing with Sustainable Energy Development Issues. Energies 2018, 11, 2754. [Google Scholar] [CrossRef]
  53. Shen, K.Y.; Tzeng, G.H. Advances in Multiple Criteria Decision Making for Sustainability: Modeling and Applications. Sustainability 2018, 10, 1600. [Google Scholar] [CrossRef]
  54. Badri Ahmadi, H.; Kusi-Sarpong, S.; Rezaei, J. Assessing the social sustainability of supply chains using Best Worst Method. Resour. Conserv. Recycl. 2017, 126, 99–106. [Google Scholar] [CrossRef]
  55. Zolfani, S.H.; Saparauskas, J. New Application of SWARA Method in Prioritizing Sustainability Assessment Indicators of Energy System. Eng. Econ. 2013, 24, 408–414. [Google Scholar] [CrossRef]
  56. Hashemkjani Zolfani, S.; Bahrami, M. Investment prioritizing in high tech industries based on SWARA-COPRAS approach. Technol. Econ. Dev. Econ. 2014, 20, 534–553. [Google Scholar] [CrossRef]
  57. Ghorshi Nezhad, M.R.; Hashemkhani Zolfani, S.; Moztarzadeh, F.; Zavadskas, E.K.; Bahrami, M. Planning the priority of high tech industries based on SWARA-WASPAS methodology: The case of the nanotechnology industry in Iran. Econ. Res. 2015, 28, 1111–1137. [Google Scholar] [CrossRef] [Green Version]
  58. Hashemkhani Zolfani, S.; Salimi, J.; Maknoon, R.; Kildiene, S. Technology foresight about R&D projects selection; application of SWARA method at the policy making level. Eng. Econ. 2015, 26, 571–580. [Google Scholar]
  59. Mardani, A.; Nilashi, M.; Zakuan, N.; Loganathan, N.; Soheilirad, S.; Saman, M.Z.M.; Ibrahim, O. A systematic review and meta-Analysis of SWARA and WASPAS methods: Theory and applications with recent fuzzy developments. Appl. Soft Comput. 2017, 57, 265–292. [Google Scholar] [CrossRef]
  60. Sadjadia, S.J.; Karimi, M. Best-worst multi-criteria decision-making method: A robust approach. Decis. Sci. Lett. 2018, 7, 323–340. [Google Scholar] [CrossRef]
  61. Gupta, H.; Barua, M.K. Identifying enablers of technological innovation for Indian MSMEs using best–worst multi criteria decision making method. Technol. Forecast. Soc. Chang. 2016, 107, 69–79. [Google Scholar] [CrossRef]
  62. Yadav, G.; Mangla, S.K.; Luthra, S.; Jakhar, S. Hybrid BWM-ELECTRE-based decision framework for effective offshore outsourcing adoption: A case study. Int. J. Prod. Res. 2018, 56, 6259–6278. [Google Scholar] [CrossRef]
  63. Rezaei, J.; Wang, J.; Tavasszy, L. Linking supplier development to supplier segmentation using Best Worst Method. Expert Syst. Appl. 2015, 42, 9152–9164. [Google Scholar] [CrossRef]
  64. Chitsaz, N.; Azarivand, A. Water Scarcity Management in Arid Regions Based on an Extended Multiple Criteria Technique. Water Resour. Manag. 2016, 31, 233–250. [Google Scholar] [CrossRef]
  65. Rezaei, J.; Hemmes, A.; Tavasszy, L.A. Multi-criteria decision-making for complex bundling configurations in surface transportation of air freight. J. Air Transp. Manag. 2017, 61, 95–105. [Google Scholar] [CrossRef]
  66. Ren, J.; Liang, H.; Chan, F.T.S. Urban sewage sludge, sustainability, and transition for Eco-City: Multi-criteria sustainability assessment of technologies based on best-worst method. Technol. Forecast. Soc. Chang. 2017, 116, 29–39. [Google Scholar] [CrossRef]
  67. Rezaei, J.; van Roekel, W.S.; Tavasszy, L.A. Measuring the relative importance of the logistics performance index indicators using Best Worst Method. Transp. Policy 2018, 68, 158–169. [Google Scholar] [CrossRef]
  68. Van de Kaan, G.; Janssen, M.; Rezaei, J. Standards battles for business-to-government data exchange: Identifying success factors for standard dominance using the Best Worst Method. Technol. Forecast. Soc. Chang. 2018, 137, 182–189. [Google Scholar] [CrossRef]
  69. Nawaz, F.; Asadabadi, M.R.; Janjua, N.K.; Hussain, O.K.; Chang, E.; Saberi, M. An MCDM method for cloud service selection using a Markov chain and the best-worst method. Knowl.-Based Syst. 2018, 159, 120–131. [Google Scholar] [CrossRef]
  70. Salimi, N.; Rezaei, J. Measuring efficiency of university-industry Ph.D. projects using best worst method. Scientometrics 2016, 109, 1911–1938. [Google Scholar] [CrossRef] [PubMed] [Green Version]
  71. Rezaei, J. Best-worst Multi-criteria Decision-Making Method: Some Properties and a Linear Model. Omega 2016, 62, 126–130. [Google Scholar] [CrossRef]
  72. Khodadadi, M.R.; Hashemkhani Zolfani, S.; Yazdani, M.; Zavadskas, E.K. A hybrid MADM analysis in evaluating process of chemical wastewater purification regarding to advance oxidation processes. J. Environ. Eng. Landsc. Manag. 2017, 25, 277–288. [Google Scholar] [CrossRef]
  73. Jamali, G.; Karimi Asl, E.; Hashemkhani Zolfani, S.; Saparauskas, J. Analysing large supply chain management competitive strategies in Iranian cement industries. E+M Ekon. Manag. 2017, 20, 70–84. [Google Scholar] [CrossRef]
  74. Hashemkhani Zolfani, S.; Pourhossein, M.; Yazdani, M.; Zavadskas, E.K. Evaluating construction projects of hotels based on environmental sustainability with MCDM framework. Alex. Eng. J. 2018, 57, 357–365. [Google Scholar] [CrossRef]
  75. Hong, H.; Panahi, M.; Shirzadi, A.; Ma, T.; Liu, J.; Zhu, A.; Chen, W.; Kougias, I.; Kazakis, N. Flood susceptibility assessment in Hengfeng area coupling adaptive neuro-fuzzy inference system with genetic algorithm and differential evolution. Sci. Total Environ. 2018, 621, 1124–1141. [Google Scholar] [CrossRef]
  76. Zarbakhshnia, N.; Soleimani, H.; Ghaderi, H. Sustainable third-party reverse logistics provider evaluation and selection using fuzzy SWARA and developed fuzzy COPRAS in the presence of risk criteria. Appl. Soft Comput. 2018, 65, 307–319. [Google Scholar] [CrossRef]
  77. Eghbali-Zarch, M.; Tavakkoli-Moghaddam, R.; Esfahanian, F.; Sepehri, M.M.; Azaron, A. Pharmacological therapy selection of type 2 diabetes based on the SWARA and modified MULTIMOORA methods under a fuzzy environment. Artif. Intell. Med. 2018, 87, 20–33. [Google Scholar] [CrossRef]
  78. Vesković, S.; Stević, Z.; Stojić, G.; Vasiljević, M.; Milinković, S. Evaluation of the railway management model by using a new integrated model DELPHI-SWARA-MABAC. Decis. Mak. 2018, 1, 34–50. [Google Scholar] [CrossRef]
  79. Heidary Dahooie, J.; Beheshti Jazan Abadi, E.; Salar Vanaki, A. Competency-based IT personnel selection using a hybrid SWARA and ARAS-G methodology. Hum. Factors Ergon. Manuf. Serv. Ind. 2018, 28, 5–16. [Google Scholar]
  80. Keršulienė, V.; Turskis, Z. Integrated fuzzy multiple criteria decision making model for architect selection. Technol. Econ. Dev. Econ. 2011, 17, 645–666. [Google Scholar] [CrossRef]
  81. Vafaeipour, M.; Hashemkhani Zolfani, S.; Varzandeh, M.H.; Derakhti, A.; Eshkalag, M.K. Assessment of regions priority for implementation of solar projects in Iran: New application of a hybrid multi-criteria decision making approach. Energy Convers. Manag. 2014, 86, 653–663. [Google Scholar] [CrossRef]
  82. Stanujkic, D.; Karabasevic, D.; Zavadskas, E.K. A Framework for the Selection of a Packaging Design Based on the SWARA Method. Eng. Econ. 2015, 26, 181–187. [Google Scholar] [CrossRef]
  83. ESCAP. Integrating the Three Dimensions of Sustainable Development: A Framework and Tools; ST/ESCAP/2737; United Nations Publication: New York, NY, USA, 2015. [Google Scholar]
Figure 1. Proposed hierarchical criteria structure for evaluation of sustainable materials.
Symmetry 11 00074 g001
Table 1. Comprehensive list of sustainable material selection criteria.
DimensionDefinitionsReferences
C1Economic
C1-1Initial costsAll primary costs related to the new productionSahamir et al. [20]; Moghtadernejad et al. [21];
C1-2Material costCost of selected materialsLewandowska et al. [22]; He et al. [23];
C1-3Energy consumptionThe rate of energy consumption in production and in case if it needs to work based on energyPing [24]; Sahamir et al. [20]
C1-4Maintenance costIt is related to materials and quality of design and manufacturing qualityHalstenberg et al. [25]; Go et al. [26]
C1-5Operation costIt depends to the level of technology and related thingsRosen & Kishawy [27]
C1-6Variety of suppliersIt is also related to the type of selected materials because resources are totally dependentZhang et al. [28]; Chiu & Chu [29]; Sonego et al. [30]
C2Social
C2-1Safety and securitySafety and security for both workers and consumerJilcha & Kitaw [31]; He et al. [23]; Sahamir et al. [20]
C2-2Structure parametersIt is related to the topics such as: suitable size for consumers, ergonomic aspectsHe et al. [23]
C2-3AestheticsThe quality of appearance of final products based on manufacturing designBachman [32]; Cimatti et al. [33]; Moghtadernejad et al. [21]
C2-4FunctionalityPossibility of do it by consumersSonego et al. [30]
C3Environment
C3-1RecyclableRate of using recyclable materialsHe et al. [23]; Sonego et al. [30]
C3-2ReuseEasy disassembly for reusingRosen & Kishawy [27]; Beck [34]; Sonego et al. [30]
C3-3Sustainable suppliersAccess to the sustainable suppliers and decreasing carbon footprintRaoufi et al. [35]
C3-4ReparabilityEasy to be repaired which can have social and economic advantagesZhang et al. [28]; Yan & Feng [36]
C3-5LifespanLife cycle of the product based on manufacturing designQian & Zhang [37]; He et al. [23]
C3-6DecompositionRate of being environmentally friendlyFoley & Cochran [38]; Zhang et al. [39]
C3-7Upgrade possibilityUpgrade possibility in the futureLumsakul et al. [40]; Sonego et al. [30]
Table 2. CI values for BWM method.
aBW123456789
CI (max ξ * )00.441.001.632.303.003.734.475.23
Table 3. Final weights of economic dimension based on comparative study (Expert 1).
WeightC1-1C1-2C1-3C1-4C1-5C1-6
SWARA0.0750.0640.0450.0410.0580.05
BWM0.1210.0770.0310.0140.0510.039
Priority based on SWARA125634
Priority based on BWM125634
Ksi (BWM)0.101
Table 4. Final weights of economic dimension based on comparative study (Expert 2).
WeightC1-1C1-2C1-3C1-4C1-5C1-6
SWARA0.0780.0650.0450.0390.0570.049
BWM0.1440.0600.0300.0180.0450.036
Priority based on SWARA125634
Priority based on BWM125634
Ksi (BWM)0.108
Table 5. Final weights of economic dimension based on comparative study (Expert 3).
WeightC1-1C1-2C1-3C1-4C1-5C1-6
SWARA0.0750.0680.0430.0370.0590.051
BWM0.1250.0780.0260.0140.0520.039
Priority based on SWARA125634
Priority based on BWM125634
Ksi (BWM)0.089
Table 6. Final weights of economic dimension based on comparative study (Expert 4).
WeightC1-1C1-2C1-3C1-4C1-5C1-6
SWARA0.0720.0660.0430.0390.0600.052
BWM0.1340.0810.0270.0170.0410.033
Priority based on SWARA125634
Priority based on BWM125634
Ksi (BWM)0.087
Table 7. Final weights of economic dimension based on comparative study (Expert 5).
WeightsC1-1C1-2C1-3C1-4C1-5C1-6
SWARA0.0780.0680.0430.0390.0570.047
BWM0.1430.0610.0310.0150.0460.037
Priority based on SWARA125634
Priority based on BWM125634
Ksi (BWM)0.124
Table 8. Final weights of social dimension based on comparative study (Expert 1).
WeightC2-1C2-2C2-3C2-4
SWARA0.1050.0880.0760.064
BWM0.1510.0910.0610.030
Priority based on SWARA1234
Priority based on BWM1234
Ksi (BWM)0.091
Table 9. Final weights of social dimension based on comparative study (Expert 2).
WeightC1-1C1-2C1-3C1-4
SWARA0.1000.0910.0760.066
BWM0.1860.0770.0460.023
Priority based on SWARA1234
Priority based on BWM1234
Ksi (BWM)0.140
Table 10. Final weights of social dimension based on comparative study (Expert 3).
WeightC1-1C1-2C1-3C1-4
SWARA0.1030.0860.0780.065
BWM0.1830.0710.0530.025
Priority based on SWARA1234
Priority based on BWM1234
Ksi (BWM)0.092
Table 11. Final weights of social dimension based on comparative study (Expert 4).
WeightC1-1C1-2C1-3C1-4
SWARA0.1060.0920.0740.061
BWM0.1780.0720.0540.028
Priority based on SWARA1234
Priority based on BWM1234
Ksi (BWM)0.117
Table 12. Final weights of social dimension based on comparative study (Expert 5).
WeightC1-1C1-2C1-3C1-4
SWARA0.1010.0920.0760.064
BWM0.1620.0960.0480.026
Priority based on SWARA1234
Priority based on BWM1234
Ksi (BWM)0.092
Table 13. Final weights of environment dimension based on comparative study (Expert 1).
WeightC3-1C3-2C3-3C3-4C3-5C3-6C3-7
SWARA0.0610.0450.0320.0400.0530.0740.028
BWM0.0700.0350.0230.0280.0470.1180.014
Priority based on SWARA2465317
Priority based on BWM2465317
Ksi (BWM)0.066
Table 14. Final weights of environment dimension based on comparative study (Expert 2).
WeightC3-1C3-2C3-3C3-4C3-5C3-6C3-7
SWARA0.0620.0450.0330.0390.0500.0750.030
BWM0.0700.0350.0280.0280.0470.1120.014
Priority based on SWARA2465317
Priority based on BWM2455317
Ksi (BWM)0.084
Table 15. Final weights of environment dimension based on comparative study (Expert 3).
WeightC3-1C3-2C3-3C3-4C3-5C3-6C3-7
SWARA0.0620.0450.0330.0390.0500.0750.030
BWM0.0700.0350.0280.0280.0470.1120.014
Priority based on SWARA2465317
Priority based on BWM2455317
Ksi (BWM)0.084
Table 16. Final weights of environment dimension based on comparative study (Expert 4).
WeightC3-1C3-2C3-3C3-4C3-5C3-6C3-7
SWARA0.0640.0460.0340.0390.0510.0730.028
BWM0.0720.0360.0210.0240.0480.1210.012
Priority based on SWARA2465317
Priority based on BWM2465317
Ksi (BWM)0.072
Table 17. Final weights of environment dimension based on comparative study (Expert 5).
WeightC3-1C3-2C3-3C3-4C3-5C3-6C3-7
SWARA0.0590.0470.0340.0410.0540.0710.029
BWM0.0580.0350.0220.0250.0440.1360.014
Priority based on SWARA2465317
Priority based on BWM2465317
Ksi (BWM)0.116

