Evolution of Conformity Dynamics in Complex Social Networks


1
School of Economics and Management, China University of Geoscience, Wuhan 430074, China
2
School of Art and Design, Wuhan University of Technology, Wuhan 430070, China
3
School of Economics, Wuhan University of Technology, Wuhan 430070, China
*
Author to whom correspondence should be addressed.
Symmetry 2019, 11(3), 299; https://0-doi-org.brum.beds.ac.uk/10.3390/sym11030299
Submission received: 10 January 2019
/
Revised: 17 February 2019
/
Accepted: 21 February 2019
/
Published: 28 February 2019
(This article belongs to the Special Issue Symmetry and Complexity 2019)
Abstract
:Conformity is a common phenomenon among people in social networks. In this paper, we focus on customers’ conformity behaviors in a symmetry market where customers are located in a social network. We establish a conformity model and analyze it in ring network, random network, small-world network, and scale-free network. Our simulations shown that topology structure, network size, and initial market share have significant effects on the evolution of customers’ conformity behaviors. The market will likely converge to a monopoly state in small-world networks but will form a duopoly market in scale networks. As the size of the network increases, there is a greater possibility of forming a dominant group of preferences in small-world network, and the market will converge to the monopoly of the product which has the initial selector in the market. Also, network density will become gradually significant in small-world networks.
1. Introduction
Humans are highly susceptible to social influence. When a person’s judgment conflicts with a group’s, that person often conforms their judgment to that of the group [1]. This diffuse occurrence that individuals change their behaviors and attitudes to match the majority’s behavior is known as conformity. Conformity is everywhere in our lives. For example, consumption caused by conformity will be influenced by the evaluation of others and driven by other people’s behavior. People’s pursuit of fashion often leads to the pursuit of a certain type of goods and forms a trend of popularity. Merchants often take advantage of consumers’ conformity and the fact that they will imitate idols and follow fashion trends to promote their products.
The earliest study on conformity influence dates back to the 1930s and was carried out by social psychologists Jenness [2] and Sherif [3]. Since then, extensive studies have shown that conformity can affect individual choice behavior. The well-known experiment by Asch [4] in 1955 showed that over 75% of people tend to conform to others in varying degrees. Bernheim [5] analyzed conformity by a theoretical model in which individuals care about both consumption and social status. Existing works carried out by Kelman et al. [6] and Akert [7] have repeatedly verified the significant effect of conformity influence in our social life. Krüger [8] determined the conditions needed to reach a consensus in a double-clique network with conformity and anticonformity as types of social influence.
After then, many researches have measured the degree of conformity. Mehrabian and Ksionzky [9] used a two-dimensional scheme to represent affinitive characteristics to build a function of conformity. Luce and Fishburn [10] built a conformity function which was proved to be the only possible function, which is concave for gains and convex for loses, while satisfying the requirements of segregation and binary prospect theory. Also, researchers have made efforts to establish models for exploring the factors and effects of conformity, mostly focusing on the relationship between conformity and personal characters. Crutchfield [11] put forward the idea that conformity is involved in individual differences such as age and gender. Reitan and Shaw [12] found conformity was also related to the group size. Egebark [13] did a research to show that appreciation, expressed as a single “like” on social networks, from a single stranger increased the size of the influencing group and doubled the probability that subjects expressed positive support. Zollman [14] found that conformity effects induce reliability in some contexts and, surprisingly, this happens even when it is counterproductive. Often, the methods for reducing its effects are not helpful. He attempted to determine the epistemic effects of conformity by analyzing a mathematical model of this behavior. Lascu and Zinkhan [15] proposed a classical conformity model and classified the influencing factors of conformity. The influencing factors of conformity were classified in: individual factors, group factors, product factors, and work factors. Among them, individual factors mainly refer to personality characteristics, knowledge and experience, cultural differences, personality characteristics, social status, and so on; group factors mainly refer to group size, group cohesion, individual position, consistency of group opinion, group authority, and so on. Product factors are its visibility, the specific features of the product, and the functions of the product [16]; work factors mainly refer to the fuzziness of information, the openness of conformity, and the influence of authority [17]. In addition, Deutsch [18] divided the influencing factors of conformity into normative effects and informational effects.
In the study of evolutionary games, an interesting question is why spatial topology can provide the beneficial environment for the evolution of cooperation [19,20]. Various works have demonstrated the effect of spatial reciprocity on the promotion of cooperation dynamics [21]. Conformity has been attracting much attention also recently. Szolnoki and Perc designated a fraction of population as being driven by conformity rather than payoff maximization [22]. Yang [23] and Niu [24] found that conformity-driven reproductive ability, especially rational conformity behavior, can greatly enhance cooperation compared with homogeneous reproductive ability in the evolutionary spatial prisoner’s dilemma game. Kabir et al. [25] found that the shape of the cooperative cluster and the ability to expand a single perfect C-cluster are the two factors that bolster the effect of network reciprocity.
In economics, customers are affected not only by the quality and price of the product, but also by the behaviors of other people in the market. For example, Bernheim [5] proposed a theory of social conformity and presented a model to describe the conformity process that has been replicated a large number of times across age groups and cultures by researchers. Corazzini [26] studied the role of social preferences and conformity in herding behavior in anonymous risky environments. Park and Kwanghee [27] identified three features of clothing conformity, i.e., normative, informative, and identifiable conformity. They found the interest in appearance was relatively high, and normative conformity was the most common among the three factors of clothing conformity. By analyzing quarterly data for the 1975–94 period, Wermers [28] investigated whether mutual funds tend to “herd” when trading stocks and examined the impact of herding on stock prices and whether it is stabilizing or destabilizing.
As it is well known, the social network is a theoretical construct useful in social sciences to study relationships between individuals, groups, or organizations. Most researchers use random networks, small-world networks, or scale-free networks to represent the social networks. The random networks, which was studied by Erdös and Rényi [29], is generated by a disconnected set of nodes that are then paired randomly. Other two well-known and much studied classes of complex networks are small-world networks and scale-free networks. Watts and Strogatz [30] found the small-world networks, which are characterized by specific structural features—short path lengths and high clustering—are more suitable than the random networks for describing social networks. They can be generated from a k-regular ring graph, and each edge of the network will rewire randomly according to a certain probability. Scale-free networks, proposed by Barabasi and Albert [31], are more appropriate for representing real networks of hyperlinks between websites and online social networks, when the preferential attachment mechanism works, and the power-law degree distributions of degrees are obeyed.
Along with the developing of the complex network theory, many research issues of social problems were proposed. Zanette [32] reported numerical evidence that an epidemic-like model, which can be interpreted as the propagation of a rumor, exhibits critical behavior at a finite randomness of the underlying small-world network. Moreno [33] derived mean-field equations characterizing the dynamics of a rumor process that takes place on top of complex heterogeneous networks. Nekovee [34] showed that scale-free social networks are prone to the spreading of rumors, just as they are to the spreading of infections. They are relevant to the spreading dynamics of chain emails, viral advertising, and large-scale information dissemination algorithms on the Internet. Zhang [35] researched how the conformity tendency of a person changes with their role, as defined by their structural properties in a social network. Li [36] reviewed the models for characterizing the information diffusion in online social networks. Martinčić-Ipšić et al. [37] established two weighted similarity measures to analyze link prediction among co-occurrence language networks based on hashtags and all the words in tweets. Carrera [38] developed a probabilistic approach to discovering information diffusion among network communities based on an extended hidden Markov model (HMM).
Although a large number of theoretical, empirical, and experimental studies, particularly in psychology and sociology, have investigated the presence of conformity observations with regard to human society, there are few works investigating conformity in social network. It is in this light that we examined the effect of consumers’ conformity in the different structures of social networks. On the basis of the studies of conformity and complex networks, we explored the effect of social networks’ structure on conformity. We modeled the social networks as random networks, small-world networks, and scale-free networks and then checked the evolution of conformity behavior on these networks.
2. Conformity in Ring Networks
In order to investigate the effects of conformity in social networks, we used the model of conformity effects which was constructed by Chalip and Green [39]. While this model is impoverished in many ways relative to the actual effect of conformity, its simplicity provides a convenient avenue for investigating the effects of the phenomena.
Suppose there are two products, product 1 and product 2. Each customer in the market will be informed about them with an assigned probability. Customers are arranged on a social network, and time is divided into a series of discrete time periods. In each period, every customer simultaneously surveys his neighbors’ behavior. If the majority of people make the opposite choice to theirs, the customers change their mind. In the opposite case, the customers maintain their choice. It is said that the customers in the market have a high level of conformity and would be largely influenced by other people in their neighborhood. For convenience, the following several assumptions are made:
Assumption 1.
At the first round, the event of a customer being informed by either firm 1 or firm 2 is exclusive, and a customer will choose to buy from the informer.
Assumption 2.
Suppose conformity is the only factor influencing a customer’s decision. Whether a customer in the following rounds will change its mind merely depends on other customers in the network, regardless of the product price and quality.
Assumption 3.
Not all customers are equally social, some may be in contact only with a few neighbors, while others may be connected to relatively larger groups.
Assumption 4.
Every customer is affiliated to a group, the size of any network should be , and any network is closed.
Assumption 5.
The decision-making process of customers can continue for infinite rounds.
At the beginning, every customer will be informed of the products from either firm 1 or firm 2 and then will make their choice, which might be changed in the following rounds. Assume that any individual is informed by firm 1 with probability and by firm 2 with probability .
For customer , its choice at time is . We define as the number in ’s neighborhood who would choose to buy products from firm 1; is defined accordingly. We can define the choice function of a customer based on conformity:
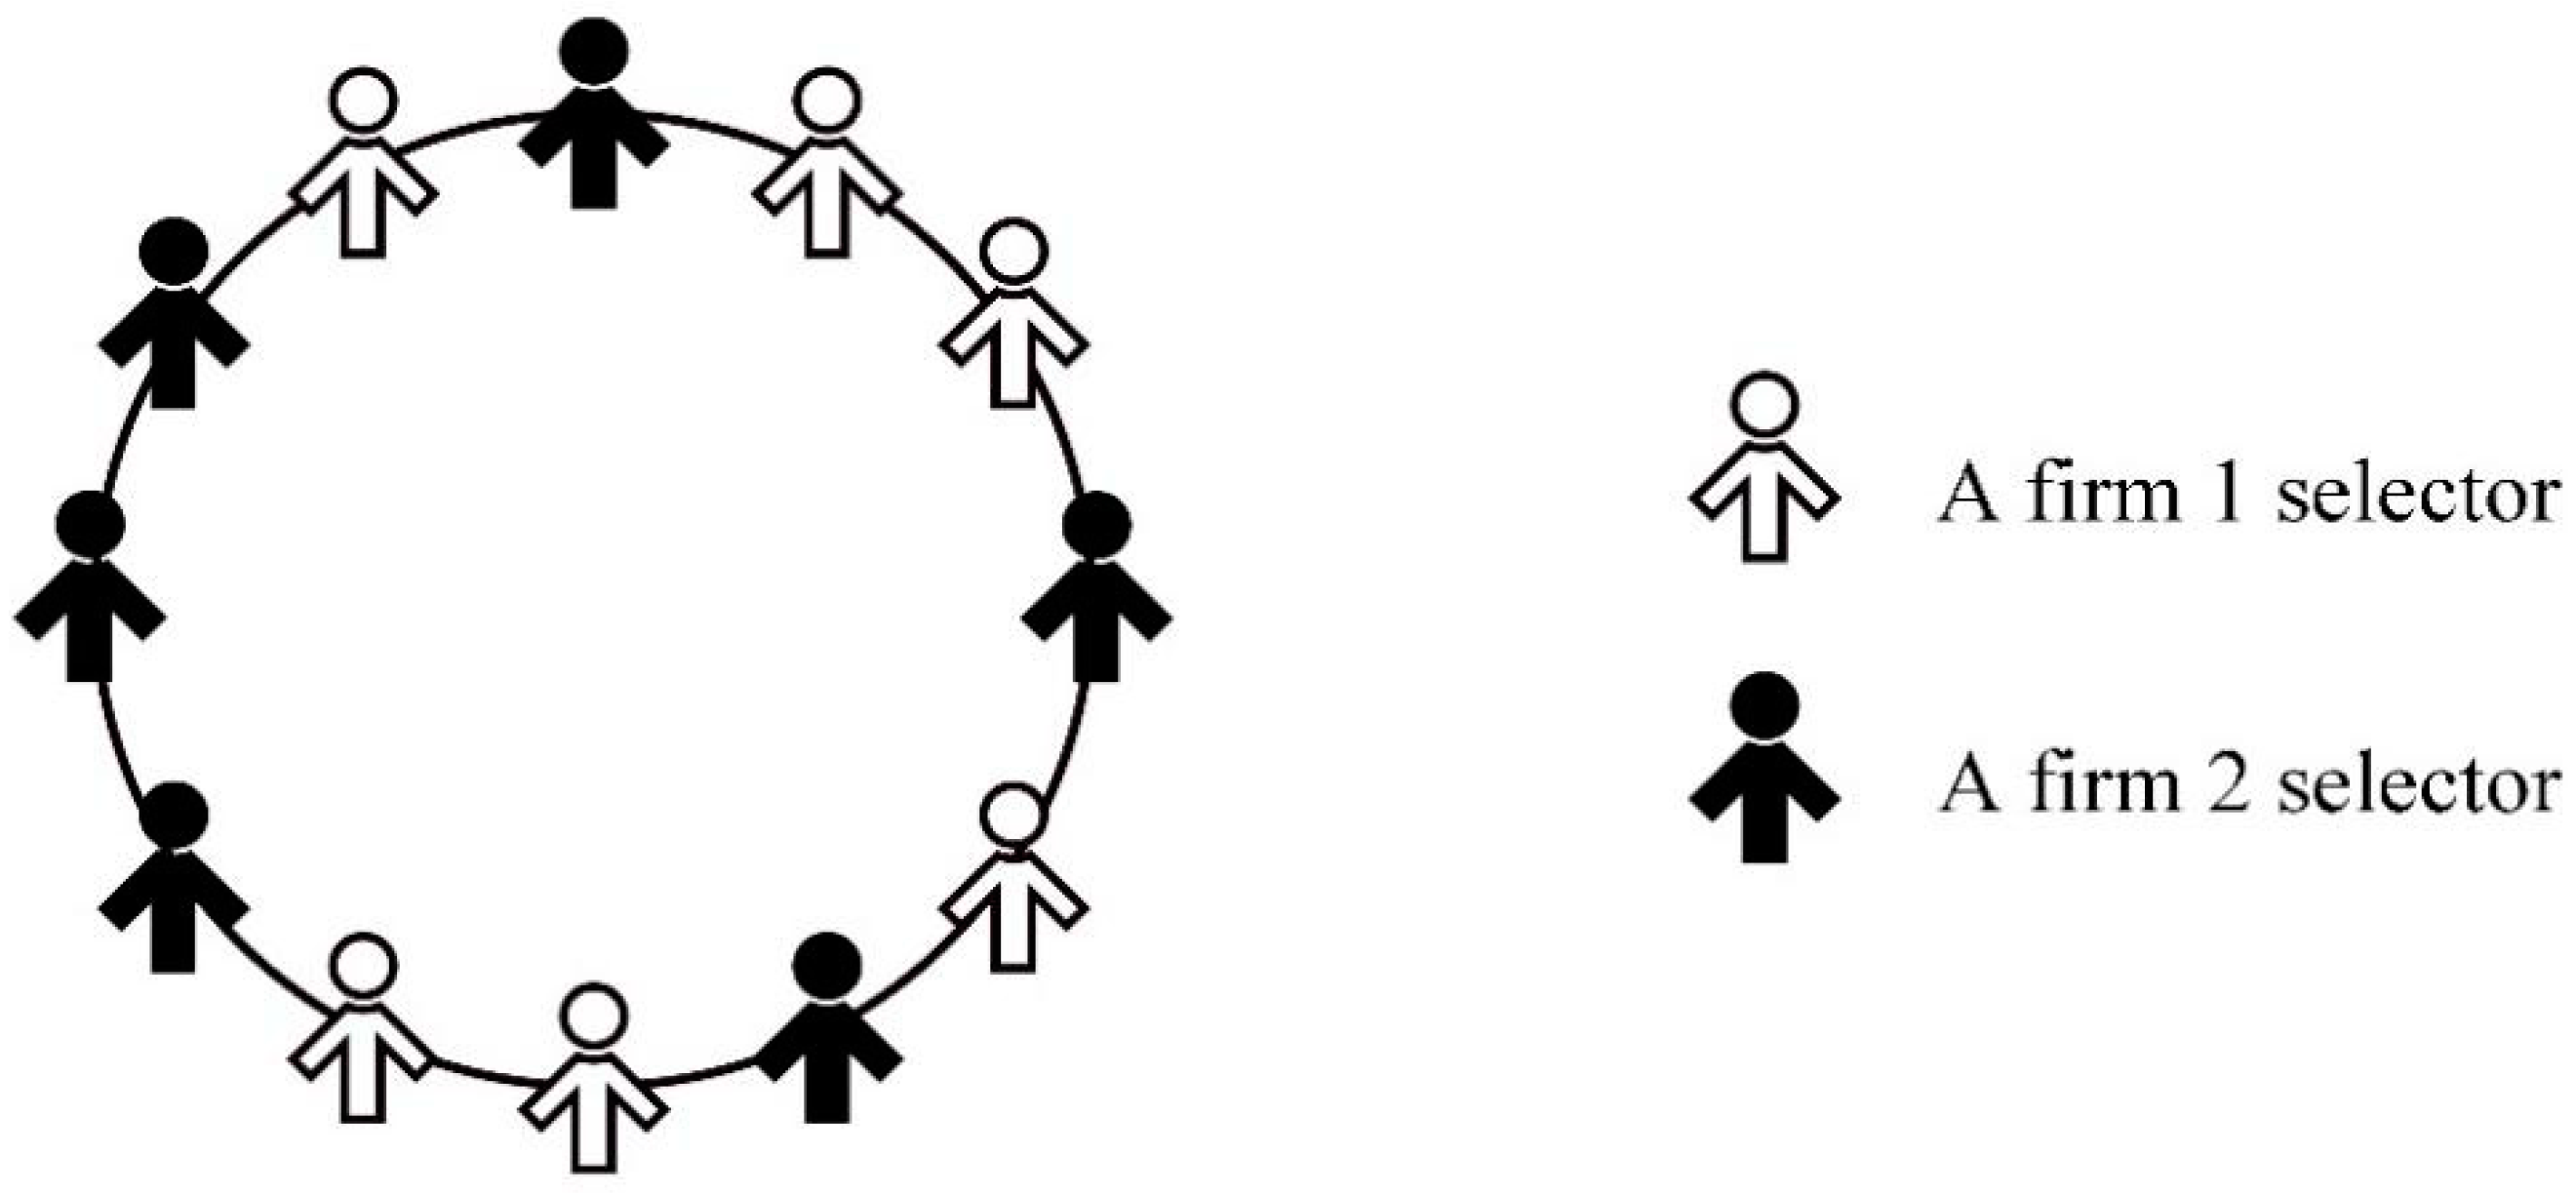
In order to simplify our research, we began the study on a ring network model which has some similarities to the model of Zollman [14]. Actually, in a regular grid topology, each node in the network is connected with two neighbors along one or more dimensions. If the network is one-dimensional and the chain of nodes is connected to form a circular loop, the resulting topology is known as a ring. Imagine customers who lead lonely lives and only know about two customers among their neighbors. The social network of these customers would be a ring, as follow (Figure 1):
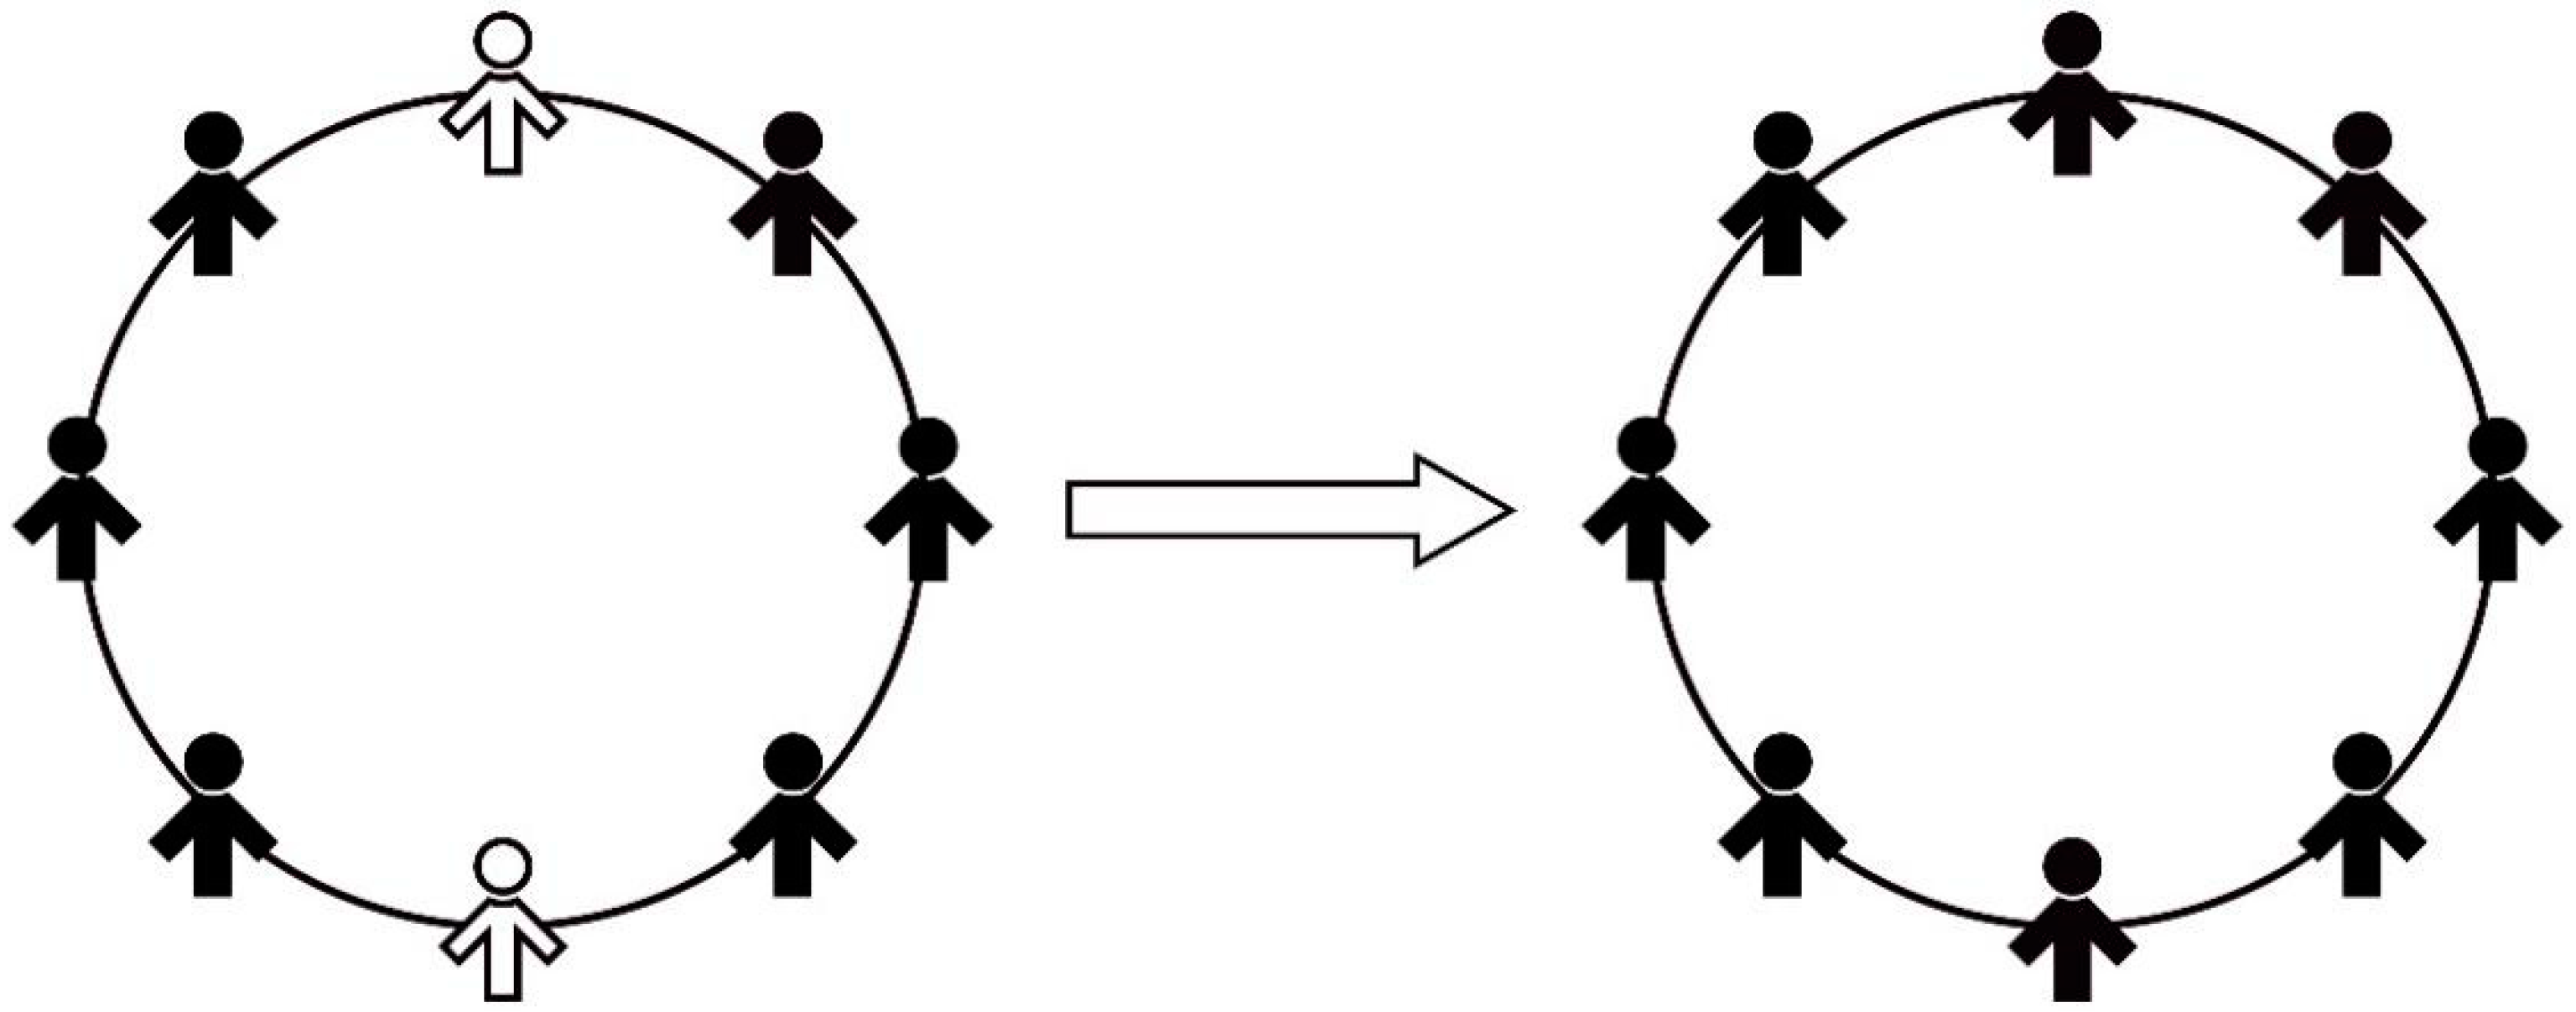
We set white icons to be firm 1 choosers, and black icons to be firm 2 choosers. According to our choice function , a customer originally informed by firm 1 will change its decision if both of its neighbors choose to buy from firm 2. We can thus conclude that a ring will converge to choose firm 2 as shown in Figure 2, if every firm 1 chooser is surrounded by firm 2 choosers. If every ring follows this rule, then firm 2 will take up the market eventually.
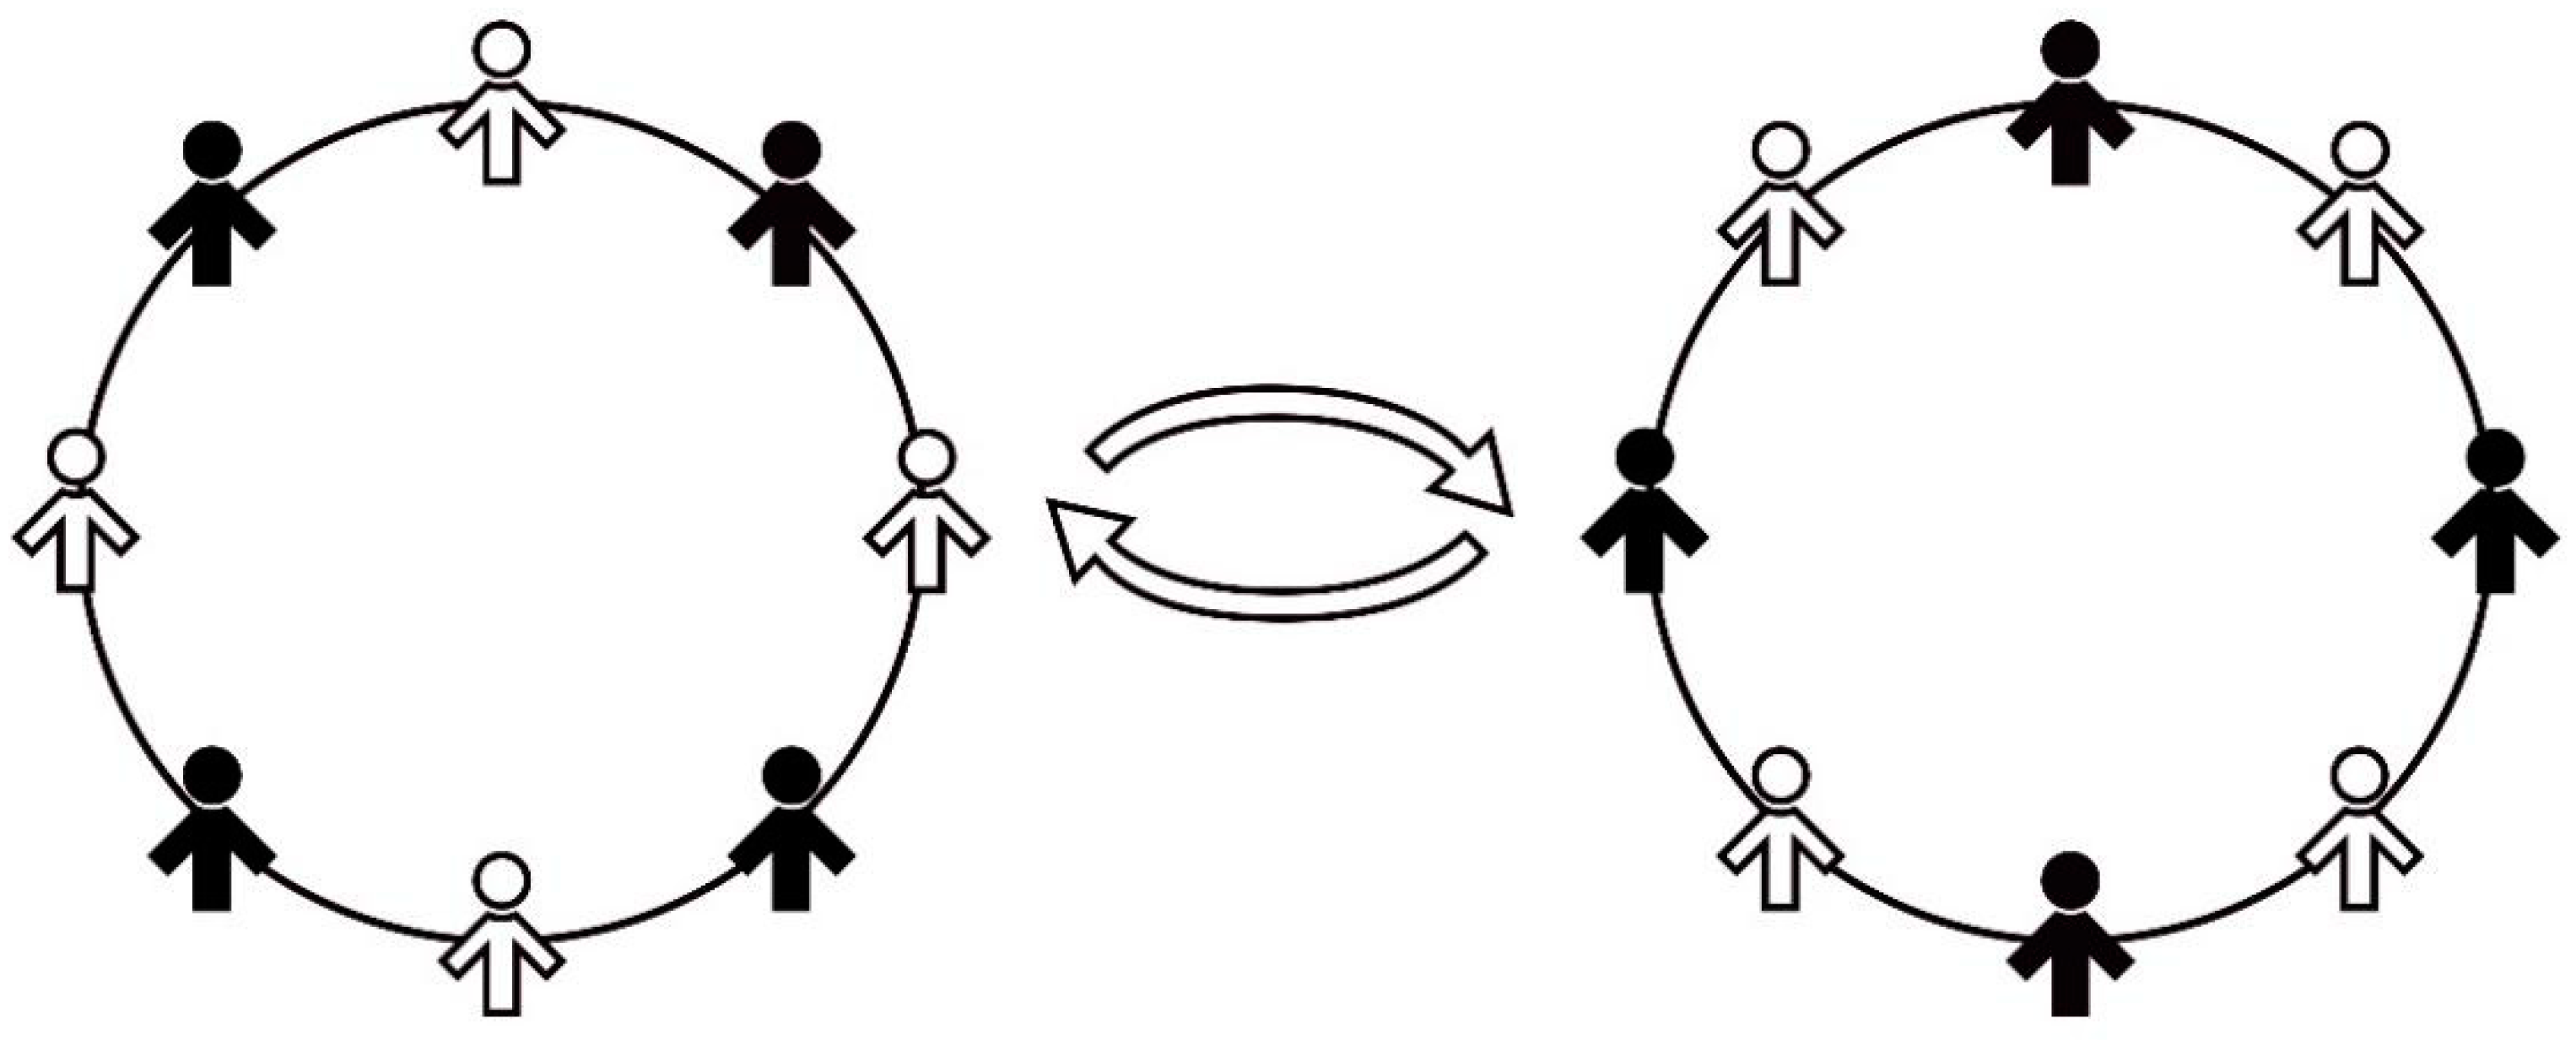
In addition, an interesting phenomenon will occur if every firm 1 chooser and firm 2 chooser appear alternatively: in this case, the ring would never converge, every node would change from 1 to 2 and then back to 1 (Figure 3), which means any individual will change its mind after every round.
The following propositions can be obtained for analysis.
Proposition 1.
The chooser in a ring network will converge to firm 1 if, and only if, every customer has two firm 1 choosers as neighbors and does not have two firm 2 choosers as neighbors.
Proof.
This proposition seems to be reasonable as we can see from the rings above: every customer with firm 1 choosers as neighbors will become a firm 1 chooser in the next round. As the process goes on, it is possible that all customers would become firm 1 choosers. With this in hand, our task now is to explore if a ring will converge to either firm 1 or firm 2 in the end.
To make it simple, we broke the ring and extended it to a linear model. The probability of not having two consecutive firm 2 choosers as neighbors is set to be . The customer itself has a probability to become a firm 1 chooser and a probability to become a firm 2 chooser. When there is only one customer in the market, ; when there are two customers, . As the number of customers increases, we divide the situation into two parts. If the first customer chooses firm 1, then the rest customers should not have two firm 2 choosers as neighbors in a row, for which the probability is required; if the first one is a firm 2 chooser, then the second person should choose firm 1, and for the rest customers, the probability must satisfy . Based on this, we have:
□
Proposition 2.
For is strictly decreasing.
Proof.
In the above linear model, the probability of not having two consecutive firm 2 choosers decreases as the number of customers increases according to proposition 2. As in a ring, the only difference between this and the linear model is one connection between the first customer and the last one. In this case, if the first person is a firm 1 chooser, we require ; if the first customer chooses firm 2, then the second and the last customers should all choose firm 1 to meet the requirement; for the rest customers, the probability should be .
So, the adjusted probability based on can be given as:
It has a similar character as according to another proposition. □
Proposition 3.
For is strictly decreasing.
Proof.
As the size of the ring network increases, the probability of one customer having two firm 2 choosers as neighbors will increase, and according to Proposition1, there would finally be some customers choosing firm 2, and the ring will never converge to firm 1. Two firms would be able to maintain a duopoly market as they share the customers together. In the simplest network (the ring), conformity may not be able to affect all customers because of lack of communication between people. It is worth mentioning that a small ring has higher chances to converge to either firm than a large one, according to the probability function which is strictly decreasing. However, in a larger ring, the majority would have higher chances to cause convergence to firm 1 or firm 2 and thus to lead to a monopoly market. It is also reasonable and provable that the firm with higher would be able to gain more customers. In order to increase their value, firms may adopt other methods such as informative advertising to increase the value of [14]. □
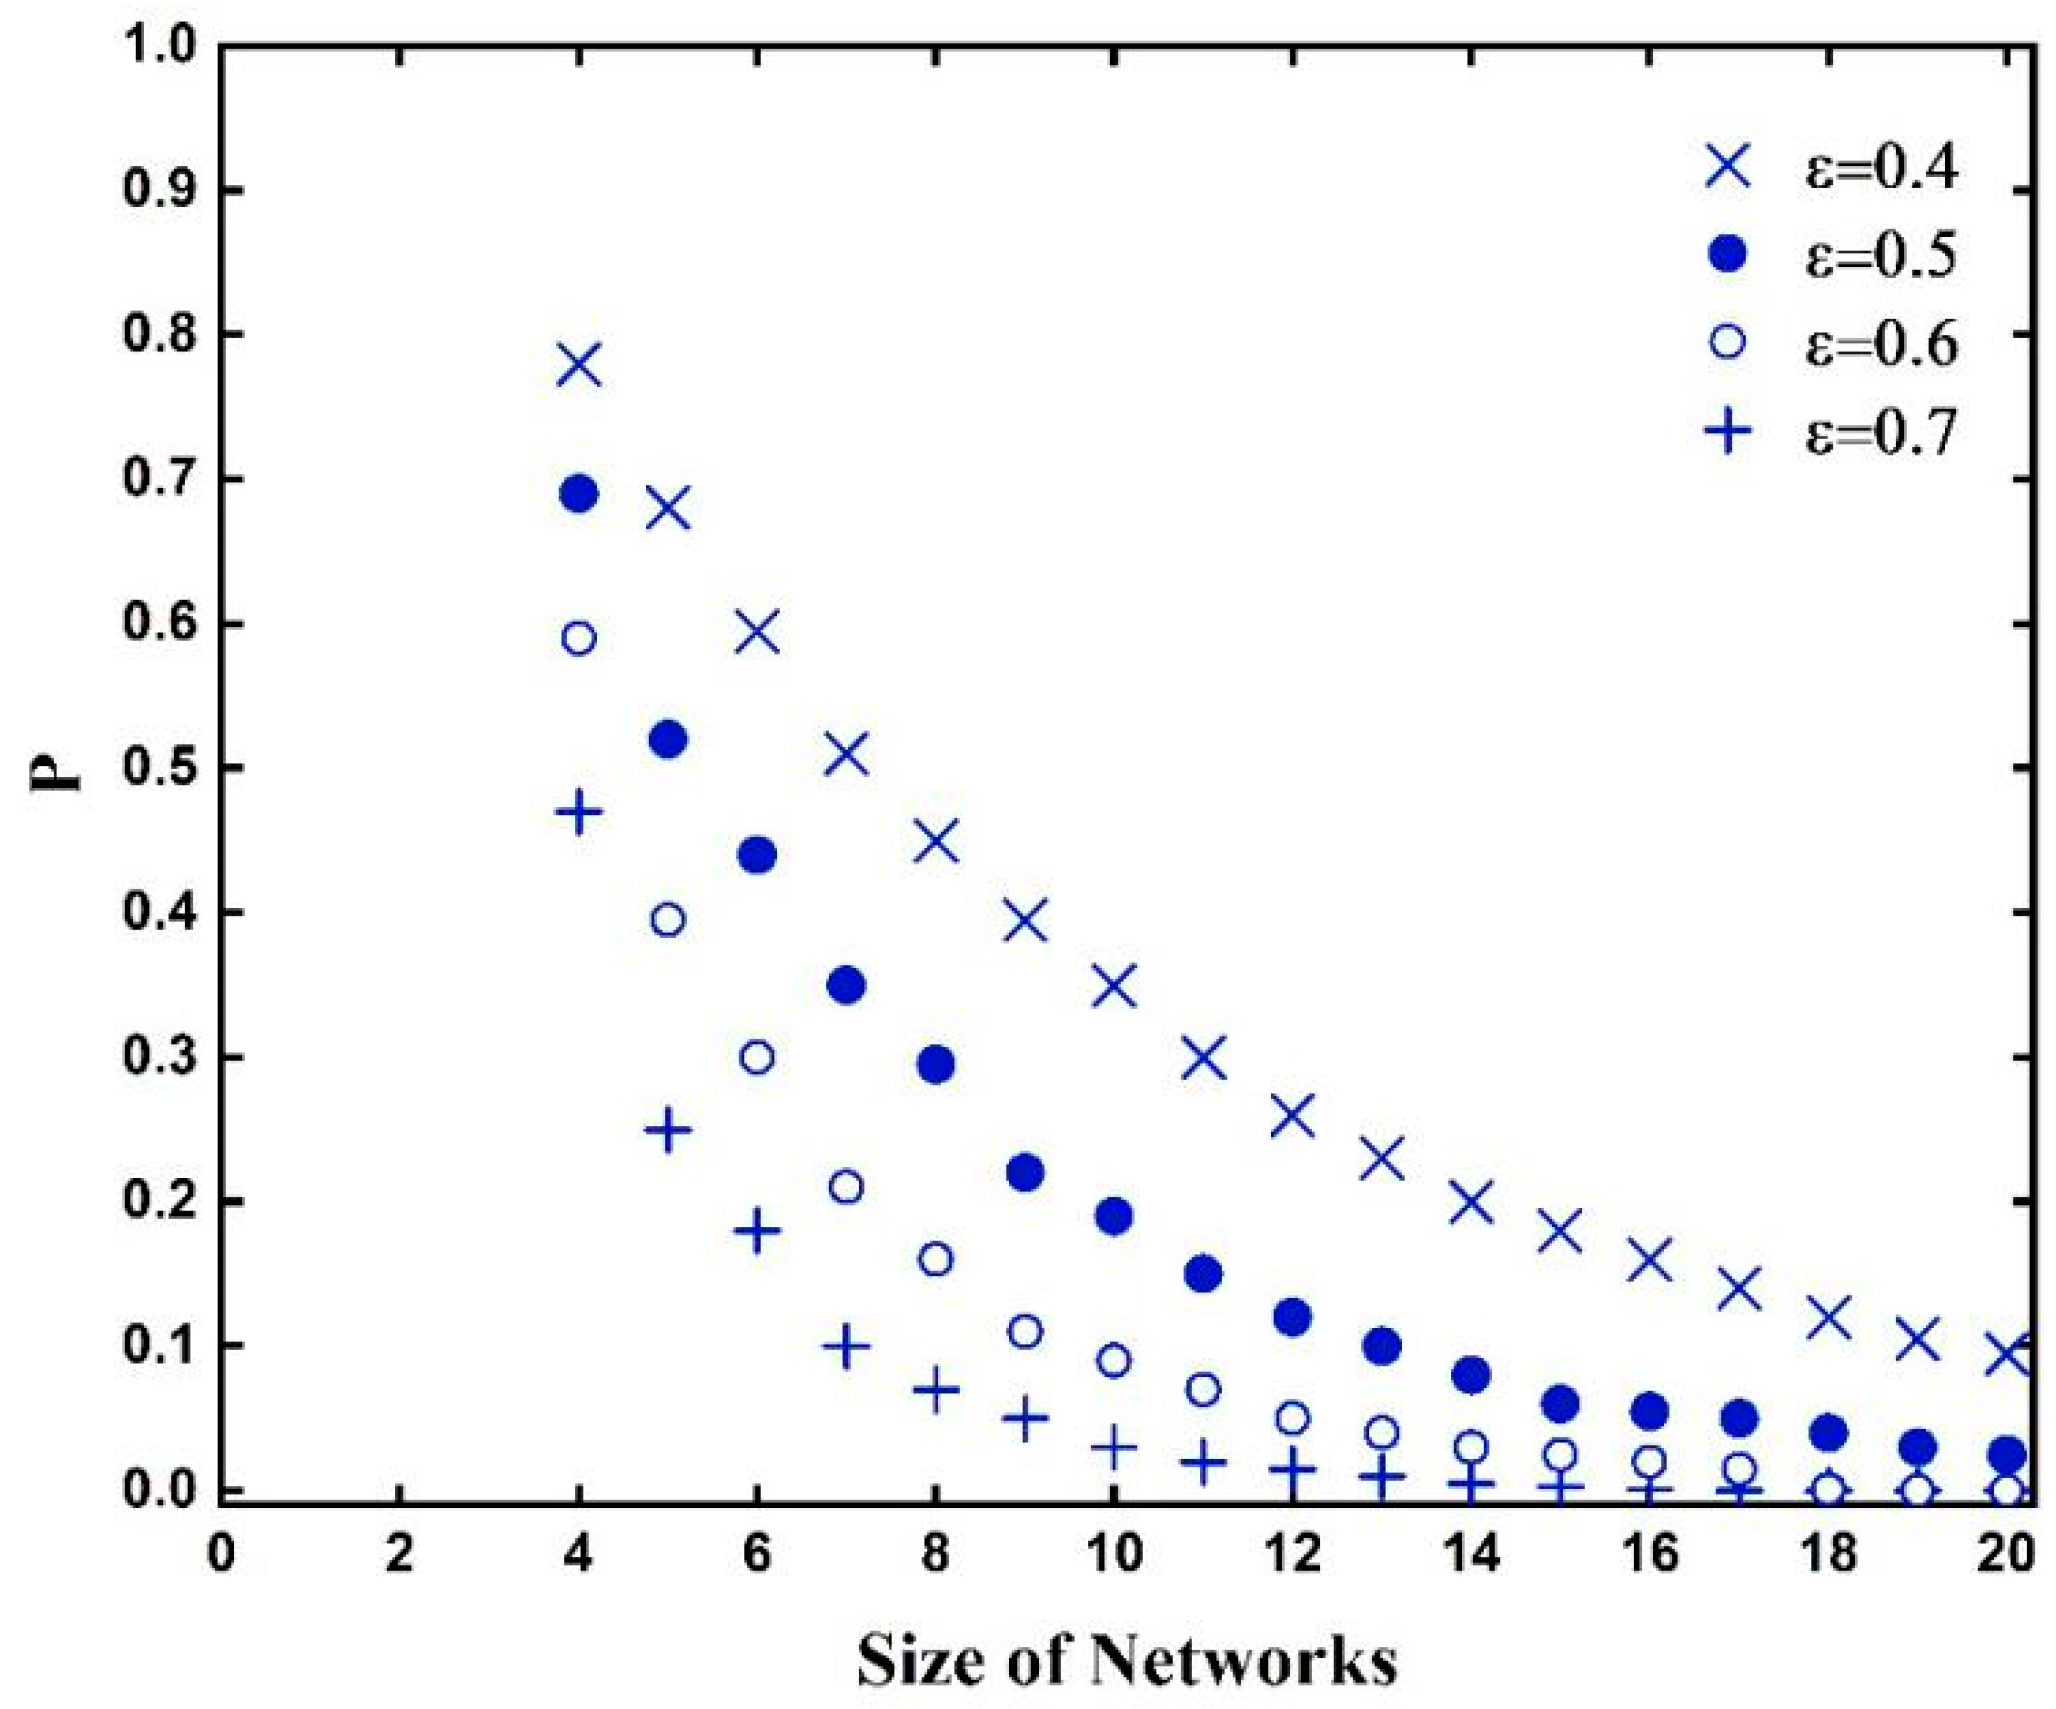
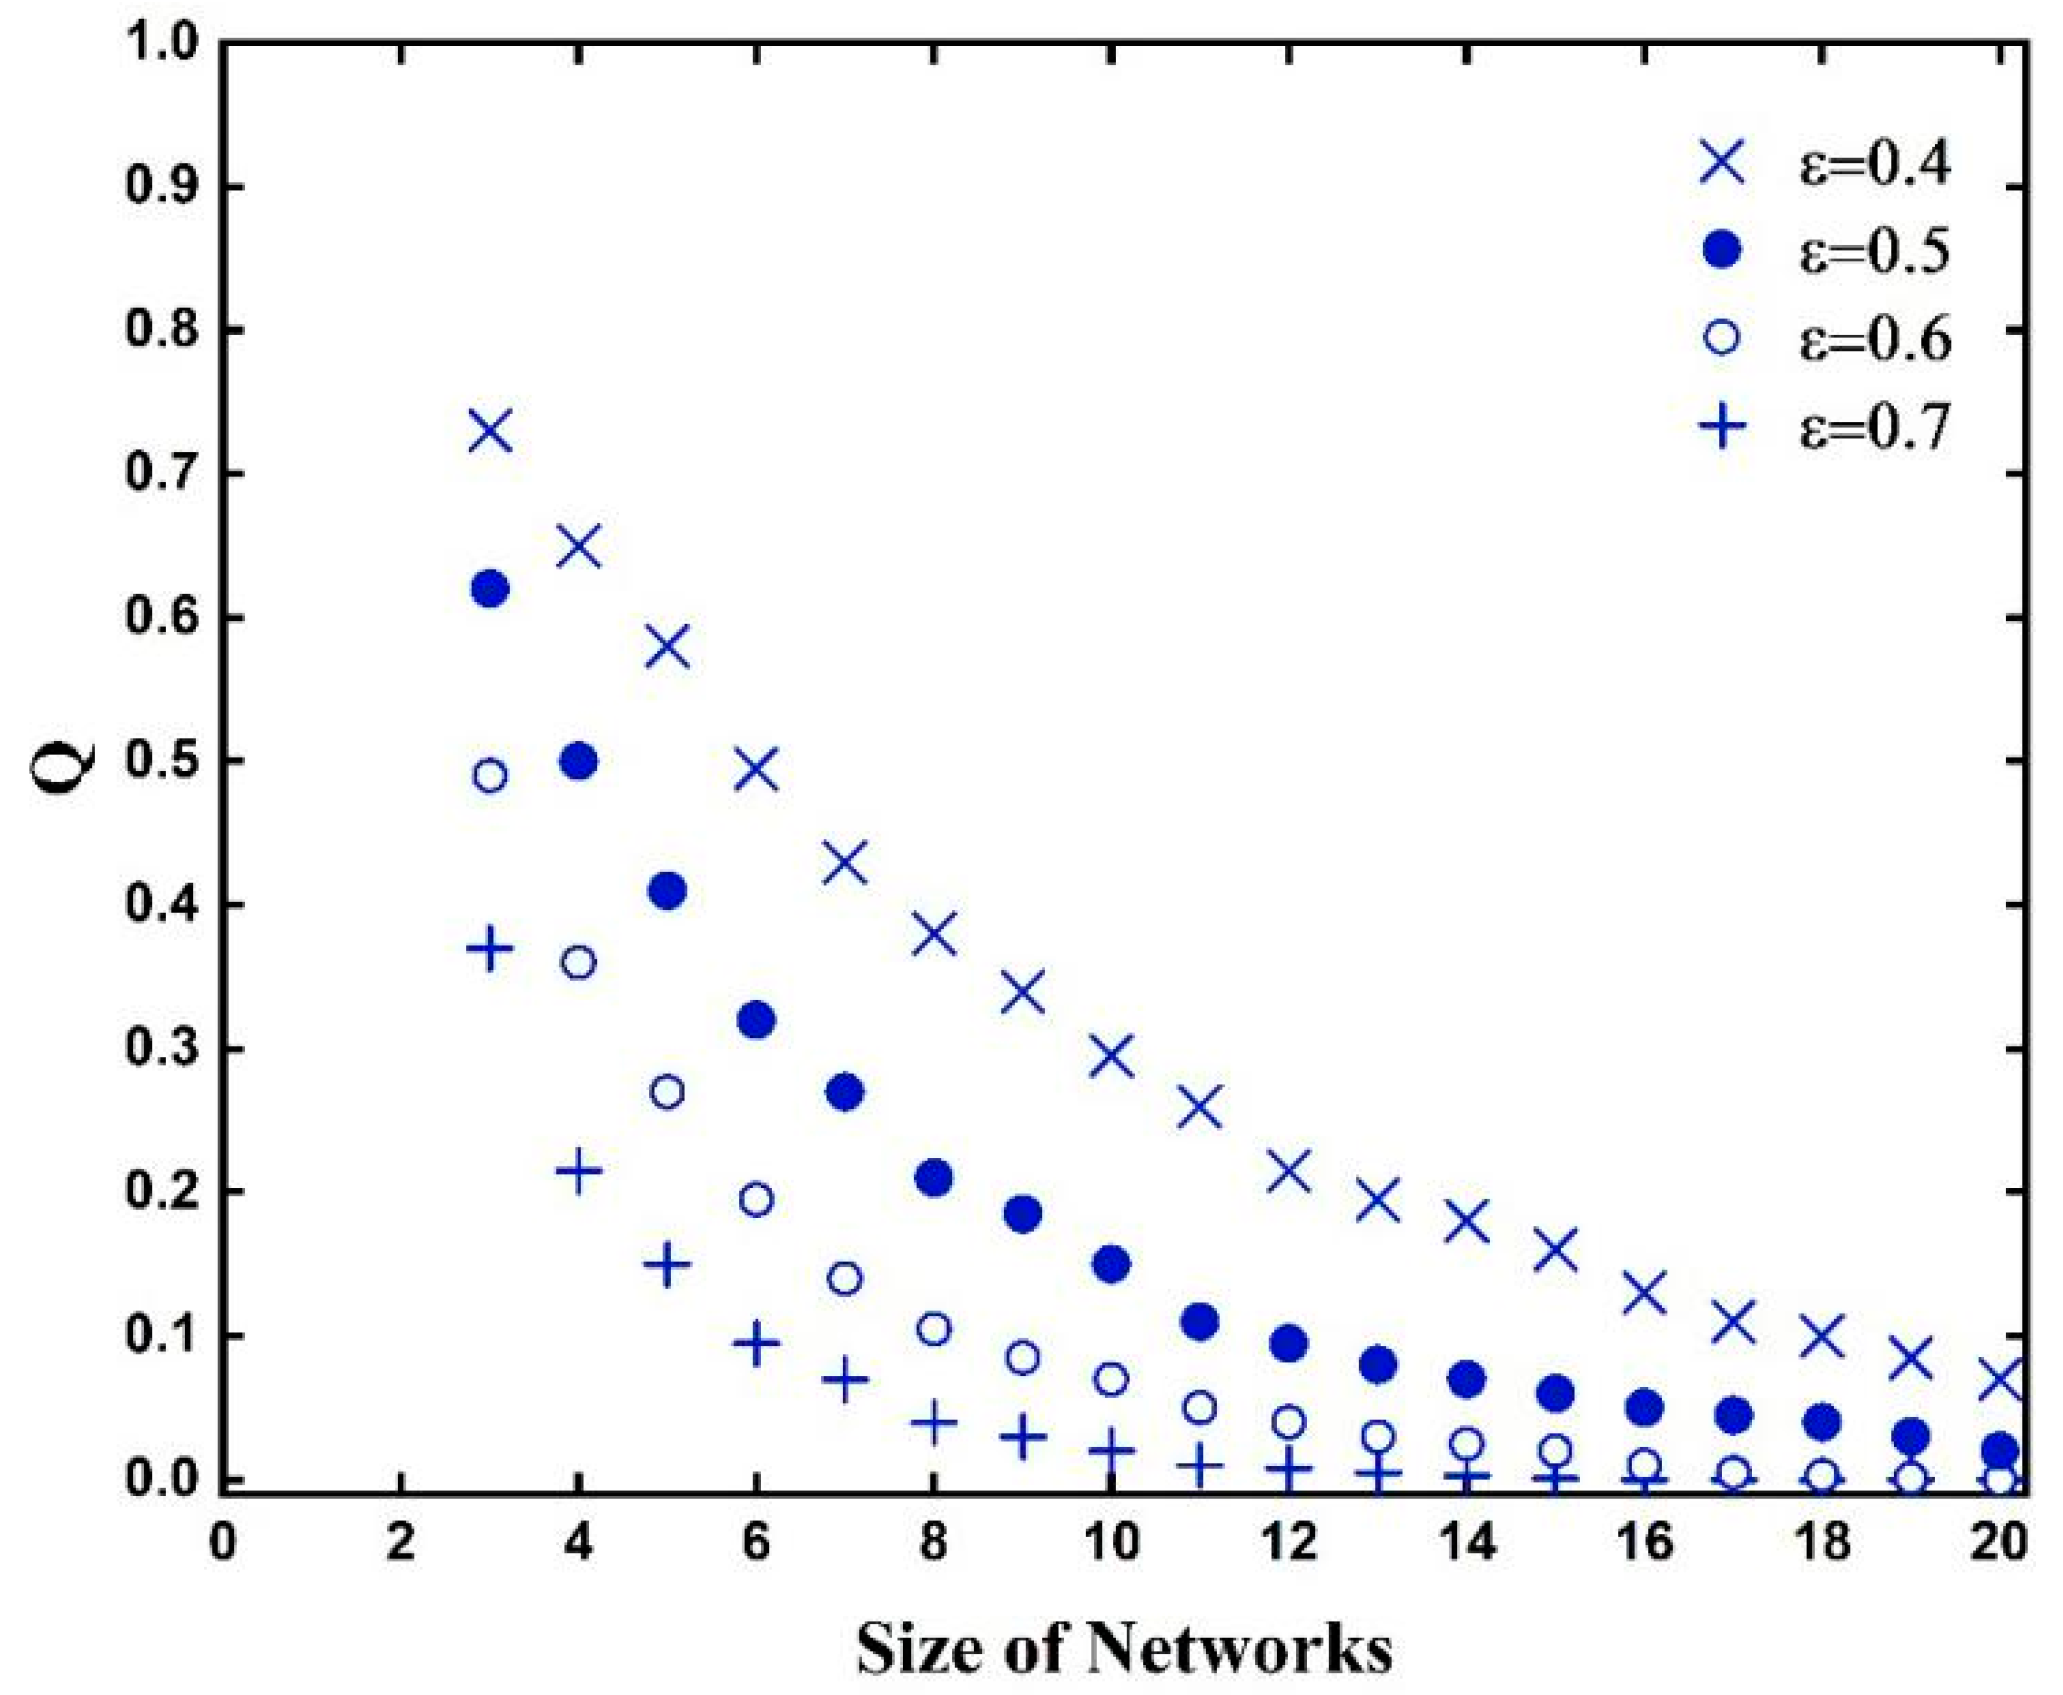
In order to illustrate the above propositions, we calculated the probability of not having two choosers of firm 2 in a row as neighbors for different values of and . The size of the network was set to be in the range from 2 to 20; we obtained four curves with different . The values of both probability functions are ploted in Figure 4 and Figure 5:
As mentioned above, for any , . In this sense, we neglected the icons when and chose to start with in , in . It is evident from Figure 4 and Figure 5 that both probability functions and decrease as increases, which indicates the larger a social group is, the more difficult it will be to converge to one firm. It is also worth mentioning that firms with higher probability to inform customers (i.e., with higher ) are less likely to take up the whole market in a ring network. This seems a little counterintuitive, but we should notice that firms of this type have higher chances to defeat their opponents and own more shares in the market.
3. Analysis of Conformity in Complex Networks
Most real-world networks, especially social networks, are complex. Complex networks are networks with non-trivial topological features that are neither purely regular nor purely random. For example, small-world networks, according to Watts and Strogatz, are distinguished from other networks by two specific properties: high clustering among nodes and short path lengths. A scale-free network, such as collaboration networks and inter-bank payment networks, is a network whose degree of distribution follows a power law. Hence, in order to further study the influence of customer conformity in the social networks, we conducted a comparative study in random networks, small-world networks, and scale-free networks.
We supposed there are N nodes in the network , in which is a finite set of nodes, and is a set of connection lines between all nodes, and in which represents an associated relationship between customer i and j. Also, each customer is set at a 0 or 1 status, , where indicates that production of firm1 is selected, and indicates that production of firm 2 is selected. Then, the state space of a social network with n customers can be described as , at any time t.
When the network size n is large enough and the nodes in the network obey the homogeneous mixed distribution, the mean-field equation can be applied to analyze the evolution dynamics of the customer’s choice behavior system. Suppose represents the proportion of nodes in which the customer with degree k in the network selects “firm 1” at time t, and represents the probability of the node connecting with the customer node with degree k in the network, where is the network average degree. Then, at time t, the probability of any customer selecting firm 1 is: . Thus, the probability of a node that chooses firm 1 among the nodes connected with customers with degree k is: , defined as . It can be seen that a mean field parameter of is applicable to any network node and is not affected by network connectivity.
Let , is a conformity coefficient, indicating the probability of customers to adjust their choice behavior. The probability that the customer choice state changes from firm 1 to firm 0 is:
where represents the proportion of the specific behavior of the associated node.
The probability of state changing from firm 0 to firm 1 is:
Then, .
Proposition 4.
The equilibrium state in the market is .
Proof.
The change rate of the customer’s choice behavior to firm1 in the network can be expressed by the mean-field equation:
□
The above formula shows that the change rate of the behavior of the customer selecting firm 1 mainly depends on the change rate of the selection behavior and the current state of the customer’s behavior, regardless of the specific time, and can be regarded as the Markov process of the continuous time system. For and , in equilibrium state, the proportion of customers whose selection behavior is 1 can be obtained by .
Following the assumptions about the market and consumers in the previous section, we carried out a series of simulation experiments to examine the influence of network structure, network size, and the initial market share on the evolution of customer conformity behaviors. In each simulation, the social network was generated with a different structure, obtaining random networks, small-world networks, and scale-free networks. Then, each experiment was iterated for 20 rounds and performed 100 times.
The results of the series of experiments are as follows:
(1) Evolution of herding behavior under different network structure types and network size.
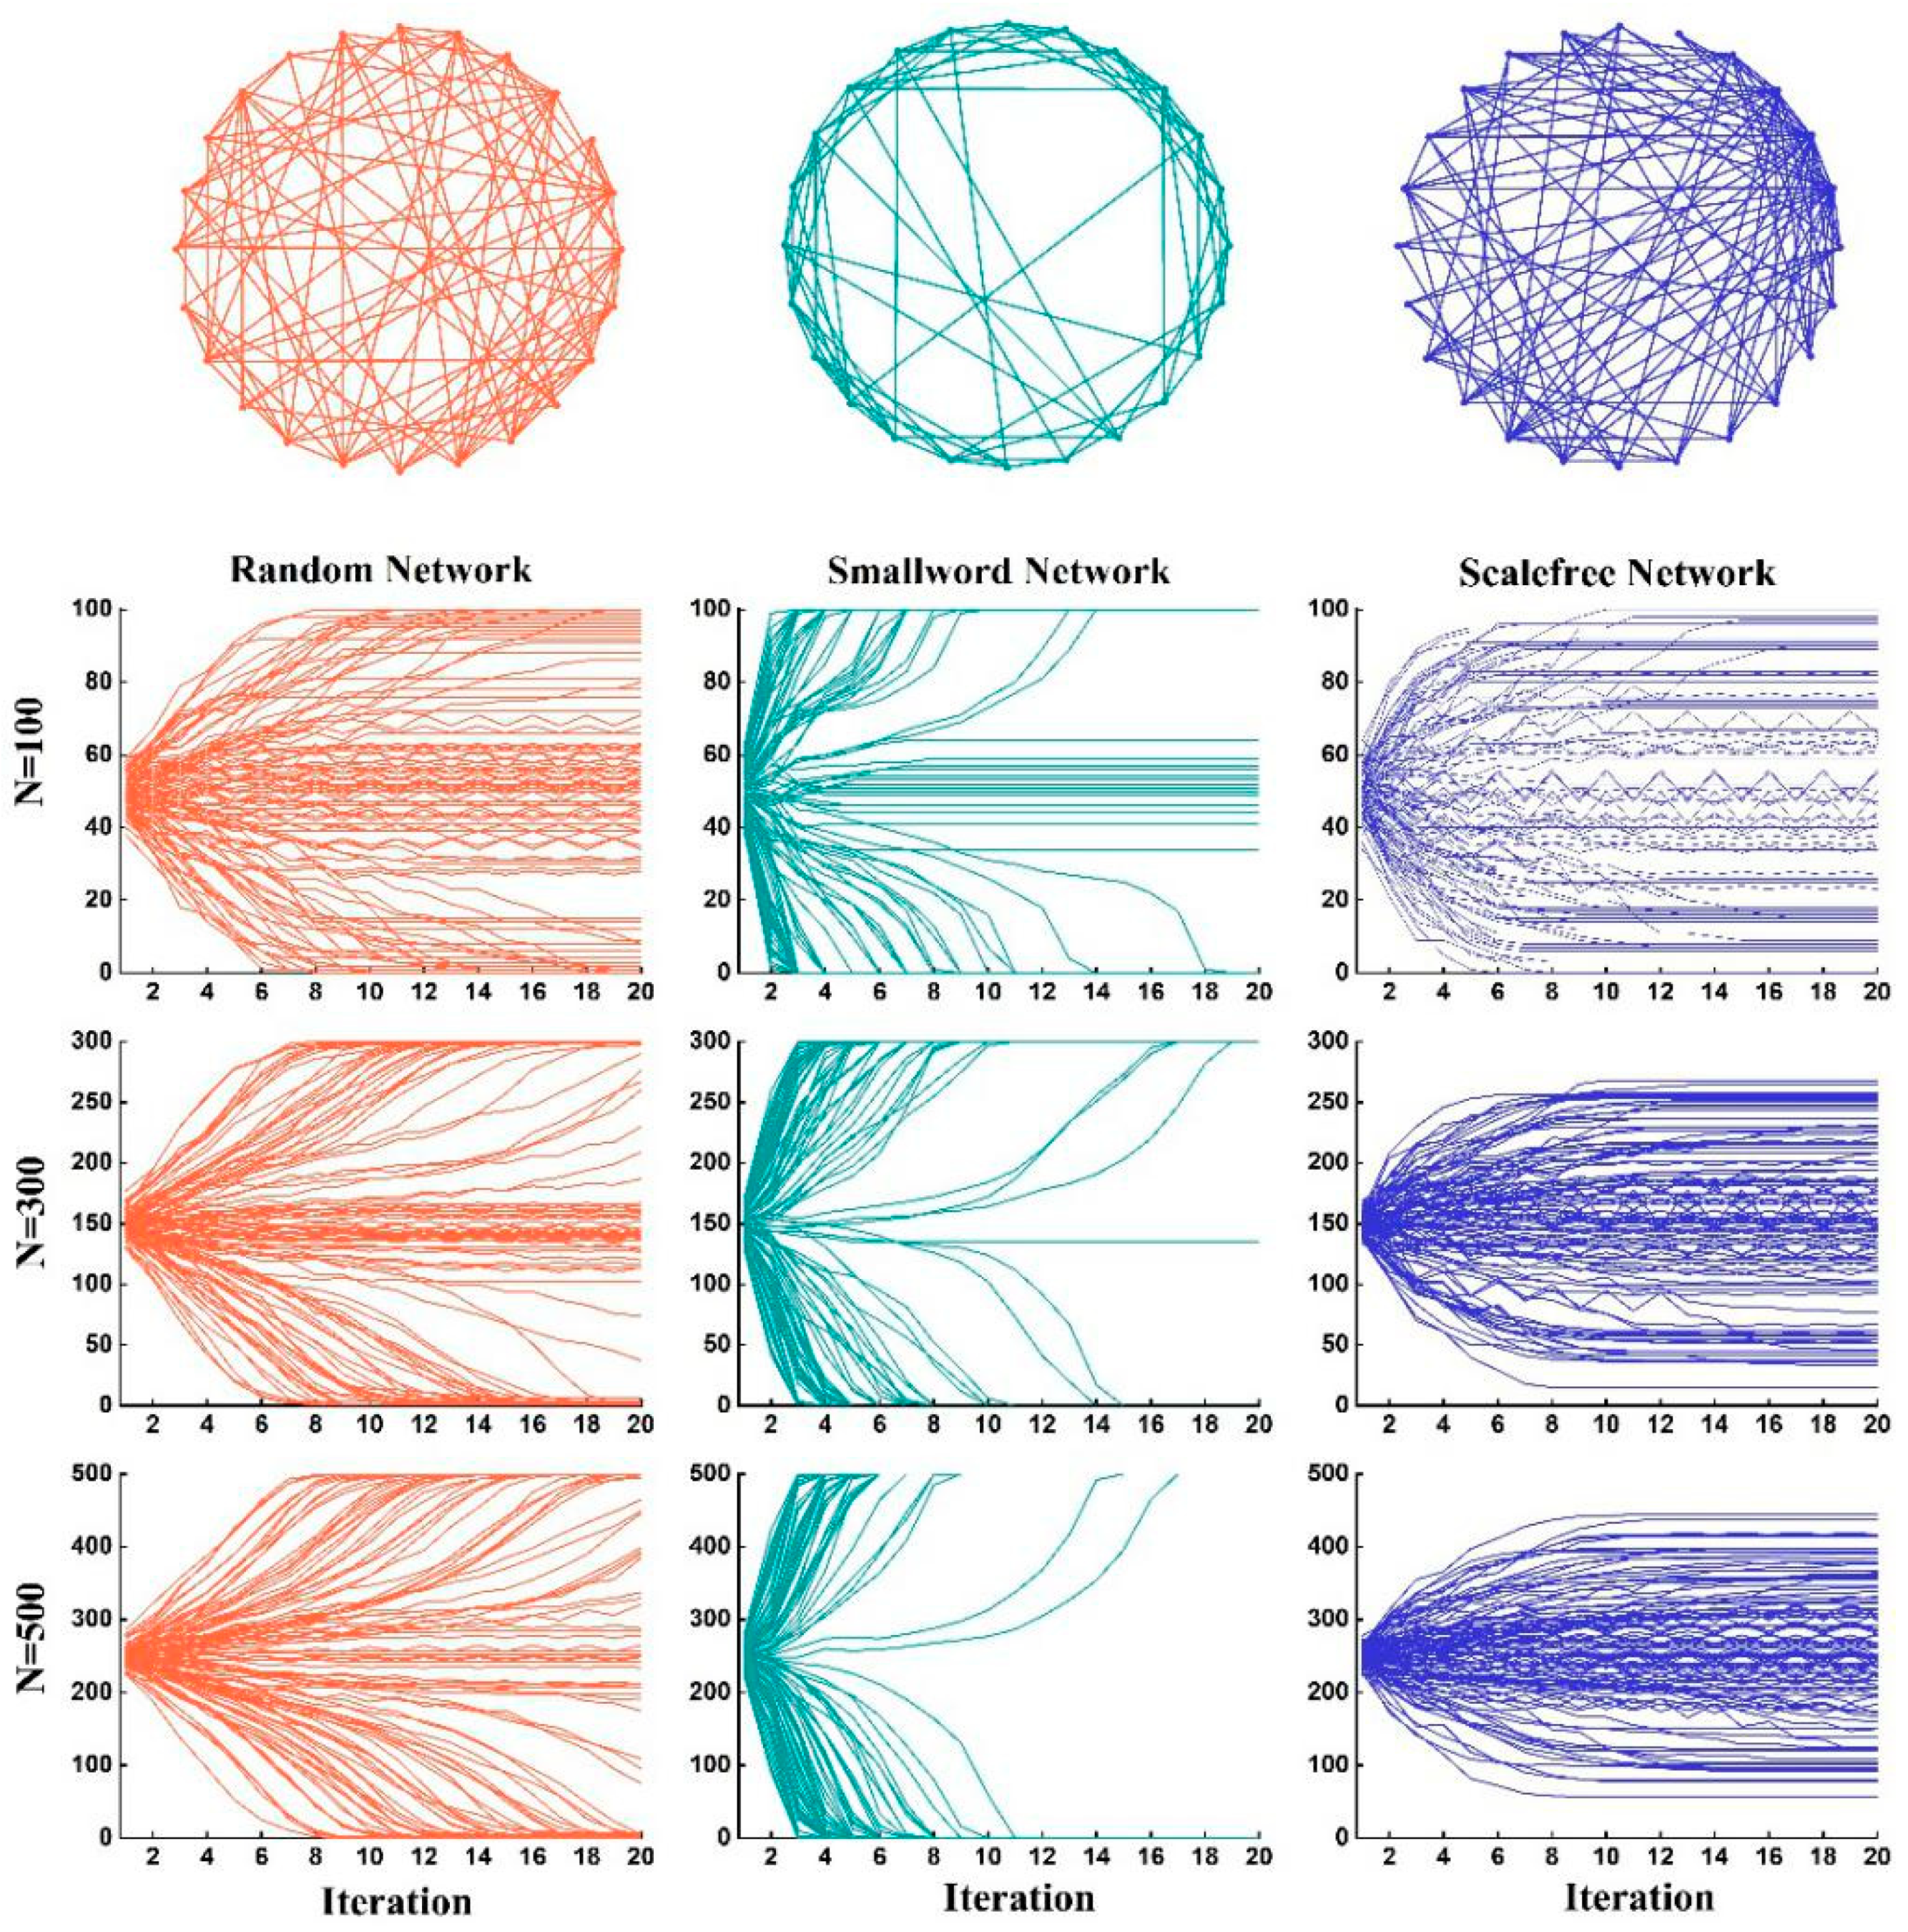
The initial market shares in the social networks were set randomly with the expected value of 0.5, and the size were set as 100, 300, and 500. Then, simulations were carried out in the generated random network, small-world network, and scale-free network, respectively. The experiment results are reported in Figure 6.
The Figure 6 shows that the topology structure of the networks has a significant impact on the evolution of the consumers’ conformity behavior. In the random network, the market share, which represents the distribution value of the consumers’ choice, may converge to one of the products, that is, the market share may reach the highest value of 1 or fall to 0, which appears as the line of iterations rises to the top or falls to the bottom; it is also possible that the line of iterations will oscillate around the middle. In the small-world network, the market share will soon converge to a stable state, showing that all consumers tend to have a common choice. In the scale-free network, the distribution value of the consumers’ choice will oscillate to varying degrees with a high probability rather than converge to a monopoly state. In addition, the scale of the network has a significant impact on the evolution of customers’ conformity behaviors. The larger the scale is, the stronger the effect of the network structure will be.
The simulation results showed that in the small-scale random network, due to the randomness of social connection, it is difficult to play a decisive role. The evolution of consumers’ behavior has a strong randomness, and the market has a certain probability to converge to the monopoly of one product. However, as the scale of the network increases, there is a great possibility of forming a dominant group of preferences in social relations, and the market share will converge to a certain monopoly state. In the small-world network, because of the shortest path and high agglomeration, consumers are likely to form a power of public opinion, which causes a high probability of converging to a monopoly of certain products in the market. In a small-scale network, there is a certain probability in a chaotic state, but as the scale increases, the convergence increases, and the market will quickly converge to a monopoly of a certain product. In a scale-free network, a non-hub node may be affected by different selected hub nodes and shift to different options, so it is difficult to converge to a monopoly state in the overall network.
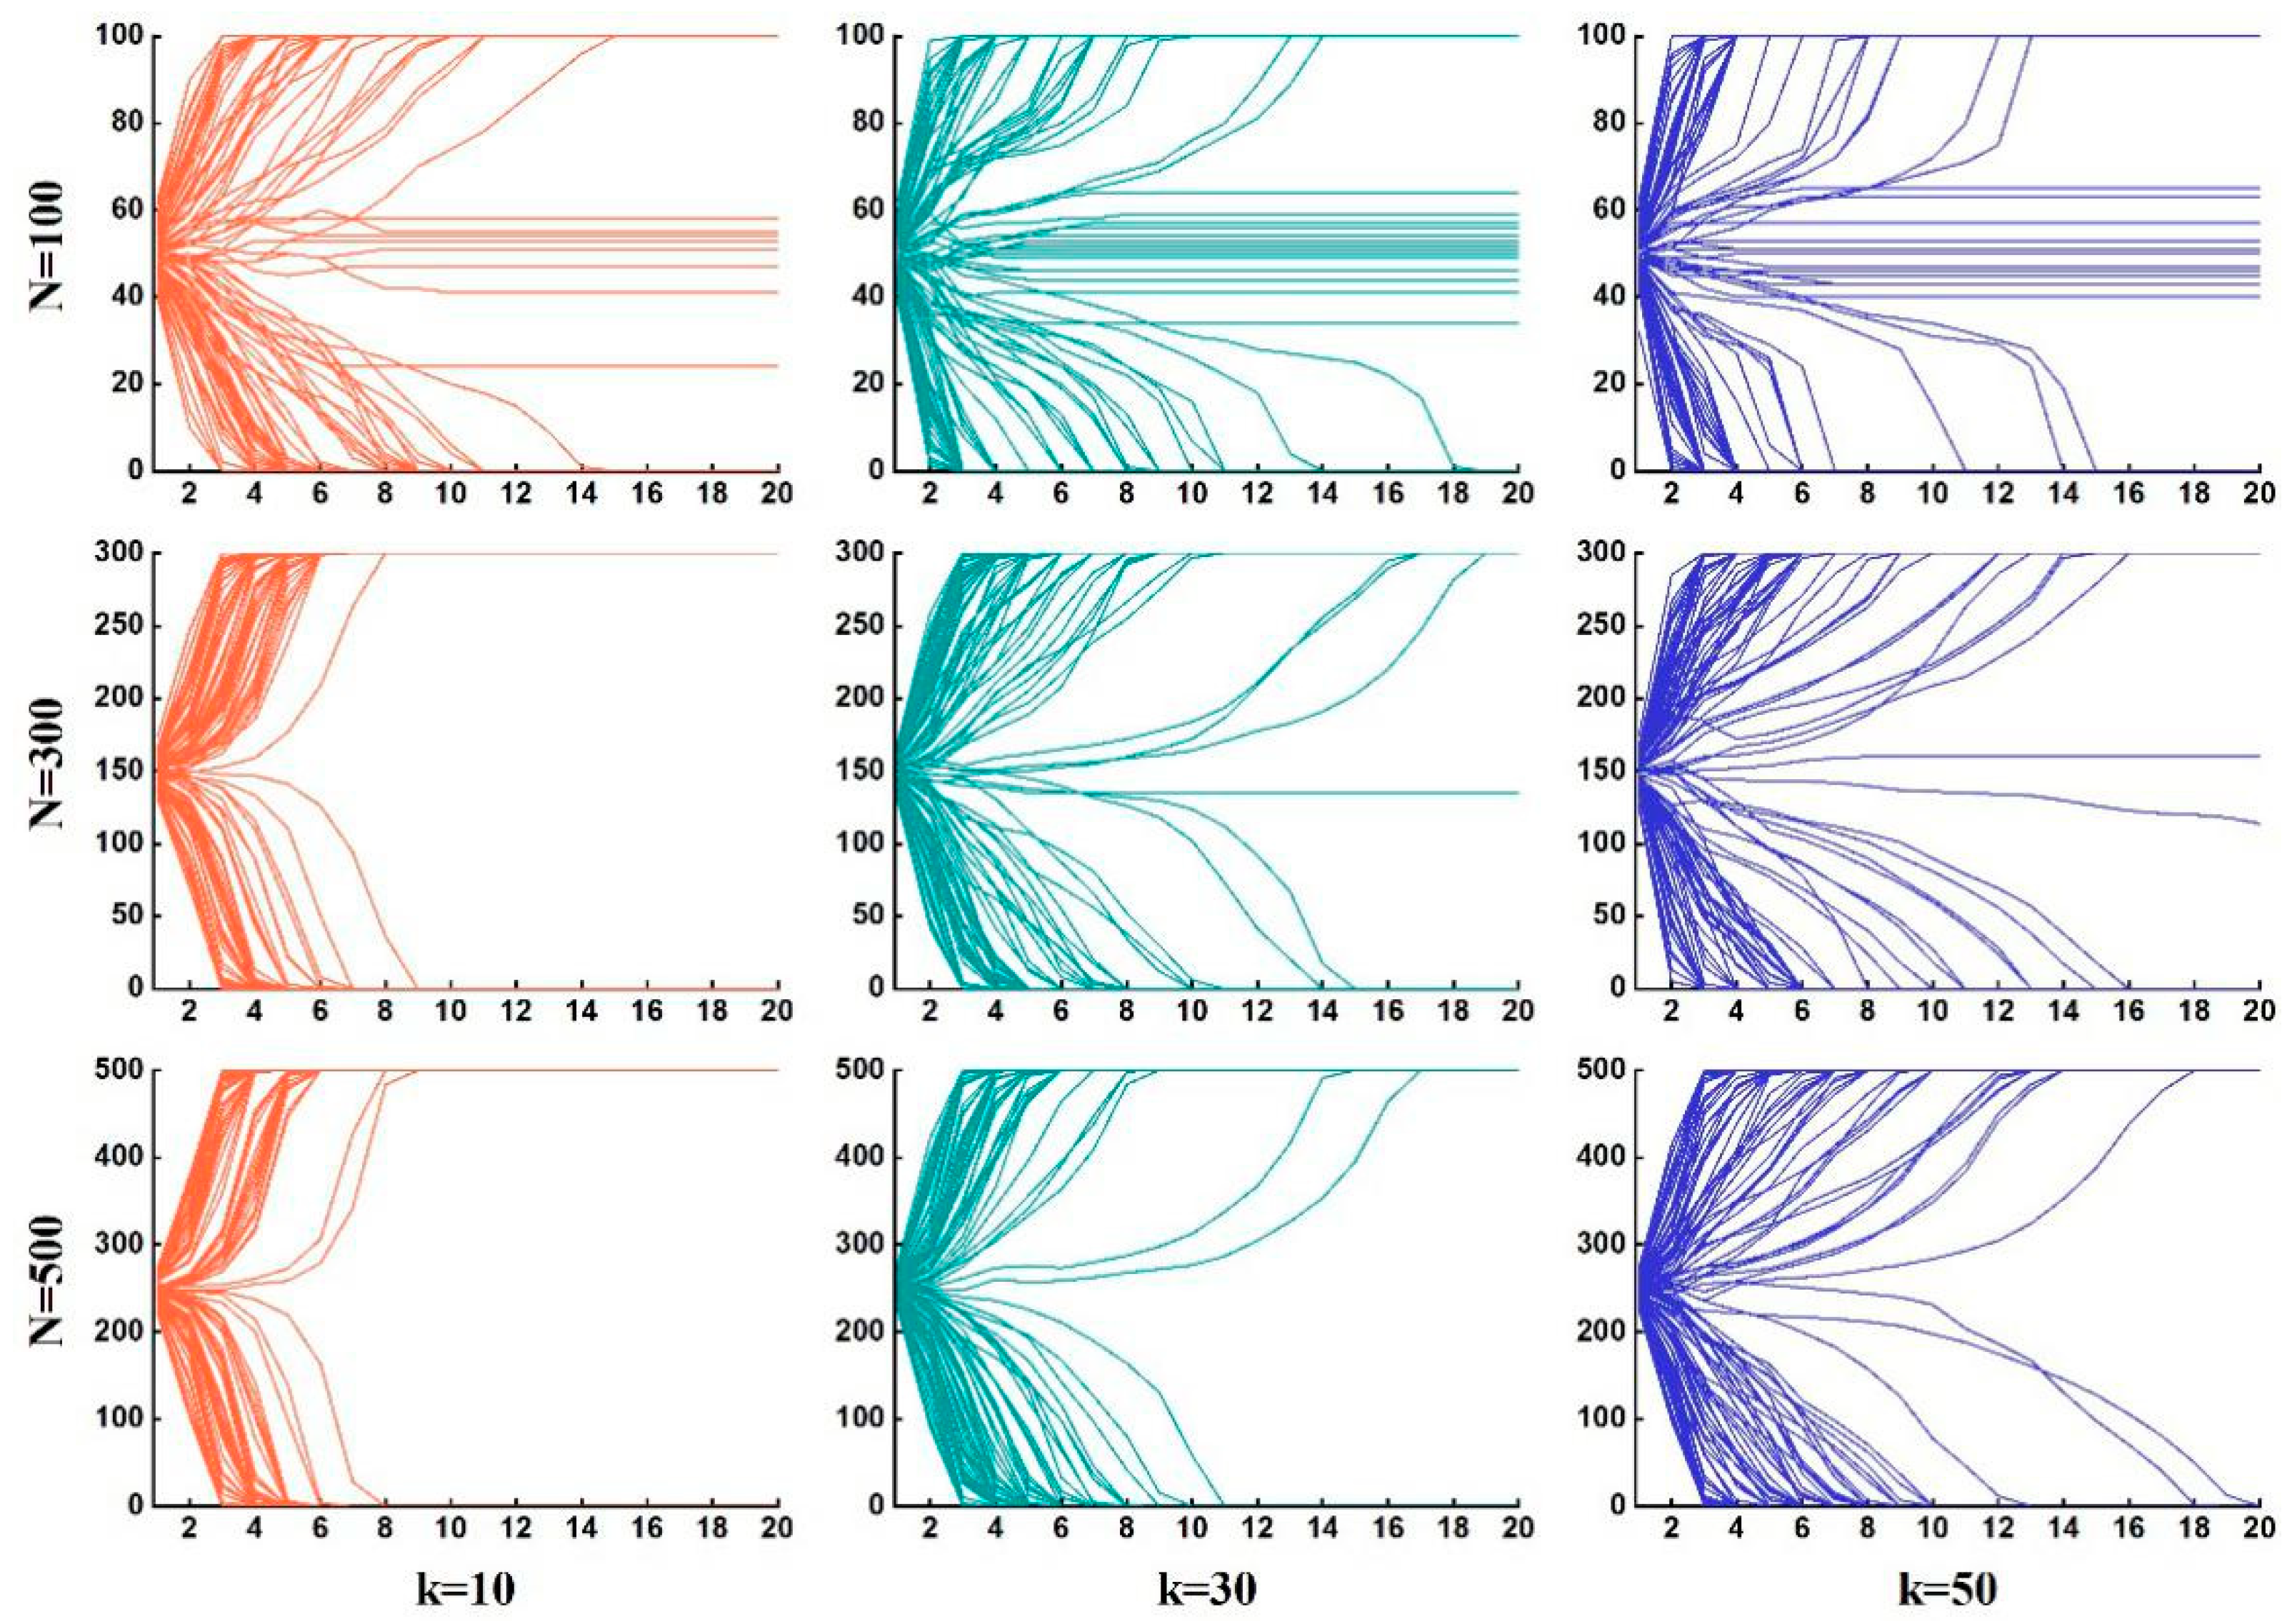
(2) Evolution of conformity behavior in small-world networks with different network densities and network scales.
The initial market shares in the small-world networks were set randomly with the expected value of 0.5, and the size were set to 100, 300, and 500. Then, simulations were carried out in the generated networks with average degree of 10, 30, and 50, respectively. The experiment results are shown in Figure 7 as follows:
The simulation results showed that the network density (which is closely related to the average number of neighbors) has a little effect on the evolution of consumers’ conformity behavior in small-world networks when the scale is small, while it will become gradually significant when the scale of the networks gets bigger. With the increase of the network density, the convergence of the market share becomes slower and weaker and may even fail to converge to the monopoly of a certain product. The possible reason is that, when the network density of small-world networks increases, the interference effect among different clustering groups is stronger, which will result in an unstable sway of some nodes in conformity selection.
(3) The influence of different initial distributions on the evolution of herd behavior.
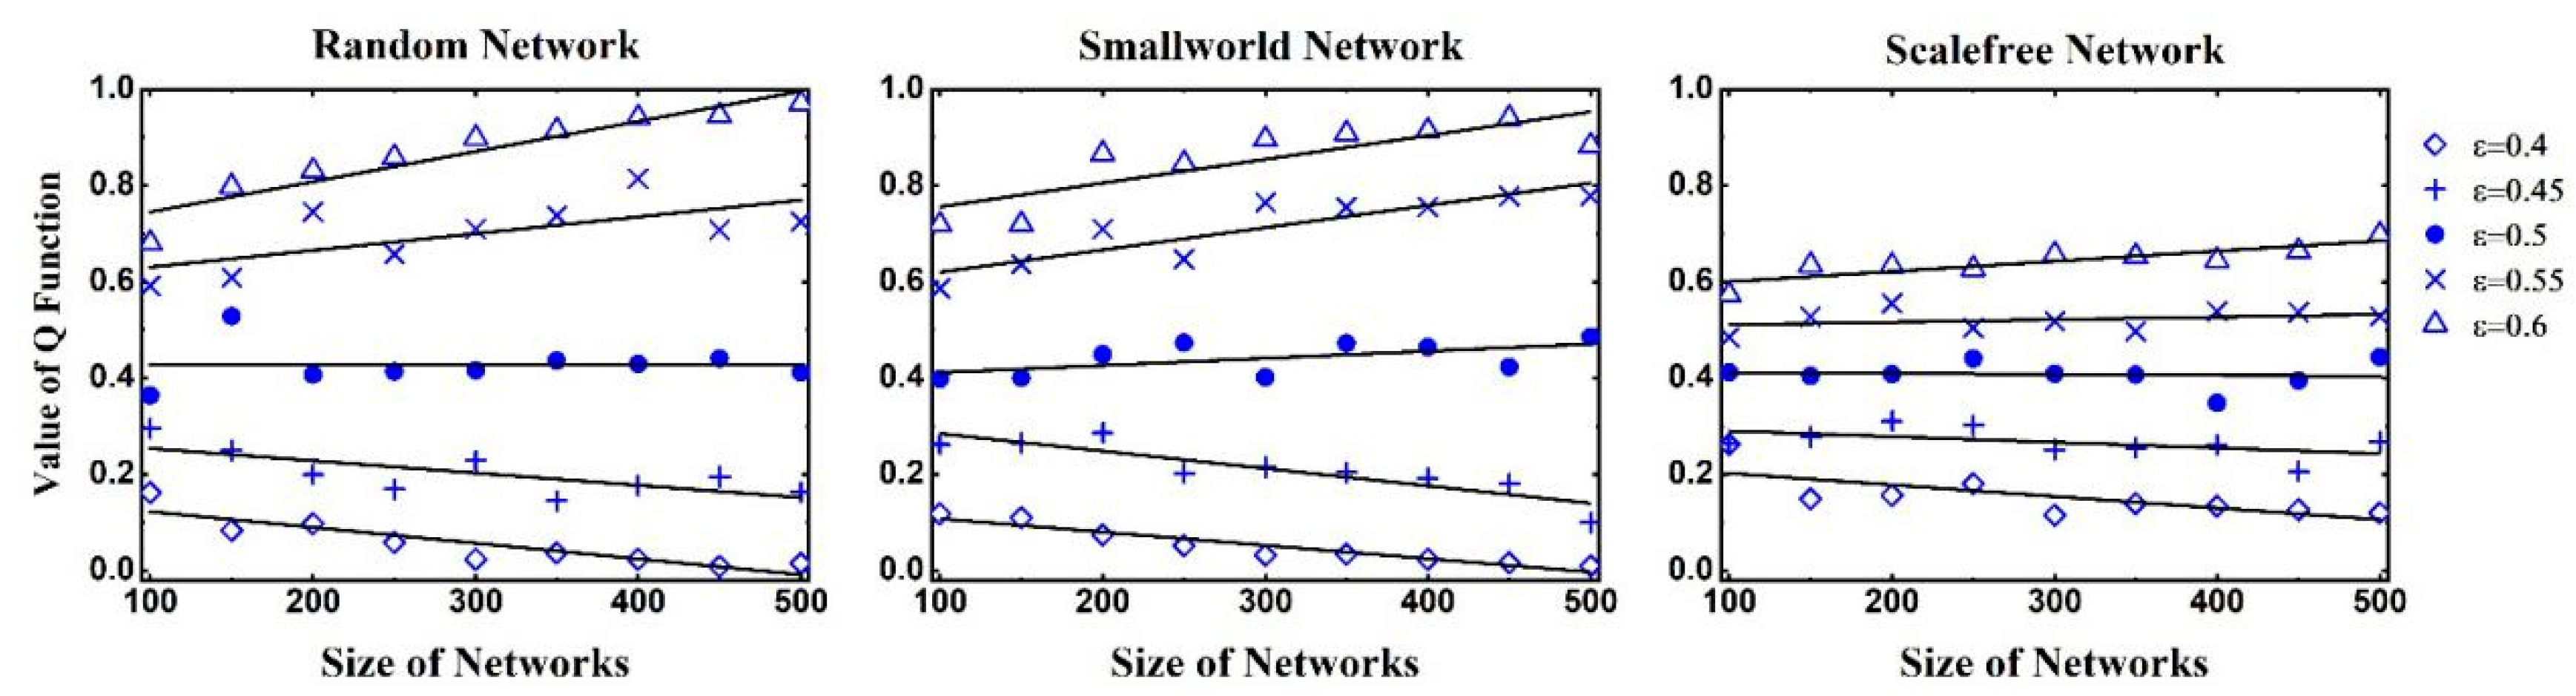
To check the effect of the initial market share on customer conformity, we set the social networks as random network, small-world network, and scale-free network, with size ranging from 100 to 500. Then, the experiments were carried out with initial distribution of 0.4, 0.45, 0.5, 0.55, and 0.6, respectively. The experimental results are shown in Figure 8 as follows:
In order to compare the results with those of the ring networks, we similarly defined , where represents the mean probability of choosing firm 1 during evolution.
When approaches 1, the distribution of consumer choices in the market tends to be monopolized by product 1. When approaches 0, the distribution of consumer choices in the market tends to be monopolized by product 2. The experimental results show that in all three kinds of social network, value will increase as increases; when the given is greater than 0.5, will increase with the size of the network. When the given is less than 0.5, will decrease with the increase of network size. When is equal to 0.5, will stabilize between 0.4 and 0.5. The above trends are particularly significant in random networks and are less obvious in scale-free networks.
The above results show that the dominant consumer groups in the initial selection distribution tend to influence the herd behavior. In turn, the market will converge to the monopoly of the product. In addition, when the initial market share is quite balanced, the distribution of consumer choice may appear as chaotic in a social network with a small scale. In a large-scale social network, it is more likely that the market will converge to the monopoly of dominant products. The above results are obvious in random networks and small-world networks, but in scale-free networks, the chaotic state is more likely to occur.
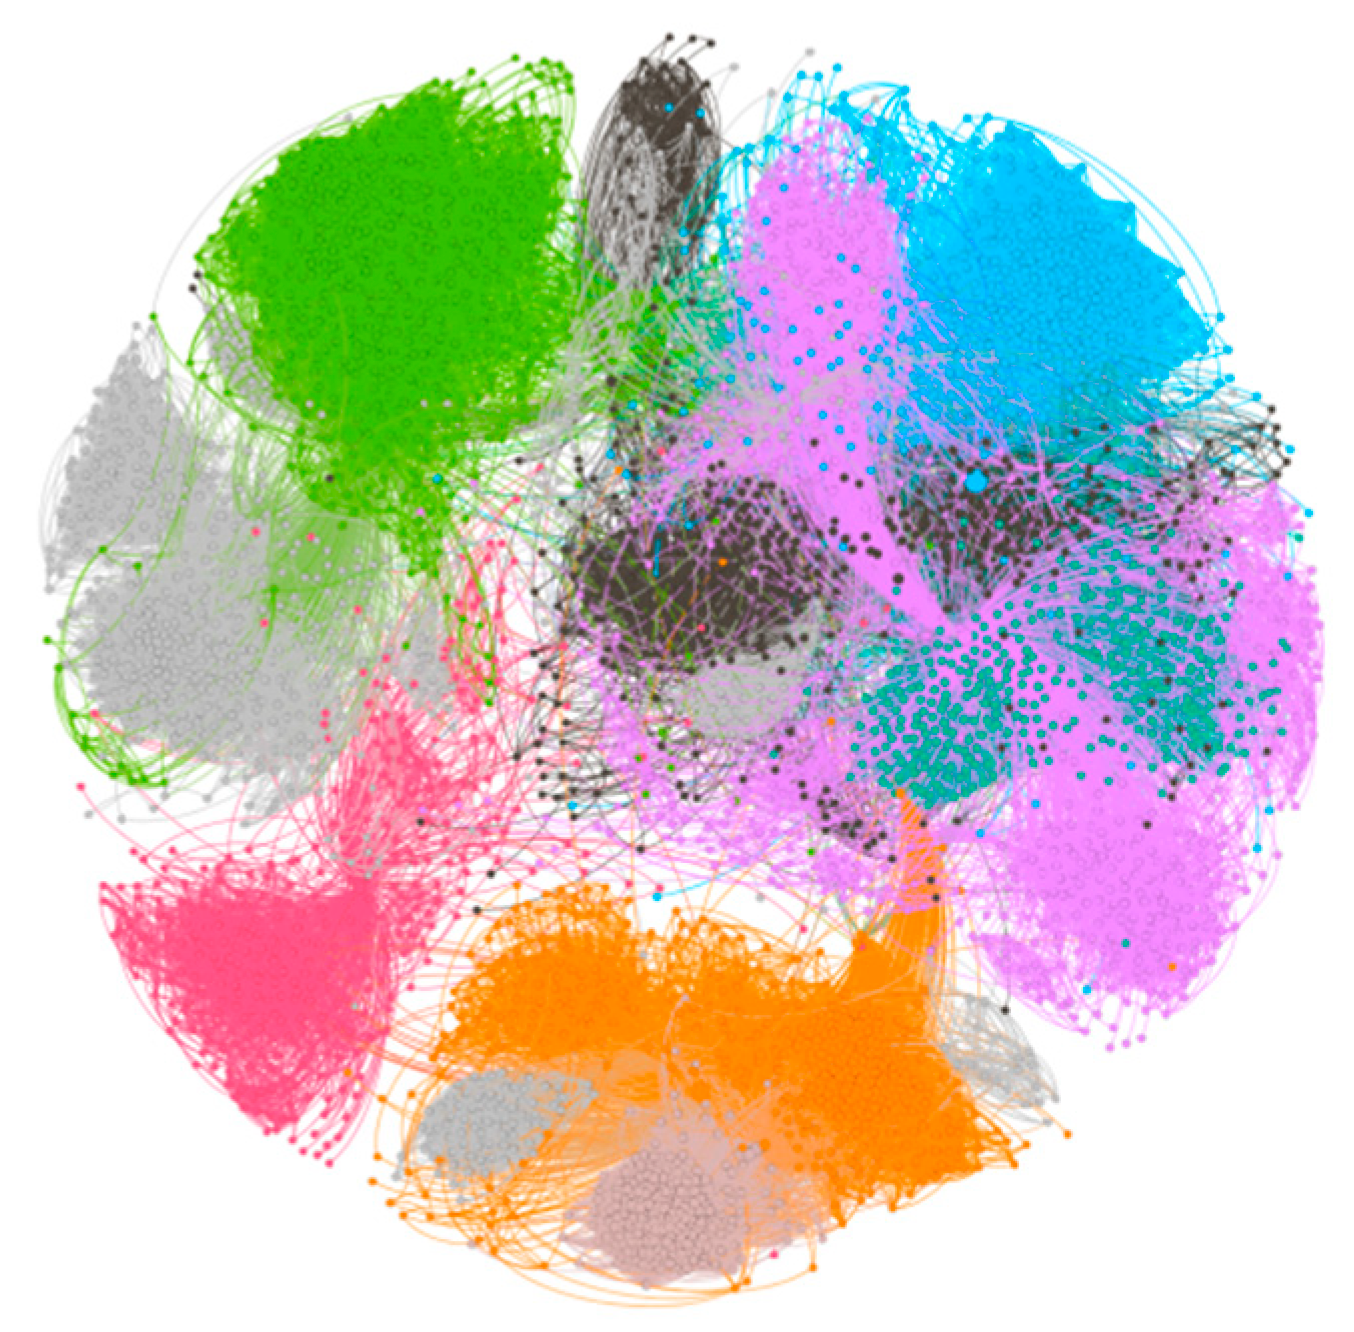
(4) The evolution of Conformity behavior on Facebook social network.
To verify the simulation results, we used a real-world social network dataset. The following Figure 9 shows the real-world social network on Facebook, whose dataset was collected from survey participants using the Facebook app and freely provided by the SNAP library of Stanford university. This dataset consists of ‘circles’ (or ‘friends lists’) from Facebook and includes node features (profiles), circles, and ego networks. The network consists of 4039 nodes and 88234 edges, the average clustering coefficient is 0.617, the average path length is 3.693, and the average degree is 43.691, which meet the characteristics of small-world network.
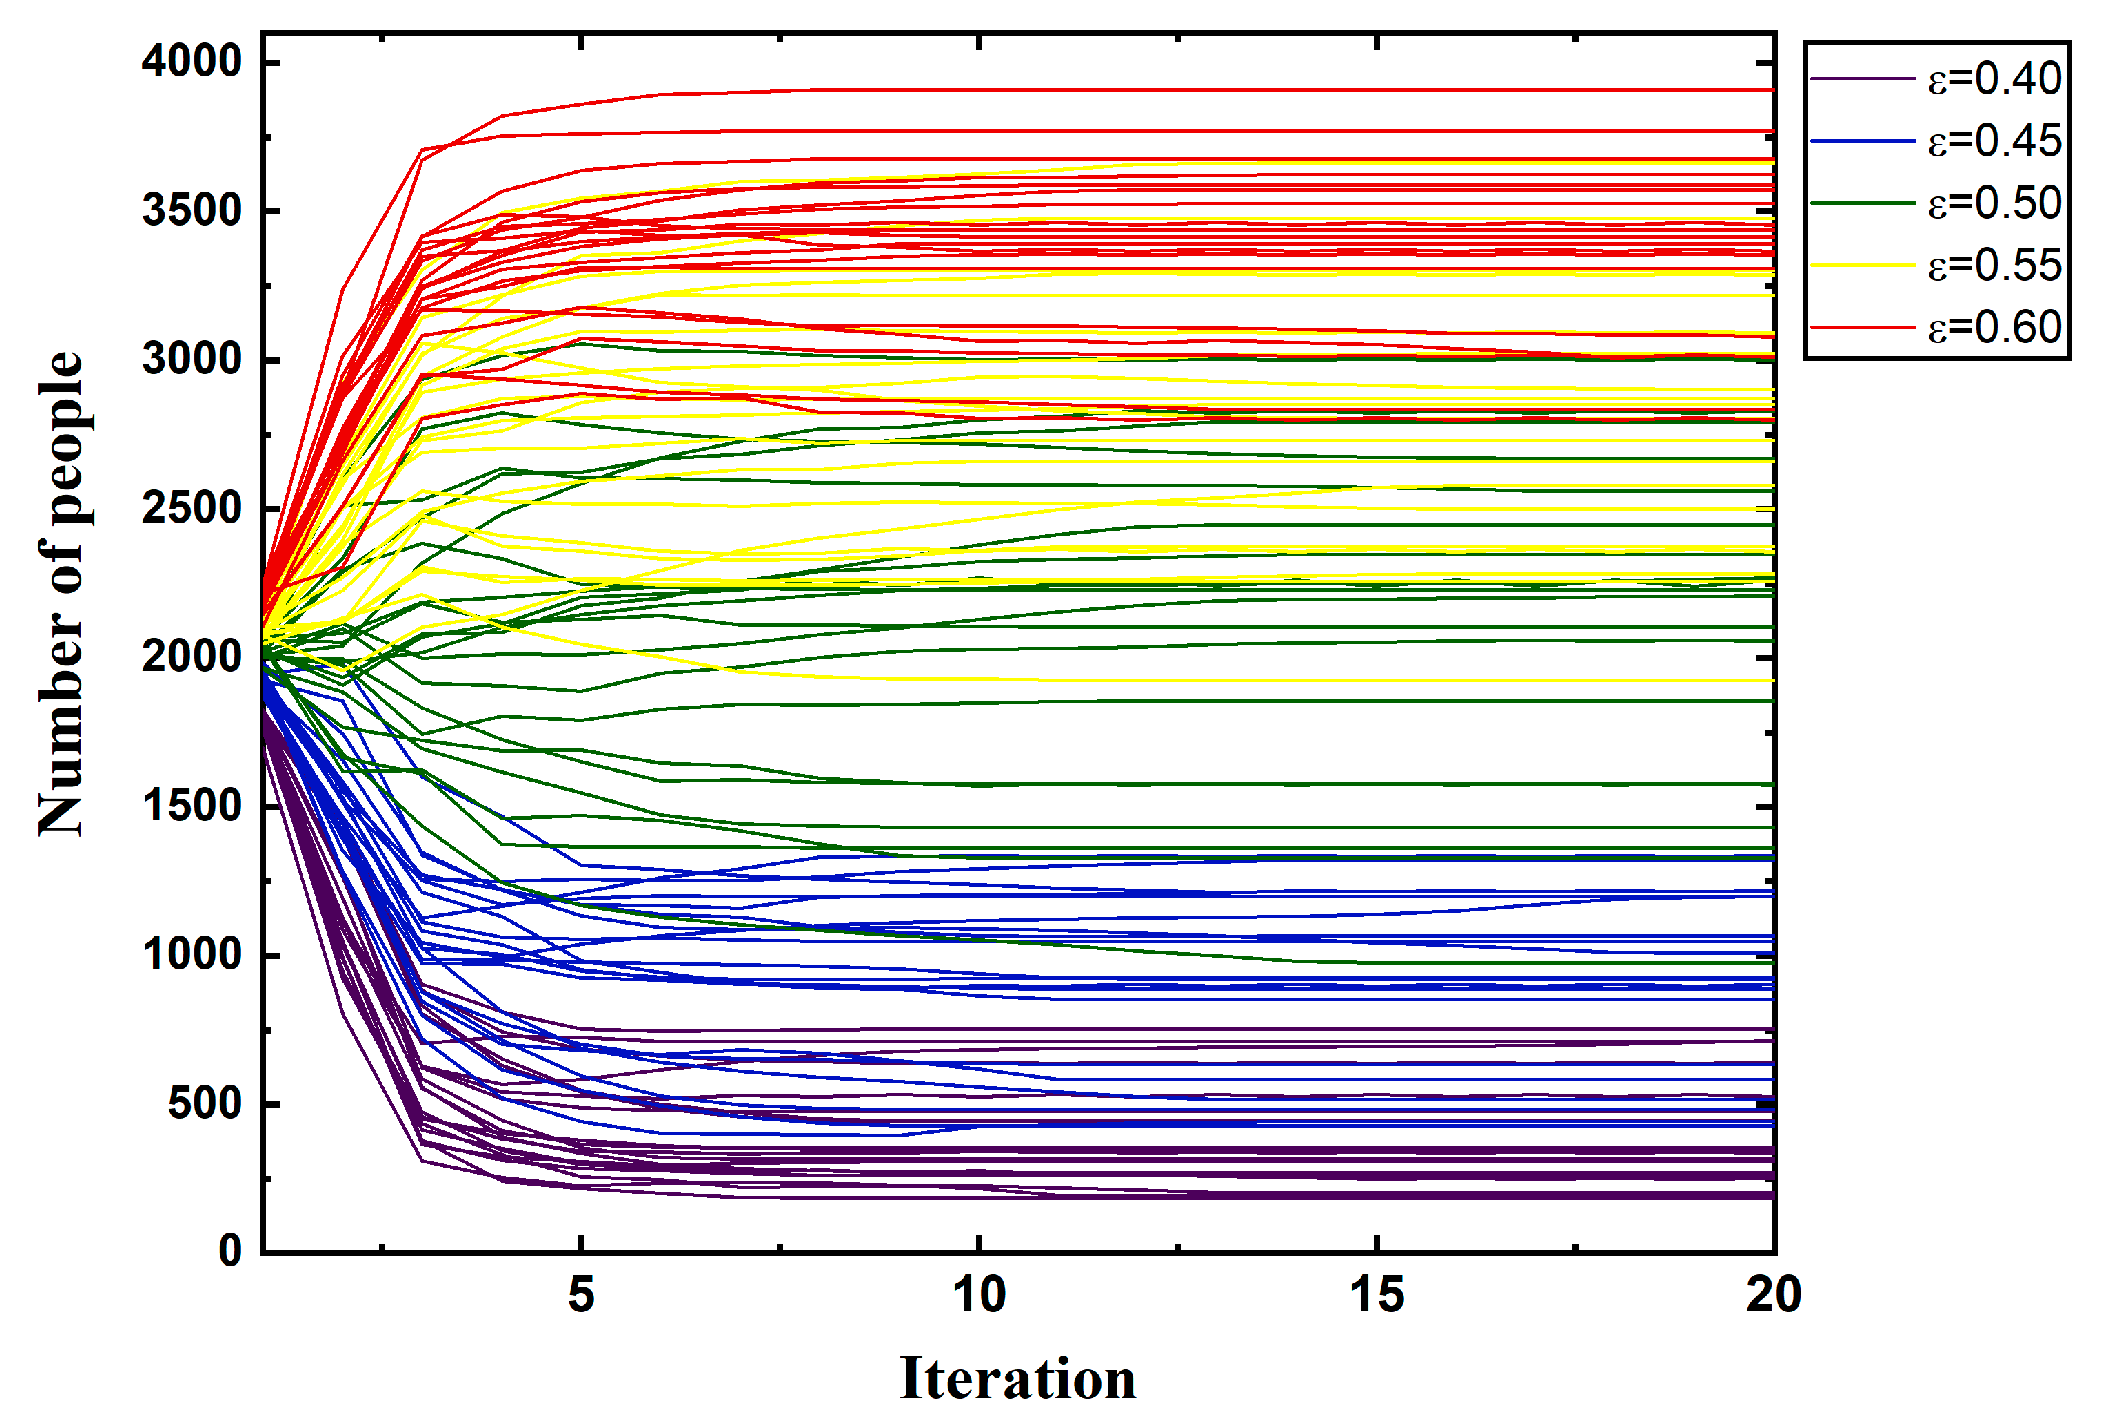
The experiments were carried out with the initial distribution as 0.4, 0.45, 0.5, 0.55, and 0.6, and each experiment was run 30 times. The experimental results (Figure 10) showed that the market will converge to the monopoly of a certain product which is dominant in the initial market. When the initial distribution is larger than 0.55 or less than 0.45, the market will converge to a monopoly state more quickly. When the initial distribution is around 0.5, the market will not to converge to a monopoly state in the overall network and will exhibit a chaotic state. These results are consistent with experiments carried out on simulation networks.
4. Conclusions
In this paper, we established the conformity model in networks where the customers in the market have strong conformity and are largely influenced by their neighborhood in social networks. We studied the influence of customer conformity in different structures of social networks, including ring network, random network, small-world network, and scale-free network.
When the network is a ring network, the market share will more likely converge to a monopoly state, and the firm with a higher market share will be able to gain more customers. However, conformity does not always lead to convergency as the network size increases. The reason may be that a customer might not be able to assert its influence on other buyers because of limited communication in the social network.
The simulations on random networks, small-world networks, and scale-free networks showed that the topology structure, network size, and initial market share will have significant effects on the evolution of customers’ conformity behaviors. Firstly, when the social network is a small network, the market will more likely converge into a monopoly market due to its shortest path and high agglomeration, and public opinion will be more powerful in the social network. However, in the scale-free network and random network, it is difficult to converge to a monopoly state in the overall network.
Secondly, the size of networks also plays an important role in determining conformity in social networks. As the scale of the network increases, there is a greater possibility of forming a dominant group of preferences in social networks. However, in scale-free networks, this is difficult to happen, and the network will exhibit a chaotic state. Furthermore, the initial market share will dramatically determine the final results. The market will converge to the monopoly of the product which has the initial selector in market.
Finally, the results also showed that the network density will has an effect on consumers’ conformity in social networks, especially in small-world networks, and the impact will be increasingly significant when the scale of the networks gradually becomes larger.
Author Contributions
Methodology, Q.Y.; Visualization, Y.G.; Writing—original draft preparation, Y.G.; Writing—review and editing, Q.Y.
Funding
This work was supported by the National Natural Science Foundation of China (No. 71774128).
Conflicts of Interest
The authors declare no conflict of interest.
References
- Berns, G.S. Price, placebo, and the brain. J. Mark. Res. 2005, 42, 399–400. [Google Scholar] [CrossRef]
- Jenness, A. Social influences in the change of opinion. J. Abnorm. Soc. Psychol. 1932, 27, 29–34. [Google Scholar] [CrossRef]
- Sherif, M. A study of some social factors in perception. Arch. Psychol. 1935, 187, 5–61. [Google Scholar]
- Asch, S.E. Studies of independence and conformity: I. A minority of one against a unanimous majority. Psychol. Monogr. 1956, 70, 1–70. [Google Scholar] [CrossRef]
- Bernheim, B.D. A Theory of conformity. J. Political Econ. 1994, 102, 841–877. [Google Scholar] [CrossRef]
- Kelman, H. Communing and relating. Am. J. Psychoanal. 1958, 18, 77–98. [Google Scholar] [CrossRef]
- Aronson, E.; Wilson, T.D.; Akert, R.M. Social Psychology: International Edition; Pearson Schweiz Ag: Zug, Switzerland, 2011. [Google Scholar]
- Krüger, T.; Szwabiński, J.; Weron, T. Conformity, anticonformity and polarization of opinions: Insights from a mathematical model of opinion dynamics. Entropy 2017, 19, 371. [Google Scholar] [CrossRef]
- Mehrabian, A.; Ksionzky, S. Models for affiliative and conformity behavior. Psychol. Bull. 1970, 74, 110–126. [Google Scholar] [CrossRef]
- Luce, R.D.; Fishburn, P.C. A note on deriving rank-dependent utility using additive joint receipts. J. Risk Uncertain. 1995, 11, 5–16. [Google Scholar] [CrossRef]
- Crutchfield, R.S. Conformity and character. Am. Psychol. 1955, 10, 191–198. [Google Scholar] [CrossRef]
- Reitan, H.T.; Shaw, M.E. Group membership, sex-composition of the group, and conformity behavior. J. Soc. Psychol. 1964, 64, 45–51. [Google Scholar] [CrossRef] [PubMed]
- Egebark, J.; Ekstrm, M. Liking what others “Like”: Using Facebook to identify determinants of conformity. Exp. Econ. 2018, 21, 793–814. [Google Scholar] [CrossRef]
- Zollman, K.J.S. Social structure and the effects of conformity. Synthese 2010, 172, 317–340. [Google Scholar] [CrossRef]
- Lascu, D.N.; Zinkhan, G. Consumer conformity: Review and applications for marketing theory and practice. J. Mark. Theory Pract. 1999, 7, 1–12. [Google Scholar] [CrossRef]
- Kuenzel, J.; Musters, P. Social interaction and low involvement products. J. Bus. Res. 2007, 60, 876–883. [Google Scholar] [CrossRef]
- Sharma, S.; Bikhchandani, S. Herd behavior in financial markets; A Review. IMF Work. Pap. 2000, 47, 279–310. [Google Scholar] [CrossRef]
- Deutsch, M.; Gerard, H.B. A study of normative and informational social influences upon individual judgment. J. Abnorm. Psychol. 1955, 51, 629–636. [Google Scholar] [CrossRef] [PubMed]
- Tanimoto, J. Fundamentals of Evolutionary Game Theory and Its Applications; Springer: Tokyo, Japan, 2015. [Google Scholar]
- Tanimoto, J. Evolutionary Games with Sociophysics: Analysis of Traffic Flow and Epidemics; Springer: Singapore, 2018. [Google Scholar]
- Wang, Z.; Kokubo, S.; Tanimoto, J.; Fukuda, E.; Shigaki, K. Insight into the so-called spatial reciprocity. Phys. Rev. E 2013, 88, 042145. [Google Scholar] [CrossRef] [PubMed]
- Szolnoki, A.; Perc, M. Conformity enhances network reciprocity in evolutionary social dilemmas. J. R. Soc. Interface 2014, 12, 20141299. [Google Scholar] [CrossRef] [PubMed]
- Yang, H.X.; Tian, L. Enhancement of cooperation through conformity-driven reproductive ability. Chaos Solitons Fractals 2017, 103, 159–162. [Google Scholar] [CrossRef] [Green Version]
- Niu, Z.; Xu, J.; Dai, D.; Liang, T.; Mao, D.; Zhao, D. Rational conformity behavior can promote cooperation in the prisoner’s dilemma game. Chaos Solitons Fractals 2018, 112, 92–96. [Google Scholar] [CrossRef]
- Kabir, K.A.; Tanimoto, J.; Wang, Z. Influence of bolstering network reciprocity in the evolutionary spatial prisoner’s dilemma game: A perspective. Eur. Phys. J. B 2018, 91, 312. [Google Scholar] [CrossRef]
- Corazzini, L.; Greiner, B. Herding, social preferences and (non-)conformity. Econ. Lett. 2007, 97, 76–80. [Google Scholar] [CrossRef]
- Park, K.H.; Yoo, H.S. Effects of appearance interest and demographic characteristics on clothing conformity. Fash. Text. Res. J. 2013, 15, 210–218. [Google Scholar] [CrossRef]
- Wermers, R. Mutual fund herding and the impact on stock prices. J. Financ. 1999, 54, 581–622. [Google Scholar] [CrossRef]
- Erdös, P.; Rényi, A. Some problems and results on consecutive primes. Simon Stevin 1950, 27, 115–125. [Google Scholar]
- Watts, D.J.; Strogatz, S.H. Collective dynamics of ‘small-world’ networks. Nature 1998, 393, 440–442. [Google Scholar] [CrossRef] [PubMed]
- Barabasi, A.L.; Albert, R. Emergence of scaling in random networks. Scinece 1999, 286, 509–512. [Google Scholar]
- Zanette, D.H. Critical behavior of propagation on small-world networks. Phys. Rev. E Stat. Nonlinear Soft Matter Phys. 2001, 64, 050901. [Google Scholar] [CrossRef] [PubMed]
- Moreno, Y.; Nekovee, M.; Pacheco, A.F. Dynamics of rumor spreading in complex networks. Phys. Rev. E Stat. Nonlinear Soft Matter Phys. 2004, 69, 066130. [Google Scholar] [CrossRef] [PubMed]
- Nekovee, M.; Moreno, Y.; Bianconi, G.; Marsili, M. Theory of rumour spreading in complex social networks. Phys. A Stat. Mech. Its Appl. 2008, 374, 457–470. [Google Scholar] [CrossRef]
- Zhang, J.; Tang, J.; Zhuang, H.; Leung, C.W.; Li, J. Role-aware conformity influence modeling and analysis in social networks. In Proceedings of the Twenty-Eighth AAAI Conference on Artificial Intelligence, Québec City, QC, Canada, 27–31 July 2014; AAAI Press: Palo Alto, CA, USA, 2014. [Google Scholar]
- Li, M.; Wang, X.; Gao, K.; Zhang, S. A survey on information diffusion in online social networks: Models and methods. Information 2017, 8, 118. [Google Scholar]
- Martinčić-Ipšić, S.; Močibob, E.; Perc, M. Link prediction on Twitter. PLoS ONE 2017, 12, e0181079. [Google Scholar] [CrossRef] [PubMed]
- Carrera, B.; Jung, J.-Y. SentiFlow: An information diffusion process discovery based on topic and sentiment from online social networks. Sustainability 2018, 10, 2731. [Google Scholar] [CrossRef]
- Chalip, L.; Green, B.C. Establishing and maintaining a modified youth sport program: Lessons from Hotelling’s location game. Sociol. Sport J. 1998, 15, 326–342. [Google Scholar] [CrossRef]
Figure 1.
A sample market on a ring network.

Figure 2.
Conformity effect on customer’s choices in the ring network.

Figure 3.
Switch loop of customer’s choices affected by conformity.

Figure 4.
function decreases as increases. with higher converges more quickly to 0.

Figure 5.
function decreases as increases. with higher converges more quickly to 0.

Figure 6.
Evolution of market share with effect of conformity on networks having different structures and sizes.
Figure 6.
Evolution of market share with effect of conformity on networks having different structures and sizes.

Figure 7.
Evolution of market share with effect of conformity on small-world networks having different average degrees and sizes.
Figure 7.
Evolution of market share with effect of conformity on small-world networks having different average degrees and sizes.

Figure 8.
Monotonicity of in different networks and with different .

Figure 9.
Image of the social network on Facebook.

Figure 10.
Evolution of market dynamics on Facebook social networks with different .

© 2019 by the authors. Licensee MDPI, Basel, Switzerland. This article is an open access article distributed under the terms and conditions of the Creative Commons Attribution (CC BY) license (http://creativecommons.org/licenses/by/4.0/).
Share and Cite
MDPI and ACS Style
Gong, Y.; Yu, Q. Evolution of Conformity Dynamics in Complex Social Networks. Symmetry 2019, 11, 299. https://0-doi-org.brum.beds.ac.uk/10.3390/sym11030299
AMA Style
Gong Y, Yu Q. Evolution of Conformity Dynamics in Complex Social Networks. Symmetry. 2019; 11(3):299. https://0-doi-org.brum.beds.ac.uk/10.3390/sym11030299
Chicago/Turabian StyleGong, Yuhui, and Qian Yu. 2019. "Evolution of Conformity Dynamics in Complex Social Networks" Symmetry 11, no. 3: 299. https://0-doi-org.brum.beds.ac.uk/10.3390/sym11030299
Note that from the first issue of 2016, this journal uses article numbers instead of page numbers. See further details here.