A New DEA Model for Evaluation of Supply Chains: A Case of Selection and Evaluation of Environmental Efficiency of Suppliers


Faculty of Maritime Studies and Transport, University of Ljubljana, 6320 Portoroz, Slovenia
*
Author to whom correspondence should be addressed.
Symmetry 2019, 11(4), 565; https://0-doi-org.brum.beds.ac.uk/10.3390/sym11040565
Submission received: 31 March 2019
/
Revised: 10 April 2019
/
Accepted: 15 April 2019
/
Published: 18 April 2019
(This article belongs to the Special Issue Multi-Criteria Decision-Making Techniques for Improvement Sustainability Engineering Processes)
Abstract
:Supply Chain Management (SCM) represents an example of a complex multi-stage system. The SCM involves and connects different activities, from customer’s orders to received services, all with the aim of satisfying customers. The evaluation of a particular SCM is a complex problem because of the internally linked hierarchical activities and multiple entities. In this paper, the introduction of a non-radial DEA (Data Envelopment Analysis) model for the evaluation of different components of SCM, primarily in terms of sustainability, is the main contribution. However, in order to confirm the novelty and benefits of this new model in the field of SCM, a literature review of past applications of DEA-based models and methods are also presented. The non-radial DEA model was applied for the selection and evaluation of the environmental efficiency of suppliers considering undesirable inputs and outputs resulting in a better ranking of suppliers. Via perturbation of the data used, behavior, as well as the benefits and weaknesses of the introduced model are presented through sensitivity analysis.
1. Introduction
A prerequisite for providing products and services of high quality at the lowest cost is the effective management of the supply chain (SCM) [1].
The efficiency of the supply chain (SC) is significantly dependent on the coordination both across firms and within firms because each part can influence the SC. When any of the parts lack co-ordination, dramatic effects on the SC can result [2]. Therefore, measuring and monitoring the efficiency of the SC represents one of the most important steps towards its improvement. The DEA method is one of the most often used multi-criteria decision making (MCDM) methods for SC efficiency evaluation. This is why the model used in this paper is based on it.
The DEA method originated from the work of Charnes et al. [3], originally applied in the evaluation of relative efficiency of similar units when there are multiple inputs and outputs. It is one of the most effective approaches in measuring the efficiency of a SC and its components [4]. After the first application of the DEA in the field of SCM, in the literature, various approaches were presented [4]. The main reason for modifications of the DEA lies in the fact that the traditional DEA models cannot be directly employed in the SC evaluation because they consider only inputs and outputs. However, they must be modified in order to be able to include the intermediate products. Moreover, in real applications within the production process, undesirable (bad) outputs can be produced. A good example of such results, pointed out by Mahdiloo et al. [5], are suppliers’ carbon emissions. Mahdiloo et al. [5] highlighted that different DEA approaches that consider the undesirable outputs, primarily for the evaluation of the green or sustainable SCM, have been developed and are presented in the literature. However, a DEA model that, besides undesirable outputs, can evaluate efficiency using some undesirable inputs is missing.
Because of the importance and complexity of the SC, as well as the possibility to include undesirable inputs and outputs for the evaluation of different parts of the SC, the aim of this paper is to contribute to the existing literature through the introduction of a non-radial DEA model for efficiency evaluation either of different components of SCM or the whole of SCM. Consequently, the main contribution of the paper is reflected in the introduction of a new DEA model for evaluation of SCM that considers also undesirable outputs. The benefit of the introduced model is related to the possibility of consideration of undesirable inputs as well as outputs simultaneously. With such a model, the evaluation of SCM or their components in terms of sustainability would be possible. In order to check and confirm the novelty of the proposed DEA model, a comprehensive literature review of past applications of the DEA method in SCM and particular areas of SCM is presented. The applicability of the introduced model is presented through the selection and evaluation of the environmental efficiency of suppliers using data taken from Mahdiloo et al. [5]. No matter whether the data were reused from an existing study, the aim was to provide an overview of the behavior of the proposed model and compare it with other models using the same data as Mahdiloo et al. [5]. Because the data were reused from an existing study, testing of data before applying the DEA model was not performed.
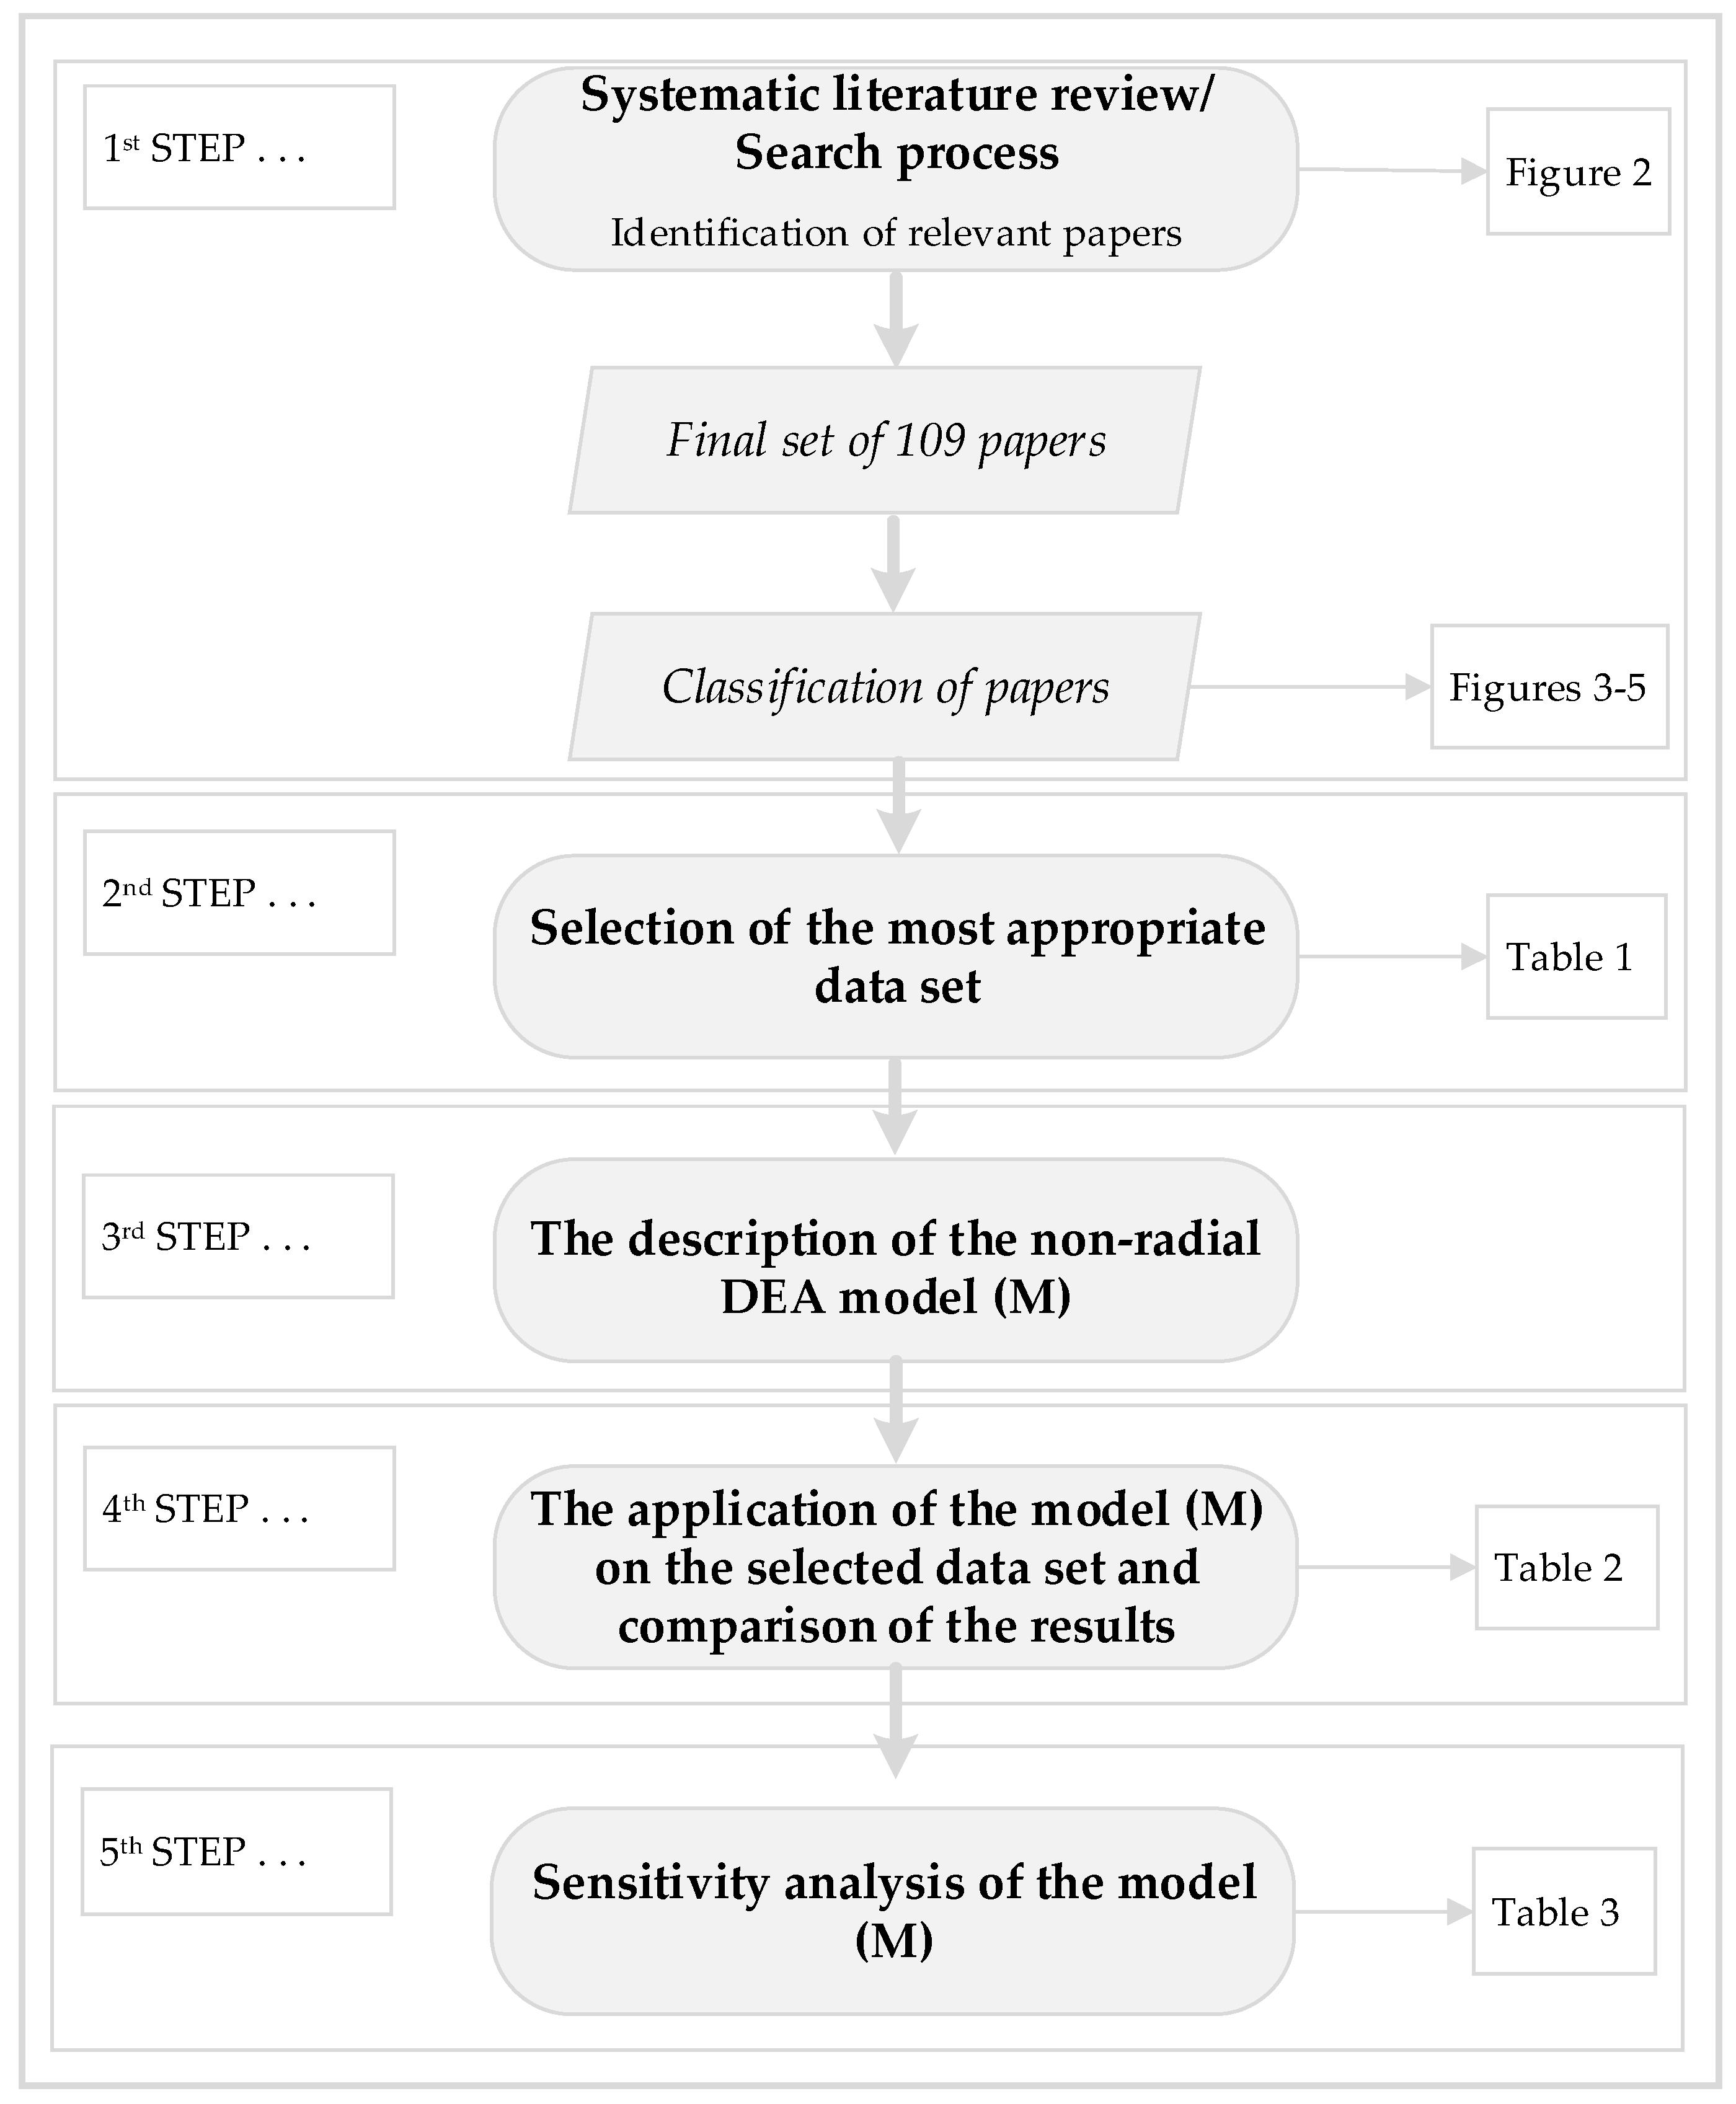
With the aim to present the novelty of this paper and to better describe the process of the introduction of our model in the SC efficiency evaluation, a sequence of steps, represented in Figure 1, were performed: (1) systematic literature research; (2) selection of the paper with the most appropriate data set used; (3) the description of the non-radial DEA model itself; (4) the application of the non-radial DEA model using the selected set of data and comparison of the results; and (5) sensitivity analysis of the proposed model.
The following section describes the methodology of the literature review. Section 3 presents the results of the literature review together with the classification of papers according to particular evaluated areas of SCM. Section 4 presents the basics of the non-radial DEA model and its introduction for the evaluation of particular areas of SCM. Within Section 5, the results of the proposed model and sensitivity analysis of the model are presented. Section 6 discusses the methodology and obtained results. Finally, in Section 7, we offer our conclusions, summarizing the literature review, presenting the model, and suggesting future research.
2. Previous Research
With the aim of confirmation of the novelty of the introduced non-radial DEA model, an overview of papers related to the application of the DEA method to SCM was performed. During the review, the only paper that reviews the application of DEA in SCM found was that of Soheilirad et al. [4], but it only presents a review of literature published until 2016.
Methodology of Literature Review
The methodology of the literature review has been taken from papers written by Krmac and Djorjević [6] and Djordjević et al. [7]. Accordingly, the literature review was conducted through fundamental guidelines of the systematic literature review. Since ScienceDirect and Scopus represent the two most important (and largest) scientific databases [6], a review of papers published in peer-reviewed journals without limitation on the time period of publishing was performed. However, in order to avoid bias regarding the top journals or the most cited ones, the literature review based on meta-analysis was not conducted.
The review of open-access studies focused on titles, abstracts, and keywords for English-written full-text free-available scientific journal papers, and was performed in December 2018.
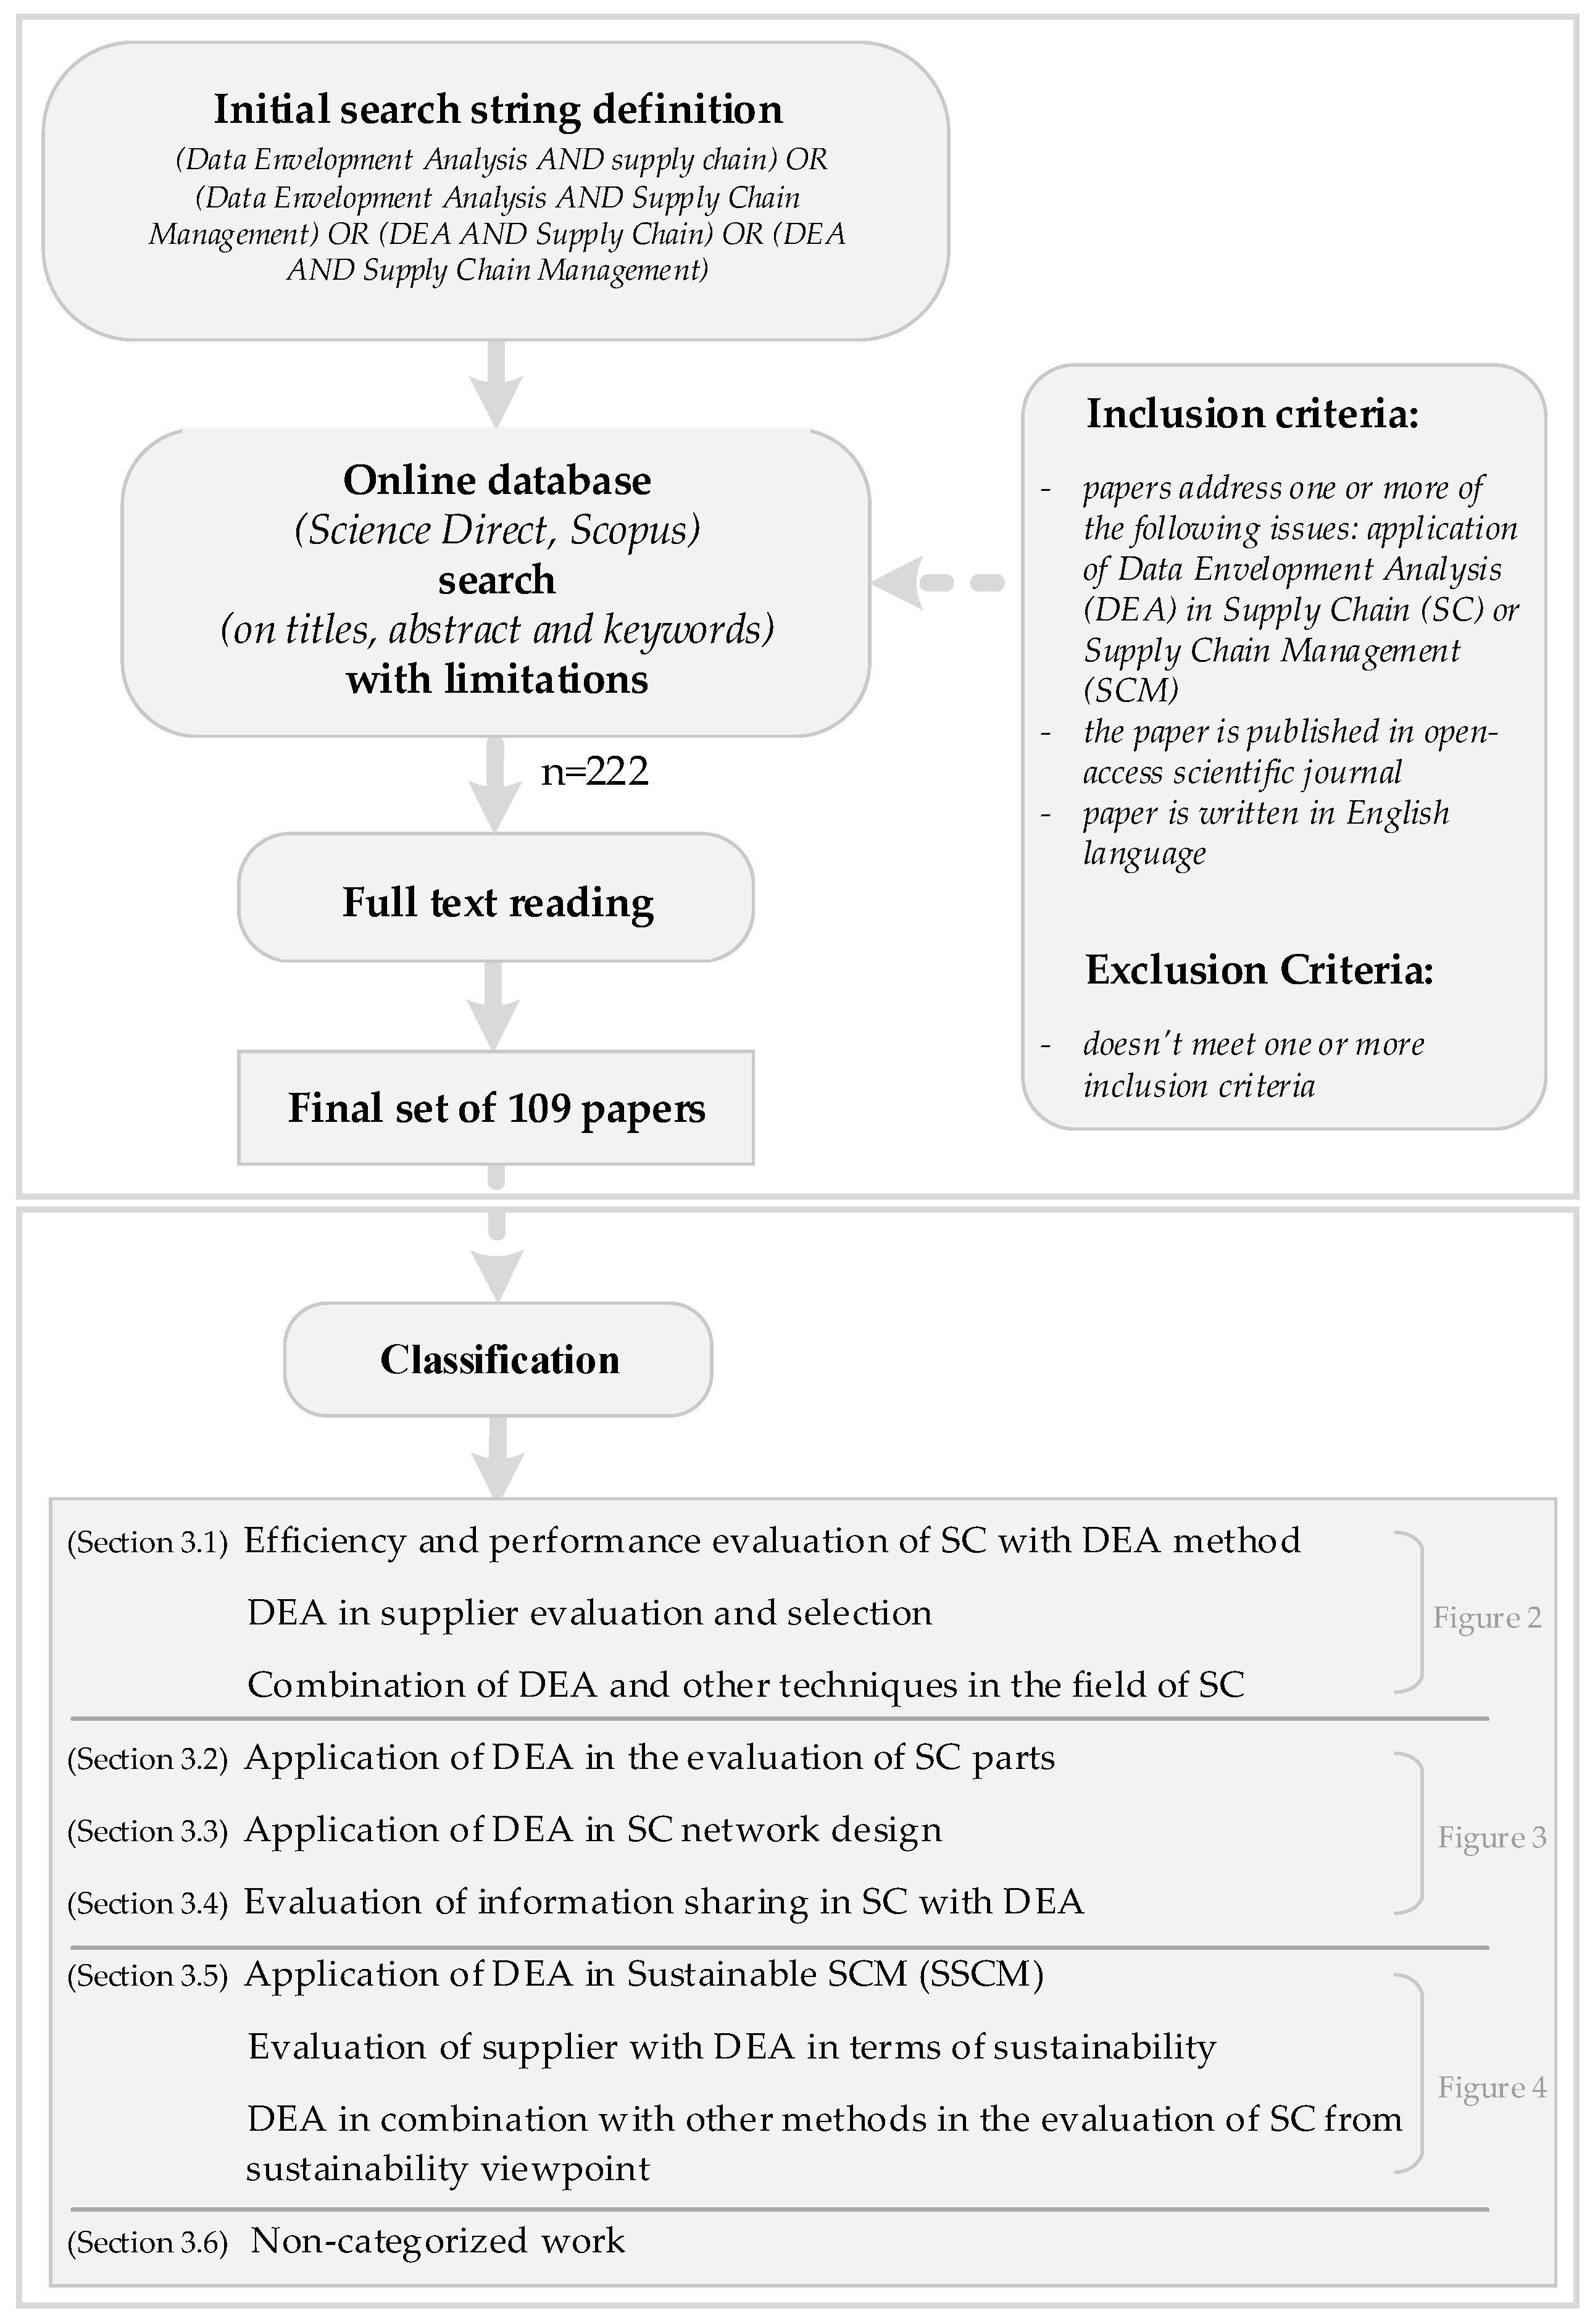
The search of databases using keywords such as “Data Envelopment Analysis AND Supply Chain”, “Data Envelopment Analysis AND Supply Chain Management”, and the variations of both search strings where the abbreviations DEA, SC, and SCM were used, was performed in both databases. Papers that presented an application of the DEA in the SCM field were taken over by first reading the title, keywords, and abstracts. After the initial reading, 222 papers were extracted. Further, after the full-text reading of extracted papers, 109 were selected and considered relevant. Based on the review, the selected papers were classified into main areas such as the evaluation of the SC, the evaluation and the selection of suppliers, as well as the consideration of the SC and the evaluation of suppliers in terms of sustainability. Also, for each of these categories, the application of DEA in combination with other methods was presented. However, those papers that used the DEA method for analyzing more than one aspect or where the DEA was combined with another method or methods were classified as non-categorized. The overall search process is shown in Figure 2.
3. Results of the Literature Review and Classification
In the literature, numerous papers that applied the DEA method in the area of SCM were found. Within this paper, they were classified according to the purpose of the application of DEA and the combinations of DEA with other techniques or approaches. Papers that did not fall into any of the defined categories were classified as “non-categorized works”. The overall search process is shown in Figure 2.
3.1. Efficiency and Performance Evaluation of SC with the DEA Method
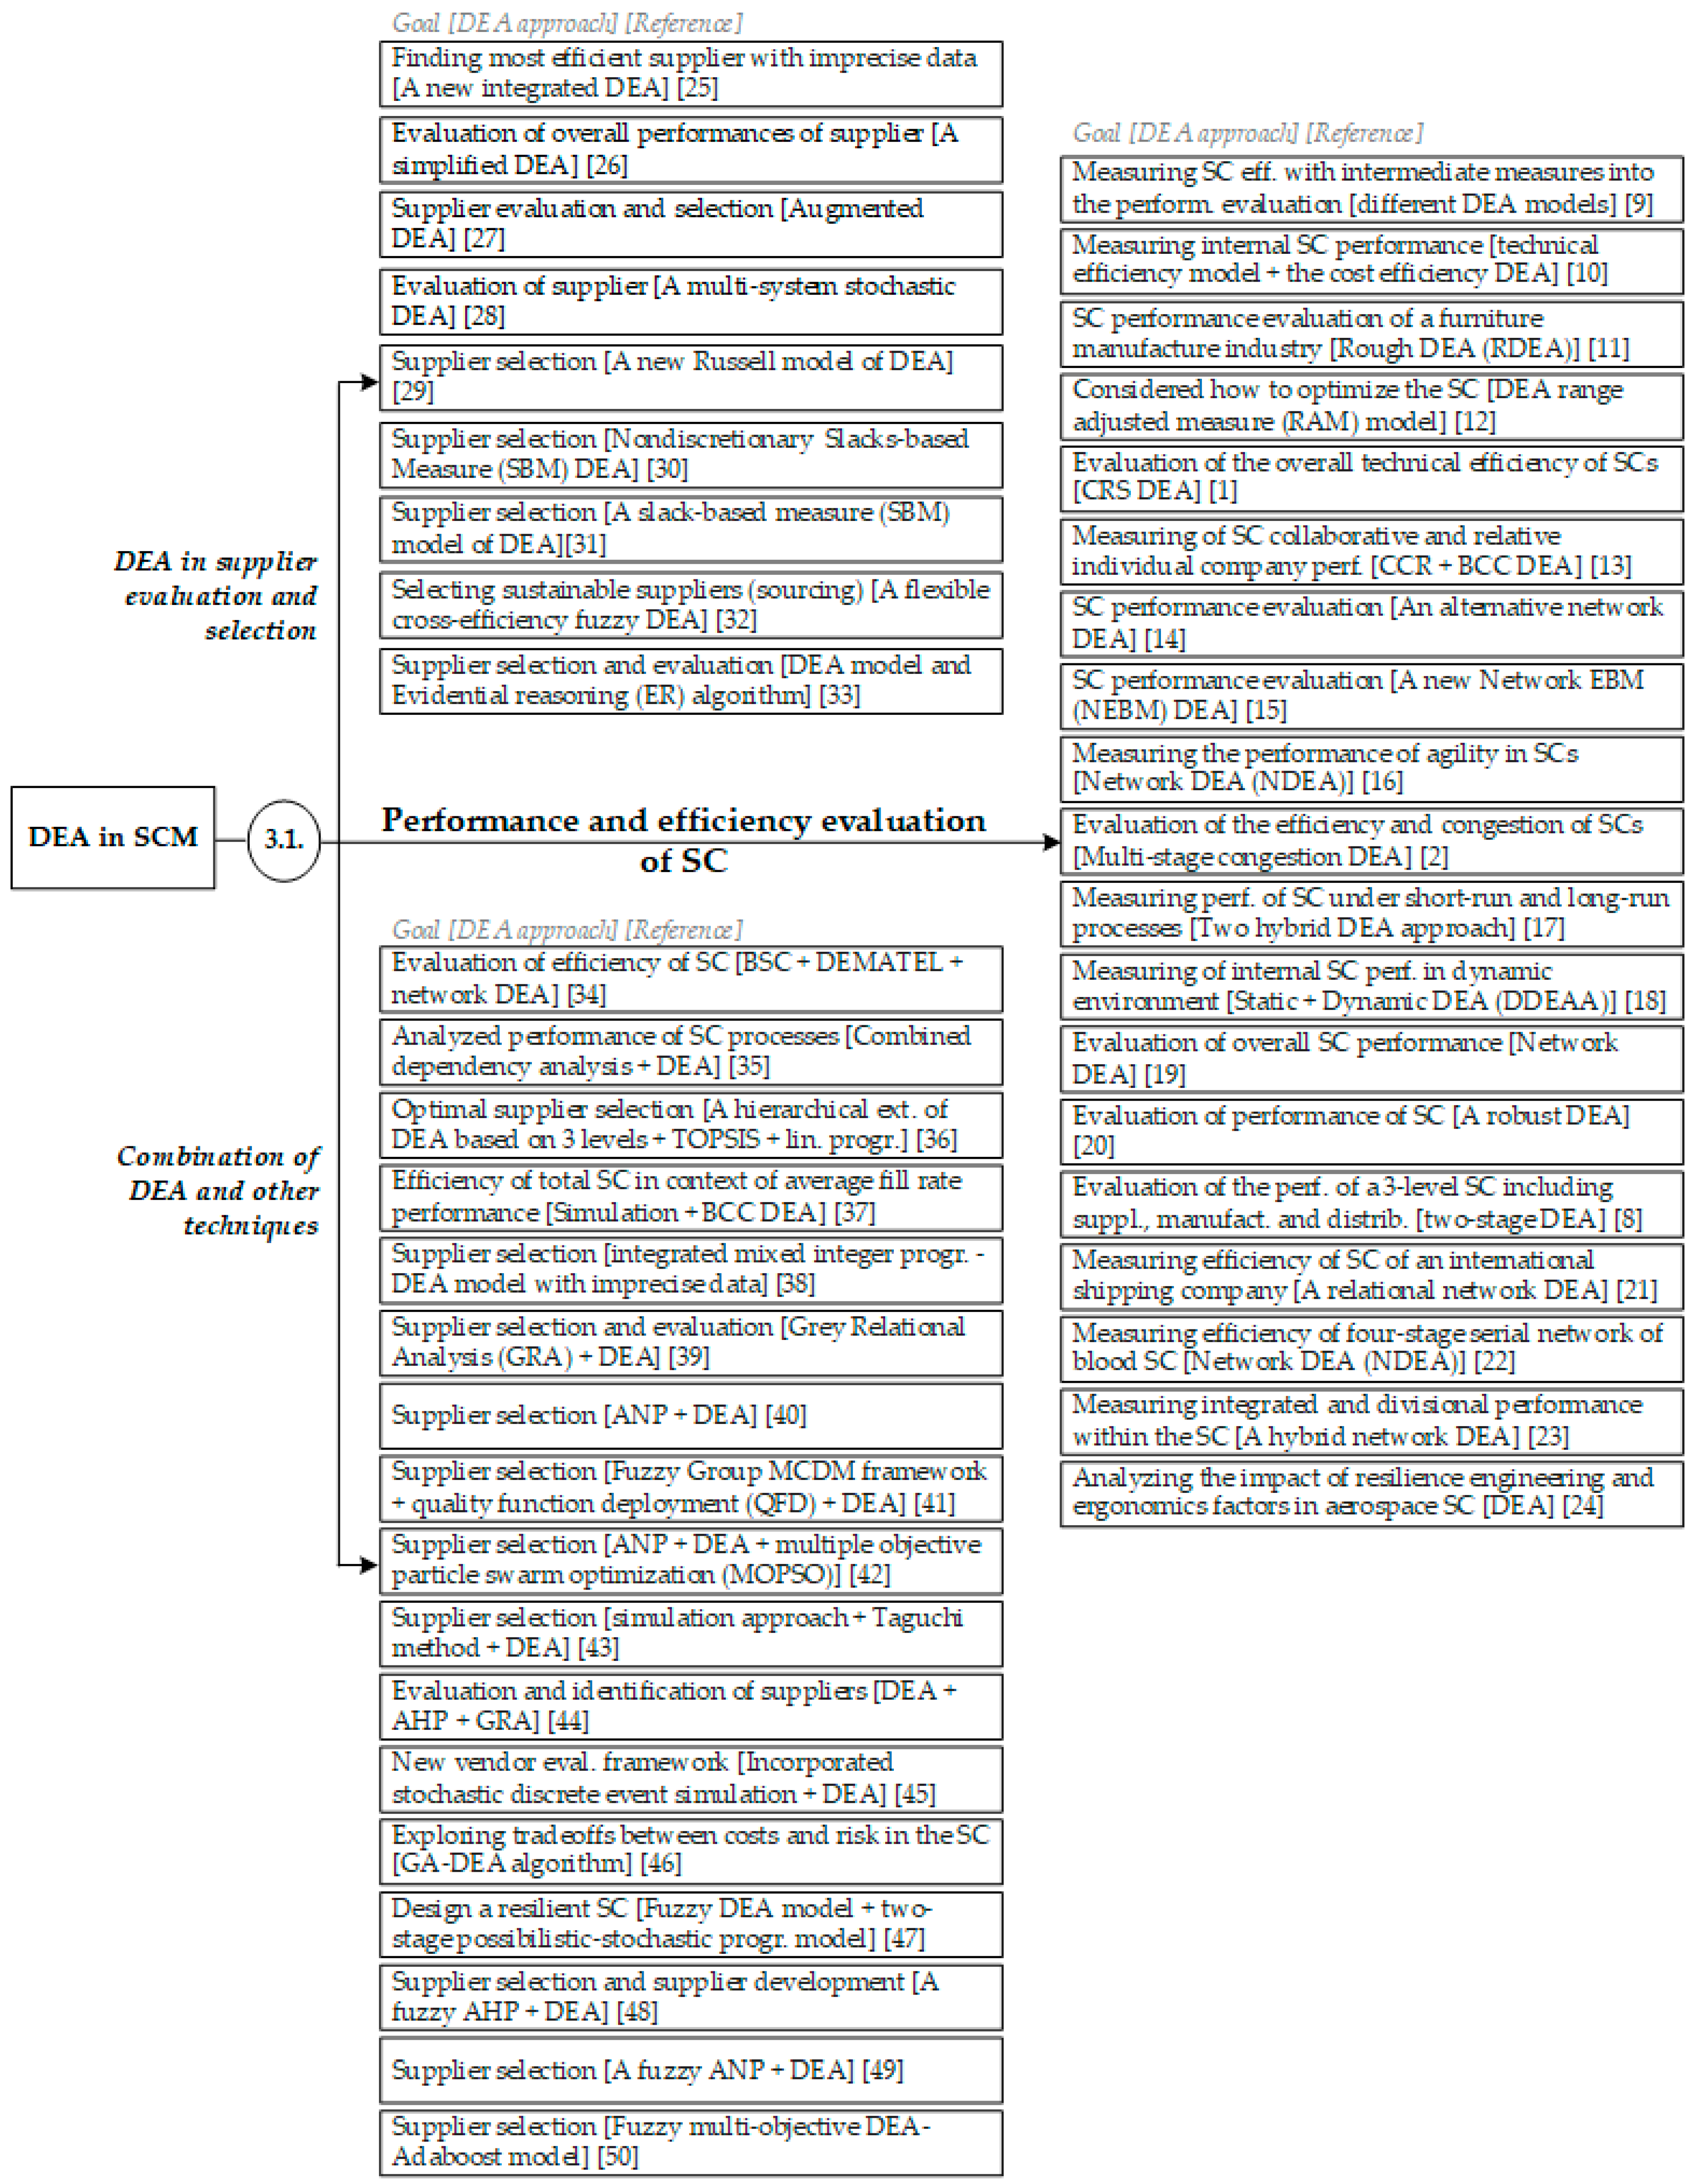
For the evaluation of SC performances, the DEA method has been extensively employed. Previously, with the DEA method, only the initial inputs and final outputs to measure the efficiency of SCs were used, while intermediate products were ignored. However, the application of the DEA method for measuring the efficiency of the entire SC and all its components at all levels was recognized in ref. [8]. The application of DEA for performance and efficiency evaluation of SCs is summarized in Figure 3.
The description of each paper was given true to the short description of the goal followed by a DEA approach in the first square brackets and the reference in the second one. Because the state of SC functioning can be to a large degree linked with the selection of the best suppliers, the papers considering the methods, models and approaches of supplier evaluation and selection were separately classified under the label “DEA in supplier evaluation and selection”. Over the years, several techniques such as Analytic Hierarchical Process (AHP), Analytic Network Process (ANP), Linear Programming (LP), Mathematical Programming, Multi-objective Programming, and DEA have been developed to solve the problem efficiently [25]. The papers that considered the evaluation of suppliers using the DEA technique can be also seen in Figure 3.
In order to improve some characteristics of the DEA in the evaluation of SCs and their parts, DEA was also used in combination with other methods. Shafiee et al. [34] created a network DEA for the evaluation of efficiency with a balanced scorecard (BSC) approach where the DEMATEL approach was employed to obtain a network structure of four perspectives of BSC. Many other combinations for the purpose of evaluation of the SC and its different parts were also used in the literature, and they are summarized in Figure 3 as well under the label “Combination of DEA and other techniques”.
3.2. Application of DEA in the Evaluation of SC Parts
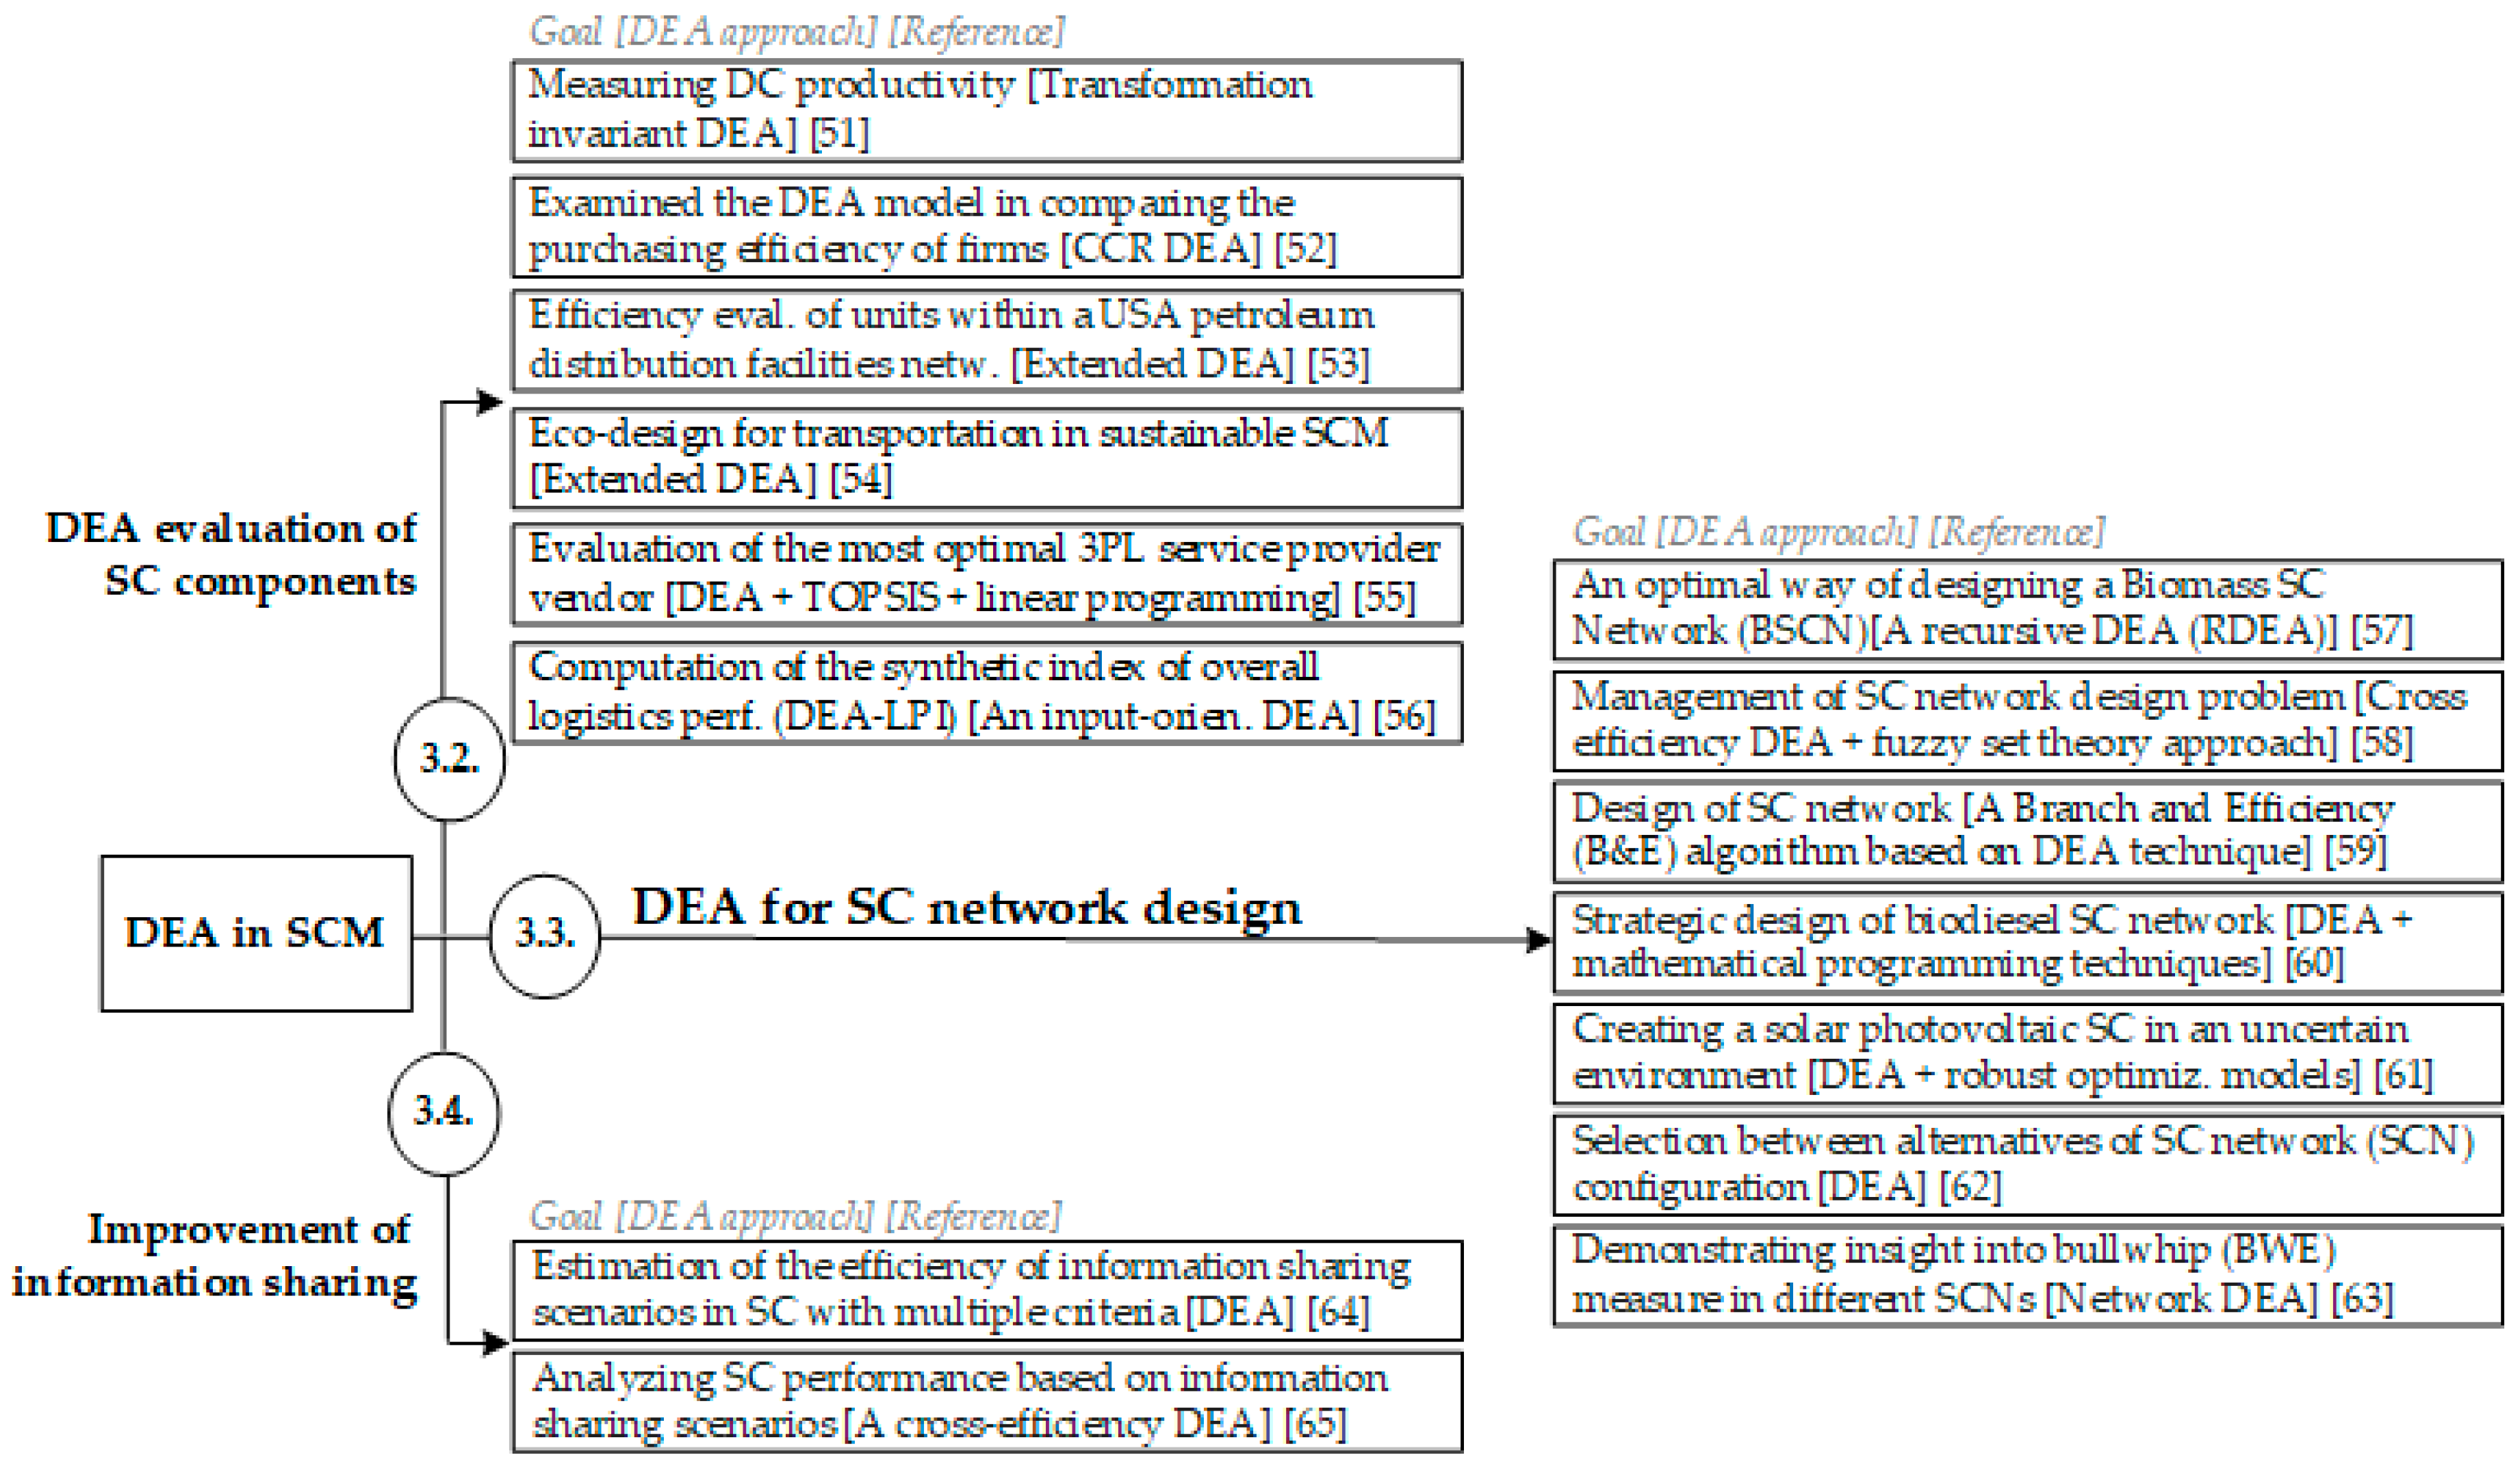
Papers that applied the DEA method in order to evaluate parts or components of SCs are presented in Figure 4 under the label “DEA evaluation of SC components”.
3.3. Application of DEA in SC Network Design
One of the areas of the SC where the DEA method was applied is the problem of SC network design or selection of optimal network solutions. The group of papers that considers the application of DEA in the SC network field is presented in Figure 4 under the label “DEA for SC network design”.
3.4. Evaluation of Information Sharing in SC with DEA
After the previous decade with developed information technology, every firm can now improve its SC strategies with the aim to improve their performance of SCM through well-organized information sharing. In the literature, there are studies like papers written by Chen et al. [64] and Yu et al. [65], that considered the effects of information sharing on the efficiency of SCs (see Figure 4).
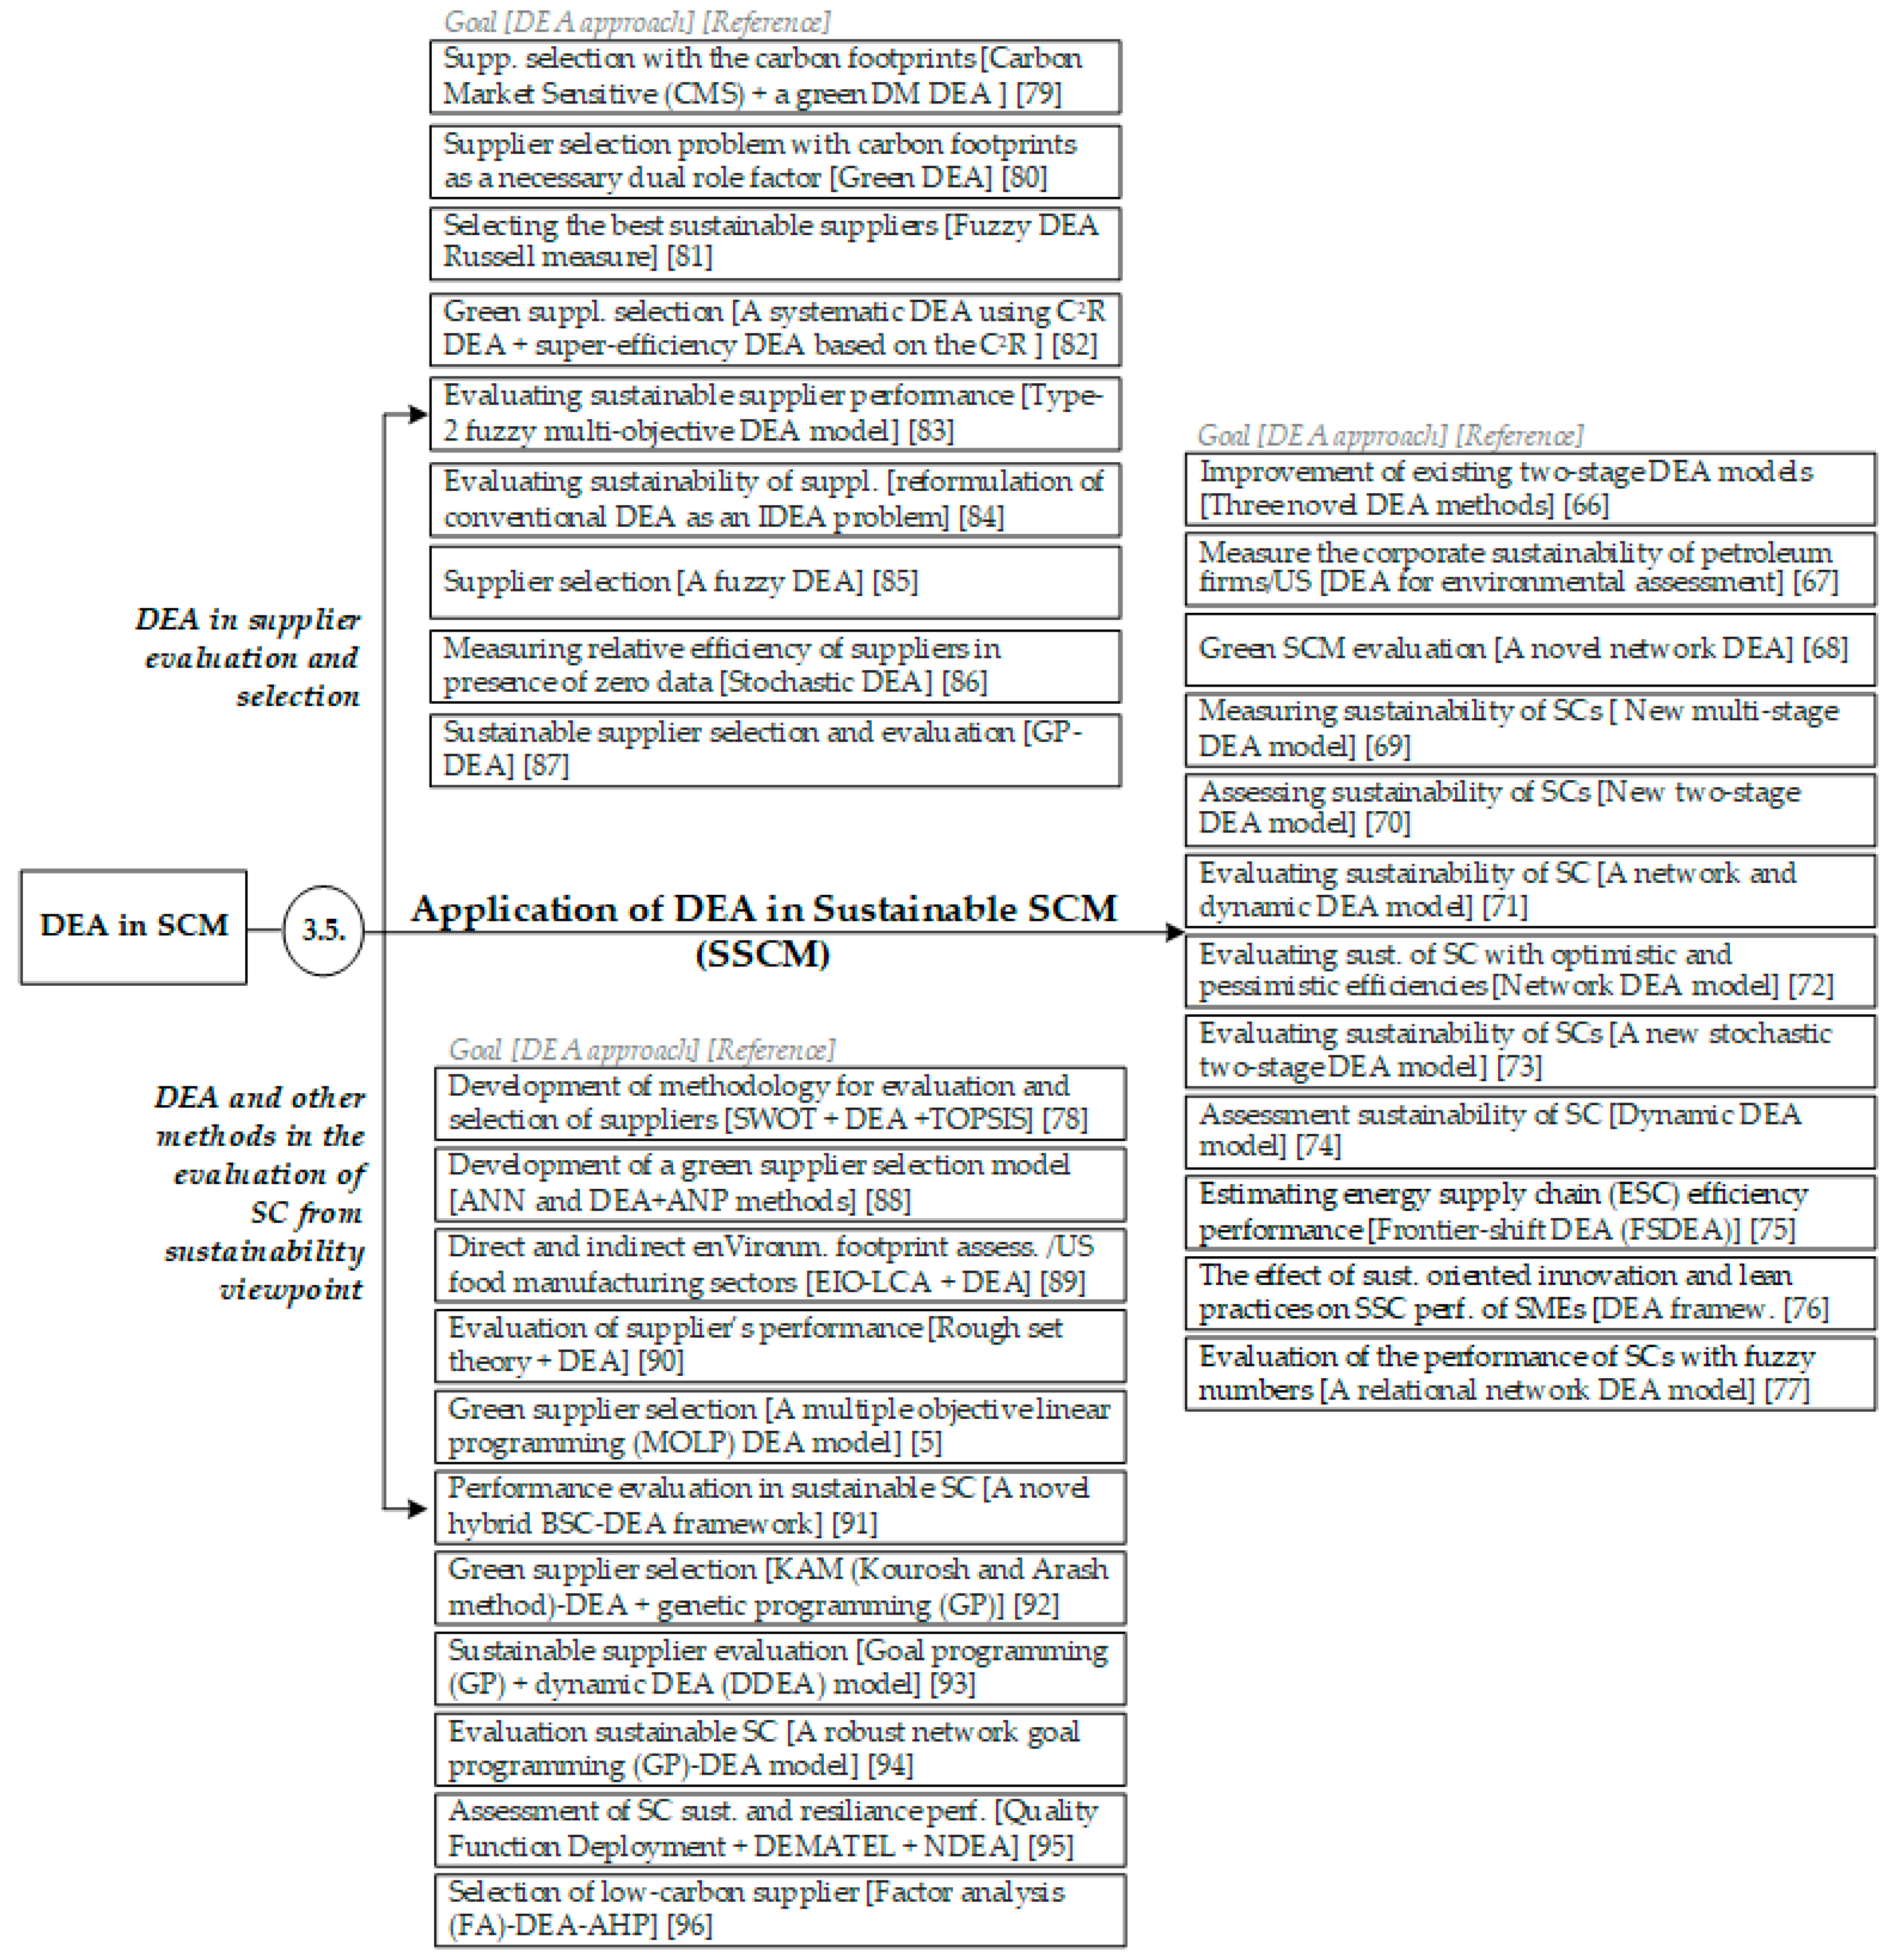
3.5. Application of DEA in Sustainable SCM
Recently, in the literature, a lot of papers can be found regarding sustainable SCM (SSCM). Papers that considered SSCM with DEA are summarized in Figure 5.
SSCM is focused on the improvement of economic, social, and environmental performances at the same time. Therefore, sustainable SCM evaluation has become a significant task for each organization. As one of the methods, DEA was recognized as suitable for the evaluation of sustainable SCM [67].
According to ref. [79], in order to develop effective SC, supplier evaluation and selection plays an important role. Within the developed approaches for supplier selection, the main goal was the reduction of SC costs, while environmental criteria were neglected. Nevertheless, the developed environmental criteria should include the comprehensive carbon footprint in the supplier’s selection approaches i.e., consideration of the environmental impact of suppliers. Therefore, the authors of ref. [80] proposed an integrated buyer initiated approach for supplier selection that considers two objectives: cost cutting and environmental efficiency. Other DEA approaches in evaluating the sustainability of suppliers are presented in Figure 5 under the label “DEA in supplier evaluation and selection”.
With the aim of improving previously used methods, Chen [78] introduced a structured methodology for supplier selection and evaluation based on supply chain integration architecture. Besides this paper, other papers that combine DEA with additional techniques for analysis of different areas of SCs in terms of sustainability can be found in the literature. They are presented in Figure 5 and group under the label “DEA and other methods in the evaluation of SC from a sustainability viewpoint”.
3.6. Non-Categorized Works
In order to provide a hybrid method for supplier selection, Sevkli et al. [97] used the DEAHP method—the DEA method embedded into AHP methodology—because DEA still lacks a real application case, in which its implications can be evaluated.
Risk evaluation models that also represent an example of tools for supplier selection between the chance-constrained programming (CCP), multi-objective programming (MOP), and DEA were considered by Wu and Olson [98]. Azadeh and Alem [99] presented three types of models for SC risk and supplier selection under certainty, uncertainty and probabilistic conditions: DEA, Fuzzy DEA, and Chance Constraint DEA. From these studies, it can be seen that DEA has been employed in supplier selection. Further, a new approach also based on DEA, called DEA VaR (value-at-risk), was developed by Wu and Olson [100] for the selection of vendors in enterprise risk management. Visani et al. in ref. [101] used a DEA approach in approximating supplier total cost of ownership. Boudaghi and Saen [102] presented a novel model of data envelopment analysis–discriminant analysis (DEA–DA) to predict group membership of suppliers in a sustainable SC context.
Based on the developed fuzzy network DEA model, Pournader et al. [103] evaluated risk resilience of the overall SC and their individual tiers. The DEA method was also used by Azadeh et al. [104] for analyzing the impact of macro-ergonomic factors in healthcare SC. Further, Amalnick and Saffar [24] conducted an analysis of the impacts of resilience engineering and ergonomic factors in aerospace SC using DEA.
Saranga and Moser [105] presented a comprehensive performance measurement framework using the classical and two-stage Value Chain DEA models for estimating the performance of purchasing and supply management. For measuring the performance of suppliers and manufacturers in SC operations, Amirteimoori and Khoshandam [106] developed a DEA model within their study. A model for performance assessment of an outsourcer’s processes in an SC comprised of several internal and external entities was provided by Pournader et al. [107] based on the Slacks-based Measure incorporated into a Hybrid Network DEA. Since a transportation system can be disrupted within the SC, Azadeh et al. [108] designed and simulated an echelon SC in which the preferred scenario was identified using fuzzy DEA.
The DEA method was also used in comparing different aspects. For example, Bayraktar et al. [109] compared SCM and information system practices of small and medium-sized enterprises operating in food products and beverages in Turkey and Bulgaria. Also, by combining the DEA method with other methods, the analysis of SC was conducted. Jalalvand et al. [110] combined DEA and PROMETHEE II as tools to compare SC at the process level, business stage level, and SC level.
4. The Proposal of a Non-Radial DEA Model in SC
Within this part of the paper, the non-radial DEA model M is introduced. The DEA method is a linear programming-based method popularized by Charnes et al. [3] for efficiency evaluation. In the literature, the DEA method has been applied for relative efficiency evaluation of the comparable set of entities, called decision-making units (DMUs) with multiple inputs and outputs, i.e., DMUs that are able to transform multiple inputs to multiple outputs. Based on the obtained results by the application of the DEA method, DMUs are classified as efficient or non-efficient. One of the advantages of the DEA method is that it does not require any prior assumptions on underlying functional relationships between inputs and outputs [7]. The mathematical formulation of the classical input oriented Charnes, Cooper, and Rhodes (CCR) DEA model [111] can be written as:
under the assumption that there are n DMUs, m outputs and s inputs, where X and Y represent sets of vectors of inputs and outputs, respectively. represents an indicator of technical efficiency where and indicates how much evaluated entity could potentially reduce its input vector while holding the output constant.
A Brief Description of the Non-Radial DEA Model
As can be seen from the CCR DEA model, as one of the classical DEA models, it is strongly related to, and can be presented through, production theory, in which raw materials and resources are treated as inputs, while products are treated as outputs in the production process [112]. However, in some real applications, the production process may also use undesirable inputs and generate undesirable outputs. However, a method for treating both undesirable inputs and outputs simultaneously in non-radial DEA models has been introduced by Djordjević et al. [7]. One non-radial DEA model was presented by Wu et al. [113] in the field of energy and environmental efficiency. In addition to the advantages of the non-radial DEA model already described, this model was extended in ref. [7] for the proposal of the evaluation of safety at railway-level crossings. Considering the ability of the DEA method in efficiency evaluation and the advantages of the non-radial DEA model, the proposed model M has been chosen for application and evaluation in SC.
The same model could be used in the SC for the evaluation of its different parts/components “as the input” such as the selection of a supplier. Consequently, inputs can be considered as desirable. However, each part of the SC can also represent/include primarily undesirable factors. Therefore, in the paper of ref. [7], in order to allow for the simultaneous reduction of desirable inputs and to obtain an accurate idea regarding the results of efficiency, the non-radial DEA model by authors of ref. [113] was improved in the following way:
s. t.
Under the assumption that there are K DMUs, each of them has n desirable and l undesirable inputs in order to produce m desirable and j undesirable outputs, denoted respectively as , , , .
This non-radial model M could be projected for efficiency evaluation either of SC components or whole SC. The non-radial model M proportionally decreases the number of undesirable inputs and undesirable outputs as much as possible for the given level of desirable inputs and desirable outputs. The optimal values of unified efficiency are in the interval between 0 and 1. An entity with a higher value of efficiency has better efficiency compared to others. However, if an entity has an objective function equal to 1 it means that the entity is the best, located at the frontier, and could not reduce undesirable input and undesirable output. Such a non-radial model M could therefore be suitable for efficiency evaluation of SC components or a whole SC in terms of sustainability or dimensions of sustainability because it has a relatively strong discriminating power and the capability to expand desirable outputs, simultaneously reducing undesirable outputs. Additionally, unified efficiency can be calculated through decision-maker-specified weights (user-specified weights) assigned to each of these three efficiency scores and depends on the preferences between undesirable inputs utilization and undesirable outputs. However, as with any model, there are some risks related with the application of the non-radial model M. First, because the unified efficiency depends on the selected user-specified weights, the results can be subjective. Consequently, for example, the greater degree of weight for an undesirable output implies the reduction of that output. A second risk of the model M is related to the resultant inaccuracy if not all necessary variables (inputs and outputs) are included. The results of unified efficiency can be inaccurate if the set of data is not comprehensive. The improved non-radial DEA model M in this paper was applied through the evaluation of the environmental efficiency of suppliers. The detailed description of these and other characteristics of the model M can be found in Djordjević et al. [7].
5. Illustration of Application of the Non-Radial Model M—Numerical Example
In this part of the paper, the non-radial DEA model M was applied to the selection and evaluation of the environmental efficiency of suppliers with the aim to present the applicability of the model M within the SC field. Because the new and fresh data was missing, non-radial model M was applied on data used in ref. [5] using the Excel Solver tool. However, the main advantages and purpose of the reuse of data is the comparison of obtained results by different models on the same data. Because the data were reused primarily in order to introduce and present the behavior of the model M, the testing of these data before applying the model M was not performed. The data, inputs and outputs that were used in the paper of Mahdiloo et al. [5] are presented in Table 1. Within the study written by Mahdiloo et al. [5], the number of employees (N1) and energy consumption (L1) were considered as inputs, sales, and return on assets (ROA); and environmental R&D investment were considered as desirable outputs; and carbon dioxide (CO2) emission as undesirable output. However, for the application of model M, energy consumption was used as an undesirable input.
The basic equation for the evaluation of environmental efficiency of suppliers (EES) of the model M can be written as:
where the goal function of the model M can be written as:
or, more simply as
Comparison of the results of the application of three models, namely Model 2, Model 4, and Model 5, performed by ref. [5], with the results of the use of the introduced non-radial DEA model M on the same data is presented in Table 2.
Unified efficiency of the model M was obtained based on the same weights for desirable input, undesirable input and output. The same weights, i.e., 1/3, were selected for both desirable and undesirable inputs, as well as undesirable output with the aim to reduce the subjective bias. Using the Excel Solver tool, the results of the non-radial model M were obtained. From Table 2, it can be seen that for Model 2, the suppliers 2, 15, 16, 17, and 18 were rated as the most efficient. Next were 13, 14, 19, and 20. Regarding Model 4, the most efficient suppliers were 2, 15, and 18, while a greater number of suppliers have efficiency near to 1 compared to Model 2. The most efficient suppliers with Model 5 were the same as Model 2. Comparing the results obtained by different models, it can be seen that regarding the environmental efficiency of suppliers, Model M gave similar results to those of Model 4. Hence, suppliers that were rated as efficient within Model 4 were efficient also within Model M. The inefficiency of suppliers obtained by Model 4 was also the same with Model M. The main difference between these two models is the efficiency score. Efficiency scores obtained by Model M for each supplier are lower than efficiency scores obtained by Model 4. The main reason for this lies in the relatively strong discriminating power of model M.
Validation of Non-Radial DEA Model M
The sensitivity analysis of the non-radial DEA model M was performed with the aim to check its validity. It was conducted on data from Mahdiloo et al. [5] as shown in Table 2 using the Excel Solver tool. The main aim of the validation of model M and, therefore, of the sensitivity analysis, was the consideration of the model’s behavior. So, the data used has no influence on the sensitivity analysis. The sensitivity analysis was conducted in the same way as in Djordjević et al. [7]. Realization of the sensitivity analysis of non-radial model M is presented in Table 3. The process of sensitivity analysis was conducted based on the certain percentages of perturbation of used data, i.e., 2%, 5% and 10% until the status of at least one supplier was changed [7]. Sensitivity analysis was presented through three cases. In Case 1, both desirable and undesirable inputs, as well as undesirable output, were improved for suppliers with efficiency 1 and worsened for suppliers with efficiency under 1. Within Case 2, perturbation of the data was focused on the increment of undesirable inputs and output for suppliers with efficiency 1 and reduction for those with lower efficiency, while desirable input was fixed. Then, the behavior of model M was checked through Case 3 where desirable outputs were decreased and desirable input increased for suppliers with efficiency 1, and vice versa for inefficient suppliers. For each case, after the data changing model M was solved using Excel Solver. Results of three cases of the sensitivity analysis are presented in Table 3.
For most suppliers with efficiency under 1, the score of efficiency was improved (see Table 3). However, for some inefficient suppliers, the efficiency score was not significantly changed, such as, for example, suppliers 12 and 13.
With increments in data for 5% and 10% in Case 1, the suppliers 15 and 18 became efficient, while a score of efficiency was changed gradually for inefficient suppliers. In respect to Case 2, the transformation of results can also be noticed with only a 5% decrement of undesirable input and output for inefficient suppliers, which became efficient, such as suppliers 14 and 16, while the results for some efficient suppliers were transformed to inefficient. In comparison with Case 1, the efficiency and inefficiency of a large number of suppliers were changed. Such information tells us that the results of the non-radial DEA model M probably depend on the undesirable input and output.
For Case 3, results have shown that inefficient suppliers became efficient with 5% decrement/increment. Through comparison with Case 1, it can be concluded that some efficient suppliers became inefficient with a change of desirable outputs and inputs. These results indicated that the suppliers are more sensitive to the data of undesirable output and input (see Case 2). With the aim of further changes from inefficient to efficient or vice versa, it is necessary to apply higher percentages of data perturbations. Meanwhile, it should be pointed out that the efficiency for suppliers such as 2 and 17 are unchanged besides the percentages of data perturbations.
The comparison of the results of three cases is given in Table 3, in the column remarks. It was conducted based on the percentage of data perturbation for each supplier. The results show that the efficiency of a particular supplier was mainly unchanged, i.e., scores of efficiency were the same—in all cases under the 2% of data perturbation. In the case of 5% of data perturbation, the efficiency in Case 2 was lower than those in Case 3 and 1, while it was mainly the same for Cases 1 and 3. Finally, for 10% of data perturbation, the efficiency was mainly lower in Case 2 compared to Cases 3 and 1.
6. Discussion
As can be seen from the literature review, many studies have applied the DEA method for efficiency evaluation in SCM. The main contribution of this research is related to the introduction of the non-radial DEA model for efficiency evaluation of different components of SC. Applicability of the introduced non-radial model M was presented through the evaluation and selection of suppliers using the data from ref. [5]. The proposed tool, i.e., the non-radial model M, is relevant for the selection and evaluation of suppliers. However, it can also be a good tool for considering best practices of all components of SC in terms of sustainability because the model is able to measure efficiency while considering undesirable inputs, as well as undesirable outputs, which appeared in real applications.
Through comparison of the results obtained by the non-radial DEA model M and models developed by Mahdiloo et al. [5] (see Table 2), it can be seen that model M has similar results, i.e., the closest results in terms of efficiency score to Model 2. However, regarding the efficiency and inefficiency of suppliers, results of Model M are the most similar to those of Model 4. Further, the results for each supplier of Model 2 were lower in comparison with other models. The main reason for this is the higher discrimination power of model M.
Based on the results of model M, obtained using the Excel Solver tool, it can be said that this model is more appropriate for efficiency evaluation. First of all, with the model M desirable inputs, undesirable inputs and undesirable outputs are simultaneously reduced. Hence, model M can minimize desirable inputs as well. However, in the case of the application of the non-radial model M without the efficiency score θn and weight Wn in terms of desirable inputs, an unreal picture regarding the efficiency can be presented. With model M, the consideration of environmental evaluation and selection of supplier and other components of SC regarding sustainability is more precise, providing better relative efficiency. Further, through the selection of the set of preference weights, the degree of desirability of the adjustment of the input and output levels can be achieved. Therefore, the selection of the weight, for example, for undesirable output, will affect the reduction of that output. Consequently, based on their preferences and the goal of evaluation, decision makers should select weights carefully because the selection of weights can influence the results of model M. In this paper, all weights were selected to be 1/3.
In our case, the environmental efficiency of suppliers was evaluated based on the data taken from Mahdiloo et al. [5]. The suppliers with the greatest relative efficiency were 2, 15 and 18 (see Table 2). Consequently, based on the model M and the results, it can be said that these suppliers for the given level of Sales, ROA and Environmental R&D investment have minimum Energy consumption and CO2, as well as Number of employees in comparison with other suppliers.
Through the consideration of results of the sensitivity analysis, it can be highlighted that model M is valid. Nevertheless, model M is sensitive to data for a smaller transformation of data that causes reduced stability of the model. The reason lies in the fact that model M has the effect of greater discrimination. Then, the score of efficiency for some suppliers was unchanged, which can be linked to the fact that model M evaluates suppliers, i.e., minimizes inputs for a given level of outputs. Consequently, besides the transformation of data, the score of efficiency for particular suppliers was unchanged as these suppliers have a lower level of desirable outputs in comparison with other suppliers. However, it can be concluded that for a higher percentage of data transformations, the model M can present a picture with higher changes of a score of efficiency. In the case of inaccurate data, the application of model M can present an unrealistic picture regarding the best suppliers. The comparison, given in the column remarks of Table 3, confirms these facts. The comparison was conducted based on the percentage of data perturbation for each supplier. The results show that the efficiency of a particular supplier was mainly unchanged, i.e., scores of efficiency were the same—in all cases under the 2% of data perturbation. In the case of a higher percentage of data perturbation, the efficiency in Case 2 was lower than those in Case 3 and Case 1. The obtained results, therefore, confirm that the behavior and results of the model M can be affected by the accuracy of the data and the selection of inputs and outputs.
Nevertheless, the application of model M with an accurate date can show that the model could be a good tool for supplier evaluation and other parts of SCs in terms of sustainability. Further details of the weaknesses of the model M which can appear during supplier evaluation and selection can be found in Djordjević et al. [7].
7. Conclusions
Through the literature review, various DEA models for evaluation within SCM have been shown. However, just a few of them considered undesirable inputs, which are an inseparable part of real production processes and applications, while consideration of undesirable outputs within DEA models is still missing. Therefore, in order to improve the existing literature, the non-radial DEA model that simultaneously considers undesirable inputs and outputs was proposed. Consequently, within the paper, the introduction and presentation of a new DEA model for the evaluation of different components of SCs, which is the main contribution of this paper, was presented. Applicability of the proposed model was presented through the evaluation of the environmental efficiency of suppliers. In order to confirm the novelty of the introduced non-radial model M within this paper, a comprehensive literature review of the application of the DEA method in SCM was performed. Numerous papers have applied quite a variety of DEA approaches in the field of SCM and its components. These papers were categorized according to the purpose of application of the DEA method. Application of the DEA method in combination with other methods in the field of SCM was presented as a separate category. Finally, papers that used DEA as a part of a developed framework or method, as well as for analyzing two or more aspects of SC, were grouped as non-categorized works. As can be seen, a lot of papers were presented in the evaluation of SC performance and supplier selection in terms of sustainability. Different modifications of the DEA method in SCM are therefore available in the literature. Besides modifications of the DEA model, there are also papers that only considered some inputs and outputs as undesirable factors.
However, it can be concluded that there are not many papers that have considered undesirable factors in/within SCs that can appear in real applications. Some papers that included undesirable factors in the evaluation of SC or different parts of it were focused only on undesirable outputs. Therefore, in this paper, we introduced a DEA model M that besides undesirable outputs can also consider and evaluate undesirable inputs. The proposed new approach of a non-radial DEA model M for the environmental evaluation of suppliers and other components of SC that is able to consider desirable inputs in the goal function, all with appropriate weights, was presented.
With the introduced non-radial model M, a better picture in terms of a score of efficiency can be achieved. Application of model M has been presented based on the data taken from Mahdiloo et al. [5]. Results of the model M, obtained using Excel Solver tool, and results obtained by models applied in Mahdiloo et al. [5], are presented in Table 2. Because the data were reused primarily in order to introduce and present the behavior of model M, testing of these data before applying model M was not performed. From Table 2, it can be seen that for Model 2, the suppliers 2, 15, 16, 17, and 18 were rated as most efficient. For Model 4, the most efficient suppliers were 2, 15, and 18, while the most efficient suppliers within Model 5 were the same as within Model 2. Comparing the results of different models, it can be seen that the model M yielded similar results for environmental efficiency of suppliers as Model 4. The picture regarding the inefficiency of suppliers is the same. The main difference between the model M and other models is in efficiency score, i.e., in the case of the model M, it is lower than in the case of other models. Considering these results, it can be concluded that model M provides more precise results because of the higher discriminatory power.
In order to check the behavior of the model M, using the same data as in Mahdiloo et al. [5], sensitivity analysis was performed using the Excel Solver tool, conducted through three Cases under a certain percentage of data perturbation (2%, 5% and 10%). The results of the sensitivity analysis are presented in Table 3. In Case 1, both desirable and undesirable inputs, as well as undesirable outputs, were improved for suppliers with efficiency 1 and worsened for suppliers with efficiency under 1. Within Case 2, the perturbation of the data was focused on the increment of undesirable inputs and outputs for suppliers with efficiency 1 and on the reduction for those with lower efficiency, while desirable input was fixed. Then, the behavior of model M was checked through Case 3 where desirable outputs were decreased and desirable input increased for suppliers with efficiency 1, and vice versa for inefficient suppliers. Based on the results obtained through the sensitivity analysis, it can be concluded that for most suppliers with efficiency under 1, the score of efficiency was improved. However, for some inefficient suppliers, the efficiency score was not significantly changed; such as, for example, suppliers 12 and 13. Through the comparison of efficiency for a particular supplier, comparing data of different perturbations (Table 3), it can be seen that efficiency was mainly the same in all Cases under the 2% of data perturbation. However, with 5% of data perturbation, the efficiency for each supplier was lower in Case 2 compared to Case 3 and Case 1, while efficiency was mainly the same for Case 3 and Case 1. In addition, regarding 10% of data perturbation, it can be seen that the efficiency of suppliers was mainly lower in Case 2 compared to Case 3 and Case 1.
Model M was taken from Wu et al. [113] and then improved and applied in Djordjević et al. [7]. The comprehensive observation was that efficiency obtained by non-radial DEA model M from ref. [7] was different from the model developed in ref. [113] and that model M gives better efficiency because of the involvement of efficiency score with weight in the model. The main reason for different results in comparison with results in ref. [113] and in ref. [5] lies in the fact that model M can simultaneously reduce desirable inputs. Through the application of model M for the evaluation of SC, a better picture regarding relative efficiency can be given because the model is more representative and strict. The proposed model M can, therefore, be a good tool for efficiency evaluation of SCs and identification of best practices.
Specifically, the model M is able to measure the efficiency of some components of an SC such as supplier selection and comparison of efficiency between SCs on different (micro and macro) levels over time.
Further, one of the major advantages of the proposed model M are weights that can be assigned to desirable and undesirable inputs and outputs. Through the application of particular weights for inputs and outputs, the level of desirability can be determined, which influences reduction or improvement effects of inputs or outputs. Regarding that, one of the important steps in the non-radial model M should be the careful selection of weights, relying on the preferences of DM and the aim of the evaluation. Based on their degree, they can influence the results of the non-radial DEA model M. Considering the results of the sensitivity analysis of model M presented in Table 3, it can be concluded that the model is valid. However, results of sensitivity analysis also illustrate reduced stability under smaller data transformation.
Bearing in the mind the overview of literature related to the application of the DEA approach in SCM and the introduced non-radial DEA model M, future work can be conducted. For instance, the model M may be applied for the evaluation of components of SC such as supplier selection using experimental or real data. Further, the non-radial DEA model can be also applied to the specific companies within the EU countries or the US. Funding of the best practices among companies and comparisons of between companies or countries can also be realized with model M. In the future, model M can be extended also for the evaluation of whole SC through the inclusion of intermediate variables. Besides the environmental efficiency model M can be applied for measuring other components or whole SC from the perspective of dimensions of sustainability such as economic and social. Moreover, combination and application of DEA with other economic measures such as ROE (Return on Equity) and ROA (Return on Assets) for the purposes of evaluation in SCM in terms of different views of sustainability can be one of the future tasks.
Author Contributions
Both authors contributed equally to this work and have read and approved the final manuscript.
Funding
This research received no external funding.
Conflicts of Interest
The authors declare no conflict of interest.
References
- Yang, F.; Wu, D.; Liang, L.; Bi, G.; Wu, D.D. Supply chain DEA: Production possibility set and performance evaluation model. Ann. Oper. Res. 2011, 185, 195–211. [Google Scholar] [CrossRef]
- Sharma, M.J.; Yu, S.J. Multi-Stage data envelopment analysis congestion model. Oper. Res. Int. J. 2013, 13, 399–413. [Google Scholar] [CrossRef]
- Charnes, A.; Cooper, W.W.; Rhodes, E. Measuring the efficiency of decision making units. Eur. J. Oper. Res. 1978, 2, 429–444. [Google Scholar] [CrossRef]
- Soheilirad, S.; Govindan, K.; Mardani, A.; Zavadskas, K.E.; Nilashi, M.; Zakuan, N. Application of data envelopment analysis models in supply chain management: A systematic review and meta-analysis. Ann. Oper. Res. 2018, 271, 915–969. [Google Scholar] [CrossRef]
- Mahdiloo, M.; Saen, F.R.; Lee, K.-H. Technical, environmental and eco-efficiency measurement for supplier selection: An extension and application of data envelopment analysis. Int. J. Prod. Econ. 2015, 168, 279–289. [Google Scholar] [CrossRef]
- Krmac, E.; Djordjević, B. An evaluation of train control information systems for sustainable railway using the analytic hierarchy process (AHP) model. Eur. Transp. Res. Rev. 2017, 9, 35. [Google Scholar] [CrossRef]
- Djordjević, B.; Krmac, E.; Mlinarić, T.J. Non-radial DEA model: A new approach to evaluation of safety at railway level crossings. Saf. Sci. 2018, 103, 234–246. [Google Scholar]
- Tavana, M.; Kaviani, M.A.; Caprio, D.D.; Rahpeyma, B. A two-stage data envelopment analysis model for measuring performance in three-level supply chains. Measurement 2016, 78, 322–333. [Google Scholar] [CrossRef]
- Liang, L.; Yang, F.; Cook, W.D.; Zhu, J. DEA models for supply chain efficiency evaluation. Ann. Oper. Res. 2006, 145, 35–49. [Google Scholar] [CrossRef]
- Wong, W.P.; Wong, K.Y. Supply chain performance measurement system using DEA modeling. Ind. Manag. Data Syst. 2007, 107, 361–381. [Google Scholar] [CrossRef]
- Xu, J.; Li, B.; Wu, D. Rough data envelopment analysis and its application to supply chain performance evaluation. Int. J. Prod. Econ. 2009, 122, 628–638. [Google Scholar] [CrossRef]
- Aoki, S.; Naito, A.; Gejima, R.; Inoue, K.; Tsuji, H. Data envelopment analysis for a supply chain. Artif. Life Robot. 2010, 15, 171–175. [Google Scholar] [CrossRef]
- Li, D.-C.; Dai, W.-L. Determining the optimal collaborative benchmarks in a supply chain. Int. J. Prod. Res. 2009, 47, 4457–4471. [Google Scholar] [CrossRef]
- Chen, C.; Yan, H. Network DEA model for supply chain performance evaluation. Eur. J. Oper. Res. 2011, 213, 147–155. [Google Scholar] [CrossRef]
- Tavana, M.; Mirzagoltabar, H.; Mirhedayatian, S.M.; Saen, R.F.; Azadi, M. A new network epsilon-based DEA model for supply chain performance evaluation. Comput. Ind. Eng. 2013, 66, 501–513. [Google Scholar] [CrossRef]
- Khalili-Damghani, K.; Tavana, M. A new fuzzy network data envelopment analysis model for measuring the performance of agility in supply chains. Int. J. Adv. Manuf. Technol. 2013, 69, 291–318. [Google Scholar] [CrossRef]
- Nikfarjam, H.; Rostamy-Malkhalifeh, M.; Mamizadeh-Chatghayeh, S. Measuring supply chain efficiency based on a hybrid approach. Transp. Res. Part D 2015, 39, 141–150. [Google Scholar] [CrossRef]
- Kumar, A.; Mukherjee, K.; Adlakha, A. Dynamic performance assessment of a supply chain process: A case from pharmaceutical supply chain in India. Bus. Process Manag. J. 2015, 21, 743–770. [Google Scholar] [CrossRef]
- Tavassoli, M.; Saen, R.F.; Faramarzi, G.R. Developing network data envelopment analysis model for supply chain performance measurement in the presence of zero data. Expert Syst. 2015, 32, 381–391. [Google Scholar] [CrossRef]
- Khamseh, A.A.; Zahmatkesh, D. Supply chain performance evaluation using robust data envelopment analysis. Uncertain Supply Chain Manag. 2015, 3, 311–320. [Google Scholar] [CrossRef]
- Omrani, H.; Keshavarz, M. A performance evaluation model for supply chain of shipping company in Iran: An application of the relational network DEA. Marit. Policy Manag. 2016, 43, 121–135. [Google Scholar] [CrossRef]
- Moslemi, S.; Mirzazadeh, A. Performance Evaluation of Four-Stage Blood Supply Chain with Feedback Variables Using NDEA Cross-Efficiency and Entropy Measures Under IER Uncertainty. Numer. Algebra Control Optim. 2017, 7, 379–401. [Google Scholar] [CrossRef]
- Huang, C.-W. Assessing the performance of tourism supply chains by using the hybrid network data envelopment analysis model. Tour. Manag. 2018, 65, 303–316. [Google Scholar] [CrossRef]
- Amalnick, M.S.; Saffar, M.M. An integrated approach for supply chain assessment from resilience engineering and ergonomics perspectives. Uncertain Supply Chain Manag. 2017, 5, 159–168. [Google Scholar] [CrossRef]
- Toloo, M.; Nalchigar, S. A new DEA method for supplier selection in presence of both cardinal and ordinal data. Expert Syst. Appl. 2011, 38, 14726–14731. [Google Scholar] [CrossRef]
- Liu, J.; Ding, F.-Y.; Lall, V. Using data envelopment analysis to compare suppliers for supplier selection and performance improvement. Supply Chain Manag. Int. J. 2000, 5, 143–150. [Google Scholar] [CrossRef]
- Wu, T.; Blackhurst, J. Supplier evaluation and selection: An augmented DEA approach. Int. J. Prod. Res. 2009, 47, 4593–4608. [Google Scholar] [CrossRef]
- Wu, D.D. A systematic stochastic efficiency analysis model and application to international supplier performance evaluation. Expert Syst. Appl. 2010, 37, 6257–6264. [Google Scholar] [CrossRef]
- Azadi, M.; Saen, R.F. Supplier Selection using a New Russell Model in the Presence of Undesirable Outputs and Stochastic Data. J. Appl. Sci. 2012, 12, 336–344. [Google Scholar]
- Azadi, M.; Saen, R.F. Developing a Nondisretionary Slacks-based Measure Model for Supplier Selection in the Presence of Stochastic Data. Res. J. Bus. Manag. 2012, 6, 103–120. [Google Scholar]
- Mahdiloo, M.; Noorizadeh, A.; Saen, R.F. Benchmarking suppliers’ performance when some factors play the role of both inputs and outputs: A new development to the slacks-based measure of efficiency. Benchmark. Int. J. 2014, 5, 792–813. [Google Scholar] [CrossRef]
- Hatami-Marbini, A.; Agrell, P.J.; Tavana, M.; Khoshnevis, P. A flexible cross-efficiency fuzzy data envelopment analysis model for sustainable sourcing. J. Clean. Prod. 2017, 142, 2761–2779. [Google Scholar] [CrossRef]
- Momeni, M.; Vandchali, R.H. Providing a structured methodology for supplier selection and evaluation for strategic outsourcing. Int. J. Bus. Perform. Supply Chain Model. 2017, 9, 66–85. [Google Scholar] [CrossRef]
- Shafiee, M.; Lotfi, F.H.; Saleh, H. Supply chain performance evaluation with data envelopment analysis and balanced scorecard approach. Appl. Math. Model. 2014, 38, 5092–5112. [Google Scholar] [CrossRef]
- Reiner, G.; Hofmann, P. Efficiency analysis of supply chain processes. Int. J. Prod. Res. 2006, 44, 5065–5087. [Google Scholar] [CrossRef]
- Dotoli, M.; Falagario, M. A hierarchical model for optimal supplier selection in multiple sourcing contexts. Int. J. Prod. Res. 2012, 50, 2953–2967. [Google Scholar] [CrossRef]
- Dev, N.K.; Shankar, R.; Debnath, R.M. Supply chain efficiency: A simulation cum DEA approach. Int. J. Adv. Manuf. Technol. 2014, 72, 1537–1549. [Google Scholar] [CrossRef]
- Toloo, M. Selecting and full ranking suppliers with imprecise data: A new DEA method. Int. J. Adv. Manuf. Technol. 2014, 74, 1141–1148. [Google Scholar] [CrossRef]
- Markabi, M.S.; Sabbagh, M. A Hybrid Method of GRA and DEA for Evaluating and Selecting Efficient Suppliers plus a Novel Ranking Method for Grey Numbers. J. Ind. Eng. Manag. 2014, 7, 1197–1221. [Google Scholar]
- Abdollahi, M.; Arvan, M.; Razmi, J. An integrated approach for supplier portfolio selection: Lean or agile? Expert Syst. Appl. 2015, 42, 679–690. [Google Scholar] [CrossRef]
- Karsak, E.E.; Dursun, M. An integrated supplier selection methodology incorporating QFD and DEA with imprecise data. Expert Syst. Appl. 2014, 41, 6995–7004. [Google Scholar] [CrossRef]
- Che, Z.H.; Chang, Y.F. Integrated methodology for supplier selection: The case of a sphygmomanometer manufacturer in Taiwan. J. Bus. Econ. Manag. 2016, 17, 17–34. [Google Scholar] [CrossRef]
- Azadeh, A.; Zarrin, M.; Salehi, N. Supplier selection in closed loop supply chain by an integrated simulation-Taguchi-DEA approach. J. Enterp. Inf. Manag. 2016, 29, 302–326. [Google Scholar] [CrossRef]
- Prasad, D.G.K.; Subbaiah, V.K.; Prasad, V.M. Supplier evaluation and selection through DEA-AHP-GRA integrated approach—A case study. Uncertain Supply Chain Manag. 2017, 5, 369–382. [Google Scholar] [CrossRef]
- Park, S.; Ok, C.; Ha, C. A stochastic simulation-based holistic evaluation approach with DEA for vendor selection. Comput. Oper. Res. 2017, 100, 368–378. [Google Scholar] [CrossRef]
- Paraizar, M.; Sir, Y.M. A multi-objective approach for supply chain design considering disruptions impacting supply availability and quality. Comput. Ind. Eng. 2018, 121, 113–130. [Google Scholar] [CrossRef]
- Sabouhi, F.; Pishvaee, S.M.; Jabalameli, S.M. Resilient supply chain design under operational and disruption risks considering quantity discount: A case study of pharmaceutical supply chain. Comput. Ind. Eng. 2018, 126, 657–672. [Google Scholar] [CrossRef]
- Diouf, M.; Kwak, C. Fuzzy AHP, DEA, and Managerial Analysis for Supplier Selection and Development; From the Perspective of Open Innovation. Sustainability 2018, 10, 3779. [Google Scholar] [CrossRef]
- Wang, C.-N.; Nguyen, T.V.; Duong, H.D.; Do, T.H. A Hybrid Fuzzy Analytic Network Process (FANP) and Data Envelopment Analysis (DEA) Approach for Supplier Evaluation and Selection in the Rice Supply Chain. Symmetry 2018, 10, 221. [Google Scholar] [CrossRef]
- Cheng, Y.; Peng, J.; Zhou, Z.; Gu, X.; Liu, W. A Hybrid DEA-Adaboost Model in Supplier Selection for Fuzzy Variable and Multiple Objectives. IFAC PapersOnLine 2017, 50, 12255–12260. [Google Scholar] [CrossRef]
- Ross, A.; Droge, C. An integrated benchmarking approach to distribution center performance using DEA modeling. J. Oper. Manag. 2002, 20, 19–32. [Google Scholar] [CrossRef]
- Easton, L.; Murphy, D.J.; Pearson, J.N. Purchasing performance evaluation: With data envelopment analysis. Eur. J. Purch. Supply Manag. 2002, 8, 123–134. [Google Scholar] [CrossRef]
- Ross, A.D.; Droge, C. An analysis of operations efficiency in large-scale distribution systems. J. Oper. Manag. 2004, 15, 673–688. [Google Scholar] [CrossRef]
- Ji, X.; Wu, J.; Zhu, Q. Eco-design of transportation in sustainable supply chain management: A DEA-like method. Transp. Res. Part D 2016, 48, 451–459. [Google Scholar] [CrossRef]
- Haldar, A.; Qamaruddin, U.; Raut, R.; Kamble, S.; Kharat, M.G.; Kamble, S.J. 3PL evaluation and selection using integrated analytical modeling. J. Model. Manag. 2017, 12, 224–242. [Google Scholar] [CrossRef]
- Marti, L.; Martin, J.C.; Puertas, R. A DEA-Logistics Performance Index. J. Appl. Econ. 2017, 20, 169–192. [Google Scholar] [CrossRef]
- Grigoroudis, E.; Petridis, K.; Arabatzis, G. RDEA: A recursive DEA based algorithm for the optimal design of biomass supply chain networks. Renew. Energy 2014, 71, 113–122. [Google Scholar] [CrossRef]
- Dotoli, M.; Epicoco, N.; Falagario, M. A Technique for Supply Chain Network Design under Uncertainty using Cross-Efficiency Fuzzy Data Envelopment Analysis. IFAC-PapersOnLine 2015, 48, 634–639. [Google Scholar] [CrossRef]
- Petridis, K.; Dey, P.K.; Emrouznejad, A. A branch and efficiency algorithm for the optimal design of supply chain networks. Ann. Oper. Res. 2017, 253, 545–571. [Google Scholar] [CrossRef]
- Babazadeh, R.; Razmi, J.; Rabbani, M.; Pishvaee, M.S. An integrated data envelopment analysise mathematical programming approach to strategic biodiesel supply chain network design problem. J. Clean. Prod. 2017, 147, 694–707. [Google Scholar] [CrossRef]
- Dehghani, E.; Jabalameli, M.S.; Jabbarzadeh, A. Robust design and optimization of solar photovoltaic supply chain in an uncertain environment. Energy Econ. 2017, 142, 139–156. [Google Scholar] [CrossRef]
- Pourhejazy, P.; Kwon, O.K.; Chang, Y.-T.; Park, H. Evaluating Resiliency of Supply Chain Network: A Data Envelopment Analysis Approach. Sustainability 2017, 9, 255. [Google Scholar] [CrossRef]
- Goodarzi, M.; Saen, F.R. How to measure bullwhip effect by network data envelopment analysis? Comput. Ind. Eng. 2018, in press. [Google Scholar] [CrossRef]
- Chen, M.-C.; Yang, T.; Yen, C.-T. Investigating the value of information sharing in multi-echelon supply chains. Qual. Quant. 2007, 41, 497–511. [Google Scholar] [CrossRef]
- Yu, M.-M.; Ting, S.-C.; Chen, M.-C. Evaluating the cross-efficiency of information sharing in supply chains. Expert Syst. Appl. 2010, 37, 2891–2897. [Google Scholar] [CrossRef]
- Khodakarami, M.; Shabani, A.; Saen, R.F.; Azadi, M. Developing distinctive two-stage data envelopment analysis models: An application in evaluating the sustainability of supply chain management. Measurement 2015, 70, 62–74. [Google Scholar] [CrossRef]
- Sueyoshi, T.; Wang, D. Sustainability development for supply chain management in U.S. petroleum industry by DEA environmental assessment. Energy Econ. 2014, 46, 360–374. [Google Scholar] [CrossRef]
- Mirhedayatian, S.M.; Azadi, M.; Saen, R.F. A novel network data envelopment analysis model for evaluating green supply chain management. Int. J. Prod. Econ. 2014, 147, 544–554. [Google Scholar] [CrossRef]
- Tajbakhsh, A.; Hassini, E. A data envelopment analysis approach to evaluate sustainability in supply chain networks. J. Clean. Prod. 2015, 105, 74–85. [Google Scholar] [CrossRef]
- Izadikhah, M.; Saen, R.F. Evaluating sustainability of supply chains by two-stage range directional measure in the presence of negative data. Transp. Res. Part D 2016, 49, 110–126. [Google Scholar] [CrossRef]
- Kahi, V.S.; Yousefi, S.; Shabanpour, H.; Saen, R.F. How to evaluate sustainability of supply chains? A dynamic network DEA approach. Ind. Manag. Data Syst. 2017, 117, 1866–1889. [Google Scholar] [CrossRef]
- Badiezadeh, T.; Saen, R.F.; Samavati, T. Assessing sustainability of supply chains by double frontier network DEA: A big data approach. Comput. Oper. Res. 2017, 98, 284–290. [Google Scholar] [CrossRef]
- Izadikhah, M.; Saen, R.F. Assessing sustainability of supply chains by chance-constrained two-stage DEA model in the presence of undesirable factors. Comput. Oper. Res. 2017, 100, 343–367. [Google Scholar] [CrossRef]
- Kalantary, M.; Saen, F.R. Assessing sustainability of supply chains: An inverse network dynamic DEA model. Comput. Ind. Eng. 2018, in press. [Google Scholar] [CrossRef]
- Zhai, D.; Shang, J.; Yang, F.; Ang, S. Measuring energy supply chains’ efficiency with emission trading: A two-stage frontier-shift data envelopment analysis. J. Clean. Prod. 2019, 210, 1462–1474. [Google Scholar] [CrossRef]
- De, D.; Chowdhury, S.; Dey, K.P.; Ghosh, K.S. Impact of Lean and Sustainability oriented innovation on Sustainability performance of Small and Medium Sized Enterprises: A Data Envelopment Analysis-based Framework. Int. J. Prod. Econ. 2018. accepted. [Google Scholar] [CrossRef]
- Omrani, H.; Keshavarza, M.; Ghaderib, F.S. Evaluation of supply chain of a shipping company in Iran by a fuzzy relational network data envelopment analysis model. Sci. Iran. E 2018, 25, 868–890. [Google Scholar] [CrossRef]
- Chen, Y.-J. Structured methodology for supplier selection and evaluation in a supply chain. Inf. Sci. 2011, 181, 1651–1670. [Google Scholar] [CrossRef]
- Jain, V.; Kumar, S.; Kumar, A.; Chandra, C. An integrated buyer initiated decision-making process for green greensupplier selection. J. Manuf. Syst. 2016, 41, 256–265. [Google Scholar] [CrossRef]
- Kumar, A.; Jain, V.; Kumar, S. A comprehensive environment friendly approach for supplier selection. Omega 2014, 42, 109–123. [Google Scholar] [CrossRef]
- Azadi, M.; Jafarian, M.; Saen, R.F.; Mirhedayatian, S.M. A new fuzzy DEA model for evaluation of efficiency and effectiveness of supplier sinsustainable supply chain management context. Comput. Oper. Res. 2015, 54, 274–285. [Google Scholar] [CrossRef]
- Shi, P.; Yan, B.; Shi, S.; Ke, C. A decision support system to select suppliers for a sustainable supply chain based on a systematic DEA approach. Inf. Technol. Manag. 2015, 16, 39–49. [Google Scholar] [CrossRef]
- Zhou, X.; Pedrycz, W.; Kuang, Y.; Zhang, Z. Type-2 fuzzy multi-objective DEA model: An application to sustainable supplier evaluation. Appl. Soft Comput. 2016, 46, 424–440. [Google Scholar] [CrossRef]
- Izadikhah, M.; Saen, R.F.; Ahmadi, K. How to assess sustainability of suppliers in volume discount context? A new data envelopment analysis approach. Transp. Res. Part D 2017, 51, 102–121. [Google Scholar] [CrossRef]
- Yu, M.-C.; Su, M.-H. Using Fuzzy DEA for Green Suppliers Selection Considering Carbon Footprints. Sustainability 2017, 9, 495. [Google Scholar] [CrossRef]
- Tavassoli, M.; Saen, F.R. Predicting group membership of sustainable suppliers via data envelopment analysis and discriminant analysis. Sustain. Prod. Consum. 2018, in press. [Google Scholar] [CrossRef]
- Ghoushchi, J.S.; Milan, D.M.; Rezaee, J.M. Evaluation and selection of sustainable suppliers in supply chain using new GP-DEA model with imprecise data. J. Ind. Eng. Int. 2018, 14, 613–625. [Google Scholar] [CrossRef]
- Kuo, R.J.; Wang, Y.C.; Tien, F.C. Integration of artificial neural network and MADA methods for green supplier selection. J. Clean. Prod. 2010, 18, 1161–1170. [Google Scholar] [CrossRef]
- Egilmez, G.; Kucukvar, M.; Tatari, O.; Bhutta, M.S. Supply chain sustainability assessment of the U.S. food manufacturing manufacturingsectors: A life cycle-based frontier approach. Resour. Conserv. Recycl. 2014, 82, 8–20. [Google Scholar] [CrossRef]
- Bai, C.; Sarkis, J. Determining and applying sustainable supplier key performance indicators. Supply Chain Manag. Int. J. 2014, 19, 275–291. [Google Scholar] [CrossRef]
- Haghighi, M.S.; Torabi, S.A.; Ghasemi, R. An integrated approach for performance evaluation in sustainable supply chain networks (with a case study). J. Clean. Prod. 2016, 137, 579–597. [Google Scholar] [CrossRef]
- Fallahpour, A.; Olugu, E.U.; Musa, S.N.; Khezrimotlagh, D.; Wong, Y.K. An integrated model for green supplier selection under fuzzy environment: Application of data envelopment analysis and genetic programming approach. Neural Comput. Appl. 2016, 27, 707–725. [Google Scholar] [CrossRef]
- Tavana, M.; Shabanpour, H.; Yousefi, S.; Saen, R.F. A hybrid goal programming and dynamic data envelopment analysis framework for sustainable supplier evaluation. Neural Comput. Appl. 2017, 28, 3683–3696. [Google Scholar] [CrossRef]
- Yousefi, S.; Soltani, R.; Saen, R.F.; Pishvaee, M.S. A robust fuzzy possibilistic programming for a new network GP-DEA model to evaluate sustainable supply chains. J. Clean. Prod. 2017, 166, 537–549. [Google Scholar] [CrossRef]
- Ramezankhani, M.J.; Vahidi, F. Supply chain performance measurement and evaluation: A mixed sustainability and resilience approach. Comput. Ind. Eng. 2018, 126, 531–548. [Google Scholar] [CrossRef]
- He, X.; Zhang, J. Supplier Selection Study under the Respective of Low-Carbon Supply Chain: A Hybrid Evaluation Model Based on FA-DEA-AHP. Sustainability 2018, 10, 564. [Google Scholar] [CrossRef]
- Sevkli, M.; Koh, S.L.; Zaim, S.; Demirbag, M.; Tatoglu, E. An application of data envelopment analytic hierarchy process for supplier selection: A case study of BEKO in Turkey. Int. J. Prod. Res. 2007, 45, 1973–2003. [Google Scholar] [CrossRef]
- Wu, D.; Olson, D.L. Supply chain risk, simulation, and vendor selection. Int. J. Prod. Econ. 2008, 114, 646–655. [Google Scholar] [CrossRef]
- Azadeh, A.; Alem, S.M. A flexible deterministic, stochastic and fuzzy Data Envelopment Analysis approach for supply chain risk and vendor selection problem: Simulation analysis. Expert Syst. Appl. 2010, 37, 7438–7448. [Google Scholar] [CrossRef]
- Wu, D.D.; Olson, D. Enterprise risk management: A DEA VaR approach in vendor selection. Int. J. Prod. Res. 2010, 48, 4919–4932. [Google Scholar] [CrossRef]
- Visani, F.; Barbieri, P.; di Lascio, F.M.; Raffoni, A.; Vigo, D. Supplier’s total cost of ownership evaluation: A data envelopment analysis approach. Omega 2016, 61, 141–154. [Google Scholar] [CrossRef]
- Boudaghi, E.; Saen, R.F. Developing a novel model of data envelopment analysis–discriminant analysis for predicting group membership of suppliers in sustainable supply chain. Comput. Oper. Res. 2018, 89, 348–359. [Google Scholar] [CrossRef]
- Pournader, M.; Rotaru, K.; Kach, A.P.; Hajiagha, S.H. An analytical model for system-wide and tier-specific assessment of resilience to supply chain risks. Supply Chain Manag. Int. J. 2016, 21, 589–609. [Google Scholar] [CrossRef]
- Azadeh, A.; Gaeini, Z.; Shabanpour, N. Optimization of healthcare supply chain in context of macro-ergonomics factors by a unique mathematical programming approach. Appl. Ergon. 2016, 55, 46–55. [Google Scholar] [CrossRef]
- Saranga, H.; Moser, R. Performance evaluation of purchasing and supply management using value chain DEA approach. Eur. J. Oper. Res. 2010, 207, 197–205. [Google Scholar] [CrossRef]
- Amirteimoori, A.; Khoshandam, L. A Data Envelopment Analysis Approach to Supply Chain Efficiency. Adv. Decis. Sci. 2011, 2011, 608324. [Google Scholar] [CrossRef]
- Pournader, M.; Kach, A.; Fahimnia, B.; Sarkis, J. Outsourcing performance quality assessment using data envelopment analytics. Int. J. Prod. Econ. 2019, 207, 173–182. [Google Scholar] [CrossRef]
- Azadeh, A.; Atrchin, N.; Salehi, V.; Shojaei, H. Modelling and improvement of supply chain with imprecise transportation delays and resilience factors. Int. J. Logist. Res. Appl. 2014, 17, 269–282. [Google Scholar] [CrossRef]
- Bayraktar, E.; Gunasekaran, A.; Koh, S.L.; Tatoglu, E.; Demirbag, M.; Zaim, S. An efficiency comparison of supply chain management and information systems practices: A study of Turkish and Bulgarian small- and medium-sized enterprises in food products and beverages. Int. J. Prod. Res. 2010, 48, 425–451. [Google Scholar] [CrossRef]
- Jalalvand, F.; Teimoury, E.; Makui, A.; Aryanezhad, M.B.; Jolai, F. A method to compare supply chains of an industry. Supply Chain Manag. Int. J. 2011, 16, 82–97. [Google Scholar] [CrossRef]
- Cooper, W.W.; Seiford, L.M.; Tone, K. Introduction to Data Envelopment Analysis and Its Use: With DEA-Solver Softwer and References; Springer: New York, NY, USA, 2006. [Google Scholar]
- Djordjević, B.; Krmac, E. Application of Multicriteria Decision-Making Methods in Railway Engineering: A Case Study of Train Control Information Systems (TCIS), Modern Railway Engineering; Hessami, A., Ed.; IntechOpen: Rijeka, Croatia, 2018. [Google Scholar]
- Wu, J.; Zhu, Q.; Yin, P.; Song, M. Measuring energy and environmental performance for regions in China by using DEA-based Malmquist indices. Oper. Res. Int. J. 2015, 17, 715–735. [Google Scholar] [CrossRef]
Figure 1.
The research process.

Figure 2.
The overall search process.

Figure 3.
DEA used in performance and efficiency evaluation of SCs [1,2,8,9,10,11,12,13,14,15,16,17,18,19,20,21,22,23,24,25,26,27,28,29,30,31,32,33,34,35,36,37,38,39,40,41,42,43,44,45,46,47,48,49,50].

Figure 4.
DEA in the evaluation of SC parts, in SC network design, and in the improvement of information sharing among SC stakeholders [51,52,53,54,55,56,57,58,59,60,61,62,63,64,65].

Figure 5.
Application of DEA and combinations of DEA and other methods in SSCM [5,66,67,68,69,70,71,72,73,74,75,76,77,78,79,80,81,82,83,84,85,86,87,88,89,90,91,92,93,94,95,96].


Table 1.
Dataset taken from Mahdiloo et al. [5] for application of model M.
Table 1.
Dataset taken from Mahdiloo et al. [5] for application of model M.
| Suppliers | Number of Employees (N1) | Energy Consumption (kWh/year) (L1) | Sales (1000 Korean Won) (M1) | ROA (M2) | Environmental R&D Investment (100,000 Korean Won) (M3) | CO2 (kg) (J1) |
|---|---|---|---|---|---|---|
| 1 | 1112 | 1267 | 119,477 | 0.04046 | 67 | 43,562 |
| 2 | 118 | 968 | 125,762 | 0.04499 | 65 | 45,000 |
| 3 | 458 | 1001 | 58,770 | 0.02221 | 57 | 42,400 |
| 4 | 416 | 1393 | 62,989 | 0.02920 | 62 | 43,734 |
| 5 | 413 | 1586 | 67,088 | 0.03269 | 50 | 44,890 |
| 6 | 430 | 1802 | 72,318 | 0.03116 | 36 | 42,913 |
| 7 | 426 | 1998 | 74,626 | 0.02184 | 47 | 39,438 |
| 8 | 452 | 1824 | 74,476 | 0.0348 | 44 | 40,078 |
| 9 | 503 | 1479 | 79,710 | 0.03976 | 47 | 39,500 |
| 10 | 498 | 1623 | 79,384 | 0.03723 | 89 | 45,023 |
| 11 | 192 | 1322 | 73,124 | 0.01269 | 256 | 41,324 |
| 12 | 171 | 831 | 62,529 | 0.00385 | 423 | 45,000 |
| 13 | 163 | 913 | 65,424 | 0.02776 | 508 | 42,400 |
| 14 | 161 | 893 | 71,027 | 0.04847 | 536 | 43,734 |
| 15 | 161 | 903 | 74,093 | 0.0514 | 570 | 44,890 |
| 16 | 162 | 778 | 72,830 | 0.04356 | 472 | 42,913 |
| 17 | 159 | 710 | 71,940 | 0.03932 | 426 | 39,438 |
| 18 | 157 | 695 | 82,203 | 0.02599 | 386 | 40,078 |
| 19 | 151 | 637 | 55,681 | 0.00001 | 376 | 39,500 |
| 20 | 151 | 781 | 64,839 | 0.02742 | 369 | 38,570 |
Table 2.
Results of the efficiency from models 2, 4, and 5 presented in Mahdiloo et al. [5] and model M.
Table 2.
Results of the efficiency from models 2, 4, and 5 presented in Mahdiloo et al. [5] and model M.
| Suppliers | Technical Efficiency (Model 2) | Environmental Efficiency (Model 4) | Eco-Efficiency (Model 5) | Model M |
|---|---|---|---|---|
| 1 | 0.73 | 0.99 | 0.99 | 0.60 |
| 2 | 1.00 | 1.00 | 1.00 | 1.00 |
| 3 | 0.47 | 0.52 | 0.52 | 0.37 |
| 4 | 0.40 | 0.63 | 0.63 | 0.41 |
| 5 | 0.39 | 0.68 | 0.68 | 0.44 |
| 6 | 0.34 | 0.69 | 0.69 | 0.42 |
| 7 | 0.29 | 0.68 | 0.68 | 0.38 |
| 8 | 0.37 | 0.82 | 0.82 | 0.47 |
| 9 | 0.50 | 0.93 | 0.93 | 0.56 |
| 10 | 0.44 | 0.78 | 0.78 | 0.48 |
| 11 | 0.55 | 0.80 | 0.80 | 0.62 |
| 12 | 0.83 | 0.79 | 0.83 | 0.80 |
| 13 | 0.88 | 0.94 | 0.94 | 0.90 |
| 14 | 0.96 | 0.98 | 0.98 | 0.96 |
| 15 | 1.00 | 1.00 | 1.00 | 1.00 |
| 16 | 1.00 | 0.95 | 1.00 | 0.97 |
| 17 | 1.00 | 0.99 | 1.00 | 0.98 |
| 18 | 1.00 | 1.00 | 1.00 | 1.00 |
| 19 | 0.96 | 0.80 | 0.96 | 0.85 |
| 20 | 0.84 | 0.89 | 0.89 | 0.89 |
Table 3.
Results of Sensitivity Analysis of non-radial DEA model M.
| Suppliers | Case 1 (C1) | Case 2 (C2) | Case 3 (C3) | Remarks 1 | ||||||||
|---|---|---|---|---|---|---|---|---|---|---|---|---|
| 2% | 5% | 10% | 2% | 5% | 10% | 2% | 5% | 10% | 2% | 5% | 10% | |
| 1 | 0.63 | 0.67 | 0.74 | 0.63 | 0.66 | 0.73 | 0.63 | 0.67 | 0.75 | C1=C2=C3 | C1>C2<C3 | C3>C1<C2 |
| 2 | 1.00 | 1.00 | 1.00 | 1.00 | 1.00 | 1.00 | 1.00 | 1.00 | 1.00 | C1=C2=C3 | C1=C2=C3 | C1=C2=C3 |
| 3 | 0.39 | 0.41 | 0.45 | 0.39 | 0.40 | 0.44 | 0.39 | 0.41 | 0.46 | C1=C2=C3 | C1>C2<C3 | C3>C1>C2 |
| 4 | 0.43 | 0.45 | 0.47 | 0.43 | 0.44 | 0.46 | 0.43 | 0.45 | 0.48 | C1=C2=C3 | C1>C2<C3 | C3>C1>C2 |
| 5 | 0.45 | 0.47 | 0.49 | 0.45 | 0.46 | 0.48 | 0.45 | 0.47 | 0.50 | C1=C2=C3 | C1>C2<C3 | C3>C1>C2 |
| 6 | 0.43 | 0.45 | 0.48 | 0.43 | 0.45 | 0.47 | 0.43 | 0.45 | 0.49 | C1=C2=C3 | C1=C2=C3 | C3>C1>C2 |
| 7 | 0.40 | 0.42 | 0.46 | 0.39 | 0.41 | 0.45 | 0.40 | 0.43 | 0.48 | C1>C2<C3 | C3>C1>C2 | C3>C1>C2 |
| 8 | 0.49 | 0.51 | 0.53 | 0.49 | 0.50 | 0.53 | 0.49 | 0.51 | 0.54 | C1=C2=C3 | C1>C2<C3 | C1<C3>C2 |
| 9 | 0.58 | 0.60 | 0.63 | 0.58 | 0.60 | 0.62 | 0.58 | 0.60 | 0.63 | C1=C2=C3 | C1=C2=C3 | C1>C2<C3 |
| 10 | 0.50 | 0.52 | 0.55 | 0.50 | 0.51 | 0.54 | 0.50 | 0.52 | 0.55 | C1=C2=C3 | C1>C2<C3 | C1>C2<C3 |
| 11 | 0.65 | 0.67 | 0.69 | 0.64 | 0.66 | 0.68 | 0.66 | 0.67 | 0.71 | C3>C1>C2 | C1>C2<C3 | C3>C1>C2 |
| 12 | 0.83 | 0.83 | 0.83 | 0.82 | 0.83 | 0.83 | 0.83 | 0.83 | 0.83 | C1>C2<C3 | C1=C2=C3 | C1=C2=C3 |
| 13 | 0.94 | 0.95 | 0.95 | 0.93 | 0.95 | 0.95 | 0.95 | 0.95 | 0.95 | C3>C1<C2 | C1=C2=C3 | C1=C2=C3 |
| 14 | 1.00 | 1.00 | 1.00 | 0.99 | 1.00 | 1.00 | 1.00 | 1.00 | 1.00 | C1>C2<C3 | C1=C2=C3 | C1=C2=C3 |
| 15 | 1.00 | 0.95 | 0.86 | 1.00 | 0.98 | 0.92 | 1.00 | 0.92 | 0.81 | C1=C2=C3 | C2>C1>C3 | C2>C1>C3 |
| 16 | 1.00 | 1.00 | 1.00 | 0.99 | 1.00 | 1.00 | 1.00 | 1.00 | 1.00 | C1=C2=C3 | C1=C2=C3 | C1=C2=C3 |
| 17 | 1.00 | 1.00 | 1.00 | 1.00 | 1.00 | 1.00 | 1.00 | 1.00 | 1.00 | C1=C2=C3 | C1=C2=C3 | C1=C2=C3 |
| 18 | 1.00 | 0.97 | 0.89 | 1.00 | 0.99 | 0.94 | 1.00 | 0.94 | 0.84 | C1=C2=C3 | C2>C1>C3 | C2>C1>C3 |
| 19 | 0.88 | 0.88 | 0.88 | 0.87 | 0.88 | 0.88 | 0.88 | 0.88 | 0.88 | C1>C2<C3 | C1=C2=C3 | C1=C2=C3 |
| 20 | 0.88 | 0.88 | 0.89 | 0.87 | 0.88 | 0.89 | 0.88 | 0.88 | 0.89 | C1>C2<C3 | C1=C2=C3 | C1=C2=C3 |
1 Remarks: Show the relationships between the results of the efficiency calculated for each supplier and for each data perturbation through Cases 1, 2, and 3.
© 2019 by the authors. Licensee MDPI, Basel, Switzerland. This article is an open access article distributed under the terms and conditions of the Creative Commons Attribution (CC BY) license (http://creativecommons.org/licenses/by/4.0/).
Share and Cite
MDPI and ACS Style
Krmac, E.; Djordjević, B. A New DEA Model for Evaluation of Supply Chains: A Case of Selection and Evaluation of Environmental Efficiency of Suppliers. Symmetry 2019, 11, 565. https://0-doi-org.brum.beds.ac.uk/10.3390/sym11040565
AMA Style
Krmac E, Djordjević B. A New DEA Model for Evaluation of Supply Chains: A Case of Selection and Evaluation of Environmental Efficiency of Suppliers. Symmetry. 2019; 11(4):565. https://0-doi-org.brum.beds.ac.uk/10.3390/sym11040565
Chicago/Turabian StyleKrmac, Evelin, and Boban Djordjević. 2019. "A New DEA Model for Evaluation of Supply Chains: A Case of Selection and Evaluation of Environmental Efficiency of Suppliers" Symmetry 11, no. 4: 565. https://0-doi-org.brum.beds.ac.uk/10.3390/sym11040565
Note that from the first issue of 2016, this journal uses article numbers instead of page numbers. See further details here.