Article

Influence of Mucosal Thickness, Implant Dimensions and Stability in Cone Morse Implant Installed at Subcrestal Bone Level on the Peri-Implant Bone: A Prospective Clinical and Radiographic Study

by
Sergio Alexandre Gehrke
1,2,*,
Mauro Bercianos
3,
Jorge Gonzalo Aguerrondo
3,
José Luis Calvo-Guirado
4 and
Juan Carlos Prados-Frutos
5
1
Biotecnos Research Center, 11100 Montevideo, Uruguay
2
Master Postgraduate Program in Biotechnology of UCAM, 11100 Montevideo, Uruguay
3
Postgraduate Program in Biotechnology of UCAM, 11100 Montevideo, Uruguay
4
Oral and Implant Surgery, Faculty of Health Sciences, Universidad Católica San Antonio de Murcia (UCAM), 30107 Murcia, Spain
5
Department of Medicine and Surgery, Rey Juan Carlos University, Alcorcón, 28922 Madrid, Spain
*
Author to whom correspondence should be addressed.
Submission received: 12 July 2019 / Revised: 26 August 2019 / Accepted: 28 August 2019 / Published: 7 September 2019
(This article belongs to the Special Issue Dental Implant Macrogeometry and Biomaterials)

Abstract

:
The objective of this observational clinical study was to analyze the behavior of peri-implant tissues around cone Morse dental implants installed in the subcrestal bone position considering different clinical variables: Mucosal thickness, implant diameter, and implant length. Thirty patients were selected and included in the present study. Initially the thickness of the mucosa was measured by periapical radiographic and clinically (after the mucosal displaced). According to the planning for each treatment, implants with different dimensions (in length and diameter) were selected and used. Periapical radiographs were obtained at different times: Immediate postoperative (time t1) and 90 days after implantation (time t2). The initial stability of the implants (ISQ) was measured immediately of the implant insertion and 90 days after. The means and standard deviations of the ISQ values were in time t1 was 63.2 ± 6.99 (95% confidence interval (CI): 41 to 83) and in time t2 was 69.7 ± 7.09 (95% CI: 61 to 87). Overall mean of mesial and distal bone loss 90 days after the implantations were 1.11 ± 1.16 mm and 1.11 ± 1.15 mm, respectively. When the variables were considered, in all situations proposed, the bone loss showed differences statistically significant. In conclusion, the implant diameter and mucosal thickness variables showed an important effect on bone loss values. However, the implant length did not show an effect on the peri-implant behavior.

1. Introduction

Implantology as a surgical procedure implies the management of a wound involving the soft and hard tissues. After the implant osseointegration, the bone and the mucosa required by its new function of protection of underlying peri-implant structures, is transformed into the peri-implantar mucosa acquiring particular morphological characteristics. For this new sealing function, the epithelial and connective tissues require an appropriate dimension, and if it does not exist it will be created at the expense of bone resorption. Berglund and Lindhe [1] carried out a study with the purpose of confirming this concept, where thinning the tissues also proves that the conformation of the seal requires a minimal mucosal dimension, otherwise it would be created at the expense of bone resorption. In this way, the biology demands a dimension of minimal epithelial and connective tissue adequate for the protection of the underlying structures. In this sense, other authors begin to give importance to the mucosal thickness as a relevant factor independent of the aforementioned bone resorption, using in its clinical trials different types of technology in the area of the implant connection, noticing the inefficacy of these technologies in the control of crestal bone resorption when the mucosa shows little thickness [2,3,4,5,6,7].
In addition, other factors may affect the behavior of peri-implant tissues, such as: Microgap, micromovement, microtopography of the interface, repeated removal of the abutment, and the platform design (switching or no) [8,9,10,11]. Several studies carried out by our group demonstrated that Morse taper implants present a better condition and behavior when compared to implants of internal and external connection, referring to the factors previously described [12,13]. In this way, a recent important systematic review that was published about the performance of the Morse taper connection [14] showed evidence that this type of connection appeared to be superior in terms of bacterial sealing compared with the traditional ones emphasizing that no connection has a 100% bacterial sealing. Morse taper connection systems appear to be more resistant to abutment movement and increased under load space compared to internal and external hexagon implants [15]. Moreover, the Morse taper connection have greater resistance to torque loss than other connection models [16]. This system seems to have less tension on the abutment screw, the cone compensates for the high stresses and protects the screw from overload [17].
Marginal bone stability around dental implants has always been considered one of the main criteria for defining implant success [18]. Then, with the current advancements and new technologies in implant dentistry, we should strive both for bone loss close to zero and to seek out variables that cause higher or lower rates of resorption. Albrektsson et al. reported that the extensive bone resorption after the first year is generally due to an exacerbation of adverse body reactions caused by non-optimal implant components, adverse surgery or prosthodontics, and/or compromised patient factors [19]. In a recent review study of the evidence regarding marginal bone loss around dental implants, Sasada and Cochran concluded that there is a strong indication that contaminated implant-abutment connections may have an effect on peri-implantitis and failure over time [20].
Although the in vitro results show better results in implants of conical internal connection and in vivo results with lower marginal bone loss, all models show comparable rates in terms of implant success and survival. However, these Morse tapered implants need to be evaluated for their clinical behavior in relation to peri-implant tissues, as many manufacturers recommend their infra-osseous installation without explaining the need for this procedure. In this sense, the aim of the present study was to evaluate the clinical performance of an implant with Morse taper connection (submerged 2 mm infra-osseous) and comparing different clinical variables (mucosal thickness, implant dimensions, and implant stability) with the marginal bone behavior. It was hypothesized that mucosal thickness plays a fundamental role in the maintenance of peri-implant bone and soft tissues.

2. Material and Methods

2.1. Patient Population and Research Design

For the present study, patients aged between 20 to 63 years, that needed replacement of missing teeth in the posterior region of the mandible with adequate condition of remaining bone (height ≥10 mm and width ≥6 mm) and adequate prosthetic space to rehabilitation, were selected in a private clinic (Montevideo, Uruguay). A total of 30 patients, 18 women and 12 men, were consecutively included. All patients signed a written Helsinki informed consent for participation and permission to use the data obtained for research purposes prior to the procedures. The general health condition stability of the participants in the study was considered and their ability to withstand surgery to install the planned implants. Patients with systemic alterations (diabetes, hypertension, or osteoporosis) or local changes (oral pathology in soft or hard tissues, bruxism, and smoking) were excluded from this study. In addition, patients with uncontrolled and/or untreated periodontal disease, lack of adequate bone tissue for implant insertion, and/or presence of inflammatory events were not included in the study.
Sixty dental implants of conical macro design with cone Morse connection manufactured in grade IV titanium (Implacil De Bortoli, São Paulo, Brazil) were used in the implantations. The implants dimensions used were 3.5 and 4 mm in diameter and 7, 9, and 11 mm in length. Moreover, five implants were used to the surface analysis. The Figure 1 show a representative image of the macro design and the connection characteristics of the implant used in the present study.

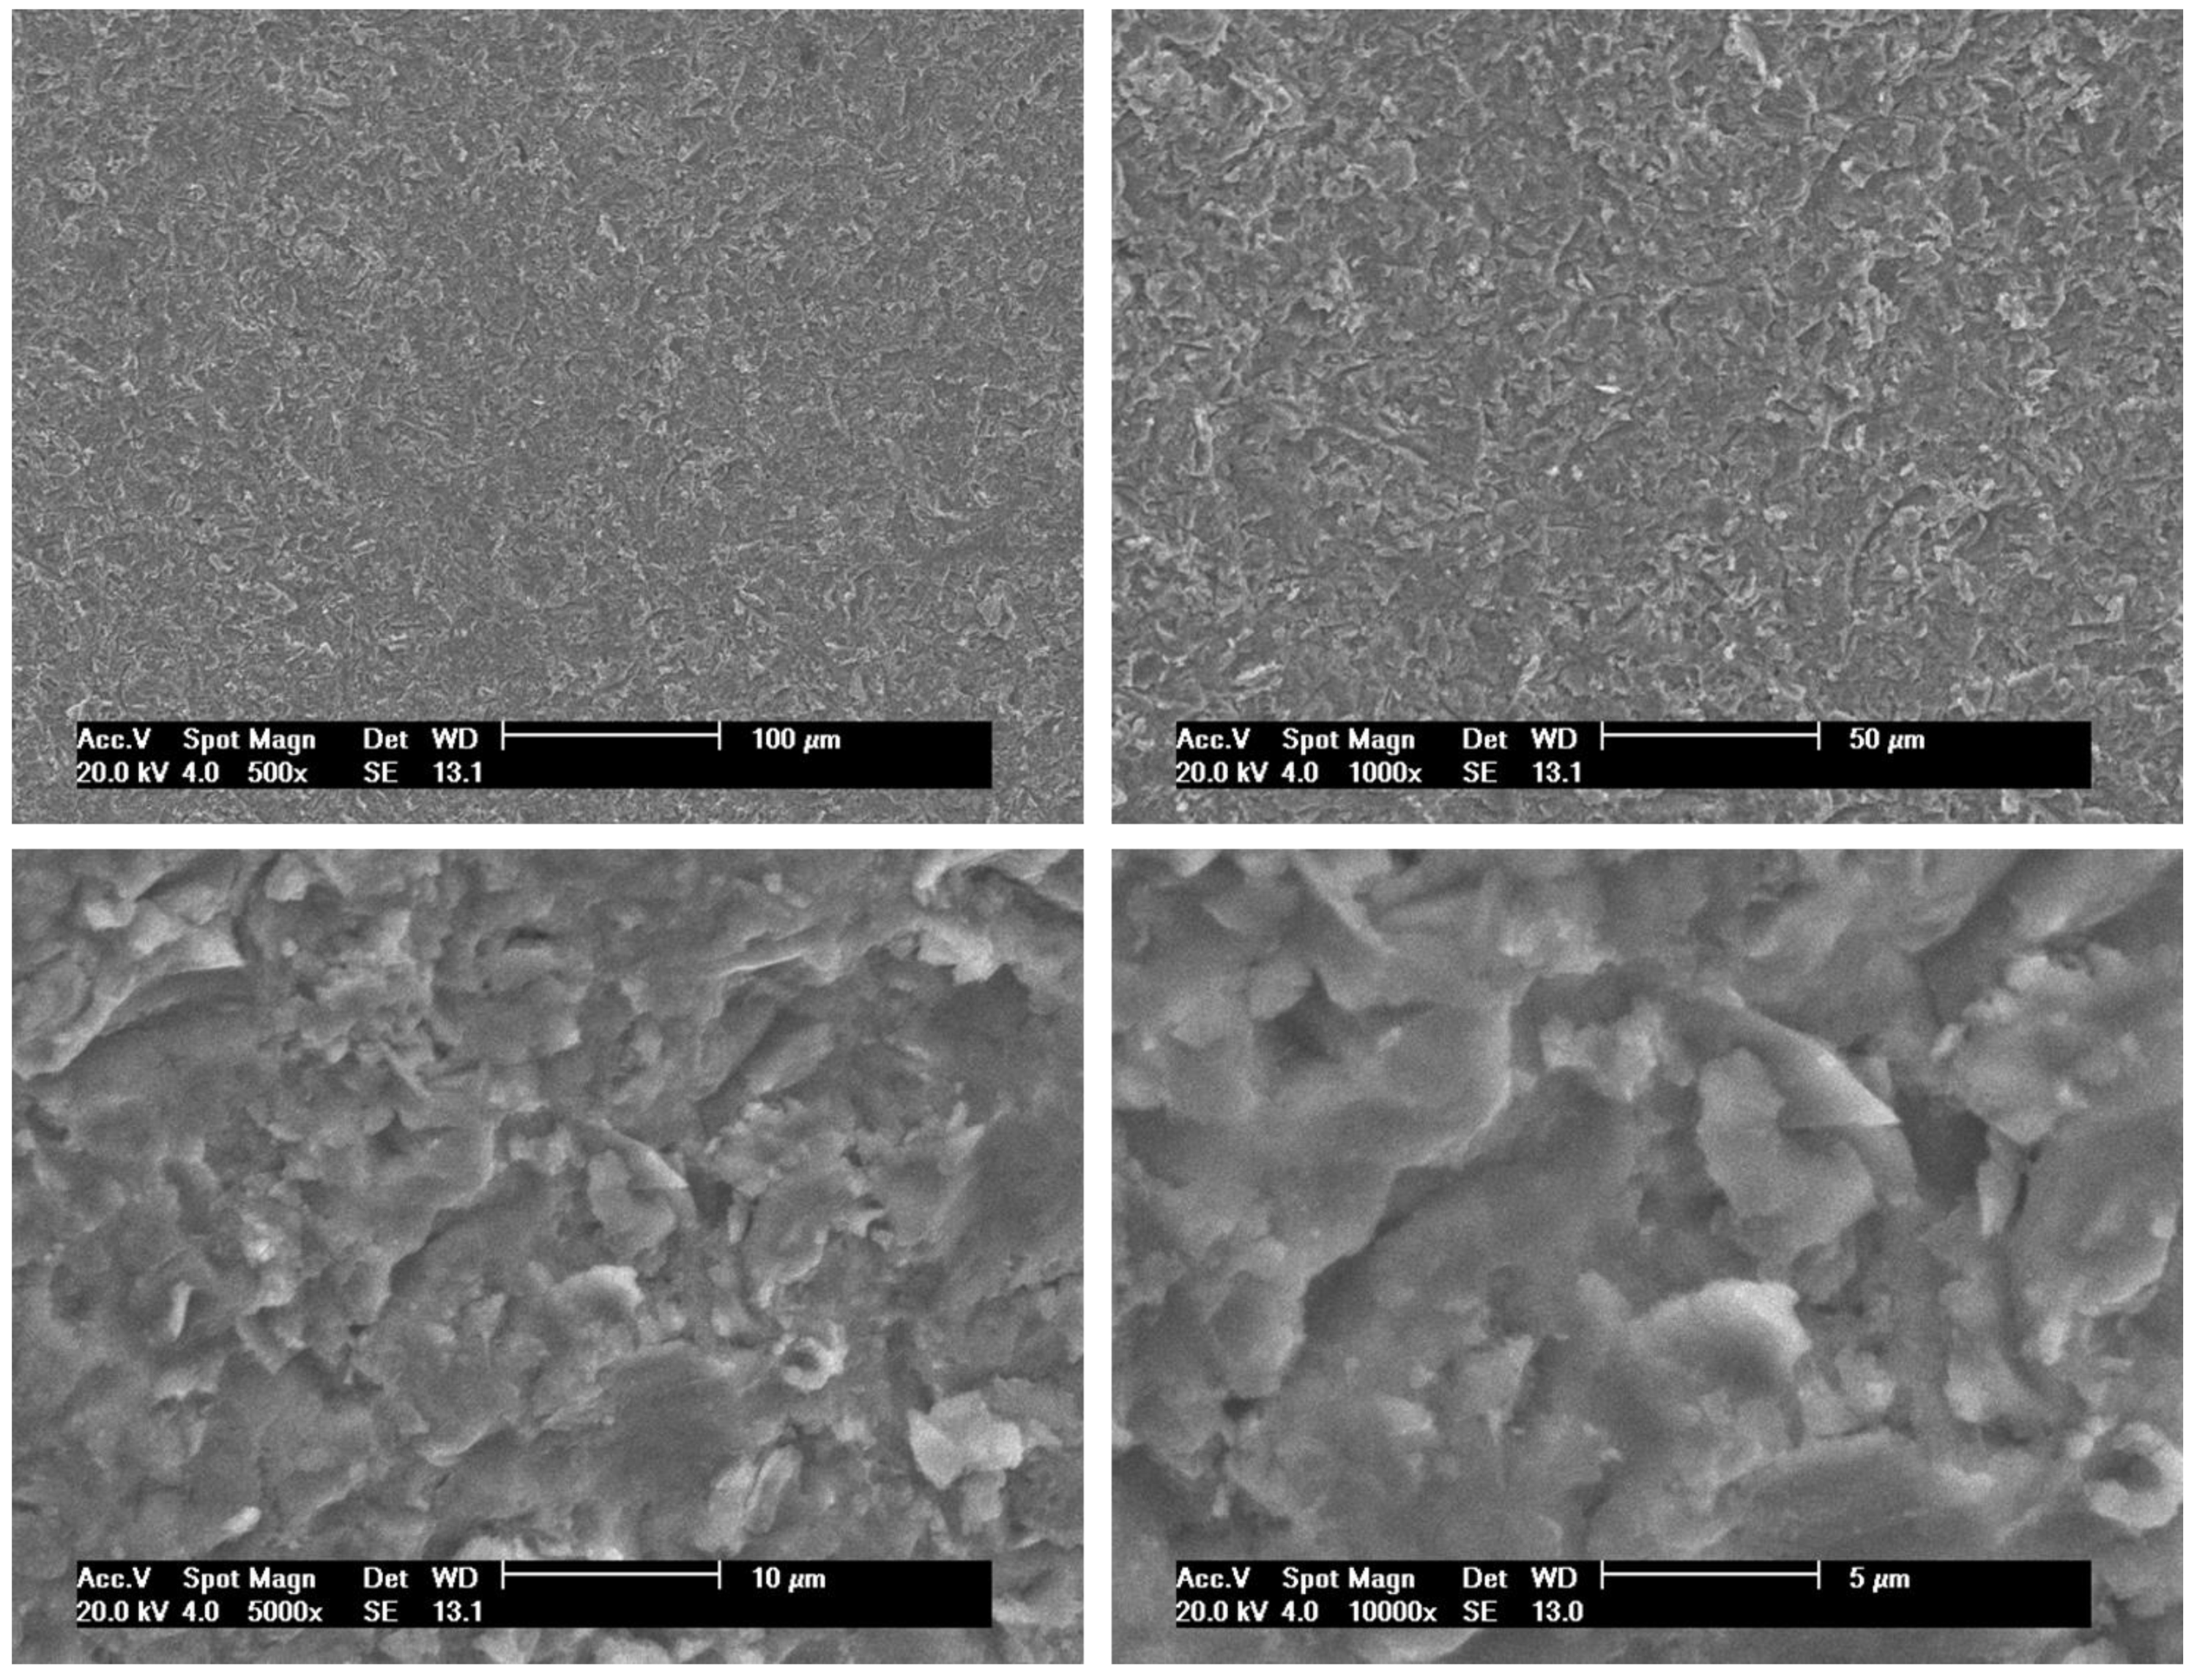
2.2. Dental Implant Surface Topography

All implants are treated with sandblasted acid-etched surface technology as previously described by Gehrke et al. [21]. The implants were blasted with 50–100 µm TiO2 microparticles and, following, the surface was ultrasonically cleaned with an alkaline solution, washed in distilled water, and pickled with maleic acid (HO2CCHCHCO2H). After these treatments, five implants were used to evaluate the surface characteristics by scanning electron microscopy (SEM, model JSM 5200, JEOL Ltd., Tokyo, Japan) and the roughness parameters, which was measured on the profilometer (Perthometer S2, Mahr GmbH, Göttingen, Germany), where Ra is the absolute value of all profile points, and Rz is the value of the absolute heights of the five highest peaks and the depths of the five deepest valleys.

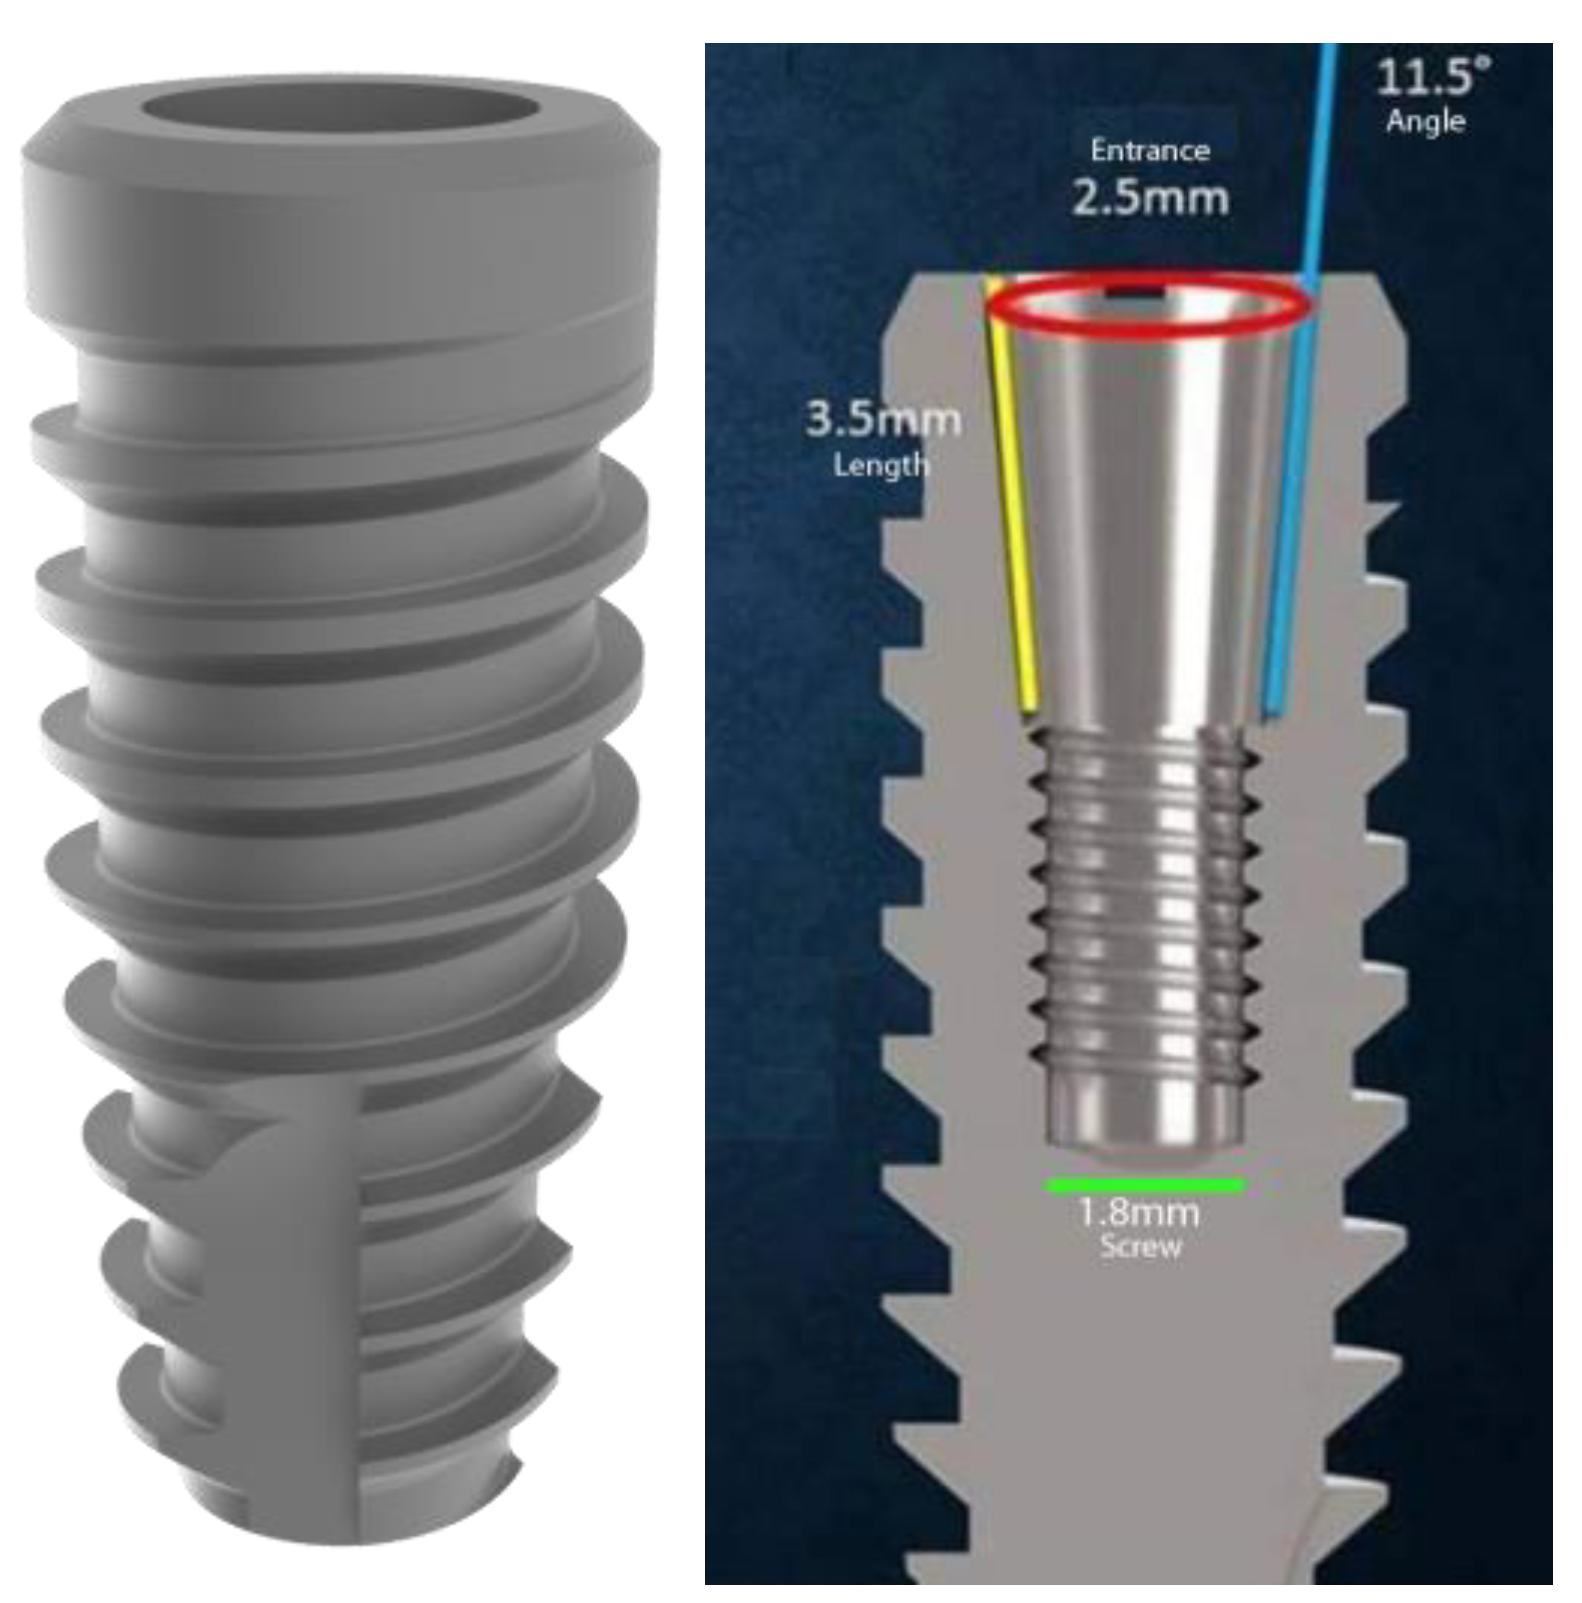
2.3. Surgical Procedure of Implant Placement

All procedures (pre, trans, and postoperative) were performed by two specialists in implantology (MB and JGA). In all patients, mucosal thickness was measured at the local determined for implant installation through a periapical X-ray images. The measurement of the mesio-distal diameter of clinical crown of the tooth adjacent to the place where the implant will be installed was used to calibrate the program. The surgical procedures routinely used to install dental implants were applied. Surgical guides were prepared and used for the installation of all implants. All patients were given antibiotic premedication that was administered orally (2 g of Amoxicillin, 2 h before surgery) and continued in the postoperative for another five days (500 mg every 8 h). After the application of local anesthesia using Articaine 2% (DFL Ltd.a, Rio de Janeiro, Brazil), an incision was performed in the central area of the mucosal crest, and only the buccal flap was displaced, keeping the lingual mucosa in position for the proper measurement of its clinical thickness. The mucosa thickness was measured using a periodontal probe (Hu-Friedy, Chicago, IL, USA), from the crestal bone to the more apical area of the mucosa. Then, the lingual flap was raised, and the implant procedures were performed in accordance to the manufacturer’s instructions.
The dimensions of the implants were previously determined during the planning of each case. For osteotomies, a Driller BLM600 motor and a counter angle with a 20:1 reduction (Driller, São Paulo, Brazil) was used under intense external irrigation with 0.9% saline solution. All implants were positioned 2 ± 0.2 mm subcrestally. All sutures were performed using simple point with Nylon 5-0 (Ethicon US, Bridgewater, NJ, USA). For the post-operative pain and inflammation control was administrated Cetoprofeno (200 mg/day) for four days plus paracetamol (750 mg, in case of pain). Ninety days after performing the surgery for the installation of the implants, the rehabilitation procedures were started.

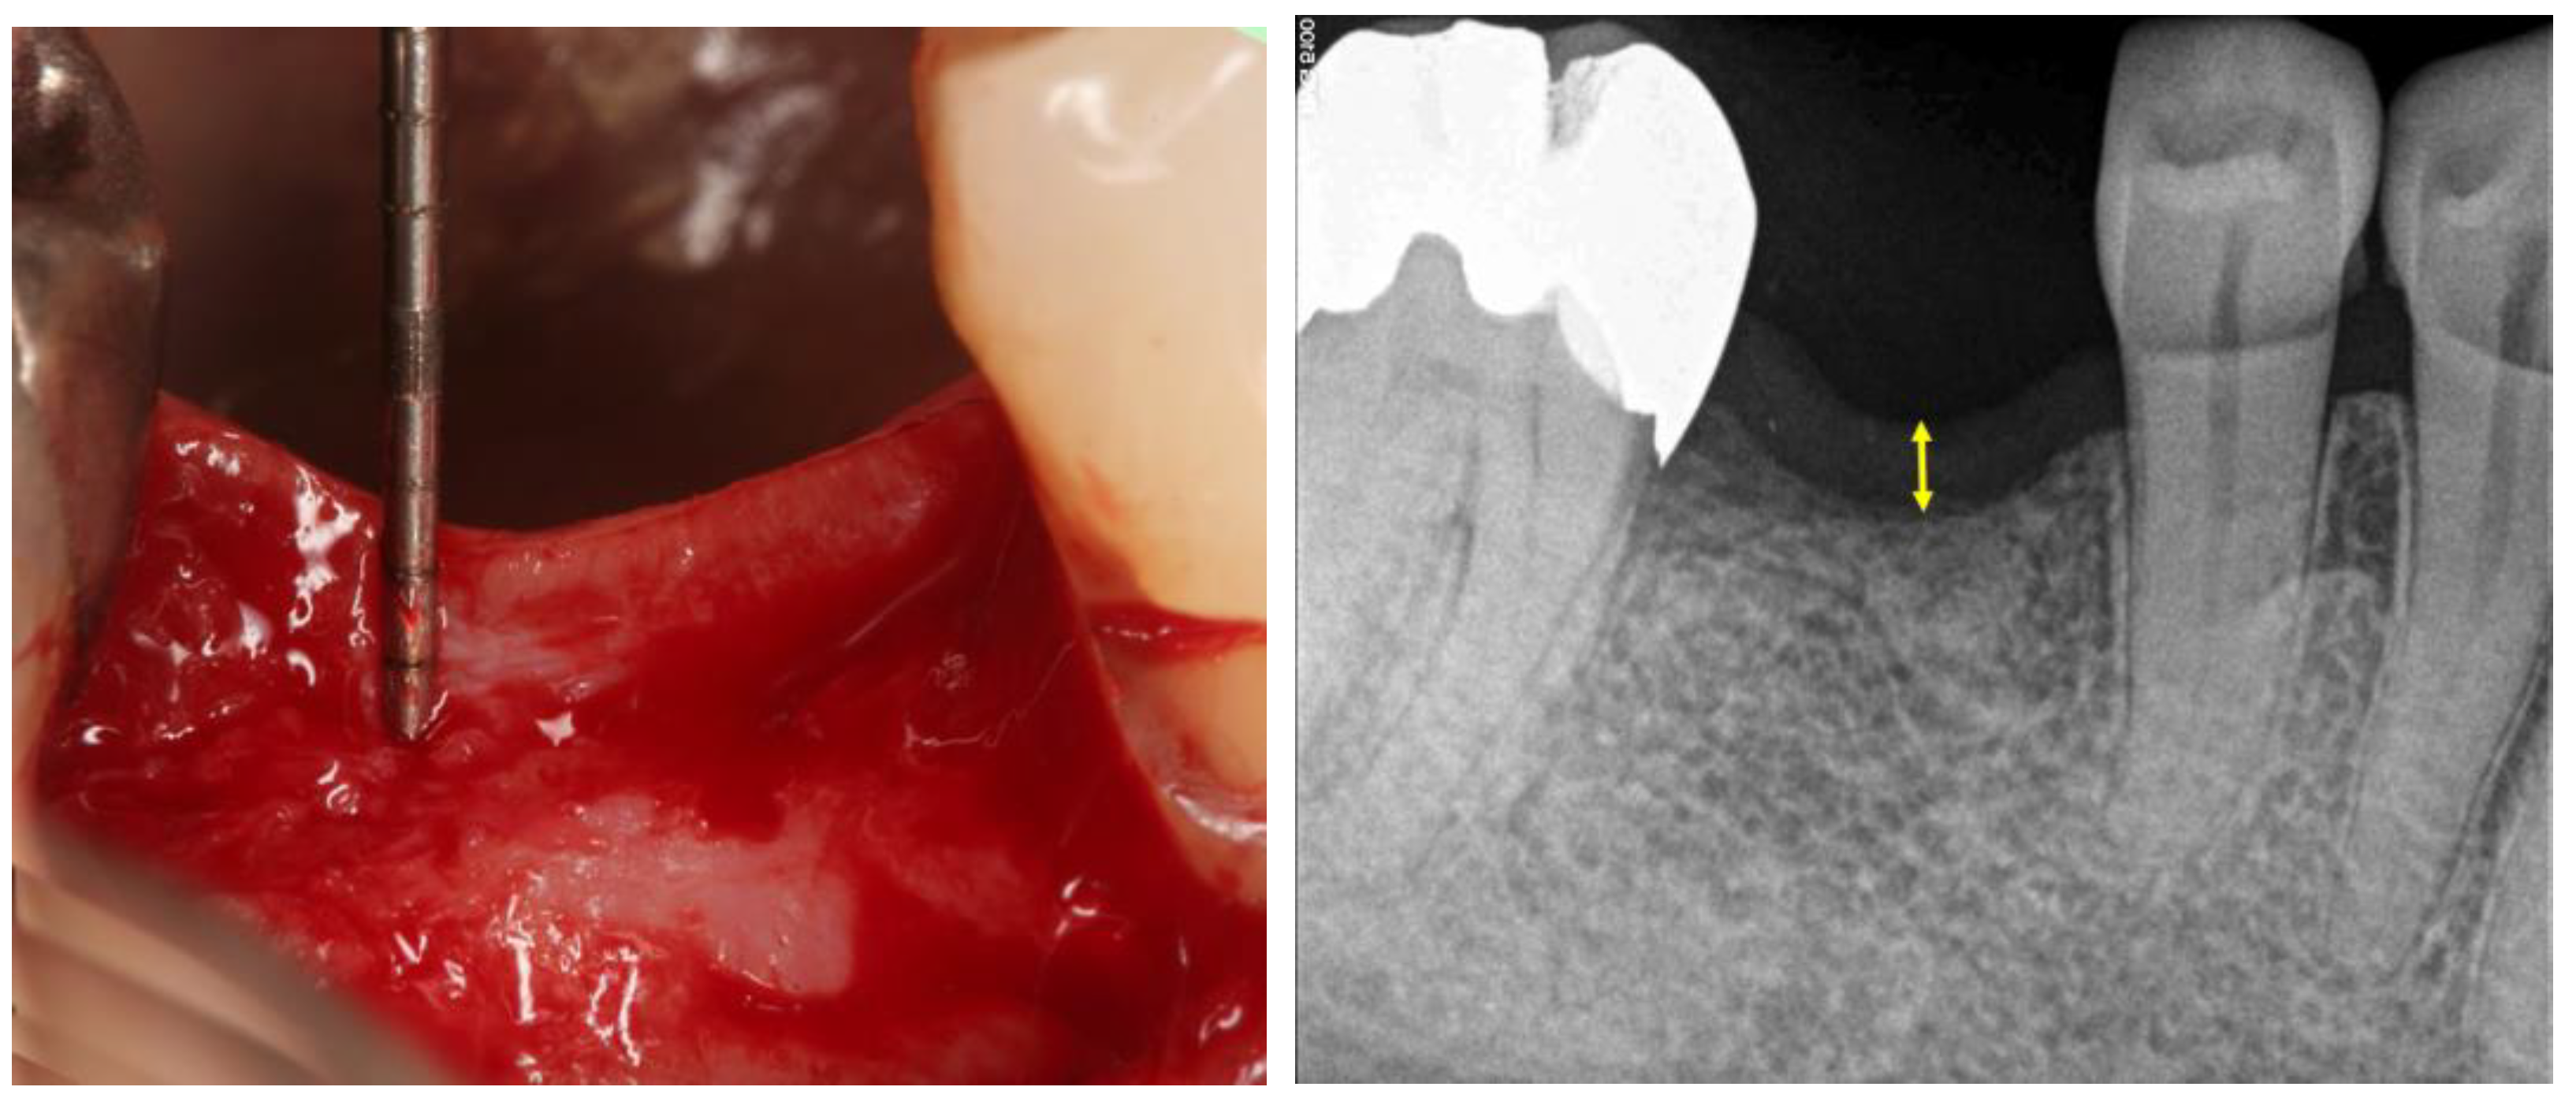
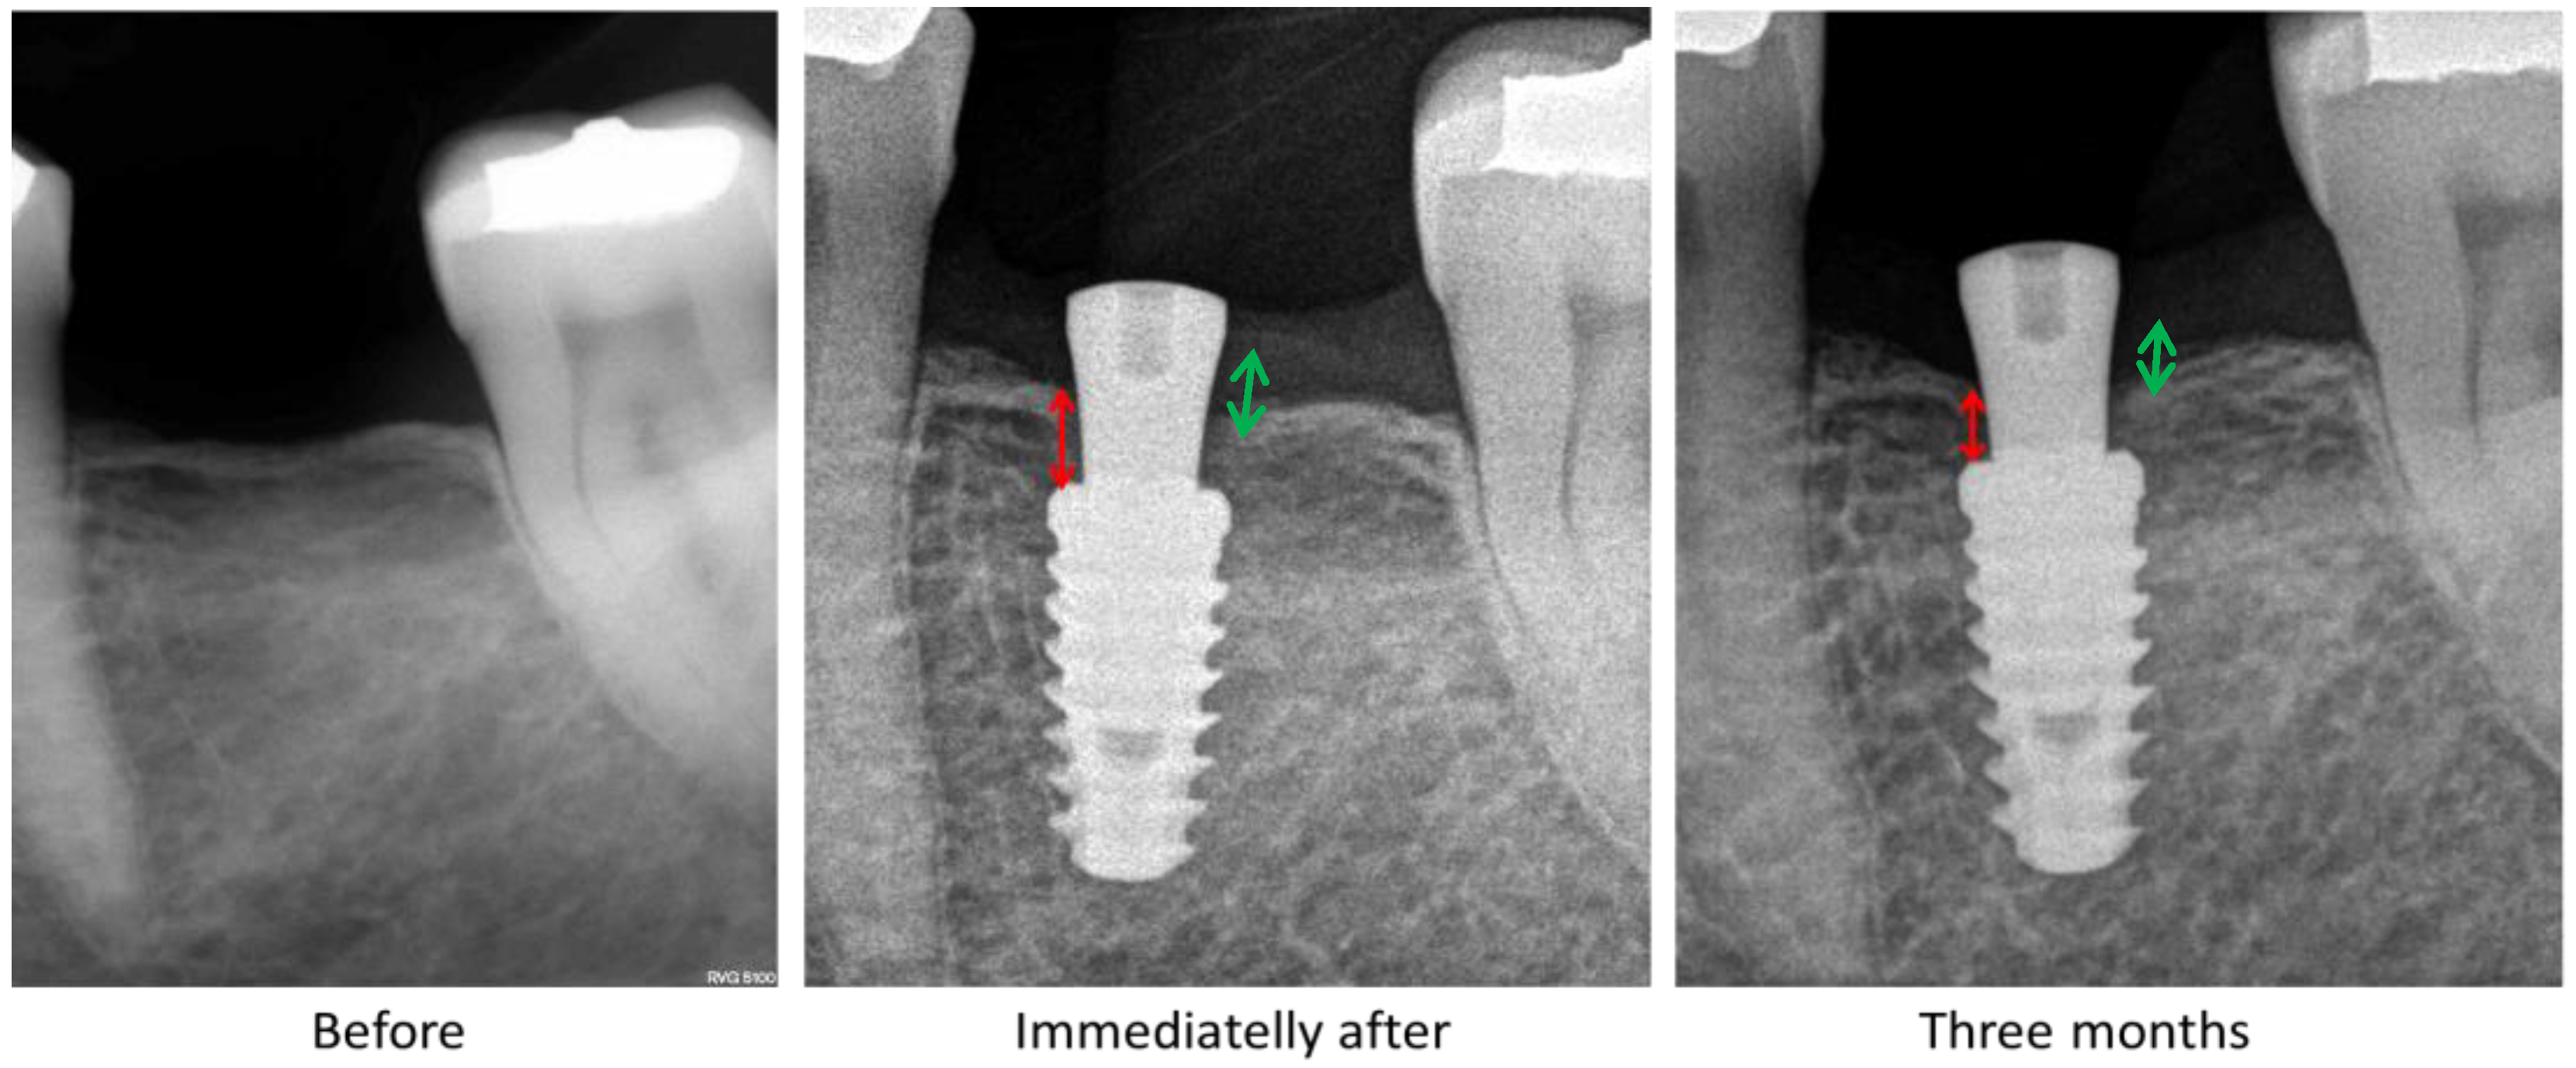
2.4. Clinical Stability and Radiographic Evaluations

The stability of all implants was evaluated by resonance frequency immediately after the installation (t1) and 90 days (t2) in the reentry surgery to install the healing abutment. This evaluation was performed using the OstellTM Mentor (Integration Diagnostics AB, Goteborg, Sweden) plus the SmartpegTM (Integration Diagnostics AB) devices. Smartpeg sensors were installed in each implant using a controlled torque of 10 Ncm, as recommended by a recent study [22]. A mean was performed with the values obtained in the measurements in the vestibule-lingual direction (V-L) and mesio-distal direction (M-D).
Three periapical radiographies were made for each patient to measure the mucosa thickness (before implant placement) and the marginal bone loss (immediately after the surgery and 90 days later). Parallel profile radiography using a digital ring holder was used to standardize the analysis and decrease the image distortions. The relation between the implant platform and the crestal bone position was measured. All radiographic measurements were performed using the ImageJ software for Windows (developed at the U.S. National Institutes of Health and available at http://rsb.info.nih.gov/ij). In the first radiography the mucosa width was measured and compared with the clinical measurements. Then, the implants were grouped according to the measured thickness of the mucosa in each implant: Patients with mucosal thickness (MT) between 1.0 and 2.0 mm (MT1); mucosal thickness between 2.1 and 3.0 mm (MT2); and, mucosal thickness more 3.1 mm (MT3). In the radiographs post-implantation, the cortical bone level to the platform was measured and recorded at the mesial-marginal bone loss (m-MBL) and distal-marginal bone loss (d-MBL) side of each implant.

2.5. Statistical Analyses
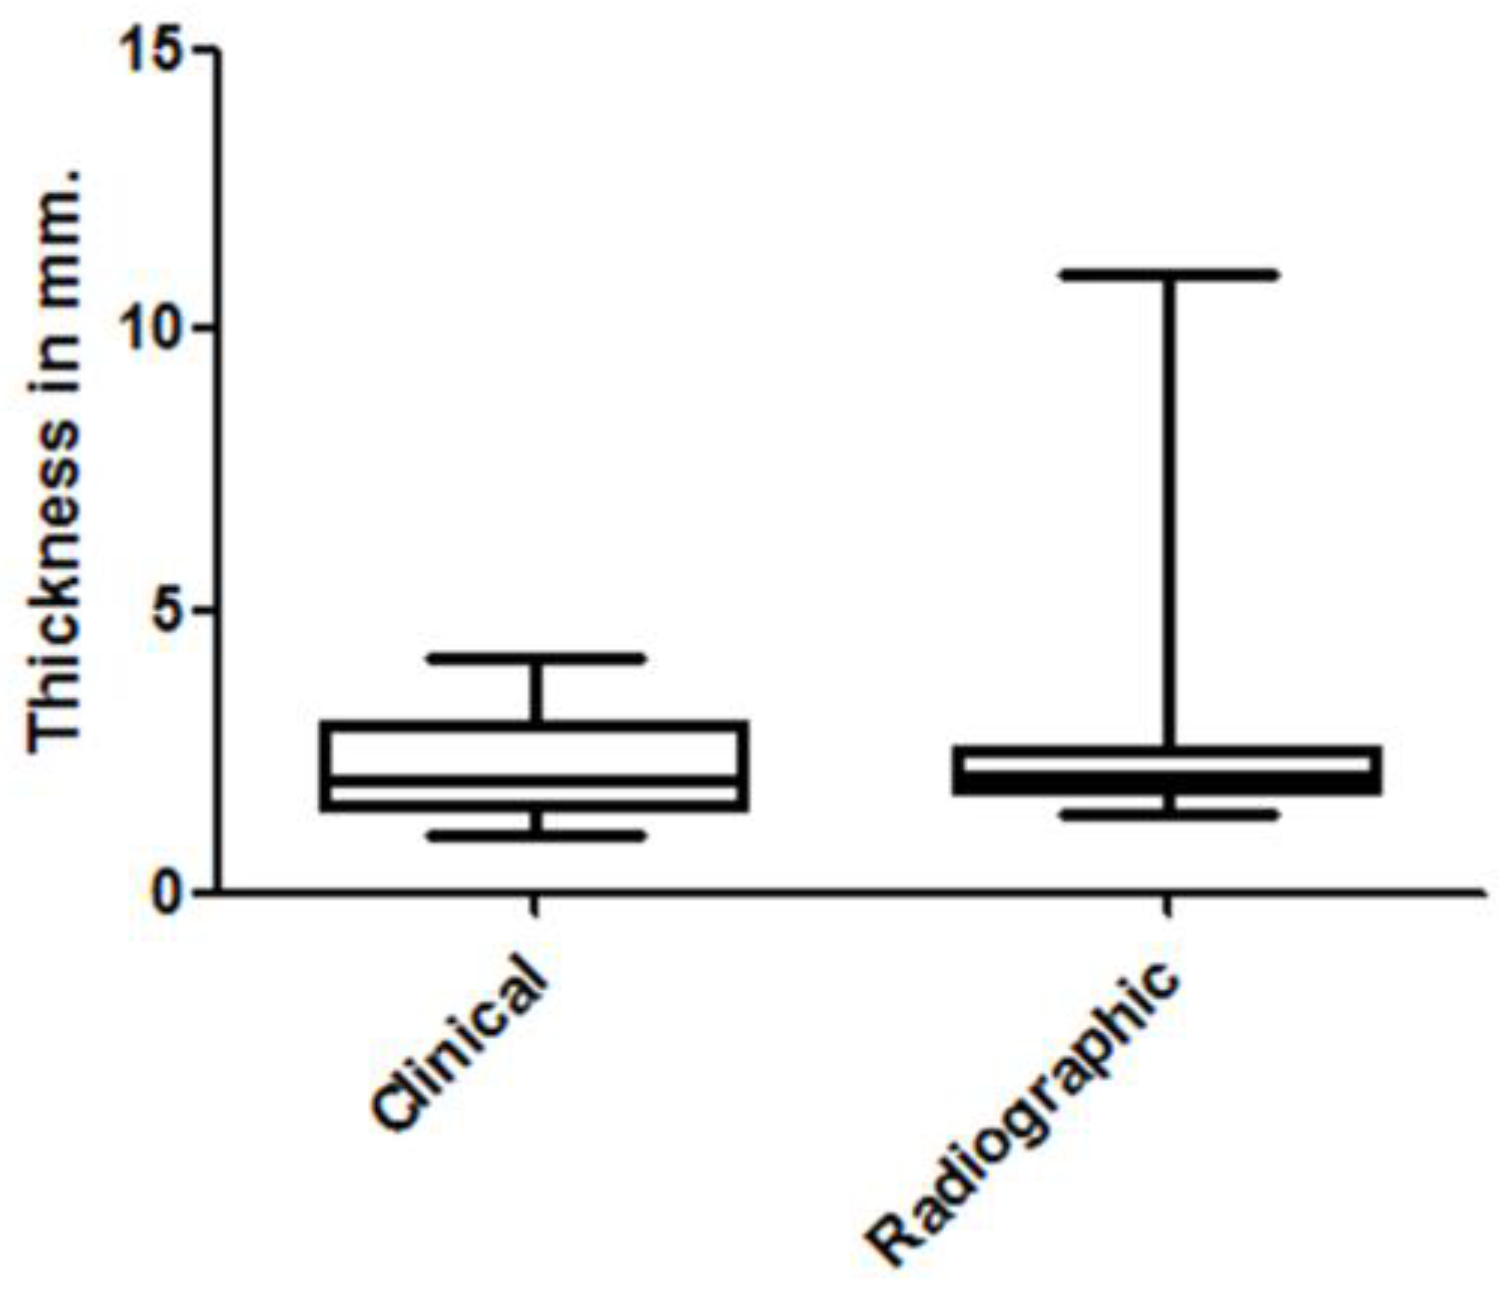
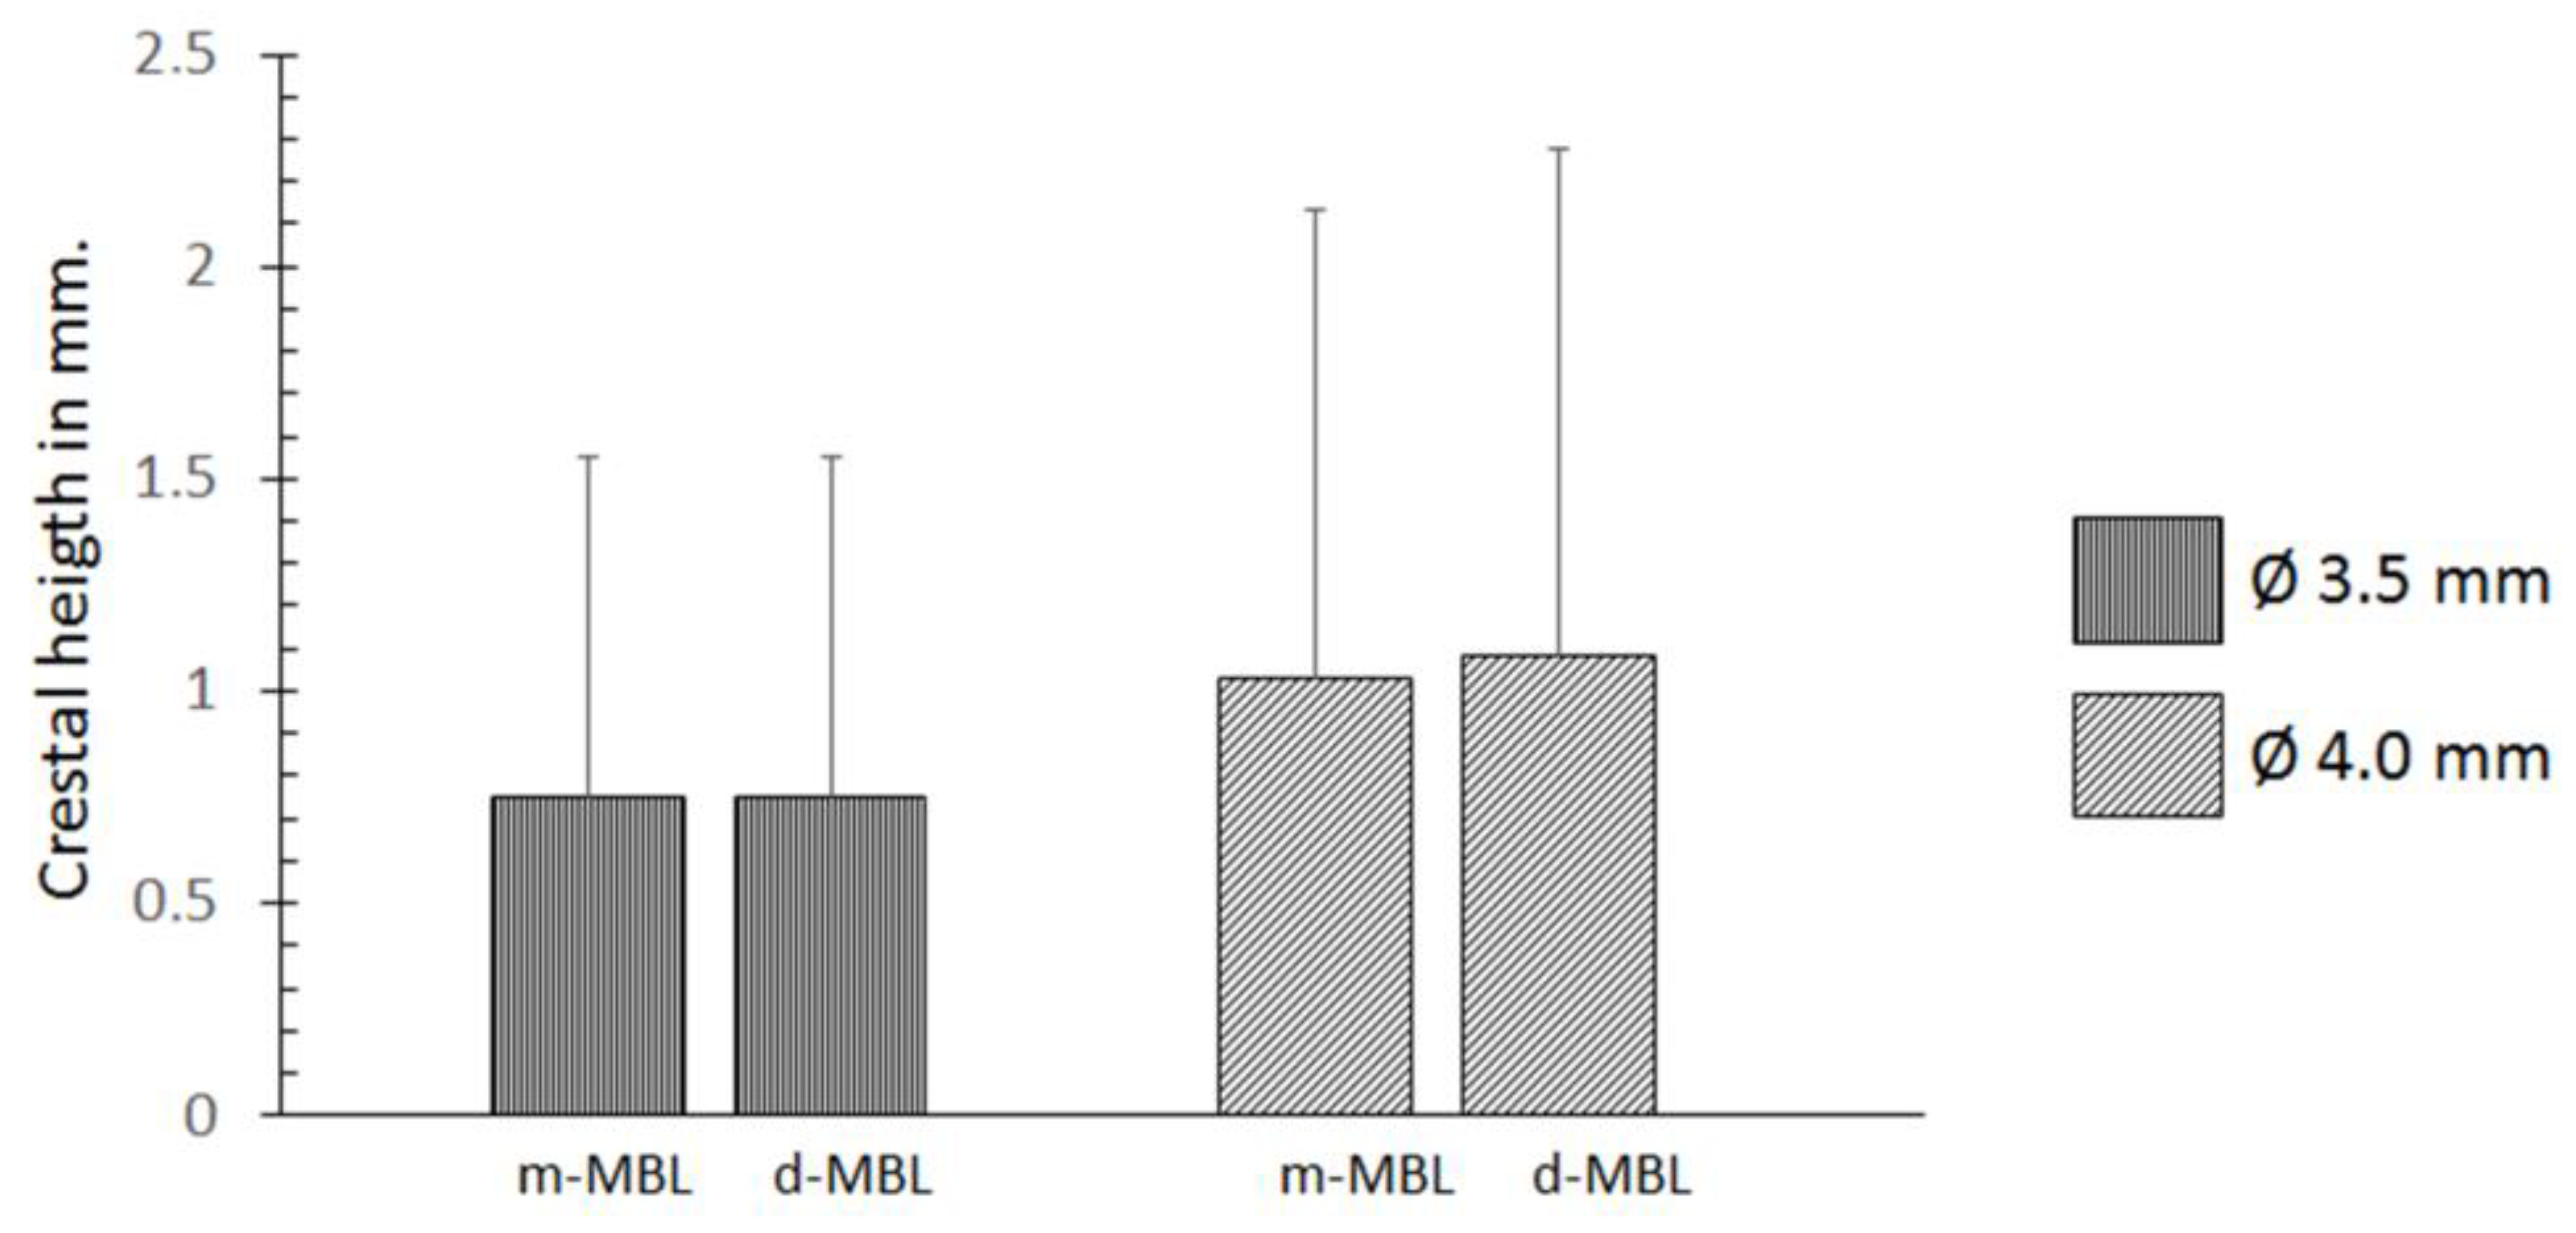
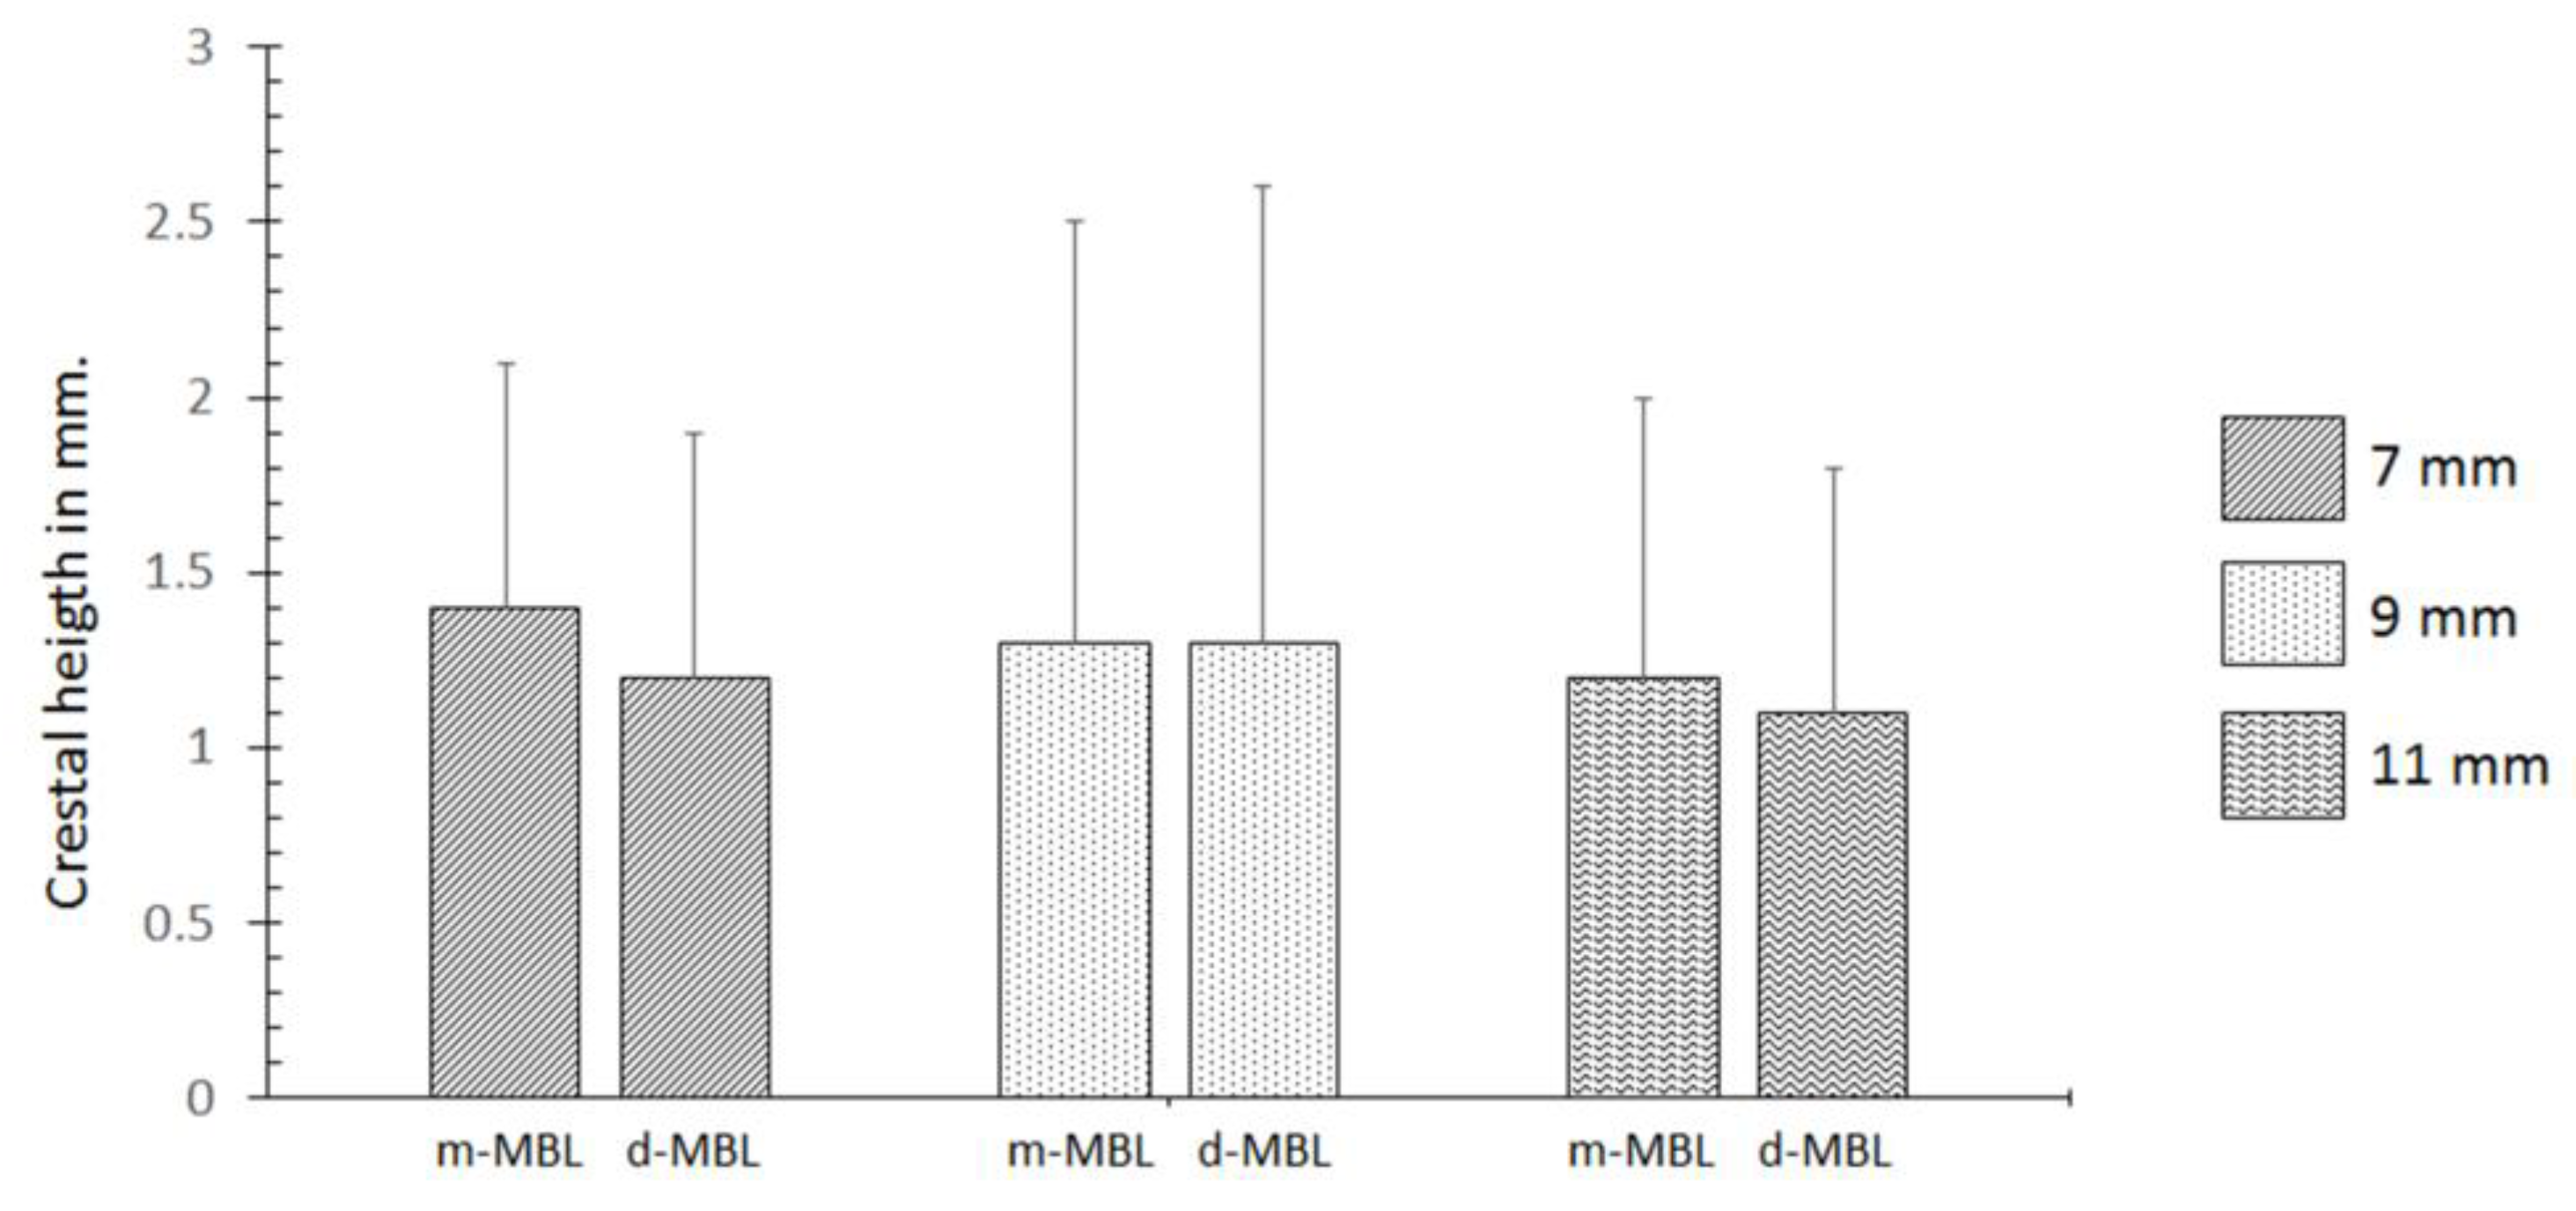
The methodology and statistical data analyses were reviewed by an independent statistician. The outcomes were longitudinally analyzed among the two initial stability of the implants (ISQ) tests and the bone level between the variables using the one-way analysis of variance (ANOVA) test for repeated measures. The comparison between the clinical and radiographic measurements was performed using the z-test for unpaired samples. The Kolmogorov-Smirnov normality test and the Levene’s homogeneity of variance test were used. For bivariate analysis, Mann-Whitney U, and Students-t tests were used. Repeated-measures ANOVA was used to analyze the reduction in marginal bone loss. All comparison analysis was performed using GraphPad Prism 5 software for Windows (GraphPad Software, San Diego, CA, USA). The level of significance was set at α = 0.05.

3. Results

The mean and standard deviation of the absolute values of all profile points (Ra) was 0.87 ± 0.14 μm, the root-mean-square of the values of all points (Rq) was 1.12 ± 0.18 μm, and the average value of the absolute heights of the five highest peaks and the depths of the five deepest valleys (Rz) was 5.14 ± 0.69 μm. In the Figure 2 are showed the implant macro design and the surface images of the morphology.
A total of 60 conical implants of Morse taper connections were installed and the evaluated variables were the diameter of 3.5 mm (n = 17) and 4 mm (n = 43), the different lengths that ranged from 7 mm (n = 21), 9 mm (n = 24), and 11 mm (n = 15) and the mucosa thickness MT1 (n = 19), MT2 (n = 24), and MT3 (n = 17). Thirty patients (18 women and 12 men; ages from 20 to 63 years) received dental implants. After the initial period of 90 days, only one implant was loose throughout the study period and re-implanted with success. Then, the analysis was performed with a total implant quantity (60 implants). No patient dropout was observed during the observation period.
The analyses between the radiographic and clinical measurements showed similar values for the mucosal thickness, no presenting statistical differences (p = 0.634), with a mean and standard deviation of 2.26 ± 0.72 and 2.34 ± 1.27, for clinical and radiographic measurements, respectively. The Figure 3 show a box plots graph to compare the measured values and the Figure 4 shows the clinical and radiographic representative image of these measurements.
The measured ISQ values showed an overall mean and standard deviation in each proposed time as following: In time t1 was 63.6 ± 2.90 (95% CI: 53 to 70) and in t2 was 69.0 ± 4.14 (95% CI: 49 to 75). The values (mean, SD, and median) are summarized in the Table 1. Figure 5 showed a box-plots graph of the ISQ evolution in each time. No statistical difference of ISQ was observed regarding the implant diameter and length (p > 0.05). However, comparing the values of t1 versus t2, an expected statistical difference was found (p < 0.0001).
The comparative data measured between mesial and distal marginal bone loss with the observed variables. Overall mean of mesial and distal MBL were 1.11 ± 1.16 mm and 1.11 ± 1.15 mm, respectively, resulted in non-statistically significant differences (p > 0.05). The comparison of the bone loss between the patient’s sex showed non-statistically significant differences (p > 0.05), where the woman patient’s show an MBL mean value of 1.1 ± 1.25 mm and the man patient´s 1.0 ± 0.93 mm. The images of the Figure 6 show a sequence of measurements of the MBL.
Regarding the implant dimensions, the diameter showed a mean value of MBL in 0.73 ± 0.8 mm for the implants of 3.5 mm and 1.05 ± 1.1 mm for the implant of 4.0 mm, with significant statistical difference (p < 0.001). The bar graph of the Figure 7 shows the values of mesial and distal MBL measurements.
However, the MBL values measured at different implant lengths showed very similar values (Figure 8), without statistically significant differences (p > 0.05).
The mucosal thickness (MT1, MT2, and MT3) resulted in statistically significant differences (p < 0.05). The mean value of MBL in the MT1 was 1.5 ± 0.8 mm, in the MT2 was 0.75 ± 0.5 and in the MT3 was 0.9 ± 0.8 mm. The bar graph of the Figure 9 shows the values for mesial and distal measurements. In general, the better behavior was observed in the MT2 (mucosal thickness between 2.1 and 3.0 mm), with 0.7 ± 0.6 mm for m-MBL and 0.8 ± 0.5 mm for d-MBL.

4. Discussion

This clinical study describes an analysis the marginal bone behavior considering of different variables after the implants installed in the posterior area of mandible: Patient sex, implant dimensions (diameter and length), and mucosa thickness. One implant was loose throughout the study period and re-implanted, and the survival rate of dental implants considered was of 98.3%. This study was made without patient selection, the only criterion was the posterior inferior region selection, this makes a random distribution of the ridges with the difficulty of achieving uniformity in the height and width of the ridge and the trouble of achieving the 2 mm of supracrestal bone in all cases, as well as having bone in around the 100% of the perimeter, simply because of the anatomy of the area. These could be factors that may affect the mucosal position and the behavior around the implant.
All implants measured the mucosa thickness on the radiographic images and compared with the clinical measurements, and the results confirmed no statistical differences among these collected data. Then, the measurement of the mucosa in radiographic images can be used for planification of the implant position (depth position). Therefore, the ISQ and the bone height in relation of the implant platform were measured immediately after the implant placement (baseline) and after 90 days. The relation of the marginal bone behavior and the variables with significant statistical differences are discussed separately follow.
Surface topography refers to the degree of surface roughness and the orientation of surface irregularities, which can directly stimulate osseointegration, increasing and/or accelerating the events involved in this process [8,21]. In this sense, we use implants with a surface roughness considered moderate, similar to that used by many other brands of implants. This data is important so that in future studies researchers can compare their results or reproduce in new investigations. In addition, since stability measurements were taken 90 days after implantation, the results are directly affected by the type of surface used in the implants.

4.1. Initial Implant Stability

The initial stability of the implants, a measure that can be represented by ISQ, is of fundamental importance for osseointegration. Several studies describe a direct relationship between bone density and measured ISQ values [23,24,25,26,27]. Both the thickness of the cortical bone and the pattern presented by the medullary portion (trabecular), which are in contact with the installed implant, are determinant factors for stability (bone and implant contact) [28]. The aim of this study was to observe the consequences of the placing Morse taper implants subcrestally and the relation between bone remodeling and soft tissue thickness. The initial results in these three months of studies show that the sectors in which the mucosal thickness was 1 to 2 mm suffered greater bone remodelation compared to the sectors where the width of the soft tissue was 2 mm or more.
The clinical methods that are commonly used to verify implant stability and osseointegration include percussion, mobility, and radiographic studies. However, these methods have an important limitation in their standardization, since they have a great dependence on the sensitivity and susceptibility with respect to the professional executor [29,30]. In this sense, more precise and non-invasive techniques were developed. These analyzes are called according to the method by which they are performed, i.e., resonance frequency analysis (RFA), and are used to verify and measure the stability of implants installed in bone tissue at different clinical periods [30,31]. The use of this technique is mainly based on being easy to perform, fast, and direct and, moreover, can be applied routinely in the clinic because it does not present discomfort to the patient.
The measured values of ISQ varied during the phases of osseointegration evaluated. At the trans-operative time, the mean and standard deviations of the ISQ values measured was 63.6 ± 2.90 varying of 53 to 70, indicating adequate primary stability, similar to the results reported in other studies that presented averages from 60.3 to 62.6 [31,32,33,34]. While, in the second time measured, 90 days after the implantations, the means and standard deviations of the ISQ values was 69.7 ± 7.09 varying of 49 to 75. Such overall result for the ISQ values for the time of 90 days are within the mean values shown in several similar studies, where the values varied from 67.0 to 72.1 [31,32,35,36].

4.2. Mucosal Thickness

Linkevicius and colleagues studied the main factors related with the bone remodeling [2,3], understanding and trying to make a relation between mechanic factors and mucosal thickness. Isolating the connection factor even when this was 2 mm supracrestal and the mucosa was thin, there was bone remodeling consequence of the biological width formation [2]. Using implants with platform switching concept did not prevent the bone remodeling also when the mucosal thickness shows little thickness [3,4]. The use of Morse-cone implants for this study is based on the minimal number of microorganisms penetrating the implant/abutment microgap as well as the absence of movement [37]. This rigid type of connection eliminates a potential remodeling bone factor and with the subcrestal position opens a new way in which the biologic width can be conformed [37,38,39,40]. Studies showed the possibility of having no bone remodeling reaction at the abutment-implant interface and making a new configuration of the biological space and the mucosa characteristics surrounding the implant [41,42,43,44].
The results are in agreement with the studies mentioned previously, although in our study the evaluation time was less than one year, the first case (MT1), where the mucosa was between 1 and 2 mm, suffered much more bone loss than de MT2 and MT3 where the mucosal width was two or more millimeters. The group MT2 and MT3 had very similar measures in respect of bone remodeling. However, the MT3 not show superior behavior in comparison with the MT1 and MT2, possibly because in this group the biological space exceeded the value considered ideal for the position of implant-abutment junction (IAJ). Conversely, controversial information is available regarding implants placed subcrestally. Some authors recommended placement of the implant platform 1 or 2 mm below the alveolar crest to better maintain marginal bone levels [45,46]. However, other studies reported an increased extension of inflammatory infiltrate due to deep positioning of the IAJ, resulting in greater MBL compared to implants placed equicrestally [47,48]. In the case of implants with mucosal thickness 3 mm (MT3), added to 2 mm positioning subcrestal implants, the final positioning distance of the AIJ was greater than 5 mm, which probably explains the behavior of the implants in this condition.
Clinically the time bone loss around implants can influence the planned aesthetic results, mainly because it alters the final positioning of the tissue because its final volume decreased.

4.3. Implant Dimensions (Diameter and Length)

Several studies showed that the implant dimensions have direct influence on the stress distribution to the bone [41,42,43,44,45] as the implant directly affects the area of possible bone retention [49]. Moreover, other authors have advocated the use of implants as long and wide as possible [50]. However, when bone loss around the implants was evaluated, there is a controversy regarding the influence of length in these alterations, and some studies present results of larger losses in the short implants, other authors report that the length of the implant has little influence on the quantity of vertical load stress, and may have a lower effect on the distribution of stresses to bone tissue when compared to the variation in implant diameter [49,51]. In this way, Koutouzis and collaborates not found statistical difference in the values of bone resorption in larger diameter implants, comparing small diameter (3.5 mm) with larger diameter (4.5 mm) [52]. Unlike most of the cited reports, an important fact that the research revealed was the better behavior of the 3.5 mm implants when compared to the 4.0 mm diameter implants in terms of bone remodeling, that is, the smaller implants diameters showed lower bone resorption. On the other hand, when the implants were compared in terms of length (7, 9, and 11 mm), the results obtained in the present study did not present statistical differences, with very similar values among the sizes used. However, in the present study the implants evaluated were not placed under masticatory loads, which may be the reason for the difference in results between the studies. Previous FEA studies have shown that a decrease in diameter increases the stress transferred to crestal bone [53].

5. Conclusions

Within the limitations of this prospective study, although in our study the evaluation time was short after the implantation, we concluded that cone Morse implants placed 2 mm subcrestal level showed different values of bone loss depending of the mucosal thickness and implant diameter. However, the initial stability and implant length not showed influence on the marginal bone loss.

Author Contributions

Conceptualization, J.C.P.-F.; Data curation, S.A.G., M.B. and J.A.; Formal analysis, S.A.G. and J.C.P.-F.; Investigation, M.B. and J.A.; Methodology, J.L.C.-G., S.A.G. and J.C.P.-F.; Project administration, M.B., J.L.C.-G.; Resources, J.A.; Software, M.B. and J.A.; Supervision, S.A.G. and J.C.P.-F.; Visualization, J.C.P.-F.; Writing—original draft, M.B. and J.A.; Writing—review and editing, J.L.C.-G. and S.A.G.

Funding

This research received no external funding.

Acknowledgments

The authors are grateful to the Paulo Rossetti from the Dental School of the University of São Paulo, Bauru, Brazil, for their kind support as independent statistician. The authors are grateful to Implacil De Bortoli (São Paulo, Brazil) for the products support.

Conflicts of Interest

The authors declare no conflict of interest.

References

  1. Berglundh, T.; Lindhe, J. Dimension of the periimplant mucosa. Biological width revisited. J. Clin. Periodontol. 1996, 23, 971–973. [Google Scholar] [CrossRef] [PubMed]
  2. Linkevicius, T.; Apse, P.; Grybauskas, S.; Puisys, A. The influence of soft tissue thickness on crestal bone changes around implants: A 1-year prospective controlled clinical trial. Int. J. Oral Maxillofac. Implant. 2009, 24, 712–719. [Google Scholar]
  3. Linkevicius, T.; Apse, P.; Grybauskas, S.; Puisys, A. Influence of thin mucosal tissues on crestal bone stability around implants with platform switching: A 1-year pilot study. J. Oral Maxillofac. Surg. 2010, 68, 2272–2277. [Google Scholar] [CrossRef] [PubMed]
  4. van Eekeren, P.; Tahmaseb, A.; Wismeijer, D. Crestal bone changes in macrogeometrically similar implants with the implant-abutment connection at the crestal bone level or 2.5 mm above: A prospective randomized clinical trial. Clin. Oral Implant. Res. 2016, 27, 1479–1484. [Google Scholar] [CrossRef] [PubMed]
  5. Linkevicius, T.; Puisys, A.; Svediene, O.; Linkevicius, R.; Linkeviciene, L. Radiological comparison of laser-microtextured and platform-switched implants in thin mucosal biotype. Clin. Oral Implant. Res. 2015, 26, 599–605. [Google Scholar] [CrossRef]
  6. Puisys, A.; Linkevicius, T. The influence of mucosal tissue thickening on crestal bone stability around bone-level implants. A prospective controlled clinical trial. Clin. Oral Implant. Res. 2015, 26, 123–129. [Google Scholar] [CrossRef]
  7. Linkevicius, T.; Puisys, A.; Steigmann, M.; Vindasiute, E.; Linkeviciene, L. Influence of Vertical Soft Tissue Thickness on Crestal Bone Changes Around Implants with Platform Switching: A Comparative Clinical Study. Clin. Implant Dent. Relat. Res. 2015, 17, 1228–1236. [Google Scholar] [CrossRef]
  8. Gehrke, S.A.; da Silva Neto, U.T. Evaluation of the Surface Treatment on Bone Healing in a Transmucosal 1-mm Area of Implant Abutment: An Experimental Study in the Rabbit Tibia. Clin. Implant Dent. Relat. Res. 2016, 18, 489–497. [Google Scholar] [CrossRef]
  9. van Eekeren, P.J.; Tahmaseb, A.; Wismeijer, D. Crestal Bone Changes Around Implants with Implant-Abutment Connections at Epicrestal Level or Above: Systematic Review and Meta-Analysis. Int. J. Oral Maxillofac. Implant. 2016, 31, 119–124. [Google Scholar] [CrossRef]
  10. Schwarz, F.; Hegewald, A.; Becker, J. Impact of implant-abutment connection and positioning of the machined collar/microgap on crestal bone level changes: A systematic review. Clin. Oral Implant. Res. 2014, 25, 417–425. [Google Scholar] [CrossRef]
  11. Hermann, J.S.; Schoolfield, J.D.; Schenk, R.K.; Buser, D.; Cochran, D.L. Influence of the size of the microgap on crestal bone changes around titanium implants. A histometric evaluation of unloaded non-submerged implants in the canine mandible. J. Periodontol. 2001, 72, 1372–1383. [Google Scholar] [CrossRef] [PubMed]
  12. Zanatta, L.C.; Dib, L.L.; Gehrke, S.A. Photoelastic stress analysis surrounding different implant designs under simulated static loading. J. Craniofacial Surg. 2014, 25, 1068–1071. [Google Scholar] [CrossRef] [PubMed]
  13. Stein, A.E.; McGlmphy, E.A.; Johnston, W.M.; Larsen, P.E. Effects of implant design and surface roughness on crestal bone and soft tissue levels in the esthetic zone. Int. J. Oral Maxillofac. Implant. 2009, 24, 910–919. [Google Scholar]
  14. Schmitt, C.M.; Nogueira-Filho, G.; Tenenbaum, H.C.; Lai, J.Y.; Brito, C.; Döring, H.; Nonhoff, J. Performance of conical abutment (Morse Taper) connection implants: A systematic review. J. Biomed. Mater. Res. Part A 2014, 102, 552–574. [Google Scholar] [CrossRef] [PubMed]
  15. Baj, A.; Bolzoni, A.; Russillo, A.; Lauritano, D.; Palmieri, A.; Cura, F.; Silvestre, F.J.; Giannì, A.B. Cone-morse implant connection system significantly reduces bacterial leakage between implant and abutment: An in vitro study. J. Biol. Regul. Homeost. Agents 2017, 31, 203–208. [Google Scholar] [PubMed]
  16. Gehrke, S.A.; Delgado-Ruiz, R.A.; Prados Frutos, J.C.; Prados-Privado, M.; Dedavid, B.A.; Granero Marín, J.M.; Calvo Guirado, J.L. Misfit of Three Different Implant-Abutment Connections Before and After Cyclic Load Application: An in Vitro Study. Int. J. Oral Maxillofac. Implant. 2017, 32, 822–829. [Google Scholar] [CrossRef] [PubMed]
  17. Hanaoka, M.; Gehrke, S.A.; Mardegan, F.; Gennari, C.R.; Taschieri, S.; Del Fabbro, M.; Corbella, S. Influence of implant/abutment connection on stress distribution to implant-surrounding bone: A finite element analysis. J. Prosthodont. 2014, 23, 565–571. [Google Scholar] [CrossRef] [PubMed]
  18. Albrektsson, T.; Zarb, G.; Worthington, P.; Eriksson, A.R. The long-term efficacy of currently used dental implants: A review and proposed criteria of success. Int. J. Oral Maxillofac. Implant. 1986, 1, 11–25. [Google Scholar]
  19. Albrektsson, T.; Chrcanovic, B.; Östman, P.O.; Sennerby, L. Initial and long-term crestal bone responses to modern dental implants. Periodontology 2000 2017, 73, 41–50. [Google Scholar] [CrossRef]
  20. Sasada, Y.; Cochran, D.L. Implant-Abutment Connections: A Review of Biologic Consequences and Peri-implantitis Implications. Int. J. Oral Maxillofac. Implant. 2017, 32, 1296–1307. [Google Scholar] [CrossRef] [Green Version]
  21. Gehrke, S.A.; Ramírez-Fernandez, M.P.; Granero Marín, J.M.; Barbosa Salles, M.; Del Fabbro, M.; Calvo Guirado, J.L. A comparative evaluation between aluminium and titanium dioxide microparticles for blasting the surface titanium dental implants: An experimental study in rabbits. Clin. Oral Implant. Res. 2018, 29, 802–807. [Google Scholar] [CrossRef] [PubMed]
  22. Salatti, D.B.; Pelegrine, A.A.; Gehrke, S.; Teixeira, M.L.; Moshaverinia, A.; Moy, P.K. Is there a need for standardization of tightening force used to connect the transducer for resonance frequency analysis in determining implant stability? Int. J. Oral Maxillofac. Implant. 2019, 34, 886–890. [Google Scholar] [CrossRef] [PubMed]
  23. Balleri, P.; Cozzolino, A.; Ghelli, L.; Momichioli, G.; Varriale, A. Stability measurements of osseointegrated implants using Osstell in partially edentulous jaws after one year of loading: A pilot study. Clin. Implant. Dent. Relat. Res. 2002, 4, 128–132. [Google Scholar] [CrossRef] [PubMed]
  24. Barewal, R.M.; Oates, T.W.; Meredith, N.; Cochran, D.L. Resonance frequency measurement of implant stability in vivo on implants with a sandblasted and acid-etched surface. Int. J. Oral Maxillofac. Implant. 2003, 18, 641–651. [Google Scholar]
  25. Bischof, M.; Nedir, R.; Szmukler-Moncler, S.; Bernard, J.P.; Samson, J. Implant stability measurement of delayed and immediately loaded implants during healing. Clin. Oral Implant. Res. 2004, 15, 529–539. [Google Scholar] [CrossRef] [PubMed]
  26. Nedir, R.; Bischof, M.; Szmulzkler-Moncler, S.; Bernard, J.P.; Samson, J. Predicting osseointegration by means of implant primary stability: A resonance frequency analysis with delayed and immediately loaded ITI SLA implants. Clin. Oral Implant. Res. 2004, 15, 520–528. [Google Scholar] [CrossRef] [PubMed]
  27. Oates, T.W.; Valderrama, P.; Bischof, M.; Nedir, R.; Jones, A.; Simpson, J.; Toutenburg, H.; Cochran, D.L. Enhanced implant stability with a chemically modified SLA surface: A randomized pilot study. Int. Oral Maxillofac. Implant. 2007, 22, 755–760. [Google Scholar]
  28. Meredith, N. Assessment of implant stability as a prognostic determinant. Int. J. Prosthodont. 1998, 11, 491–501. [Google Scholar]
  29. Fischer, K.; Bäckström, M.; Sennerby, L. Immediate and early loading of oxidized tapered implants in the partially edentulous maxilla: A 1-year prospective clinical, radiographic, and resonance frequency analysis study. Clin. Implant. Dent. Relat. Res. 2009, 11, 69–80. [Google Scholar] [CrossRef]
  30. Meredith, N.; Book, K.; Friberg, B.; Jemt, T.; Sennerby, L. Resonance frequency measurements of implant stability in vivo. A crosssectional and longitudinal study of resonance frequency measurements on implants in the edentulous and partially dentate maxilla. Clin. Oral Implant. Res. 1997, 8, 226–233. [Google Scholar] [CrossRef]
  31. Gehrke, S.A.; da Silva Neto, U.T.; Rossetti, P.H.; Watinaga, S.E.; Giro, G.; Shibli, J.A. Stability of implants placed in fresh sockets versus healed alveolar sites: Early findings. Clin. Oral Implant. Res. 2016, 27, 577–582. [Google Scholar] [CrossRef] [PubMed]
  32. Gehrke, S.A.; Tavares da Silva Neto, U. Does the time of osseointegration in the maxilla and mandible differ? J. Craniofacial Surg. 2014, 25, 2117–2120. [Google Scholar] [CrossRef] [PubMed]
  33. Friberg, B.; Sennerby, L.; Linden, B.; Gröndahl, K.; Lekholm, U. Stability measurements of one-stage Branemark implants during healing in mandibles. A clinical resonance frequency analysis study. Int. J. Oral Maxillofac. Surg. 1999, 28, 266–272. [Google Scholar] [CrossRef]
  34. Zix, J.; Hug, S.; Kessler-Liechti, G.; Mericske-Stern, R. Measurement of dental implant stability by resonance frequency analysis and damping capacity assessment: Comparison of both techniques in a clinical trial. Int. J. Oral Maxillofac. Implant. 2008, 23, 525–530. [Google Scholar]
  35. da Silva Neto, U.T.; Joly, J.C.; Gehrke, S.A. Clinical analysis of the stability of dental implants after preparation of the site by conventional drilling or piezosurgery. Br. J. Oral Maxillofac. Surg. 2014, 52, 149–153. [Google Scholar] [CrossRef] [PubMed]
  36. Gehrke, S.A.; da Silva, U.T.; Del Fabbro, M. Does Implant Design Affect Implant Primary Stability? A Resonance Frequency Analysis-Based Randomized Split-Mouth Clinical Trial. J. Oral Implantol. 2015, 41, e281–e286. [Google Scholar] [CrossRef]
  37. Koutouzis, T.; Neiva, R.; Nair, M.; Nonhoff, J.; Lundgren, T. Cone beam computed tomographic evaluation of implants with platform-switched Morse taper connection with the implant-abutment interface at different levels in relation to the alveolar crest. Int. J. Oral Maxillofac. Implant. 2014, 29, 1157–1163. [Google Scholar] [CrossRef] [PubMed]
  38. Koutouzis, T.; Neiva, R.; Nonhoff, J.; Lundgren, T. Placement of implants with platform-switched Morse taper connections with the implant-abutment interface at different levels in relation to the alveolar crest: A short-term (1-year) randomized prospective controlled clinical trial. Int. J. Oral Maxillofac. Implant. 2013, 28, 1553–1563. [Google Scholar] [CrossRef]
  39. Fetner, M.; Fetner, A.; Koutouzis, T.; Clozza, E.; Tovar, N.; Sarendranath, A.; Coelho, P.G.; Neiva, K.; Janal, M.N.; Neiva, R. The Effects of Subcrestal Implant Placement on Crestal Bone Levels and Bone-to-Abutment Contact: A Microcomputed Tomographic and Histologic Study in Dogs. Int. J. Oral Maxillofac. Implant. 2015, 30, 1068–1075. [Google Scholar] [CrossRef]
  40. Tesmer, M.; Wallet, S.; Koutouzis, T.; Lundgren, T. Bacterial colonization of the dental implant fixture-abutment interface: An in vitro study. J. Periodontol. 2009, 80, 1991–1997. [Google Scholar] [CrossRef]
  41. Welander, M.; Abrahamsson, I.; Berglundh, T. Subcrestal placement of two-part implants. Clin. Oral Implant. Res. 2009, 20, 226–231. [Google Scholar] [CrossRef] [PubMed]
  42. Weng, D.; Nagata, M.J.H.; Bell, M.; Bosco, A.F.; de Melo, L.G.N.; Richter, E.-J. Influence of microgap location and configuration on the periimplant bone morphology in submerged implants. An experimental study in dogs. Clin. Oral Implant. Res. 2008, 19, 1141–1147. [Google Scholar] [CrossRef] [PubMed]
  43. Weng, D.; Nagata, M.J.H.; Leite, C.M.; de Melo, L.G.N.; Bosco, A.F. Influence of microgap location and configuration on radiographic bone loss in nonsubmerged implants: An experimental study in dogs. Int. J. Prosthodont. 2010, 24, 445–452. [Google Scholar]
  44. Pilliar, R.M.; Deporter, D.A.; Watson, P.A.; Valiquette, N. Dental implant design: Effect on bone remodeling. J. Biomed. Mater. Res. 1991, 25, 467–483. [Google Scholar] [CrossRef] [PubMed]
  45. Brunski, J.B. Biomechanical considerations in dental implant design. Int. J. Oral Maxillofac. Implant. 1988, 5, 31–34. [Google Scholar]
  46. Holmgren, E.P.; Seckinger, R.J.; Kilgren, L.M.; Mante, F. Evaluating parameters of osseointegrated dental implants using finite element analysis—A two-dimensional comparative study examining the effects of implant diameter, implant shape, and load direction. J. Oral Maxillofac. Implant. 1998, 24, 80–88. [Google Scholar] [CrossRef]
  47. Meijer, H.J.; Kuiper, J.H.; Starmans, F.J.; Bosman, F. Stress distribution around dental implants: Influence of superstructure, length of implants, and height of mandible. J. Prosthet. Dent. 1992, 68, 96–102. [Google Scholar] [CrossRef]
  48. Iplikcioglu, H.; Akca, K. Comparative evaluation of the effect of diameter, length and number of implants supporting three-unit fixed partial prostheses on stress distribution in the bone. J. Dent. 2002, 30, 41–46. [Google Scholar] [CrossRef]
  49. Himmlova, L.; Dostalova, T.; Kacovsky, A.; Konvickova, S. Influence of implant length and diameter on stress distribution: A finite element analysis. J. Prosthet. Dent. 2004, 91, 20–25. [Google Scholar] [CrossRef]
  50. Winkler, S.; Morris, H.F.; Ochi, S. Implant survival to 36 months as related to length and diameter. Ann. Periodontol. 2000, 5, 22–31. [Google Scholar] [CrossRef]
  51. Misch, C.E. Divisions of available bone. In Contemporary Implant Dentistry, 2nd ed.; Mosby: St Louis, MO, USA, 1999; pp. 91–94. [Google Scholar]
  52. Koutouzis, T.; Fetner, M.; Fetner, A.; Lundgren, T. Retrospective evaluation of crestal bone changes around implants with reduced abutment diameter placed non-submerged and at subcrestal positions: The effect of bone grafting at implant placement. J. Periodontol. 2011, 82, 234–242. [Google Scholar] [CrossRef] [PubMed]
  53. Qian, L.; Todo, M.; Matsushita, Y.; Koyano, K. Effects of implant diameter, insertion depth, and loading angle on stress/strain fields in implant/ jawbone systems: Finite element analysis. Int. J. Oral Maxillofac. Implant. 2009, 24, 877–886. [Google Scholar]
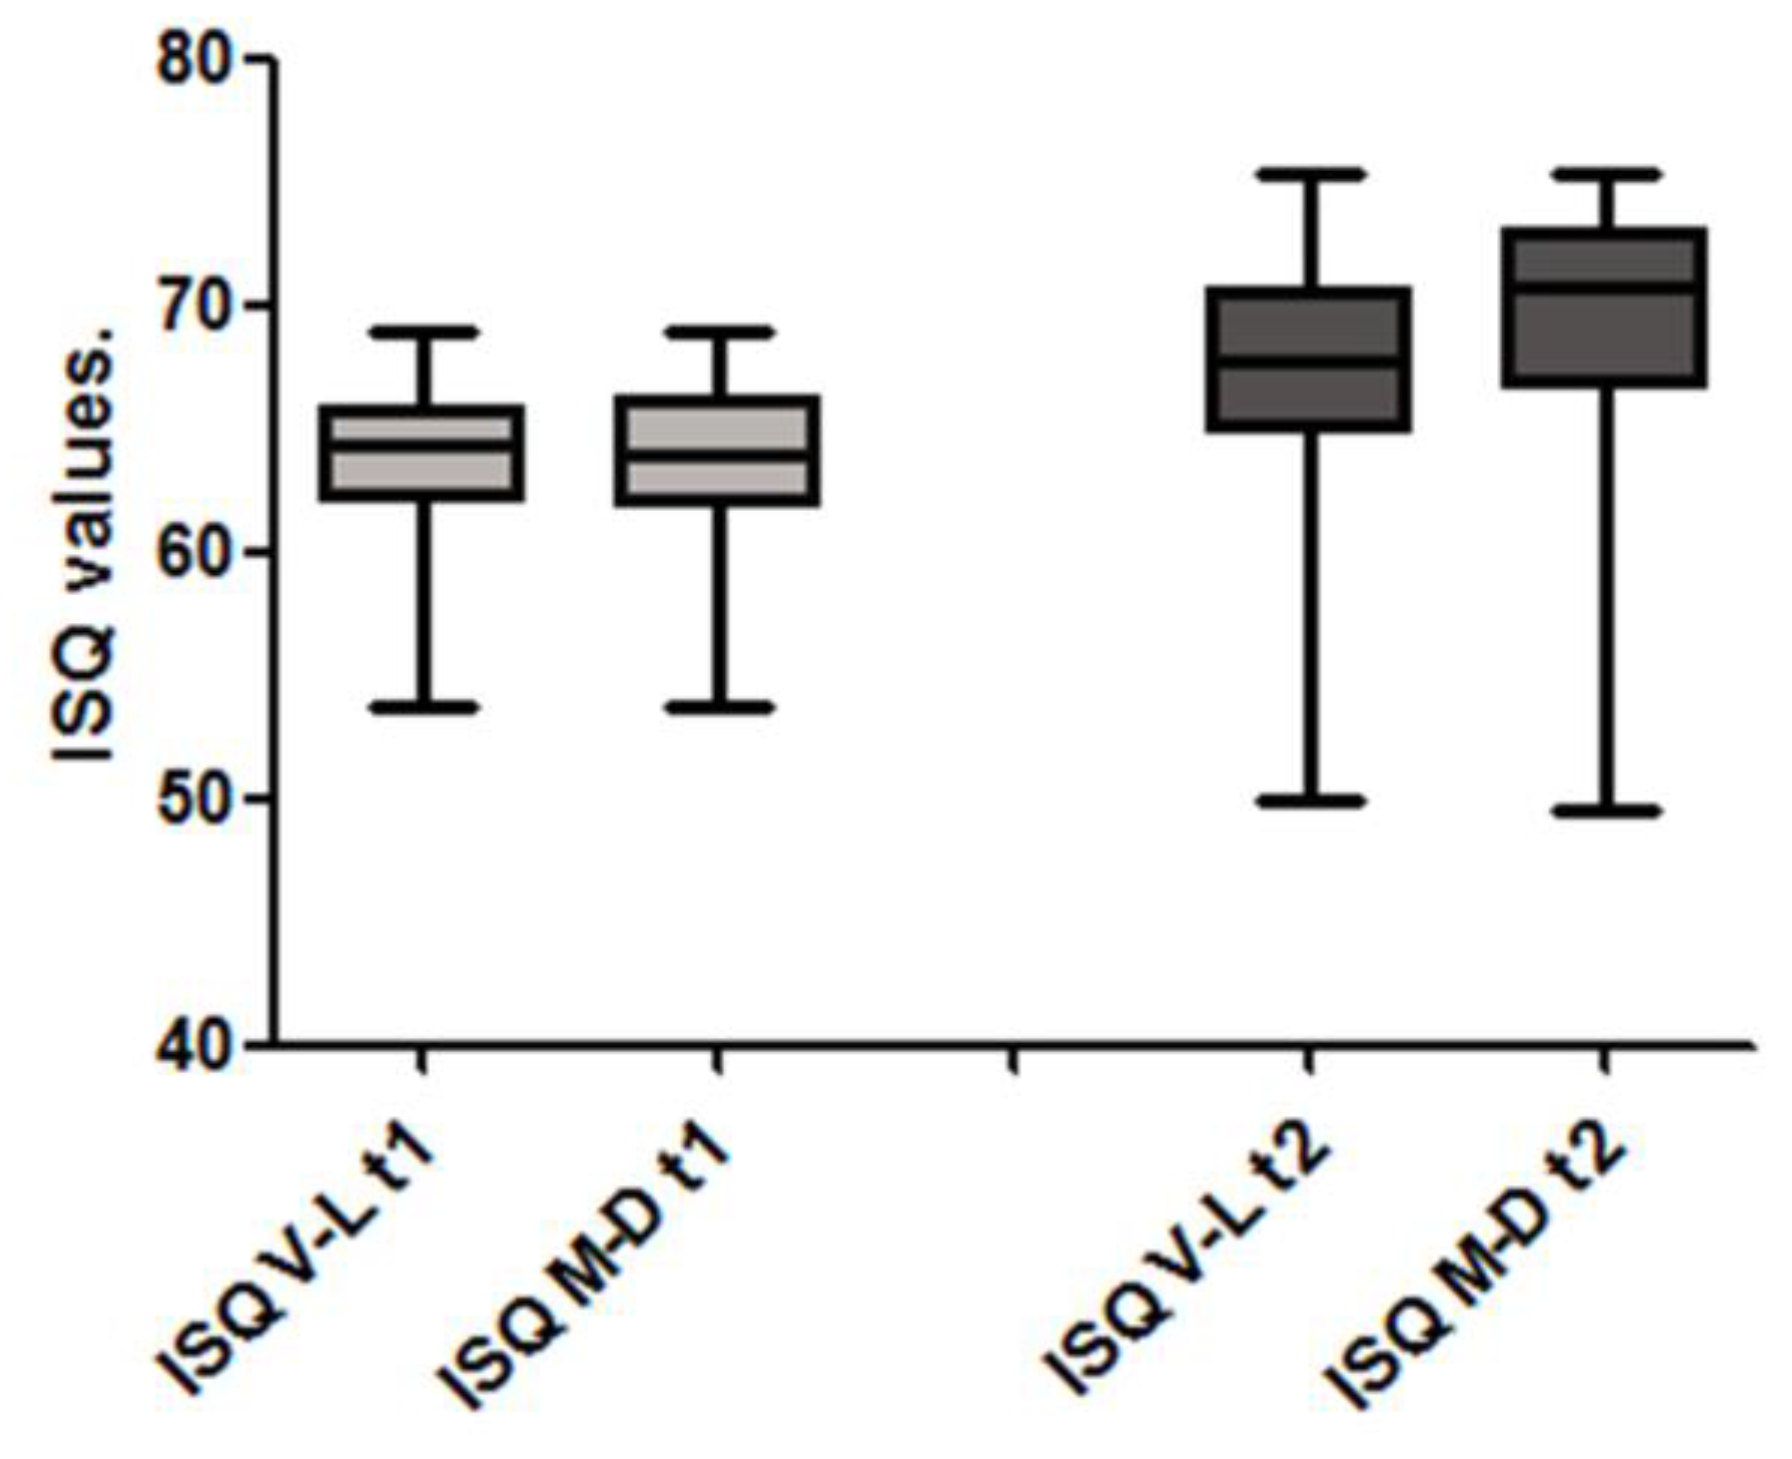
Figure 1. Representative image of the macro design and the connection characteristics of the implants used in the study, respectively.
Symmetry 11 01138 g001
Figure 2. SEM images of the implant surface in different increases.
Symmetry 11 01138 g002
Figure 3. Box-plots graph of the values measured clinical and radiographically.
Symmetry 11 01138 g003
Figure 4. Representative clinical image of the mucosal thickness measurement after the mucosal flap and a periapical x-ray image of the mucosal measurement.
Symmetry 11 01138 g004
Figure 5. Box-plots graph of the ISQ measured values in the time 1 (t1) and time 2 (t2). V-L = vestibule-lingual direction and M-D = mesio-distal direction.
Symmetry 11 01138 g005
Figure 6. Radiograph sequence used to evaluate and measure the bone level. The measurements were performed from the implant platform to the crestal bone (red arrows = m-MBL and green arrows = d-MBL).
Symmetry 11 01138 g006
Figure 7. Bar graph showing the mean and standard deviation of the MBL values measured in mesial (m-MBL) and distal (d-MBL) position of each implant in the two implant diameters.
Symmetry 11 01138 g007
Figure 8. Bar graph showing the mean and standard deviation of the MBL values measured in mesial (m-MBL) and distal (d-MBL) position of each implant in the three implant lengths used.
Symmetry 11 01138 g008
Figure 9. Bar graph showing the mean and standard deviation of the MBL values measured in mesial (m-MBL) and distal (d-MBL) position of each implant in the three mucosal thickness.
Symmetry 11 01138 g009
Table 1. Initial stability of the implants (ISQ) analysis and measurements at initial day (baseline) and 90 days after the implant installation. Results as mean and medians.
ISQ ValueBaseline90 Days
Mean ± SDMedianMean ± SDMedian
Mesio-distal63.4 ± 2.9463.7568.0 ± 3.8569.53
Vestibule-lingual63.7 ± 2.8964.4569.9 ± 4.1470.80

