Adaptive Image Edge Extraction Based on Discrete Algorithm and Classical Canny Operator

College of Computer Science and Electronic Engineering, Hunan University, Changsha 410082, China
*
Author to whom correspondence should be addressed.
Symmetry 2020, 12(11), 1749; https://0-doi-org.brum.beds.ac.uk/10.3390/sym12111749
Submission received: 3 September 2020
/
Revised: 15 October 2020
/
Accepted: 18 October 2020
/
Published: 22 October 2020
(This article belongs to the Special Issue Mathematical Modeling and Computational Methods in Science and Engineering II)
Abstract
:In order to improve the accuracy of image edge detection, this paper studies the adaptive image edge detection technology based on discrete algorithm and classical Canny operator. First, the traditional sub-pixel edge detection method is illustrated based on the related literature research. Then, Canny operator is used for detection, the edge model of the quadric curve is established using discrete data, and the adaptive image edge parameters are obtained using one-dimensional gray moment. Experimental results show that the accuracy of feature detection is 99%, which can be applied to the practice of image edge detection to a certain extent.
1. Introduction
Image edge extraction plays an important role in image recognition and processing. With the rapid development of science and technology, intelligent manufacturing methods are gradually popularized in all walks of life, and the intelligent application of image vision has become very common. For example, the image information to be detected is imported into the computer through the acquisition system, and the computer is used for intelligent analysis of the information collected from the image to extract the required key information [1]. In each process, it is very important to detect and extract the image edges. The accuracy of edge detection can directly affect the contour extraction and object registration [2]. In the manufacturing process of some high precision devices, the accurate registration and recognition of parts have put forward higher precision requirements for the image edge detection and extraction technology [3]. To improve the accuracy of edge detection, the hardware resolution of computer system and the image edge detection technology itself can be improved. Due to the high cost of updating the system, this paper chose to improve the image edge detection and extraction technology and studied adaptive image edge extraction technology based on the discrete algorithm and the classical Canny operator.
In this paper, adaptive image edge extraction technology based on the discrete algorithm and the classical Canny operator is studied. First, the research on image edge detection technology is summarized. Then, the Canny edge detection operator and sub-pixel edge detection method are introduced, and a quadratic curve edge model based on discrete data is proposed. On the basis of Canny edge detection, subpixel edge detection was carried out by using one-dimensional gray moment. Finally, the simulation test and the analysis of the good result for edge detection method are carried out to prove its feasibility.
2. Related Work
Image edge is one of the most basic feature signals in image signal. The basis of image analysis is image edges and also the focus of object analysis by computer vision. The existing image edge detection technology can be divided into pixel level edge detection and sub-pixel edge detection in terms of accuracy [4]. Fernando et al. studied the algorithm of digital image edge detection and proposed a new detection method, which introduced the directional average gradient property of intensity function. Starting from the local detection of images, better detection results can be obtained in a relatively short execution time to ensure that the detected digital images have a higher resolution. Compared with the Canny and Sobel methods, the result of the image processing was similar [5]. Peng et al., in order to solve the problem of low efficiency of image edge detection, proposed an image edge detection algorithm combining least-squares support vector machine and cellular automata. First, the kernel function is constructed by introducing the gaussian radial basis kernel and polynomial kernel to ensure that the least square support vector machine can accurately fit the pixel gray value. Then, the gradient value is obtained through the convolution of gray value, and the cellular automatic part is used to detect the edge of the image through the evolutionary gradient value, which proves that the detection performance of this algorithm is better than the traditional algorithm [6]. Yuan et al. proposed an image edge detection method based on quantum algorithm, designed a quantum comparator, made full use of quantum parallelism, and analyzed all steps of quantum circuit. First, the image is smoothed, then the specular gradient is found, and the edge detection is tracked by quantum algorithm [7]. Sun et al. studies a kind of secondary arc image that is common in an ultra-high-voltage power supply. Therefore, Xu Ya carried out certain noise filtering and image segmentation processing and established a new algorithm to overcome the disadvantages of traditional operators’ difficulty in continuity and false edge, which can effectively eliminate the irrelevant edge and improve the detection accuracy. Experiments show that the algorithm can accurately estimate arc size and radius [8].
Biswas et al. proposed an image edge detection method based on an improved Mooreneighbor algorithm, which improves the Moore neighborhood to make it suitable for image boundary tracking and introduces a range filter to be combined with it for image edge detection. This algorithm can accurately extract the real edge of the object and is robust to noise. Experiments have proven that this algorithm has better detection accuracy for different images in the Berkeley segmentation database [9]. He et al. proposed an image edge detection algorithm based on improved morphological gradient to meet the need of image edge detection in industrial measurement. This algorithm can use structural elements to process image feature information, and the combination of structural elements with different shapes and sizes can obtain better edge detection effect. Experimental results show that the algorithm can extract the edge of noise image more clearly than the traditional algorithm [10]. Wan et al. proposed an integrated strategy of edge retention filter, deeply learning model and edge detection. First, through an adaptive filter, it reduces the original image noise and extracts the spectral feature space, and then the input characteristics of random forest classifier carries on the preliminary training. Moreover, the research extracts the reduced size on the edge of the first principal component, using region growing rules to determine the local area of unmarked pixels, and finally produces the output image [11]. Zhou et al. proposed an improved Sobel operator for edge extraction of quantum images aimed at the representation of generalized quantum images and simultaneously calculated the image intensity and gradient of all pixels without realizing the specific circuit of quantum image edge extraction algorithm. This algorithm has better performance in extracting diagonal edges [12]. Tang et al. proposed an effective method to keep the image edges smooth, which transformed the smoothing problem into a convex objective function with constraints to minimize the problem. The author regularized the garden, and texture pixels were not optimized, so as to better keep the fine edge of the texture region. This method can improve the performance of image processing and task operation and simplify edge extraction [13].
In recent years, a large number of scholars have studied the problem of image edge detection and have put forward different improved methods, which effectively improve the efficiency and accuracy of symmetric or asymmetric image edge detection. In this paper, an adaptive image edge extraction technique combining discrete algorithm and Canny operator is studied.
3. Sub Pixel Edge Extraction Model of Adaptive Image Edge Detection Algorithm Based on Canny Operator
In the process of generating and transmitting digital image, the image will be disturbed by noise, resulting in image quality degradation [14]. Therefore, in order to ensure the normal operation of the operating system, in image processing, it is necessary not only to smooth the overall image noise, but also to protect the image edge [15]. Directional smoothing filter is a basic filter for local direction average filtering in spatial domain. It can calculate the average gray value of different directions by using local region and take the minimum average value as the gray value of the region center. The Kuwahara filter can select four windows in a region, including the central cross distribution of overlapping pixels in the middle four windows, calculate the gray value variance and average value of each window, and use the minimum variance window to replace the average gray value window of the middle pixel and the direction of the pixels in the above image. In this paper, we use discrete algorithm and the classical Canny operator to detect the edge.
Smart edge detection operator is a basic edge detection operator, which can ensure that the real edge loss is less in image detection, and non-edge detection is unlikely to be edge. The detection steps of the Canny operator are as follows. First, the image is processed by Gaussian filtering to remove harmful noise [16]. Then, the gradient amplitude and gradient direction of the image are calculated, and the image edge is thinned using “non-maximum suppression” technology. The threshold technology is used for further processing, and the double threshold iterative method is used to extract the real edge. Assuming the Canny operator uses double threshold method to detect the strong edge and weak edge of the image. When the strong edge and the weak edge are connected together, the weak edge can be retained. This method can effectively reduce the error rate of edge detection and realize the real extraction of strong edge and weak edge. Sub-pixel edge detection technology is a high-precision edge detection algorithm, which is based on the pixel edge. Usually, the traditional edge detection algorithm firstly detects the edge of the image at pixel level. Then, the edge position detected by this method is expanded outward, and the sub-pixel detection method is used to find more accurate edge position [17]. This paper mainly uses the moment-based sub-pixel edge detection method, which is insensitive to noise and uses the moment integral operator to locate the sub-pixel edge.
The basic principle of the gray moment edge location method is to assume that the actual edge distribution in the actual image is consistent with the gray moment of the ideal step edge model, and the position of the actual edge is determined by this relationship [18]. Four parameters of edge variables can be obtained by gray moment. Many research results have been calculated on the mapping circle, and the edge parameters have been calculated by two-dimensional gray moment. The model construction in this paper first needs to establish the one-dimensional step edge, whose expression is
Among them, is the grey value of , and represent the gray values on both sides of the edge, is the location of the edge. In order to be used in digital images, the discrete gray moment is mainly introduced. In continuous images, A one-dimensional continuous gray moment’s definition is , Assuming that and are gray values of and whose percentage of pixels in total pixels n, and meet , then
It can be obtained by combining the above step model with the gray moment:
Among them, represents the actual gray value in the image, represents the total number of pixels.
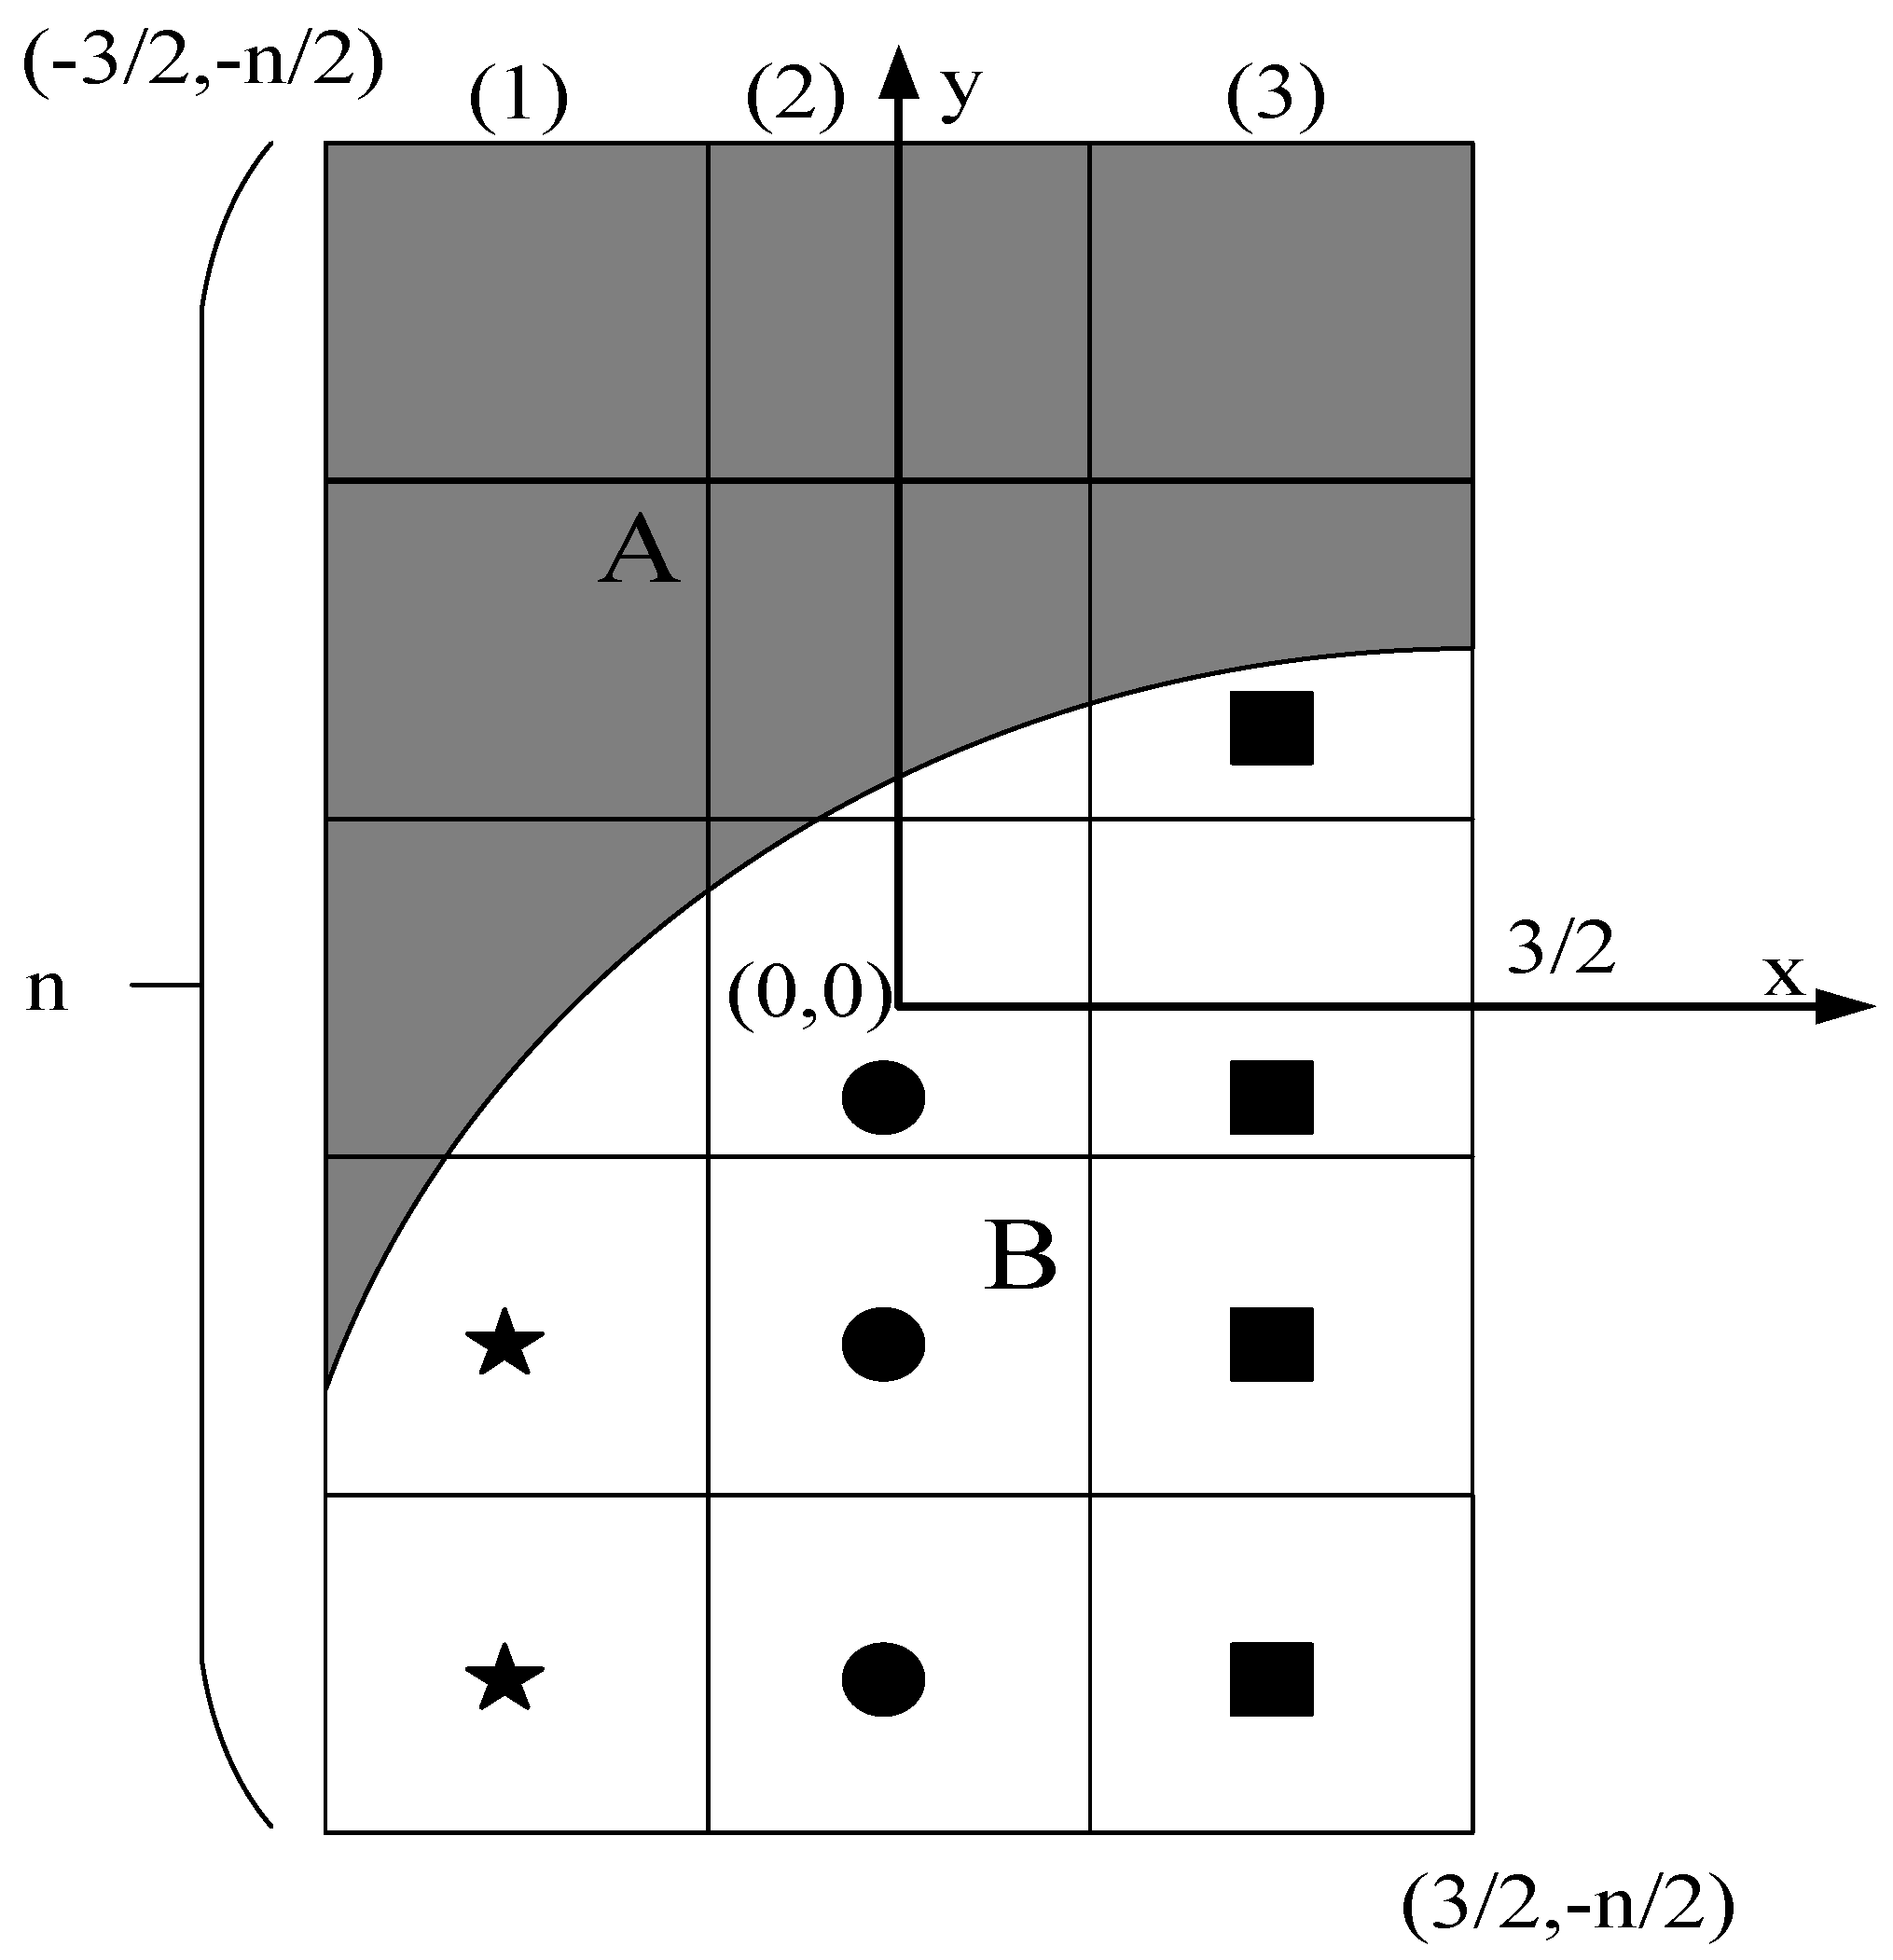
The gray moment edge detection model proposed in this paper is different from the previous two-dimensional gray moment edge detection model, which adopts the curve model based on one-dimensional gray moment. However, most of the current edge detection models adopt the linear model of two-dimensional gray moment. The edge model used in this paper is shown in Figure 1. Part A represents the gray value above the edge conic and part B represents the gray value below the edge conic. (1), (2), (3) represent the corresponding area directly below them (A and B), n represents the length of the area, the pentagram represents the lower part of the edge conic of the corresponding area of (1), the pentagram represents the part below the edge conic of the corresponding area of (1), the circle symbol represents the part below the edge conic of the corresponding area (2), and the square symbol represents the part below the edge conic of the corresponding area (1). In this paper, quadric curve is used as image edge and name, which is defined as follows:
Among them, A, B and C are conic parameters.
First order gray moment of region (1) and second-order gray moment are as shown in Formulas (6) and (7) respectively.
Among them, represents the area proportion of Pentagram sign area in area (1), represents the proportion of area in area (1) above the sign area curve of Pentagram, . Equation (8) is the solution formula of .
Among them, represents the area of area (1). First order gray moment of region (2) and the calculation method of second-order gray moment is the same as Formulas (6) and (7), represents the proportion of circular symbol area in area (2). The solution of , is shown in Equation (9).
Among them, represents the area of area (2). The calculation method of first order gray moment of region (3) and second-order gray moment are the same as Formulas (6) and (7), represents the proportion of circular symbol area in area (3), represents the proportion of the area above the circular symbol area curve in area (3), and the solution of , is as shown in Equation (10).
Among them, represents the area of area (3). Therefore, all curve edge parameters can be calculated as follows.
Among them, , .
The above has introduced the sub-pixel image edge extraction technology based on the discrete algorithm and Canny operator in detail (See the Appendix A for specific programming), and we will use this algorithm to explain the specific process of image processing, as shown in the Figure 2.
4. Experimental Design and Analysis
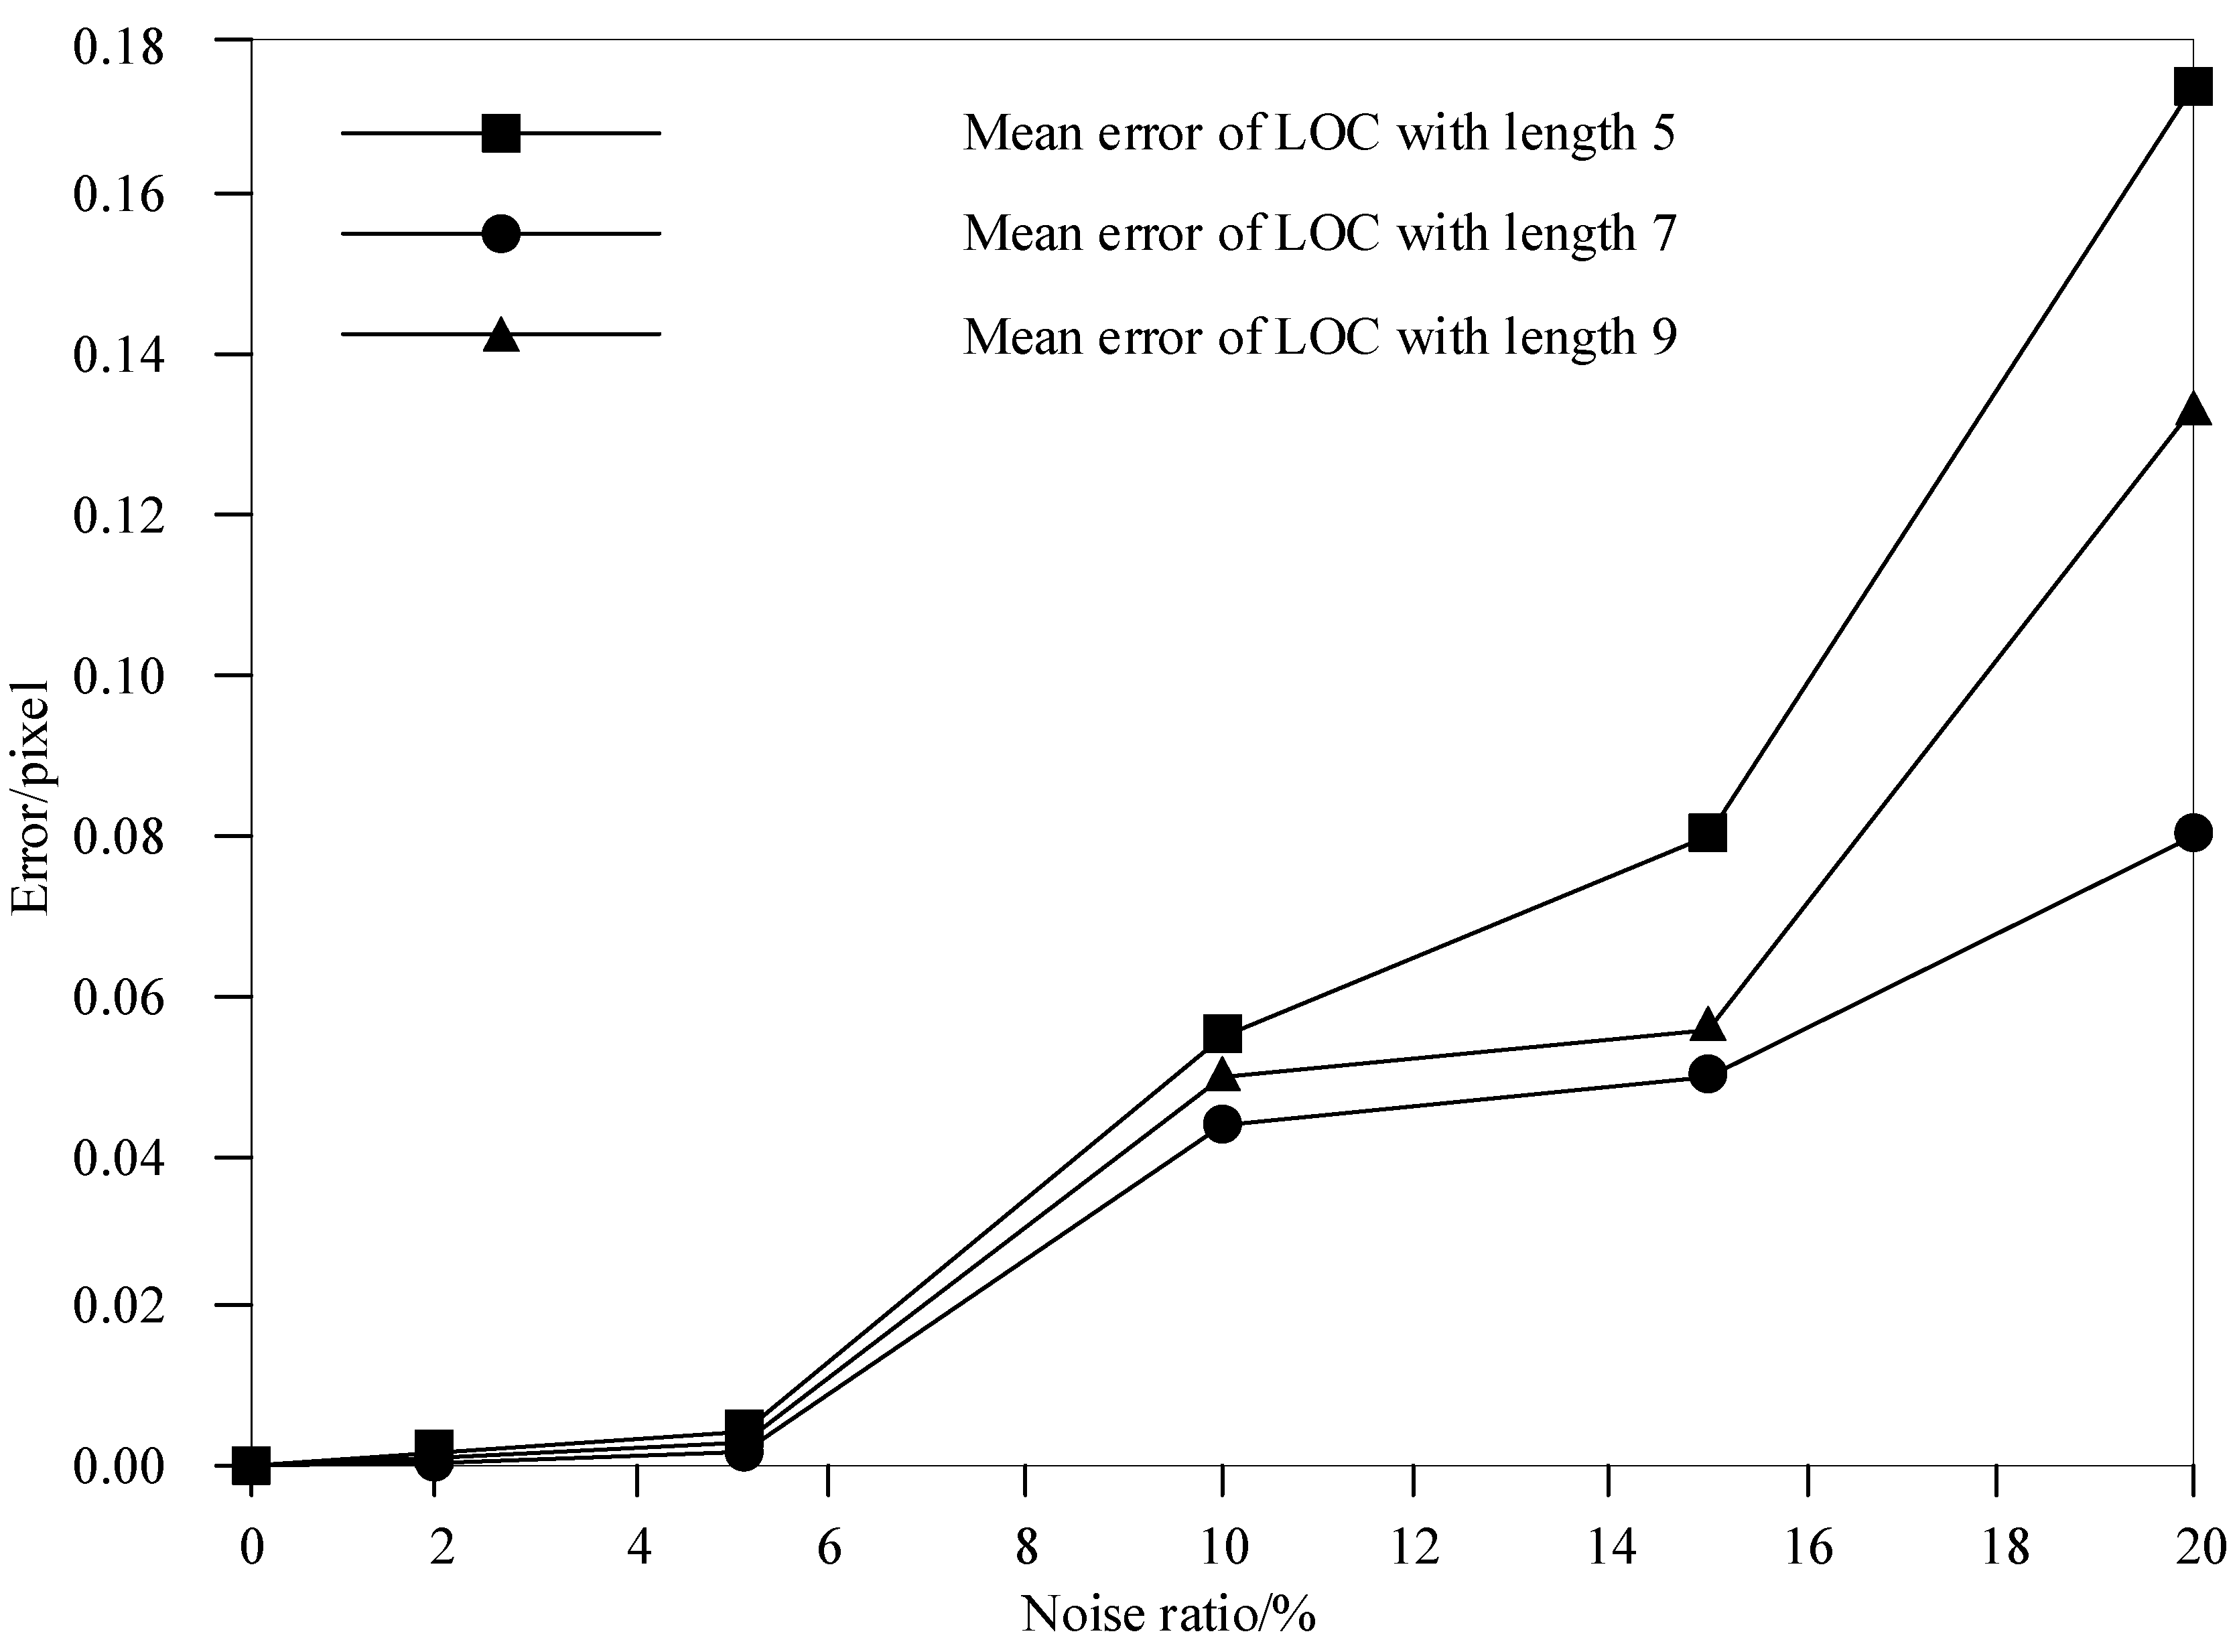
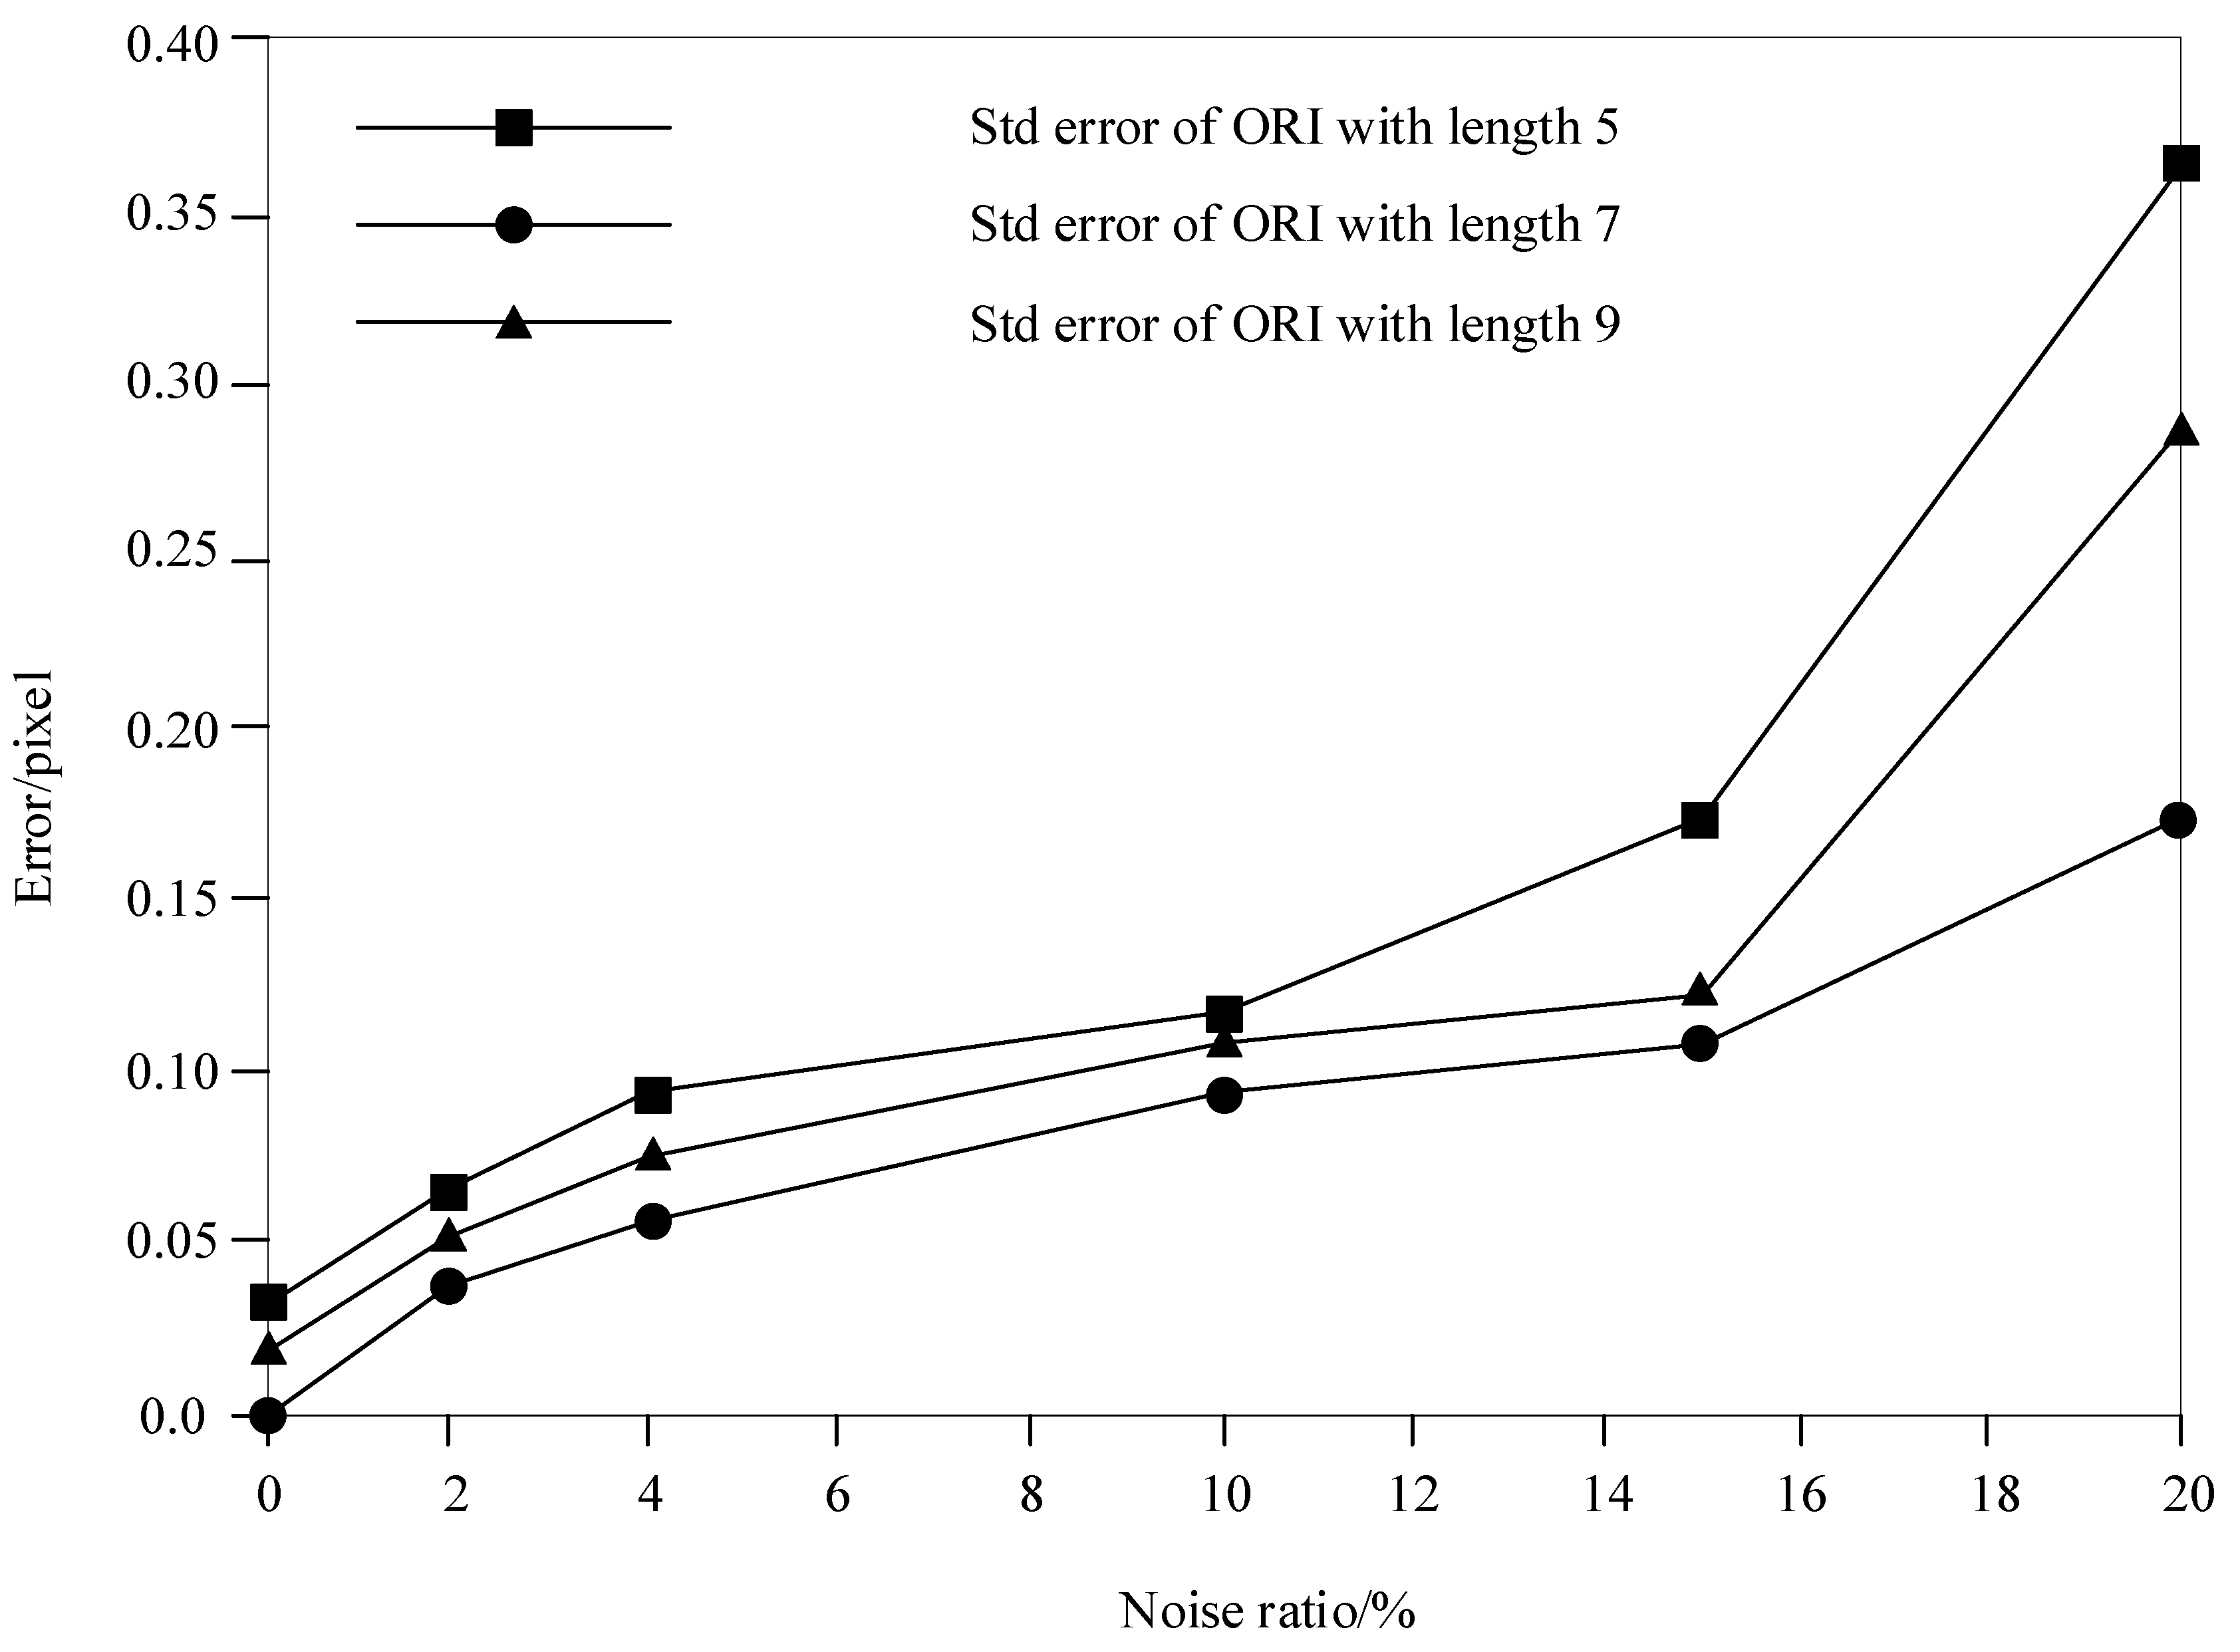
This paper introduces a sub-pixel edge detection method based on one-dimensional gray moment. In the simulation experiment designed in this paper, the main parameters of the computer are aPentium (Intel Corporation, City of Santa Clara, CA, USA)4 2.66 GHz CPU and 1MB of memory. The text algorithm is implemented using the MATLAB 2019 programming tool, and the gray image edge synthesized by Matlab is extracted. When calculating edge parameters, the selection of region length N in Figure 1 is very important. Therefore, we first need to carry out different length n experiments on the synthetic image to select the optimal region length. This paper introduces a definition of noise ratio and edge parameter error. The noise ratio is the ratio of the standard deviation of Gaussian white noise added to the difference between the target object and the background gray value [19]. The edge parameter error is the difference between the edge estimated value and the actual value [20]. In this paper, the definition is combined with the region length, and the optimal region length n is selected by comparison. The specific test results are shown in Figure 2, Figure 3, Figure 4, Figure 5, Figure 6 and Figure 7. Figure 2, Figure 3 and Figure 4 are edge position error detection of different area lengths, and Figure 5, Figure 6 and Figure 7 are edge direction error detection of different area lengths.
Under different region lengths, the detection results of sub-pixel edge detection methods in this paper are different. Observing the maximum error results of edge position under different region lengths in Figure 2, it can be found that when the edge length is 7, the detection effect of the maximum error of pixel under different noise ratios is the best. Observing the average error results of edge position under different area lengths in Figure 3, we can see that when the edge length is 7, the detection effect of the average error of pixels under different noise ratios is the best, the detection effect is the second when the edge length is 9, and the worst when the edge length is 5. Observing the standard deviation results of edge position under different region lengths in Figure 4, it can be found that the pixel error standard deviation detection results are the best when the region length is 7, and it is the worst when the region length is 5.
Observe the edge direction detection results of different area lengths, as shown in Figure 5, which is the maximum error result of edge direction under different area lengths, and we can infer that the best detection effect of the region length is 7, the second one of the region length is 9, and the worst is the region length that is 5. As shown in Figure 6, it is the average error result of edge direction under different area length. Similarly, when the region length is 7, the detection effect of the pixel average error is the best under different noise ratio, and when the region length is 9, the pixel average error detection effect is the second, and when the length is 5, the effect is the worst [21]. As shown in Figure 7, it is the standard deviation result of edge direction under different region length. When the edge length is 7, the standard deviation value of pixel error under different noise ratio is the smallest, and the detection effect is the best. When the edge length is 9, the detection effect is the second, and when the edge length is 5, the effect is the worst.
For the method with small length, the detection effect is the worst. The reason may be that when the size selection is small, there are less elements in the symmetrical or asymmetric image, the amount of information contained is not large, and the data is not complete, which will lead to inaccurate detection results. Of course, if the length is too large, the detection effect will be poor. When the length side is longer, the amount of information in the region increases, the amount of calculation increases, and the complexity increases. At the same time, it may also contain other redundant edge data and excessive noise data, which will have a certain impact on the detection accuracy. Therefore, the length of the detection region selected in this paper is determined to be 7.
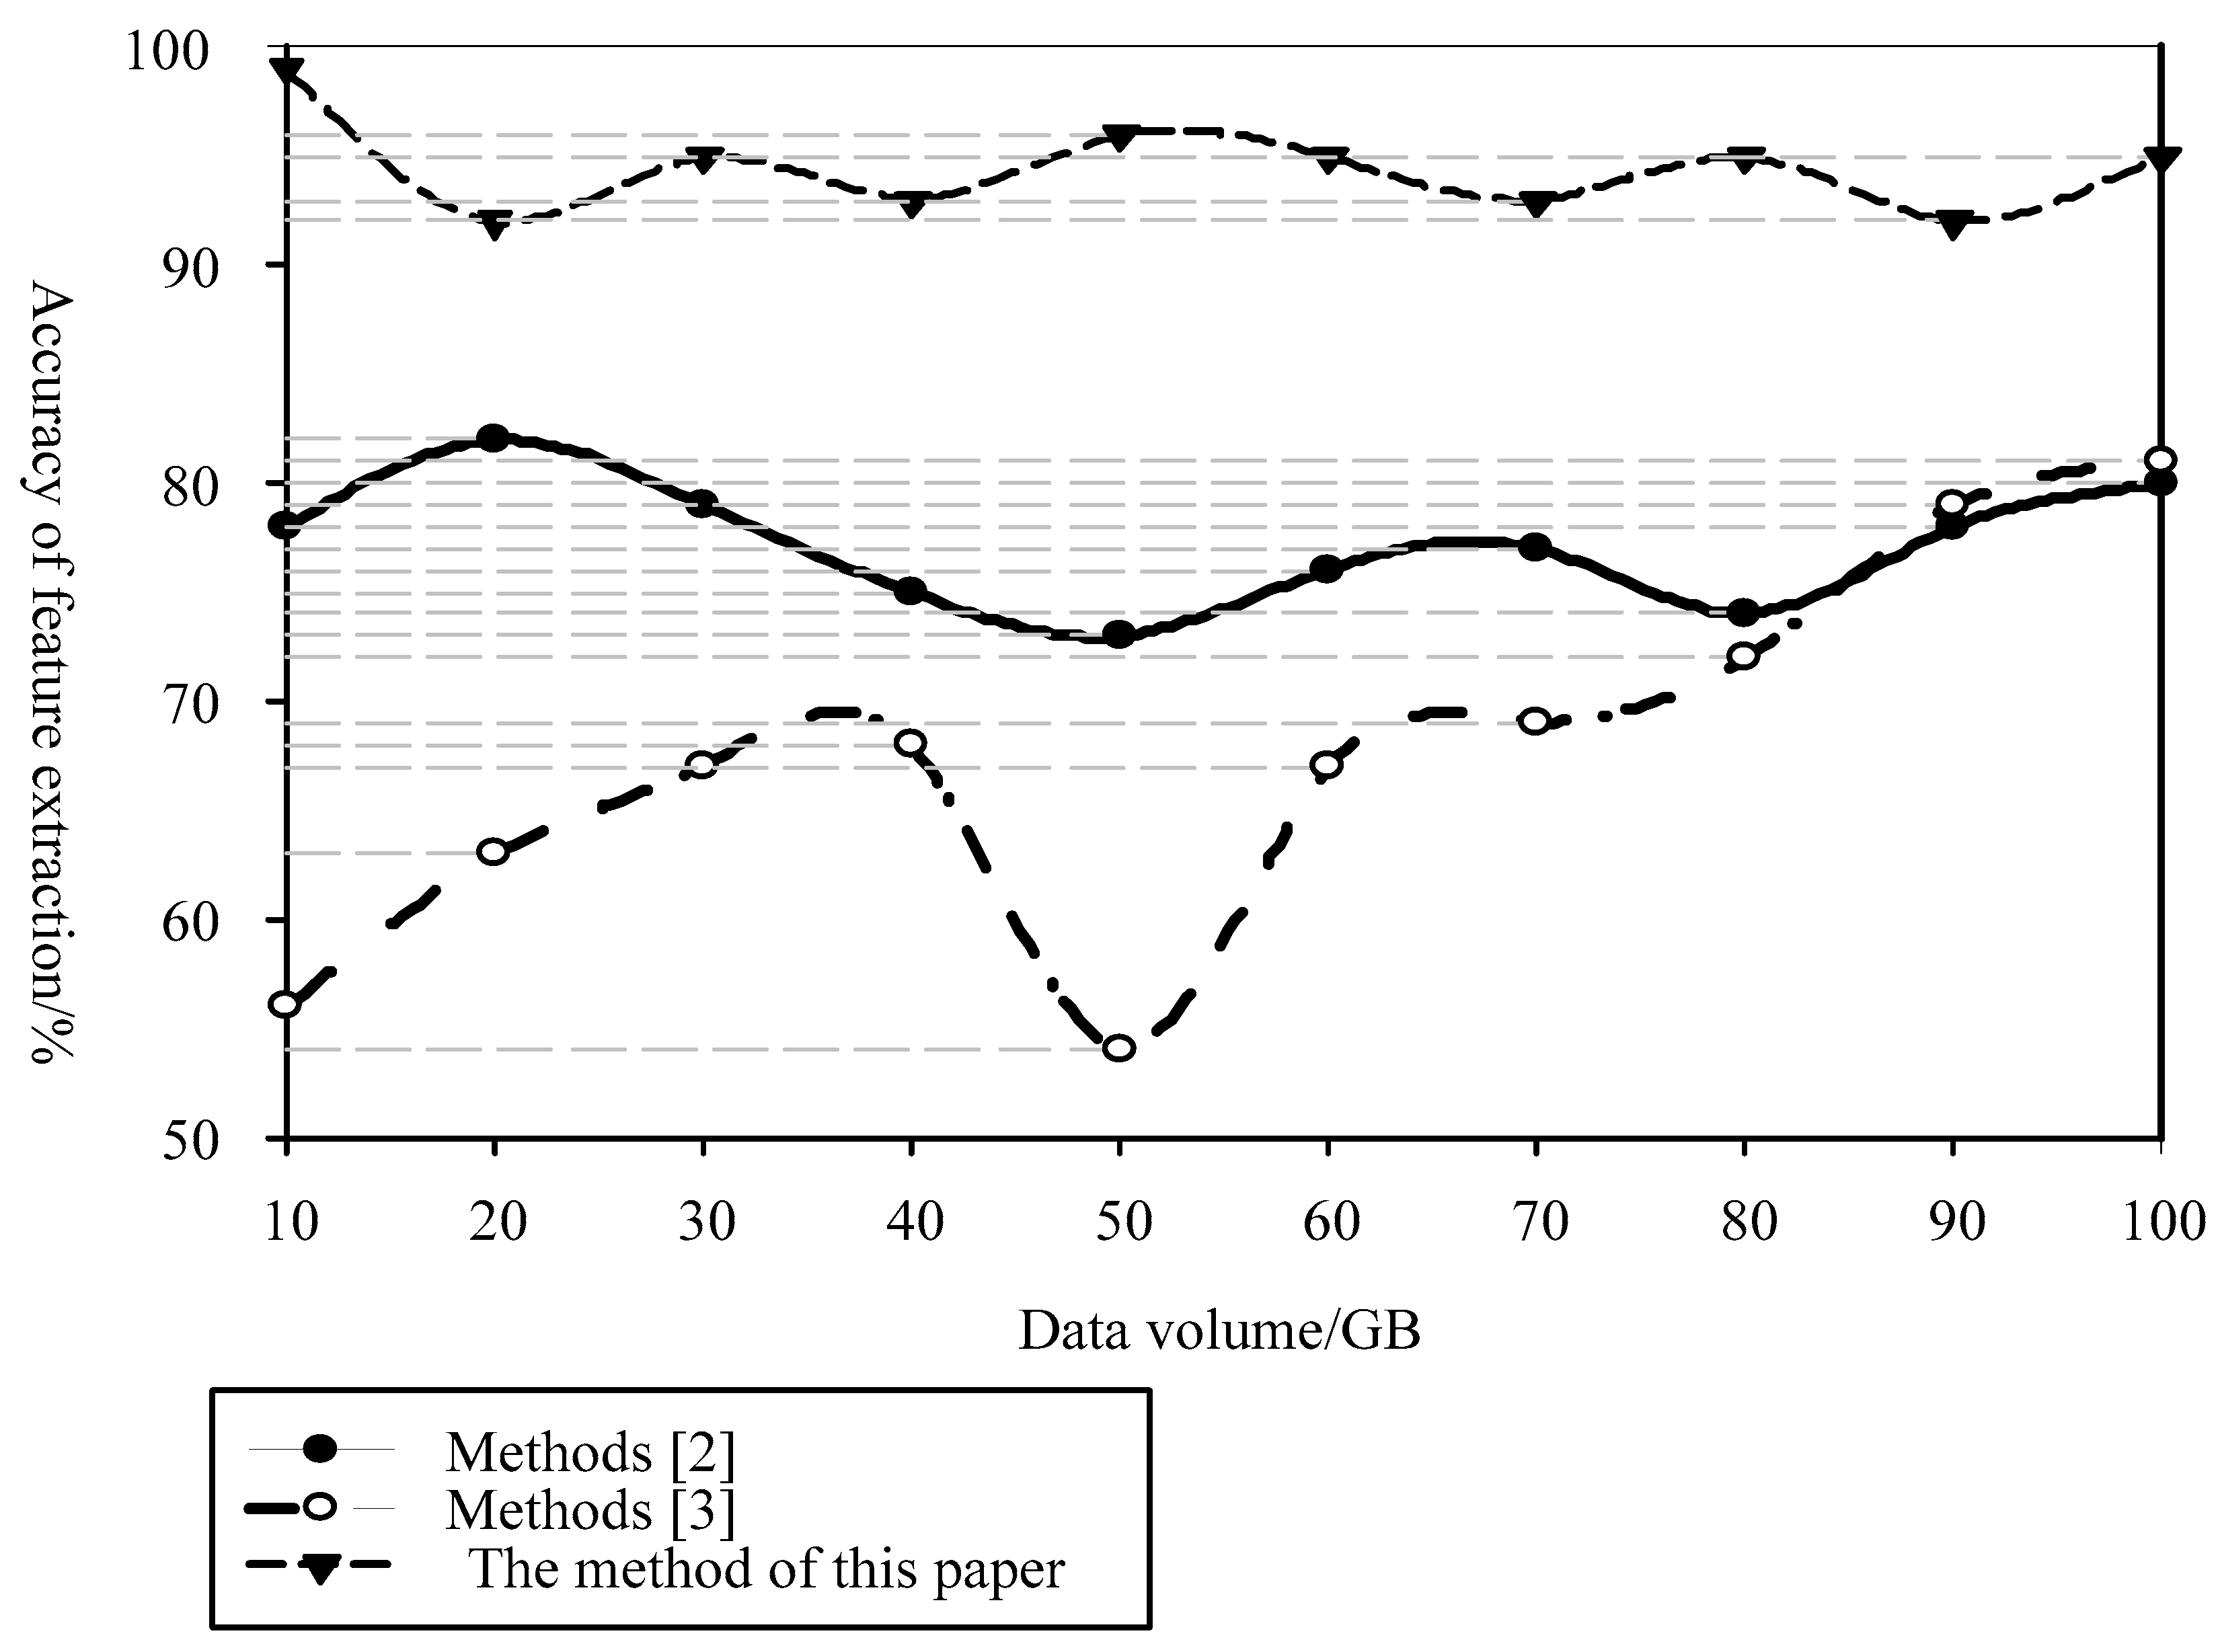
In order to verify the feature detection accuracy of different methods, the method of reference [2], the method of reference [3] and the feature detection of this method are obtained, and the feature detection accuracy of different methods is obtained. The results are shown in Figure 8.
Analysis of Figure 8 shows that, when the amount of data is 10GB, the feature detection accuracy of the method in reference [2] is 78%, that of the method in reference [3] is 56%, and that of the method in this paper is 99%. When the amount of data is 80GB, the feature detection accuracy of reference [2] method is 74%, that of reference [3] method is 72%, and that of this method is 95%. The feature detection accuracy of this method is much higher than that of other methods, indicating that the accuracy of this method is higher.
In order to verify the effectiveness of the adaptive image edge extraction method that combines the discrete algorithm and the Canny operator constructed in this paper, it is compared with three other image edge detection methods: pseudo Zernike subpixel edge detection, Sobel operator edge detection, and SIGMOD kernel fuzzy edge model. In the simulation experiment, the image size is 500 px × 500 px and Gaussian white noise are added to the image, and the variance is set as 0.2. The test results are shown in Table 1 and Table 2. The sub-pixel edge detection results of the composite image at different angles corresponding to this are shown in Figure 8. a ~ f are the detection results without white noise. g ~ l is the detection result of adding noise. The angles are 0 degrees, −25 degrees, and 65 degrees.
Observe the data in Table 1. In the experiments of different angles and straight lines, the method proposed in this paper has the highest detection accuracy. Next indetection accuracy is the pseudo Zernike subpixel edge detection method. Then, there is the fuzzy edge model of the SIGMOD kernel. Sobel operator edge detection method is the worst in detection accuracy.
From the data in Table 2, it can be found that the detection differences of different methods are also large. Similarly, the proposed detection method has the highest detection accuracy, followed by the SIGMOD kernel fuzzy edge model. This is due to the idea of iteration, which improves the accuracy of direction detection. The image edge detection method proposed in this paper has a high detection accuracy for the composite line gray image and the actual object edge, and has a good anti image noise ability, which can make the symmetrical or asymmetric image edge get better detection effect.
From the above data, we can know that the algorithm in this paper has better position and direction detection effect in different angles of lines. Therefore, the error for the detection result of the method in this paper under the change of angle is further represented by lines, as shown in Figure 9 and Figure 10.
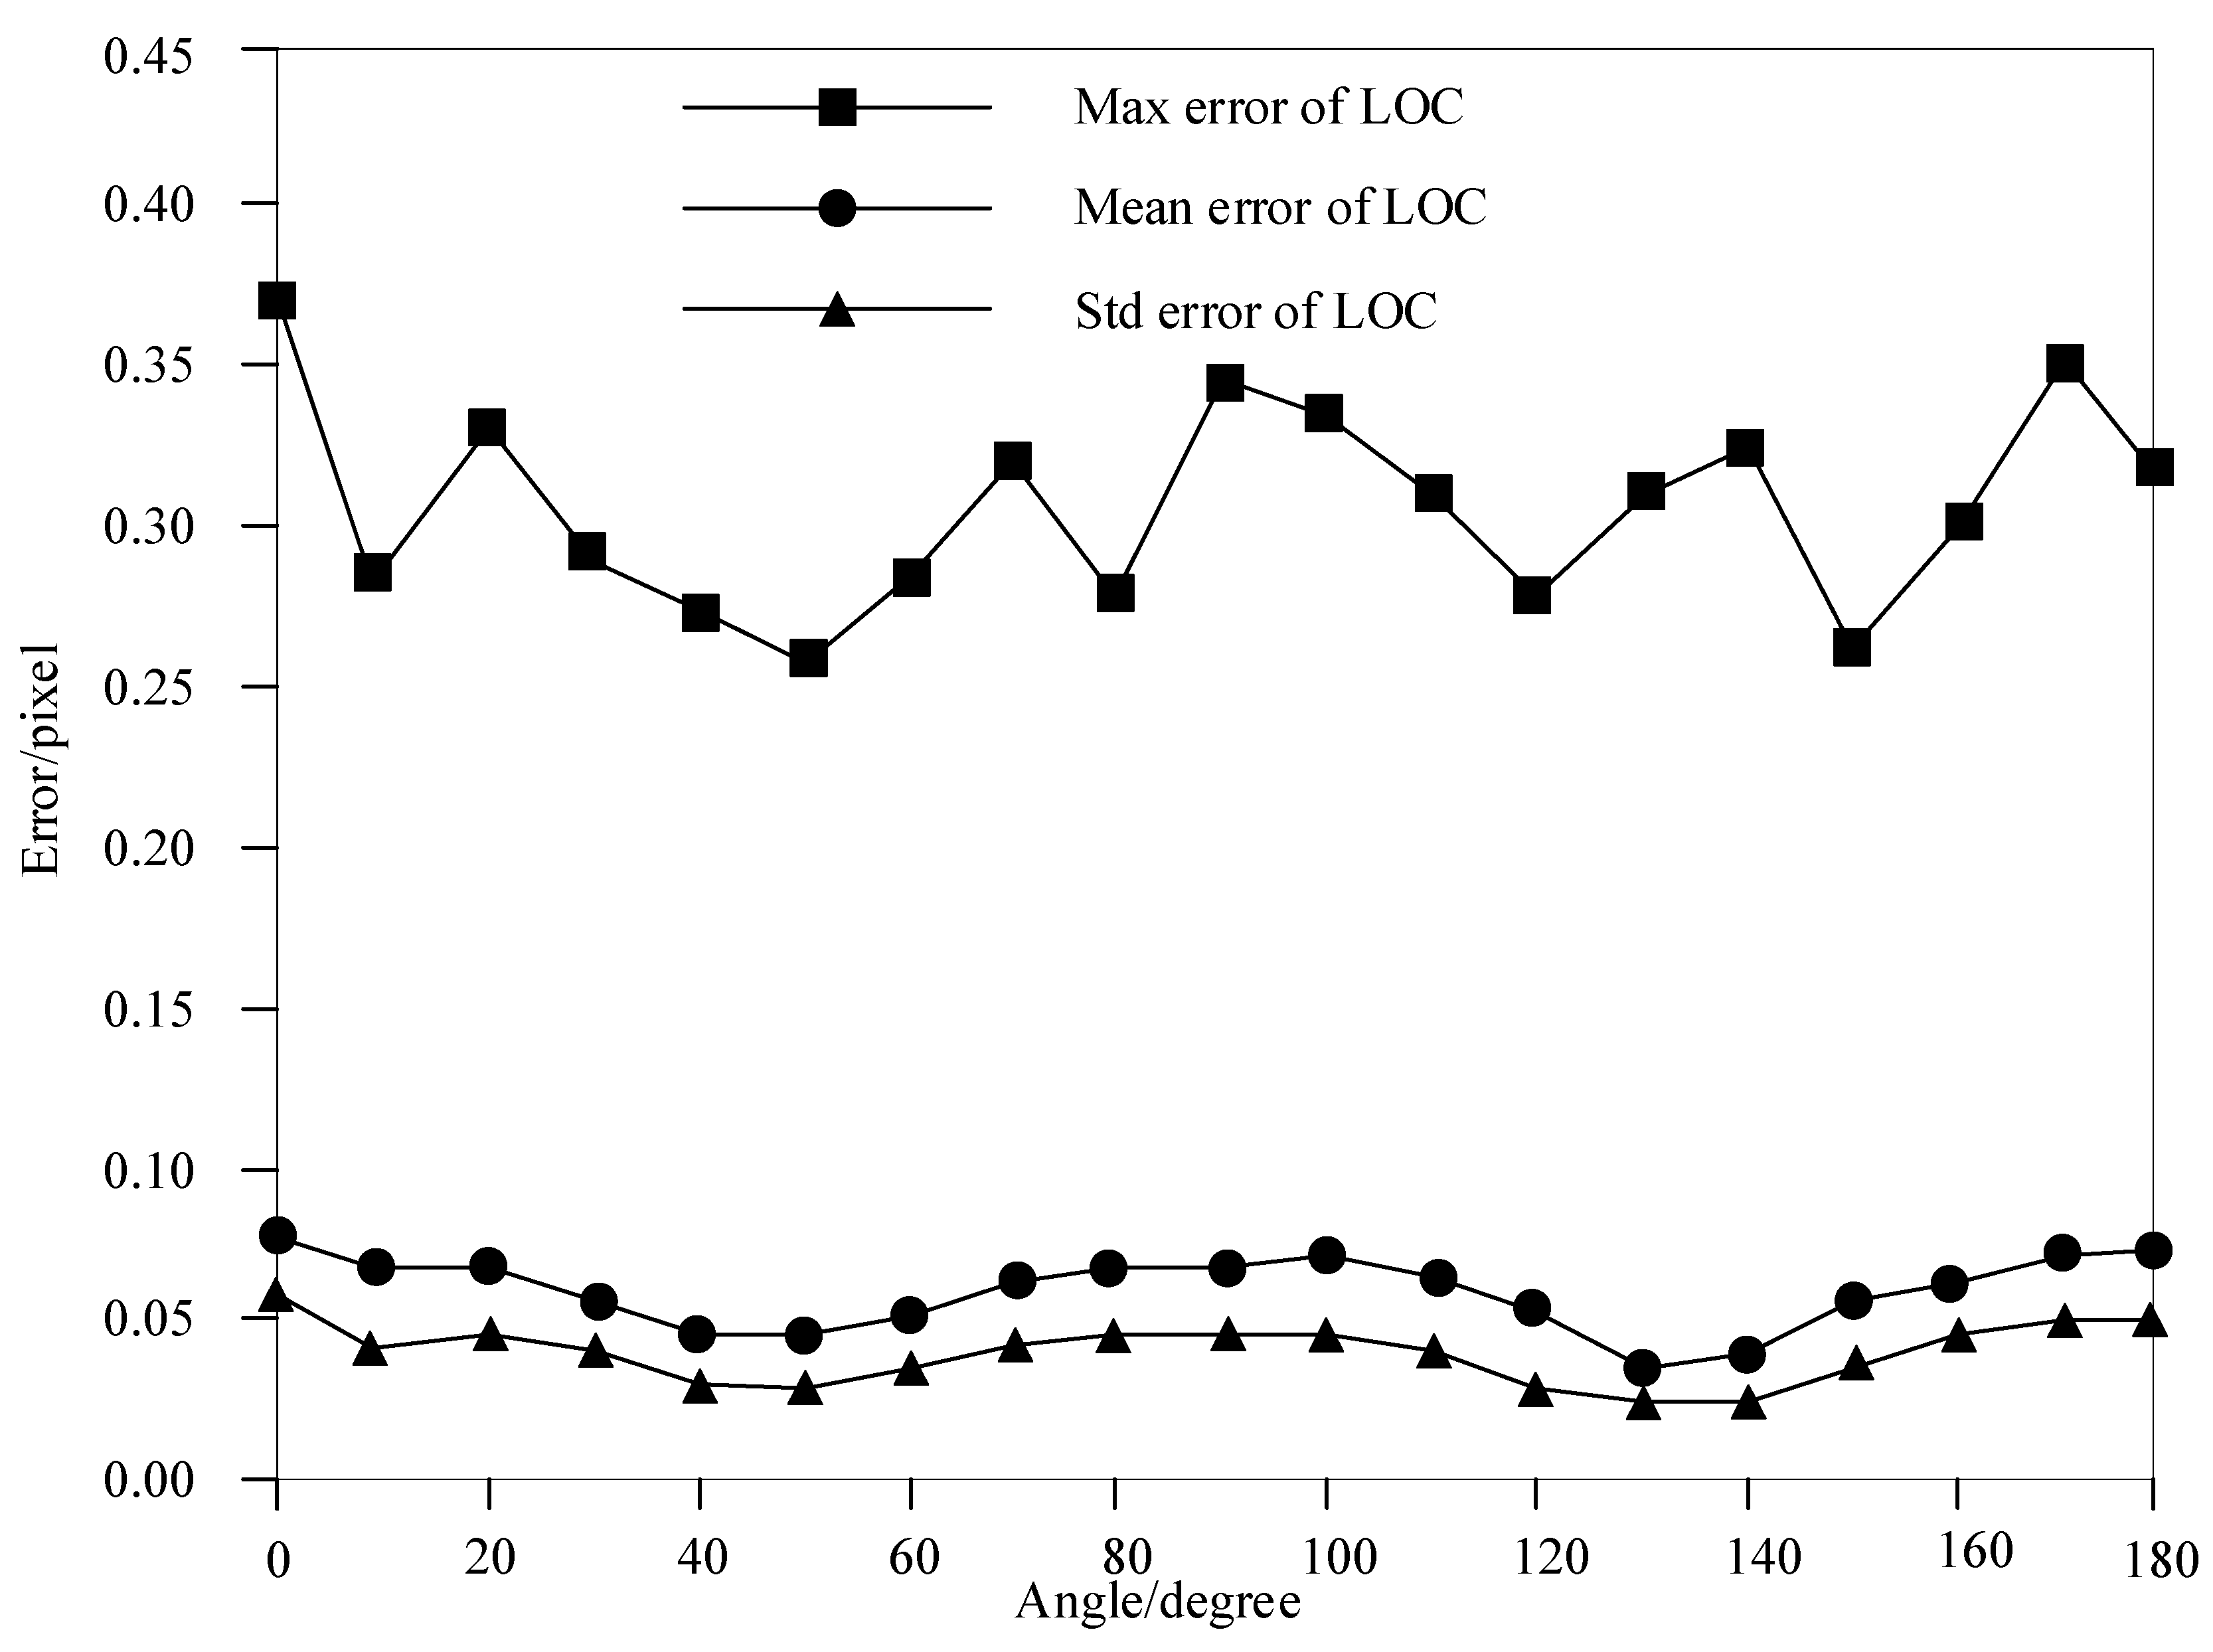
It can be seen from Figure 10 that the position detection accuracy of the adaptive image edge extraction method combining the discrete algorithm and Canny operator proposed in this paper is about 0.07 pixel. Observing the fluctuation of the three discounting results, we can see that the maximum error of the position detection result is less than 0.375 pixel, the average error of the position detection result is less than 0.1 pixel, and the standard deviation of the position detection result error is less than 0.06.
As can be seen from Figure 11, the image edge extraction method proposed in this paper has a good impact on the position detection accuracy. The position detection accuracy is about 0.075 degrees, the maximum error of position detection results is less than 0.38 degrees, the average error of position detection results is less than 0.1 degrees, and the standard deviation of position detection results is about 0.06 degrees.
It can be seen from Figure 12 that the image edge extraction method proposed in this paper has better effect on the direction detection accuracy. The direction detection accuracy is about 0.3 degrees, the maximum error of the direction detection result is less than 1.3 degrees, the average error of the direction detection result is less than 0.35 degrees, and the standard deviation of the direction detection result error is about 0.2 degrees.
5. Conclusions
In order to improve the accuracy of adaptive image edge detection, this paper introduces the traditional Canny algorithm into image edge detection and proposes an adaptive image edge detection technology based on discrete algorithm and classical Canny operator. First, the image is smoothed and denoised, and then the image edge is detected by the algorithm proposed in this paper. Simulation results show that, compared with other traditional algorithms, the detection error of this algorithm in position and direction is smaller, and the accuracy is higher, up to 99%, which effectively improves the detection accuracy of image edge. However, there are still some shortcomings in this algorithm; that is, this paper only considers the case of low noise and uses quadratic curve to establish the edge model, which needs further research in the future.
Author Contributions
This paper studies the adaptive image edge detection technology based on discrete algorithm and classical Canny operator. P.K. uses Canny operator to detect, uses discrete data to establish the edge model of quadratic curve, D.Z. uses one-dimensional gray moment to calculate the adaptive edge parameters of the image, They did the experiment together, the experimental results show that the accuracy of feature detection is 99%. P.K. and D.Z. both made great contributions to this paper and jointly completed the acceptance. All authors have read and agreed to the published version of the manuscript.
Funding
This research received no external funding.
Conflicts of Interest
The authors declare no conflict of interest.
Appendix A
The implementation process of this algorithm is as follows:
#include<iostream>
using namespace std;
int main()
{
int n;
cin >> n;
int*a = new int[n];
for (int i = 0; i < n; i++)
cin >> a[i];
for (int j = 1; j < n; j++)
{
int i = 0;
int m;
while (a[j] > a[i])
i++;
m = a[j];
for (int k = 0; k < j - i; k++)
a[j - k] = a[j - k - 1];
a[i] = m;
}
for (int i = 0; i < n; i++)
{
cout << a[i] << “ “;
}
return 0;
}
References
- Bampis, L.; Iakovidou, C.; Chatzichristofis, S.A.; Boutalis, Y.S.; Amanatiadis, A. Real-time indexing for large image databases: Color and edge directivity descriptor on GPU. J. Supercomput. 2015, 71, 909–937. [Google Scholar] [CrossRef]
- Lee, M.; Woo, B.; Kim, J.; Jamshidi, N.; Kuo, M. Su-E-J-252: Reproducibility of radio genomic image features: Comparison of two semi-automated segmentation methods. Med. Phys. 2015, 42, 3324. [Google Scholar] [CrossRef]
- Zuo, Y.; Liu, J.; Yang, M.; Wang, X.; Sun, M. Algorithm for unmanned aerial vehicle aerial different-source image matching. Opt. Eng. 2016, 55, 123111. [Google Scholar] [CrossRef]
- Wang, K.; Lin, L.; Lu, J.; Li, C.; Shi, K. Pisa: Pixelwise image saliency by aggregating complementary appearance contrast measures with edge-preserving coherence. IEEE Trans. Image Process. 2015, 24, 3019–3033. [Google Scholar] [CrossRef] [Green Version]
- Fernando, G.O.; Francisco, D.J. Boundary layer detection techniques applied to edge detection. Int. J. Image Graph. 2019, 19, 1950010. [Google Scholar]
- Peng, F.; Wang, S.; Liang, S. Establishment of cellular automata image model and its application in image dimension measurement. EURASIP J. Image Video Process. 2019, 2019, 14. [Google Scholar] [CrossRef]
- Yuan, S.; Venegas-Andraca, S.E.; Wang, Y.; Luo, Y.; Mao, X.F. Quantum image edge detection algorithm. Int. J. Theor. Phys. 2019, 58, 2823–2833. [Google Scholar] [CrossRef]
- Sun, Q.; Liang, F.; Wang, F.; Cong, H.; Li, Q.; Yan, J. Investigation on the geometrical characteristics of secondary arc by image edge detection. IEEE Trans. Plasma Sci. 2018, 46, 2016–2025. [Google Scholar] [CrossRef]
- Biswas, S.; Hazra, R. Robust edge detection based on modified moore-neighbor. Opt. Int. J. Light Electron Opt. 2018, 168, 931–943. [Google Scholar] [CrossRef]
- He, Y.; Zeng, Y.; Chen, H.; Xiao, S.; Wang, Y.; Huang, S. Research on improved edge extraction algorithm of rectangular piece. Int. J. Mod. Phys. C 2018, 29, 1850007. [Google Scholar] [CrossRef]
- Wan, X.; Zhao, C.; Gao, B. Integration of adaptive guided filtering, deep feature learning, and edge-detection techniques for hyperspectral image classification. Opt. Eng. 2017, 56, 113106. [Google Scholar] [CrossRef]
- Zhou, R.; Liu, D. Quantum image edge extraction based on improved sobel operator. Int. J. Theor. Phys. 2019, 58, 1–17. [Google Scholar] [CrossRef]
- Tang, C.; Hou, C.; Hou, Y.; Wang, P.; Li, W. An effective edge-preserving smoothing method for image manipulation. Digit. Signal Process. 2016, 63, 10–24. [Google Scholar] [CrossRef]
- Pérez-Benito, C.; Morillas, S.; Jordán, C.; Conejero, J.A. Smoothing vs. sharpening of colour images: Together or separated. Appl. Math. Nonlinear Sci. 2017, 2, 299–316. [Google Scholar] [CrossRef] [Green Version]
- Zead, I.; Saad, M.; Sanad, M.R. Photometric and spectroscopic studies of the intermediate -polar cataclysmic system DQ Her. Appl. Math. Nonlinear Sci. 2017, 2, 181–194. [Google Scholar] [CrossRef] [Green Version]
- Shu, Q.L.; Shan, B. Sub-Pixel Localization Algorithm Based on Modified Canny Operator. Mach. Des. Manuf. 2017, 332, 172–175. [Google Scholar]
- Han, D.; Li, Y.Q.; Wu, Y.H. Sub-pixel edge detection based on gaussian fitting. Comput. Appl. Softw. 2018, 35, 210–229. [Google Scholar]
- Zhu, W.; Liu, M.; Ye, S. Small module gear sub-pixel image edge detection based on neighborhood characteristic analysis. Acta Instrum. Sin. 2018, 39, 148–156. [Google Scholar]
- Yadav, S.K. Some results on D-homothetic deformation of (LCS)2n+1-manifolds. Appl. Math. Nonlinear Sci. 2019, 4, 113–128. [Google Scholar] [CrossRef] [Green Version]
- Qu, S.; Zhao, L.; Xiong, Z. Cross-layer congestion control of wireless sensor networks based on fuzzy sliding mode control. Neural Comput. Appl. 2020, 32, 13505–13520. [Google Scholar] [CrossRef]
- Zeng, H.; Liu, X.; Wang, W.; Xiao, S. New results on stability analysis of systems with time-varying delays using a generalized free-matrix-based inequality. J. Frankl. Inst. 2019, 356, 7312–7321. [Google Scholar] [CrossRef]
Figure 1.
Edge model image based on subpixel edge detection of one-dimensional gray moment.

Figure 2.
Sub pixel edge extraction steps.

Figure 3.
Result of maximum error of edge position under different region length.

Figure 4.
Results of average error of edge position at different region lengths.

Figure 5.
Standard deviation results of edge positions at different region lengths.

Figure 6.
Maximum error results in the direction of the edges at different region lengths.

Figure 7.
Results of average edge direction error at different region lengths.

Figure 8.
Results of standard deviation of edge direction under different region lengths.

Figure 9.
Accuracy of feature detection under different methods.

Figure 10.
Subpixel edge detection results of composite images from different angles.

Figure 11.
Position detection error results of the algorithm in this paper at different angles.

Figure 12.
Direction detection error results of the algorithm in this paper at different angles.


Table 1.
Edge position error of different methods.
| Angle | Zernike | Sobel | Sigmod | Algorithm in this Paper | ||||||||
|---|---|---|---|---|---|---|---|---|---|---|---|---|
| εmax | μs | σε | εmax | μs | σε | εmax | μs | σε | εmax | μs | σε | |
| 0 | 0.512 | 0.146 | 0.111 | 1.149 | 0.345 | 0.248 | 0.612 | 0.168 | 0.124 | 0.435 | 0.104 | 0.069 |
| 10 | 0.462 | 0.112 | 0.081 | 1.182 | 0.361 | 0.251 | 0.728 | 0.152 | 0.109 | 0.368 | 0.099 | 0.064 |
| 20 | 0.425 | 0.109 | 0.079 | 1.182 | 0.287 | 0.226 | 0.579 | 0.143 | 0.113 | 0.278 | 0.081 | 0.060 |
| 30 | 0.348 | 0.079 | 0.075 | 1.153 | 0.298 | 0.249 | 0.538 | 0.128 | 0.121 | 0.254 | 0.069 | 0.049 |
| 40 | 0.319 | 0.077 | 0.059 | 1.038 | 0.238 | 0.204 | 0.439 | 0.118 | 0.087 | 0.248 | 0.058 | 0.051 |
| 50 | 0.417 | 0.082 | 0.060 | 1.066 | 0.271 | 0.195 | 0.508 | 0.109 | 0.079 | 0.247 | 0.072 | 0.052 |
| 60 | 0.382 | 0.088 | 0.101 | 1.011 | 0.309 | 0.224 | 0.482 | 0.128 | 0.101 | 0.349 | 0.078 | 0.059 |
| 70 | 0.442 | 0.112 | 0.094 | 1.162 | 0.364 | 0.241 | 0.572 | 0.145 | 0.095 | 0.308 | 0.079 | 0.058 |
| 80 | 0.451 | 0.110 | 0.087 | 1.439 | 0.385 | 0.275 | 0.598 | 0.139 | 0.113 | 0.269 | 0.077 | 0.057 |
| 90 | 0.446 | 0.123 | 0.086 | 1.572 | 0.315 | 0.268 | 0.638 | 0.137 | 0.121 | 0.319 | 0.091 | 0.069 |
Table 2.
Edge direction error of different methods.
| Angle | Zernike | Sobel | Sigmod | Algorithm in this Paper | ||||||||
|---|---|---|---|---|---|---|---|---|---|---|---|---|
| εmax | μs | σε | εmax | μs | σε | εmax | μs | σε | εmax | μs | σε | |
| 0 | 1.514 | 0.412 | 0.325 | 2.025 | 0.527 | 0.378 | 1.098 | 0.429 | 0.301 | 1.078 | 0.279 | 0.218 |
| 10 | 1.345 | 0.368 | 0.284 | 1.752 | 0.498 | 0.385 | 0.138 | 0.315 | 0.246 | 1.062 | 0.289 | 0.207 |
| 20 | 1.138 | 0.324 | 0.223 | 1.584 | 0.456 | 0.356 | 0.997 | 0.258 | 0.208 | 1.021 | 0.235 | 0.179 |
| 30 | 1.002 | 0.251 | 0.197 | 1.698 | 0.368 | 0.284 | 1.482 | 0.183 | 0.189 | 0.627 | 0.176 | 0.137 |
| 40 | 0.825 | 0.183 | 0.145 | 1.036 | 0.268 | 0.207 | 0.725 | 0.192 | 0.142 | 0.542 | 0.135 | 0.108 |
| 50 | 0.603 | 0.184 | 0.146 | 0.996 | 0.276 | 0.198 | 0.598 | 0.234 | 0.156 | 0.608 | 0.132 | 0.102 |
| 60 | 0.876 | 0.208 | 0.178 | 1.058 | 0.359 | 0.284 | 0.793 | 0.291 | 0.197 | 0.827 | 0.208 | 0.158 |
| 70 | 0.134 | 0.275 | 0.236 | 1.325 | 0.386 | 0.315 | 1.084 | 0.326 | 0.227 | 1.023 | 0.247 | 0.199 |
| 80 | 0.368 | 0.345 | 0.286 | 1.587 | 0.478 | 0.368 | 1.126 | 0.278 | 0.294 | 1.157 | 0.276 | 0.218 |
| 90 | 0.421 | 0.394 | 0.298 | 1.678 | 0.524 | 0.375 | 1.528 | 0.385 | 0.315 | 1.205 | 0.298 | 0.219 |
Publisher’s Note: MDPI stays neutral with regard to jurisdictional claims in published maps and institutional affiliations. |
© 2020 by the authors. Licensee MDPI, Basel, Switzerland. This article is an open access article distributed under the terms and conditions of the Creative Commons Attribution (CC BY) license (http://creativecommons.org/licenses/by/4.0/).
Share and Cite
MDPI and ACS Style
Kanchanatripop, P.; Zhang, D. Adaptive Image Edge Extraction Based on Discrete Algorithm and Classical Canny Operator. Symmetry 2020, 12, 1749. https://0-doi-org.brum.beds.ac.uk/10.3390/sym12111749
AMA Style
Kanchanatripop P, Zhang D. Adaptive Image Edge Extraction Based on Discrete Algorithm and Classical Canny Operator. Symmetry. 2020; 12(11):1749. https://0-doi-org.brum.beds.ac.uk/10.3390/sym12111749
Chicago/Turabian StyleKanchanatripop, Phusit, and Dafang Zhang. 2020. "Adaptive Image Edge Extraction Based on Discrete Algorithm and Classical Canny Operator" Symmetry 12, no. 11: 1749. https://0-doi-org.brum.beds.ac.uk/10.3390/sym12111749
Note that from the first issue of 2016, this journal uses article numbers instead of page numbers. See further details here.