A Case Study on Evolution of Car Styling and Brand Consistency Using Deep Learning


1
Department of Industrial Design, National Taipei University of Technology, Taipei 10608, Taiwan
2
College of Design, National Taipei University of Technology, Taipei 10608, Taiwan
*
Author to whom correspondence should be addressed.
Symmetry 2020, 12(12), 2074; https://0-doi-org.brum.beds.ac.uk/10.3390/sym12122074
Submission received: 15 November 2020
/
Revised: 6 December 2020
/
Accepted: 8 December 2020
/
Published: 14 December 2020
(This article belongs to the Special Issue Advances on Engineering Graphics: Improvements and New Proposals)
Abstract
:Brand style and product identity are critical to the core value of a brand. Yet how to identify the style and identity is highly dependent on the human expert’s judgment. As deep learning for image recognition has made a rapid process in recent years, it’s the application of brand style and design features have potential. This investigation assessed the car styling evolution of two car brands, Dodge and Jaguar, by training convolutional neural network. The method used heat map analysis of deep learning and was supplemented by statistical methods. The two datasets in this investigation were the car design features dataset and the car style images dataset. Results using the deep learning method show that the average accuracy of the last ten under verification modes was 95.90%, while 78% of the new cars continue the early brand style. Moreover, Jaguar had a higher proportion of style consistency than Dodge. Results using statistical methods reveal two cars had evolved in two different trends regarding the vehicle length. In terms of the design features, Jaguar had no noticeable design features of the rocket-tailfin. The heat map method of deep learning indicates a design feature’s focus area, and the method is beneficial for future brand style analysis.
1. Introduction
Are consumers able to recognize the brand of a car from a distance? Research showed that product design has great potential to build brand value. For many car companies, stable brand recognition is a crucial design specification through the clues of the car’s visual design and brand connection to identify the brand. Therefore, unique identifiable features and brand recognition were a significant challenge in identifying a brand’s core value. To recognize such characteristics, it should be contemplated through which “traits” design was connected to the very basics of the brand identity [1]. However, it is not easy to identify the brand style or car brand by the design features. Several essential factors may determine the car style, including the unique brand style, particular regional style, the period style, and zeitgeist.
In the development process of a car brand, there is a particular brand style and brand identity between different car brands to create a unique core value and brand consistency. Developing consumer’s brand recognition often requires a certain of products perceived by the consumers over time. Companies need to nurture visual continuity over their current portfolio and successive product generations in order to establish a recognizable identity and promote consistent associations [2]. Therefore, product identification and imagery to the consumer were essential for the enterprise. In this sense, a brand’s major design restriction was establishing a clear product identification that differentiated it from other related products [3].
Regarding the period style, the development of car styles has evolved over many periods. The style includes vintage car style, streamlined style, popular style, and modern style, etc. Each style had one or several unique design features. In the streamlined style period, it had a teardrop-shaped appearance design, which had been mentioned by the related books on design history. Just like the Design Source Book written by Sparke Penny [4], it described the product and car design at that time. All products had a particular visual shape or design feature, and these shapes had cultural or epochal significance regarding styles selection of consumers in many regions. In short, different countries have different cultural backgrounds and consumer preferences. Consumers related to the region were familiar with local cultural styles. These brands were endorsed by the innovation associated with a product area from being dissipated in the marketplace [5].
Today, with the rapid process of deep learning, it is possible to use more tools to explore the trend and recognition of car styles, such as regression analysis, Bayes’ theorem, cluster analysis, decision tree analysis, and convolutional neural network. These tools have been widely used in information, machinery, engineering, business investment, medical, and other fields. However, deep learning has rarely been the field of brand value, product identity, and style. The question in the present study was if artificial intelligence could help us find the differences, trends, identification, and consistency of different brand styles, and if the ways could visualize the latest mechanism the formation and evolution of brand style. Therefore, this investigation can be extended to anything that has a dynamic balance between things that have changed and or been left unchanged, such as globalization and localization. Just as researchers find academic value from journal papers, designers also try to find design knowledge from the collection of past design cases. We hope this research is inspiring for product designers in the context of globalization. Rationally explaining more emotional thinking by data is a research topic with great potential in the future.
2. Literature Review
2.1. Brand Image and the Consistency of Brand Style
Visual recognition on the image level relies on sign creation and interpretation and acts as a conveyor of brand values and related meanings. The most important brand identity concept is to design a correct appearance or brand image for people to associate it with the brand. The brand image includes the brand’s logo and style. For example, the Volvo shoulder can be seen to evoke safety in a rather strong manner. Furthermore, Volvo’s wide shoulders can be viewed as denoting thick and heavy doors, a safety-related connotation of rigidity and strength, one of Volvo’s core values [6]. The use of Advanced High-Strength Steel to create an extremely safe protection cage has made Volvo synonymous with car safety for decades. As a consequence, Volvo comes to mind when consumers discuss safe cars.
All considered, the current discourse on brand styles is confronted with the problem of how and where to search for real proofs of styles in products. There may also be a style attribution problem, in that the way people allocate a brand’s products to a style is contextual and relies on knowledge of the brand and its previous styles [7]. For instance, safety can be the feature, and wide shoulders can be tangible evidence for the brand when it comes to Volvo. However, not every Volvo car is built with wide shoulders, as, for example, the 940 model, manufactured in 1991. This model lacks the feature of wide shoulders compared with the current models.
Most brands still maintain consistent styles, and it can be seen that brand image can deliver a clear core value through its style. A study noted that identifying brand styles includes understanding the significant design elements relevant to brand style. The methodology of hybrid style quantification can not only replicate the initial vehicle designs but can also create various variations within the style spectrum of the initial vehicle design [8]. The similarity is sought to make it more likely that customers recognize the brand style of the company in the case of a limited assortment size [9]. Keller described the brand image as perceptions about a brand that reflects a growing association in consumers’ minds. Keller defines brand knowledge as two components: brand awareness and brand image. Along this dimension, brand associations can be classified into three major categories of increasing scope: attributes, benefits, and attitudes [10]. Brand image is formed from the elements of attributes, which describe the features possessed by a product good or service. Attributes consist of product-related attributes, the features that make the product functions work, related to the physical composition or the form of service [11]. It is difficult to identify a clear brand style, since it combines various elements. However, the automotive industry requires a strong brand identity. Therefore, it leads to another issue in which a new product should look similar or different from the previous one.
Related research explored the effect of experience and educational background. The outcome suggests that experienced professionals are more concerned with the historical position of product styling, and less experienced professionals are more concerned with the consistency within the product assortment. The last result is that more experienced design professionals tend to style a new product close to their competitors. Therefore, it is important to explore the history of every brand’s development, particularly product style image, when it comes to brand style or brand value. The consistency of brand product styles will also vary according to each stage of the product life cycle strategies.
To sum up, the brand style includes design elements, features, style quantitative analysis, brand historical development, consistency, and continuity of the style. These components of brand stage are the vehicle to deliver the brand value to consumers.
2.2. Styles of Automobiles, Products, and Architectures
There are a great number of factors that affect the style of automobile. From a macro perspective, these factors include brand values, times, and regions. On a more micro perspective, shapes, colors, and textures are factors affecting the style. In the case of cars specifically, in connection with the country of origin of the brand, strong associations appear, which also affect visual perception and interpretation. From a regional perspective, the brands of the United States represent the styles of American cars. American car styles are mainly affected by the three major car brands of General Motors, Ford Motors, and Chrysler Automobiles [12]. American tastes also tend toward larger cars, and it is therefore more common to find larger and longer vehicles in the US. The style of British cars, in contrast, is more classical, aristocratic, and gentlemanly in style. The lines of British vehicles are mostly curved, smooth, and elegant, while exuding a strong sporty image with profound cultural connotations [13]. The development of automobile design has also been through various changes. If we look at streamlining as an example, from the mid-1930s to the early 1950s, the design of cars focused on reducing wind drag in the beginning to increasing speed in the later period of time. The design of every vehicle considered fluid mechanics. Wedge-shaped cars represent hedonism, and this style proliferated following the 1960s. Whether it is function or style, it is suitable for high-speed, safe driving, and including a dynamic feeling [14].
Except for the car style, the vocabulary of style is widely used to describe the different fields, such as the style of buildings, the style of literature, the style of behavior, and the style of dress [15]. The popular design created various styles, and hence, style is also linked to aesthetics [16]. The aesthetics style of the product can be connected with the product itself. A descriptive framework for visual form design denoted design format modeling. With the model, it is possible to describe aesthetic form design content on the operative as well as the strategic levels of product development [17]. A style includes the naturally produced gradual shift.
Some examples of style would be the style of Western architecture. It could be divided into ancient Greek, Roman, Neo-Renaissance, modern architecture, and postmodern architecture. The Taiwanese train station architecture can also be classified into fusion style, Japanese style, modern style, Western style, and imperial crown style [18]. Hence, style is also related to history. In 1981, Downing and Flemming examined the cabins built between 1914 and 1926 in Buffalo, New York, USA, to find the design type and style [19]. In other words, the design style of renowned designers can be recreated. There is also a new furniture design style that took inspiration from the traits of Mackintosh furniture [20]. In addition, Wang and Chen developed a prototype of an expert system for style classification, namely, STYRULE, by specifying the relationship between product appearance features and the corresponding styles [21].
The discussion of automobile style mainly concentrates on design features. Statistics and machine learning are applied to converting style features into numerical values for analysis. With deep learning, pictures can be the data sources for computers to continue further analysis. Therefore, design features cover product appearances, such as the outline, style, and scale. Visual recognition can be achieved through a computer. A paper applies real-time drafting of a virtual car in a perspective that is the best in viewing angle reality [22]. The other paper about the layout of the vehicle presents the paradigm that exists. The development of time has interesting results, showing that the car was developed following the evolution as time goes by rather than a radical paradigm [23]. Characteristic elements included character lines, curve elements, shape features, and other specific elements that were found across product portfolios and therefore considered visually characteristic for the brand. It is important to consider those features (shapes, typical patterns, identifying features, characteristic behavior) that construct the identity of particular forms and products in terms of brand communication. In addition, Andreasen defined the design features based on functionality, including structure, form, dimension, surface quality, and material [24,25]. However, there was not focus on aesthetic or decorative appearance design features.
To select the feature of style, two representative car brands with different styles will be compared at first. Moreover, previous references, such as the car design illustrated handbook “The Complete Car Yearbook” [26], periodicals, and conference papers, will be used to obtain details regarding styling features. The key papers from Journal of Design, International Journal of Advanced Engineering Informatics, and the proceeding of ICED suggest ten features affecting automobile style. The features include vehicle length, fender, headlamps, tail form, quarter glass, engine hood scoop, tailfin, bullet bumper, egg-crate grille, and sideway decoration, as shown in Table 1.
2.3. Style and the Zeitgeist
Zeitgeist is the spirit of the times. Hegel believed that art, by its very nature, reflected the culture of the era in which it was created. Culture and art are inextricable because an individual artist is a product of his or her time and thus brings to any given work of art that culture. In addition, he believed that it was impossible to produce classical art in the modern world, which Hegel believed represented a free and ethical culture that depended more on the philosophy of art and art theory than on the social construct or zeitgeist in which an artist lives [27]. Eero Saarinen defined the zeitgeist as the intellectual fashion or dominant school of thought that typifies a particular period’s culture and influences it. For instance, during much of the 20th century, the zeitgeist of modernism typified and influenced architecture, art, and fashion [28,29]. The concept of zeitgeist positions the phenomenon in a specific historical period, and perhaps certain elements with historical origin can be extracted from it. Some aesthetic properties or a certain style can be associated with zeitgeists, but they can be distinguished from the understanding of the style in art history [30].
The power of the zeitgeist is the ability to coordinate across product categories and to inspire them when creating fashion products, they have to tap into various cultures and traditions. Fashion keeps trying to harness the zeitgeist [31]. After WWII, automakers applying design characteristics of warplanes to their vehicle designs can be a good example of the zeitgeist. Add the symbol of aviation to the car’s basic design and transform people’s expectations into flying (driving) with style as shown in Figure 1a. The experience of driving a car like a pilot flies a plane was the spirit of the post-war era because airplanes changed the war and captured the imagination at the time.
The concept of zeitgeist is common all over the world. Individual countries could be branded by harnessing a zeitgeist, as could each region within it. This branding creates a fashion identity that can affect the economy directly. Vehicles with a rocket-type tailfin are another example of this idea as shown in Figure 1b. Beginning in the late 1950s, space became another dramatic arena for the US and Soviet Union. Satellites and rockets become symbols at that time in the US. With the US leading the way in space exploration, the design became more exaggerated and gorgeous, from the airplane-inspired tailfin to a rocket-shaped one. Consequently, America’s automobile manufacturers designed some of the boldest car models with remarkable rocket tailfins. Automobile companies with this innovative design feature included Chrysler, Cadillac, Buick, Ford, and Dodge. These rocket tailfin designs soon spread around the world. Consequently, the period style with the characteristics of the rocket-type tailfin can also be called the symbol of the zeitgeist.
Another example of symbolizing the zeitgeist is Volvo’s three-point safety belt. Volvo’s core values have always set standards for cars with exceptional safety, quality, and sustainability. In 1959, Swedish Volvo engineer Nils Ivar Bohlin applied for a patent for the three-point seat belt [32], widely adopted by vehicle manufacturers around the world. Everything must reflect the zeitgeist, just as the styling of a vehicle must reflect the period style. Therefore, the vehicles or product style with the symbol of the zeitgeist follow the rational development context of the period style. The style expands to the national and regional scope, corporate brand, and then influences every individual. Another paper mentions that anything can be more unscientific than such a spirit. It is the very apotheosis of self-opinion intoxicated by its own pride. However, the choice in the human enlightenment, the concept of the zeitgeist, and period style still lack objective evidence. Such as Renan’s conviction, expressed in l’avenir de la science, that amid its oscillations humanity tends through increasing rationality towards perfection [33]. Therefore, it is extremely important for any newly emerging technologies to find rational evidence for the zeitgeist, open the mysterious black box, and discover design elements behind the zeitgeist.
2.4. Deep Learning and Heat Map
Regarding deep learning, a convolutional neural network (known as CNN) is a class of deep neural networks, most commonly applied to analyzing visual imagery as shown in Figure 2. It is an effective recognition algorithm, widely used in many fields. Some paradigms, include identifying tanks and armored fighting vehicles [34], the identification of cats and dogs [35], the flower species identification [36], the MNIST dataset comprising of 10-class handwritten digits with 60,000 examples [37,38], the fashion-MNIST with images of 70,000 fashion products from 10 categories [39], and movie genre classification [40], etc. Concerning the application of heat maps on CNN, from the perspective of information science, information scientists care about increasing accuracy and innovative algorithm when it comes to applying heat maps to CNN. On the other hand, designers focus on why certain car models are classified as certain styles by the system and the meanings behind it. There was also the use of deep learning to identify and reconstruct the style of artwork [41]. However, it is not possible yet to point out the rules behind the CNN style classification, so the heat map played a critical role in visualizing the design features that affect the style.
The heat map is Gradient-Weighted Class Activation Mapping (Grad-CAM), which uses the gradients of any target concept flowing into the final convolutional layer to create a coarse map of localization highlighting the important regions in the image to predict the concept [42]. Designers can know why a vehicle or product is classified as a specific style through a heat map, which also helps us determine the relevant design features of each brand style. The heat map is commonly applied to identify animals and product features. For instance, it gives us features of an elephant with the heat map, such as its ears, outline, and trunk. Figure 3a shows an elephant’s ears, outline, and a baby elephant’s trunk through a heat map. As for Figure 3b, it shows features of a computer mouse, such as its left and right buttons, and the smooth area for a user to hold on through a heat map. The pie chart on the right of the heat map demonstrates the possible rate of identifying the object. The possible rate of identifying an elephant in Figure 3a is 97%, and the possible rate of identifying a mouse is 97%, as shown in Figure 3b. Except for the heat map, the visualized convolution layer can also observe the object behind the convolutional neural networks.
2.5. Statistical Analysis Methods
Quantitative research on style and design features often uses statistical analysis methods, including descriptive statistics, parametric methods, and nonparametric methods. Parametric methods include one-way analysis of variance, multi-way analysis of variance, post hoc test, etc. Common nonparametric methods include the chi-square test and Mann–Whitney U test, Kruskal–Wallis test, etc. [43]. Statistical analysis is often applied to estimating the relationship between variables from the dataset in the past. Combining statistical methods with automotive-related research, including numerically measured similarities in car design to synthesize and analyze car brand styles, discovering design trends among car brands for strategic design positioning, finding methods to quantify differences in style and identifying unique design elements of car designs among car manufacturers based on design similarities of a large number of car designs. Moreover, a paper used regression analysis to study different types of cars and quantitative description research to discuss styles [44]. Another study about relative coordinates and multi-variate statistical analysis is used to investigate cars’ outlines and features [45]. Additionally, the other investigation, the t-test, is also applied to presenting the correlation between subjects with a design background and their features based on the retro design of classic cars [46].
2.6. Summary
At certain periods, zeitgeist and period styles are the primary factors that determine the specific brand with representative styles. Different styles then become the most iconic features for certain brands. Therefore, we can make two statements:
- There is no need to draw a distinction between zeitgeist and style. According to the Oxford English Dictionary, the term zeitgeist has become more loosely used to describe the general cultural characteristics of any era, such as the sixties or the romantic era, and does not have the strong historicist connotations of Hegelian philosophy [47]. The elements of the period style include the zeitgeist, the development of car-making technology, and social influencing factors, such as the space race, energy crisis, energy conservation, etc. The components of the brand product style are brand core values, styles, and unique design features, along with some influencing factors including historical styles and regional styles. Since there are too many factors contributing to styles, this paper only focuses on design features that affect products’ styles.
- This paper only focuses on studying car models from certain brands with iconic styles. Automobile brands and design features are ideal factors to discuss a brand’s style. The analysis demonstrates changes regarding trends at different periods and the consistent core value of the brand. Therefore, the development and evolution of cars can be seen from either changes or consistency, such as the feature rocket-type tailfin, as PBS arts editor Margaret Myers says, “The tailfin era of automobile styling encompassed the 1950s and 1960s, peaking between 1955 and 1961. It was a style that spread worldwide, as car designers picked up styling trends from the US automobile industry, where it was regarded as the golden age of American auto design.” However, there is evidence that some automobile brands are not affected by trends at specific periods. For example, British or European car brands are not affected by the United States’ specific period style.
3. Methods
This study focuses on the cars produced by the American brand Dodge and the British brand Jaguar. The goal is to explore the evolution of the car styling of these two different brands. The following describes the dataset used for analysis and the tools and methods of using deep learning or chi-square analysis.
3.1. Datasets
This investigation includes a car style images dataset (CSI Dataset) and a car design features dataset (CDF Dataset). The car style images dataset is for deep learning methods. The car design feature dataset is for statistical analysis methods. Samples include (1) the car style images dataset containing 3803 pictures of Dodge and 3445 pictures of Jaguar cars from 1938 to 1970; (2) the car design feature dataset including 35 Dodge cars and 20 Jaguar cars from 1942 to 2017.
3.1.1. Car Style Images Dataset
The car style images dataset (CSI Dataset) is a dataset of car images about styling. The deep learning or statistical method focuses on the relationship between product appearance features and brand styles in this study. However, the difference between them is that the statistical process requires experts with the experience to extract design features. However, using the method of deep learning can directly input the pictures into the CSI Dataset. The computer with the CSI Dataset could learn automatically and build a CNN model to predict the style of the new car images. While the new photos are not in the CSI Dataset and could predict the brand or period style classification.
There are two categories of brands in this study, the American car brand Dodge and the British car brand Jaguar. The samples consist of 35 cars produced by Dodge (the proportion is 63%) and 20 vehicles produced by Jaguar (the proportion is 37%). Among the 35 Dodge cars, 18 were chosen as CSI Dataset models (the ratio is 51%). Additionally, among the 20 Jaguar vehicles, 10 of them were selected as CSI Dataset models (the ratio is 50%). The chosen cars are shown in Figure 4. The pictures of the Dodge are from 1942 to 1970, and the images of the Jaguar are from 1938 to 1969. Both of the styles are the streamlined style period and the popular style period. The predicted new pictures are all modern-style pictures after 1980. Among the 7248 photos of CSI Dataset, 3803 Dodge images were collected (52%), and 3445 Jaguar photos were collected (48%).
The input of these deep learning samples are only images, and there are no other additional values of the feature. The dataset is divided into three categories, training mode, verification mode, and test mode. The ratio of training mode to verification mode is about 5:1, a total of 6041 pictures of training mode samples (the proportion is 83%), and 1207 pictures of verification mode samples (the ratio is 17%). Finally, using 50 photos of the test mode as predictions, we obtained 26 pictures of Dodge cars (52%), and 24 pictures of Jaguar cars (48%).
Regarding the image data of the CSI Dataset, the 7248 images are all downloaded from Google’s image data. Simultaneously, the photos were selected from 28 car models of Dodge and Jaguar, and unsuitable pictures, for example, pictures of the interior of the car, including the engine, the interior of the vehicle, and partial close-up images of car design features, were discarded. In addition, the style of a specific period shows particular colors being represented, such as American cars with combinations of pink, pink and blue, or red and white being very common. However, the purpose of this research is to explore the feature of appearance, and therefore, for the image data collected by the CSI Dataset, there is no specific filtering made for colors.
3.1.2. Car Design Features Dataset
The car design features dataset (CDF Dataset) is a dataset collecting and recording every design feature of vehicles. The vehicles of the CDF Dataset also include the American and British brands Dodge and Jaguar. The features were extracted and recorded from 55 car pictures by an expert with a professional design background. We expect to know the correlation between design characteristics and brand style by statistical analysis. The curve of the figure graphic allows the style to be presented clearly, and it is possible to compare the vehicle styles of different brands. Descriptive statistics and chi-square analysis used the same CDF Dataset. This study defines and classifies the historical style period into three period styles—streamlined style, popular style, and modern style—as shown in Figure 5. According to the time series, the CDF Dataset included relevant pictures and documents on the internet while extracting the length and design features of the vehicles’ appearance.
3.2. Process
3.2.1. Deep Learning Tools and Methods
The deep learning method used in this research is a convolutional neural network (CNN). The tools used were Python language software and related modules—Tensorflow, Keras package, and VGG16 model. The CNN model referred to the machine learning model of Momonoki and Nanone and was initially used to classify images of cats and dogs. This study modifies the model described above to identify the design features and brand style of cars. The design of the experiment has two purposes. The first is to test the correctness of identifying different brand styles by deep learning. The second is to test the continuity of specific car brand styles with deep learning. This means that the vehicle images data of the CSI Dataset of a particular brand before 1970 was used to identify the brand of vehicle images after 1980. Additionally, the recognition accuracy is the standard to observe the continuity of the brand’s style. The identification process of the deep learning method is shown in Figure 6.
After the CNN model has learned to recognize the CSI Dataset, it is possible to use the heat map to observe the correct and misjudged pictures. The heat map method could find out the feature that affects the style more clearly to assist in extracting design features in statistical methods and machine learning methods. About the misjudgment pictures, it can also combine the car brand style, shape, design features, and historical perspectives to explain why this caused misjudgment. Then, it proposed evidence that two different brands reflect the same period style or proof of the same brand style under several of the same brand models.
3.2.2. Statistical Analysis Tools and Methods
The statistical methods used in this study include descriptive statistics and chi-square analysis. The data analysis tool is the chi-square analysis package of R language 3.6.1 software. The classification package can present various design features that affect the style of the car, including length, fender, number of headlights, and other features as classification attributes by using graphics and other visual methods. The vehicle period style includes the streamlined style, popular style, and modern style as target attributes for statistical analysis and chi-square analysis to explore the features of car style. The identification process of the statistical method is shown in Figure 7.
3.3. Evaluation Method of Design Features
The critical features or feature areas that affect the brand style can be obtained by the statistical chi-square test method and the heat map method of deep learning. The goal for distinguishing the relationship between features and brand style by the chi-square test, the p-value can be used as the order of the importance of a particular style. However, the deep learning heat map method can also record the number of times the feature area appears and then generate statistics to obtain the order of the importance of the specific style. Finally, it can evaluate whether the affected features of the two brand styles are the same by comparing two methods—the chi-square test method and the deep learning method.
3.4. Definition of Design Features, Style, Zeitgeist, and Style Consistency
The following is the definition of design features, brand style, period style, and zeitgeist in this investigation, which is limited to specific car brands with high sensitivity and particular brand style. Instead of discussing the design style or product style, the study only focused on the design features of the product.
- Period style or zeitgeist (X): It is an unusual force that dominates a particular era’s characteristics in the history of the world. It is also a popular fashion that regulated whether things were considered acceptable or tasteful in a specific period or schema. Contemporary style in history includes zeitgeist and period style, and most people regarded it as a factor of time context. The period style is classified into three styles in this study: streamlined style, popular style, and modern style.
- Styling (Y): This includes specific style for regional (Z) and brand style (V), as well as macro and micro factors. The macro factor is brand value, seasonableness, regional consumer preferences, etc. The micro factor is the shape, color, texture, etc. Regional style (Z): The particular preferences of different regions include color, style, fashion, etc. In this study, the regional styles are selected for the United States and the United Kingdom. Brand style (V): This refers to the brand’s suggested product appearance identification to help users acknowledge a brand style’s consistency. In this research, the selection of brand style (V) is Dodge and Jaguar.
- Design features (T): fender (FE), tailfin (TF), engine hood scoop (HS), headlamps (HL), bullet bumper (BB), tail form (TA), egg-crate grille (EG), quarter glass position (QG), sideways decoration (SD).
- Period style (X), regional style (Z), and brand style (V) are independent style types. The product features (T) of a specific age reflect the period style (X). The particular brand style with high style sensitivity determines the product characteristics (T) of a specific brand. Zeitgeist or period style (X) determines the specific brand style with high style sensitivity (Y). The definition from abstract to the concrete are the period style (X), the styling (Y) includes brand style (V), the regional styles (Z), and design features (T).
- Period style (X) is the multiplication of all design features and each feature’s weight plus the deviation value. : The weight of the fender. : The number of samples with fender in a certain period. B: bias. Period style (X) can be replaced by regional style (Z) or brand style (V). This study divided the brand style (V) into the Jaguar style and Dodge style. Besides, the regional style (Z) could be classified into two or three regions. This is an equation:
- Sigmoid and SoftMax are two commonly used functions in logistic regression and neural networks. The Sigmoid function is σ(z). Often used in binary classification problems, when Z→∞, σ(z)→1. When Z→−∞, σ(z)→0. The SoftMax function is . It has many applications in multivariate classification and neural networks. Input vector of the SoftMax function is . Composed of ( … ), all values are elements of the input vector of the SoftMax function. is the standard exponential function applied to each element of the input vector. The bottom of the formula is the normalized term. It ensures that the sum of all output values of the function is 1. K is the number of classes in the multi-class classifier. In this study, there are two brand styles: Jaguar and Dodge. Sigmoid is usually used for the classification of two categories. Besides, SoftMax can be used to classify multiple categories, such as the three styles of the period style, but this study uses SoftMax to classify the styles of the two brands.
- In order to evaluate the consistency or continuity of brand style, the terms and the formula are defined as follows. Style correct recognition rate/true positive rate (TPR), true negative rate (TNR), and style accuracy rate (Accuracy Rate). The true positive rate (TPR) measures the proportion of the brand Dodge that the computer with deep learning correctly predicted as Dodge style. The true negative rate (TNR) measures the ratio of the brand Jaguar that the computer with deep learning correctly predicted as the Jaguar style.
4. Results
This investigation used two methods, including the deep learning method and statistical data analysis, and we used two car brands as cases to construct a rational concept to illustrate the period style of car design. It is possible to find evidence of car styling, measure results, and understand it by visual tools. Besides, the investigation can also observe the car body design changes in the time series, differences in design features under different period styles, and the continuity of brand style.
4.1. Deep Learning Model
Utilizing deep learning, we can know whether convolutional neural networks can correctly identify two different brand styles. Then, we can calculate the correct rate of the confusion matrix under the verification mode and the test mode. Additionally, we can compare two different brands, whether there is a continuation of the old brand style, i.e., the brand style’s consistency.
4.1.1. Car Brand Recognition
This convolutional neural network model (CNN) is based on VGG16 as a reference model and can find some specific results by analysis. This model includes 13 convolutional layers, denoted by conv2D, respectively, two fully connected layers, indicated by interlayer and sequential, and five pool layers, respectively, shown by the maxpooling2D. The total training parameter is 16,813,634.
The accuracy and loss of the dataset include training and verification data and the full use of 7248 images of the dataset for deep learning. For identification, 100 training cycles (epochs) set, and one training cycle means that all samples are trained by the system once. From the first 50% to the final over 90%, the average accuracy of the last ten times in the verification mode is 95.90%. The result of the study shows that the accuracy of training mode and verification mode gradually increased with the number of training cycles. The result of the model is shown in Figure 8.
In addition, when the training period is 80 (epochs), the test accuracy exceeds the training accuracy. It is worth mentioning that the accuracy rate of the verification mode is higher than that of the training mode from the beginning, which is relatively rare in general object recognition. Normally, the accuracy rate of the dataset in the verification mode is lower than that of the training mode. To clarify whether it is a characteristic of the dataset or a phenomenon caused by the model, we created a small model (B-model) for verification additionally.
Now, we can consider the loss. The loss is calculated from the training and verification dataset. Unlike accuracy, the loss is not a percentage. It is the sum of the errors made for each example in the training or validation dataset. The loss of the training dataset was 1.2 at the beginning. The loss of the verification dataset was 0.8 initially and gradually decreased with the increase in the training period. The average loss of the last ten times in the verification dataset is 0.11. Still, we found a phenomenon, namely that the loss is not in a stable state. Sometimes it suddenly increases and then suddenly decreases. We can see this phenomenon in the chart.
Next, we can look at the results of the successful identification of the brand style. This experiment will predict the pictures that do not appear in the car data collection—the images of cars after 1980. It is possible to distinguish the American brand Dodge and the British brand Jaguar separately and use CNN models to predict the brands. For the recognition of style, the samples include charger RT produced by Dodge in 1980 and the S-type v8 produced by Jaguar in 2003. The style of these two cars is accurately identified, as shown in Figure 9a,b. The pie chart presents two brand colors. Orange represents Dodge’s brand style, and blue represents Jaguar’s brand style. It, respectively, predicts the samples that the ratios of specific brand styles are 99.9 and 99.6%.
Then, inputting the car Jaguar XJ model produced in 2009, it can be found that the orange block is almost the same as the blue block. The predicted Dodge brand style and Jaguar brand style rate are 40.4 and 59.6%, shown in Figure 9c. From a certain point of view, the brand style of this model is not easy to identify, and it may be perceived as two brand styles at the same time. This model has both design features of brand style and, finally, can still recognize success by heat map. The last sample was the Shelby, which was produced under the Dodge brand in 1984. Since the body shape is boxy, angular, and the shape of the lamp is also rectangular, it is entirely different from the form of the arc lamp of Jaguar. Therefore, it is predicted to be the Dodge brand. The expected ratio of Dodge styles is 99.7%, and the recognition is successful, shown in Figure 9d.
Regarding the results of misjudgments, the following are the cases and proportions of misjudgments. Simply put, it is to recognize the Dodge car as the Jaguar car or misjudge the Jaguar as the Dodge by the deep learning method. Next, take a look at the case of misjudgment. The CNN model misjudged the Dodge Neon, a car produced by Dodge in 2003, as a Jaguar. The heat map shows the feature area of observation and its focus on the streamlined shape, as shown in Figure 10a. The other case is the car XJ8 produced by Jaguar in 2004. The CNN model recognizes it as a Dodge. The heat map focus of observation is the apparent bumper and the square outline of the side. This design feature is very close to the Dodge’s boxy shape with an obvious bumper, as shown in Figure 10b.
Next, we produced a confusion matrix for the verification dataset and the test dataset. The verified car models are in the verification car dataset, and all of the models are between 1938 and 1975. The number of verified models was 1207, of which 1158 were judge correctly and 49 were judge incorrectly. The accuracy is 95.95%, as shown in Figure 11a below.
Regarding the test dataset, all the cars we tested were produced between 1980 and 2020. The number of test models is 50, of which 39 are correct, 11 are incorrect. There are seven incorrect samples by Dodge and four incorrect samples by Jaguar. The total accuracy rate is 78%, and the total error rate is 22%. Dodge’s correct percentage is 73%, and Jaguar’s correct ratio is 83%. See Figure 11b below.
Figure 11b depicts that the seven samples of Dodge were misjudged. Except for the Daytona in 1980, six of the seven vehicles were all produced after 1998. The models include the Charger in 2018, Neon in 1999, neon Sxt in 2003, The Viper GTS-Rs in 2018, and the Intrepid in 1998. This may be because modern cars tend to be arc-shaped, streamlined, and sports-car-shaped. The shape of Dodge after 1998 and before 1975 was very different. Instead, it is closer to the brand style of Jaguar cars. The four misjudged Jaguar cars were XJ6 in 1978, XJS in 1978, XJS V12 in 1996, and XJ8 in 2004. In addition to the obvious bumper just mentioned, the reason is that under the bumper, the obvious air intake is also regarded as Dodge’s brand style.
The last is the additional CNN verification model (Model B), as shown in Figure 12. A phenomenon found from the accuracy chart was that the accuracy rate and the actual accuracy rate cross when the training cycle is 80 (epochs), which is relatively rare in the identification of other cases. So, we did an additional test and used another smaller model to verify the correctness of the experiment repeatedly. After testing, we found the same results. Simply put, the results produced by the two models are the same. We define the original model as Model A, and this small model as Model B. The model accuracy rate of Model A is 95.92%, and the model accuracy rate of Model B is 94.1%. The accuracy of model training and the actual accuracy crossed at 80 epochs in the training period. The small model (Model B) is not as well as the original model (Model A) in terms of accuracy. Another finding is that the figure has shown the fluctuations in the accuracy rate graph to be more prominent. The instability of the loss is also more apparent than the original model (Model A).
4.1.2. The Induction of Features Attention Area of the Deep Learning Heat Map
It can be observed to apply the convolutional neural network and recognize it as one of the two vehicle brand styles by the heat map of deep learning. Why does the system identify the feature area from the Dodge car style or Jaguar car style? We make these features’ attention area into summaries and quantity statistics, as shown in Figure 13.
Since the heat map contains a wide area, we divided the total area into three smaller areas. One area is the windshield, engine hood, and car window. Another area is the headlights, grille, and front bumper. The final area is the door and side shape of the vehicle. Among them, the cumulate of headlights, grille, and front bumper with the maximum quantity, which is 30 models. It shows that this area has a higher proportion to recognize a specific brand style using deep learning methods. Respectively, the quantity of the other two areas is 19, as shown in Table 2.
Using this statistic method can give us a better understanding of why to classify the vehicle into one of the two brand styles. The features area of the heat map behind the convolutional neural network model is also helpful compared to the feature that affects the style using the chi-square test in statistical methods.
4.1.3. Brand Car Model and Period Style
From the above-mentioned car brand identification and the induction of the regional features using the heat map of deep learning, the car styling is closely related to the brand style and period style. For example, the brand style of the Dodge in modern cars, beginning in 1985, transformed from a boxy shape to a curvy one.
Due to this transformation of style, many cases of brand misrecognition occur. Looking at the heat map, one of the several feature attention areas is the waved and curvy shape of the hood extending to the front bumper. Another area form of the trunk at the rear end extends to the bumper at the back end. The other area extends from the windshield to the A-pillar at the side end and then spreads to the roof at the upper end. However, compared with the style of the early Dodge cars, they have a noticeable bumper, from the rocket-shaped tailfin to the trunk shape or from the windshield to the upper roof. They all have a boxy shape and the overall change in Dodge’s car style can be clearly seen.
The Jaguar car’s brand style is entirely different from Dodge cars. The early cars of Jaguar were an organic shape, and they even produced some popular sports car styles. However, since 1978, we also found that the Jaguar’s styling experienced some feature modification. For example, the headlights of the Jaguar XJS model have become a square shape. Additionally, the vehicle side of the Jaguar XJ6 has more apparent lines. It is therefore quite clear why the misjudgment from the heat map may occur. A specific feature of the particular car model has been different from the organic shape and curvy style of the Jaguar, so the CNN model recognizes it as Dodge’s style.
4.2. The Results of Statistics and Chi-Square Analysis
The car styling features are closely related to the period style using statistical analysis. The vehicle styling features include vehicle length and design features. The statistical analysis in this study comprises descriptive statistics and chi-square tests. It can find the difference in vehicle length under different period styles and car brand styles using descriptive statistics.
Next, we can use descriptive statistics to observe the correlation between vehicle length and period style. Additionally, we compare the vehicle length with the two brands in time series to know the differences between the two brands’ styles. Besides, it is possible to find the design features influenced by the particular period’s style using the chi-square test, and the feature differences under different brand styles. We can know the design features that affected the Dodge car brand style and ranked according to importance. Second, we can find out the most critical design feature that affects the style of a particular brand. A specific brand style produces a unique design feature.
4.2.1. Period Style and Car Styling Features
According to Figure 14 is shown, the relationship between the vehicle length and time series of cars of two brands, including 35 Dodge cars and 20 Jaguar cars. Additionally, the curve slowly rises during the streamlined style period, and the curve peaked in 1970 and then gradually declined. Until 2000, the curve again showed a small and slow upward trend.
The curve shows the trend of vehicle length, and can also see the impact caused by energy. For example, after the energy crisis in 1973, the length of cars generally became shorter. As consumers considered fuel consumption, there was no longer the need for a massive and useless rear compartment, and consumers began buying a suitable vehicle from a more economical point of view.
Then, we used the correlation between Dodge’s design features and period style using the chi-square test. After selecting ten appearance features, the method confirms a correlation between the period style and the design features. Table 3 below shows the chi-square test results between these nine features and different styles. Since the p-value is less than 0.05, we rejected the null hypothesis. So, there is statistical evidence that style and design features are related. Additionally, the chi-square test used R 3.6.1. The results show that, among the nine appearance features, only a p-value of the engine hood scoop and the egg-crate grille was greater than 0.05. Therefore, the period style is unrelated to the engine hood scoop and the egg-crate grille, while the other seven design features and the period style are significantly statistically related.
Next, using the chi-square test to find out the correlation between the design features of the two brands of cars and the period style. There is a total of 55 cars, divided into three styles. It finds that there are three design features: the p-value is greater than 0.05. One is the engine hood scoop, another is the egg crate grille, and the third is the rocket tailfin, as shown in Table 4. It means that in addition to these three characteristics, the other six design features are significantly statistically related to the period style.
However, why is the result of two brands using a chi-square test of 35 Dodge cars compared with 55 cars, and there is an additional rocket tailfin design feature that is not related to the period style? The reason is that Dodge is the style of an American car, so the rocket-shaped tailfin feature of the popular style is evident. Jaguar is a British car style. Although Jaguar is the same period as Dodge, it does not have the features of the American car style. It shows that different countries and different cultures have created various design features and brand styles. The period style of American car design does not represent the car design of British brands.
The features of car styling design under the three-period style classification is different. For example, the arc-shaped body tail appeared in the streamlined style period. Rocket-type tailfin and bullet bumpers all appeared earlier in the popular style period. The engine hood scoop appeared in the late popular style period. The design features of the two brand styles are not the same. Regarding the design features of the rocket-type tailfin, the British Jaguar models have no prominent rocket-type tailfin design features from the results of the chi-square analysis. It shows that the rocket-type tailfin is only an important design feature that represents the American popular style. There are apparent differences in the design styles of the two regional brands. This method can identify essential design features that affect the style of a car and find the differences in the different brand styles. It regards the stylistic differences in different cultures in car design history.
4.2.2. Evolution of Car Brand and Car Styling Features
In the beginning, we produced a chart showing the relationship between vehicle length and the time series for all 55 cars. In addition, we also made individual trend graphs for British Jaguar and American Dodge. The X-axis is the time series, and the Y-axis is the vehicle length. The vehicle length of the American Dodge cars was immense at the beginning, reaching a peak in the popular style period, and then decreasing year by year. The other line represents the car of British Jaguar, which is a smaller size than the American car initially, which may be due to the narrower British streets. In 1949, the convertible two-seater sports car, the XK120, was produced, and the vehicle length was small. It was also the fastest production car in the world at that time. After that, the length of the Jaguar’s vehicle length has increased year by year, even after the energy crisis, it was not affected.
It can be seen from Figure 15 that the car styles designed by the two brands are completely different. The American brand Dodge emphasizes practicality and makes appropriate adjustments with energy trends. The design focused on the middle-class group in the market, and the car body was designed to accommodate four people before the 1980s. After 1985, Dodge began to produce a two-seater sports car. In the early days, the British brand Jaguar emphasized performance and focused on the upper-class market, which influenced the subsequent car design style.
According to the survey results of 55 cars produced by Dodge and Jaguar, among the three period styles, it can be found that the vehicle length of the popular style is longer than the other two styles. According to the brand style, the survey between the two brands shows that each brand’s vehicle length has its own evolution. Dodge style has the longest vehicle length in the popular style period, while Jaguar style has the shortest vehicle length in the early days of the popular style period. The vehicle lengths of the two brands styles crossed in the early 1980s. After that, Dodge developed shorter-sized cars, and Jaguar developed towards middle and longer cars. Recently, the vehicle length of the two brands has also become similar.
4.2.3. Comparison of Feature Induction between Deep Learning Heat Map and Chi-Square Test
In this study, using the heat map of the convolutional neural network (CNN) model to summarize the areas of focus on the features, it is found that the design features that affect the two car brands’ styles are not the same as the use of chi-square analysis. Taking the application of the deep learning method as an example, car lights, grills, and front bumpers appear most frequently, representing that these are the most important design features, as shown in Table 3. However, the first three most important features by the chi-square test are the position of the triangular window, the shape of the tail form, and the fender shape. Therefore, the important features by applying the deep learning method that affects brand style are located in the front of the car body. In contrast, the important features by applying the chi-square test that affects style are all located on the side.
4.2.4. The Car Styling Features and Period Style
How to judge whether the car’s styling has a particular feature in a specific period style? In the same period, we can observe the same design features in different car models and different brands. One distinctive feature of the period style is the fender. The fender represents the period style of the streamlined period, and this design feature is spread to all car brands and all over the world. After the transition from the streamlined period to the popular style period, the fender disappeared slowly. In this study, both Dodge and Jaguar exhibit the same trend so that the fender can be regarded as an important feature affected by the period style.
The rocket-type tailfin is one feature of the period style. It appeared from 1950 to 1960, and all major automobile brands in the United States have this feature. Although Jaguar does not have it, this design feature can also be found in other British brands. The rocket-type tailfin simultaneously in different car models of different brands appears and then disappears, so the rocket-type tailfin can also be regarded as an important feature affected by the period style.
Many American vehicle models between 1965 and 1975 had these design features regarding engine hood scoop, but only a few Jaguar models had this design feature. Therefore, Jaguar’s design style is not as prominent, exaggerated, and obvious as the Dodge design. Bullet bumpers also appear in the regional brands of American automobiles. The engine hood scoop and the bullet bumper are not regarded as an important feature affected by the period style. These design features did not appear and then disappear simultaneously in different car models of different brands. Therefore, before 1980, Jaguar and Dodge’s style were basically two brand styles in the same period.
5. Discussion
5.1. Rediscovering Period Style, Brand Style, and Design Features by Deep Learning
Zeitgeist represents the spirit of an era, and it is used to show the abstract and general ideas (concepts, beliefs), morals (attitudes, tastes), and cultural atmosphere of a certain era. Since it is a time axis, it must be used to study the dynamics of history, time, change, and events. It is a diachronic and dynamic framework. The zeitgeist is actually known to Germans in the 18th and 19th centuries and certainly does not include backward countries and regions.
The brand style represents the unique style of a brand, spread to a region, with continuity. For example, Dodge is boxy, and Jaguar is more obviously organic and curvy. The modeling style is influenced by many factors, which by the zeitgeist, the period style, the regional cultural style, and the brand style. Reflected on the vehicle appearance is the design feature, and the integration is the model styling. The highest is the abstract zeitgeist, and the lower that is relatively concrete is a design feature.
The concepts of period style, brand style, and design features are defined in this research, which is feasible to predict the correctness and the continuity of brand vehicle style. Evidence can be obtained from convolutional neural networks of deep learning and heat map visualization, or statistics visualization based on time series. Therefore, this research provides not only automobile styling design, but also a new method that can be extended to product appearance design. It can redefine the relationship between the zeitgeist, the period style, the brand style, and the design features. Then, it will point out how to identify two-car styles of brands, as follows:
- Using deep learning to judge that a group of different models of the same brand with design features have the same brand style. The features include a wave-shaped area on the engine hood scoop, an arc-shaped headlight, and a melon-shaped grille. Although there are two different periods, it can be identified as the same brand style, and the probability of identifying the Jaguar style is 100%, as shown in Figure 16a.
- Using deep learning to judge that a group of different models of different brands with design features have the same period style. The features include the bumper and vehicle registration plate area, which are particularly obvious. Therefore, the Jaguar car model is identified as having a Dodge brand style, and the probability of identifying the Dodge style is 87.3%, as shown in Figure 16b.
5.2. The Difference between Statistics and Deep Learning
The main difference between statistics and deep learning is their purpose. To put it simply, the purpose of statistics is to explain, and deep learning is to recognize. If the study needs to explain or delve into the relationship between the rocket tailfin and Dodge brand style, statistical methods will be more suitable than deep learning. This article also observes that by the chi-square test, it is assumed that the rocket tailfin is not related to the Dodge brand style, but the p-value is 0.004, which is less than 0.05, so this assumption is discarded. Rocket tailfin is related to the Dodge brand style. The same method assumes that the rocket tailfin is not related to the Jaguar brand style, and the p-value is 0.09. Therefore, accept this assumption that the rocket tailfin has no correlation with the Jaguar brand style.
Suppose the study tries to use deep learning to explain the correlation between rocket tailfin and the brand style. First, use the deep learning model to judge the brand style and then use the heat map to observe the features areas. The results are different from the statistical analysis. The area of identification covered by the heat map may contain more than one feature, so it is not easy to get a clear correlation like statistical methods. Taking the car brand style in this study as an example, we can predict the later vehicle models based on the previous brand style car dataset. Still, the disadvantage of deep learning is that it is not easy to explain its classification reasons.
The second difference between the two methods is the sample quantity. The deep learning method requires more samples than the statistical method to classify, identify, and predict accurately. Therefore, in this study, the statistical method uses two brands, with 55 car models and 10 design features. The deep learning method uses 7248 car pictures, so applying the statistics method can get good inferences based on limited observations and regular deductive methods. With more models or design features, better results will not be obtained. On the contrary, the more pictures obtained in a deep learning dataset, the higher the accuracy rate. Besides, the more training cycles (epoch), the higher the accuracy rate obtained. If there are only a few pictures or a few training cycles (epoch), good predictions cannot be obtained.
5.3. Case Discussion
The brand style of the car can be predicted by this statistical method or car style recognition system of deep learning. Another application is to look at the brand car design context from the history of car product design. However, there are still some special cases, such as a car model when the period style transition, a retro car model, a car model with an obvious brand style, or a car model without an obvious brand style. The following are examples of three cars produced by Dodge and Jaguar. The first two cases are cars with obvious brand characteristics, and the third case is a car with both brand characteristics.
5.3.1. Dodge Custom Royal (1958)
Dodge Custom Royal represents popular style in American vehicle design history, and it has a long body design and an exaggerated rocket tailfin. The following will use statistical methods and deep learning methods to discuss cases.
- Statistical method: First of all, it can be seen that Dodge Custom Royal belongs to the long-length model among the Dodge brand models from the relevant trend chart of vehicle length and style in the dataset (see Figure 14). It can be known that it is a car of the popular style period because this unique vehicle length is significantly different from other periods. The Custom Royal belongs to the Dodge brand by comparing the vehicle length of the two brands in time series (see Figure 15). The model with the design features of the rocket tailfin, rear shape, and vehicle length are related to the Dodge brand style that learns from the chi-square analysis. It also reflects the design concept of the American brand Dodge before the energy crisis. So, the model can be regarded as the American car style.
- Deep learning method: First, use the convolutional neural network model, and the dataset is a collection of 7248 car modeling pictures. Then, the image of Custom Royal is predicted by the CNN model and is show its feature area of brand style by using a heat map. The result is the American brand Dodge (see Figure 17a). Therefore, we can see that using the deep learning method to predict the brand style of the car. In addition to predicting unknown models, it can also be used for known models by applying the statistical approach to explain the correlation between the design features and the brand style or period styles, such as the vehicle length and the rocket-shaped tailfin.
5.3.2. Jaguar XK150 (1958)
The Jaguar XK150 has a fender design, a rounded rear design, and a vehicle length of 177 inches. Next, it uses statistical methods and deep learning methods for case studies.
- Statistical method: First of all, due to the 177 inch vehicle length, it can judge whether it may be the modern style of the Dodge or it may be the streamlined style of the Jaguar by comparing the vehicle length of the two brands in time series (see Figure 15). Then, the Jaguar XK150 does not have the feature of a rocket-type tailfin, so it is not an American car style. XK150 also has a fender design, so it is not modern design. The model can be judged to be the streamlined style of the Jaguar.
- Deep learning: First, use the convolutional neural network model and apply the dataset collection of 7248 car modeling pictures. By using the CNN model to predict the brand style of Custom Royal’s images and the heat map to show the feature area, the results show that it is the British brand Jaguar (see Figure 17b). The Jaguar XK150 was a car with a smaller size in the late 1950s. At that time, the vehicle did not have the features of a rocket-type tailfin, and it did not relate to the style of American cars. The results of the chi-square analysis are also correct. Statistical methods can also provide a rational context and see the differences between British and American car styles. The result of applying deep learning to judge is also correct.
5.3.3. Jaguar XJ (1998)
Next, when applying statistical methods and deep learning methods for case studies of Jaguar XJ, this car is difficult to distinguish in two ways.
- Statistical method: First, from the size confirmation, the vehicle length of XJ is 197.8 inches. After comparing the vehicle length of the two brands in time series (see Figure 15), it may be the Dodge brand from 1980 to 1990 or the Jaguar brand from 1990 to 2000. The rest of the design features include four headlights, no rocket-type tailfin, no engine hood scoop, and a boxy tail form. It is not easy to identify the design features of the brand style, so this case is not easy to distinguish by the statistical method.
- Deep learning: This is also a vehicle that is not easily distinguished by deep learning. Taking the Jaguar XJ as an example, it can be seen that there are two blocks in the heat map with a significant color distribution. One part is on the engine hood of the car, because the wavy surface on the engine hood is a notable design feature of the British brand Jaguar. The other part is the boxy shape of the side of the car, which is the brand style of the American brand Dodge car. Therefore, this car combines two different brand styles from a certain angle. It can see that the predicted ratio is not as straightforward as the above two successful identification cases, and it is more ambiguous, as shown in Figure 9c. It can be seen that on the pie chart, the blue and orange blocks are almost equally divided, showing the difficult-to-identify features of the car.
5.4. Research Implication
- The difference between British brand Jaguar and American brand Dodge car styles. British brand cars did not follow the rules of American car design history. Jaguar maintains a consistent style in appearance and design features. The study found that the shapes of Dodge cars are mostly boxy shapes, but Jaguar cars are mostly organic, rich in curves and curved surfaces. Jaguar cars maintained an elegant and retro style, which continued from the streamlined period. After 1980, Jaguar cars are still maintained in the usual car brand style. Therefore, the two brand styles show significant differences in appearance.
- The study discovers new features that influence brand style through deep learning. The design features were identified by experts to define the influence of brand style or period style by statistical methods or machine learning methods. This way of expressing design features is exact, but it is not complete and comprehensive. The deep learning heat map method can find that the design features area affects the style connected to two features. However, it is not easy to describe in words. For example, the area extends from the windshield to the side A-pillars and extends to the upper roof, or the other area connected the bumper, the headlights, and the engine hood. It can see these brightly colored features from the deep learning heat map. They are also essential design features that affect brand style. However, it is not easy to precisely capture the feature-by-feature engineering or machine learning methods.
- The results of applying deep learning and heat maps to discover car brand consistency. The study uses deep learning methods to explore the consistency of brand style. It can find the apparent difference between the two brand styles from the dataset with 7248 car styling pictures, and the recognizable rate reached 95.9%. Moreover, another design feature area can be discovered from the heat map of deep learning, which is a design feature that cannot be generalized by the statistical chi-square test. These features are connected by many different design feature areas, and they are not easy to describe in words. However, it can be seen from the distribution of the heat map, and it is easy to know through observing the heat map. Finally, we predict the brand style trend of the new car from the collection of the old model’s pictures of brand cars. It was found that 78% corresponded with the original brand style, and misjudged models were 22%. They can also be known why it was misjudged from the heat map. In addition, the proportion of Dodge vehicles being misjudged is higher than that of Jaguar vehicles. It can be seen that the style of Dodge’s new cars has changed significantly. At the same time, the design of Dodge’s modern models is no longer a boxy appearance.
- The purpose of using CNN, heat map, and confusion matrix. The purpose of using CNN is to predict its category, which operates to predict different brand styles in this article. The purpose of using the heat map is to explain how to classify visually. For example, the system predicts a new case and classify into the Dodge brand style. The heat map can easily observe that the area of this case has the Dodge brand style. The purpose of using the confusion matrix is to calculate and observe the proportions and cases of correctness and error identified by CNN.
- The discovery of applying statistical methods for vehicle style. The study used two statistical methods, descriptive statistics and chi-square tests, in this study. Moreover, the result shows two brand styles have differences in vehicle length based on time series from the narrative statistics chart and visual presentation. Besides, the method also finds the trend and evolution of overall vehicle length. The chi-square test can be used to obtain the correlation between design features and styles in different periods.
- Vehicle models of different brands have the same period style design feature. Such as a fender design feature. After changing from a streamlined style to a popular style, the wheel arc feature disappeared slowly. Many brand cars can find this situation. Using deep learning or statistical methods can find the correlation between fender design features and period style. Additionally, different cars have this feature, and this phenomenon has spread all over the world.
- Does “spreading all over the world” become an element of the zeitgeist? Regarding the rocket-type tailfin, the brand Jaguar does not have this feature. However, if different brands in the UK or Europe area have the same design feature, it can explain that the “rocket-type tailfin” design feature is one of the symbols of the zeitgeist. Therefore, the spreading scope of design features should have a certain important relationship with the zeitgeist. Otherwise, the meaning of zeitgeist cannot be described by design features, rationality, and calculation, because it is a sociological vocabulary. If the rocket-type tailfin can be seen as a symbol of the zeitgeist, can the bullet bumper or engine hood scoop be a symbol of the zeitgeist? Therefore, the zeitgeist can only describe the period style, such as the “sixties” or the “romantic era”, but it cannot describe the design features.
- The research combines the relevant analysis of style and design features. In addition, applying deep learning with a design case study to explore the style differences of brand car models. The advantage of deep learning is identification and prediction, and the advantage of statistical methods is that it can find the correlation between style and design features. This method represents the innovation that combines the advantages of deep learning and statistical methods. Therefore, this investigation not only finds the correlation from the chi-square test but also completes the identification of new or old vehicle cases. It can further use the heat map method to observe and understand the main areas behind the deep learning identification related to the design features. It also discusses the evolution of automobile design styling based on the period style and points out the innovation and superiority of this method compared with traditional research methods. It is possible for applications and development in the future.
- How to explain the obvious difference in vehicle length between the two brands? The two brands’ design features are obviously different, and the consumer market influences the brand style. For example, Dodge targets the middle-class market, and Jaguar targets the wealthy. Because the target markets are different, targeting the middle class in the United States, Dodge has a long vehicle length during the popular style period. The middle class needs the vehicle to have more space to put luggage and accommodate children, so the bigger vehicle, the better. Due to the energy crisis in the later period, the length gradually shortened, which also considered the middle class’s burden. Jaguar targets the wealthy of the upper class, so at the beginning, it was the shape of a sports car with a short body. Even after the energy crisis in 1975, the car body was not too small. Because rich people did not worry about oil prices, only luxury cars can highlight the symbol of dignity.
- Vehicle length is a design feature influenced by the brand style or the period style. From this article, Dodge and Jaguar each formed two different brands of vehicle length trends. It can be proved by the trend chart of the two brands. However, at the same time, the vehicle length of a particular brand is also influenced by the period style. The period style is divided into three different period styles; you will find that Dodge’s models conform to the American period style’s influence. The vehicle length is particularly long in the popular style period, but not every brand follows this trend.
- How to explain that Jaguar does not have an obvious rocket tailfin? Different regions have different influences on the period style. American brands are definitely more affected by American period styles (streamlined style, popular style, and modern style) than British brands. Therefore, Jaguar does not have an obvious rocket-type tailfin, which shows that it has not been affected by the American style. However, not all British brands are devoid of a rocket-type tailfin, such as Cresta PA of British brand Vauxhall, both of which have this design feature. Therefore, it is not unreasonable to regard the rocket-type tailfin as a design feature influenced by the zeitgeist or the period style. However, the Jaguar D-type has a tailfin in the center of the rear, but not a rocket-typed one. Additionally, it is not on the two sides of the rear. Since the invention of the tailfin was deeply influenced by aerodynamics, many brands were affected by it. Besides, the United Kingdom once launched a rocket, but it only succeeded once, much less than that of the United States. The image of the rocket has not captured the British imagination or the consumer market as it has in the US. It possibly due to this reason, so the British brand Jaguar does not have a rocket-type tailfin design element.
- What can heat maps of deep learning help this study observe? The heat map of deep learning is originally the visual area that the deep learning process focuses on, which can help this research to observe the classification of particular brand styles and the reasons behind the identification. The advantages of deep learning are that it is easy to classify, predict, or identify. The disadvantage of deep learning is a black box, and it is not easy for people to understand the way behind it. However, the heat map can help us to observe which area is important using deep learning recognition. Then, learning to classify and predict. Deep learning heat maps can explain the correlation between style and design features, just like the correlation between elephant and trunk features. It is a method that applies image analysis to confirm the design features of a car that is influenced by style.
- The results by the heat map area of deep learning and the statistical method’s design features are different. The design feature areas summarized in the heat map area are mostly on the front of the body, such as bumpers, headlights, and front grille areas. The second most common area is on the side or above the engine hood. The design feature areas summarized by statistical methods are relatively clear, such as a fender, tailfin, engine hood scoop, etc. The reason is that the heat map distribution area cannot be as concentrated as a single feature and can only focus on one area. On the other hand, there is an issue presented by the camera angle used to capture the image. Due to the shooting angle, all design features cannot be seen. The inherent differences in the two different methods—one being image-based deep learning, and the other, data-analysis-based statistical methods—means that different results are produced.
- Which significantly affects the design feature, brand style, or period style? Regarding the car shape style of Dodge’s boxy style and Jaguar’s curvy style, the brand style’s influence is more significant than period style. The evidence is that the shape style is slowly changed so that they will not disappear too quickly. These shape styles will continue to appear in the later car models. However, for car design features such as fender, rocket-type tailfin, and engine hood scoop, the influence of the period style is more significant than the brand style. The evidence is that these features appeared and then disappeared with a specific period. Additionally, the design features eventually spread to other vehicle manufacturers around the world.
- A possible definition of the zeitgeist. This investigation uses empirical scientific research to point out the zeitgeist’s possible definition, though the term has never been rigorous. In this article, one of the limitations is that we believe there are only design features that can precisely express, include text, numbers, visual elements that can convert into text or numbers, etc. The concepts interpreted by this design feature, such as identification, classification, and style formula, including y = f (design features), are the objects and methods of design style that we should study. One of the questions that should be considered when using this method is whether rigorous calculations and inferences can represent that everyone’s sense of style will be the same.
5.5. Applications
In this section, we will discuss how to apply this period style or brand style classification system. The system uses two methods include statistical methods and deep learning. The purpose is to identify the car styles of different brands. Of course, another application is to identify different period styles. In this article, the car’s brand style is the key point, the period style is the supplement, and the actual application is the same. The applications include three areas as follows.
The first field is to identify if products identify or style with the same brand image, including branded car’s peripheral products, co-branding products, regional style decorations, or souvenirs, and then confirm whether they are consistent with the brand style or regional style.
The second field is to establish a car-style recognition system, then use this system to train young designers or design students to design a product with a specific style. The issue is how to evaluate a designer’s style consistently with a company brand as expected. A young designer can apply the approach proposed in this paper to compare different brands’ styles for identifying the correct style.
The third field is the TV and film industries. For example, Knight Rider is a 1980s TV series about an American car-driving crime-fighting hero. The appearance of the TV series must be characteristic of the American style. The car prominently featured in the series must also be recognizably American, with significant bumpers, boxy shapes, square car headlamps, etc. No matter whether the brand style of American or the nostalgic period style, we can use the car style classification system to initially judge whether the stage’s properties are suitable for this scene, as shown in Figure 18.
6. Conclusions
This article, in a sense, ignites hope that deep learning heat map analysis is supplemented by statistical methods to analyze and rethink styles. It can produce quite interesting results, though the technical threshold is not as high as imagined. The study has to propose an approach to integrating image and data analysis to explore a specific product’s shape in a certain period. This approach can relatively correctly judge the period style corresponding to a specific vehicle styling case in a certain period and test the influence on private brand vehicles’ styling. This investigation makes the following four conclusions.
The first is the comparison of the two brand styles. The American brand Dodge has a boxy shape, generous vehicle style, and focuses on the middle-class market. While the British brand Jaguar is the curvy shape, aristocratic, and aimed at high-end markets. The brand style is the core value of the brand, so it is crucial to find and maintain the brand style. This study provides two methods. Both deep learning and statistics can identify the brand style. The second is the comparison between statistics and deep learning. Statistics are suitable for finding out the relationship between features and brand style. Deep learning is suitable for classification or identification. Therefore, this study has two datasets—the car design feature dataset and the car styling images dataset. Statistics is the method for data analysis, and deep learning is the method for image analysis.
The third is that the heat map can observe the deep learning model’s feature area and provide a clue to explore the relationship between style formation and design features. From observing the heat map, everyone can more clearly understand why they are classified as specific brand styles. By comparing the deep learning heat map method and the statistical method chi-square test. It can be seen that the two methods for the design features that affect the style are inconsistent. The fourth is that the brand style recognition system can be applied in a wide range, including brand style learning tools for young designers, confirmation of the style consistency of brand style products, and confirmation of the style of scene items in TV series and movies.
To sum up, this investigation applying pictures for deep learning and design features for analysis present advantages and limitations. The use of deep learning is to make accurate identification or predictions. Statistical models are also used to explain the relationship between feature attributes and brand styles. Several predictions are made through applying various methods, including regression analysis, decision tree analysis, and Bayes’ theorem. However, these analyses do not demonstrate a significant advantage in identifying or predicting car styling and brand consistency. On the contrary, it seems relatively easy to identify or predict objects through CNN by simply submitting pictures in deep learning.
As time goes by, one of the two brands’ vehicle styles will tend to evolve into another brand’s style. For example, the car with a boxy form will tend to the curvy form, or the long-sized vehicle will tend to the short-sized. In other words, the relationship of brand style will become more and more symmetrical, so “symmetry” will be used to emphasize the balance of the two brands’ style evolution.
Author Contributions
The authors built the framework of this research together. H.-H.W. planned, organized, and supervised the content of the paper, and C.-P.C. was responsible for collecting automotive-related data to perform statistics and operation of deep learning. All authors have read and agreed to the published version of the manuscript.
Funding
This work was supported in part by a grant, 109-WFAA-310-249, from MOST, Taiwan.
Acknowledgments
The author is extremely grateful for the technical guidance on machine learning from Stella Lin in the computer and information networking center of National Taiwan University.
Conflicts of Interest
The authors declare no conflict of interest.
References
- Karjalainen, T.-M. Semantic Knowledge in the Creation of Brand-Specific Product Design. In Proceedings of the 5th European Academy of Design Conference, Barcelona, Spain, 28–30 April 2003. [Google Scholar]
- Karjalainen, T.-M. It looks like a Toyota: Educational approaches to designing for visual brand recognition. Int. J. Des. 2007, 1, 67–81. [Google Scholar]
- Ostrosi, E.; Bluntzer, J.-B.; Zhang, Z.; Stjepandić, J. Car style-holon recognition in computer-aided design. J. Comput. Des. Eng. 2019, 6, 719–738. [Google Scholar] [CrossRef]
- Sparke, P.; Hodges, F.; Coad, E.D.; Stone, A. The New Design Source Book; Knickerbocker Press: New York, NY, USA, 1997. [Google Scholar]
- Aaker, D.A. Brand Portfolio Strategy: Creating Relevance, Differentiation, Energy, Leverage, and Clarity; Free Press: New York, NY, USA, 2006. [Google Scholar]
- Karjalainen, T.-M.; Warell, A. Do you recognise this tea flask? Transformation of brand-specific product identity through visual design cues. In International Design Congress; IASDR 2005; National Yunlin University of Science and Technology: Douliu, Taiwan, 2005. [Google Scholar]
- Person, O.; Snelders, D. Brand styles in commercial design. Des. Issues 2010, 26, 82–94. [Google Scholar] [CrossRef]
- Hyun, K.H.; Lee, J.-H.; Kim, M.; Cho, S. Style synthesis and analysis of car designs for style quantification based on product appearance similarities. Adv. Eng. Inform. 2015, 29, 483–494. [Google Scholar] [CrossRef]
- Person, O.; Schoormans, J.; Snelders, D.; Karjalainen, T.-M. Should new products look similar or different? The influence of the market environment on strategic product styling. Des. Stud. 2008, 29, 30–48. [Google Scholar] [CrossRef]
- Keller, K.L. Conceptualizing, measuring, and managing customer-based brand equity. J. Mark. 1993, 57, 1–22. [Google Scholar] [CrossRef]
- Wijaya, B.S. Dimensions of brand image: A conceptual review from the perspective of brand communication. Eur. J. Bus. Manag. 2013, 5, 55–65. [Google Scholar]
- Shao, W. Research on Chinese Car Style Trends under the Oriental Aesthetics; Tianjin University: Tianjin, China, 2007. [Google Scholar]
- Huang, Z.-Q. Research on Evolution of Automotive Design Style; Jiaotong University: Shanghai, China, 2010. [Google Scholar]
- Zhao, Y.-F. The Application of Storm Sculpture Concept in the Automobile Modeling Design; Chongqing University: Chongqing, China, 2016. [Google Scholar]
- Xu, Z.-M.; Zhang, Q.; Jing, S.-Y.; Lu, C.-D. Modeling for style description of shape design. Comput. Appl. Res. 2005, 22, 38–41. [Google Scholar]
- Hiroshi, O. Basis of Design; Talubook: Taipei, Taiwan, 1974. [Google Scholar]
- Warell, A. Design Syntactics: A Functional Approach to Visual Product form Theory, Models, and Methods; Chalmers University of Technology: Gothenburg, Sweden, 2001. [Google Scholar]
- Xie, M.-F. A Typological Study on the Taiwan Railway Stations Built during the Japanese-Colonization; Tunghai University: Taichung, Taiwan, 2001. [Google Scholar]
- Downing, F.; Flemming, U. The bungalows of Buffalo. Environ. Plan. B Plan. Des. 1981, 8, 269–293. [Google Scholar] [CrossRef] [Green Version]
- You, X.-Z.; Chen, G.-X.; Deng, Y.-X. A study on the form generation of Mackintosh style chairs. J. Des. 2007, 12, 17–31. [Google Scholar]
- Wang, H.-H.; Chen, C.-P. Styrule-A Classification System of Car Styling. J. Des. 2004, 9, 107–121. [Google Scholar]
- Chen, K.-M.; Chen, L.-L. Perception of realism for real-time rendered virtual prototypes and physical models: Using car styling as examples. J. Des. 2007, 12, 37–52. [Google Scholar]
- Shackleton, C.D.A.J. Design History of the Car: An Empirical Overview of the Development of Layout and Form. In Proceedings of the ICED 03 14th International Conference on Engineering Design, Stockholm, Sweden, 19–21 August 2003. [Google Scholar]
- Hubka, V.; Eder, W. Theory of Technical Systems, A Total Concept Theory for Engineering Design; Springer: New York, NY, USA, 1988. [Google Scholar]
- Mortensen, N.H.; Andreasen, M.M. Contribution to a Theory of Detailed Design. In Proceedings of the DFX 1999: 10th Symposium on Design for Manufacturing, Schnaittach/Erlangen, Germany, 14–15 October 1999; pp. 83–88. [Google Scholar]
- Langworth, R.M. Complete Book of Collectible Cars: 70 Years of Blue Chip Auto Investments 1930–2000; Publications International: Morton Grove, IL, USA, 2000. [Google Scholar]
- Hendrix, J.; Hendrix, J.S. Aesthetics & the Philosophy of Spirit; Peter Lang: New York, NY, USA, 2005. [Google Scholar]
- Saarinen, E.; Pelkonen, E.L.; Albrecht, D. Eero Saarinen: Shaping the Future; Yale University Press: New Haven, CT, USA, 2006. [Google Scholar]
- El-Zeiny, R.M.A. Interior Design Styles and Socio-demographic Characteristics in Egypt: From the concept of Zeitgeist. Environ. Behav. Proc. J. 2016, 1, 280–290. [Google Scholar] [CrossRef] [Green Version]
- Krause, M. What is Zeitgeist? Examining period-specific cultural patterns. Poetics 2019, 76, 101352. [Google Scholar] [CrossRef]
- Almond, K. Made in Yorkshire: Harnessing the Zeitgeist. Catwalk: J. Fash. Beauty Style 2014, 3, 1–24. [Google Scholar]
- Reichenbach, M. Fasten Your Seat Belt; Springer: New York, NY, USA, 2016. [Google Scholar]
- Neiman, F. The Zeitgeist of Matthew Arnold; Publications of the Modern Language Association of America: New York, NY, USA, 1957; Volume 70, pp. 977–996. [Google Scholar]
- Xie, X.-Z.; Xue, S. Application of Cifar-10 model for improved in armor target binary classification. J. Ordnance Equip. Eng. 2019, 28, 141–144. [Google Scholar]
- Parkhi, O.M.; Vedaldi, A.; Zisserman, A.; Jawahar, C. Cats and dogs. In Proceedings of the 2012 IEEE Conference on Computer Vision and Pattern Recognition, Providence, RI, USA, 16–21 June 2012; pp. 3498–3505. [Google Scholar]
- Nguyen, T.T.-N.; Le, T.-L.; Vu, H.; Hoang, V.-S. Towards an Automatic Plant Identification System without Dedicated Dataset. Int. J. Mach. Learn. Comput. 2019, 9, 26–34. [Google Scholar] [CrossRef] [Green Version]
- LeCun, Y.; Bottou, L.; Bengio, Y.; Haffner, P. Gradient-based learning applied to document recognition. Proc. IEEE 1998, 86, 2278–2324. [Google Scholar] [CrossRef] [Green Version]
- Seewald, A.K. Digits-A Dataset for Handwritten Digit Recognition; Technical Report; Austrian Research Institut for Artificial Intelligence: Vienna, Austria, 2005. [Google Scholar]
- Xiao, H.; Rasul, K.; Vollgraf, R. Fashion-Mnist: A Novel Image Dataset for Benchmarking Machine Learning Algorithms. arXiv 2017, arXiv:1708.0774. [Google Scholar]
- Chu, W.-T.; Guo, H.-J. In Movie genre classification based on poster images with deep neural networks. In Proceedings of the Workshop on Multimodal Understanding of Social, Affective and Subjective Attributes, Mountain View, CA, USA, 23–27 October 2017; pp. 39–45. [Google Scholar]
- Lecoutre, A.; Negrevergne, B.; Yger, F. Recognizing Art Style Automatically in painting with deep learning. In Proceedings of the Ninth Asian Conference on Machine Learning; ACML: Seoul, Korea, 2017; pp. 327–342. [Google Scholar]
- Selvaraju, R.R.; Das, A.; Vedantam, R.; Cogswell, M.; Parikh, D.; Batra, D. Grad-CAM: Why did you say that? arXiv 2016, arXiv:1611.07450. [Google Scholar]
- MacKenzie, I.S. Human-Computer Interaction: An Empirical Research Perspective; Morgan Kaufmann: Waltham, MA, USA, 2012. [Google Scholar]
- You, W.-L.; Lin, J.-M. A study on the quantitative description of product styles-with sedans as a case study. J. Des. 1997, 2, 89–107. [Google Scholar]
- Chen, H.-Y.; Zhang, Y.-M. A study on the feature relationship of automobile contour. J. Des. 2009, 9, 87–105. [Google Scholar]
- Lin, M.-H.; Boson, H.; Chen, C.-C. The retro-expressions of the classic car styling. J. Des. 2009, 14, 31–49. [Google Scholar]
- Scott, J.; Marshall, G. A Dictionary of Sociology; Oxford University Press: New York, NY, USA, 2009. [Google Scholar]
Figure 1.
Examples of zeitgeist: (a) car design like airplane; (b) car shape with rocket-shaped tailfin.
Figure 1.
Examples of zeitgeist: (a) car design like airplane; (b) car shape with rocket-shaped tailfin.

Figure 2.
Concept map of object recognition using convolutional neural network.

Figure 3.
Use the heat map to visualize the features identified as elephant or mouse by deep learning: (a) elephant; (b) mouse.
Figure 3.
Use the heat map to visualize the features identified as elephant or mouse by deep learning: (a) elephant; (b) mouse.

Figure 4.
Selected 28 car models as car style images dataset, blue and red are Dodge and Jaguar brands, respectively.
Figure 4.
Selected 28 car models as car style images dataset, blue and red are Dodge and Jaguar brands, respectively.

Figure 5.
Brand car design feature dataset used for statistical analysis.

Figure 6.
Identification process of deep learning method for vehicle brand recognition.

Figure 7.
The process of the statistical analysis method for vehicle brand and period recognition.

Figure 8.
Accuracy and loss of car style images dataset using convolutional neural network model.

Figure 9.
Successful identification case of cars after 1980 using heat map analysis of the convolutional neural network model: (a) Dodge Charger RT; (b) Jaguar S-type v8; (c) Jaguar XJ; (d) Dodge Shelby.
Figure 9.
Successful identification case of cars after 1980 using heat map analysis of the convolutional neural network model: (a) Dodge Charger RT; (b) Jaguar S-type v8; (c) Jaguar XJ; (d) Dodge Shelby.

Figure 10.
Misjudged identification case of cars after 1980 using heat map analysis of the convolutional neural network model: (a) Dodge Neon; (b) Jaguar XJ8.
Figure 10.
Misjudged identification case of cars after 1980 using heat map analysis of the convolutional neural network model: (a) Dodge Neon; (b) Jaguar XJ8.

Figure 11.
Confusion matrix of the car style images dataset vehicles under verification and test mode: (a) vehicles under verification mode between 1938 and 1975; (b) vehicles under test mode between 1980 and 2020.
Figure 11.
Confusion matrix of the car style images dataset vehicles under verification and test mode: (a) vehicles under verification mode between 1938 and 1975; (b) vehicles under test mode between 1980 and 2020.

Figure 12.
Accuracy and loss of car style images dataset using additional verification model.

Figure 13.
Convolutional neural network model (CNN) heat map focus area.

Figure 14.
The related trends between the length and style of the car design feature dataset.

Figure 15.
Comparison of vehicle length of two brands in time series.

Figure 16.
Use of the heat map to identify the following two-car styles: (a) distinguish that a group of different cars of the same brand with the same brand style; (b) distinguish that a group of cars of different brands with the same period style.
Figure 16.
Use of the heat map to identify the following two-car styles: (a) distinguish that a group of different cars of the same brand with the same brand style; (b) distinguish that a group of cars of different brands with the same period style.

Figure 17.
Applying heat map analysis of the convolutional neural network model for recognizing case: (a) Dodge Custom Royal; (b) Jaguar XK150.
Figure 17.
Applying heat map analysis of the convolutional neural network model for recognizing case: (a) Dodge Custom Royal; (b) Jaguar XK150.

Figure 18.
Apply the car-style recognition system to determine vehicles that fit the regional style, period style, or suitable scene.
Figure 18.
Apply the car-style recognition system to determine vehicles that fit the regional style, period style, or suitable scene.


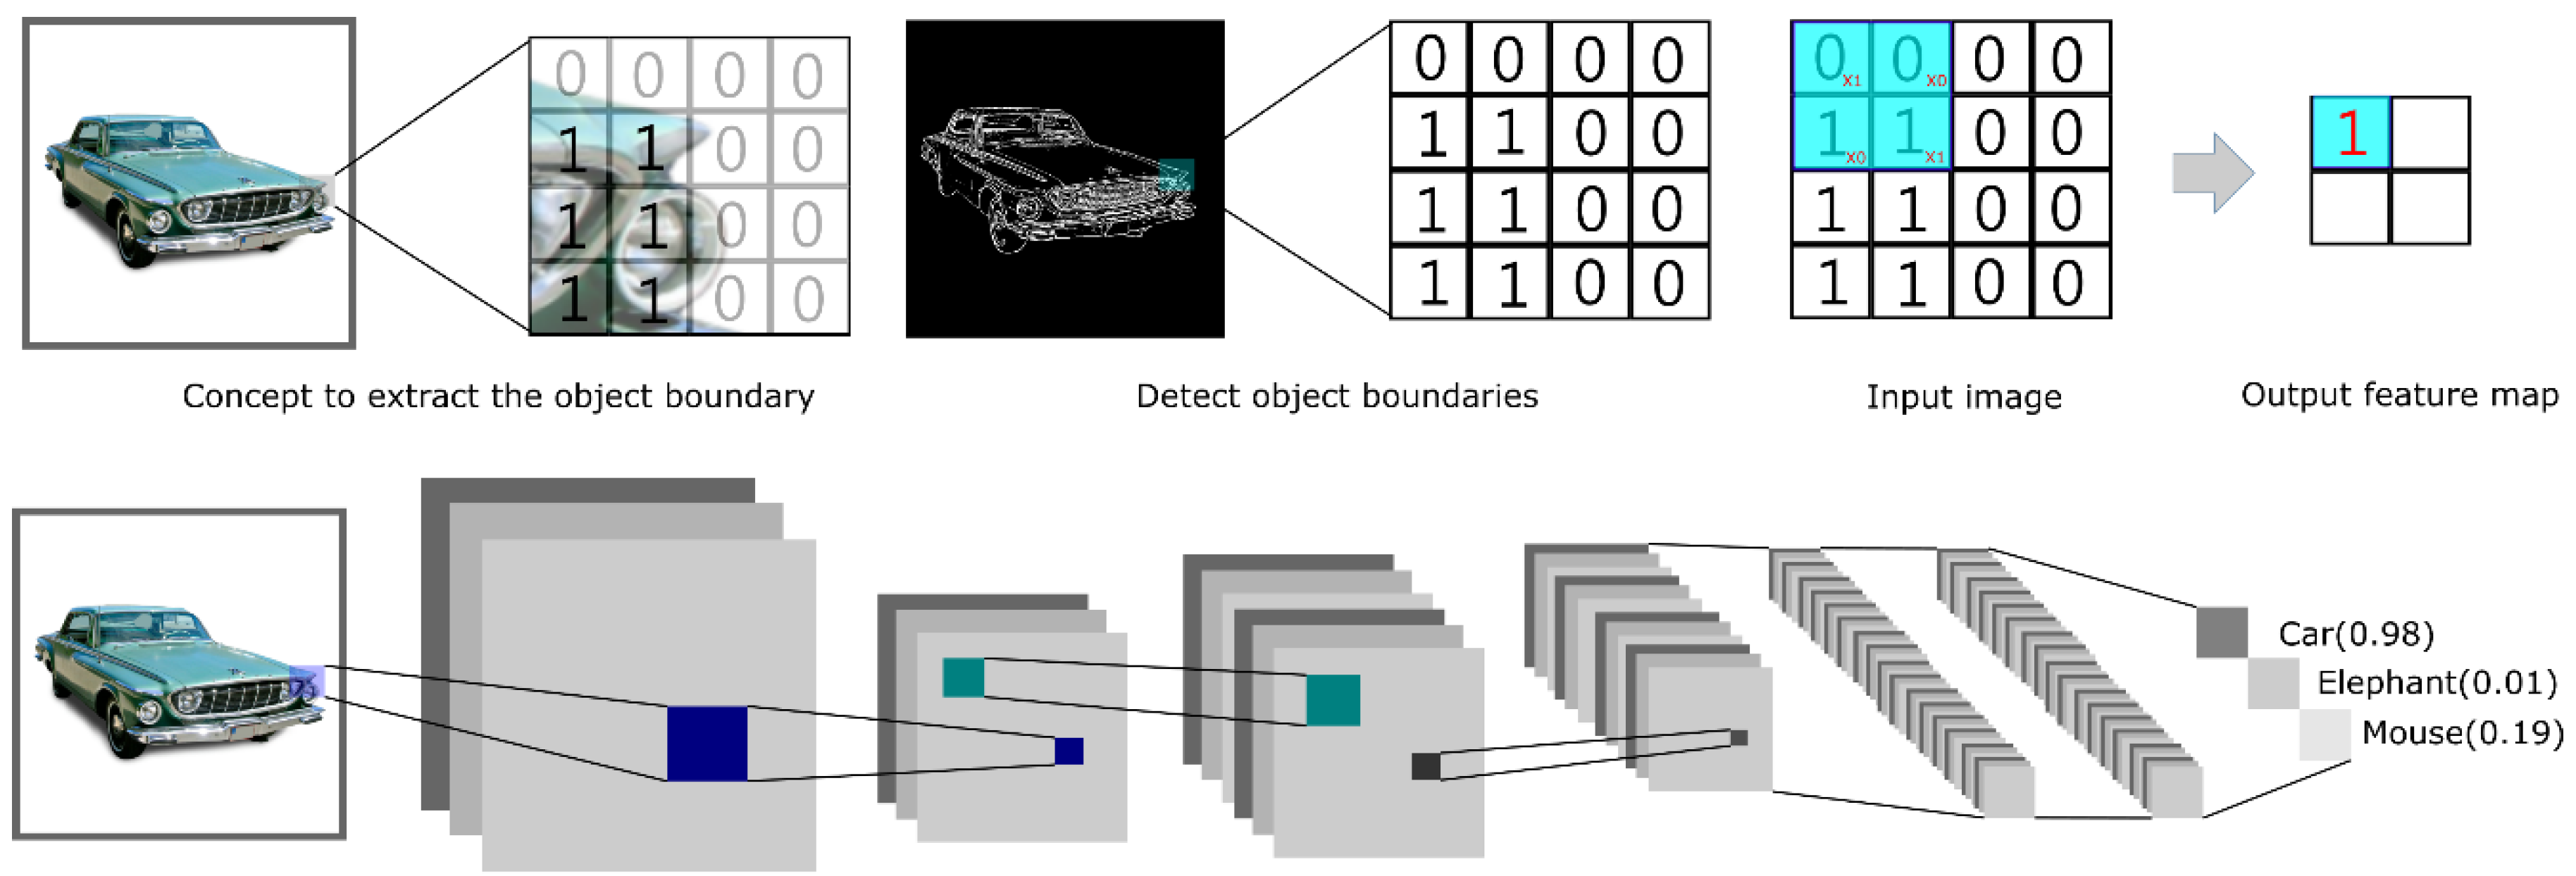
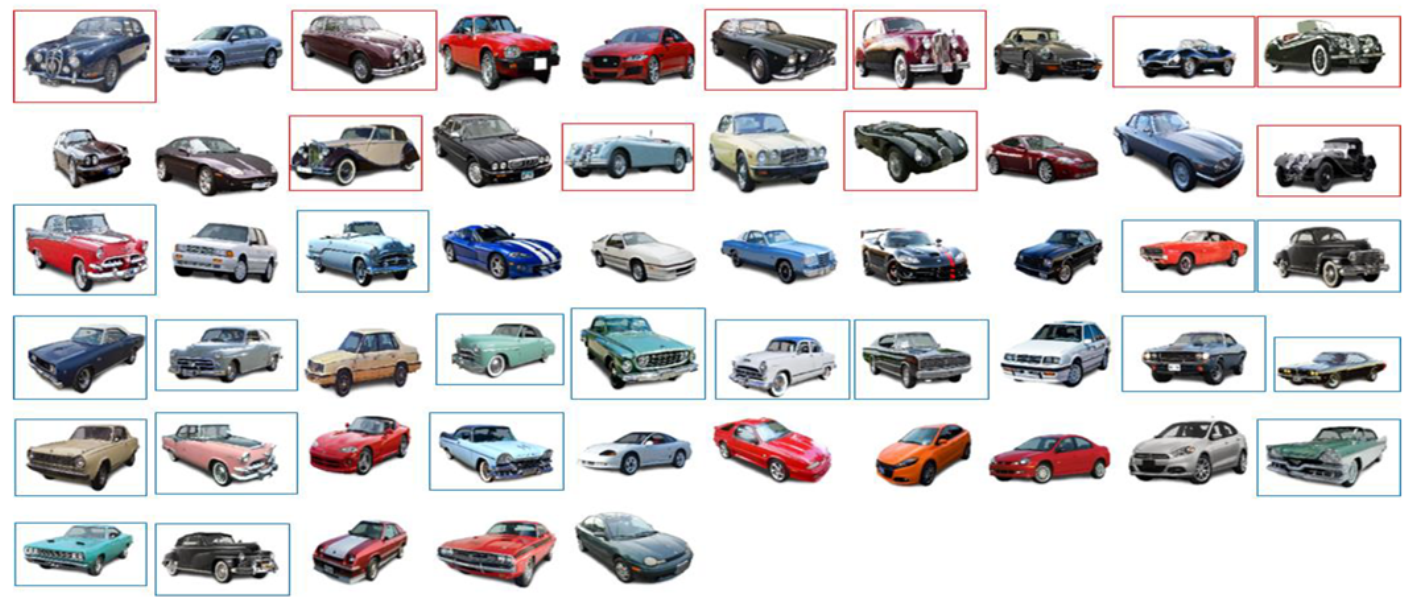
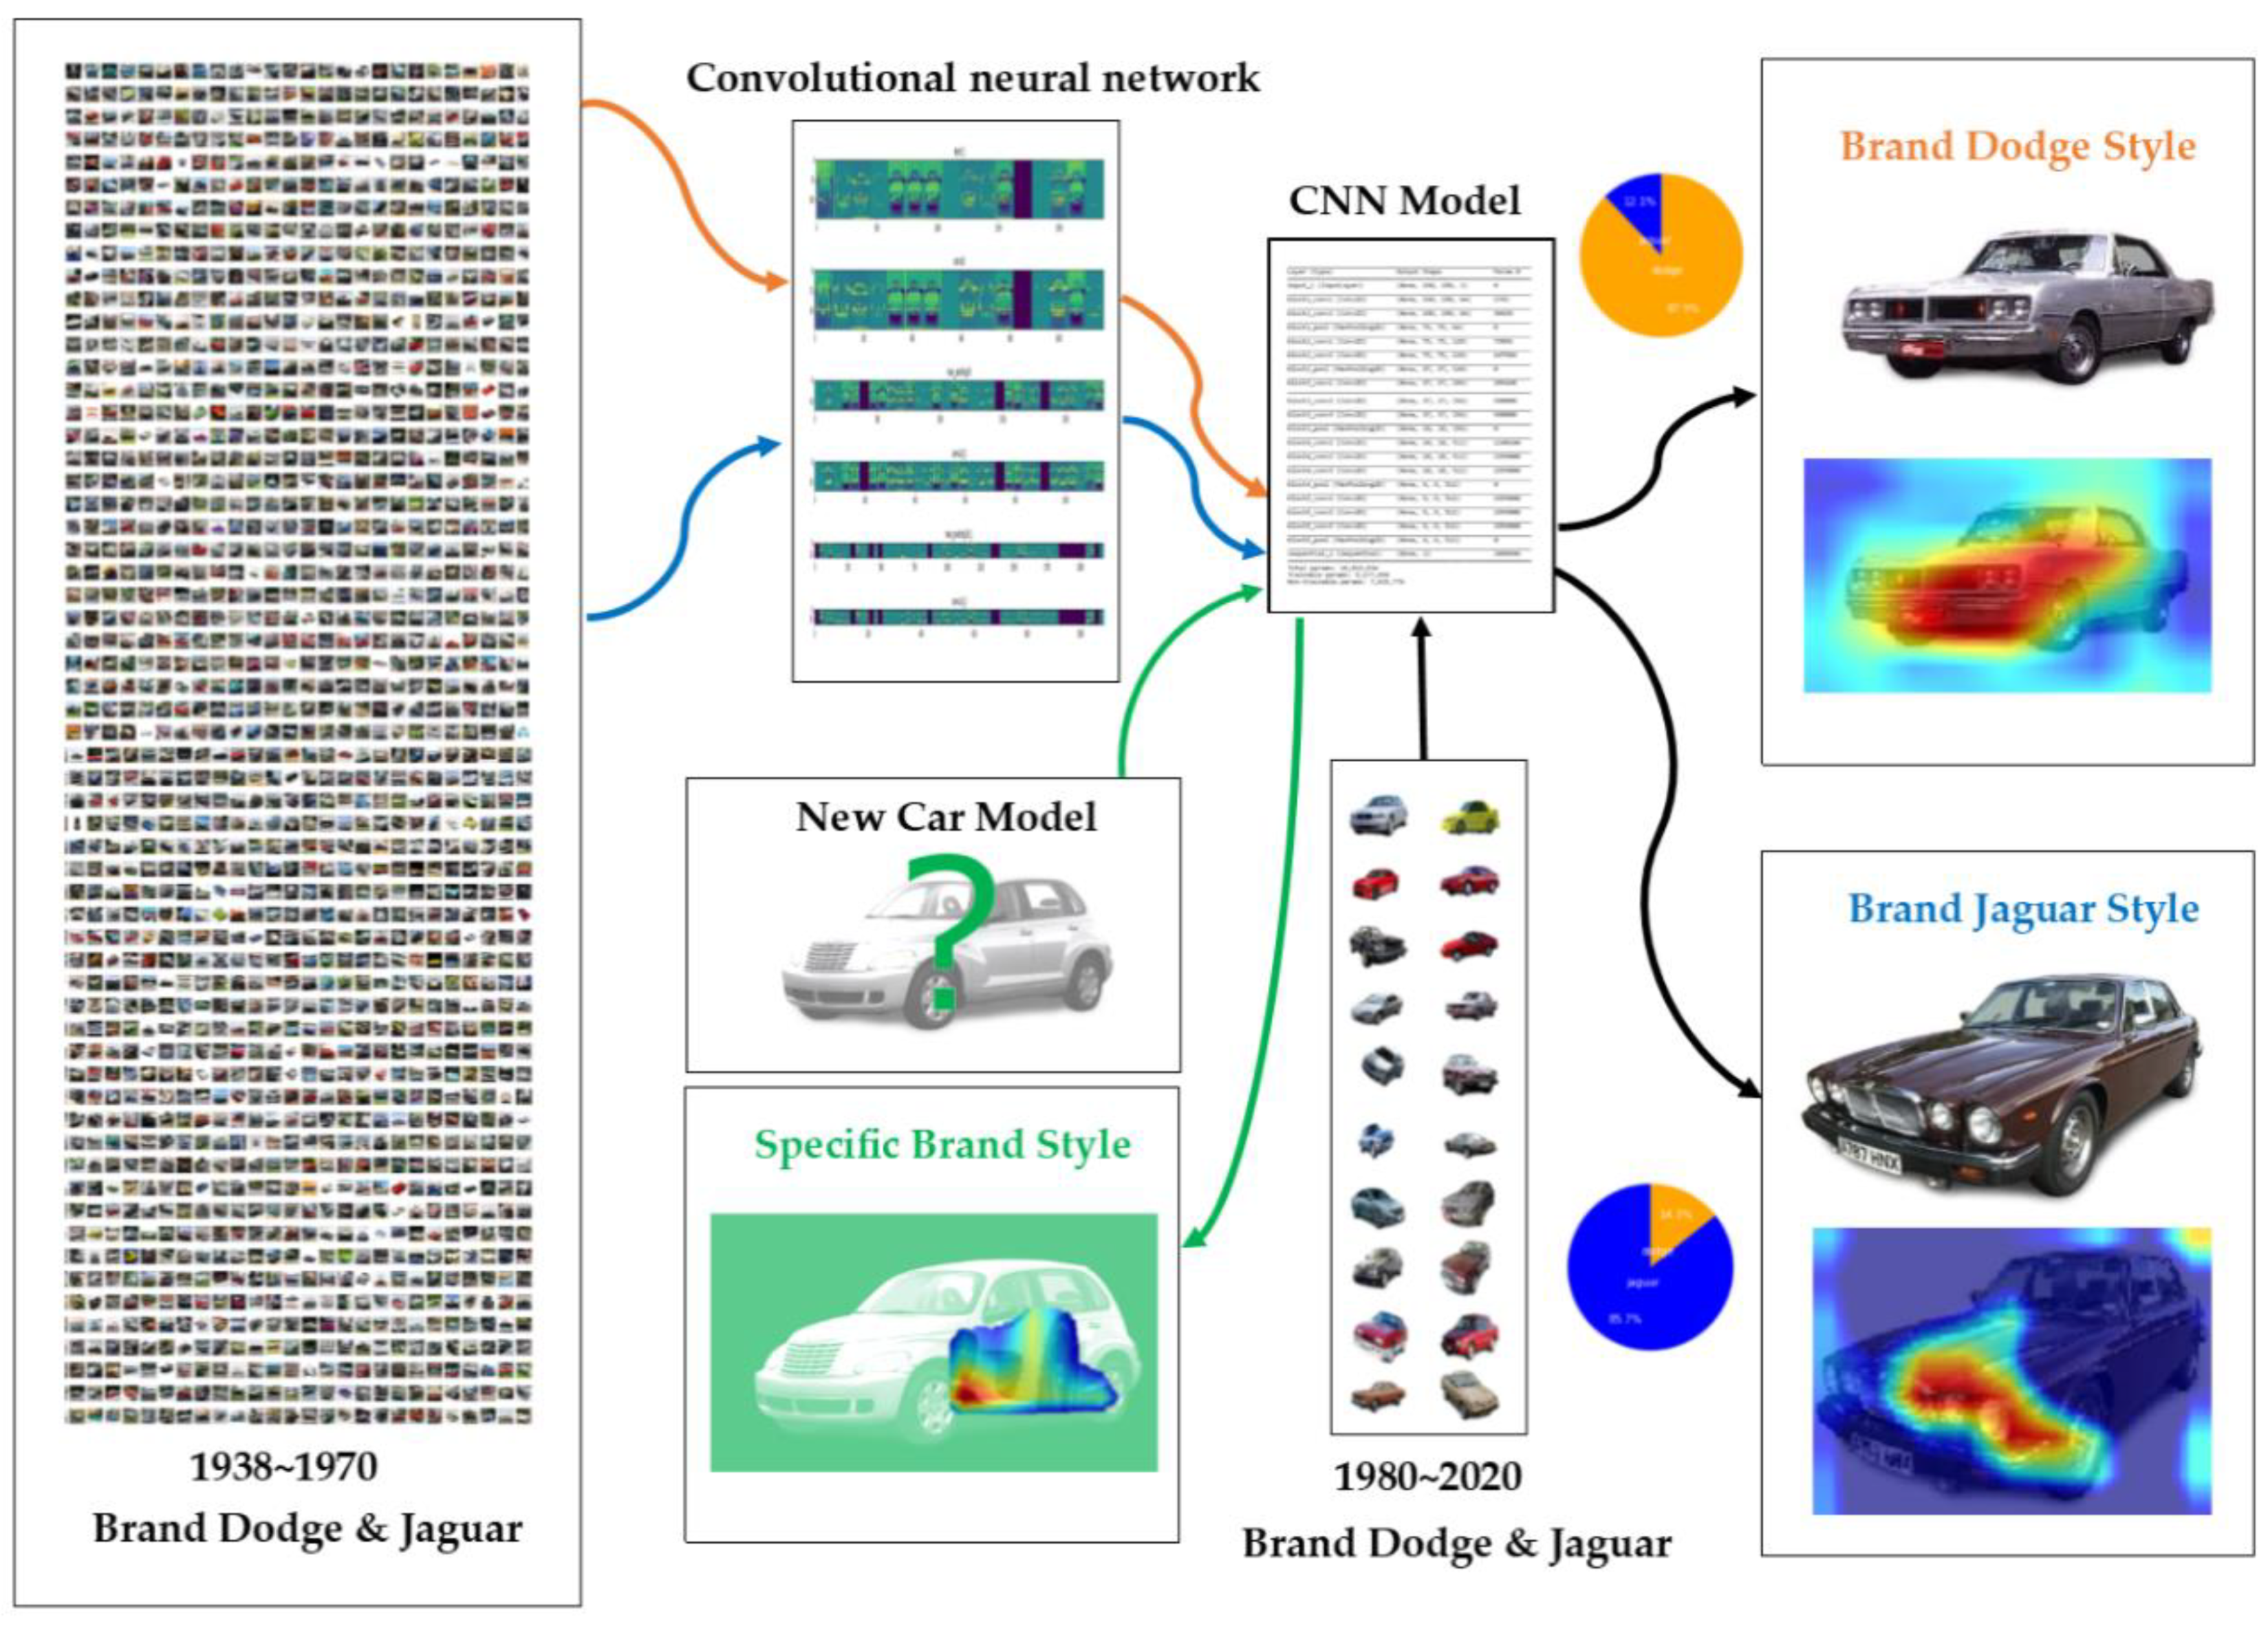
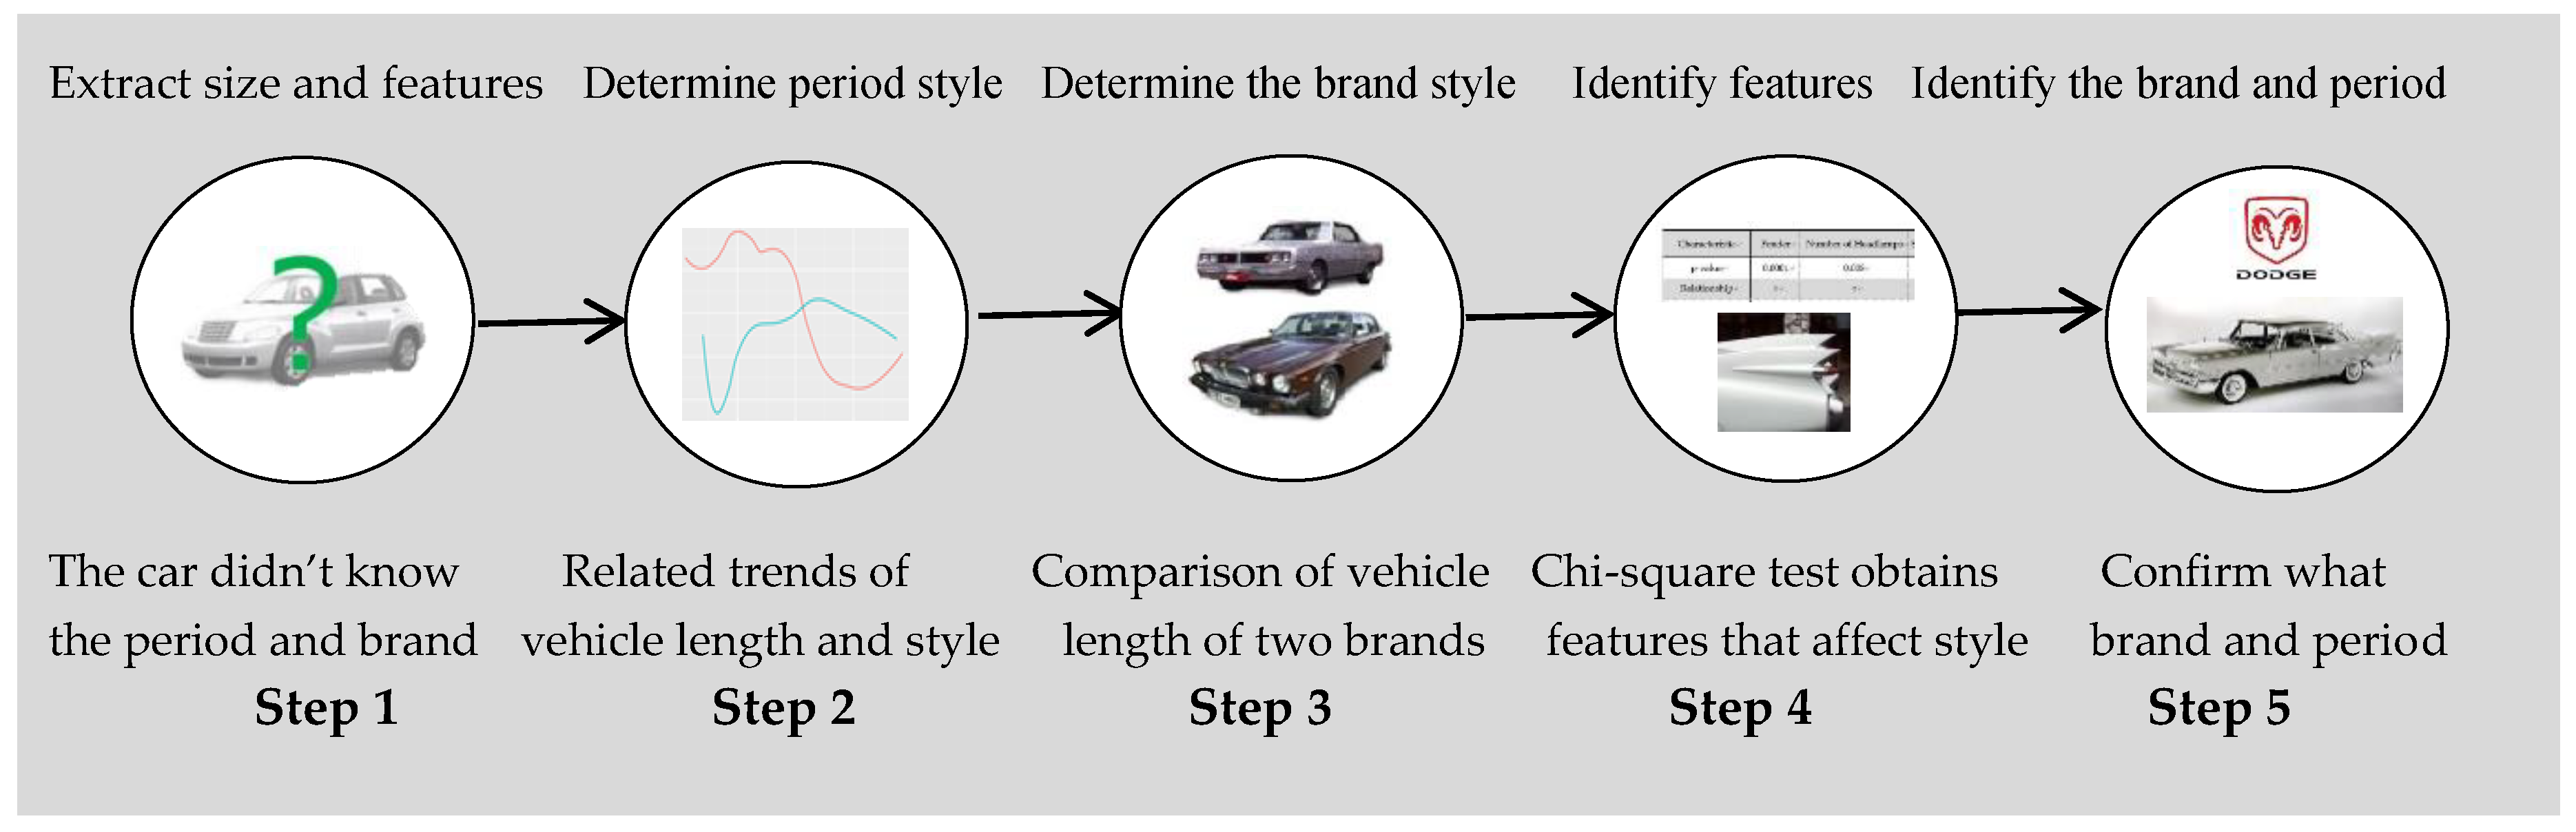
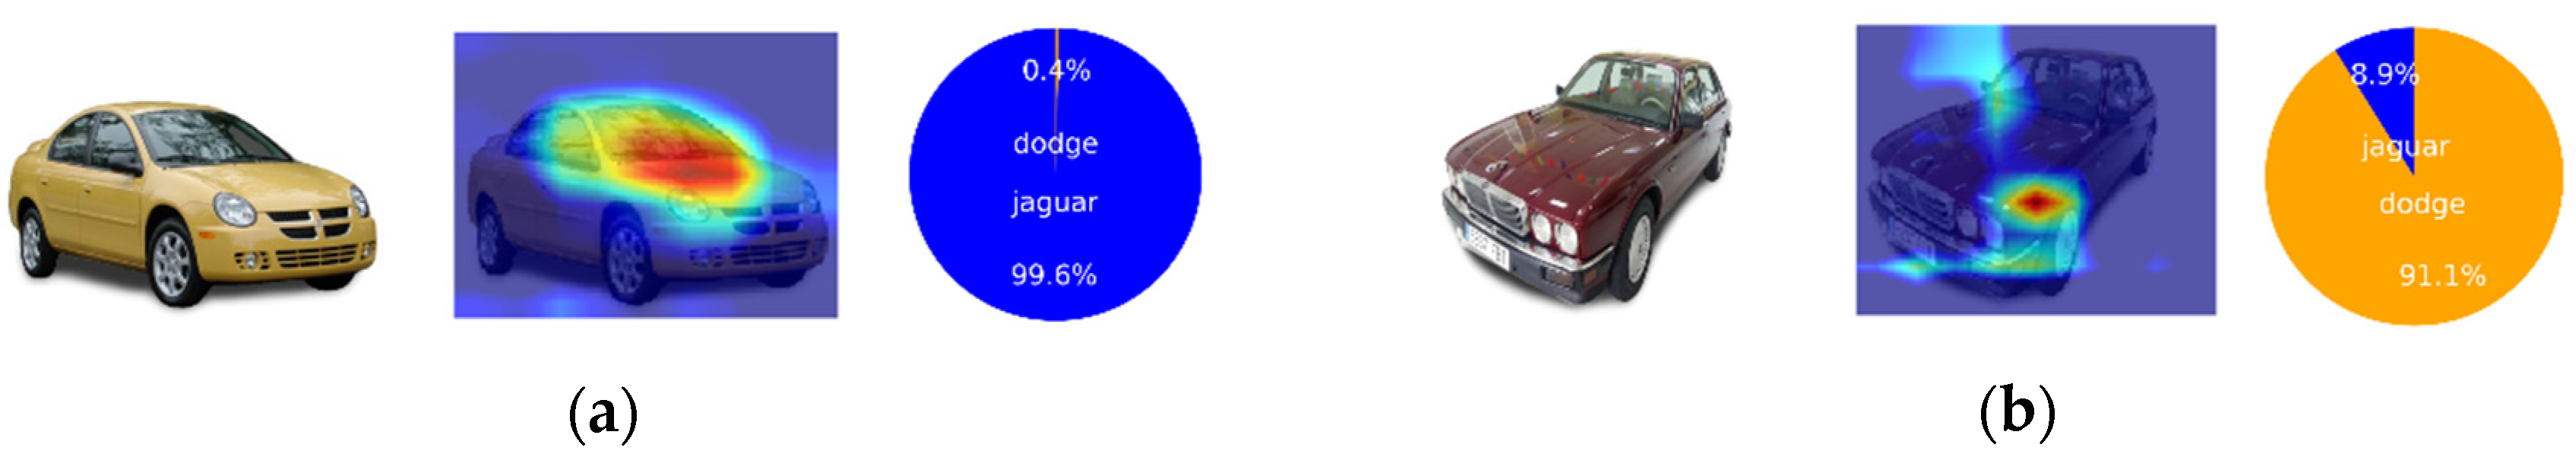
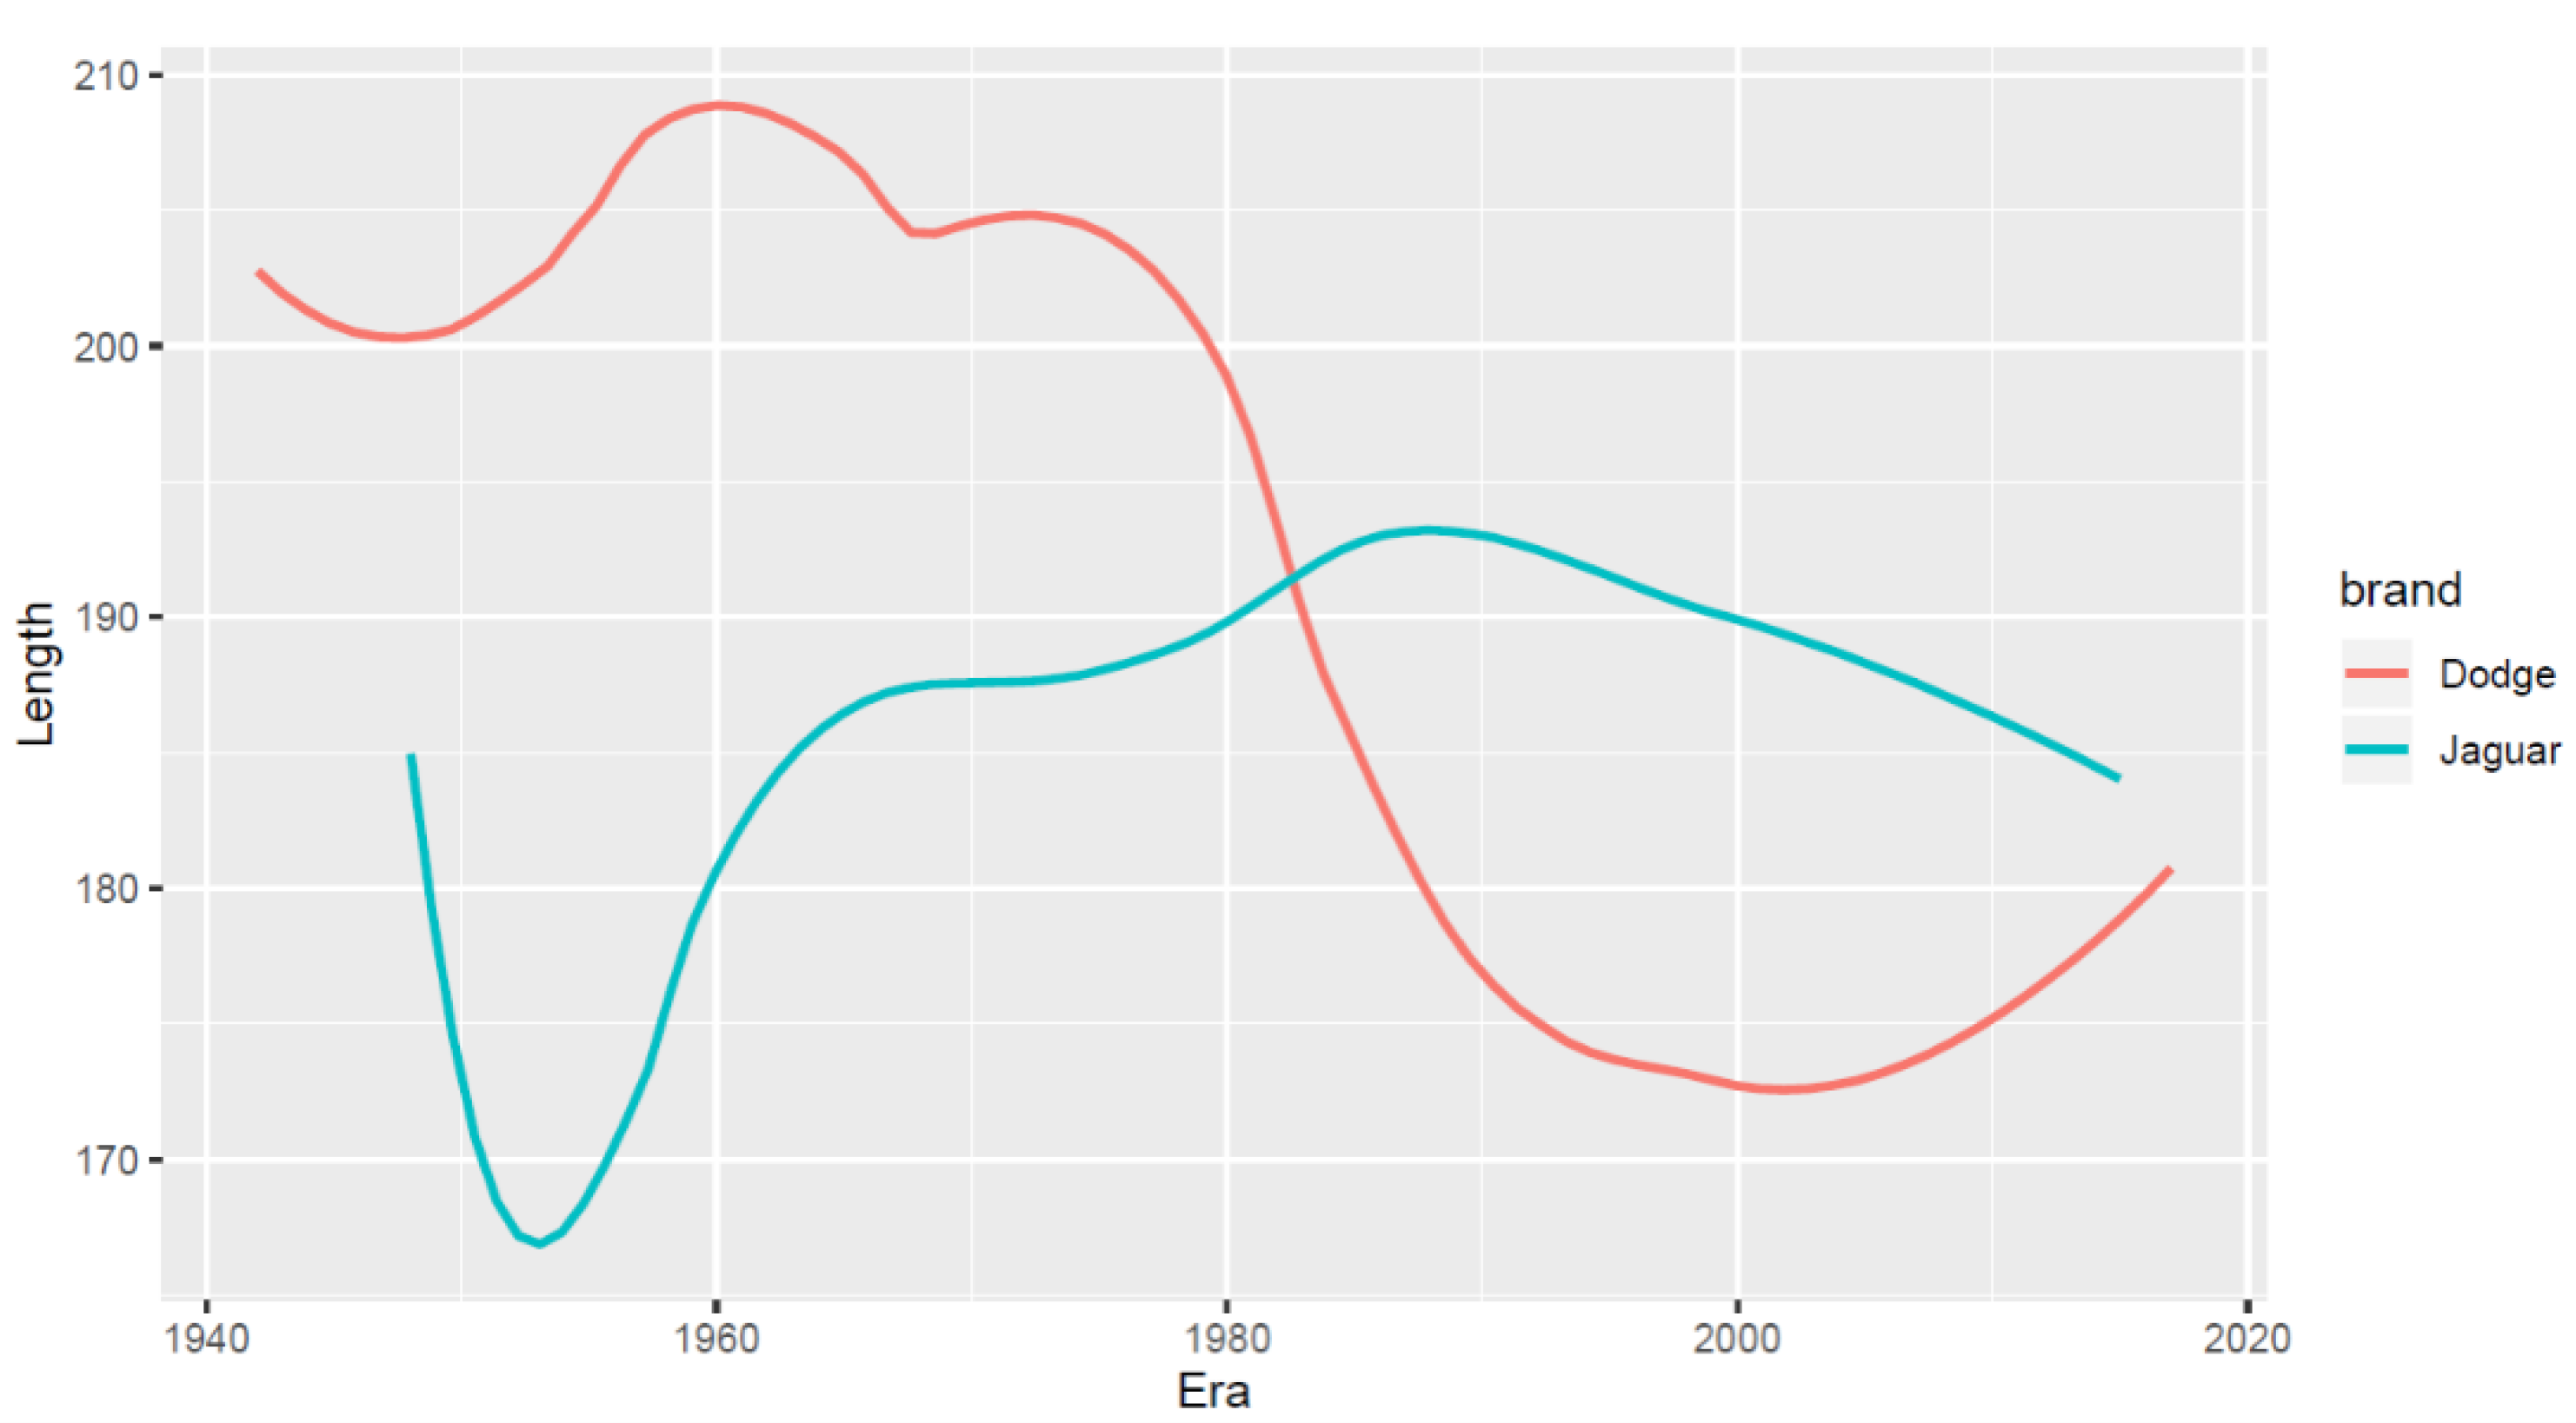
Table 1.
Selection of design features that affect the vehicle style.
| Feature Name | Designation | Feature Image | Feature Name | Designation | Feature Image |
|---|---|---|---|---|---|
| Length | The distance from front bumpers to rear bumpers. |  | Hood scoop | Sometimes called bonnet air dam, whose main function is to supply additional airflow to the engine. |  |
| Fender | To avoid spraying sand, mud, rocks, or liquid into the air through spinning tires. |  | Tailfin | Decorative tailfin in the back of the car, shaped like a fish fin, rocket type. |  |
| Headlamp | The number of headlights located at the front of the vehicle to illuminate the road. |  | Dagmar bumper | Bumper in front of the car, shaped as a chrome-plated cone. |  |
| Tail form | Rear body shape, such as Kammback. |  | Egg-Crate grille | The grilles in front of the car with a pattern of square or rectangle. |  |
| Quarter glass | Front or rear quarter glass. |  | Sideway decorating line | Visual decoration lines on both sides of the car may be a decorative piece of the same or different material. |  |
Table 2.
Summary of the features area using the heat map of convolutional neural network model.
| Characteristic | An Area with Windshield, Engine Hood, and Car Window | An Area with Headlights, Grille, and Front Bumper | An Area with Door and Side Shape of the Vehicle |
|---|---|---|---|
| Amount | 19 | 30 | 19 |
| Vehicle Number | 1, 3, 4, 6, 7, 8, 11, 15, 18, 20, 21, 22, 23, 24, 25, 26, 27, 30, 34 | 3, 4, 5, 8, 10, 11, 12, 13, 17, 18, 26, 28, 29, 31, 33, 34, 36, 37, 38, 39, 41, 42, 43, 44, 45, 46, 47, 48, 49, 50 | 2, 4, 5, 8, 13, 14, 16, 17, 19, 20, 21, 22, 25, 27, 32, 35, 39, 40, 48 |
Table 3.
Using chi-square test to find the Dodge car’s correlation between design features and style.
Table 3.
Using chi-square test to find the Dodge car’s correlation between design features and style.
| Characteristic | Fender | Number of Headlamps | Side Decoration | Rocket Tail | Egg Crate Grille |
|---|---|---|---|---|---|
| p-value | 0.0001 | 0.008 | 0.02 | 0.004 | 0.07 |
| Relationship | ○ | ○ | ○ | ○ | × |
| Characteristic | Rear form | Position of quarter glass | Engine hood scoop | Bullet bumpers | |
| p-value | 0.00002 | 0.00002 | 0.14 | 0.0001 | |
| Relationship | ○ | ○ | × | ○ |
Table 4.
Using the chi-square test to find the correlation between Dodge and Jaguar cars’ design features and styles.
Table 4.
Using the chi-square test to find the correlation between Dodge and Jaguar cars’ design features and styles.
| Characteristic | Fender | Number of Headlamps | Side Decoration | Rocket Tail | Egg Crate Grille |
|---|---|---|---|---|---|
| p-value | 0.000003 | 0.007 | 0.02 | 0.09 | 0.15 |
| Relationship | ○ | ○ | ○ | × | × |
| Characteristic | Rear form | Position of quarter glass | Engine hood scoop | Bullet bumpers | |
| p-value | 0.000002 | 0.000002 | 0.2 | 0.004 | |
| Relationship | ○ | ○ | × | ○ |
Publisher’s Note: MDPI stays neutral with regard to jurisdictional claims in published maps and institutional affiliations. |
© 2020 by the authors. Licensee MDPI, Basel, Switzerland. This article is an open access article distributed under the terms and conditions of the Creative Commons Attribution (CC BY) license (http://creativecommons.org/licenses/by/4.0/).
Share and Cite
MDPI and ACS Style
Wang, H.-H.; Chen, C.-P. A Case Study on Evolution of Car Styling and Brand Consistency Using Deep Learning. Symmetry 2020, 12, 2074. https://0-doi-org.brum.beds.ac.uk/10.3390/sym12122074
AMA Style
Wang H-H, Chen C-P. A Case Study on Evolution of Car Styling and Brand Consistency Using Deep Learning. Symmetry. 2020; 12(12):2074. https://0-doi-org.brum.beds.ac.uk/10.3390/sym12122074
Chicago/Turabian StyleWang, Hung-Hsiang, and Chih-Ping Chen. 2020. "A Case Study on Evolution of Car Styling and Brand Consistency Using Deep Learning" Symmetry 12, no. 12: 2074. https://0-doi-org.brum.beds.ac.uk/10.3390/sym12122074
Note that from the first issue of 2016, this journal uses article numbers instead of page numbers. See further details here.