Poverty Measure Based on Hesitant Fuzzy Decision Algorithm under Social Network Media

1
Faculty of Management and Economics, Kunming University of Science and Technology, Kunming 650000, China
2
School of Advertising, Marketing, Public Relations, Queensland University of Technology, Brisbane, QLD 4001, Australia
*
Author to whom correspondence should be addressed.
Symmetry 2020, 12(3), 384; https://0-doi-org.brum.beds.ac.uk/10.3390/sym12030384
Submission received: 27 January 2020
/
Revised: 21 February 2020
/
Accepted: 27 February 2020
/
Published: 3 March 2020
(This article belongs to the Special Issue Multi-Criteria Decision Aid methods in fuzzy decision problems – part II)
Abstract
:This study aims to solve the problem that the traditional method of measuring the poverty level in rural and urban areas of China from a purely monetary perspective can’t comprehensively analyze and reflect the poverty. In this study, a multidimensional poverty measurement model with non-monetary indicators is proposed, the data of families and their members provided by the China Health and Nutrition Survey (CHNS) of a certain year’s health and nutrition survey in China are used for analysis, and a fuzzy set method is adopted to analyze the poverty situation in various regions of China. First, the fuzzy function set method is used to calculate the one-dimensional poverty index. On the basis of income, the multi-dimensional poverty fuzzy index is calculated from five dimensions, including education, health, assets, and living standard. The calculation results of the single-dimensional poverty and the multi-dimensional poverty are compared to further analyze the reasons of the family poverty of rural residents. Second, the poverty rate of each dimension in each region is calculated by referring to the appropriate measurement indexes of each dimension of the message passing interface (MPI) team. The results show that the concept of measuring poverty by the fuzzy set method is more sensitive to the overall distribution of population in the poverty dimension than the poverty line method. Compared with the poverty line method, the fuzzy set method can better consider the overall distribution of population in poverty dimension. Accordingly, China should strengthen the infrastructure construction in rural areas, increase the investment in education in rural areas, and improve the overall quality of the poor population.
1. Introduction
At present, online public welfare has become the leading force of public welfare communication while bringing new donation channels to public welfare undertakings due to its convenient operation and low participation threshold. Therefore, online public welfare communication has become a public welfare action that everyone can participate in. However, it can also be concluded from the “Rolle incident” that the characteristics of social media also lead to some disadvantages in public service communication on its platform. Therefore, it is necessary to measure poverty from a multi-dimensional perspective to prevent the negative effects brought by online social media. Studying and calculating poverty is related to the national economy and people’s livelihood. It is the premise of building China’s social security system and social relief system, which is conducive to social stability and development. At the same time, research on poverty issues is conducive to the formulation of national poverty alleviation policies and the greater use of national poverty alleviation resources [1].
Some foreign countries have started to use the relatively mature multidimensional poverty index and measurement method to measure the poverty level and formulate poverty alleviation and development policies based on the measurement results. China should also keep pace with foreign countries, keep up with international standards, and adopt advanced poverty theories and measurement methods to measure domestic poverty problems [2]. In this study, from a multi-dimensional perspective, the multi-dimensional poverty measurement method is adapted to measure the rural poverty degree in China, analyze the causes of poverty, and give relevant policy suggestions from a multi-dimensional perspective. In the process of solving the poverty problem jointly by the whole population—online social media, as a platform for public welfare communication, connects the virtual world with the real public welfare, which has practical significance for the eradication of poverty. Based on the accurate identification of poor people, different poverty alleviation methods are adopted for different levels of poverty, and different poverty alleviation policies are formulated, which can significantly improve the efficiency of poverty reduction, make full use of poverty alleviation resources, and reduce the crowding out of poverty alleviation resources by the non-poor population.
2. Literature Review
Many scholars have discussed the relevant theories of poverty. From the initial standard of measuring poverty only from the perspective of income level, it has been gradually extended to multi-dimensional poverty measurement, and considerable progress has been made. Najera used factor analysis and structural equation models to develop a multidimensional framework that took capacity and social inclusion as additional indicators of poverty [3]. Permanyer proposed a new method of multidimensional poverty measurement, which included a recognition method pk that extended the traditional cross and joint methods and a kind of poverty measurement method Ma [4]. Rogan discussed how to combine these different poverty lines and related one-dimensional gaps to form a multidimensional poverty measurement standard and evaluate it [5]. Wulung and Gindo described each normative choice in the context of multidimensional poverty measurement design. They clarified the meaning of each choice, explained how they relate to each other, and outlined other ways to understand, make, and justify these choices [6]. Wang and Chen studied the vertical aspect of multidimensional poverty and its connection with dynamic income poverty measurement, and the results showed that monetary poverty (or non-poverty) was not always multidimensional poverty (or non-poverty) [7]. Wang proposed a new kind of multidimensional poverty index, which combined various poverty indicators and was calculated as convex variations of the poverty line vector score that people don’t care about [8]. Bader et al. measured and decomposed the multidimensional poverty in China’s rural poverty-stricken areas for the first time, and the results showed that due to the influence of population proportion, the multidimensional poverty index was inconsistent with its contribution rate [9]. Hussain and Permanyer introduced empirical issues that differ from the multidimensional poverty approach based on the count. The key was that the indicators accurately reflected deprivation at the individual level, and all indicators were converted to reflect the deprivation of the selected analytical unit [10]. Zakaria et al. explored the statistical behavior of three fuzzy poverty measures with the simulation (Monte Carlo) approach based on the British family group study data set. They believed that poverty is a multidimensional concept; “poor” and “non-poor” are not two mutually exclusive collections, and the difference can be “fuzzy” [11]. Mitra built a multi-dimensional poverty measurement model at the village level and used the index contribution index and linear regression method to discuss the poverty factors. He also used the least square error (LSE) model and spatial econometric analysis model to identify the types and differences of rural poverty [12].
Therefore, scholars all over the world have also started to construct a poverty index to study poverty, and most of the studies reflect the poverty situation from a multi-dimensional perspective. Njuguna and Mcsharry discussed an interdisciplinary approach to the comprehensive assessment of water resource scarcity, linking physical estimation of water resource availability to socio-economic variables that reflect poverty (i.e., water resource poverty index) [13]. Chantarat et al. introduced the development and application of water poverty index (WPI). The index was developed as a holistic tool for measuring water stress in households and communities. It was designed to help national policymakers, communities and central governments, as well as donor agencies, to identify priority needs for water sector interventions [14]. Najera introduced the multidimensional poverty index (MPI), a measure of severe poverty, which was understood as the inability of a person to meet minimum international standards in terms of indicators related to the millennium development goals and core functions. This was the first time that more than 100 developing countries had implemented direct measures of poverty [15]. Yongbin et al. proposed a new multidimensional poverty index (MPI-LA). The index was based on the rich tradition of poverty measurement in the region. There were unmet basic needs (UBN) methods, poverty line methods, and concept and method in the field of multidimensional poverty measurement [16]. Schiettecat et al. used the principal component method to derive simplified and economically effective indexes of water resource poverty, and the results showed that these simplified indexes had a high positive correlation and negative correlation with human development index and human poverty index respectively [17]. Ferrone and Milliano calculate India’s human development index (HDI) and the human poverty index (HPI) [18]. Kim and Nandy’s monetary measurement research on gender poverty difference showed that income is only one aspect of poverty, and other welfare measures may better reflect the relative happiness of women and female-headed families [19]. Burchi et al. introduced a multi-dimensional, cleaning-centered thematic indicator, that is, cleaning poverty index. They described the methodology for index building and disseminated the results in various forms to promote the utility of the tools for a comprehensive analysis of the links between washing and poverty [20].
3. Proposed Method
3.1. Analysis of the Problems of Current Public Media Communication in Online Social Media
3.1.1. “Light Public Welfare”
“Light public welfare” has become a current fashion, and the emergence of social media has lowered the threshold, making “light public welfare” a promising pursuit of the industry. False information dissemination is a kind of destruction of the public welfare communication system, affecting the ecological link of the entire communication system [21,22,23,24].
Although users of social networking platforms are all real-name users, their media literacy is uneven. Therefore, the public is less able to interpret and question the public information, and the unverified public information is easy to spread. Public welfare communication involves donated money, goods and other information related to property safety. Once it is not checked, it will be widely spread, which will significantly discourage public enthusiasm and public confidence [25,26,27,28]. In addition, people participate in public welfare in a light, pleasant and convenient way, mainly because of people’s sympathy. When audiences see the public information, they will click and forward it. Therefore, when the information is forwarded indefinitely, all kinds of information will be mixed together, which reduces the communication credibility of social media platforms.
3.1.2. “Public Welfare Fatigue”
In the current public welfare communication incidents in China, the biggest obstacles to people’s participation in public welfare communication are anger, sensation, and deception. Some communicators with impure motives dress up as the image of the weak and fabricate information content that incites public sentiment. The content of the information involves saving people and caring for vulnerable groups. When the information is verified and found to be fraudulent, the audience will easily be skeptical and resistant to other public welfare information, which will discourage the participation of public welfare to some extent and cause the public to reject the public welfare information [29,30].
These conditions suggest that a comprehensive measure of poverty is needed. With the rapid development of society, the problem of poverty is not only reflected in residents’ income, but also in other aspects, such as residents’ health, ecological environment, personal freedom, and education. In other words, if a resident is in non-poverty on the income dimension, he may be in poverty on other dimensions. If people only consider the income dimension, this result is not convincing.
Public welfare communication of online social media is a form of media expression of public welfare communication, which is promoted to the non-profit communication activities of the masses by online platforms. The rise of the Internet has undoubtedly opened up a vast territory for the public benefit communication market. Network media takes the advantages of the platform to gather voluntary resources and promote organizations, thus opening up another way for public benefit organizations. This kind of light participation in the network media’s public welfare links makes the public welfare run more smoothly and makes the public welfare of everyone become a reality.
3.2. Multidimensional Poverty Measure Method
The multidimensional poverty index first appeared around the 1970s. With the continuous development of society, most researchers conduct research based on the multidimensional poverty index, which can reflect all aspects of human beings from more aspects.
Among them, λ is a parameter of the size characteristics of the household; t is the transition variable, which can be converted between work and leisure; N is family type; U is the utility function for the preferences of households or individuals. The H − M index is simple to calculate, but the accuracy of the indicator is not very high but rough. The nature of the indicator depends on the social welfare function selected.
The W − M index not only satisfies the decomposability but also has strong timeliness.
where aj represents the poverty aversion coefficient on dimension j, Sj is the set of the poor on the j dimension.
3.3. Poverty Fuzzy Measure Method
The fuzzy poverty measure is based on the membership function in fuzzy mathematics. For the measurement of poverty, the traditional dichotomy simply divides the research object into two parts, while the trace file analyzer (TFA) improves the boundaries of traditional methods. It believes that people’s living conditions are not only poverty and non-poverty.
In a traditional collection, each element has an evident relationship with the collection. However, there are many things in real life that can’t be clearly stated. For example, “low income”, “young people,” etc., have no obvious boundaries. The definition of Set X, the element xεX in the set, and fuzzy subset A is as follows: A = {x, μA(x)}, and μA(x): X → [0, 1].
μA(x) is the membership function of fuzzy set A, the value of μA(x) is the degree to which the element x belongs to the fuzzy set A. μA(x) = 0 means that x does not belong to fuzzy set A, 0 < μA(x) < 1 means that the x part belongs to the fuzzy set A, and μA(x) = 1 means that x belongs completely to the fuzzy set A. Even with the same fuzzy meaning, the membership function may vary from case to case. A binary variable means that there are only two values 0 and 1, that is, the relationship between “Yes” and “No.” The dichotomous variable is the attribute indicating whether a family owns an asset. If it does, it means that the family is not poor in this dimension. Otherwise, it is poverty. The membership function of the binary variable is expressed as follows.
Among them, X is a fuzzy set variable, P is a subset of the fuzzy set X, and the value of xij indicates the degree of poverty of the ith family in the j dimension. Xij = 0 indicates that the variable is not poor in this dimension, and the value xij = 1 indicates that it is inadequate.
People often encounter sequential variables in their life, such as the evaluation of personal physical health and the measurement of living standards. People may use words like “good,” “average,” or “poor” to express. Let P be a subset of fuzzy set X, then the membership function of this variable can be defined as follows.
In the formula, xmin,j and xmax,j respectively represent the maximum and minimum values of households on the jth dimension. If the variable takes the value xij ≤ xmin,j, and the membership function value is 1, it is considered that the jth dimension of the family is poor. If the variable takes the value xij ≥ xmax,j and the membership function value is 0, it is considered that the jth dimension of the family is not poor. If the value of the variable is between [xmin,j, xmax,j], it means the poverty level of the family is between 0 and 1.
In the study of poverty, continuous variables are also common, such as income, consumption, and so on. The distribution function of continuous variables is evenly distributed over the interval [0, 1] and is strictly monotonic. The defined membership functions are as follows.
3.4. Method for Calculating the Weight of Poverty Dimension
In this section, MPI multidimensional poverty index is adopted to calculate the rural multidimensional poverty index. Previous studies mostly used equal-weight methods. In this research, to measure the multidimensional poverty index of rural families more scientifically, the “entropy weight method” is adopted to measure the weight of each index and dimension. The entropy weight method is an objective weighting method widely used. It believes that if the entropy value of a certain index is smaller, the greater the variation of the index data is, and the more information it can provide, so it will be given a larger weight. When solving the problem, the index weight can be determined according to the variation degree of the index value, that is, the weight can be determined by entropy weight method. Assuming that there are m objects to be evaluated and n evaluation indexes, and are the value of the jth index of the ith object, then the basic data matrix can be expressed as follows.
The weight of the index value of the ith item under the jth index is represented by , the entropy value of the jth index is expressed by , the entropy weight of the index is expressed by , and the comprehensive weight of the index can be calculated by combining the entropy weight of the index. The calculation steps can be expressed as follows.
The entropy weight itself is not the index importance coefficient but represents the discrimination degree of the index to the evaluated object. Since previous studies showed that there was little difference in the importance of each indicator, it should pay attention to the indicators with a large difference in sample values and formulate more targeted poverty alleviation strategies.
4. Experiments
In this study, the data of CHNS (China health and nutrition survey) are selected for analysis. The data of family and individual in the 2018 annual survey are selected for analysis, and the individual indicators were averaged by the family to obtain the average household level. A total of 11 indicators are selected according to the human development index (HDI) and multi-dimensional poverty index (MPI), as shown in Table 1.
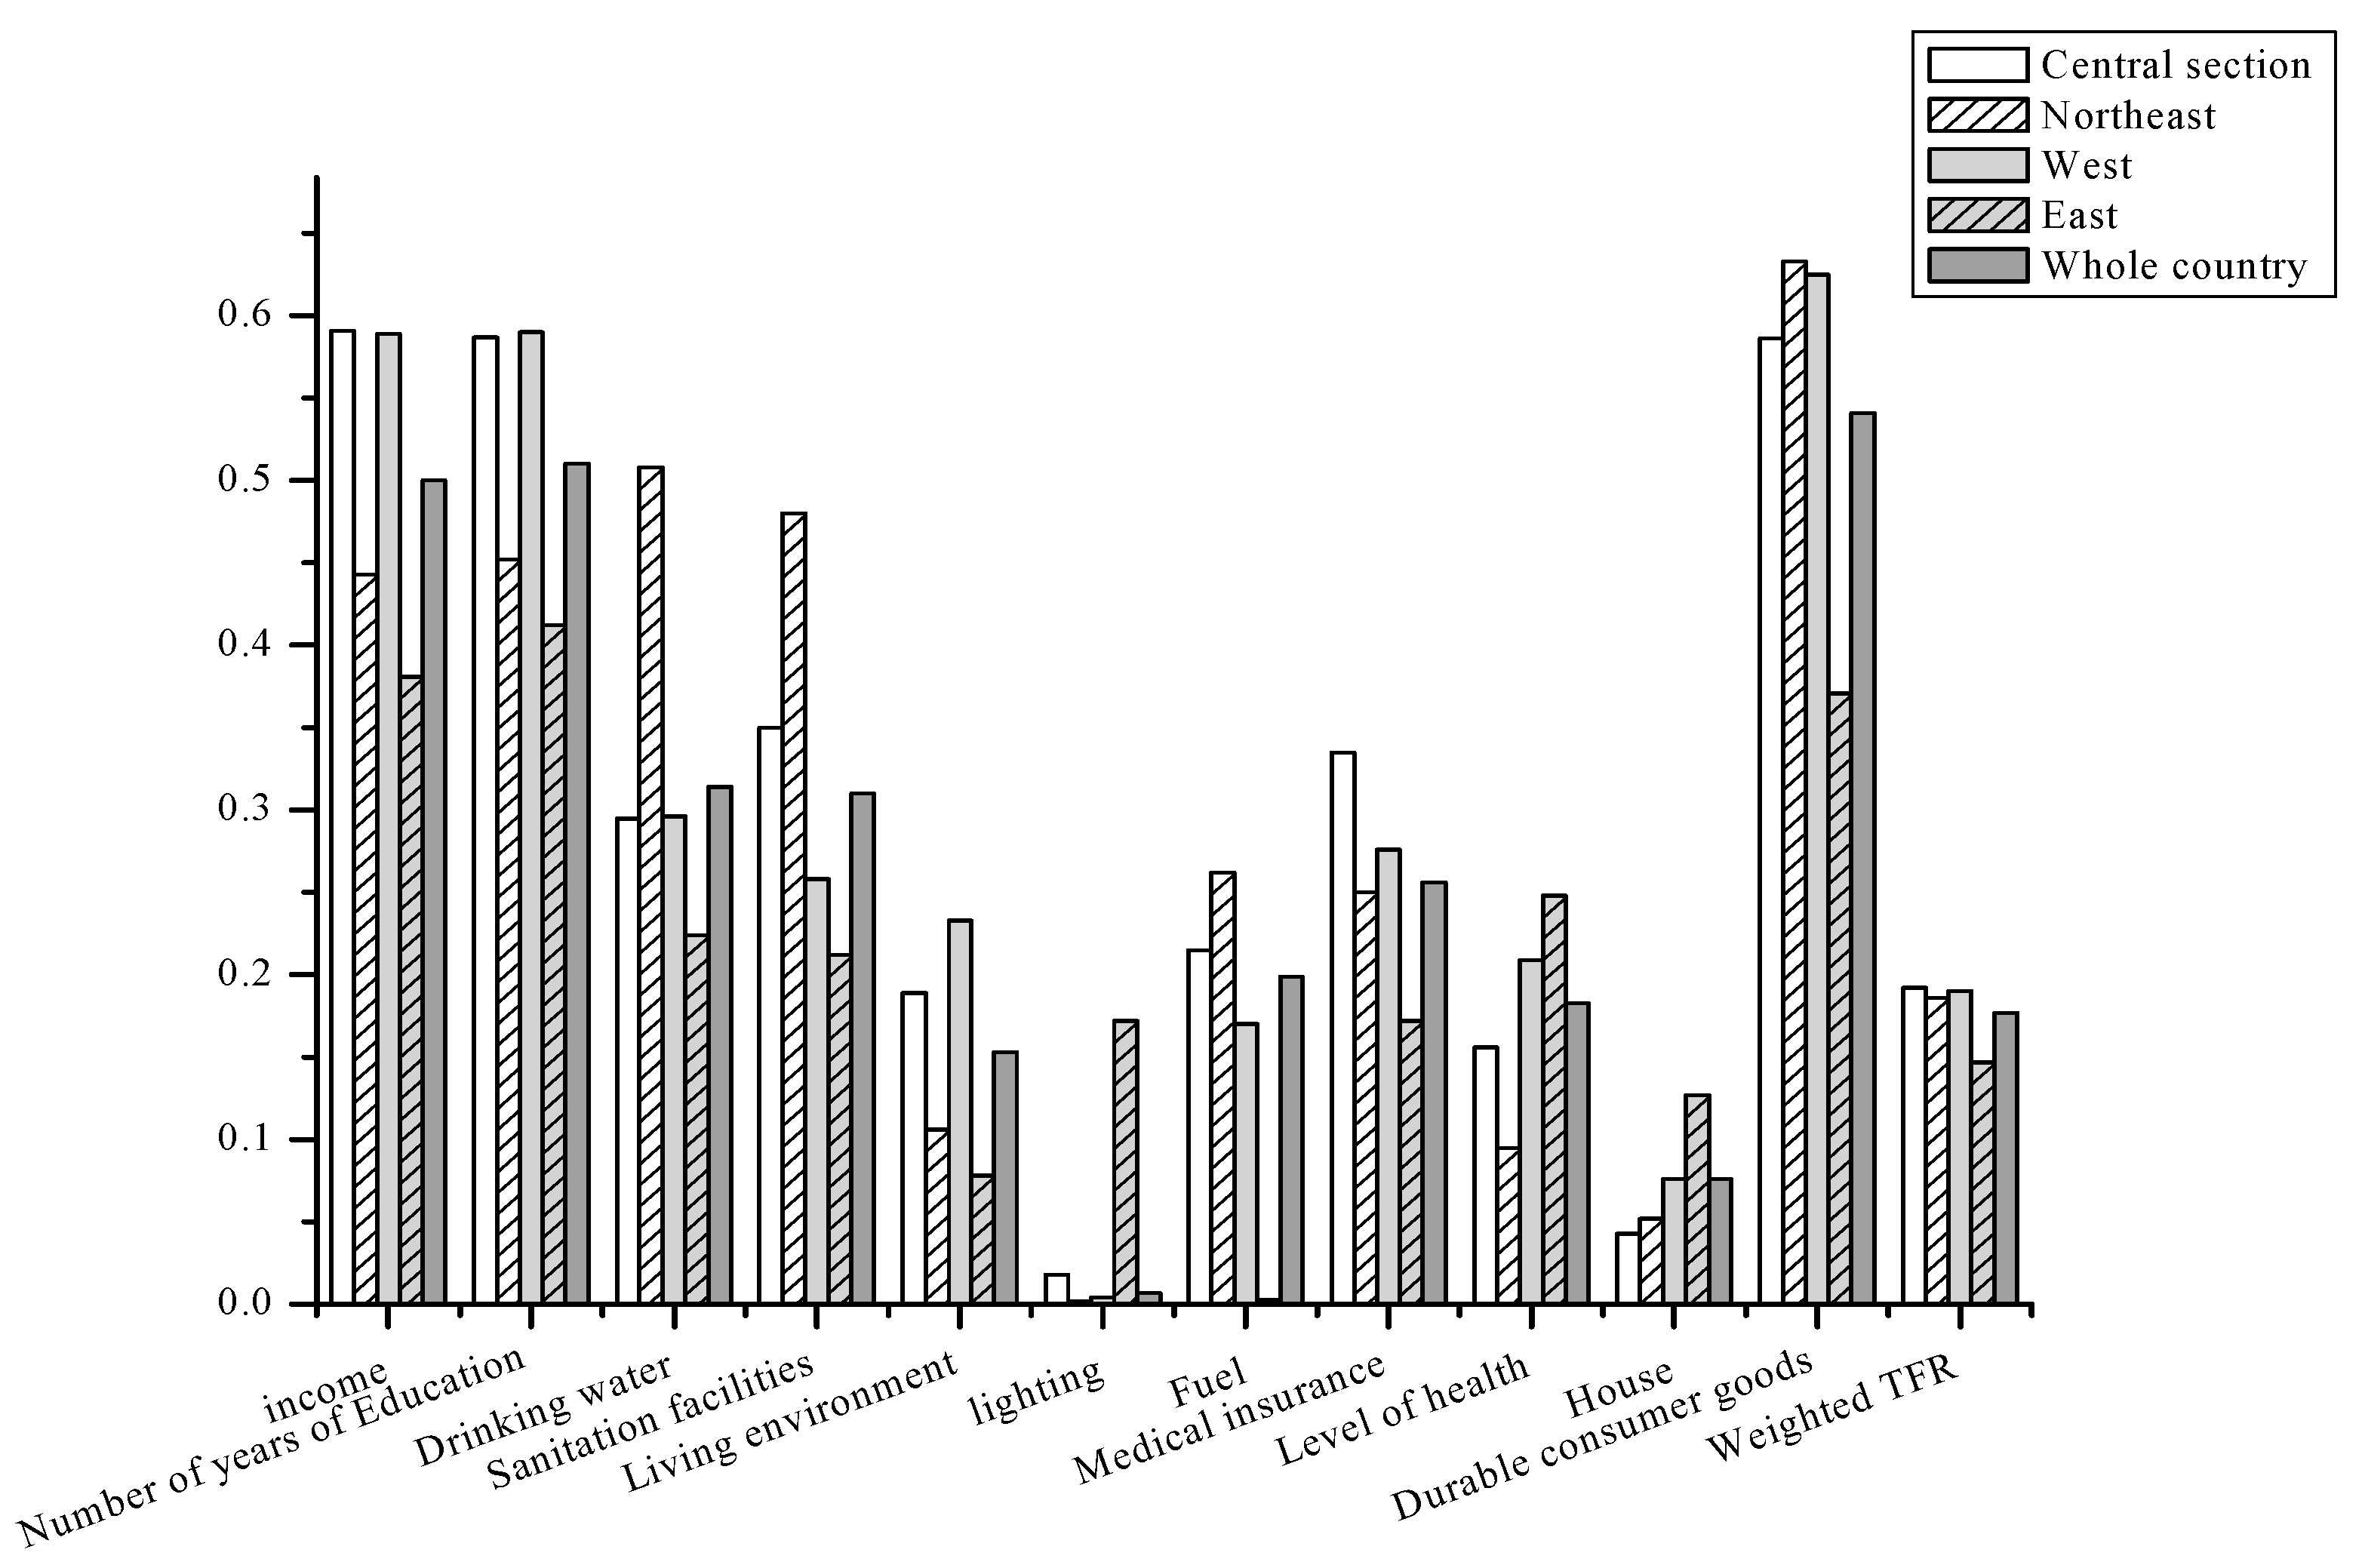
In this study, the above poverty dimension and the poverty line are selected. According to the data obtained by CHNS and the poverty lines defined in each dimension, the incidence of poverty in each dimension in each region is calculated, as shown in Figure 1, below:
According to the classification of the national statistical bureaus, the survey areas were divided into four groups. The results in Figure 1 show that there are significant differences in poverty status between different regions. The dimension with the highest deprivation level nationwide is health facilities, followed by education and fuel, and the dimension with the lowest deprivation level is lighting, indicating that the vast majority of households across the country have access to electricity. By region, the poverty rate in the central region is higher in all dimensions, and it is the highest among the four regions in terms of income, education, living environment, lighting, fuel, medical insurance, and consumer durables.
In terms of urban and rural areas, the poverty rate in each dimension is determined according to the poverty line standard, as shown in Figure 2.
It can be clearly concluded from the urban-rural decomposition in Figure 2 that there are differences in the urban and rural poverty rates. In addition to the health level, housing ownership level and lighting dimension, the poverty rate of rural families are much higher than that of urban families in all dimensions, indicating that the dual structure of urban and rural areas in China is still very obvious. Therefore, China’s modernization process, to a large extent, is to realize the transformation of the urban-rural dual economic structure into a modern economic structure.
Table 2 shows the incidence of poverty under each single dimension index of rural households calculated by sample data.
The A-F model is used to calculate the incidence of poverty P(k) and multidimensional poverty index M(k) when the dimension of poverty in rural areas is K (k = 1, 2, 3…, 9), and Table 3 shows the specific results. As the dimension number K from 1 to 9, P(k) and M(k) are also gradually decreased; especially in the process of K changing from 1 to 2 and from 2 to 3, P(k) is decreased most obviously. When K = 1 or 2, the incidence of poverty in the dimension of removing health facilities is higher than that in the dimension of removing education; in any value of K, the multidimensional poverty index in the dimension of removing health facilities is lower than that in the dimension of removing education.
Through calculation and sensitivity analysis, it can be concluded that the government should focus on two dimensions of health facilities and education to formulate corresponding poverty alleviation countermeasures, enhance the construction of health facilities and the popularization of health knowledge, promote the implementation of compulsory education, and establish the mechanism of investigation and tracking of dropout students and forced return to school, thus minimizing the incidence of multidimensional poverty and multidimensional poverty index.
5. Discussion
The totally fuzzy approach (TFR) index represents the ratio of the individual distribution function in the overall distribution, where the distribution function is calculated from the cumulative distribution. The calculation results are as follows (Table 4).
As can be concluded from Table 3, the analysis results are consistent with the poverty line analysis to a certain extent. The dimensions with a high poverty rate are income, education, health, drinking water, and durable consumer goods. According to the contribution rate of each index and dimension, the indexes that contribute more to the multidimensional poverty index are drinking water, sanitation facilities, income, education, and durable consumer goods, etc. The living environment contributes the most to the overall index, which is caused by a large number of indicators and the uneven distribution of indicators in the population. The lighting index has the smallest contribution rate, so it is given a relatively large weight to increase its contribution rate.
TFR indicators are calculated for each region, as shown in Figure 3.
It can be concluded from the TFR indicators in various regions of the country that the weighted index difference of each region is not very obvious; only the eastern region is lower. In other words, the poverty rate in the eastern region is also meager from a multi-dimensional perspective. Both the income and non-income poverty rates are controlled at a certain level. The social security system is improved, and medical insurance and public health are well protected.
From various dimensions, the indicators of the income dimension of each region and the durable consumer goods dimension have increased compared to other dimensions. Since TFR is a relative indicator, it shows that there are more households in the country on the left side of the overall income distribution and the distribution of durable consumer goods, below the poverty line or above the poverty line, but also at a relatively low level. On the whole, since the TFR index is derived from the membership function, it is an indicator reflecting relative poverty and the overall poverty distribution. In other words, it can be concluded that the overall dimension is at a low level. Although the poverty rate is not high, the TFR index is high.
The formula of income deprivation indicator FMi is as follows.
According to the principle of comparability, the selected parameter makes the average value of FMi equal to the poverty rate index H = 12.00 based on the poverty line, and a = 8.2 after calculation.
As non-income deprivation indicators need to be aggregated, it is necessary to first consider the dispersion degree of the internal distribution of each indicator and the correlation between the indicators.
It can be concluded from the Figure 4 that the correlation between the indicators is small, no more than 0.5, which is a weak correlation. The comprehensive weight and the calculation formula of the non-income deprivation index are used to obtain the individual non-income deprivation degree and the mean value of each region and the whole country.
As can be concluded from the Figure 5, the overlap degree of the central and western regions is relatively high, while the overlap degree of the northeast and eastern regions is the lowest. That is, regions with good economic conditions have a low degree of overlap, while regions with poor economic conditions have a high degree of overlap. This shows that it is necessary to adopt the multidimensional poverty analysis method in economically developed areas. Due to the low repetition rate, different groups of people have different poverty conditions, so targeted economic and policy subsidies can be provided.
6. Conclusions
Social media has become an indispensable platform in life in the Internet era, and public welfare communication is particularly important. However, the emergence of some false donations has reduced people’s attention to public welfare events and their trust in public welfare. Therefore, it needs a clear definition of poverty. Poverty is caused by many factors, including economic constraints, social systems, economic structures, and natural resources. In particular, the problem of poverty in China’s rural areas in the new era may be caused by various reasons besides income, such as poverty in education, health and drinking water. Therefore, if people only measure the rural poverty in China from the perspective of a single income dimension, the results obtained are not comprehensive and accurate. Moreover, it will mislead the formulation of poverty alleviation and development policies in China.
All in all, there are certain differences in the conclusions of poverty measurement in different ways. For example, the incidence of poverty in each dimension obtained by poverty line measurement is slightly different from the traditional method. Therefore, when choosing to use the multidimensional method to measure poverty, it is necessary to consider which aspects to focus on to determine the appropriate method for the research purpose. In a word, the results of this research are of great significance for accurate poverty alleviation. A relatively comprehensive rural multi-dimensional poverty identification system constructed in this research lays a foundation for identifying poor households. Further, by accurately identifying the poor, this can help others help them in a more targeted way. During the period of poverty alleviation in China, the identification of the poor population is very important. Multidimensional poverty measurement can summarize multiple dimensions, such as education, health, and living standards, so as to accurately identify the poor population in China and improve the efficiency of poverty alleviation. Therefore, the extension of poverty identification to multiple dimensions is a manifestation of adapting to social development. To further develop the economy, improve people’s living standards, and narrow the gap between the rich and the poor, the Government, while developing the economy, should also pay attention to the issue of equity, and reduce the negative impact of income inequality according to economic development and residents’ needs. It should continue to implement the national regional development strategy, and it can give a certain degree of inclination to the northeast region and the central and western regions to improve its economic welfare level.
Author Contributions
Methodology, formal analysis, writing—original draft preparation, funding acquisition, S.G.; writing—review and editing, K.S. All authors have read and agreed to the published version of the manuscript.
Funding
This research was funded by the National Natural Science Foundation of China [Study on the Impact Mechanism of Rural Tourism and Agriculture Convergence Development on Poverty Alleviation in the Perspective of Heterogeneity] Grant number [71940015] and the Achievements of key projects of Yunnan philosophy and social science planning [Research on the effect of the industry convergence of Rural Tourism and Agriculture on Poverty Alleviation in Yunnan Province] Grant number [ZDZZD201907].
Conflicts of Interest
The authors declare no conflicts of interest.
References
- Ezzrari, A.; Verme, P. A Multiple Correspondence Analysis Approach to the Measurement of Multidimensional Poverty in Morocco 2001–2007. Policy Res. Work. Pap. 2016, 9, 181–209. [Google Scholar]
- Chzhen, Y.; Ferrone, L. Multidimensional Child Deprivation and Poverty Measurement: Case Study of Bosnia and Herzegovina. Soc. Indic. Res. 2017, 131, 999–1014. [Google Scholar] [CrossRef]
- Najera, H.E. Does measurement invariance hold for the official Mexican multidimensional poverty measure? A state-level analysis 2012. Qual. Quant. 2017, 51, 1217–1241. [Google Scholar] [CrossRef] [PubMed] [Green Version]
- Permanyer, I. Book review of Multidimensional Poverty Measurement and Analysis. J. Econ. Inequal. 2016, 14, 353–356. [Google Scholar] [CrossRef]
- Rogan, M. Gender and Multidimensional Poverty in South Africa: Applying the Global Multidimensional Poverty Index (MPI). Soc. Indic. Res. 2016, 126, 987–1006. [Google Scholar] [CrossRef]
- Wulung, H.; Gindo, T. Multidimensional Poverty in Indonesia: Trend Over the Last Decade (2003–2013). Soc. Indic. Res. 2016, 128, 559–587. [Google Scholar]
- Wang, Y.; Chen, Y. Using VPI to Measure Poverty-Stricken Villages in China. Soc. Indic. Res. 2017, 133, 833–857. [Google Scholar] [CrossRef]
- Wang, Y.; Wang, B. Multidimensional poverty measure and analysis: A case study from Hechi City, China. SpringerPlus 2016, 5, 642. [Google Scholar] [CrossRef] [Green Version]
- Bader, C.; Bieri, S.; Wiesmann, U.; Heinimann, A. Differences Between Monetary and Multidimensional Poverty in the Lao PDR: Implications for Targeting of Poverty Reduction Policies and Interventions. Poverty Public Policy 2016, 8, 171–197. [Google Scholar] [CrossRef] [Green Version]
- Hussain, M.A.; Permanyer, I. Multidimensional Poverty Indices and First Order Dominance Techniques: An Empirical Comparison of Different Approaches. Soc. Indic. Res. 2018, 137, 1–27. [Google Scholar]
- Zakaria, N.H.; Hassan, R.; Othman, R.M.; Asmuni, H. Clustering Alkire Foster-Oriented Quantification in Measuring Multidimensional Poverty Indicators by Using Intelligent Adaptive Neural Fuzzy Inference Systems. Adv. Sci. Lett. 2017, 23, 2833–2836. [Google Scholar] [CrossRef]
- Mitra, S. Synergies Among Monetary, Multidimensional and Subjective Poverty: Evidence from Nepal. Soc. Indic. Res. 2016, 125, 103–125. [Google Scholar] [CrossRef]
- Njuguna, C.; Mcsharry, P. Constructing spatiotemporal poverty indices from big data. J. Bus. Res. 2017, 70, 318–327. [Google Scholar] [CrossRef]
- Chantarat, S.; Mude, A.G.; Barrett, C.B.; Turvey, C.G. Welfare Impacts of Index Insurance in the Presence of a Poverty Trap. World Dev. 2017, 94, 119–138. [Google Scholar] [CrossRef] [Green Version]
- Li, R.; Zheng, H.; Zhang, C.; Keeler, B.; Samberg, L.H.; Li, C.; Polasky, S.; Ni, Y.; Ouyang, Z. Rural Household Livelihood and Tree Plantation Dependence in the Central Mountainous Region of Hainan Island, China: Implications for Poverty Alleviation. Forests 2020, 11, 248. [Google Scholar] [CrossRef] [Green Version]
- Goli, S.; Maurya, N.K.; Moradhvaj; Bhandari, P. Regional Differentials in Multidimensional Poverty in Nepal: Rethinking Dimensions and Method of Computation. Sage Open 2019, 9, 2158244019837458. [Google Scholar] [CrossRef] [Green Version]
- Schiettecat, T.; Roets, G.; Vandenbroeck, M. What families in poverty consider supportive: Welfare strategies of parents with young children in relation to (child and family) social work? Child Fam. Soc. Work 2017, 22, 689–699. [Google Scholar] [CrossRef]
- Ferrone, L.; Milliano, M.D. Multidimensional Child Poverty in three Countries in Sub-Saharan Africa. Child Indic. Res. 2018, 11, 755–781. [Google Scholar] [CrossRef]
- Kim, E.; Nandy, S. Multidimensional Child Poverty in Korea: Developing Child-Specific Indicators for the Sustainable Development Goals. Child Indic. Res. 2018, 11, 1029–1050. [Google Scholar] [CrossRef]
- Burchi, F.; Muro, P.D.; Kollar, E. Constructing Well-Being and Poverty Dimensions on Political Grounds. Soc. Indic. Res. 2018, 137, 441–462. [Google Scholar] [CrossRef] [Green Version]
- Gayathri, R.; Rajagopal, N. Multidimensional Poverty Index: An Analysis of Tamil Nadu. Indian J. Econ. Dev. 2019, 15, 177–185. [Google Scholar] [CrossRef]
- Tramontana, F.; Elsadany, A.A.; Xin, B.; Agiza, H.N. Local Stability of the Cournot Solution with Increasing Heterogeneous Competitors. Nonlinear Anal. Real World Appl. 2015, 26, 150–160. [Google Scholar] [CrossRef]
- Wang, M.; Wang, G. Four properties for complex potentials in power series form. Appl. Math. Comput. 2013, 219, 4185–4193. [Google Scholar] [CrossRef]
- Zhou, X.; Shi, X.; Cheng, H. Modelling and stability analysis for a tuberculosis model with healthy education and treatment. Comput. Appl. Math. 2013, 32, 245–260. [Google Scholar] [CrossRef]
- Yang, J.; Mukhopadhaya, P. Is the ADB’s conjecture on upward trend in poverty for China right? An analysis of income and multidimensional poverty in China. Soc. Indic. Res. 2019, 143, 451–477. [Google Scholar] [CrossRef]
- Casini, M.; Bastianoni, S.; Gagliardi, F.; Gigliotti, M.; Riccaboni, A.; Betti, G. Sustainable Development Goals indicators: A methodological proposal for a Multidimensional Fuzzy Index in the Mediterranean area. Sustainability 2019, 11, 1198. [Google Scholar] [CrossRef] [Green Version]
- Zhang, Z.; Shao, H.; Wang, Z.; Shen, H. Reduced-order observer design for the synchronization of the generalized Lorenz chaotic systems. Appl. Math. Comput. 2012, 218, 7614–7621. [Google Scholar] [CrossRef]
- Ciani, M.; Gagliardi, F.; Riccarelli, S.; Betti, G. Fuzzy measures of multidimensional poverty in the Mediterranean Area: A focus on financial dimension. Sustainability 2019, 11, 143. [Google Scholar] [CrossRef] [Green Version]
- Liu, F. On the Triebel-Lizorkin space boundedness of Marcinkiewicz integrals along compound surfaces. Math. Inequal. Appl. 2017, 20, 515–535. [Google Scholar] [CrossRef] [Green Version]
- Zhang, X.; Liu, L.; Wu, Y.; Cui, Y. Entire blow-up solutions for a quasilinear p-Laplacian Schrödinger equation with a non-square diffusion term. Appl. Math. Lett. 2017, 74, 85–93. [Google Scholar] [CrossRef]
Figure 1.
Incidence of poverty in all dimensions of China (%).

Figure 2.
The poverty rate in urban and rural areas (%).

Figure 3.
Regional TFR index.

Figure 4.
The correlation between non-income indicators.

Figure 5.
A joint analysis of two forms of income and non-income.


Table 1.
Selection and Description of Multidimensional Poverty Indicators.
| Dimension | Variable | Poverty Standard |
|---|---|---|
| Economic situation | Income | Below the poverty line |
| Educational level | Number of years of education | The average number of years of education for the family population is no more than five years. |
| Environment | Drinking water | Do not drink tap water or groundwater over 5 m |
| Sanitation facilities | No flush toilet | |
| Living environment | There is excrement around the house | |
| Lighting | Electricity can’t be used. | |
| Fuel | Can’t use gas, natural gas, electricity | |
| Health | Medical insurance | More than half of the household population does not have health insurance. |
| Level of health | The average number of illnesses per family in the past month exceeded 0.5 times. | |
| Asset status | House | Do not own the property right of the house |
| Durable consumer goods | No more than two durable consumer goods |
Table 2.
The incidence of poverty in rural families under the single dimension index.
| Index | Income | Education | Drinking Water | Sanitation Facilities | Living Environment | Lighting |
|---|---|---|---|---|---|---|
| Incidence of poverty (%) | 17.4% | 45.8 | 16.8 | 45.9 | 39.8 | 32.6 |
| Index | Fuel | Medical insurance | Level of health | House | Durable consumer goods | |
| Incidence of poverty (%) | 41.6 | 4.5 | 14.2 | 23.8 | 38.5 |
Table 3.
The change of poverty index after removing the dimensions of health facilities and education.
Table 3.
The change of poverty index after removing the dimensions of health facilities and education.
| Poverty Dimensions K | Incidence of Poverty P(K) | Multidimensional Poverty Index M(K) | ||||
|---|---|---|---|---|---|---|
| Comparison Sample | Remove the Dimension of Sanitation Facilities | Remove the Dimension of Education | Comparison Sample | Remove the Dimension of Sanitation Facilities | Remove the Dimension of Education | |
| 1 | 89.6 | 86.4 | 86.1 | 27.7 | 24.8 | 25.9 |
| 2 | 70.9 | 63.1 | 61.5 | 26.2 | 20.7 | 22.8 |
| 3 | 45.6 | 28.4 | 33.8 | 19.0 | 14.2 | 17.0 |
| 4 | 27.3 | 13.7 | 15.2 | 14.2 | 0.1 | 9.1 |
| 5 | 12.9 | 5.1 | 7.2 | 8.1 | 4.0 | 4.4 |
| 6 | 4.4 | 2.1 | 2.8 | 3.5 | 1.4 | 1.9 |
| 7 | 2.1 | 0.4 | 0.4 | 1.8 | 0.3 | 0.3 |
| 8 | 0.4 | 0.3 | ||||
| 9 | 0.0 | 0.0 | ||||
Table 4.
Totally fuzzy approach (TFR) calculation results.
| Dimension | Index | TRF | Weight | TFR Weighting | Contribution Rate % | ||
|---|---|---|---|---|---|---|---|
| Poverty Indicators System | Income | Income | 0.55 | 0.0418 | 0.0209 | 10.837 | 10.67 |
| Education | Education | 0.561 | 0.0407 | 0.0209 | 10.727 | 10.57 | |
| Environment | Drinking water | 0.3454 | 0.0693 | 0.022 | 11.42 | 42.17 | |
| Sanitation facilities | 0.341 | 0.0704 | 0.022 | 11.398 | |||
| Living environment | 0.1683 | 0.1122 | 0.0176 | 8.813 | |||
| Lighting | 0.0077 | 0.297 | 0.0022 | 0.277 | |||
| Fuel | 0.2189 | 0.0968 | 0.0187 | 9.979 | |||
| Health | Medical insurance | 0.2816 | 0.0814 | 0.0209 | 10.814 | 20.31 | |
| Level of health | 0.2013 | 0.1012 | 0.0187 | 9.627 | |||
| Asset status | House | 0.0836 | 0.154 | 0.0121 | 5.755 | 16.28 | |
| Durable consumer goods | 0.5951 | 0.0363 | 0.0198 | 10.353 | |||
| Total | 100 | 100 |
© 2020 by the authors. Licensee MDPI, Basel, Switzerland. This article is an open access article distributed under the terms and conditions of the Creative Commons Attribution (CC BY) license (http://creativecommons.org/licenses/by/4.0/).
Share and Cite
MDPI and ACS Style
Gao, S.; Sun, K. Poverty Measure Based on Hesitant Fuzzy Decision Algorithm under Social Network Media. Symmetry 2020, 12, 384. https://0-doi-org.brum.beds.ac.uk/10.3390/sym12030384
AMA Style
Gao S, Sun K. Poverty Measure Based on Hesitant Fuzzy Decision Algorithm under Social Network Media. Symmetry. 2020; 12(3):384. https://0-doi-org.brum.beds.ac.uk/10.3390/sym12030384
Chicago/Turabian StyleGao, Suwei, and Kaiyang Sun. 2020. "Poverty Measure Based on Hesitant Fuzzy Decision Algorithm under Social Network Media" Symmetry 12, no. 3: 384. https://0-doi-org.brum.beds.ac.uk/10.3390/sym12030384
Note that from the first issue of 2016, this journal uses article numbers instead of page numbers. See further details here.