Parameter Adjustment Strategy and Experimental Development of Hydraulic System for Wave Energy Power Generation

School of Mechanical and Electrical Engineering, Shandong Jianzhu University, Jinan 250101, China
Symmetry 2020, 12(5), 711; https://0-doi-org.brum.beds.ac.uk/10.3390/sym12050711
Submission received: 20 February 2020
/
Revised: 29 March 2020
/
Accepted: 1 April 2020
/
Published: 2 May 2020
(This article belongs to the Special Issue Mathematical Modeling and Computational Methods in Science and Engineering II)
Abstract
:This paper develops the dynamic response of a hydrolic-transmission system of wave-power devices under random wave conditions. Through theoretical calculation and experiment analysis, the mathematical model of the hydrolic-transmission system was built to make clear which parameters are related to electric-energy output. The working characteristics of the main parameters are developed through the designed experimental platform. The charging pressure of the accumulator, which affects the rigidity of the hydrolic-transmission system, is analyzed. The throttle valve opening and symmetrical electric loads, which affect the stability and efficiency of the electric energy output, are analyzed. Thus, the energy output curve under different parameter regulations is drawn. Through the orthogonal experimental method, the law curve is further modified, the design principle of hydraulic system parameters under the sea level condition is established, and the optimal design scheme and regulation strategy to the hydraulic conversion system of the power generation device is obtained, to solve the problem that the multiparameter coupling cannot be adjusted quickly and effectively. The energy regulation response mechanism of the hydrolic-transmission system in the wave energy power-generation system is proved.
1. Introduction
Wave energy is the densest of all renewable energy sources, and it concentrates near the sea surface [1,2]. High-energy density is conducive to improving the power generation and efficiency of energy utilization devices, and concentrated distribution near the sea surface is conducive to energy capture. The theoretical-energy capture efficiency and actual efficiency of wave energy are higher than other energy sources [3]. Wave energy devices can generate energy over 90% of the normal working time [4,5]. The long-term working time means that the wave energy utilization device has a good market development prospect and utilization value, and is expected to recover the research and development cost in a short time [6,7,8].
After decades of rapid development, a large number of innovative wave energy power-generation devices have been produced [9,10,11]. However, due to the harsh marine environment, such as frequent strong winds and waves, wave energy-conversion devices are vulnerable to seawater corrosion and wind wave damage. Therefore, this has a high cost of development and utilization, which, to some extent, restricts the development of renewable energy [12,13]. As a result, few devices are put into commercial applications. This shows that there are still many problems in the wave energy-conversion process. The energy output stability and system reliability of existing devices [14] have become a bottleneck restricting the application and development of wave energy-generation technology. It has become an urgent problem that is being addressed. So, it is necessary to master the regulation law of parameters for the design and manufacture of wave energy power-generation devices. Because of the huge cost of ocean tests and the volume of wave-power-generation equipment, it is not easy to carry out experiments. Thus, most of the research is based on simulations and mathematical models, and there are certainly some limitations. It is an effective research strategy to use a physical experimental platform to study the working characteristics of the equipment before the actual ocean test. In order to achieve this goal, we have developed the mathematical model of the hydrolic-transmission system and made clear which parameters relate to the electric-energy output. Therefore, we designed the experimental platform and studied the regulation characteristics.
According to the sea situation of marine equipment, combined with an analysis of specific problems, and through the theoretical analysis and the verification of the land experiment platform [15,16], the response characteristics of each parameter in the process of power output stability regulation are analyzed. The selection principle of system parameters and structural parameters under the adaptive energy storage regulation is established, and the regulation law of different parameters about power output is summarized, to solve the problem that cannot be solved quickly and effectively under multiparameter coupling [17,18].
In this paper, the optimal wave-power-generation device is used. The first part introduces the working principle of the hydrolic-transmission system, and the second part establishes the mathematical model. Next, the third part constructs the land experiment platform to verify the theoretical results. Lasty, the fourth part draws the conclusion.
2. Working Principle of Wave Energy, Power-Generation Devices
2.1. Power Generation Principle
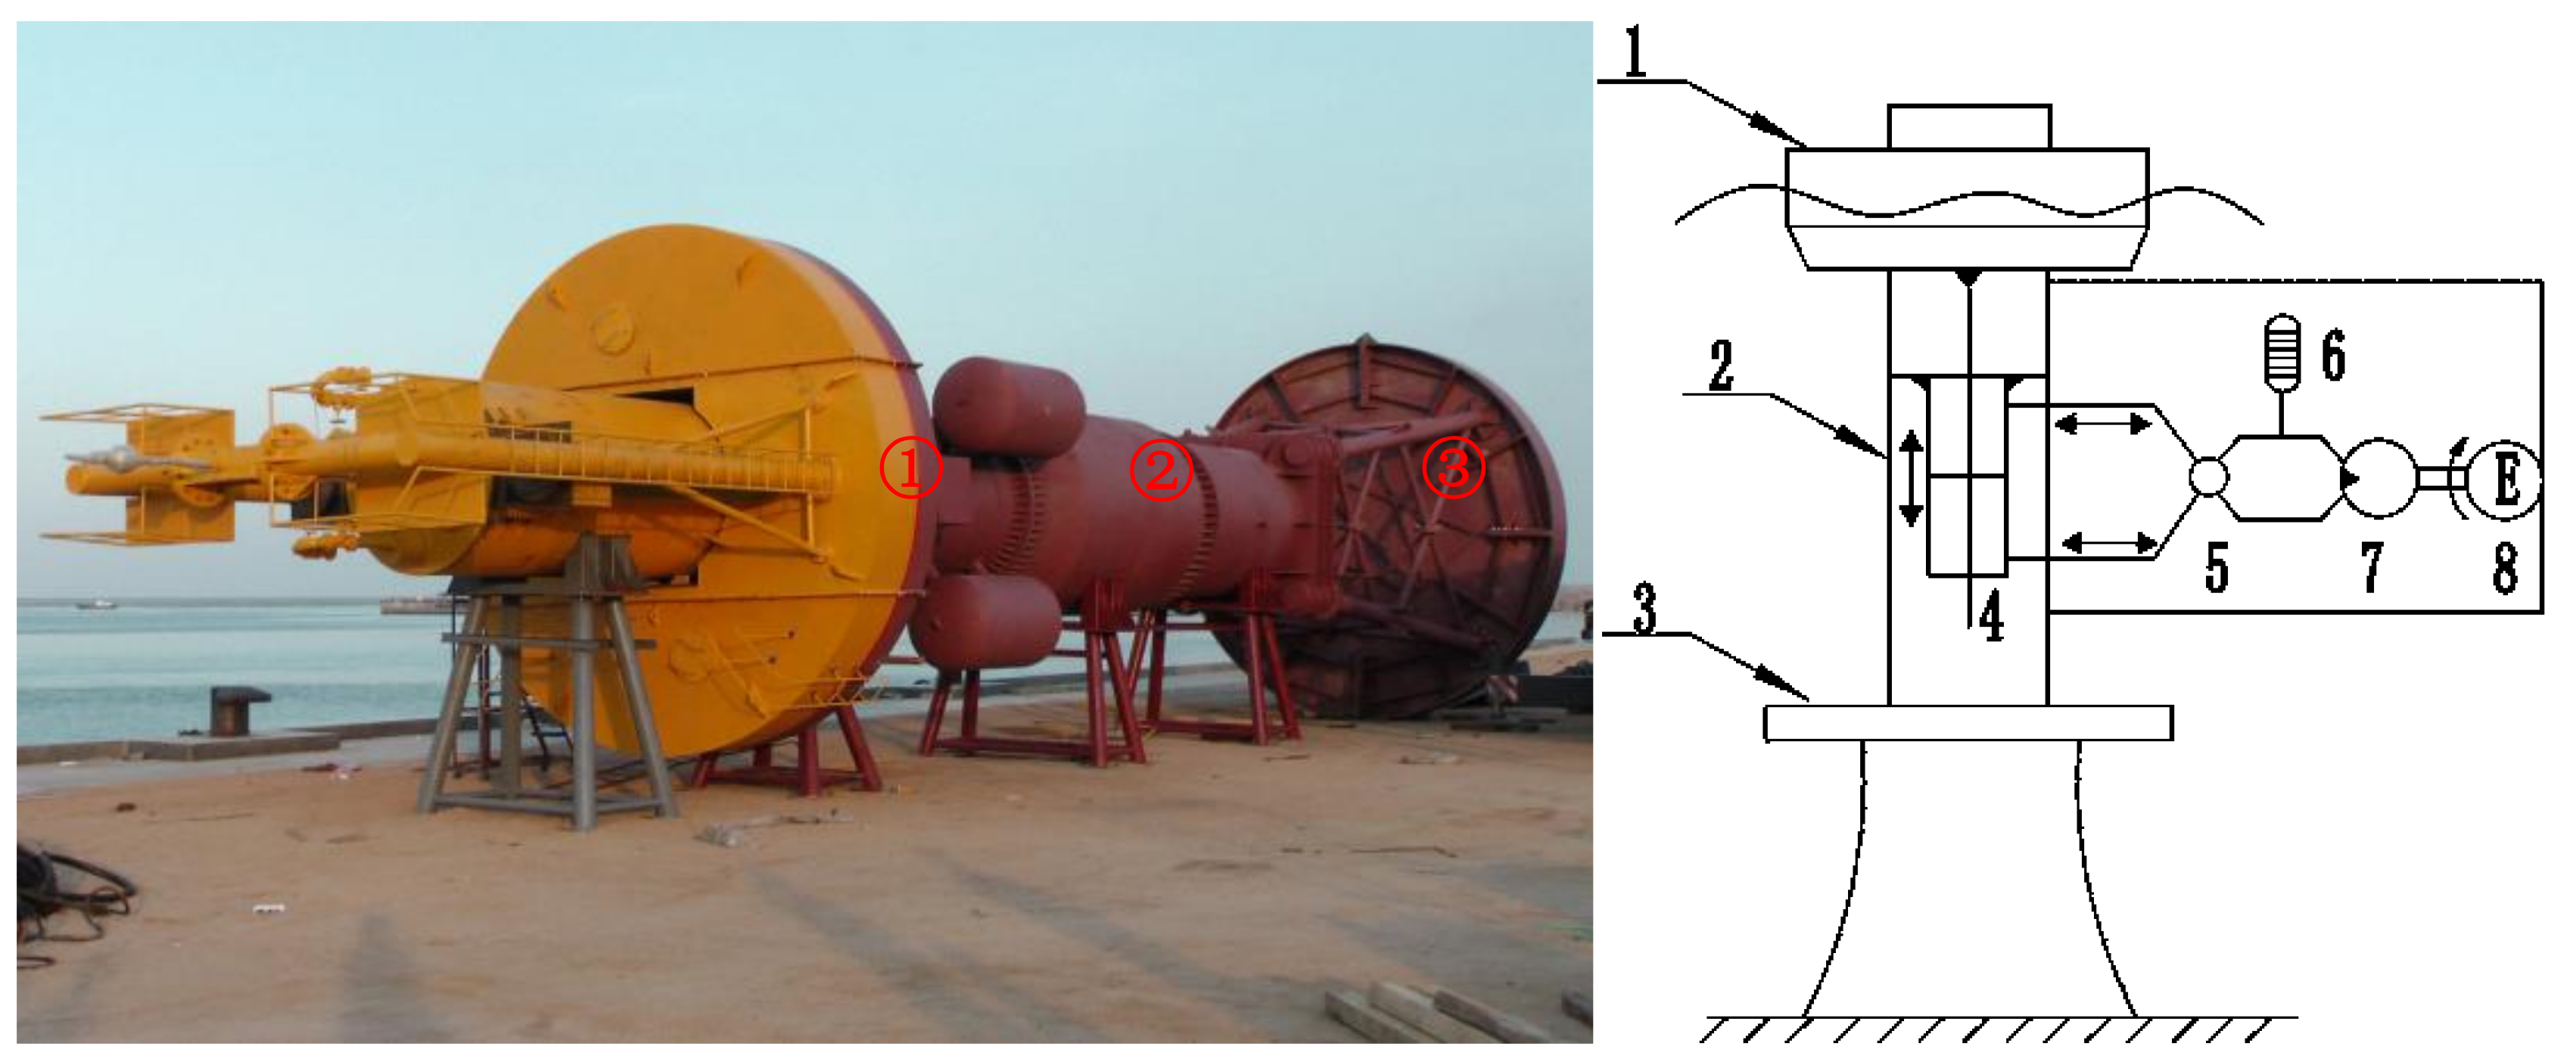
Figure 1 shows a new wave energy power-generation device. The device is mainly composed of a wave energy-conversion system, energy-transfer system, electric-energy consumption system, and control-detection system. It uses the hydraulic system for energy conversion. The hydraulic system consists of a hydraulic cylinder, hydraulic valve, accumulator, and motor. The float movement drives the hydraulic cylinder to move so as to convert the mechanical energy of float into hydraulic energy, and the hydraulic energy can drive the generator to work and output electric energy through the adjustment of the valve and accumulator.
2.2. Principle of Hydraulic Transmission
The specific working process of the hydraulic variable damping transmission system is as follows: the fluctuation of the wave causes the float to move up and down driving the hydraulic cylinder to work; the resulting high-pressure oil drives the hydraulic motor to rotate, which drives the generator to generate electricity; and the hydraulic oil discharged by the hydraulic variable displacement motor is cooled by the oil tank before it is recycled by the hydraulic cylinder. The control system switches variable motors with different displacements according to the wave conditions, and different hydraulic motors drive the generators with different rated powers to work.
When the wave is relatively large and wave energy is absorbed more, the control system will switch to variable motors with 107 mL/r displacement to drive 55 kW generators to work, and the high-pressure accumulator will start and store the excess energy in the accumulator. When the energy collected by the power-generation system is not enough to maintain the normal power generation of the system, the low-pressure accumulator will be started, and the pre-stored energy in the accumulator will be used for supplementary adjustment. At the same time, the control system will switch to the small displacement hydraulic motor to drive the 18 kW generator to work, and when it works in the normal wave condition, it will switch to the 37 kW generator to work. In this way, the generator can always work in a state of high-power output, which improves the safety of the power-generation device and the efficiency of the power output.
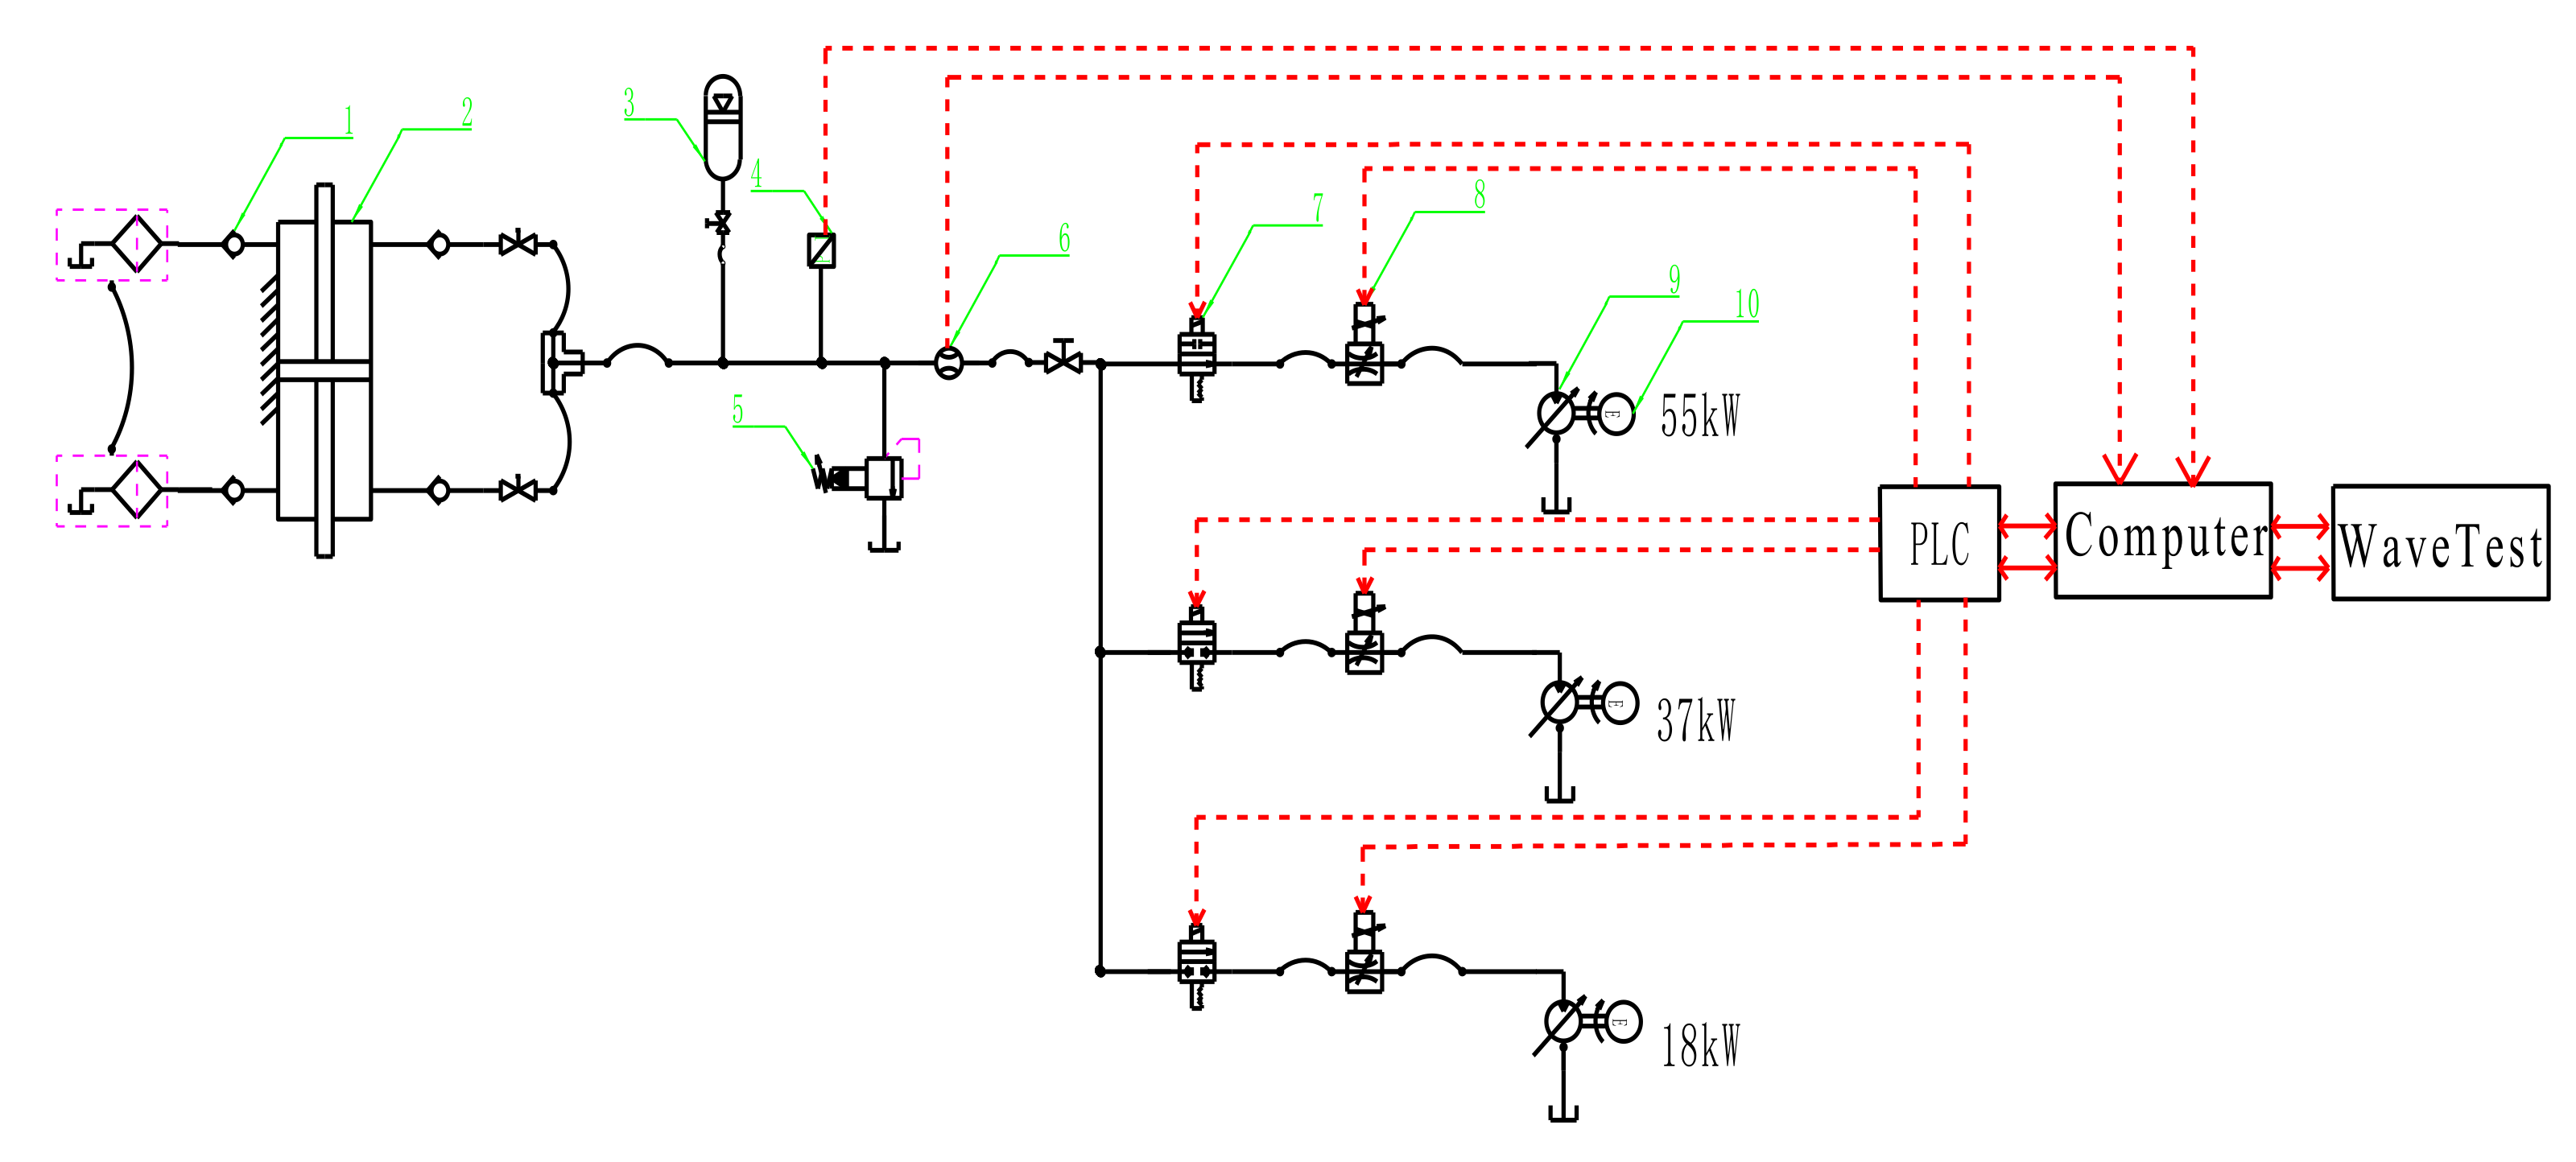
By adjusting each group of the variable motor, the speed of the generator is kept in different ranges and different stages, which is also convenient for processes such as rectification, stabilization, and inversion of electric energy. Figure 2 shows the working principle of the hydrolic-transmission system.
3. Mathematical Model Analysis
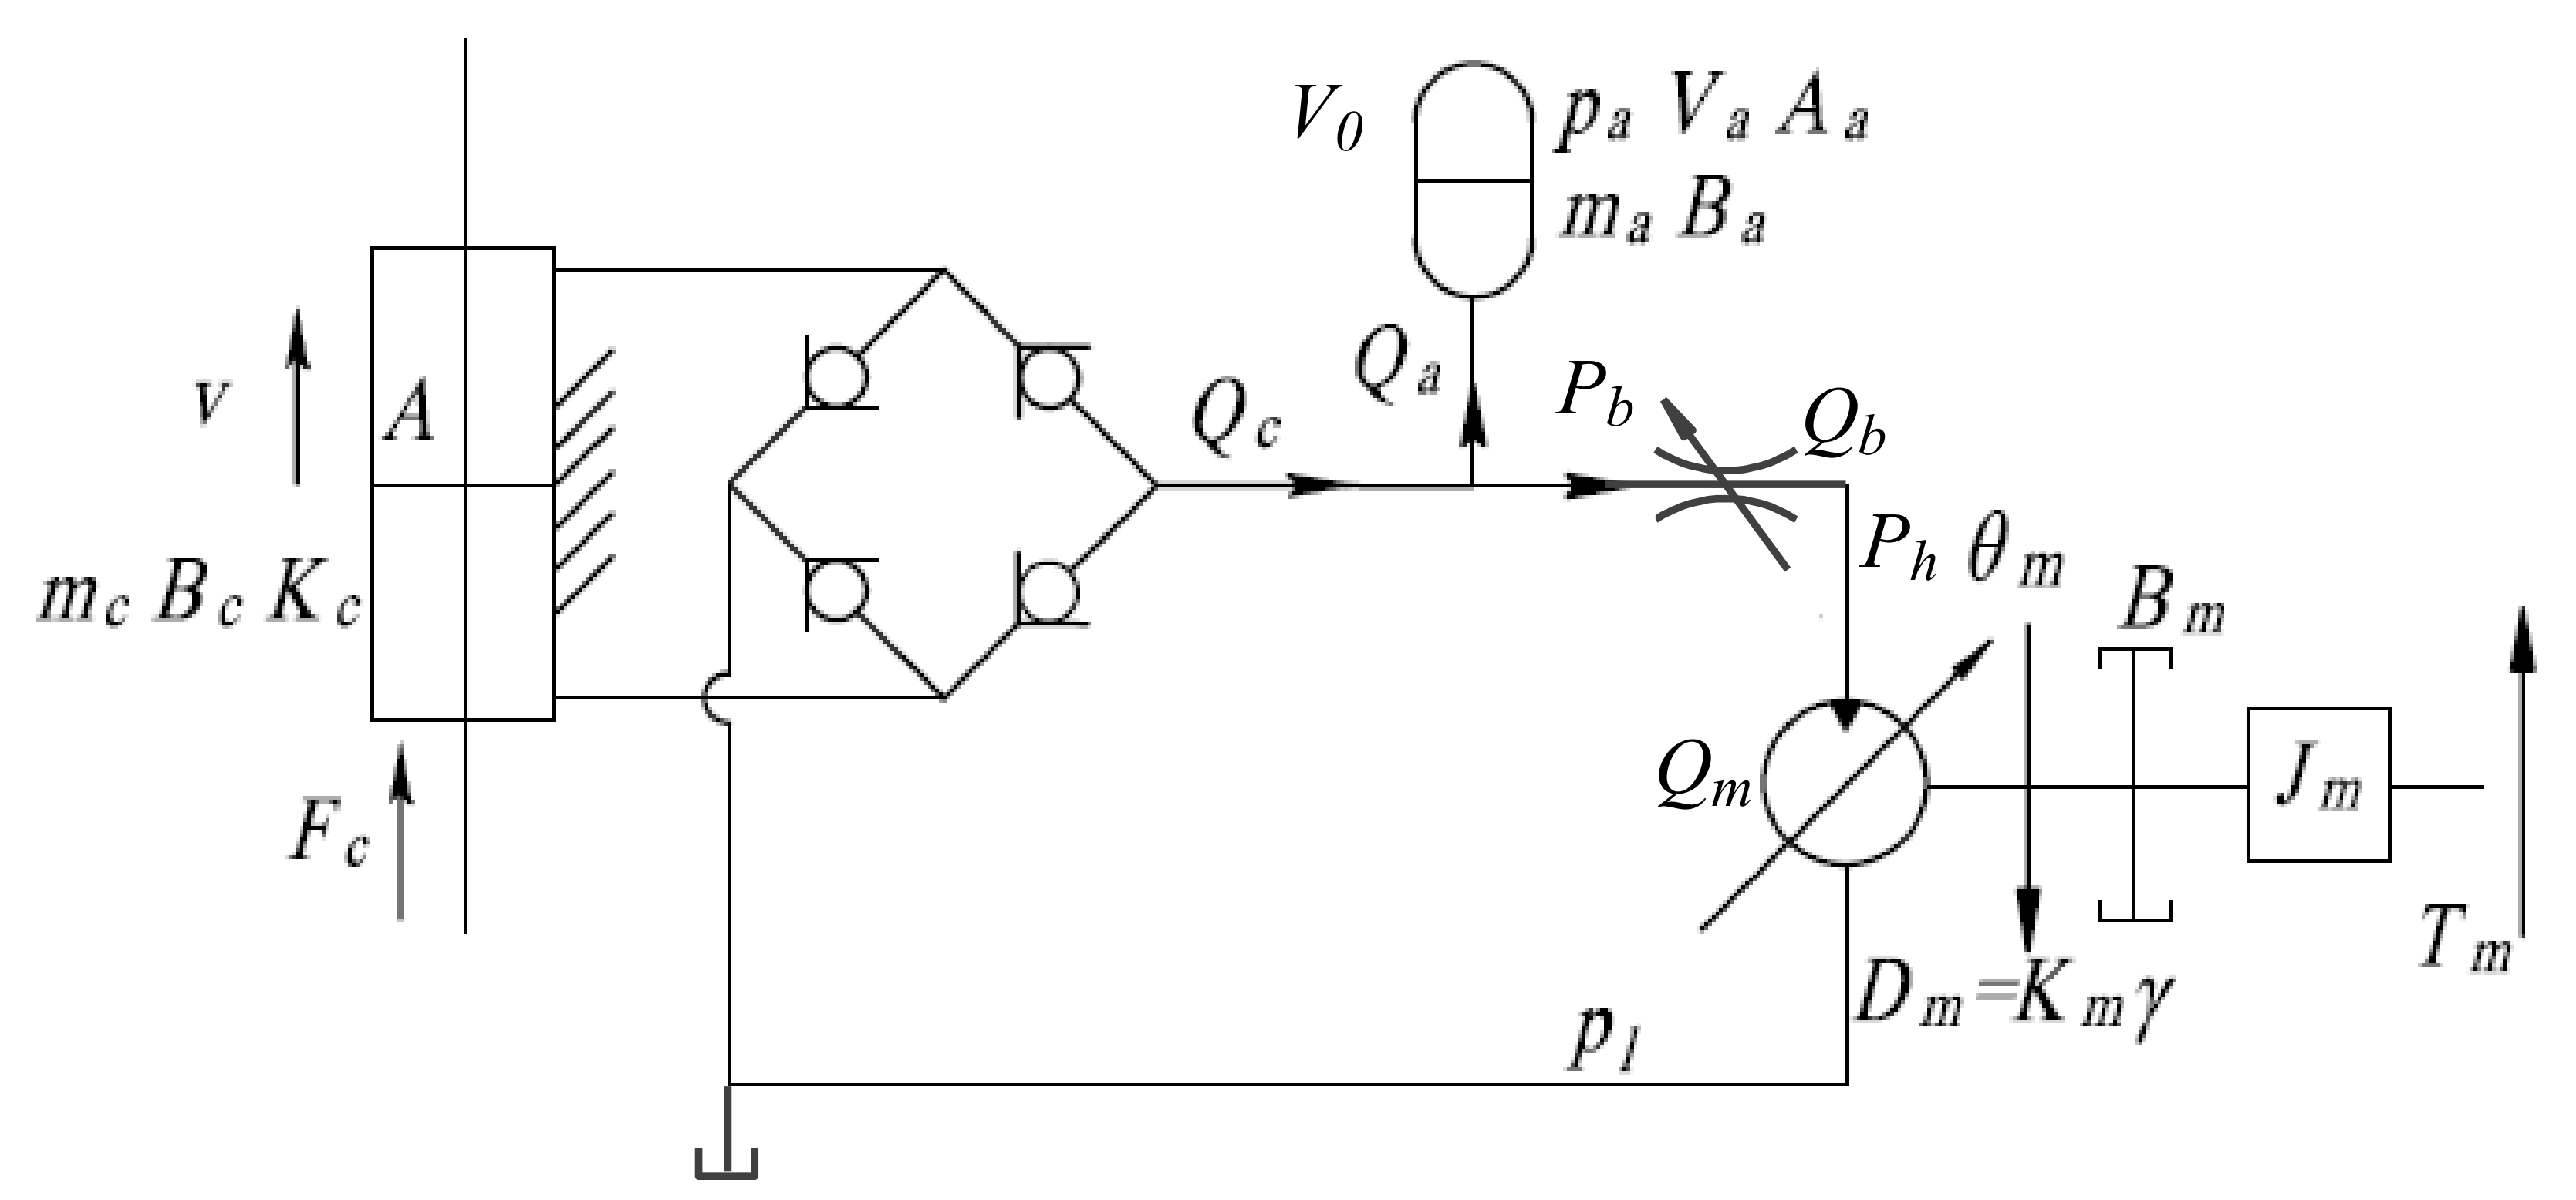
Figure 3 shows the mathematical model of the hydrolic-transmission system. Next, the mathematical model is analyzed.
Flow continuity equation of hydraulic cylinder
In formulation:
: The flow in the cylinder; : the speed of hydraulic cylinder; and : the effective area of hydraulic cylinder; : the internal leakage coefficient of hydraulic cylinder; : the external leakage coefficient of hydraulic cylinder; : the pressure of hydraulic motor; : the pressure of load.
The force balance equation of stroke control piston can be described as:
In formulation:
: The force of cylinder stroke; : the effective area of hydraulic cylinder; : the load pressure of the stroke control piston; : the effective piston mass; : the displacement of cylinder stroke; : the piston viscous damping coefficient; : the load spring constant; and : the external disturbance.
Thus, we can get
Force balance equation of accumulator
In formulation:
: The inflation pressure of accumulator; : the equivalent working area of accumulator; : the equivalent mass of hydraulic oil in accumulator; : the flow of hydraulic oil in accumulator; and : the oil cavity damping coefficient of accumulator.
Flow continuity equation of accumulator
In formulation: is the inflation volume of accumulator.
State equation of ideal gas:
In formulation: is the initial charge volume of accumulator; is the initial charge pressure of accumulator.
The state equation of ideal gas is simplified by Laplace transformation
Derived from Formulas (3)–(6) can get
The flow equation of throttle valve
In formulation: is the flow coefficient; is the Orifice area of throttle valve.
Motor flow continuity equation
In formulation: is the flow of hydraulic motor; is the speed of motor; is the displacement of motor; is the internal leakage coefficient of motor; is the displacement gradient of motor stroke control loop; and is the swing angle of hydraulic motor.
Flow continuity equation of loop high-pressure cavity
The torque-balance equation of the hydraulic motor can be described as
The output power of motor can be described as
In formulation: is the inertia; is the viscous damping coefficient; is the angular displacement of motor; is the viscous damping coefficient; is the electric load spring gradient; is the external loads of the hydraulic motor; is the effective bulk modulus; is the total volume of hydraulic motor; and is the mechanical efficiency of hydraulic motor.
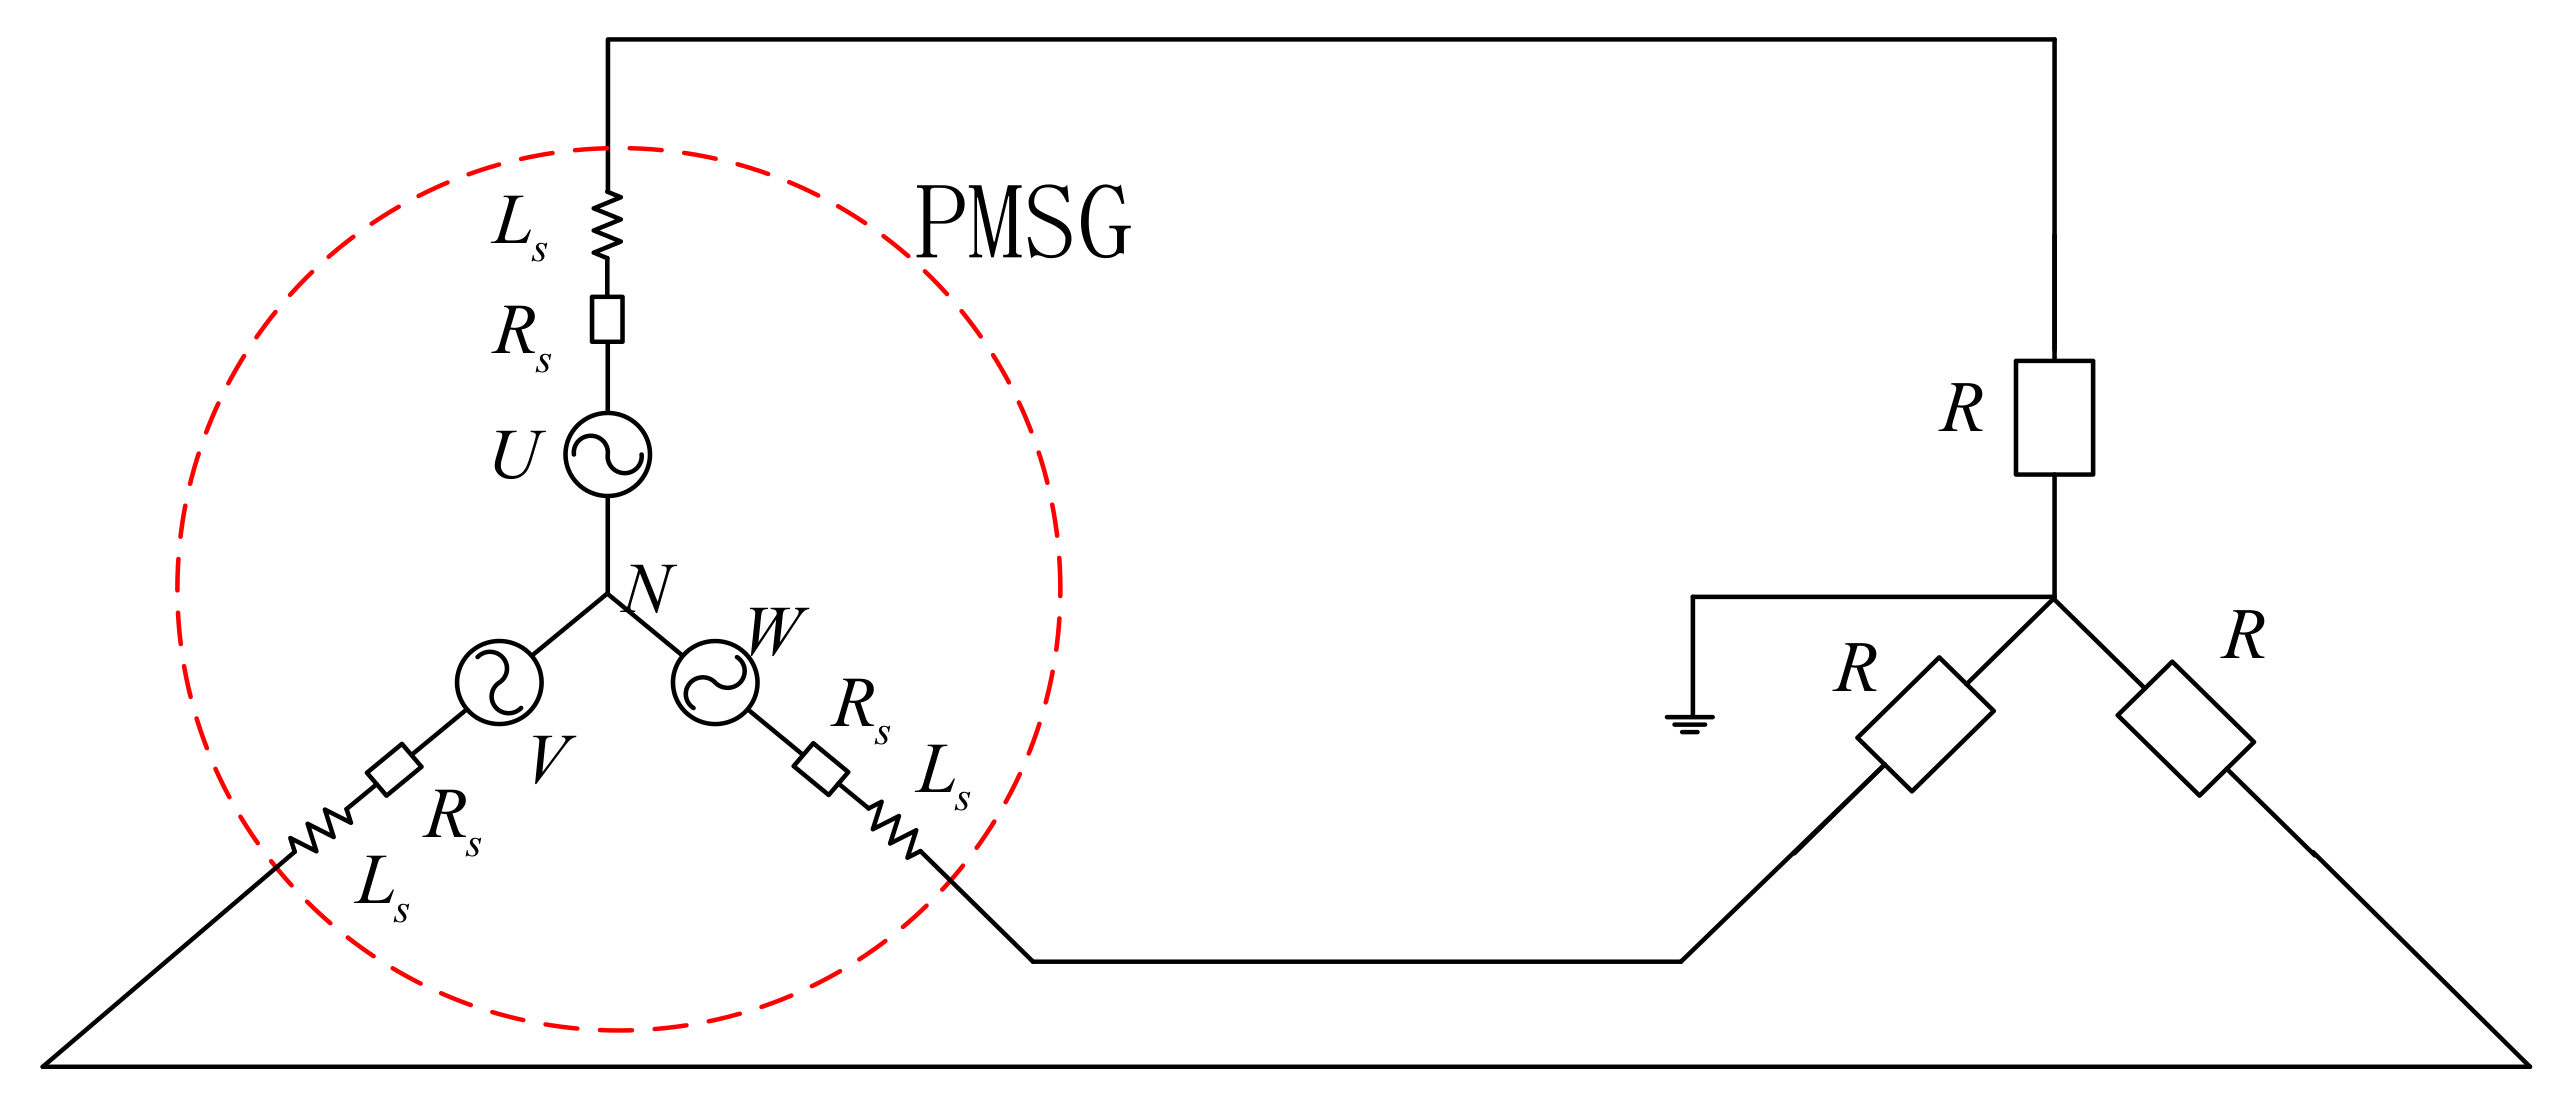
The electric load is the permanent magnet synchronous generator (PMSG) with a three-phase symmetrical pure resistance load. Its working principle can be seen in Figure 4.
Ignoring the power loss on the line, the instantaneous output power of the generator is the sum of the instantaneous absorbed power of each phase load:
In formulation:
, , : Instantaneous absorbed power of generator , , with three-phase load;
, , : Instantaneous value of three-phase load voltage of generator , , ;
, , : Instantaneous value of three-phase load current of generator , , ;
, , : Effective value of three-phase load voltage;
, , : Effective value of three-phase load voltage A;
: Three phase angular frequency, rad/s;
: Load impedance angle, rad.
The impedance angle of the pure resistive load is 0, and the complex impedance inside the selected permanent magnet synchronous motor is far less than that of the three-phase resistive load. The instantaneous total output power of the generator is
In formulation:
: The phase voltage of PMSG; : the phase current of PMSG; : the equivalent impedance of PMSG; and : the pure resistive load.
Define the system state variables
, then the state space expression of the system mathematical model is
In summary:
From the above formula, we can summarize that the power output of the wave generator is mainly related to the loads and orifice area of the throttle valve and accumulator parameters. In order to better develop the influence of different parameters, we set up a land-test platform for research.
4. Composition of Experimental Device
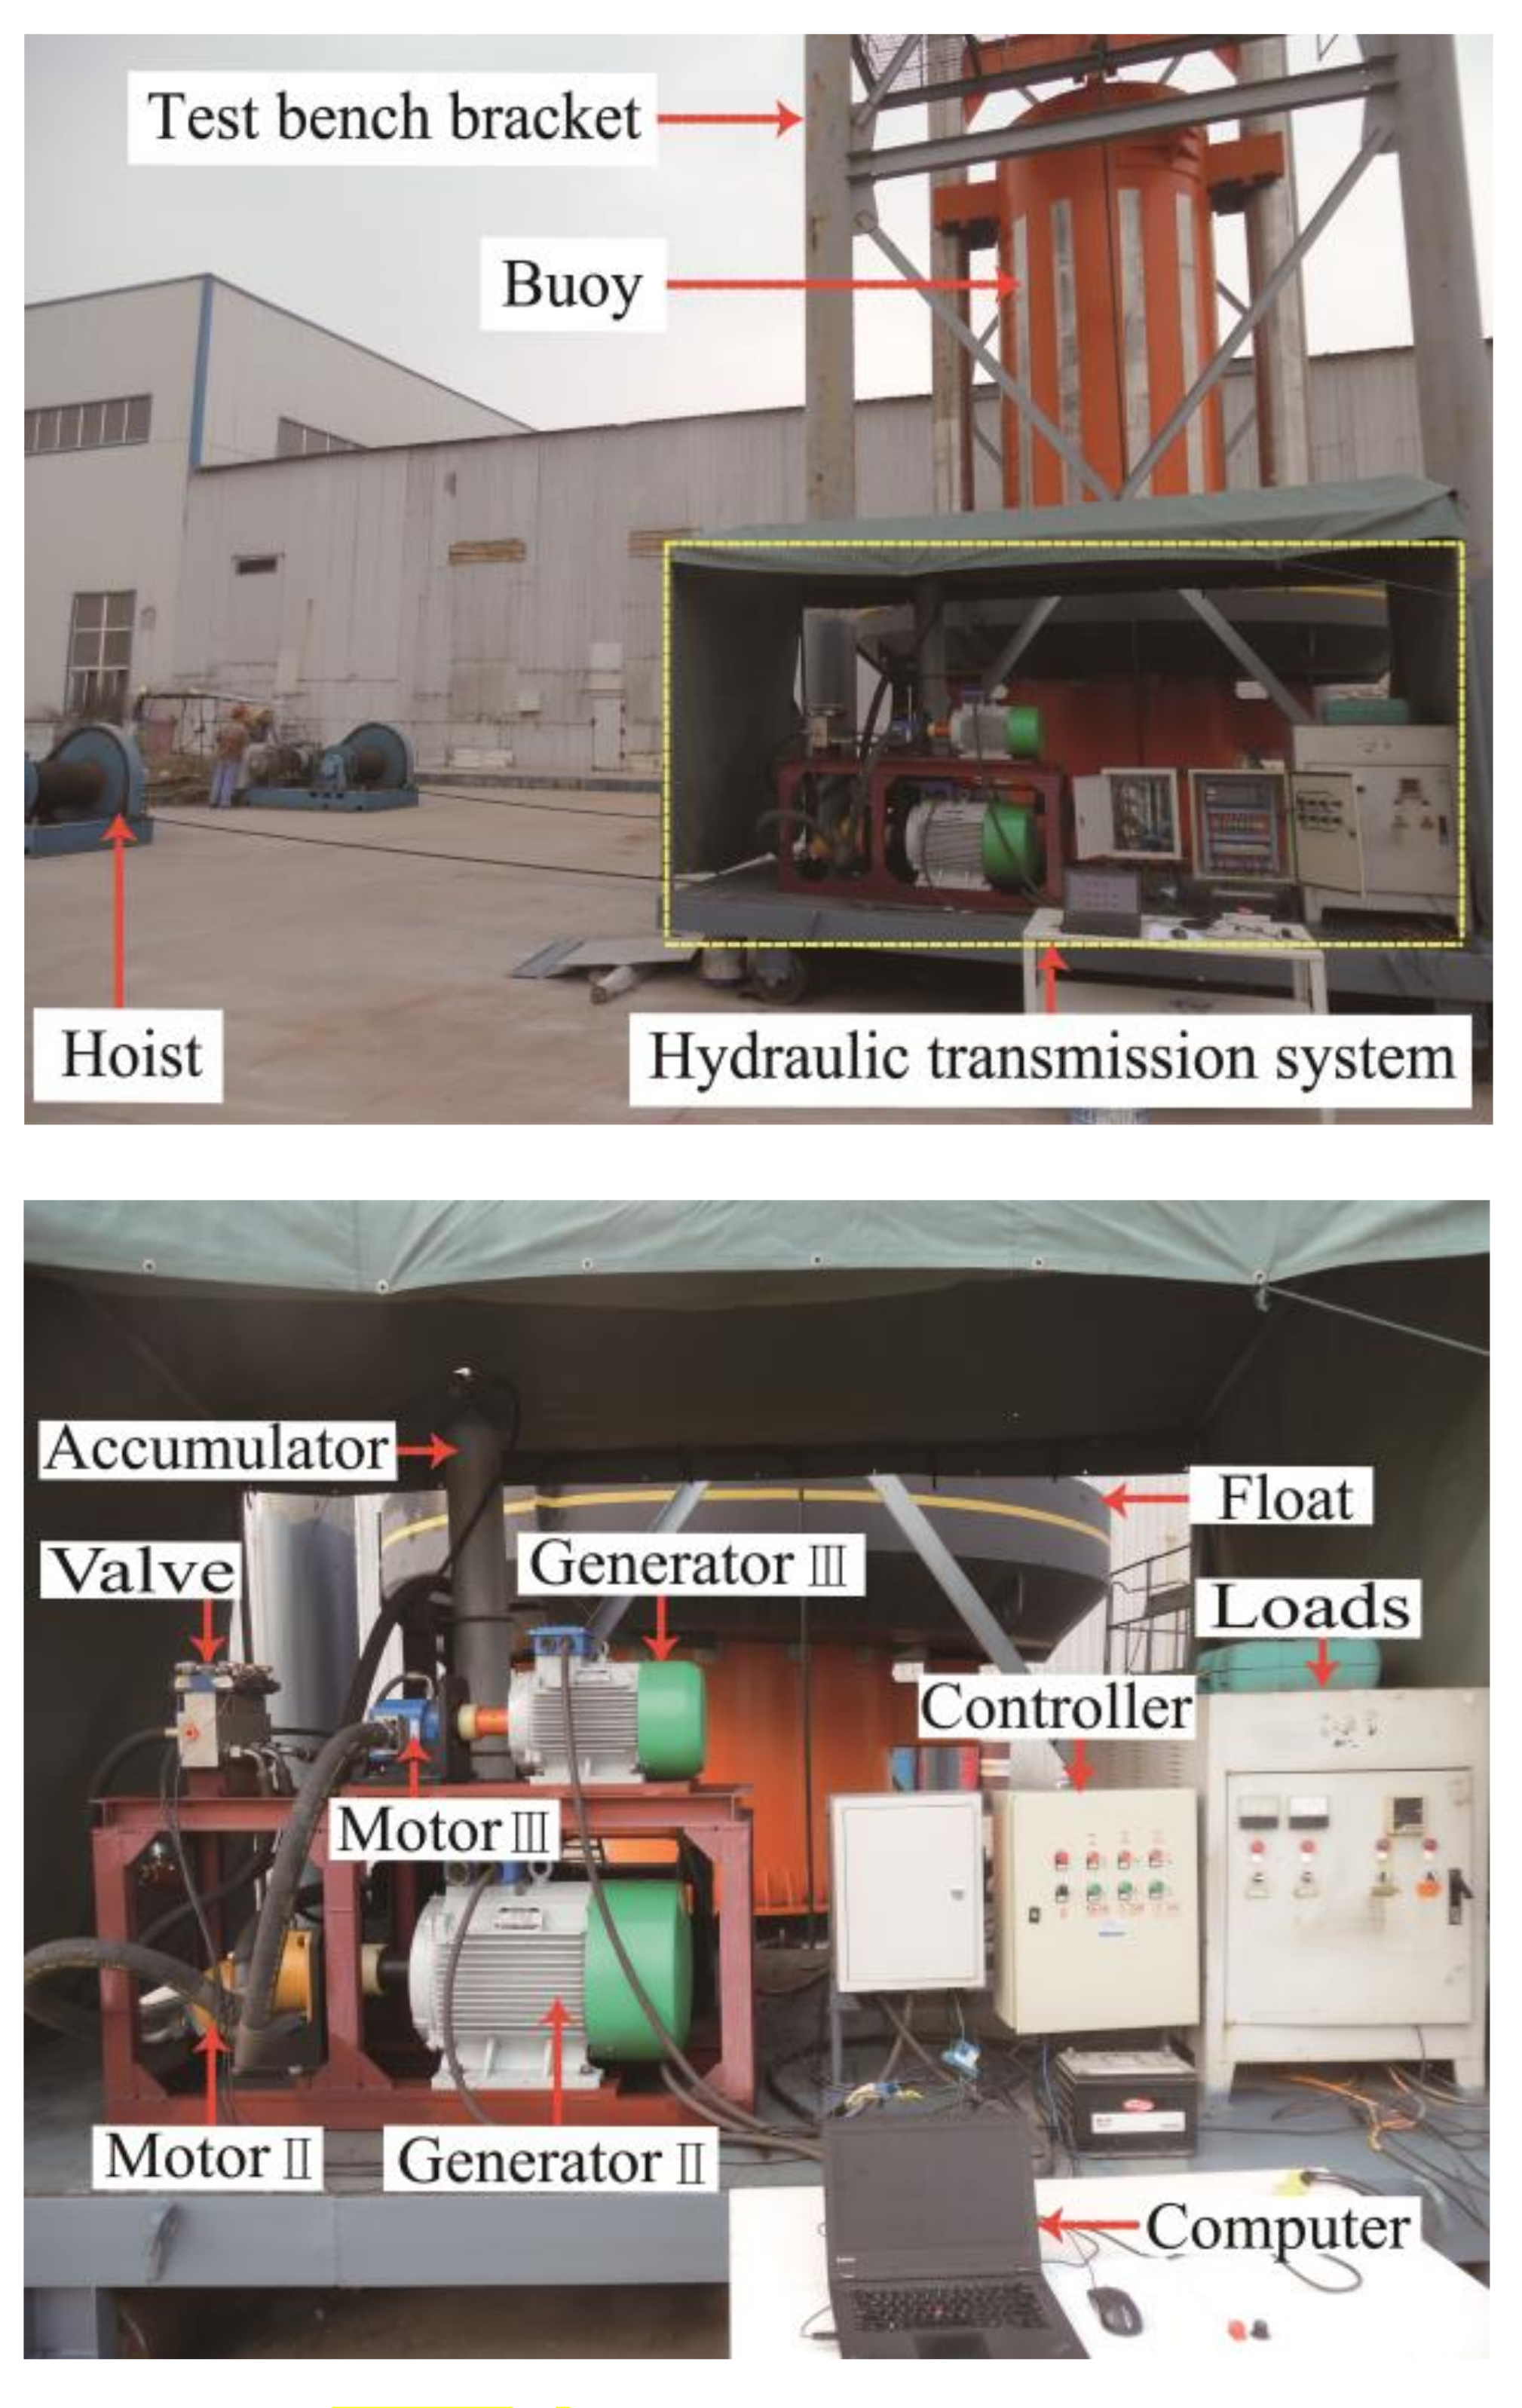
As is shown in Figure 5, the land-experiment bench has been built to develop the effect of different parameters on the power output. The float is pulled up and down along the buoy by hoists, which transmits hydraulic energy into electrical energy.
The energy-transmission system is shown in Figure 6. The PC system can acquire in real time some parameters such as the displacement of float and output pressure as well as the output voltage and other parameters.
4.1. Effect of Accumulator Pressure on Power Output
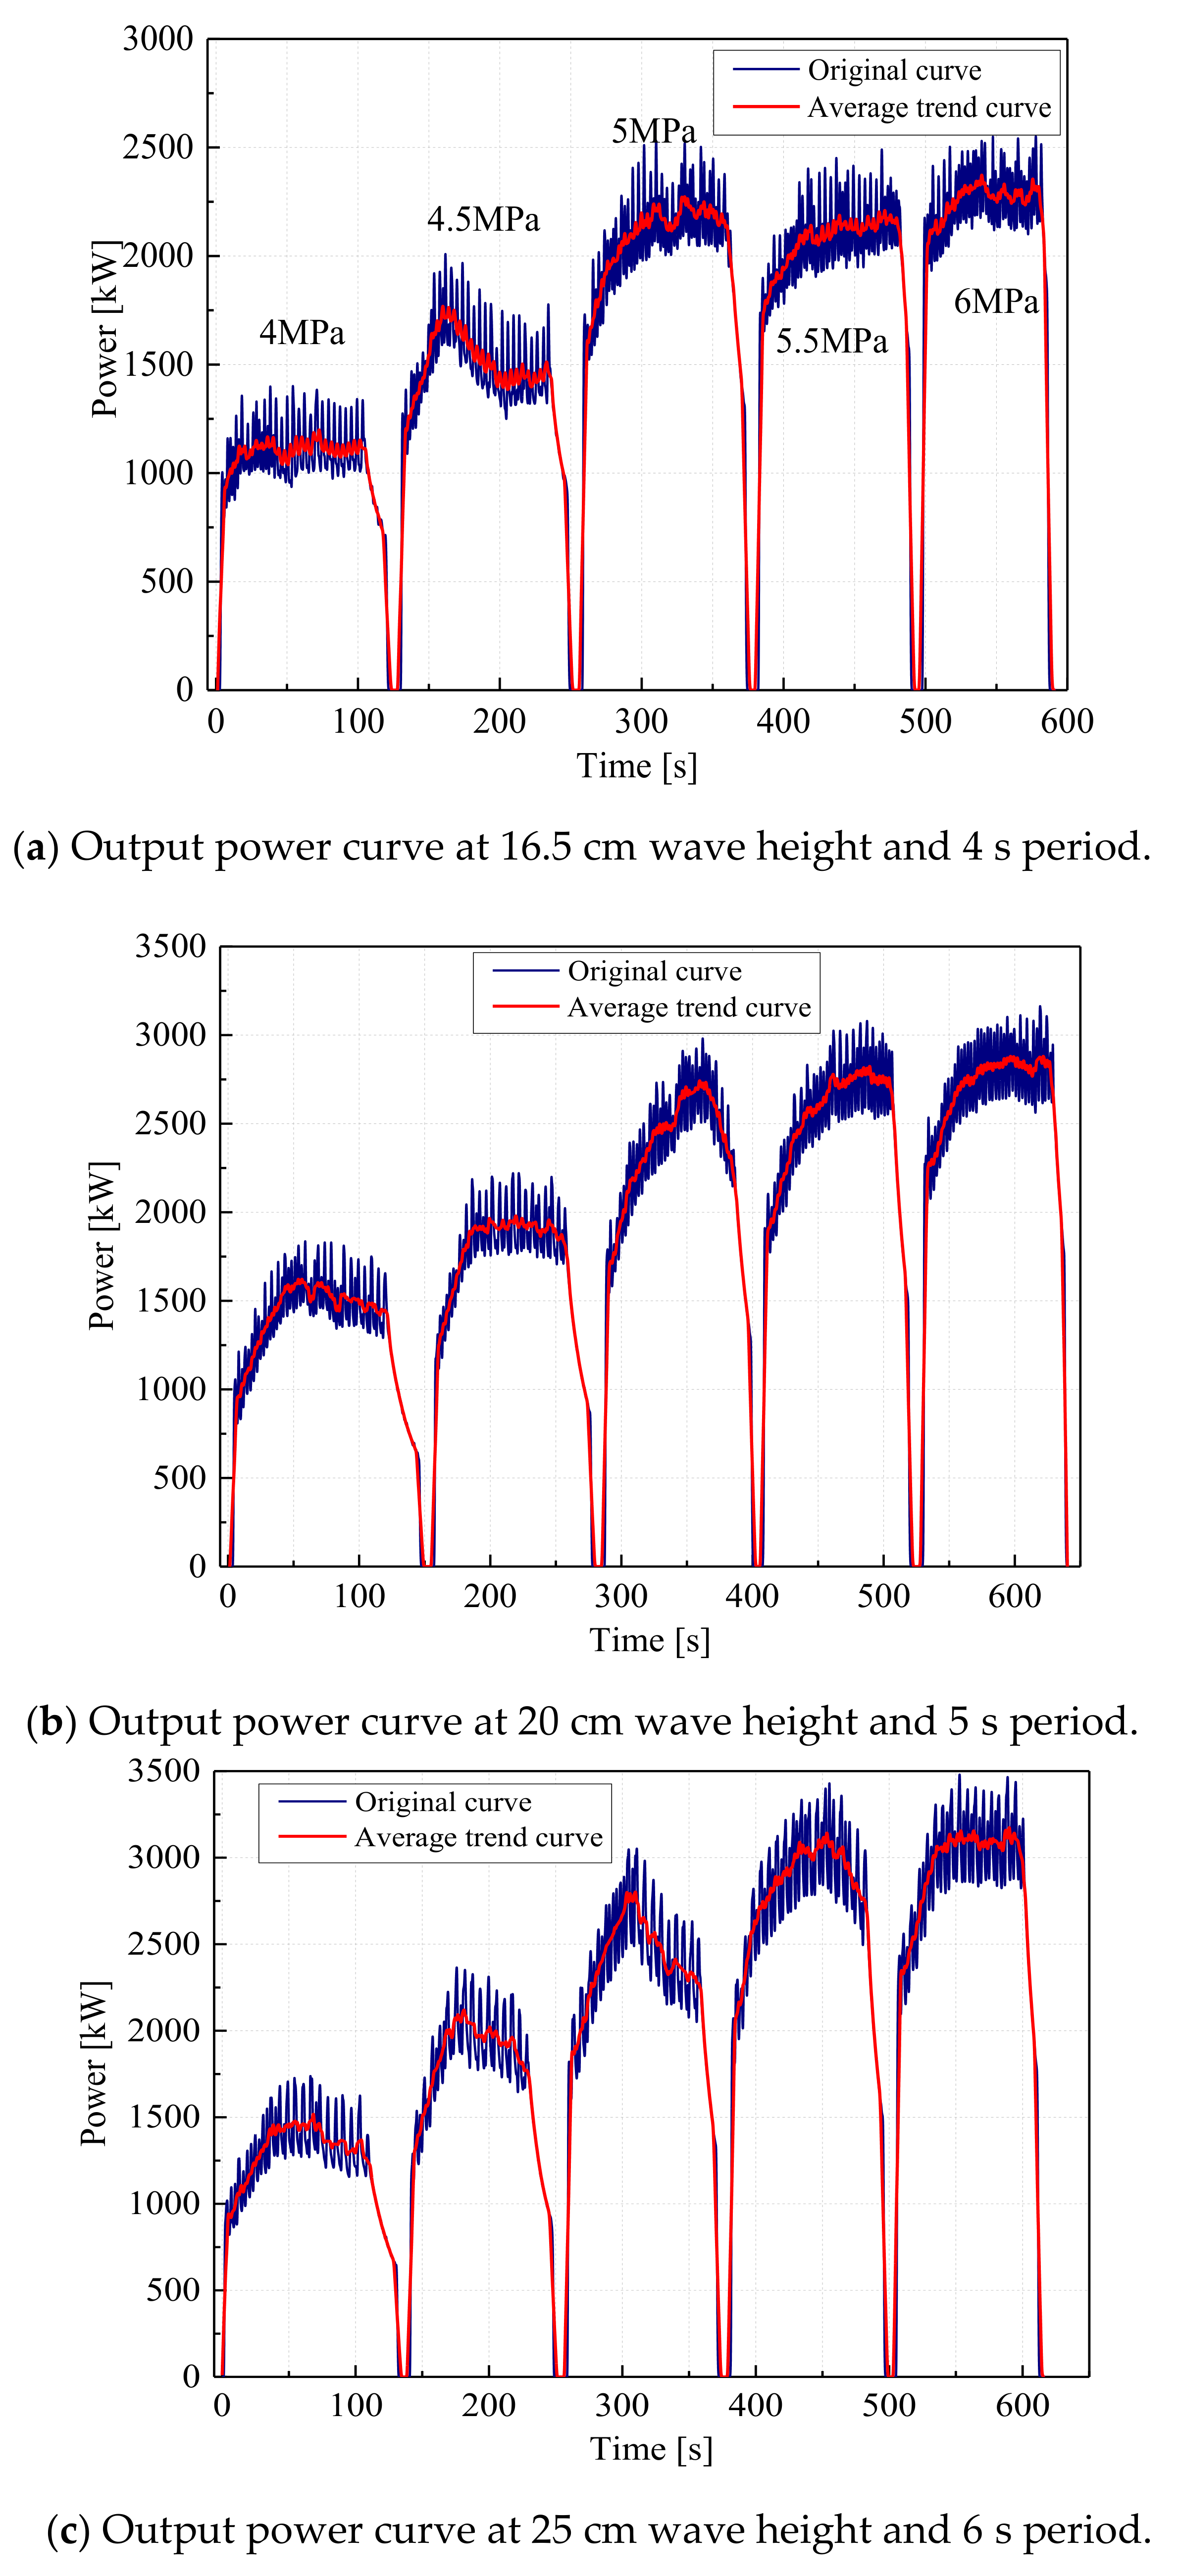
According to the wave conditions of the sea trial, the optimal pressure of the accumulator is developed. The time that the float takes to travel from peak to trough and to peak again is called the period. When the period is 4 s, the wave height is 16.5 cm; when the period is 5 s, the wave height is 20 cm; and when the period is 6 s, the wave height is 25 cm, respectively. Setting accumulator pressure is 4 MPa, 4.5 MPa, 5 MPa, 5.5 MPa, and 6 MPa, respectively. Figure 7 shows the output power curve under different accumulator charging pressures.
Analysis of the curve in Figure 7 shows that when the wave period is 4s and the wave height is 16.5 cm, the optimal pressure value of the accumulator is 5 MPa. At this time, the output power of the system is about 2.3 kW and the oscillation amplitude is relatively small. When the wave period is 5 s and the wave height is 20 cm, the optimal pressure value of the accumulator is 6.0 MPa and the stable output power of the generator is 2.75 kW. When the wave period is 6 s and the wave height is 25 cm, the optimal pressure value of the accumulator can be 6.0 MPa and the stable output power of the generator is 3.3 kW. According to the above results, the preinflation pressure value of the accumulator is closely related to the wave condition.
4.2. Effect of Load Change on Power Output
Any wave-power-generation system includes a wave energy-absorption mechanism and generator which play the role of the prime mover. As the prime mover, the optimal load of the wave-power-generation mechanism affects the efficiency of the whole power-generation system to a great extent. Whether the load is in the best condition has a very important influence on the efficiency of the wave absorbing device. Matching wave energy-absorption characteristics with generator output characteristics is an important way to improve the conversion efficiency of the wave-power-generation system.
By adjusting the load of the generator, the power output can be adjusted. The function of load regulation is to adapt the changing output power to the changing load, so that the output power of the generator and the load-absorbed power can reach a balance. Load regulation can increase and cut off the load according to the change of output power when the sea condition changes, or adjust the load according to the change of output power frequency of the generator, to make the speed of the generator run in the best condition.
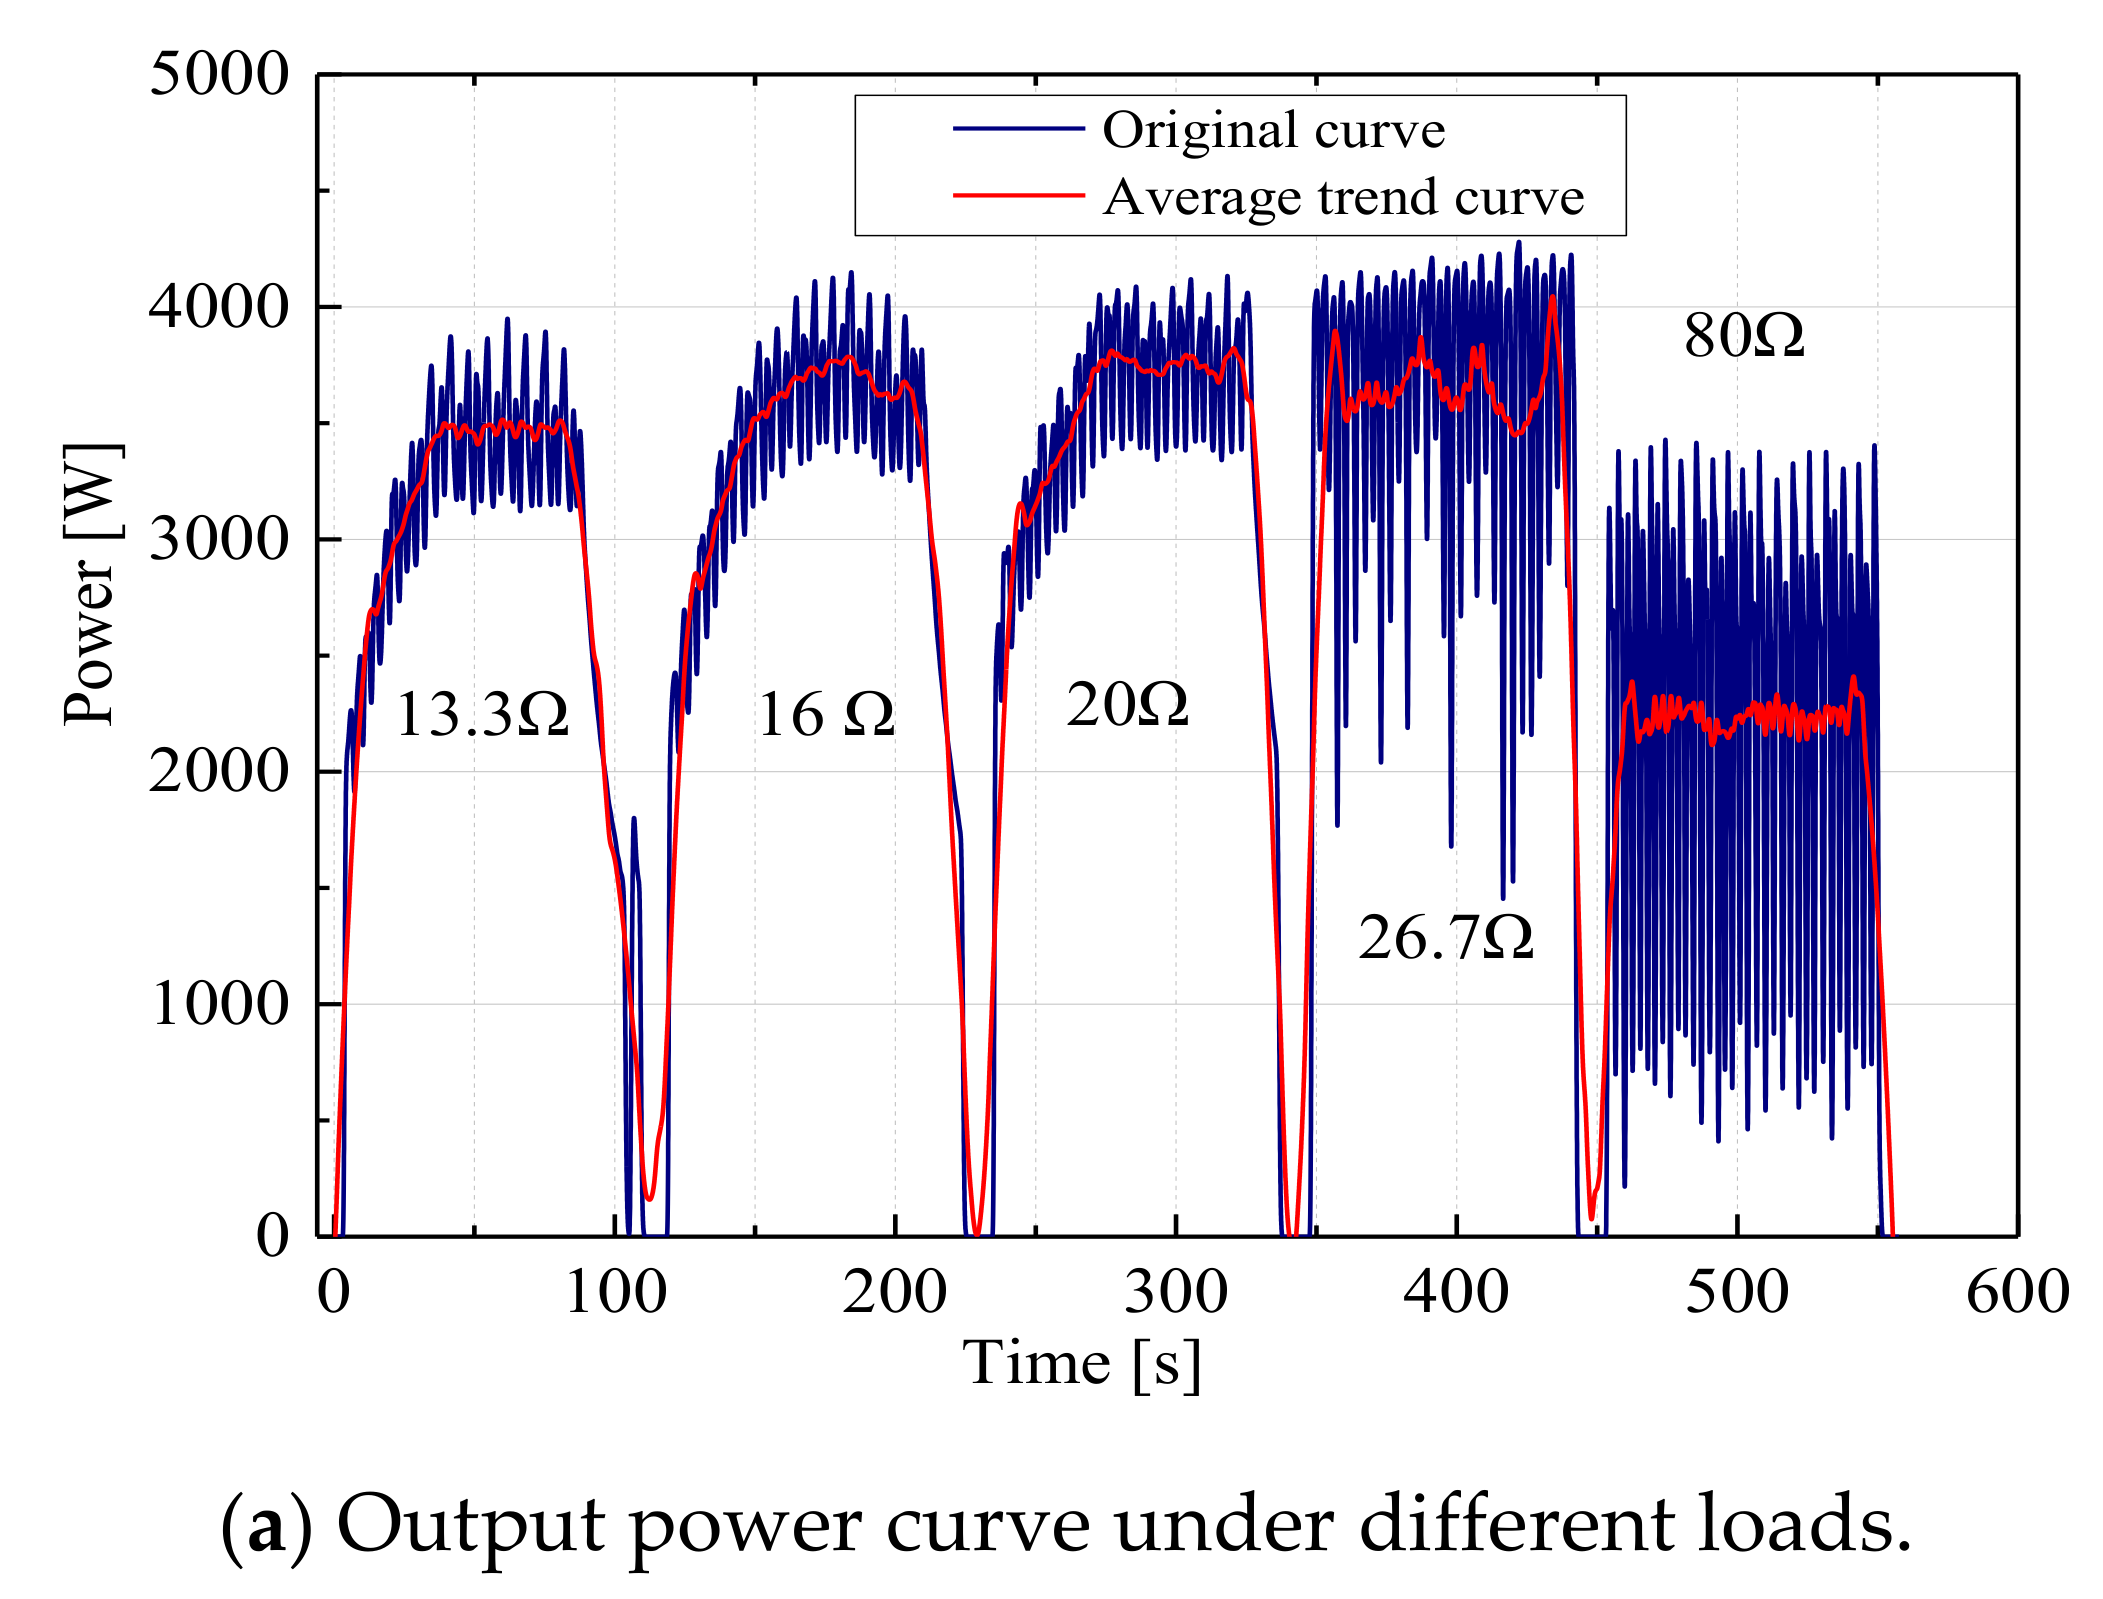
In practical applications, it is often used to balance the change of the output power of the generator by step input or by cutting off the resistance load. A load of this nature belongs to the linear variable element, which is beneficial to improve the stability of the whole-system, and the maximum power value of the variable load should be determined according to the maximum allowable power value of the generator. In the process of experimenting, a lot of resistance tubes with stable temperature characteristics and different resistance values are selected as the load, and the corresponding output parameter states under different load conditions are tested, respectively. The average value of the load is taken as the research object. The average value of the load resistance is set at 13.3 Ω, 16 Ω, 20 Ω, 26.7 Ω, and 80 Ω in turn. At this time, the accumulator pressure is 5.5 MPa, and the throttle valve is all opened. The average wave height is 25 cm, and the cycle is 6 s.
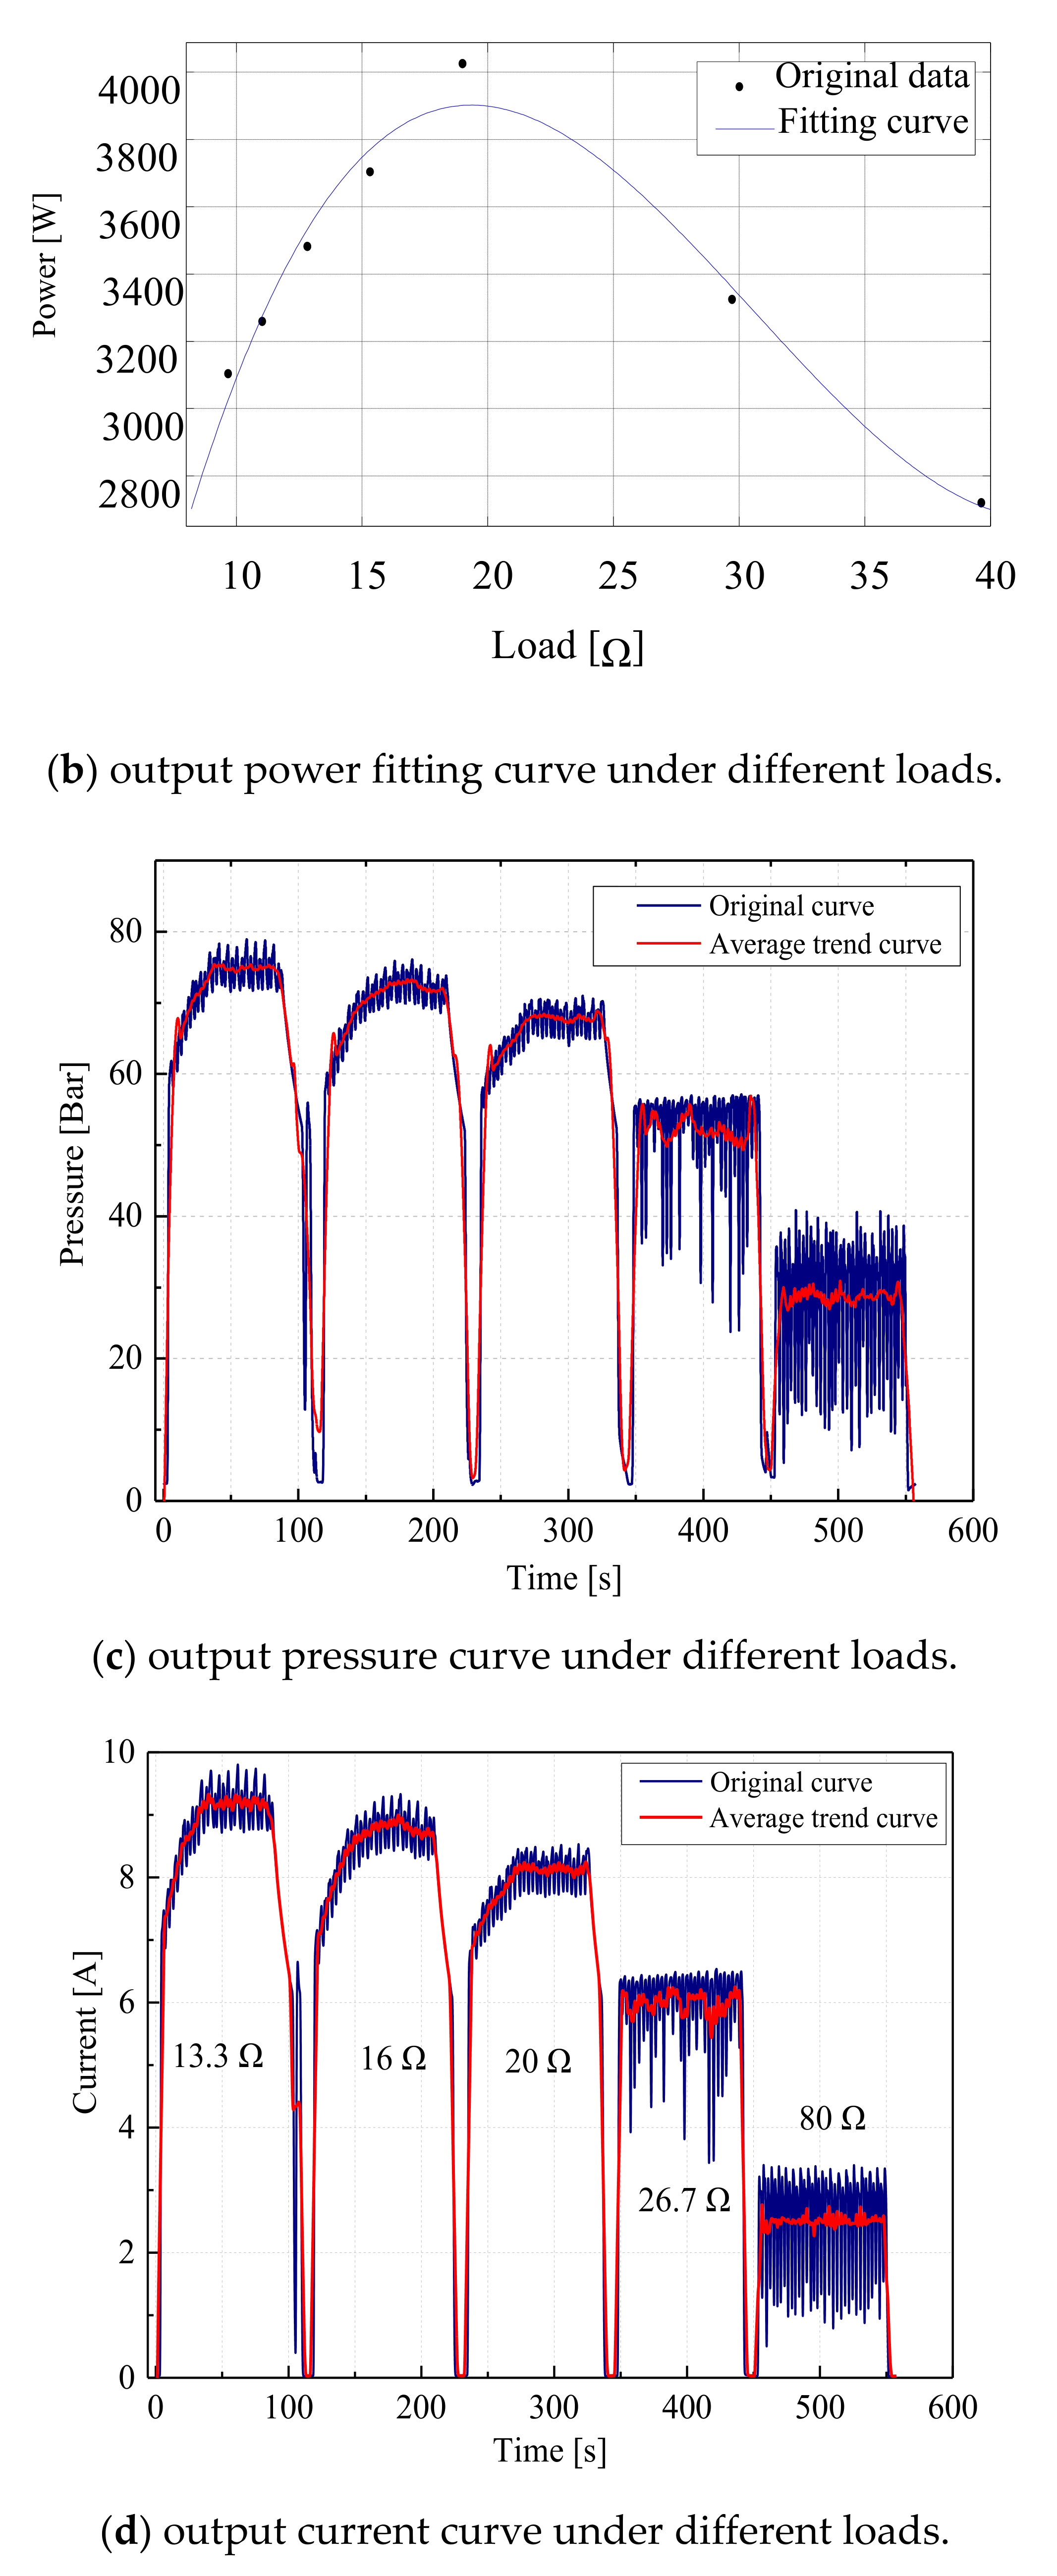
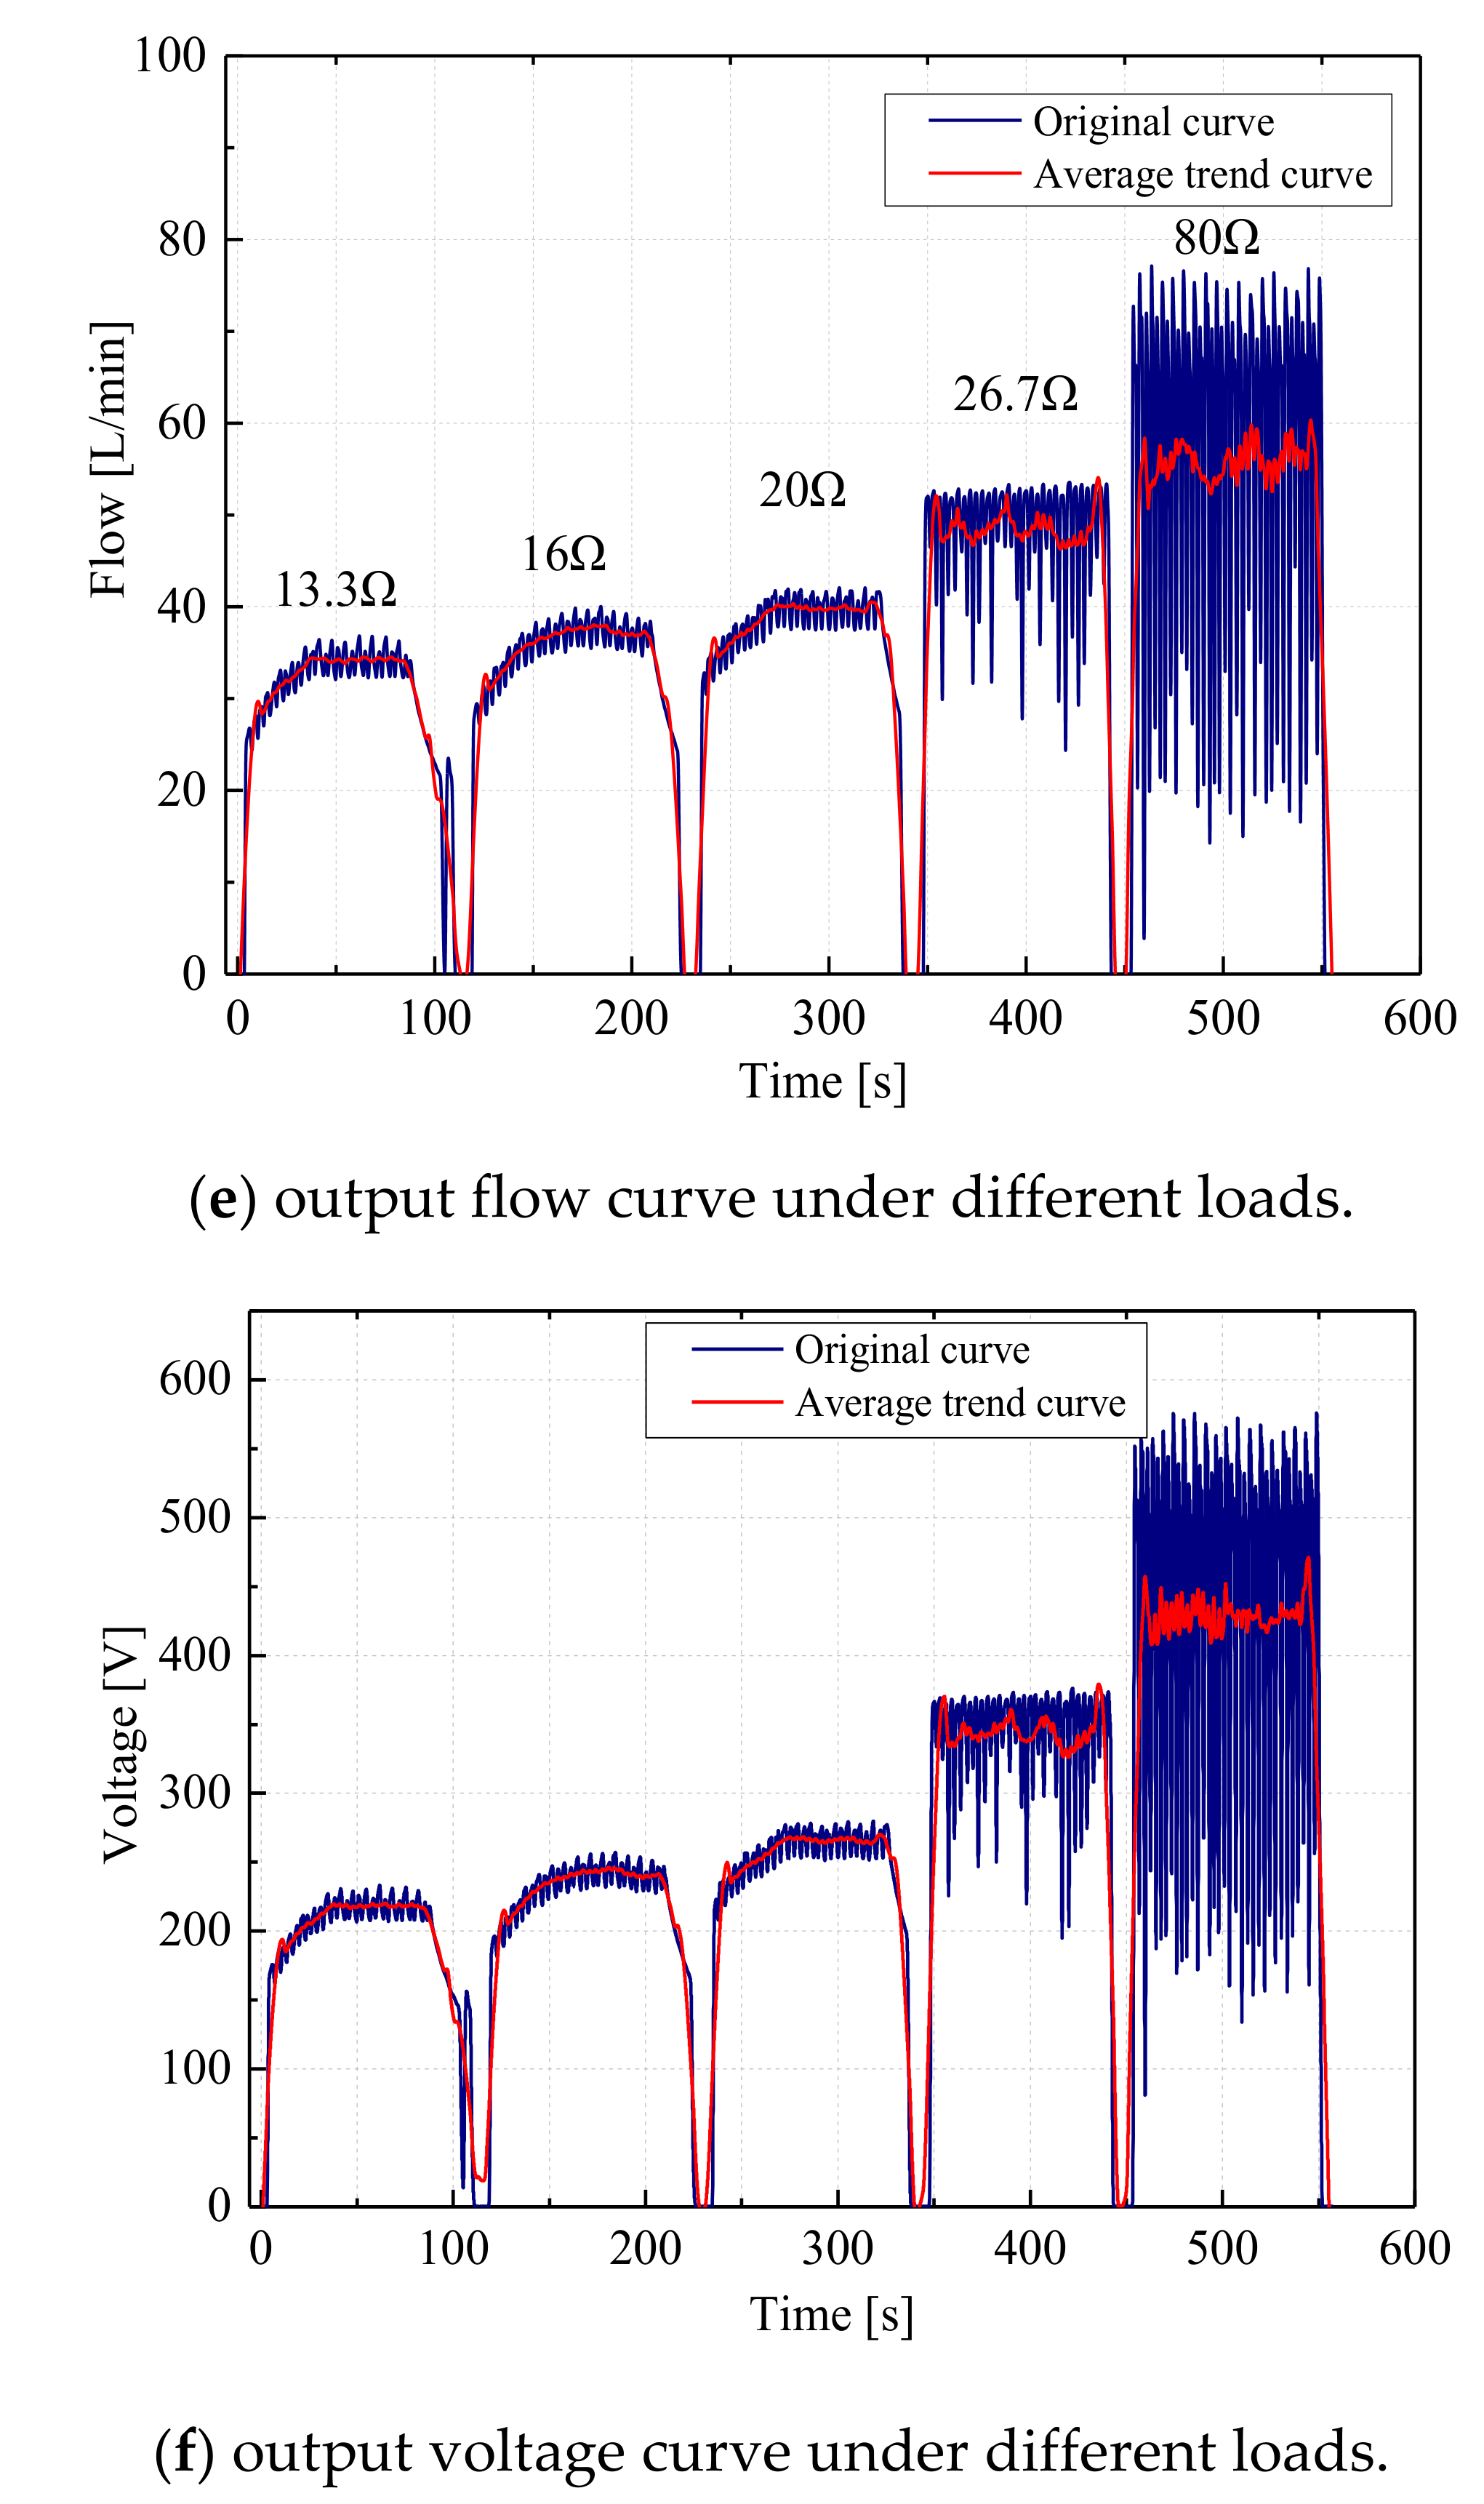
Under the same working conditions, the output power, pressure, flow, and other parameters of the system under different load conditions are recorded, respectively, and the output curve is drawn. The response state of the same output parameter under different loads is compared and analyzed. Among them, the horizontal axis is the time of separate experiments under different load conditions, and the vertical axis is the measured parameter value. The specific land experiment curve is shown in Figure 8.
Analysis of the curve in Figure 8 shows that with the decrease of load (increase of resistance), the output power of the system increases first and then decreases. When the resistance is large, the stable state of the output power of the system becomes worse. When the resistance is 80 Ω, the output of the system becomes unstable, the vibration range is about 25% of the average, and the power difference changes greatly. When the resistance is 26.7 Ω, the system output changes from instability to gradual stability. When the load is 20 Ω, the system output power is stable at about 3.9 kW.
The changed trend of the system output pressure and current is basically the same, showing a decreasing trend, and the changed trend of output flow and voltage is the same, showing a gradually increasing trend. At this time, the curve formula of output power fitted by the least square method is
The fitting curve is a cubic polynomial. According to the curve analysis, when the load is 80 Ω, the average output power of the system is 2.5 kW, the speed of the generator is fast, the maximum voltage is 600 V, and the stability is poor, which is not conducive to the follow-up power processing. When the load is 26.7 Ω, the output power of the system is 4.1 kW, the maximum voltage is 350 V, the output power is 3.8 kW, and the voltage stability is 280 V. The system output is relatively stable.
By analyzing the power curve under different load working conditions, it can be concluded that when the resistance is 26.7 Ω, the electric energy cannot continuously output and the oscillation is obvious. By adjusting the charging pressure of the accumulator or the opening of the throttle valve, the stable and continuous output can be achieved. Next, the influence of different regulating methods on the electric-energy output will be analyzed and the efficient and convenient regulation law will be summarized to achieve fast and stable regulation.
4.3. Throttle Valve Opening Adjustment
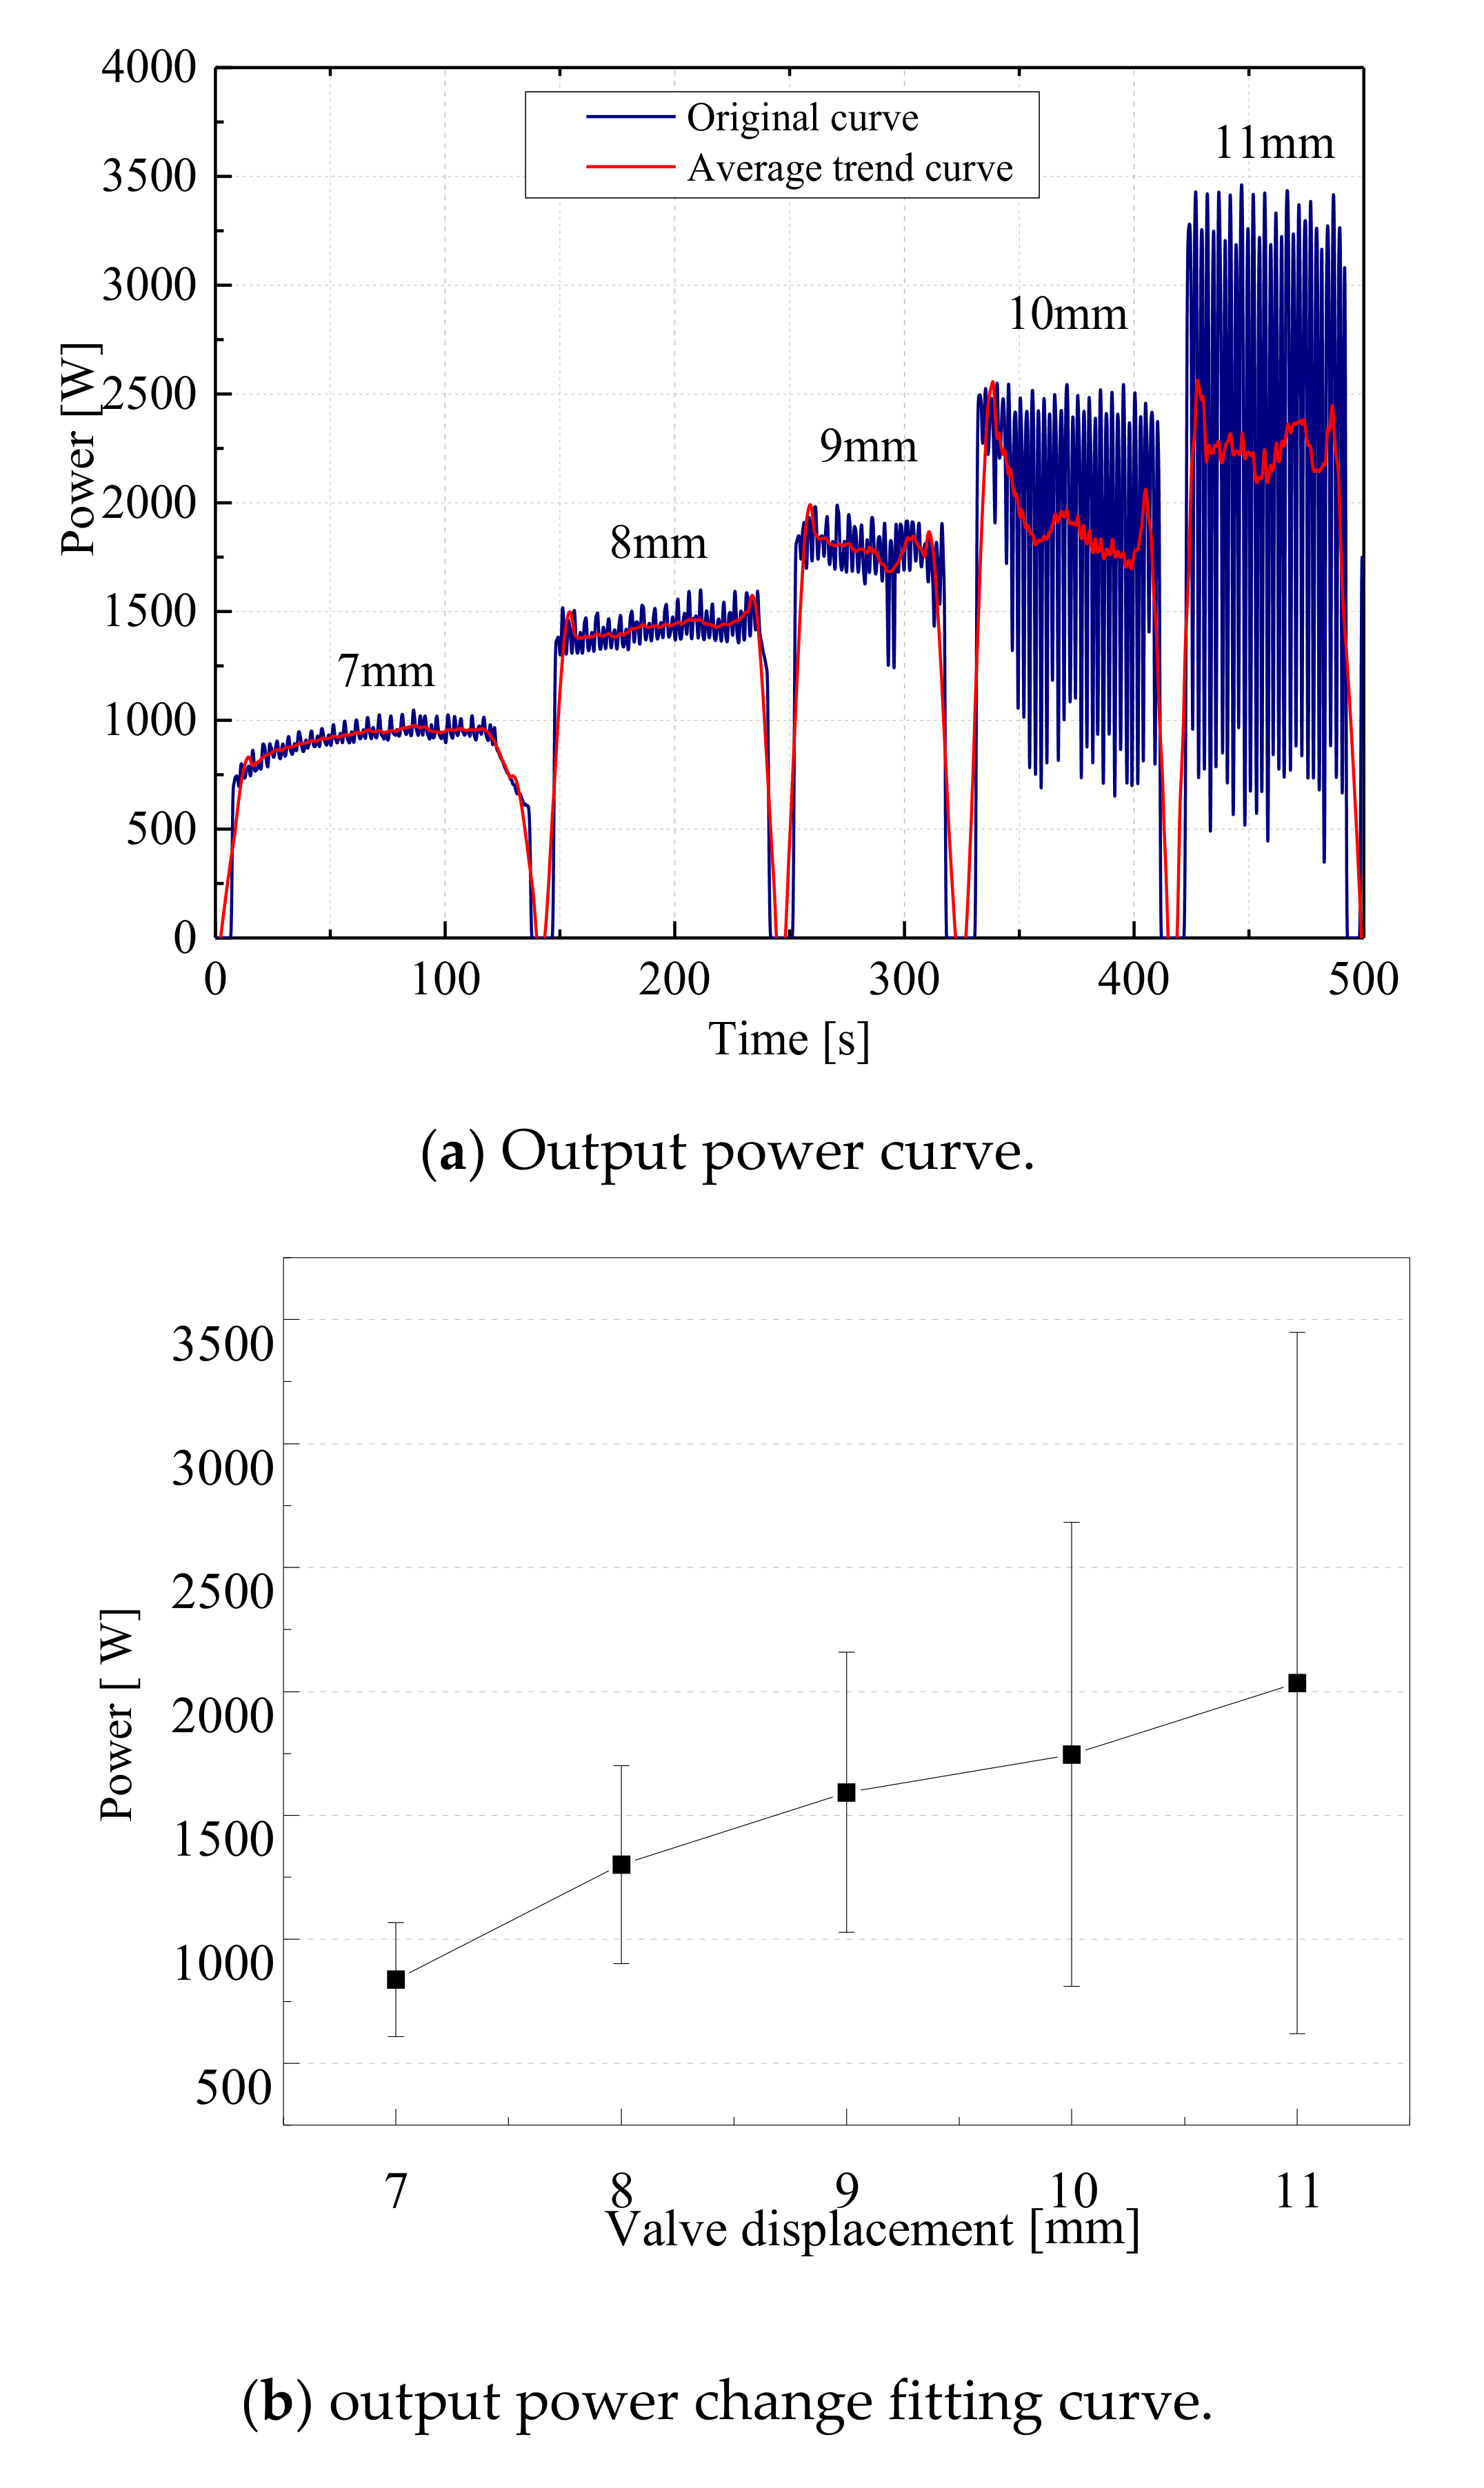
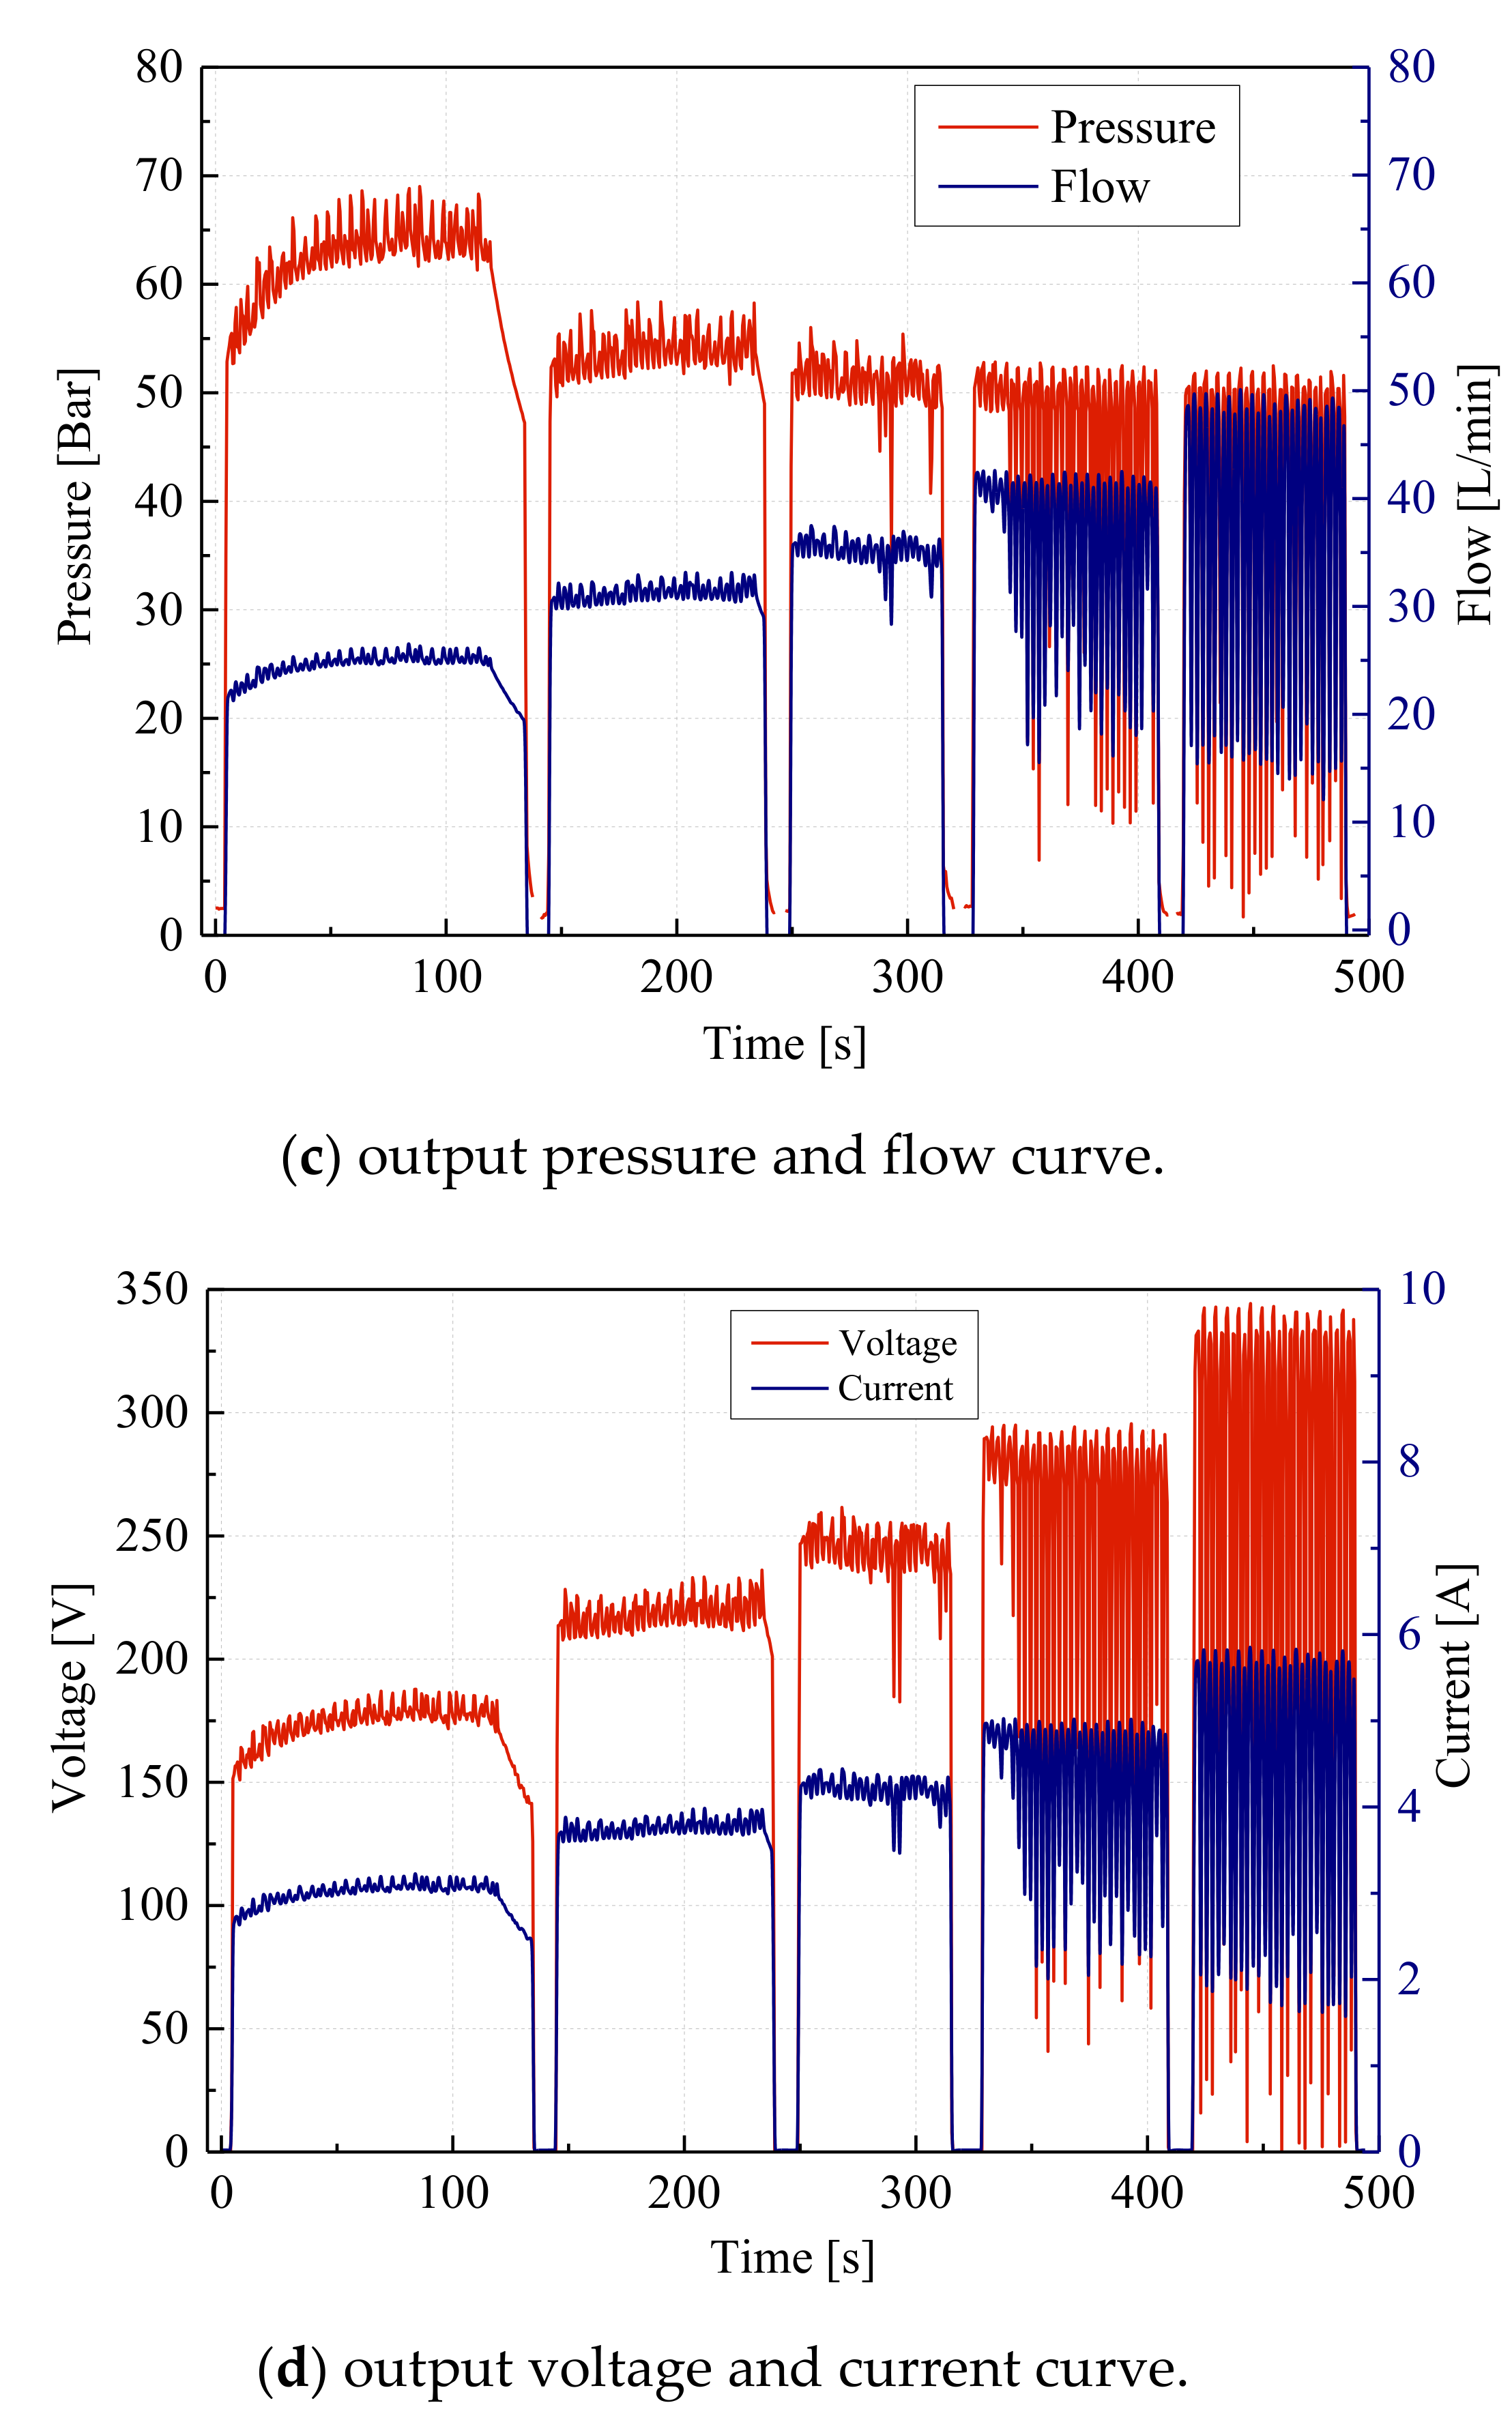
The charging pressure of the accumulator is 5.0 MPa, and the opening of the regulating throttle valve is 7 mm, 8 mm, 9 mm, 10 mm, and 11 mm, respectively. At this time, the output parameters are as shown in Figure 9.
According to the analysis of the curve in Figure 9, when the charging pressure of the accumulator is 5 MPa and the opening of the throttle valve is 9 mm, the average value of the stable output electric power of the system is 1.98 kW, and the output power is slightly lower than the average power of 4 MPa when the throttle valve is fully open by 2.1 kW. Because the regulation of the throttle valve will bring power loss, it is better to stabilize the electric-energy output by regulating the accumulator pressure at this time.
Therefore, it can be concluded that when the output of the power plant is unstable, the regulation order of the hydrolic-transmission system is as follows: first, adjusting the load, the control of the electrical components is easier to realize than the hydraulic components; second, adjusting the accumulator charging pressure, and realizing the system by selecting different inflatable pressure accumulator groups; and third, adjusting the throttle opening when the accumulator inflation pressure is adjusted to the appropriate value, so that the system works in a stable state.
5. Conclusions
The mathematical model of the hydrolic-transmission system is analyzed, and the composition and working principle of the land test-bed is introduced. The key technologies are analyzed and verified through the land test. The influence of the main component parameters on the power output is analyzed. The results show that the efficiency and stability of output electric energy can be effectively improved and the theoretical system can be further improved by adjusting the load, the charging pressure of the accumulator, and the opening of the throttle valve. By developing the influence of each parameter regulation, the regulation rules of parameters under different wave conditions are summarized and the output power curves under different loads are fitted. The adjustment sequence is determined as follows: According to the output power, first, adjust the external load. Then, adjust the accumulator pressure when it reaches the critical stability. Finally, adjust the throttle valve opening to provide a reference for fast adjustment.
Funding
The project was supported by the National Marine Bureau’s Marine Renewable Energy Special Fund Project “Marine Energy Independent Power System Demonstration Project” (Project No.: SDME2010GC02), the National Natural Science Foundation joint fund project “Study on the Mechanism and Key Technology of Efficiency Upgrading of Floating Hydraulic Wave Power Generation System” (Project No.: U17062305), National Key Research and Development Program Strategic International Scientific and Technological Innovation Cooperation Key Special Project “Long Term and Autonomous Operation and Maintenance of Intelligent Deep Sea Aquaculture Platform and Fisheries Resources Development Technology Cooperation” (Project No: 2016YFE0205700), and Doctoral Fund Research Project of Shandong Jianzhu University (No.: x18036z).
Conflicts of Interest
The author declares no conflict of interest.
References
- Falnes, J. A review of wave-energy extraction. Mar. Struct. 2007, 20, 185–201. [Google Scholar] [CrossRef]
- Wang, X.; Yang, Y. Effective energy storage from a hybridized electromagnetic-turboelectric nanogenerator. Nano Energy 2017, 32, 36–41. [Google Scholar] [CrossRef]
- Davies, P.A. Wave-powered desalination: Resource assessment and review of technology. Desalination 2005, 186, 97–109. [Google Scholar] [CrossRef]
- Pelc, R.; Fujita, R.M. Renewable energy from the ocean. Mar. Policy 2002, 26, 471–479. [Google Scholar] [CrossRef]
- Niu, S.; Liu, Y.; Wang, S.; Lin, L.; Zhou, Y.S.; Hu, Y.; Wang, Z.L. Theory of sliding-mode turboelectric nanogenerators. Adv. Mater. 2013, 25, 6184–6193. [Google Scholar] [CrossRef] [PubMed]
- Dincer, I.; Acar, C. A review on clean energy solutions for better sustainability. Int. J. Energy Res. 2015, 39, 585–606. [Google Scholar] [CrossRef]
- Babarit, A.; Guglielmi, M.; Clément, A.H. Declutching control of a wave energy converter. Ocean Eng. 2009, 36, 1015–1024. [Google Scholar] [CrossRef] [Green Version]
- Gaspar, J.F.; Calvário, M.; Kamarlouei, M.; Soares, C.G. Power take-off concept for wave energy converters based on oil-hydraulic transformer units. Renew. Energy 2016, 86, 1232–1246. [Google Scholar] [CrossRef]
- Yang, D. Research on Key Technology of Wave Energy Generator with Buoyancy Pendulum; Zhejiang University: Hangzhou, China, 2011. [Google Scholar]
- Ozkop, E.; Altas, I.H. Control, power and electrical components in wave energy conversion systems: A review of the technologies. Renew. Sustain. Energy Rev. 2017, 67, 106–115. [Google Scholar] [CrossRef]
- Falcão, A.F.O. Wave energy utilization: A review of the technologies. Renew. Sustain. Energy Rev. 2010, 14, 899–918. [Google Scholar] [CrossRef]
- Turkenburg, W.C. Energy and the Challenge of Sustainability: The World Energy Assessment; United Nations Development Programme: New York, NY, USA, 2004. [Google Scholar]
- Clément, A.; McCullen, P.; Falcão, A.; Fiorentino, A.; Gardner, F.; Hammarlund, K.; Lemonis, G.; Lewis, T.; Nielsen, K.; Petroncini, S.; et al. Wave energy in Europe: Current status and perspectives. Renew. Sustain. Energy Rev. 2002, 6, 405–431. [Google Scholar] [CrossRef]
- Henderson, R. Design, simulation, and testing of a novel hydraulic power take-off system for the Pelamis wave energy converter. Renew. Energy 2006, 31, 271–283. [Google Scholar] [CrossRef]
- Lin, Z. Research on Characteristics of Mechanical Frequency Increasing Wave Piezoelectric Power Generation Device; Tsinghua University: Beijing, China, 2015. [Google Scholar]
- Garnaud, X.; Mei, C. Wave-power extraction by a compact array of buoys. J. Fluid Mech. 2009, 635, 389–413. [Google Scholar] [CrossRef] [Green Version]
- Drobyshevski, Y. Hydrodynamic coefficients of a floating, truncated vertical cylinder in shallow water. Ocean Eng. 2004, 31, 269–304. [Google Scholar] [CrossRef]
- Price, A.; Dent, C.; Wallace, A. On the capture width of wave energy converters. Appl. Ocean Res. 2009, 31, 251–259. [Google Scholar] [CrossRef] [Green Version]
Figure 1.
A wave energy power-generation device. 1. Float 2. Buoy 3. Damping plate 4. Hydraulic cylinder 5. Regulating valves 6. Accumulator 7. Motor 8. Generator.
Figure 1.
A wave energy power-generation device. 1. Float 2. Buoy 3. Damping plate 4. Hydraulic cylinder 5. Regulating valves 6. Accumulator 7. Motor 8. Generator.

Figure 2.
Working principle of the hydrolic-transmission system. 1. One-way valve, 2. hydraulic cylinder, 3. accumulator, 4. pressure sensor, 5. relief valve, 6. flow sensor, 7. electromagnetic valve, 8. flow-regulating valve, 9. hydraulic motor, and 10. generator.
Figure 2.
Working principle of the hydrolic-transmission system. 1. One-way valve, 2. hydraulic cylinder, 3. accumulator, 4. pressure sensor, 5. relief valve, 6. flow sensor, 7. electromagnetic valve, 8. flow-regulating valve, 9. hydraulic motor, and 10. generator.

Figure 3.
Mathematical model of the hydrolic-transmission system.

Figure 4.
Mathematical model of generator load.

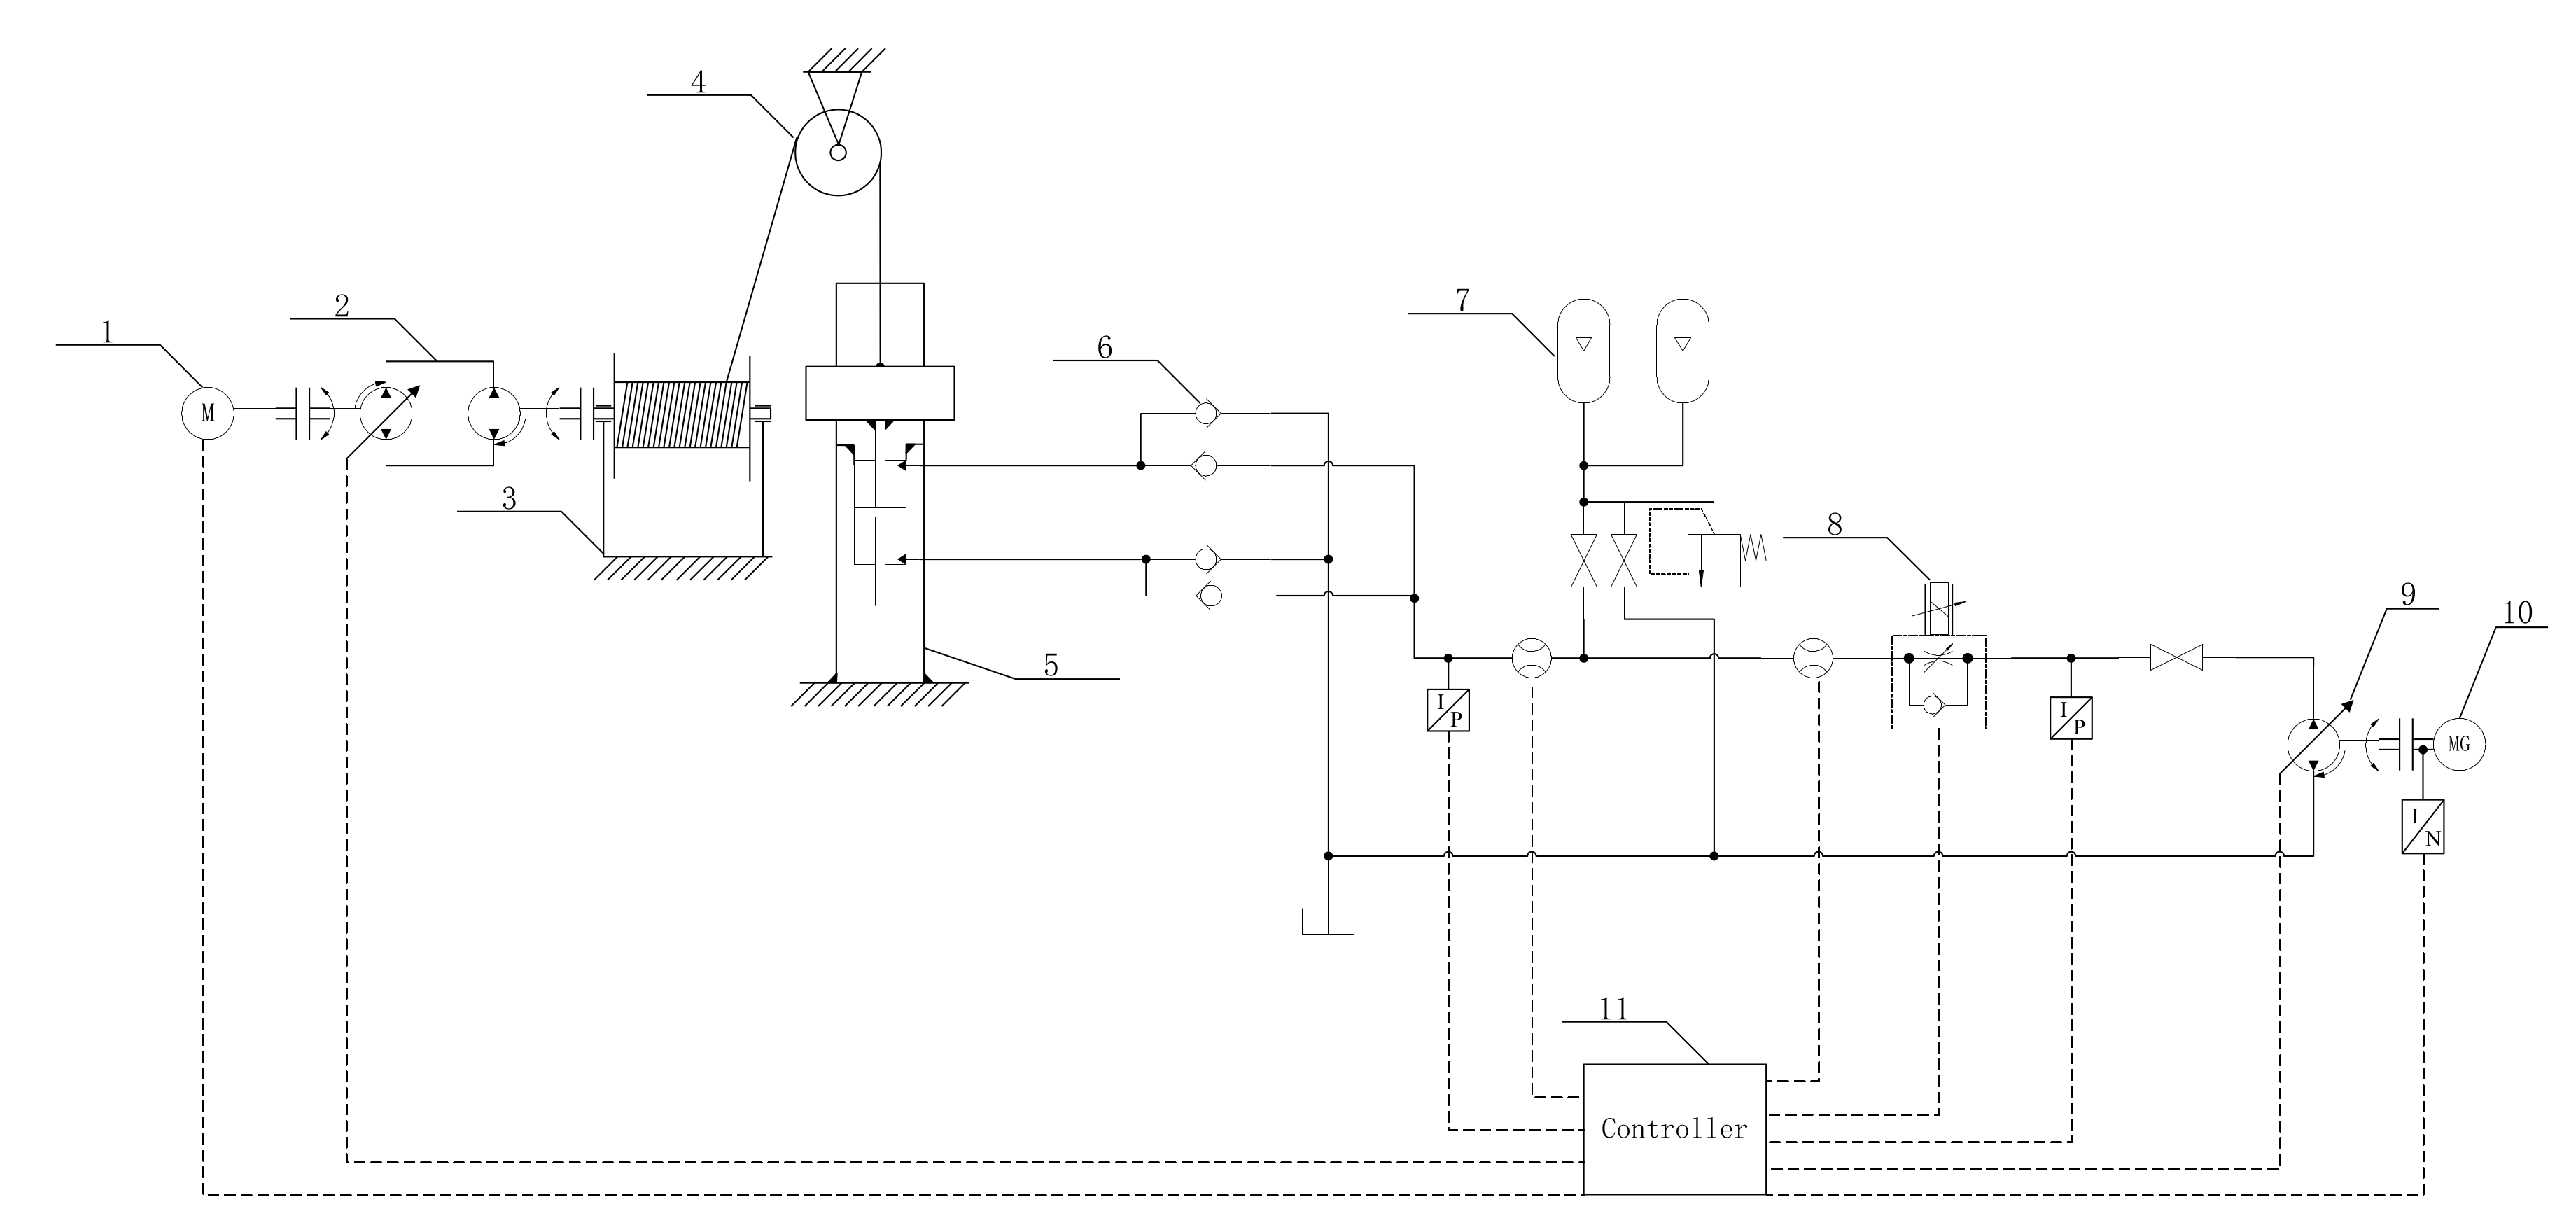
Figure 5.
Schematic diagram of the wave-power-generation device. 1. Electric motor, 2. combination design of the pumps, 3. windlass, 4. pulley systems, 5. buoy, 6. check valve, 7. accumulator, 8. electro-hydraulic proportional control valve, 9. variable displacement motor, and 10. electric generator.

Figure 6.
Experimental apparatus.

Figure 7.
Output power curve under a different wave period and amplitude.

Figure 8.
Comparison curve of the output electric-energy parameters under different load conditions.
Figure 8.
Comparison curve of the output electric-energy parameters under different load conditions.


Figure 9.
Output parameter curve under a different throttle valve opening.


© 2020 by the author. Licensee MDPI, Basel, Switzerland. This article is an open access article distributed under the terms and conditions of the Creative Commons Attribution (CC BY) license (http://creativecommons.org/licenses/by/4.0/).
Share and Cite
MDPI and ACS Style
Zhang, W. Parameter Adjustment Strategy and Experimental Development of Hydraulic System for Wave Energy Power Generation. Symmetry 2020, 12, 711. https://0-doi-org.brum.beds.ac.uk/10.3390/sym12050711
AMA Style
Zhang W. Parameter Adjustment Strategy and Experimental Development of Hydraulic System for Wave Energy Power Generation. Symmetry. 2020; 12(5):711. https://0-doi-org.brum.beds.ac.uk/10.3390/sym12050711
Chicago/Turabian StyleZhang, Wei. 2020. "Parameter Adjustment Strategy and Experimental Development of Hydraulic System for Wave Energy Power Generation" Symmetry 12, no. 5: 711. https://0-doi-org.brum.beds.ac.uk/10.3390/sym12050711
Note that from the first issue of 2016, this journal uses article numbers instead of page numbers. See further details here.