Development and Research on the Vertical Center Diaphragm Method Applied in Shallow Tunnel Construction


1
School of Civil Engineering, Beijing Jiaotong University, Beijing 100044, China
2
Tunneling and Underground Engineering Research Center of Ministry of Education, Beijing 100044, China
*
Author to whom correspondence should be addressed.
Symmetry 2020, 12(5), 855; https://0-doi-org.brum.beds.ac.uk/10.3390/sym12050855
Submission received: 27 April 2020
/
Revised: 19 May 2020
/
Accepted: 21 May 2020
/
Published: 22 May 2020
Abstract
:As a common method applied in the construction of tunnels with Grade IV and Grade V surrounding rock, the center diaphragm (CD) method has the advantage of resisting the inward horizontal convergence of the tunnel. However, due to the small lateral earth pressure of the shallow tunnel, the curved center diaphragm would have an unstable stress state and cannot provide sufficient support to the surrounding rock. Based on the CD method, this study presents a vertical center diaphragm (VCD) method with an axisymmetric structure. The application condition of the VCD method relies on the comparison of the surface settlement and tunnel deformation with the two methods in different surrounding rock grades and buried depths by using a three-dimensional finite-difference code. Based on the Shenzhen Eastern Transit Expressway Connection Line Tunnel, which has six lanes of double lines, the deformation regularities and mechanical characteristics of the VCD method, including the surface settlement, tunnel deformation, internal force of the center diaphragm, surrounding rock pressure, and steel arch stress, are investigated by numerical calculations and a field comparative test. The results obtained in this study provide several suggestions for constructing shallow tunnels. Furthermore, the construction efficiency and economy of the VCD method are evaluated.
1. Introduction
With the fast development of the economy and the continuous improvement of synthetic national power, the infrastructure construction space is vigorously expanded in China. At present, the number of motor vehicles in the first-tier and second-tier cities is continuously increasing, which brings enormous pressure into the existing road network. The construction of municipal road tunnels and urban highway tunnels is an effective way to relieve traffic pressure [1,2,3]. Compared with subway tunnels, urban highway tunnels have a more extensive section and flatter shape, which is a challenge for construction and settlement control. The shallow mining method has significant economic and social benefits in the construction of urban highway tunnels [4], mainly including the bench method, center diaphragm (CD) method, center cross diaphragm (CRD) method, and double side-wall heading method.
Appropriate techniques applied in tunnel design and construction are critical to the successful completion of a project [5]. The excavation method has a strong influence on the surface settlement, crown settlement, construction cost, and construction period [6]. In recent decades, the excavation methods of tunnels have been compared and selected based on practical engineering examples [7,8,9,10,11,12,13,14]. The results from the investigations indicated that the CD method is mainly suitable for underground engineering constructions with poor stratum and strict settlement requirements. Based on the three-dimensional elastic–plastic finite element method, Hou et al. suggested that excavation cycle footage, excavation sequence, block size, and other parameters would affect the deformation and stress of the tunnel support [15]. The above researches play a guiding role in underground engineering constructions, but lack improvement or innovation of the CD method.
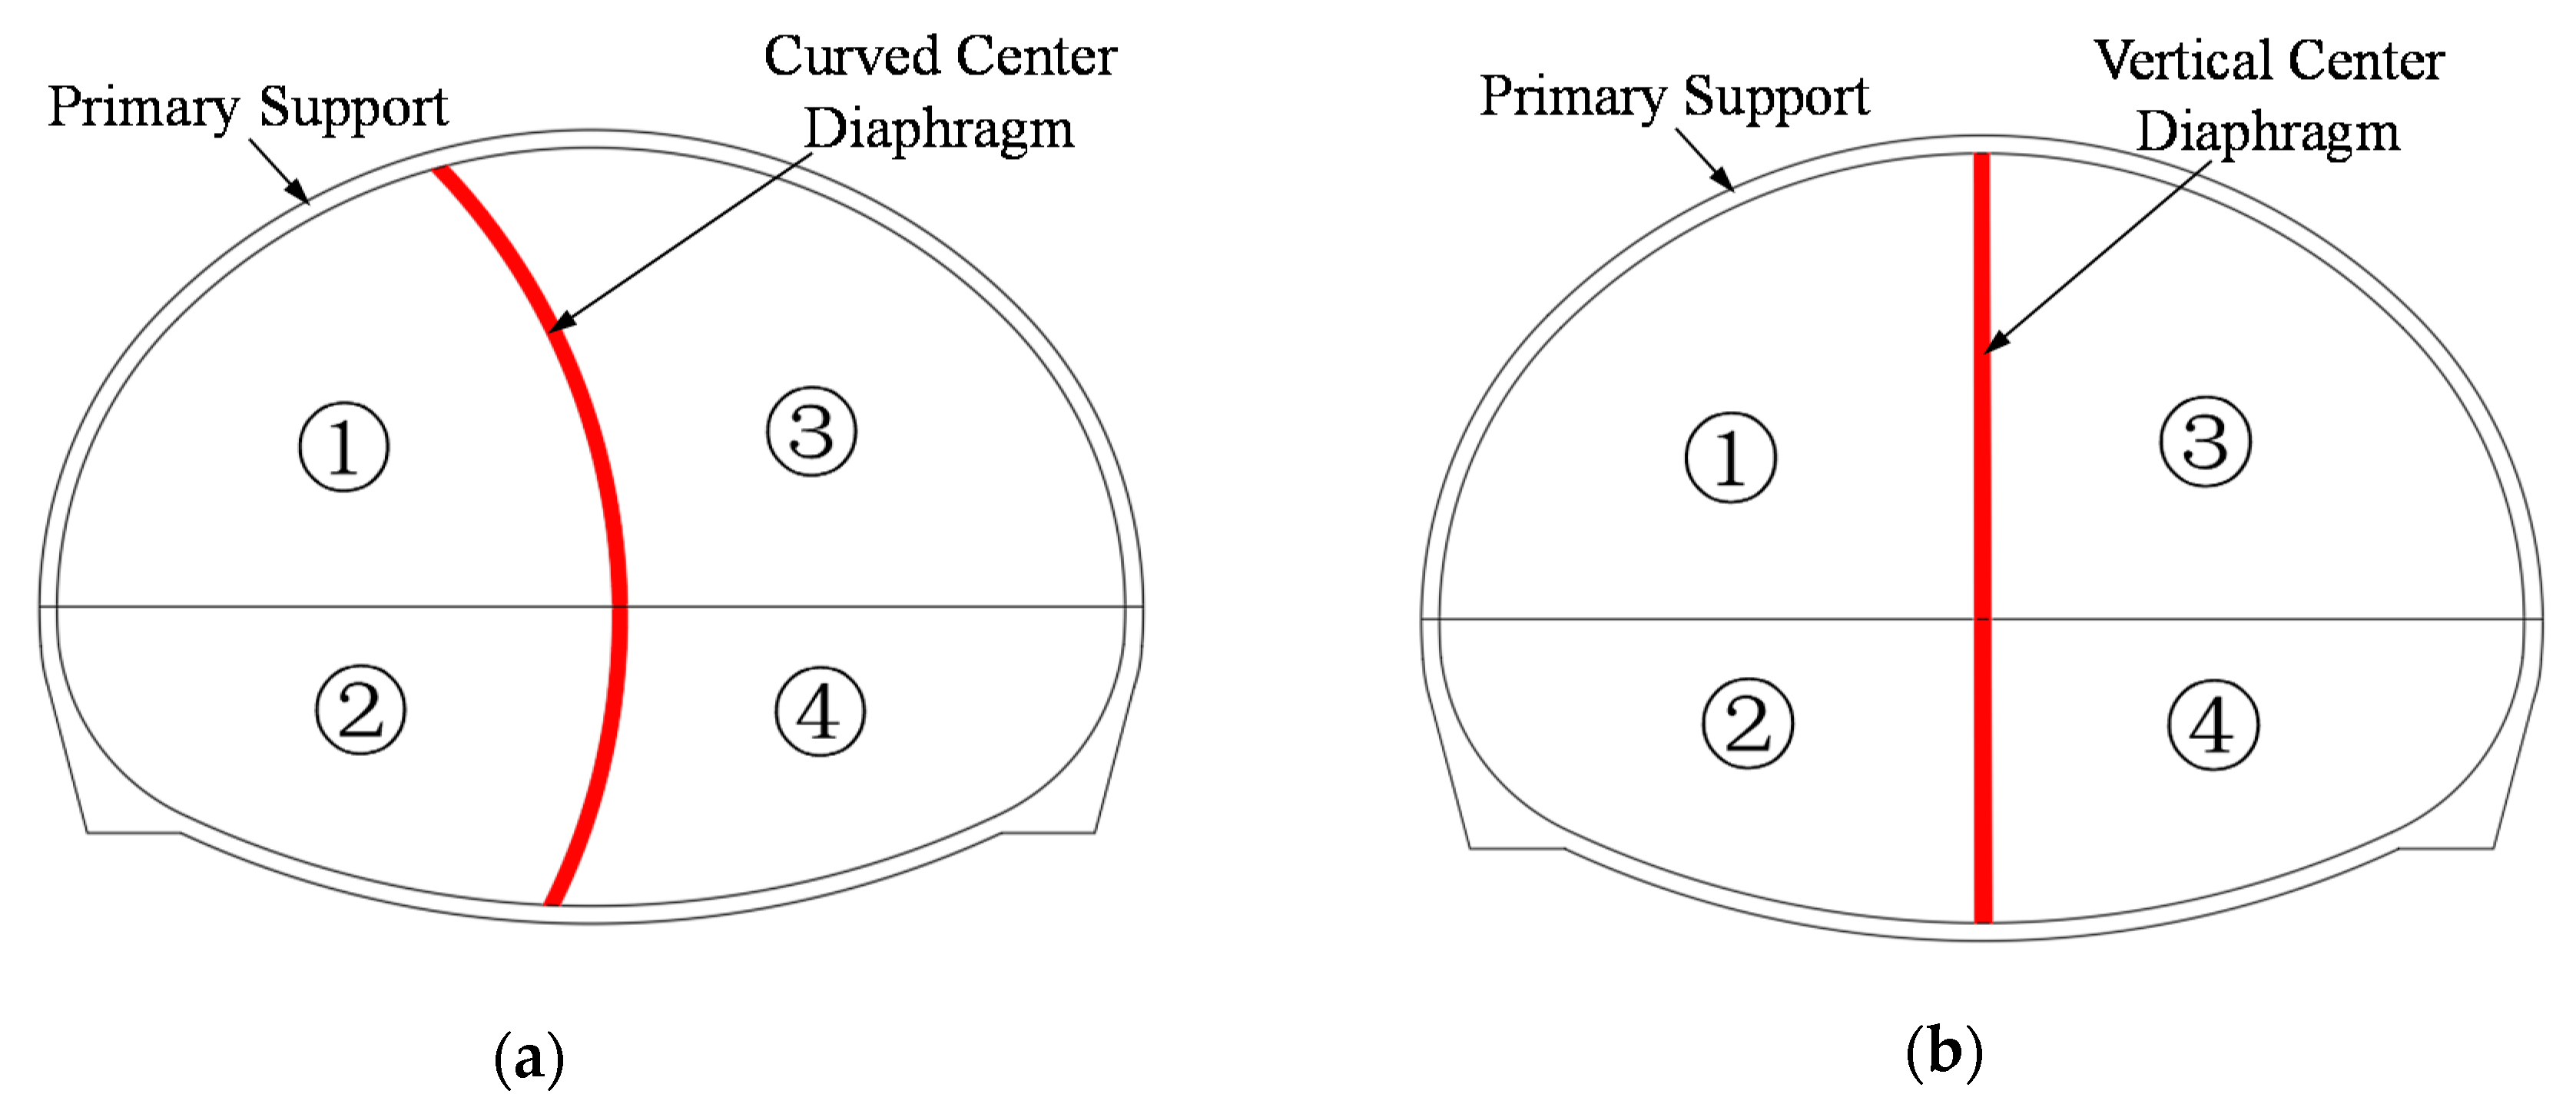
In the CD method, the tunnel is divided into two right and left sections by a curved center diaphragm [7]. In deep tunnels, the curved central diaphragm can form a ring structure with the primary support of the first excavation part, which can not only transfer the vertical earth pressure from the arch crown, but also resist the lateral earth pressure from the side walls [16]. However, due to the small lateral earth pressure of shallow tunnels, the curved center diaphragm would have an unstable stress state and cannot provide sufficient support to the arch crown [17,18]. Presently, there is no research giving effectual measures to cover the disadvantages mentioned.
This study presents a new method applied in shallow tunnel engineering, called the vertical center diaphragm (VCD) method, which alters the shape of the center diaphragm based on the CD method. Based on the Shenzhen Eastern Transit Expressway Connection Line Tunnel, the VCD method is investigated by numerical calculations and a field test, and is compared with the traditional CD method. Meanwhile, the application conditions of the VCD method are suggested, the application effect, construction efficiency, and economy are evaluated, and several construction suggestions are given. The research results can provide useful guidance for similar projects.
2. Project Overview
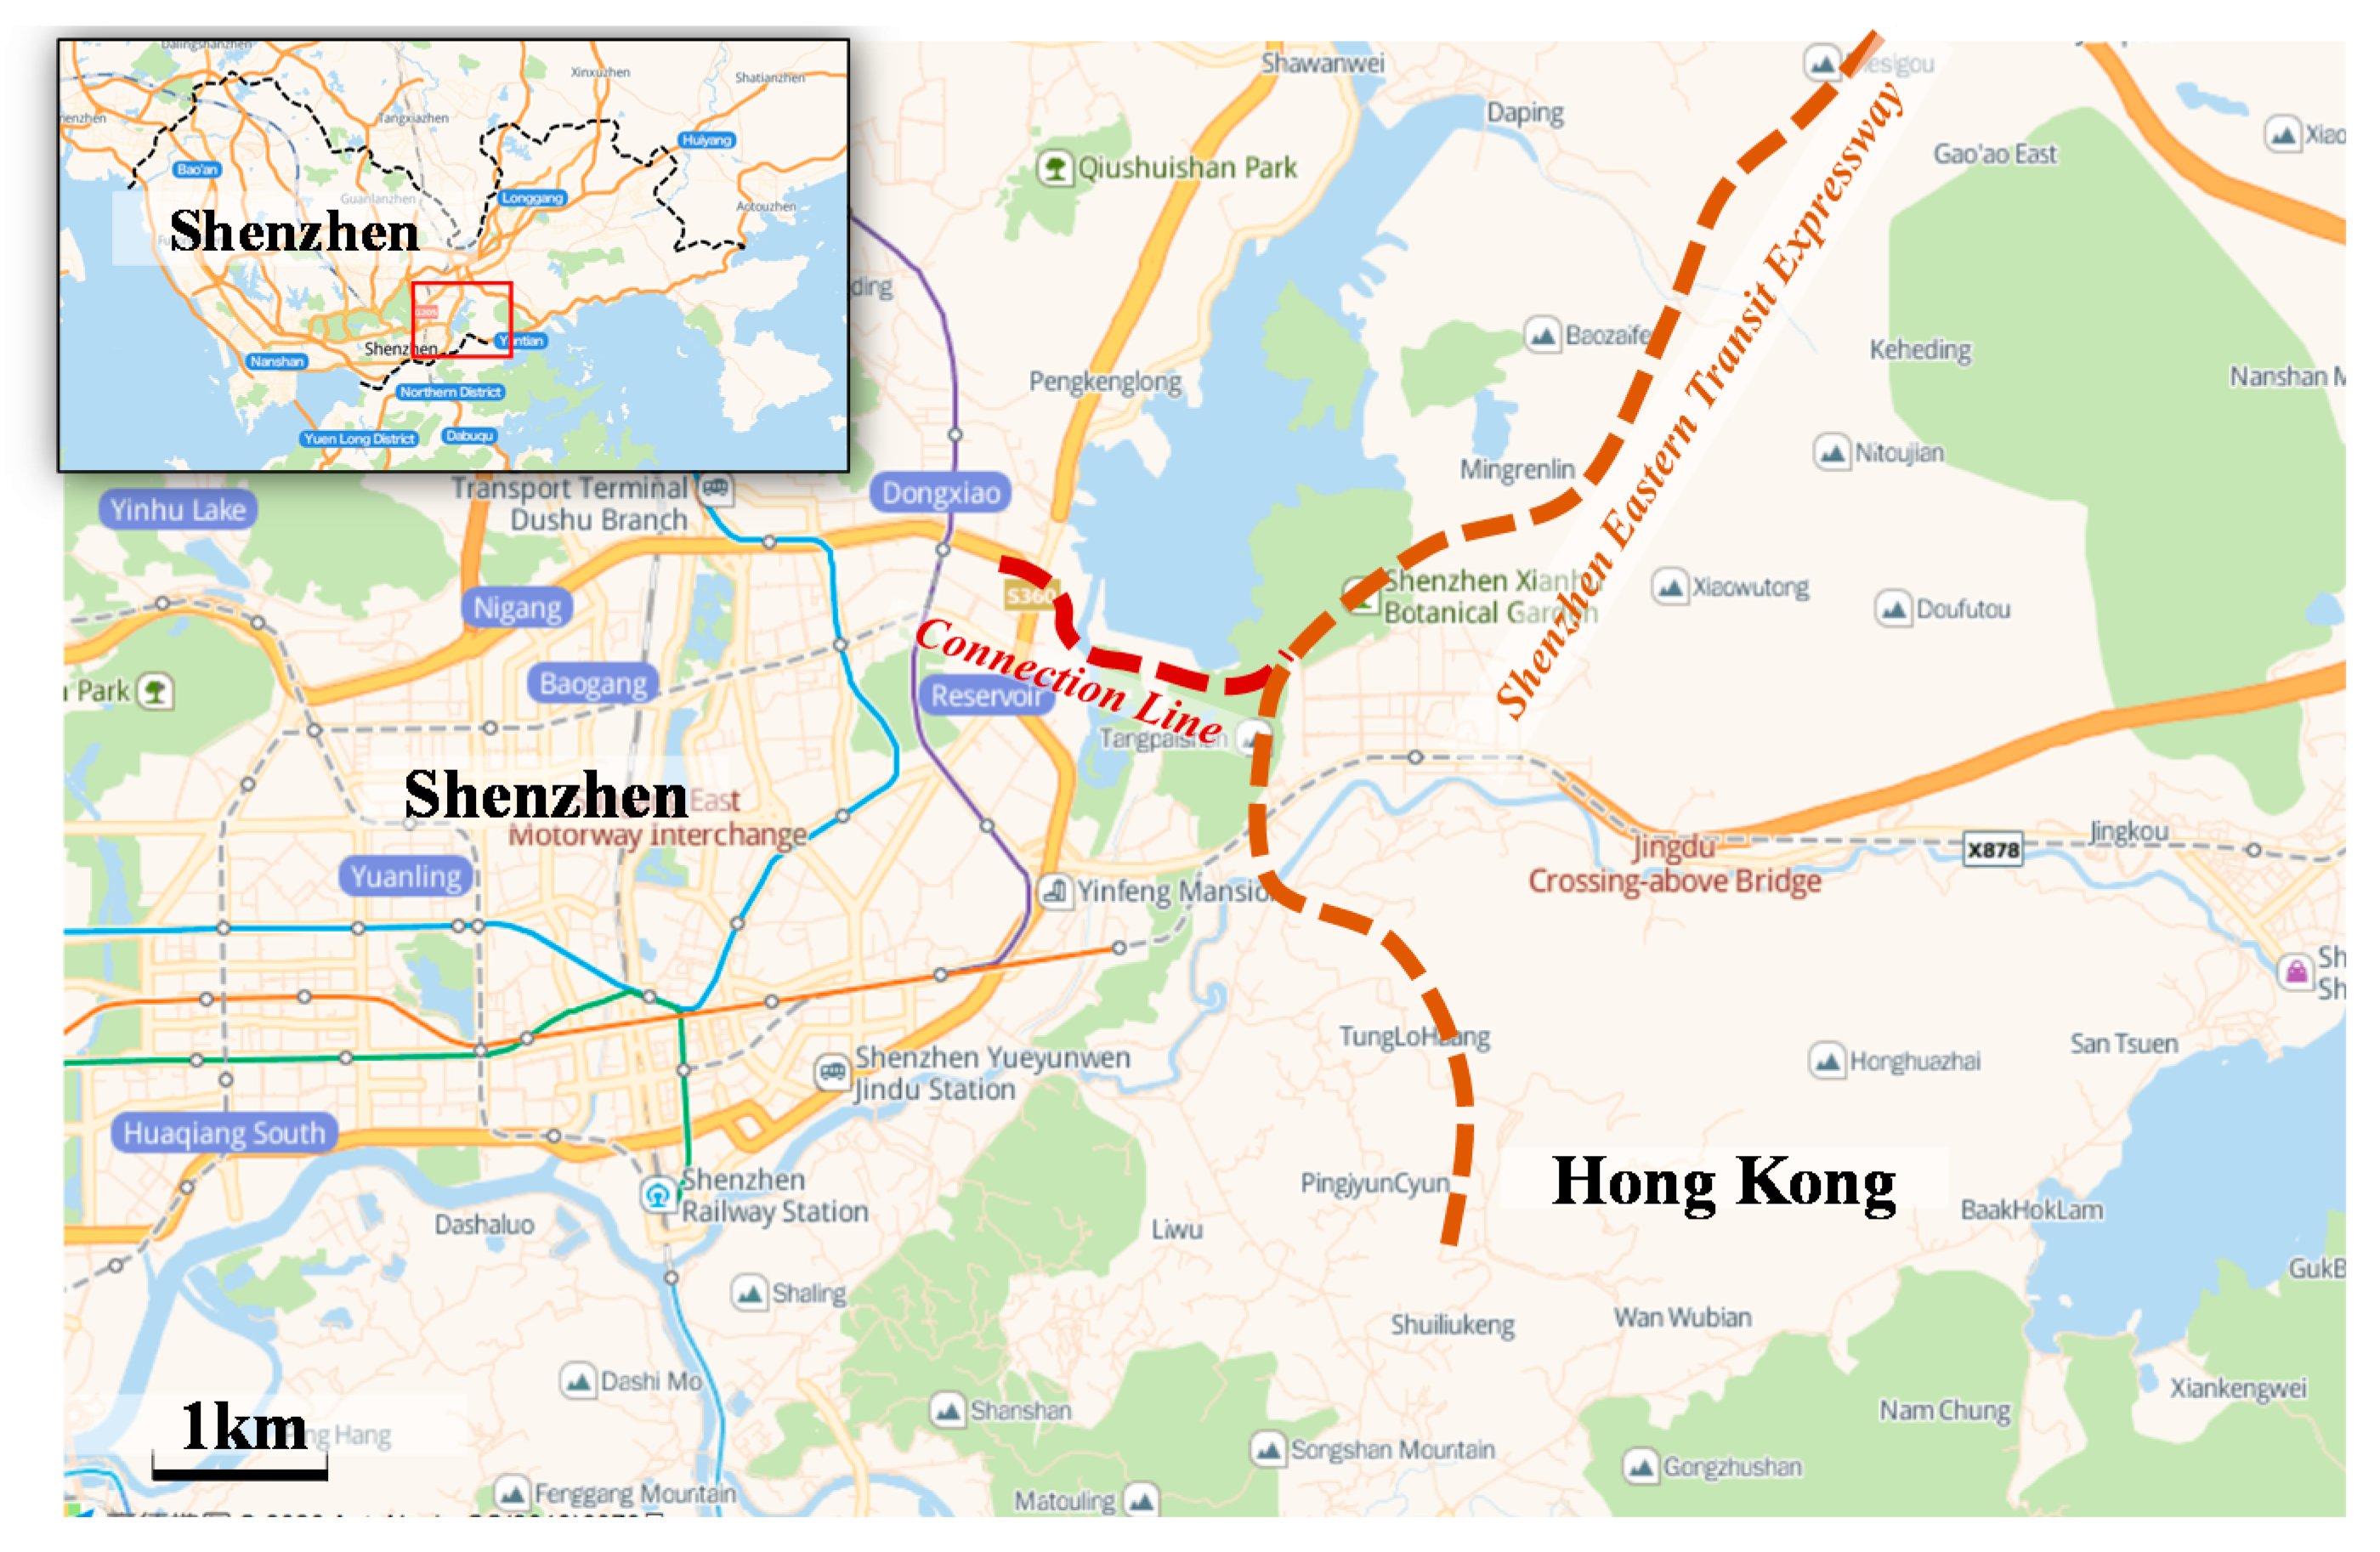
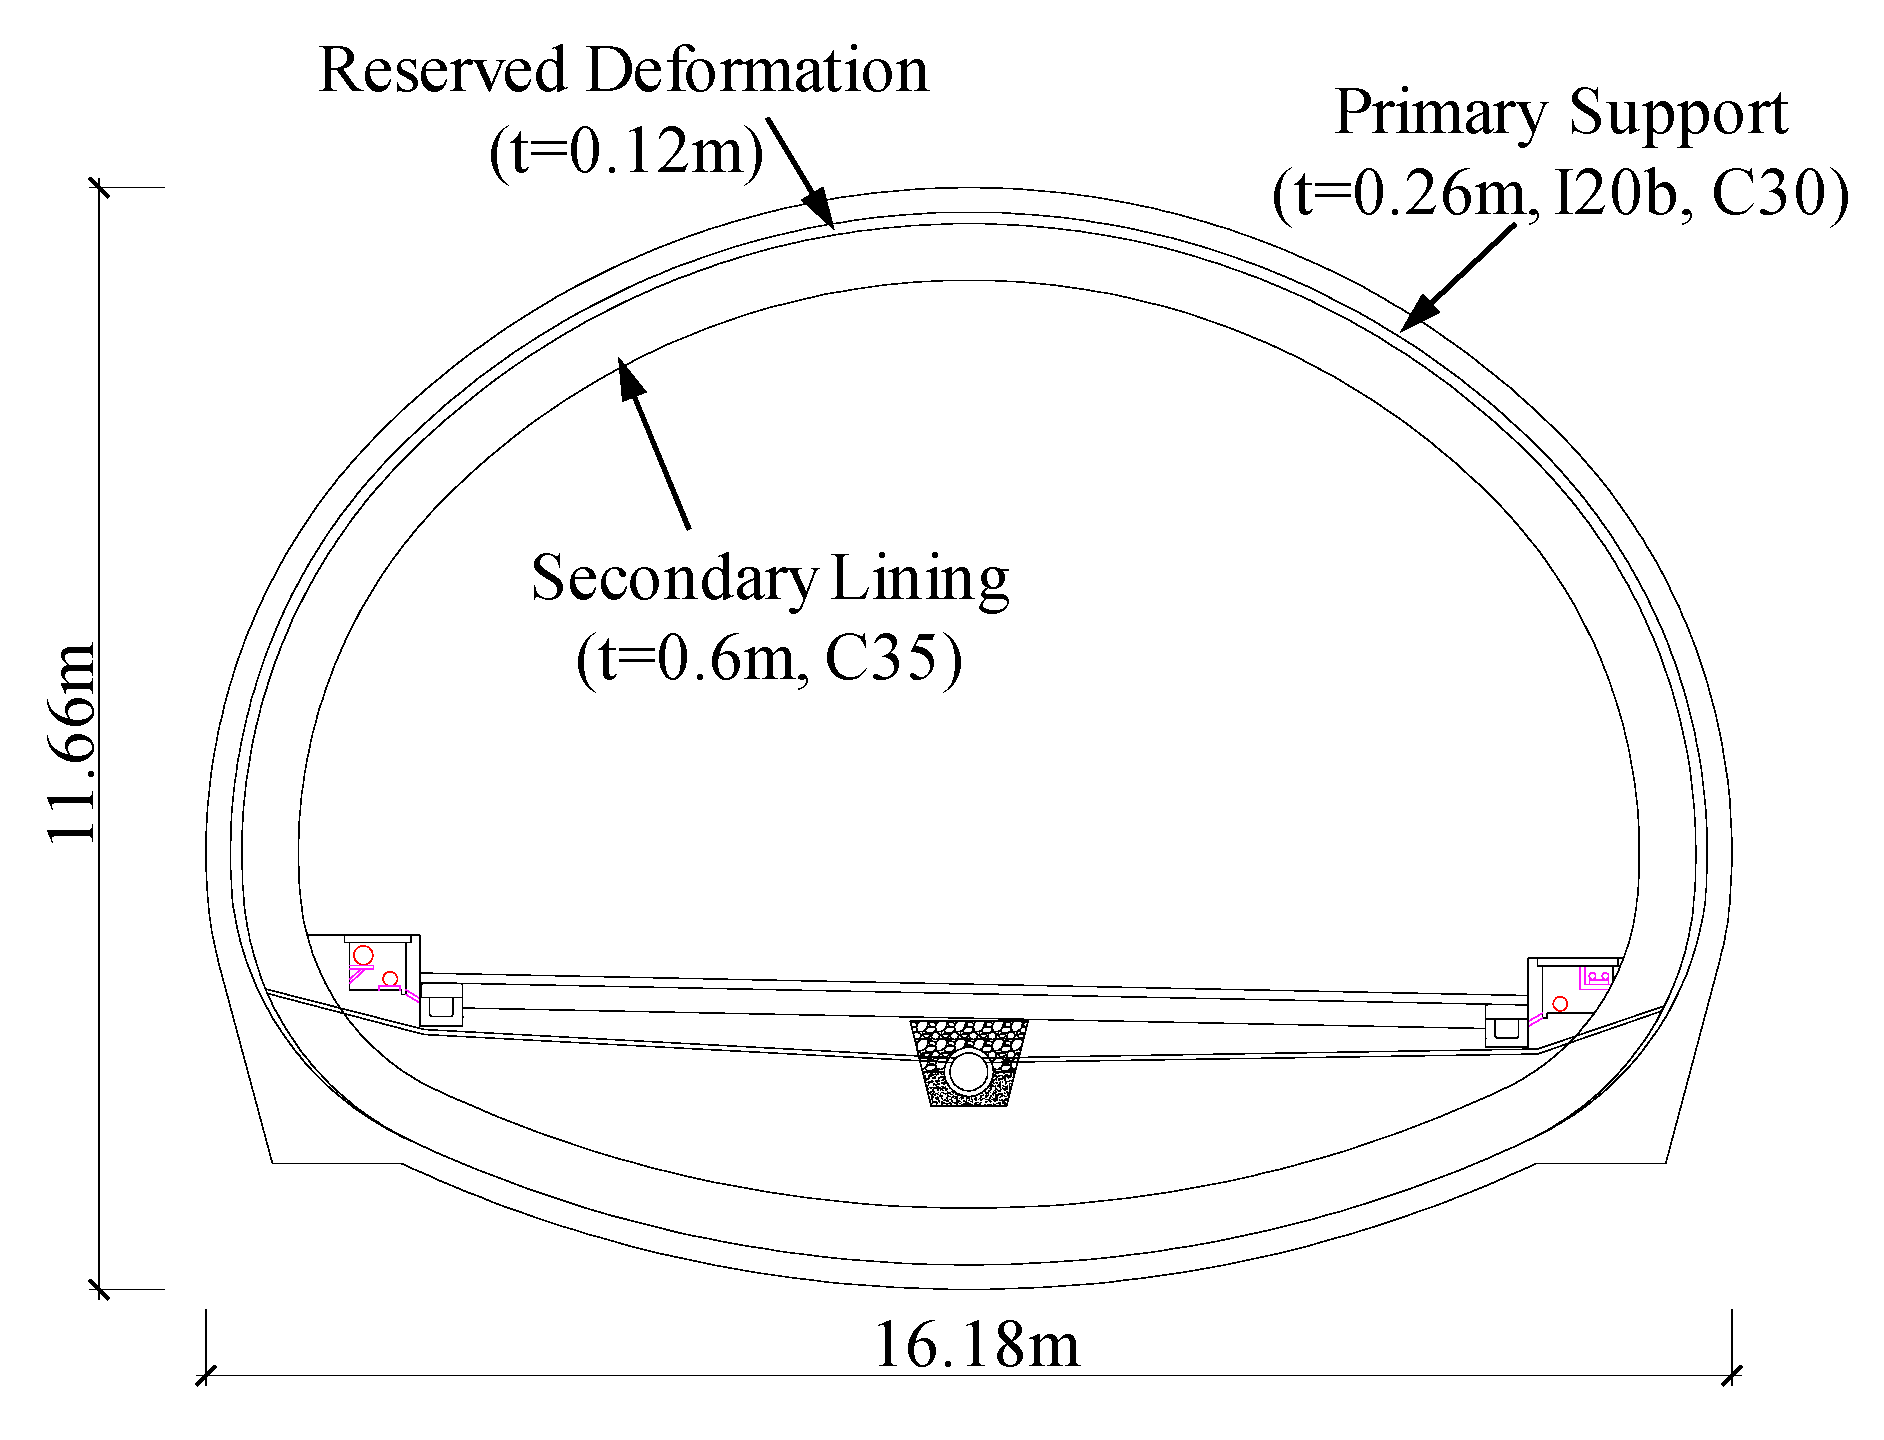
The Shenzhen Eastern Transit Expressway Connection Line Tunnel is a crucial project in Guangdong Province, China [19,20]. Its west end is connected to the Aiguo Road interchange, and the east end is connected to the main line tunnel (Figure 1). The project is designed to be a two-way six-lane road tunnel with a total length of 3113 m, in which the southern line is 1681 m long, and the northern line is 1432 m long. The buried depth is 10–30 m, whereas the excavation section is 16.18 × 11.66 m (width × height). Furthermore, as shown in Figure 2, the section of the tunnel is symmetrical. The Connection Line passes through carboniferous stratified metamorphic quartz sandstone with developed joint fissures and abundant underground water, whereas the surrounding rock is mainly classified as Grade IV. The tunnel is only 250 m distance from the Shenzhen Reservoir and passes beneath many masonry structure buildings and water supply lines. How to reduce the settlement caused by tunnel excavation is the critical factor of the project. In this paper, an area in Grade IV3 surrounding rock with a buried depth of 20 m was selected as the main research object.
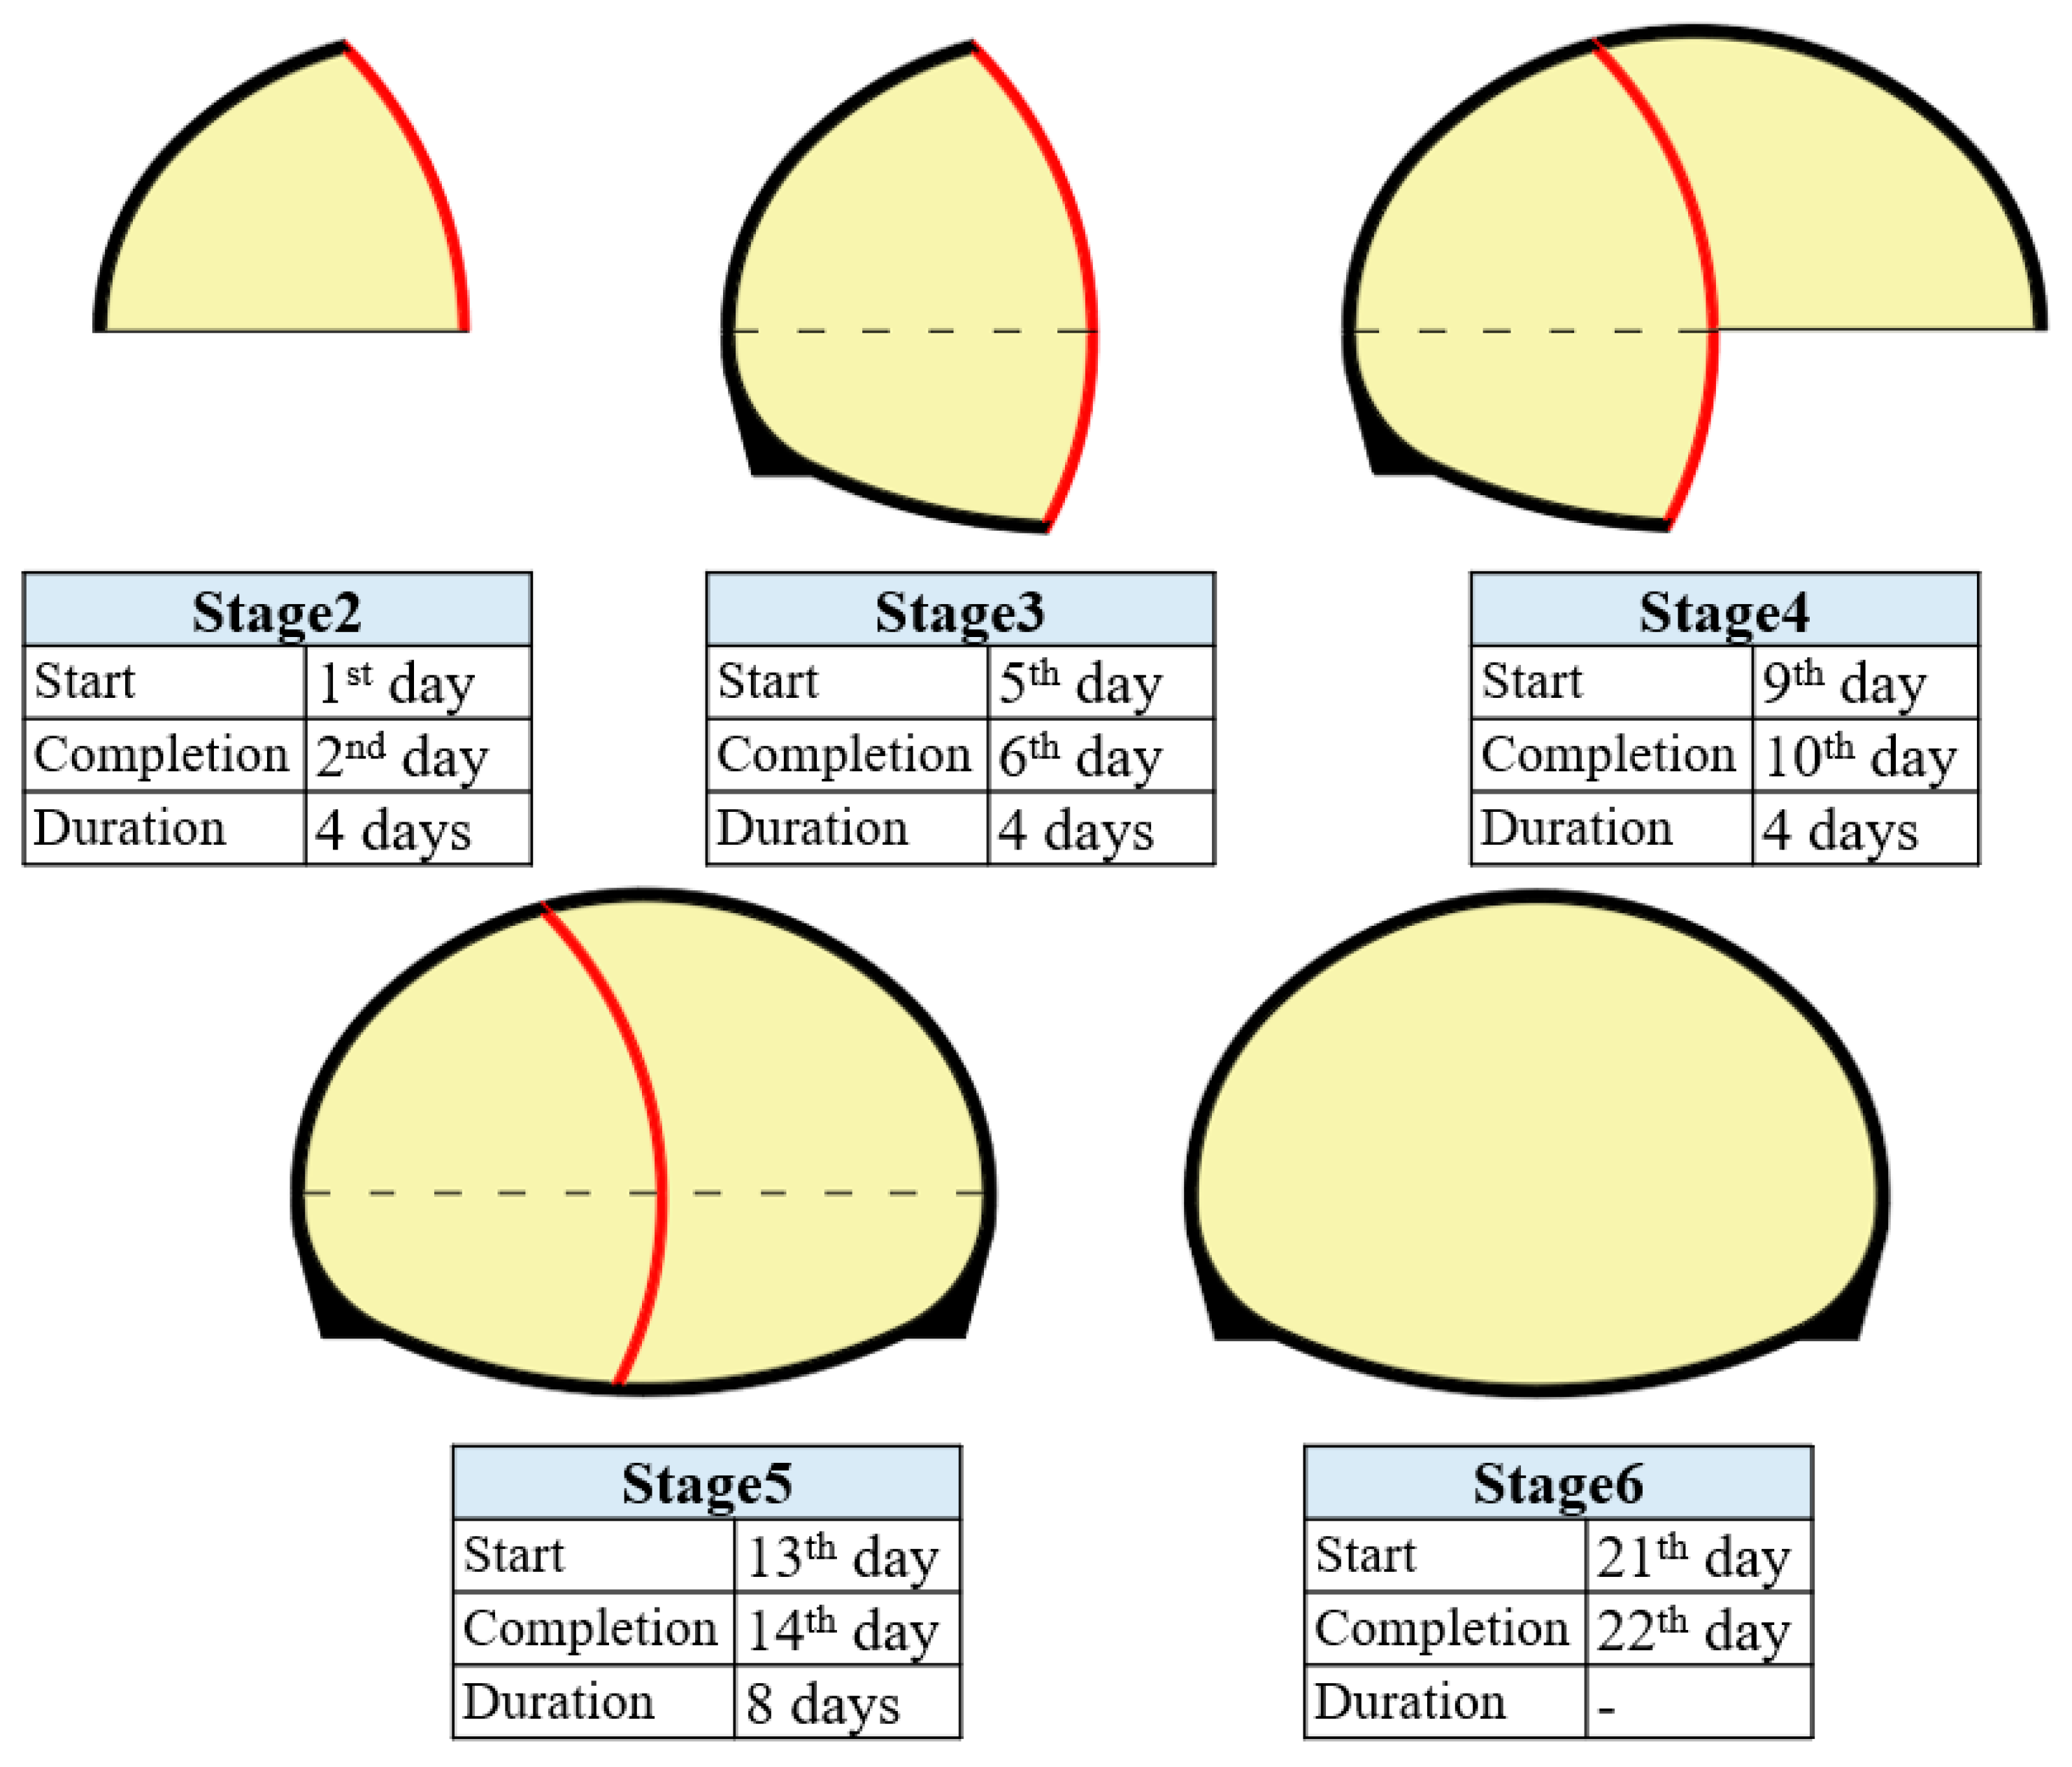
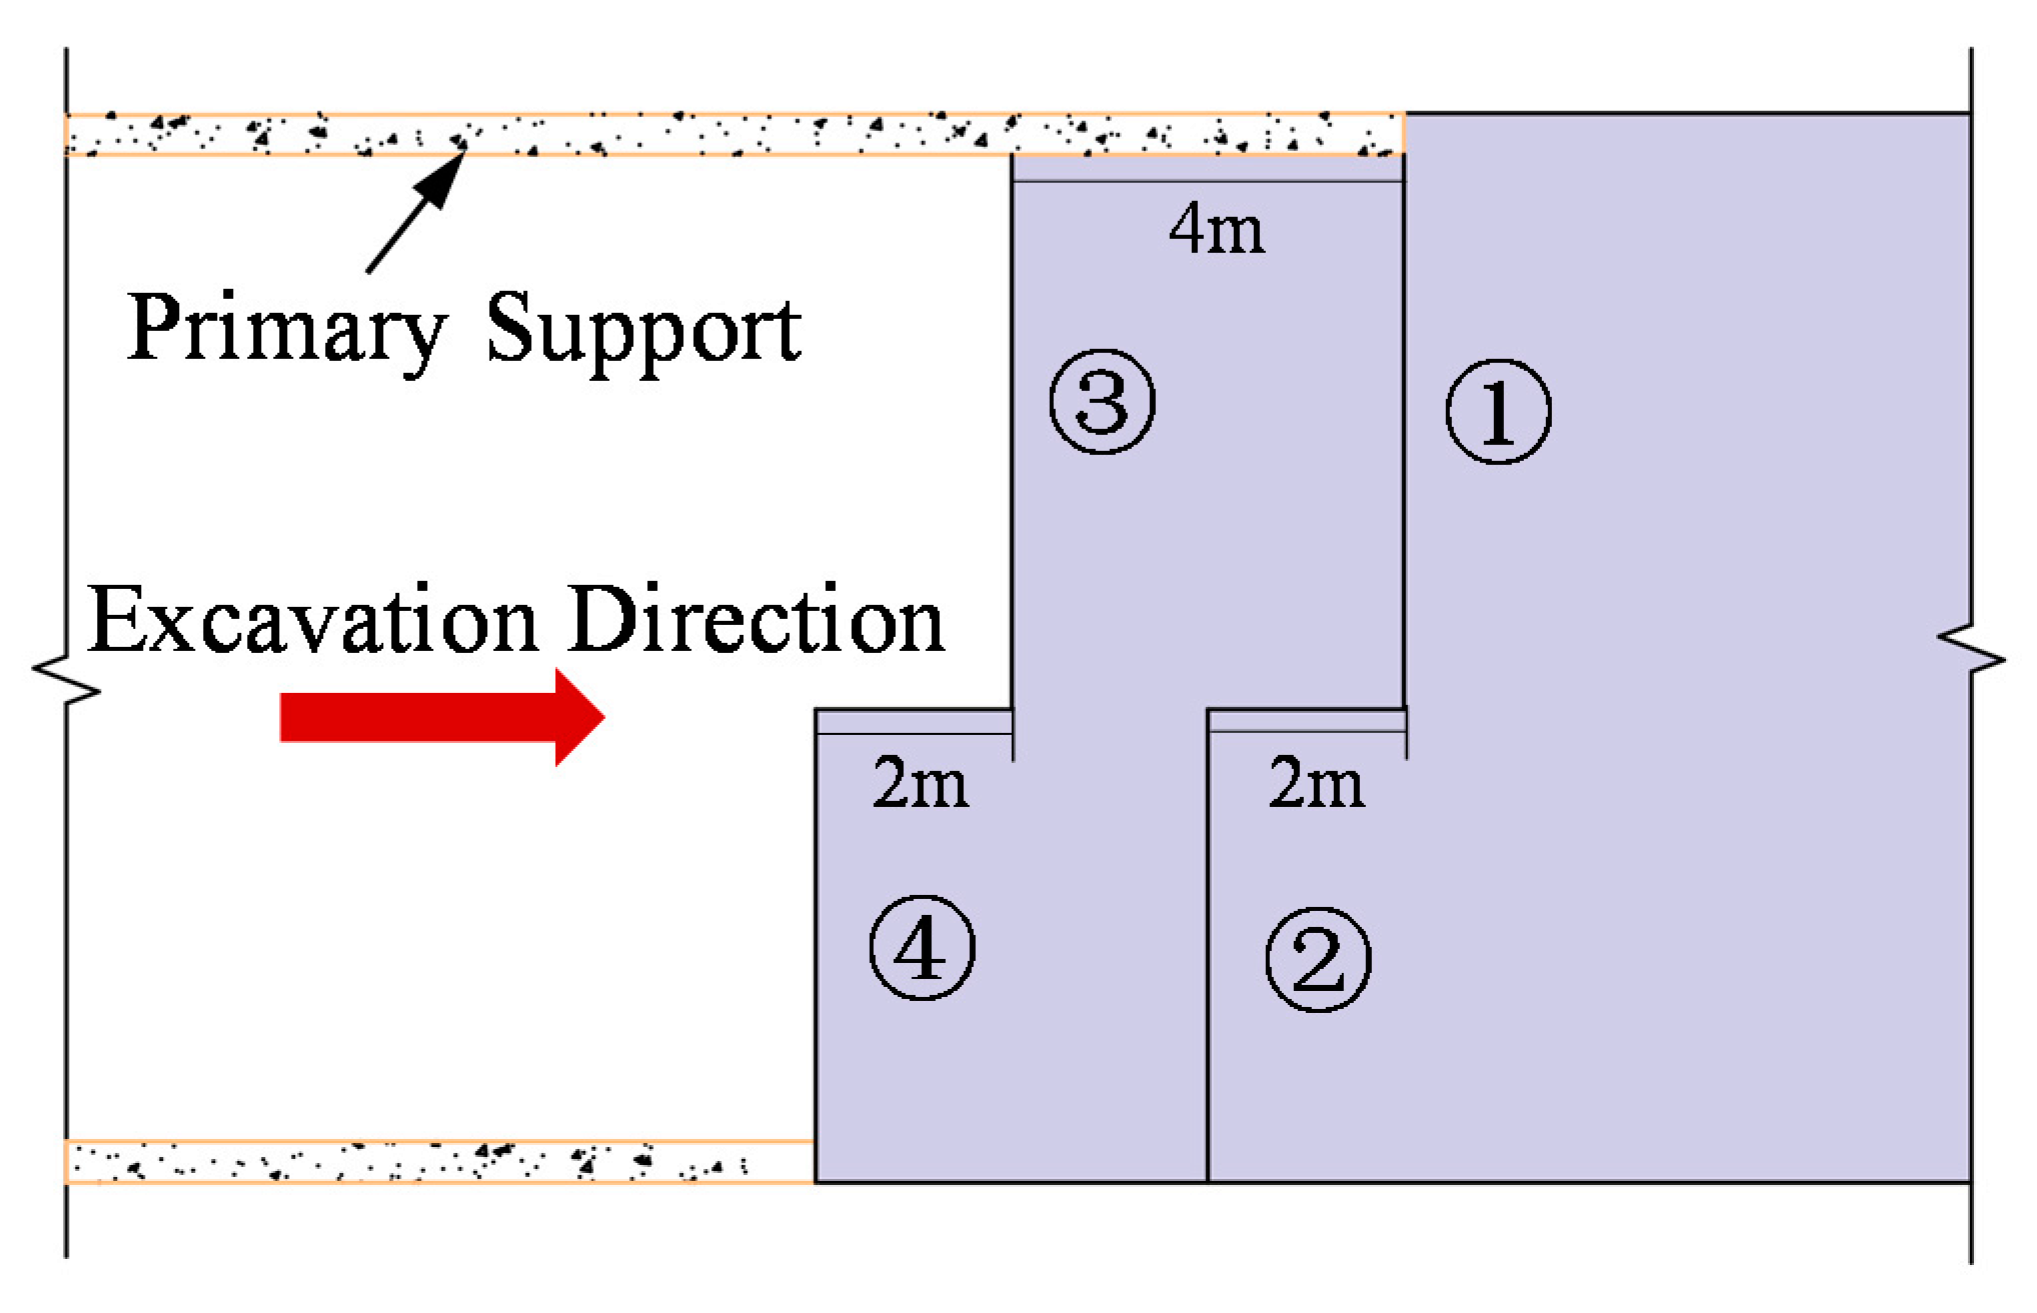
Considering the surrounding rock condition and buried depth, the Grade IV surrounding rock section of the tunnel is designed to be excavated by the CD method, and the construction cycle footage is 1 m. The construction process of the CD method consists of six key stages (Figure 3): the stage before excavation (Stage 1), the excavation and support of the upper-left section (Stage 2), the excavation and support of the lower-left section (Stage 3), the excavation and support of the upper-right section (Stage 4), the excavation and support of the lower-right section (Stage 5), and the demolition of the center diaphragm (Stage 6). Taking the four-steps CD method as an example, Figure 4 shows the longitudinal section of the CD method, and Figure 5a shows the section of the CD method. In order to reduce the settlement caused by construction, the VCD method was proposed, as shown in Figure 5b.
3. Applicable Conditions
3.1. Finite-Difference Models
In view of the fact that the in situ stress of the shallow tunnel is mainly gravity stress, three-dimensional finite-difference models under different construction conditions were established by using the FLAC3D software. FLAC3D is a general purpose code developed by Itasca, which can simulate a full range of nonlinear static problems. It is suitable for the comparative research of mechanical and deformation characteristics of different construction methods. By the numerical simulation of the excavation and support process of the CD method and the VCD method, the surface settlement, crown settlement, horizontal convergence, and internal force of the center diaphragm of the two construction methods were investigated. The models in Figure 6 are symmetrical, whereas the dimensions of X, Y, and Z are 120, 60, and 80–115 m, respectively. The number of nodes and elements included in each model is shown in Table 1. All the models have the same boundary conditions, the horizontal constraints were set for the vertical surfaces, the vertical constraint was set for the bottom surface, and the free condition was set for the top surface. The solid elements were utilized to simulate the surrounding rock. The shell elements were utilized to simulate the center diaphragm and primary support. This allows to calculate the deformation and stress distributions quickly. For an accurate comparison, a homogeneous formation was adopted in all models.
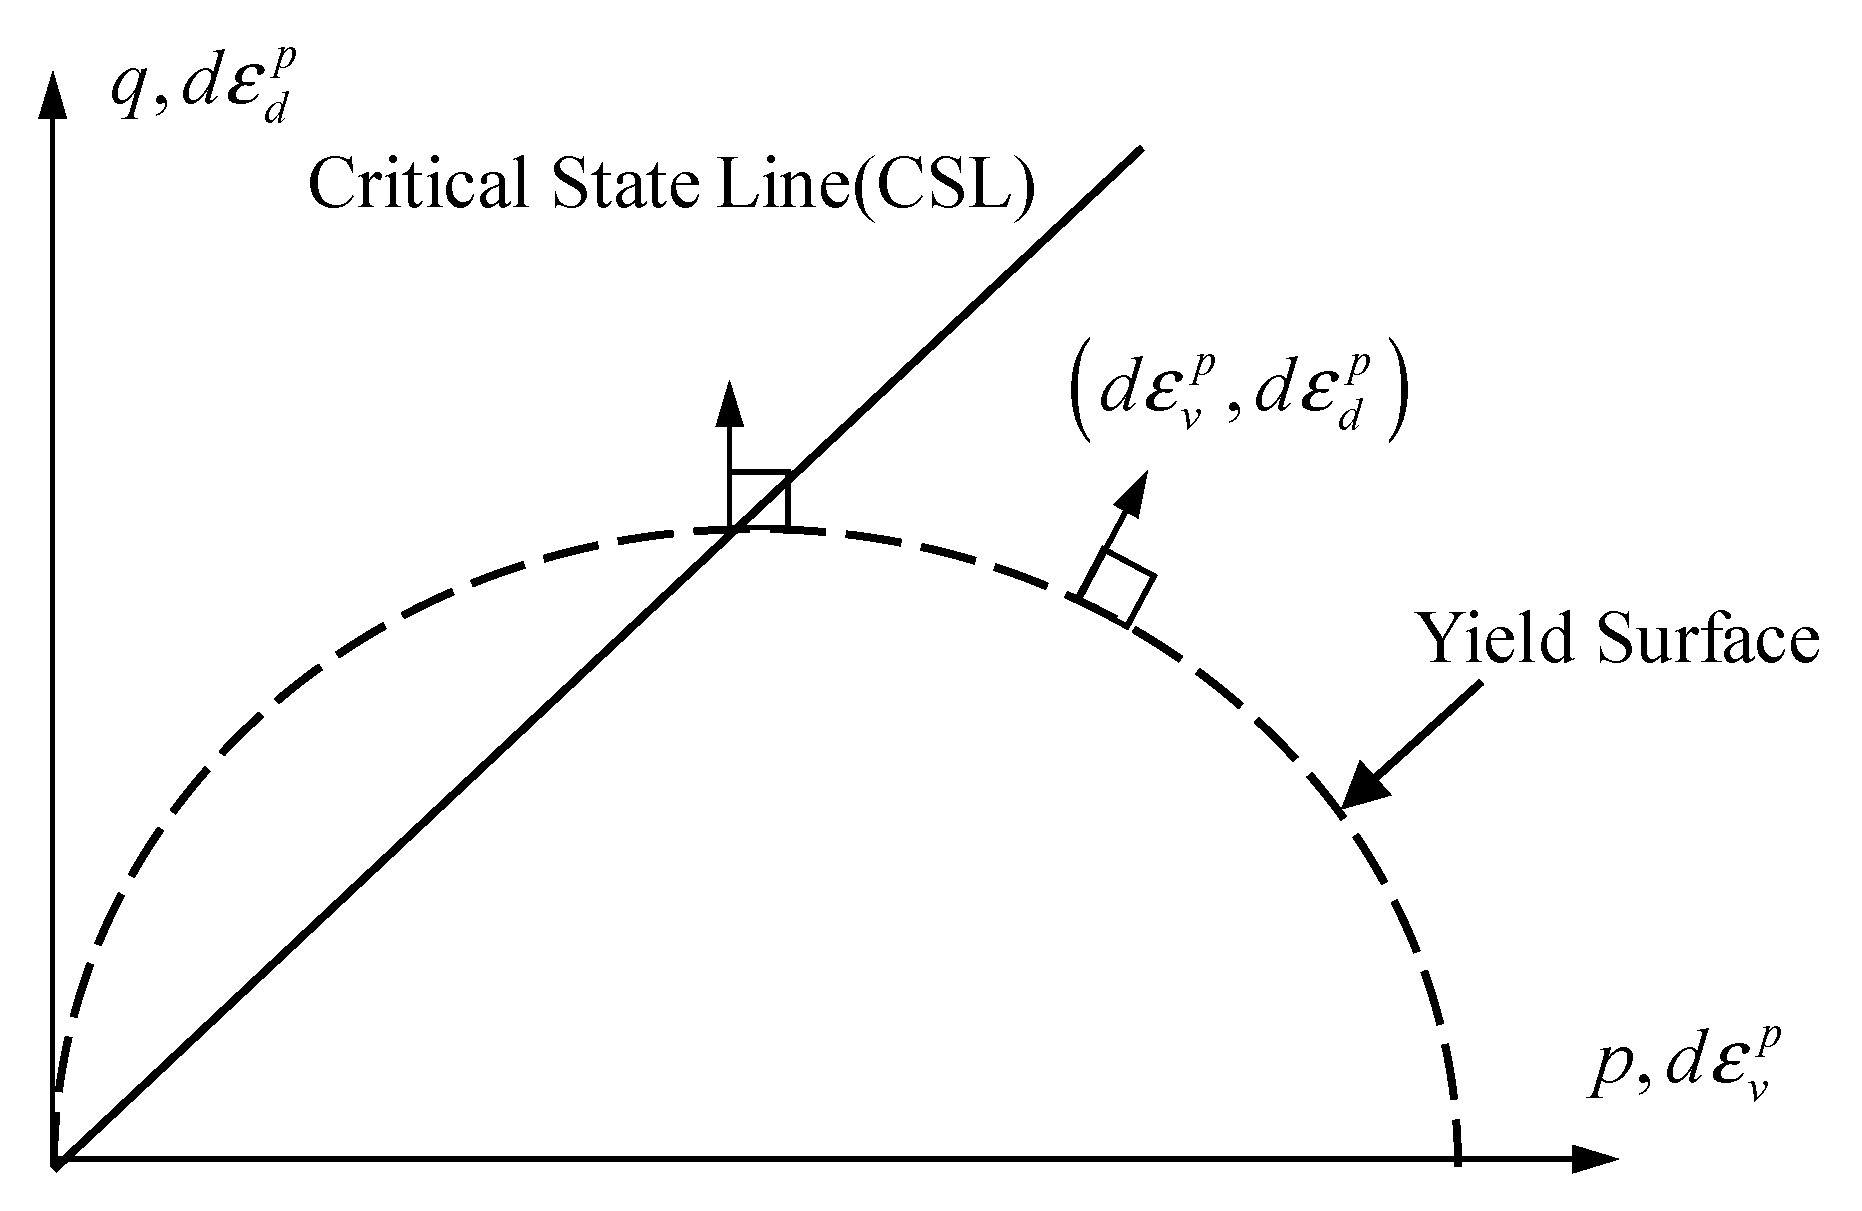
In the numerical simulation, as the Mohr–Coulomb model cannot reflect the behaviors of the soil under unloading well, the modified Cam-clay model based on the orthogonal condition and the associative flow rule (Figure 7) was adopted. The yield function of the modified Cam-clay model is given by Equations (1) and (2) [21]:
where p is the mean value of the stress; is the initial mean value of the stress; q is the deviatoric stress; M is the slope of the critical state line; is the plastic volumetric strain; is the slope of the normal consolidation line; is the slope of the elastic swelling line; and is the initial void ratio.
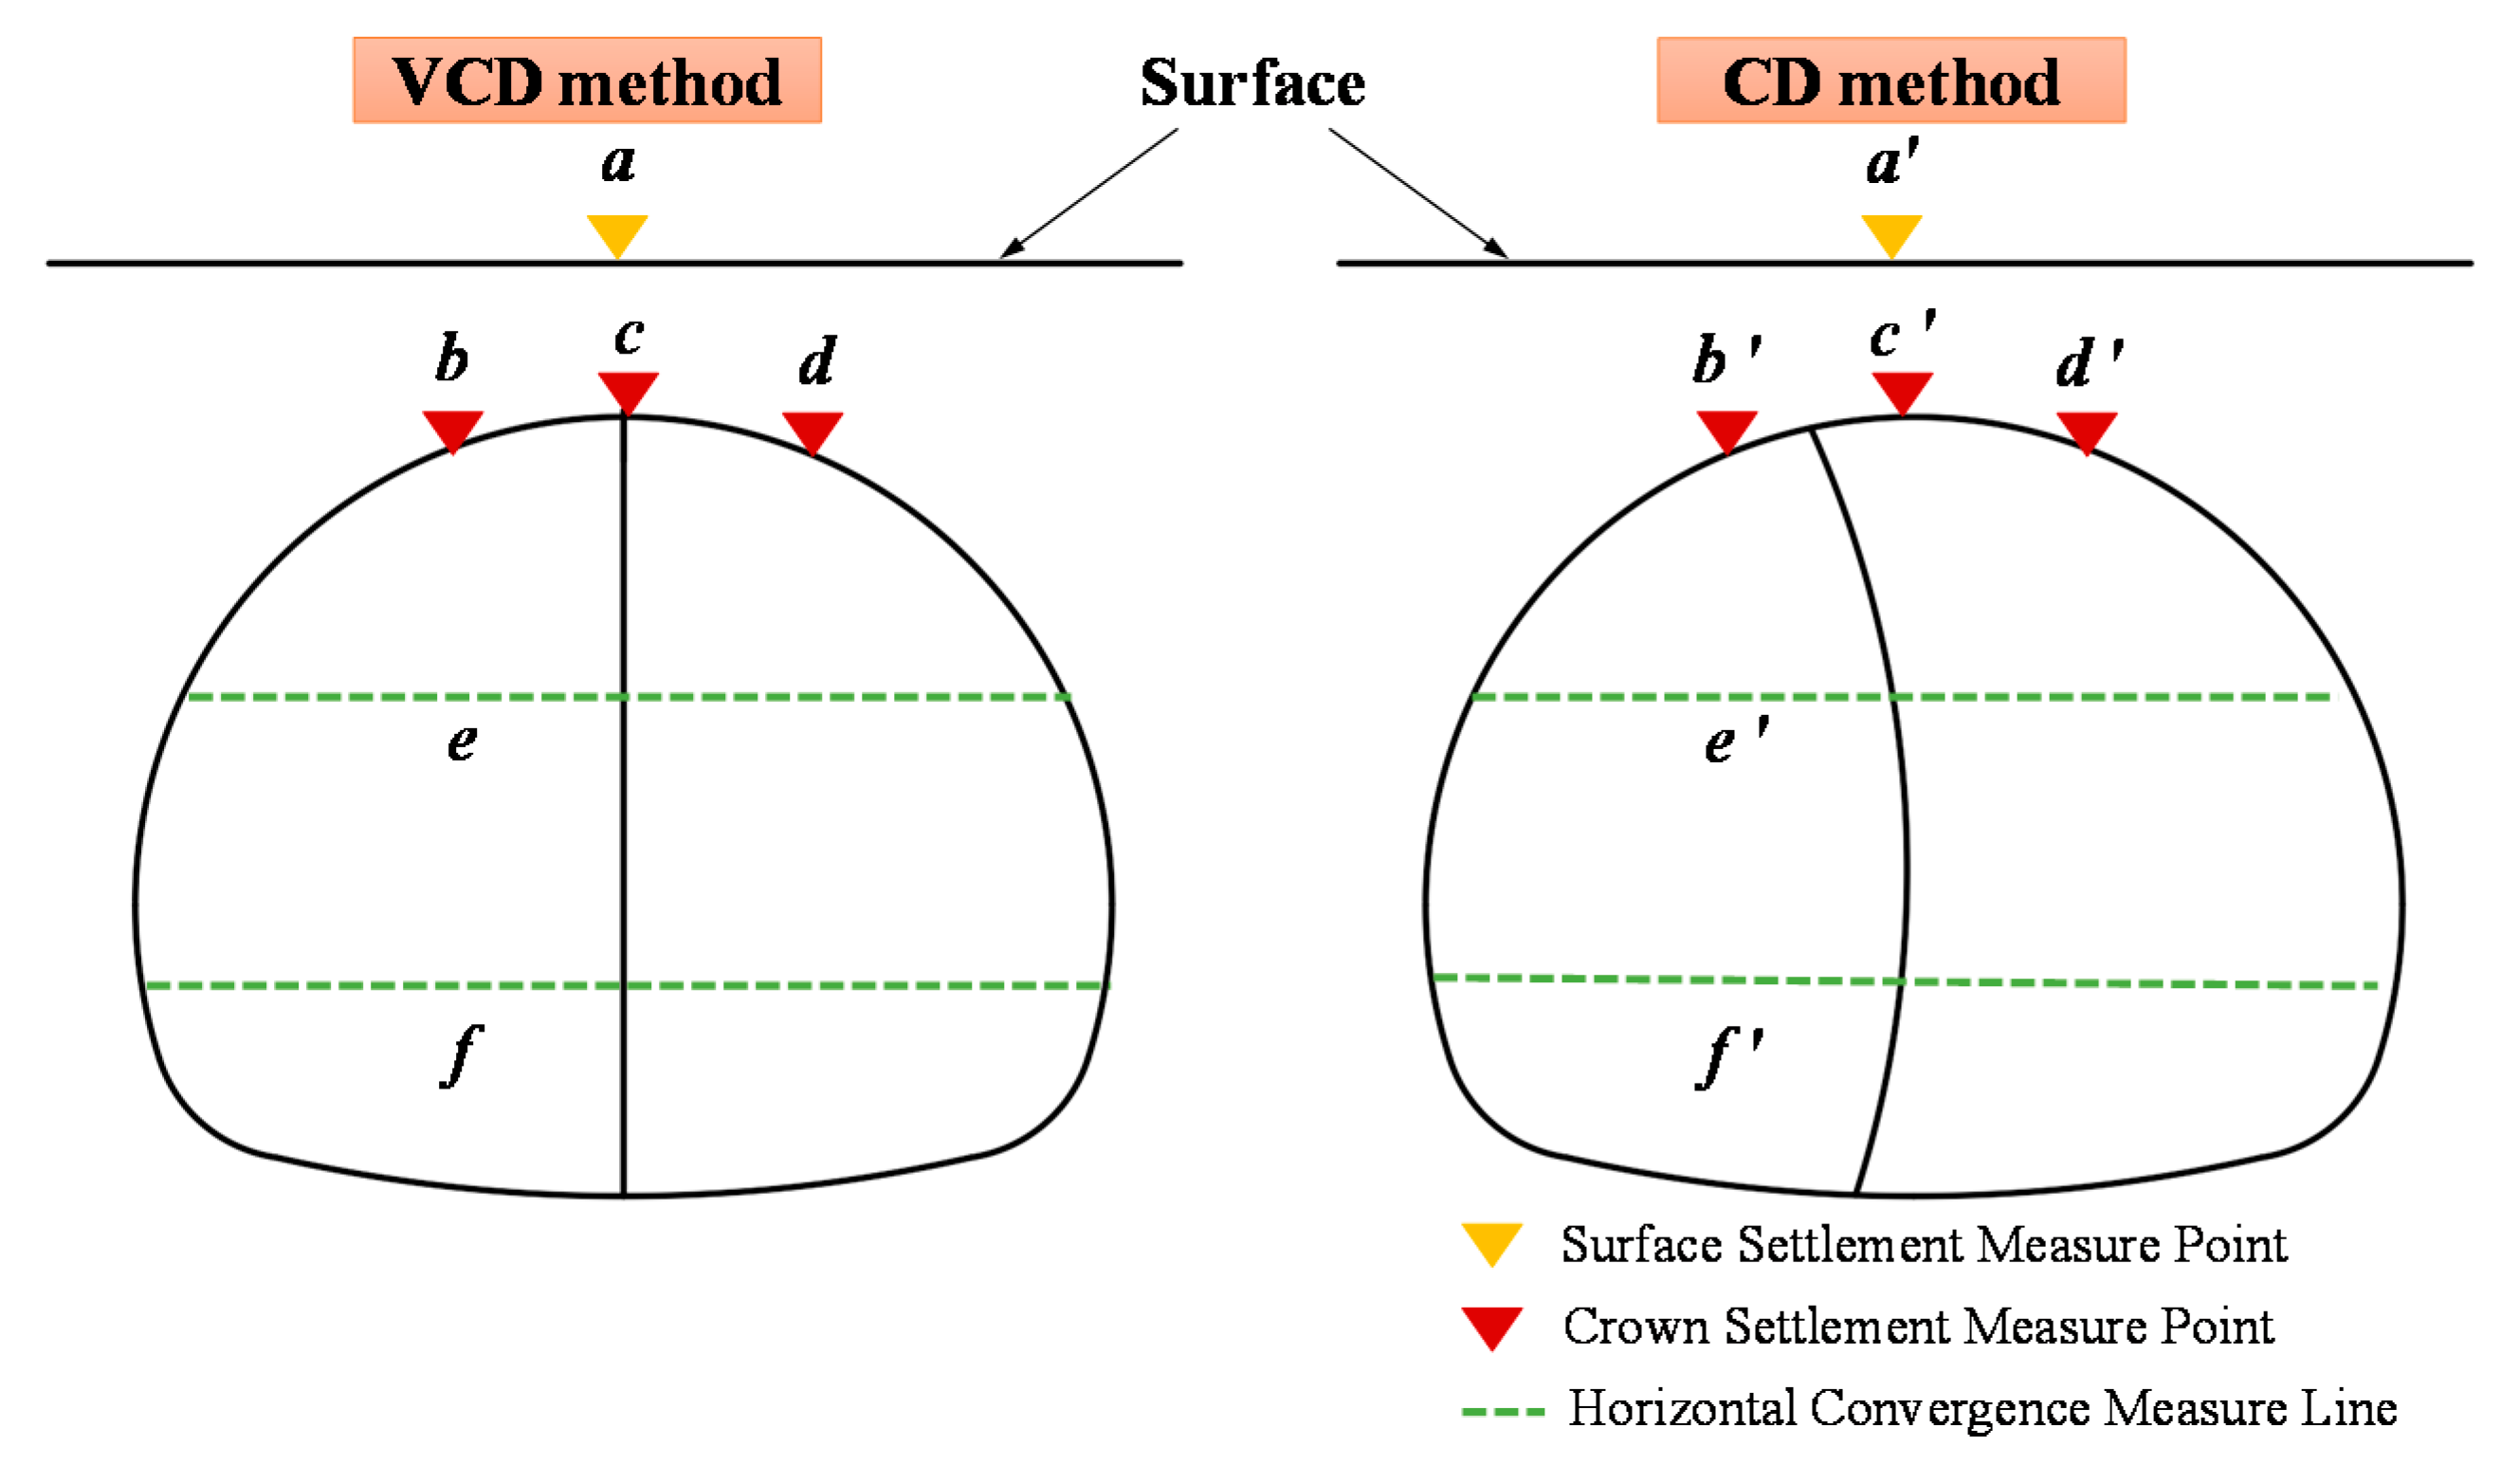
Figure 8 illustrates the positions of the measuring points. A measuring point for the surface settlement was arranged right above the tunnel, three measuring points for the crown settlement were arranged at the vault crown, and two measuring lines for the horizontal convergence were arranged at the arch springing and the side-wall.
3.2. Calculation Conditions and Selection of Parameters
According to the rock hardness and integrity, the Guidelines for Design of Highway Tunnel [22] stipulates that the rocky surrounding rock is divided into Grade I–V based on the Basic Quality Index of Rock Mass ([BQ]). Besides, Grade III is divided into Grade III1–III2, Grade IV is divided into Grade IV1–IV3, and Grade V is divided into Grade V1–V2. Table 2 shows the classification of the rocky surrounding rocks. Past practical projects have indicated that the CD method is suitable for Grade IV and Grade V surrounding rock. The [BQ] can be calculated using Equation (3):
where is the uniaxial compressive strength of rocks; and is the integrity index of the rock mass.
The Code for the Design of Road Tunnels [23] stipulates that the boundary depth between shallow and deep tunnels shall be determined comprehensively by the equivalent load height in consideration of the geological condition and the construction method. The boundary depth can be calculated using Equations (4)–(6):
where is the boundary depth between shallow and deep tunnels (m); is a constant, (two for Grade I–III surrounding rock, 2.5 for Grade IV–V surrounding rock); is the load equivalent height (m); is the surrounding rock grade; is the width influence coefficient; is the maximum excavation span of the tunnel (m); and denotes the rate of increase or decrease of the surrounding rock pressure for every 1 m increase or decrease in , = 0.2 when < 5 m, = 0.1 when > 5 m. When the surrounding rock is Grade IV3 and the tunnel span is 16.18 m, the boundary depth is 38 m. Therefore, a buried depth of 5–40 m was used in the calculations, corresponding to 0.5D–4D. D is the equivalent diameter of the tunnel. Thirteen cases were investigated in this part, and the details are presented in Table 3.
According to the guidelines [22], the calculation parameters for the surrounding rock and the structure could be determined, and the Young’s modulus for the center diaphragm and the primary support can be calculated with Equation (7):
where is the equivalent Young’s modulus of the center diaphragm and the primary support; is the inertia moment of the center diaphragm and the primary support; are the Young’s modulus and the inertia moment of the shotcrete, respectively; and and are the Young’s modulus and the inertia moment of the steel arch, respectively. The calculation parameters for the surrounding rock and the structure are presented in Table 4 and Table 5 [22], respectively.
3.3. Comparative Analysis of Deformation in Different Buried Depth
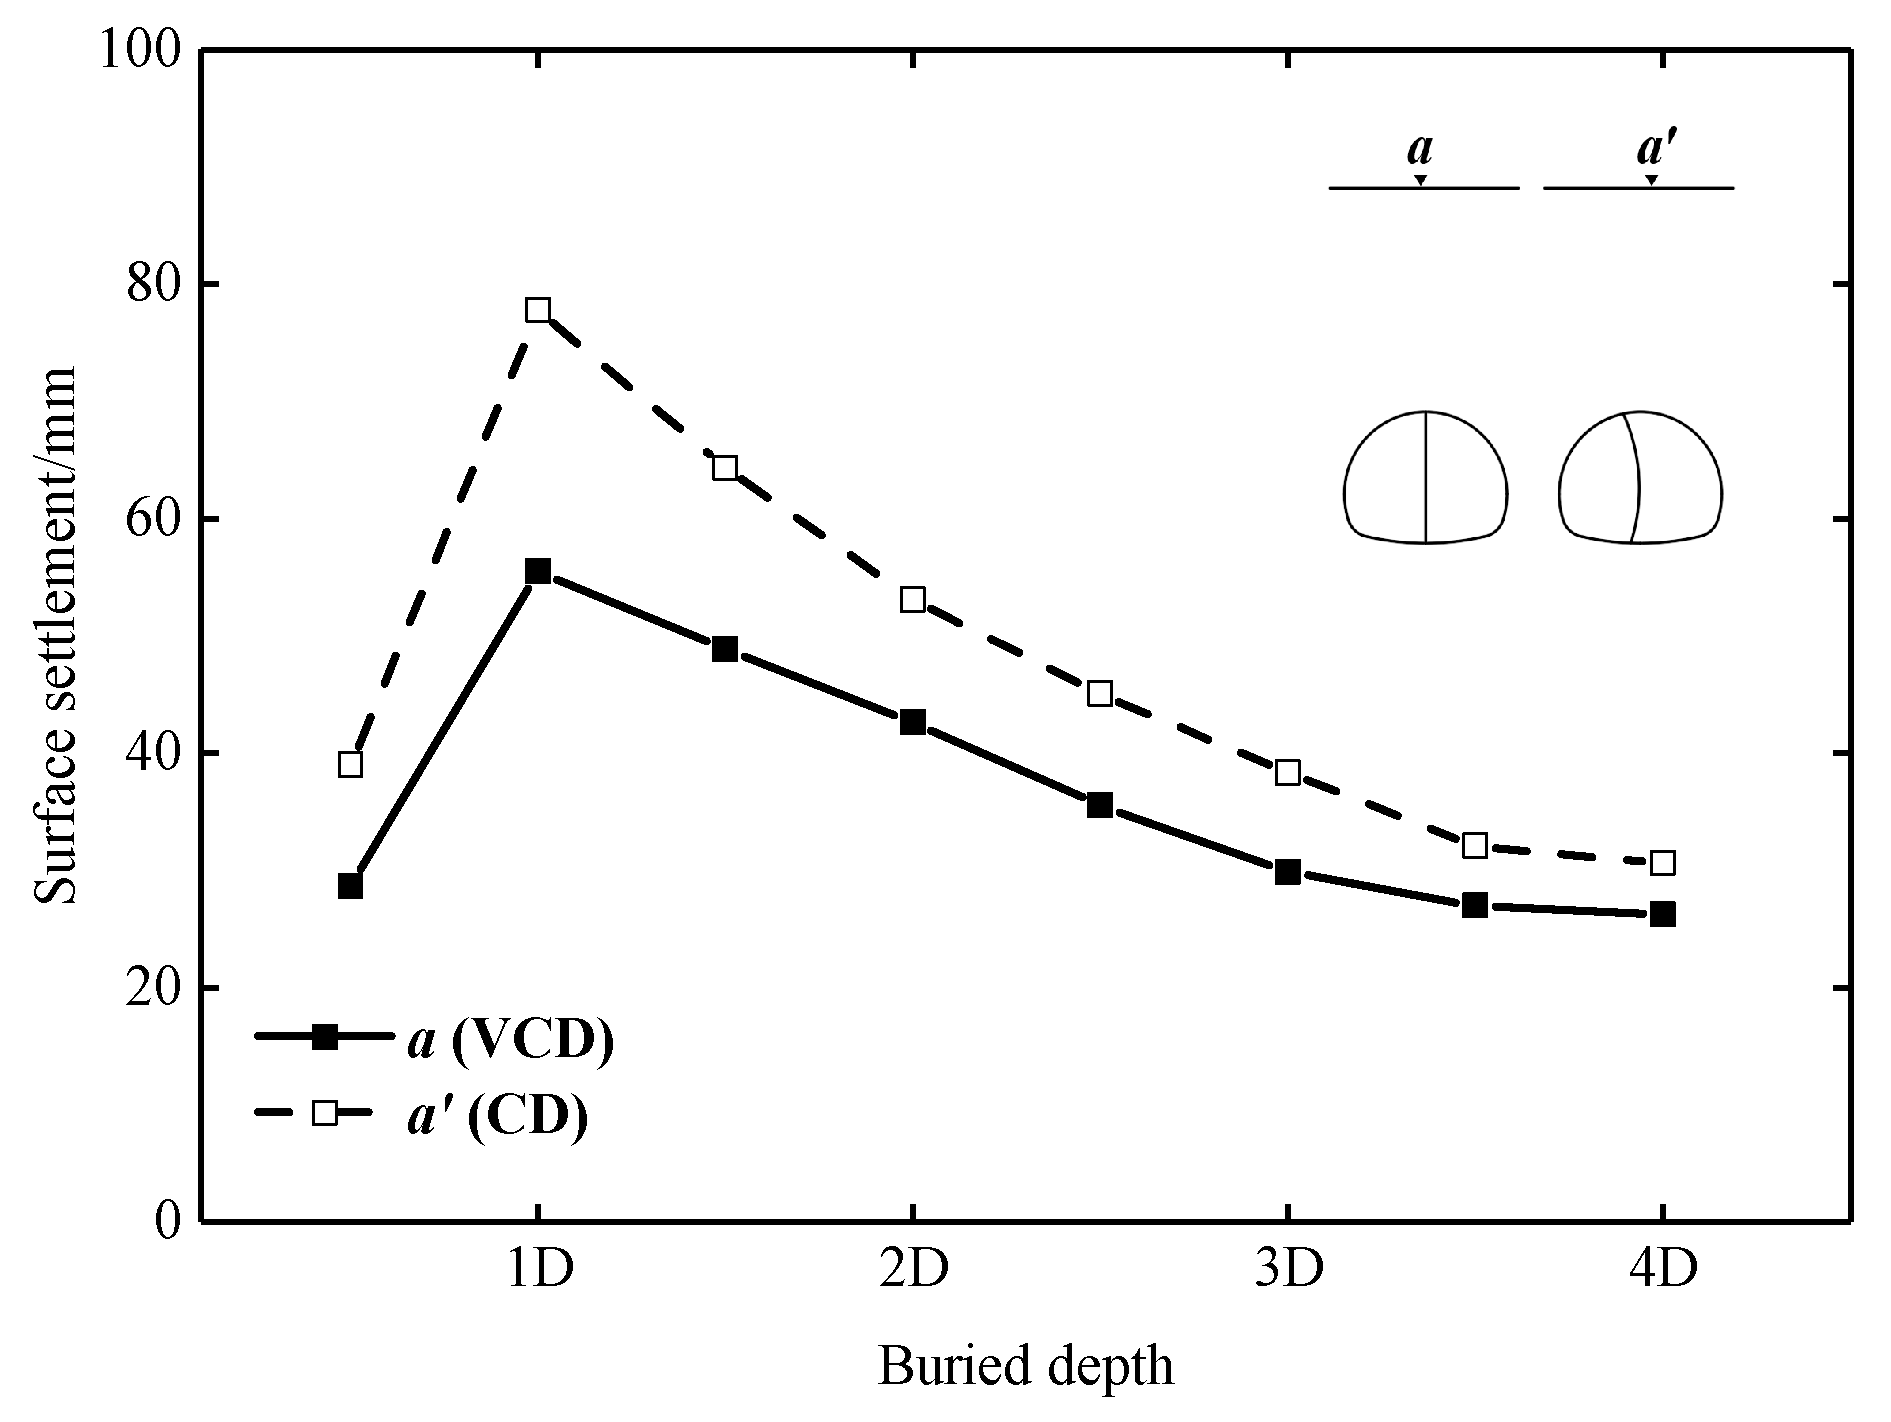
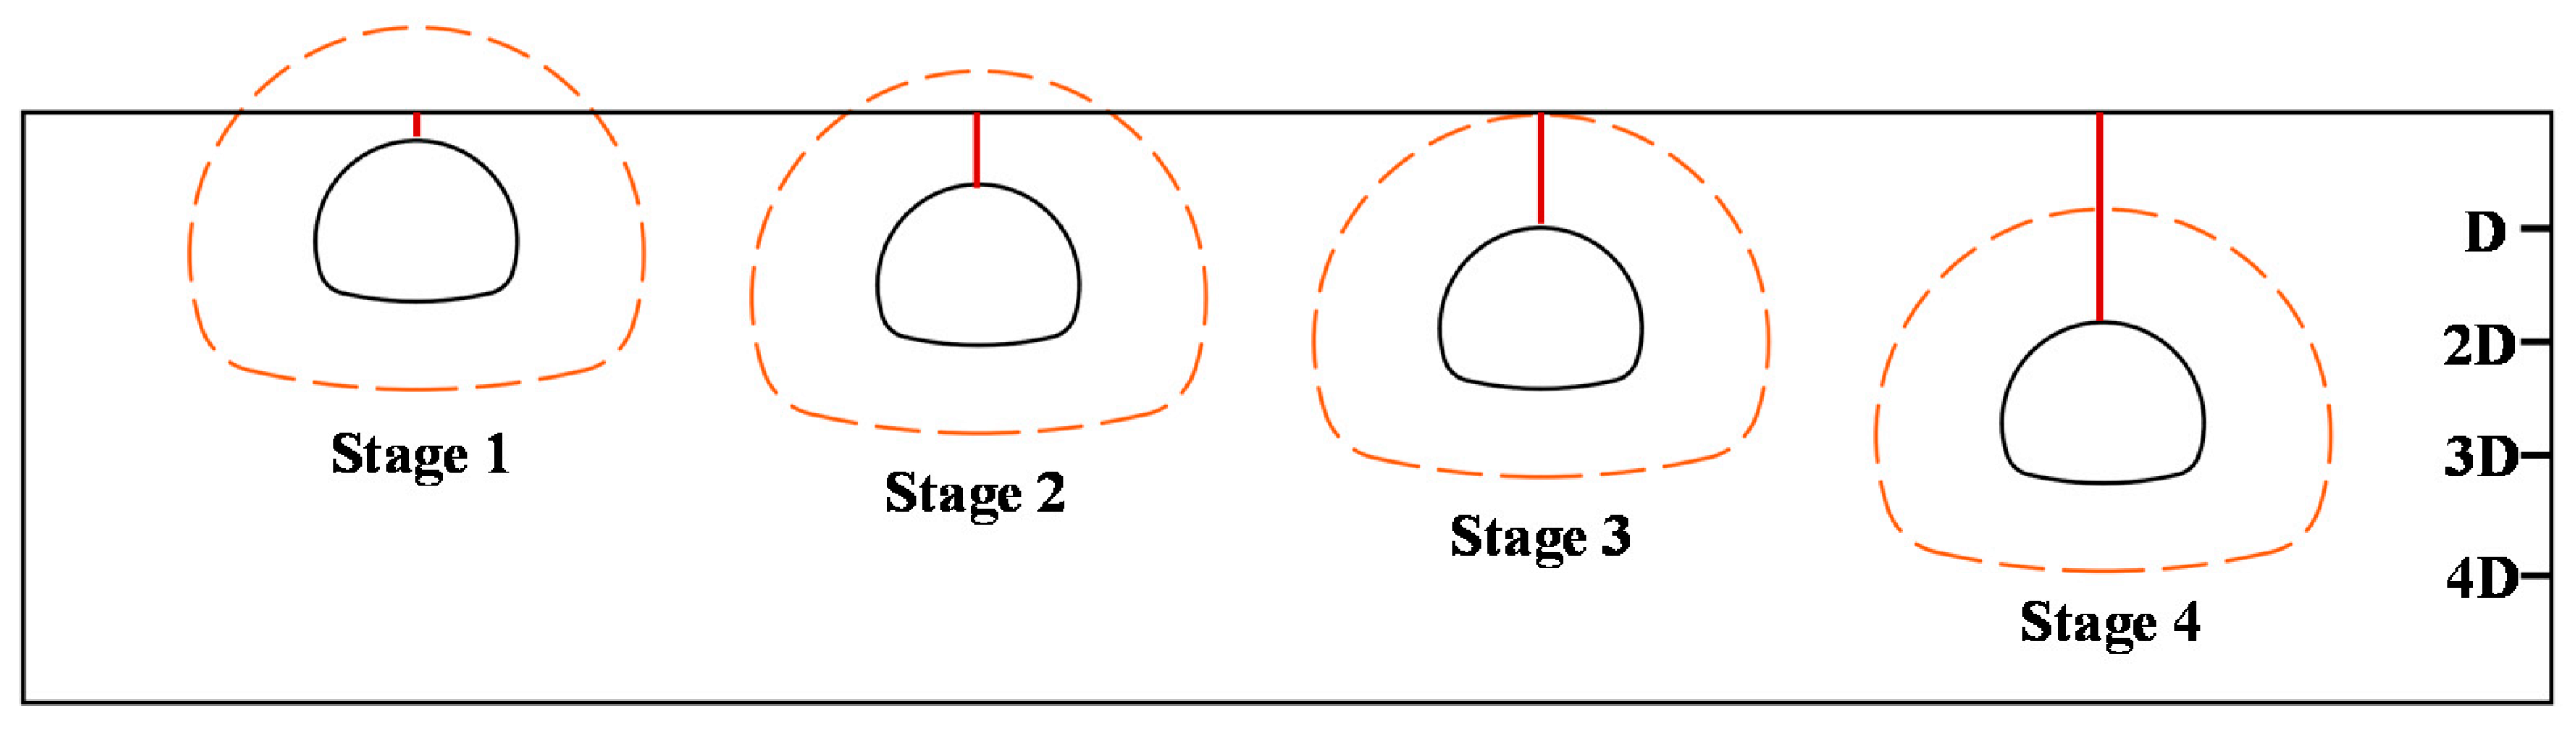
The relationship between the surface settlement and buried depth in Grade IV3 surrounding rock is shown in Figure 9. The surface settlements of the two methods have a similar trend in variation. With the increase in the buried depth, the surface settlement increases and the maximum is observed at the buried depth of D, and then shows a decreasing trend. This is because the disturbance area caused by the construction of the tunnel has reached the surface when the buried depth is shallow, and the surface settlement is the accumulated value of the stratum deformation above the tunnel, which increases with the increase in the buried depth (Stage 1 and 2 in Figure 10). On the contrary, when the buried depth is not less than the height of the disturbance area, the rock mass above the tunnel can achieve self-stabilization. The value of the surface settlement is mainly affected by ground loss and geotechnical properties, and the construction influence on the surface decreases with the increase in the buried depth (Stage 3 and 4 in Figure 10). As shown in Figure 9, the surface settlement of the CD method is 30.6–77.8 mm, and that of the VCD method is 26.2–55.5 mm. Compared with the CD method, the surface settlement of the VCD method is reduced by 14.4–28.7%, and the maximum reduced value of 22.3 mm and minimum reduced value of 4.4 mm are observed in Case1-2 and Case1-8, respectively. Furthermore, the reduced values observed in Case1-1 to Case1-4 are greater than 10 mm. The results indicate that the surface settlements in Grade IV3 surrounding rock can be reduced by more than 20% with the VCD method when the buried depth is 0.5D–3D.
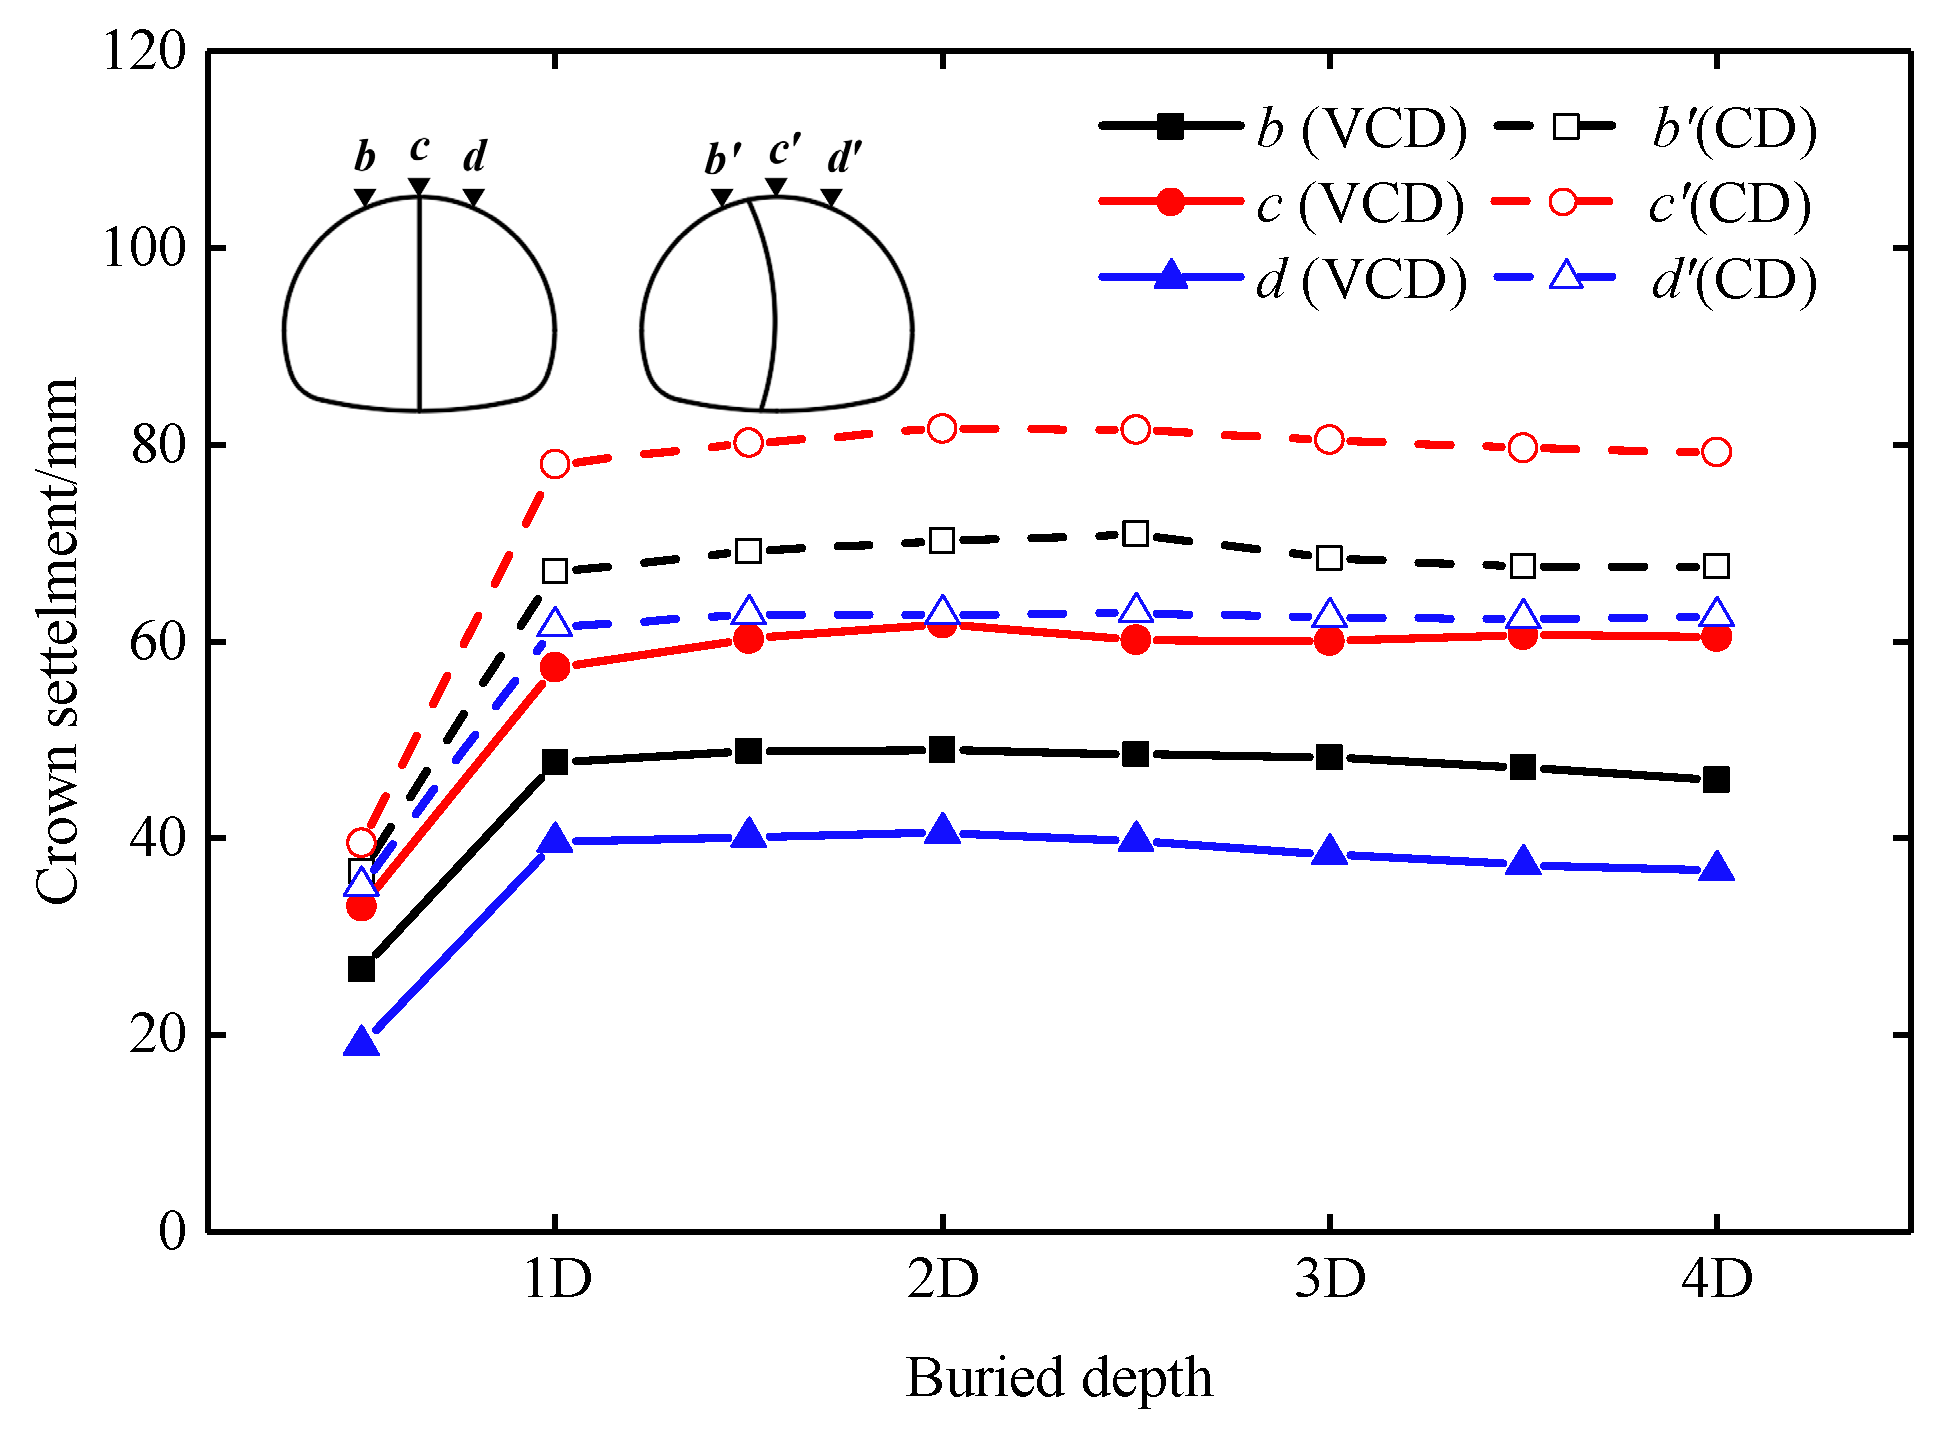
The relationship between the crown settlement and buried depth in Grade IV3 surrounding rock is shown in Figure 11. The crown settlements of the two methods have a similar characteristic in variation and distribution. With the increase in the buried depth, the crown settlements increase and the maximum is observed at the buried depth of D, and then remains substantially constant. This is because the crown settlements are mainly caused by the extrusion between the primary support and the surrounding rock in the upper part of the disturbed area. As shown in Figure 10, when the buried depth is shallow, the weight of surrounding rock in the upper disturbed area increases with the increase in the buried depth. However, when the buried depth is deep, the weight of the surrounding rock in the upper disturbed area remains a constant value. As shown in Figure 11, the left, middle, and right crown settlements of the CD method are 36.6–70.9, 39.5–81.6, and 35.2–63.0 mm respectively, and those of the VCD method are 26.7–49.0, 33.1–61.8, and 19.0–40.6 mm respectively. Compared with the CD method, the left, middle, and right crown settlements with the VCD method are reduced by 27.0–32.1%, 16.2–26.4%, and 35.2–46.0%, respectively. The reduced values observed in Case1-2 to Case1-8 are approximately 20 mm. The results indicate that the crown settlements in Grade IV3 surrounding rock can be reduced by more than 20% with the VCD method when the buried depth is D–4Dm, and the reduced value on the right side of the crown is more than 35%.
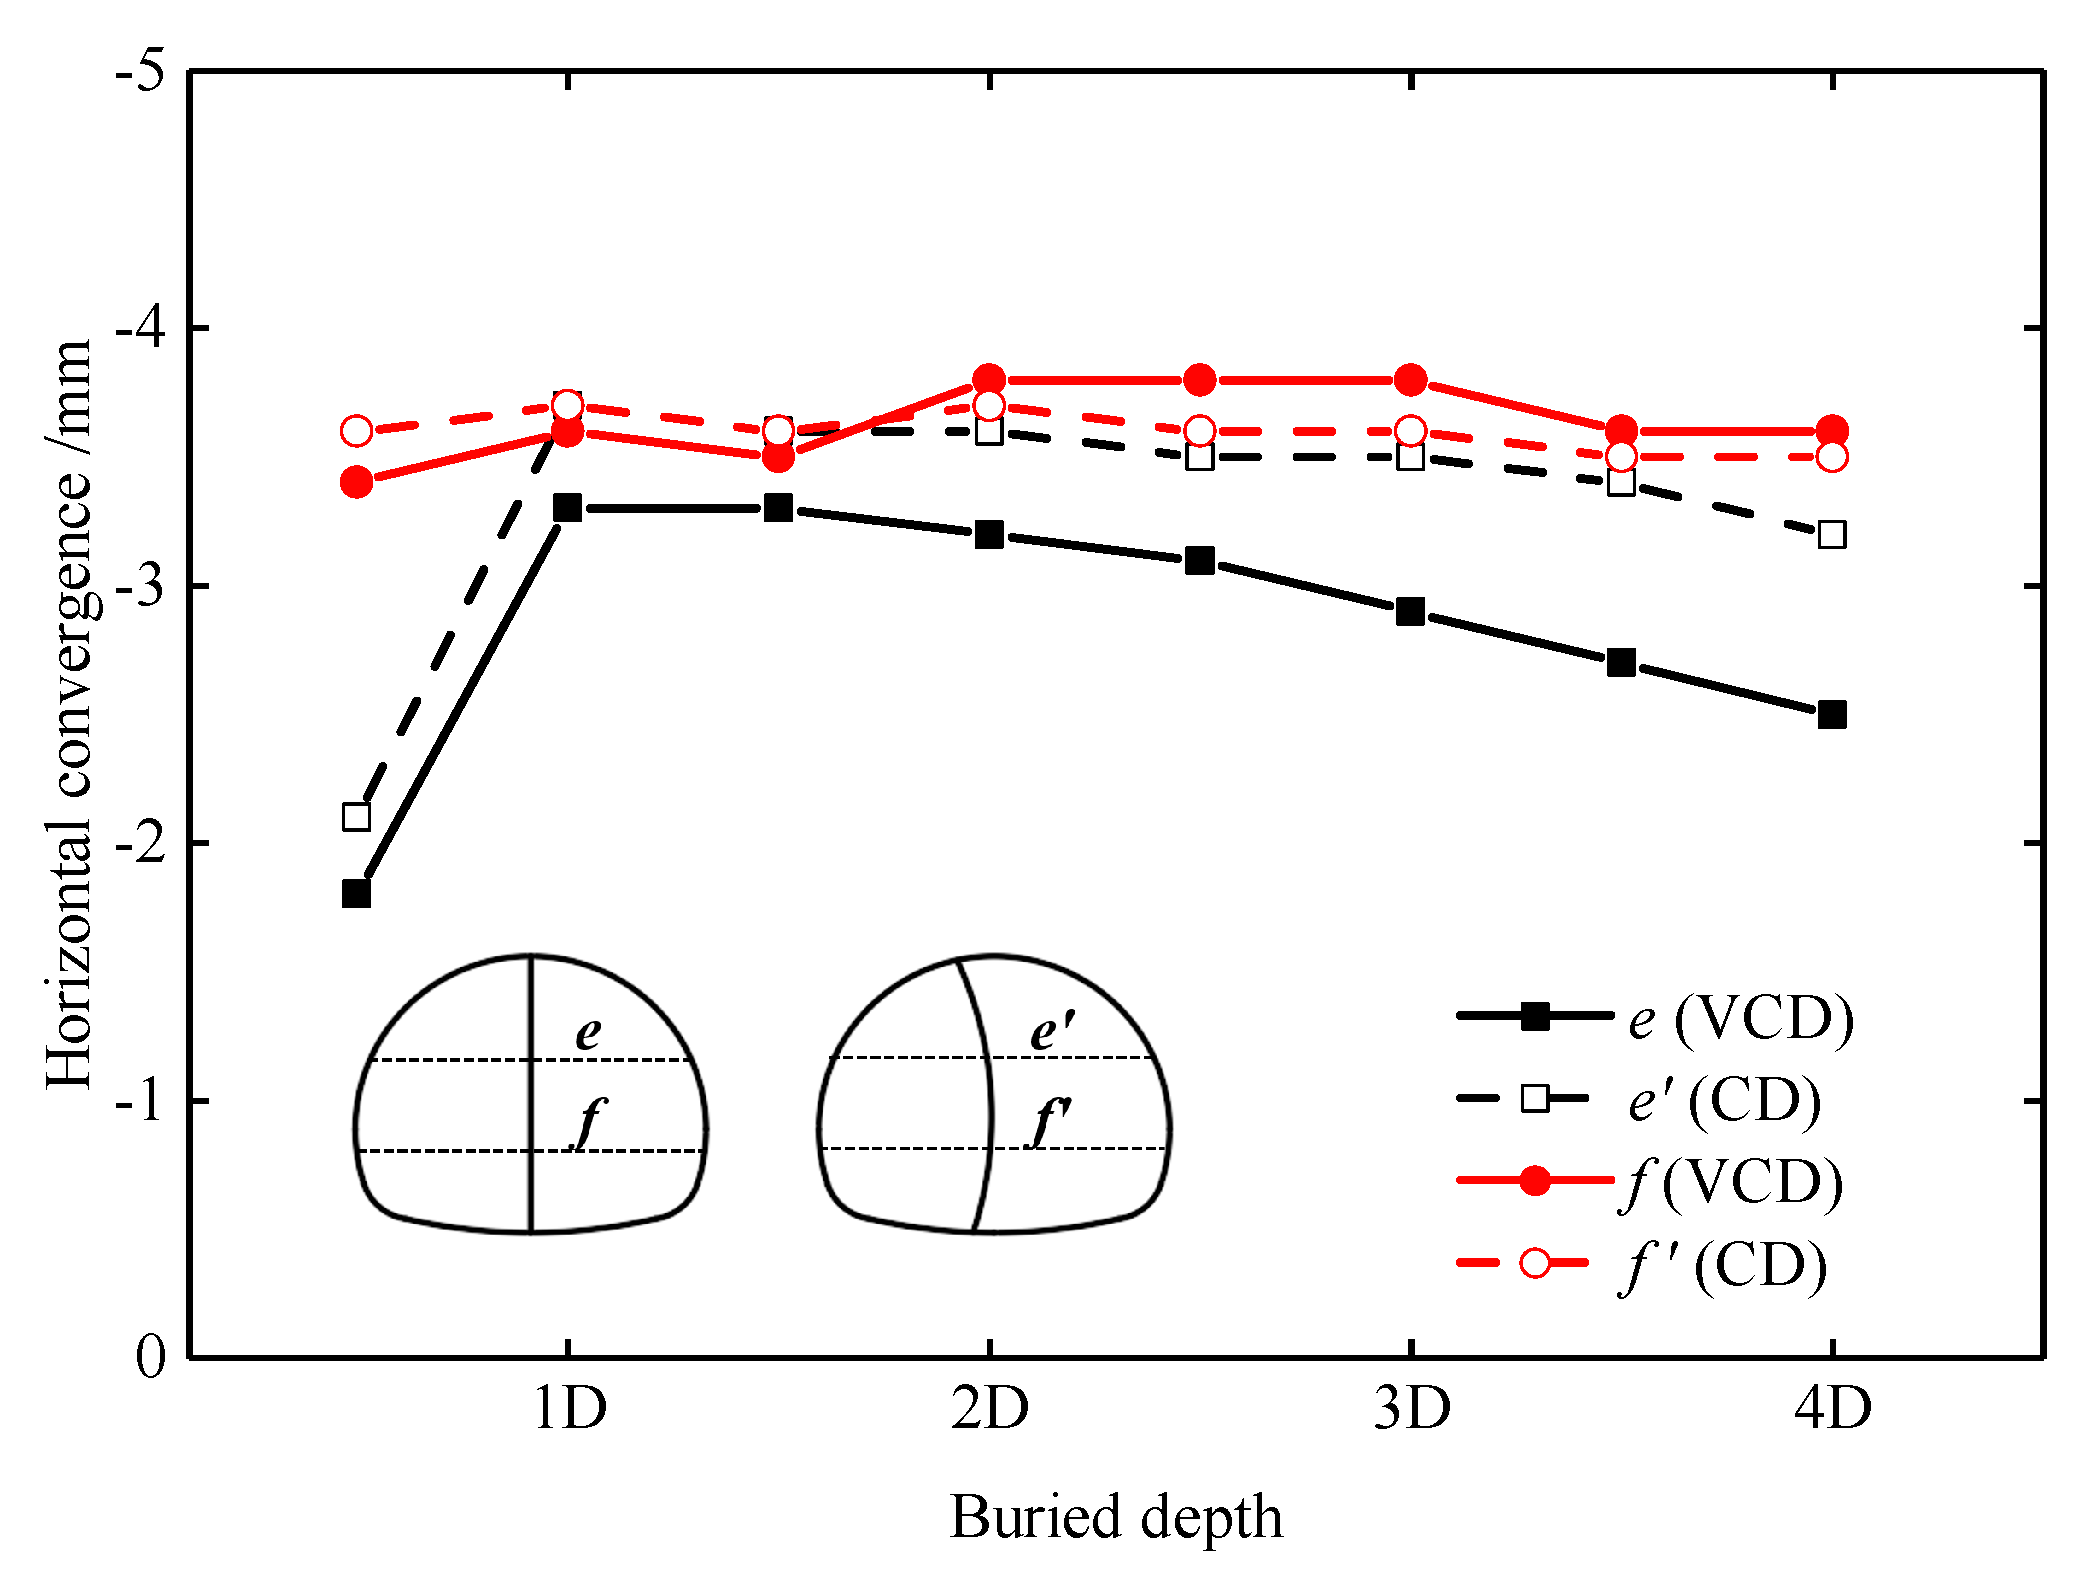
The relationship between the horizontal convergence and buried depth in Grade IV3 surrounding rock is shown in Figure 12. A positive value indicates contraction, and a negative value indicates expansion. The horizontal convergences of the two methods have a similar trend of variation. With the increase in the buried depth, the arch springing convergence increases and the maximum is observed at the buried depth of D, and then decreases slowly, while the side-wall convergence almost keeps constant as buried depth changes. This is because that the arch springing convergence is mainly affected by the crown settlement, while the side-wall convergence is mainly affected by the lateral earth pressure. The lateral earth pressure of the shallow tunnel is small, and the side-wall convergence has no significant difference. As shown in Figure 12, the arch springing convergence of the CD method is 2.1–3.7 mm, and that of the VCD method is 1.8–3.3 mm. The maximum reduction and minimum reduction are 0.7 and 0.3 mm, respectively, which are close to 0. The side-wall convergence of the VCD method is 3.4–3.8 mm, which is approximately equal to the value given by the CD method. The results indicate that the VCD method has no significant effect on the reduction of the horizontal convergence when the buried depth is less than 4D.
According to the code [23], the allowed deformation value of the tunnel can be calculated with Equation (8):
where is the allowed relative deformation value (0.3% for Grade III surrounding rock, 0.5% for Grade IV surrounding rock, 0.8% for Grade V surrounding rock); and is the tunnel span. When the tunnel span is 16.18 m, the allowed deformation value of the tunnel is calculated to be 80.9 mm in Grade IV surrounding rock. Therefore, when the buried depth is 0.5D–4D, the VCD method can be used to meet the requirement of the surrounding rock stability.
3.4. Comparative Analysis of Deformation in Different Surrounding Rock Grades
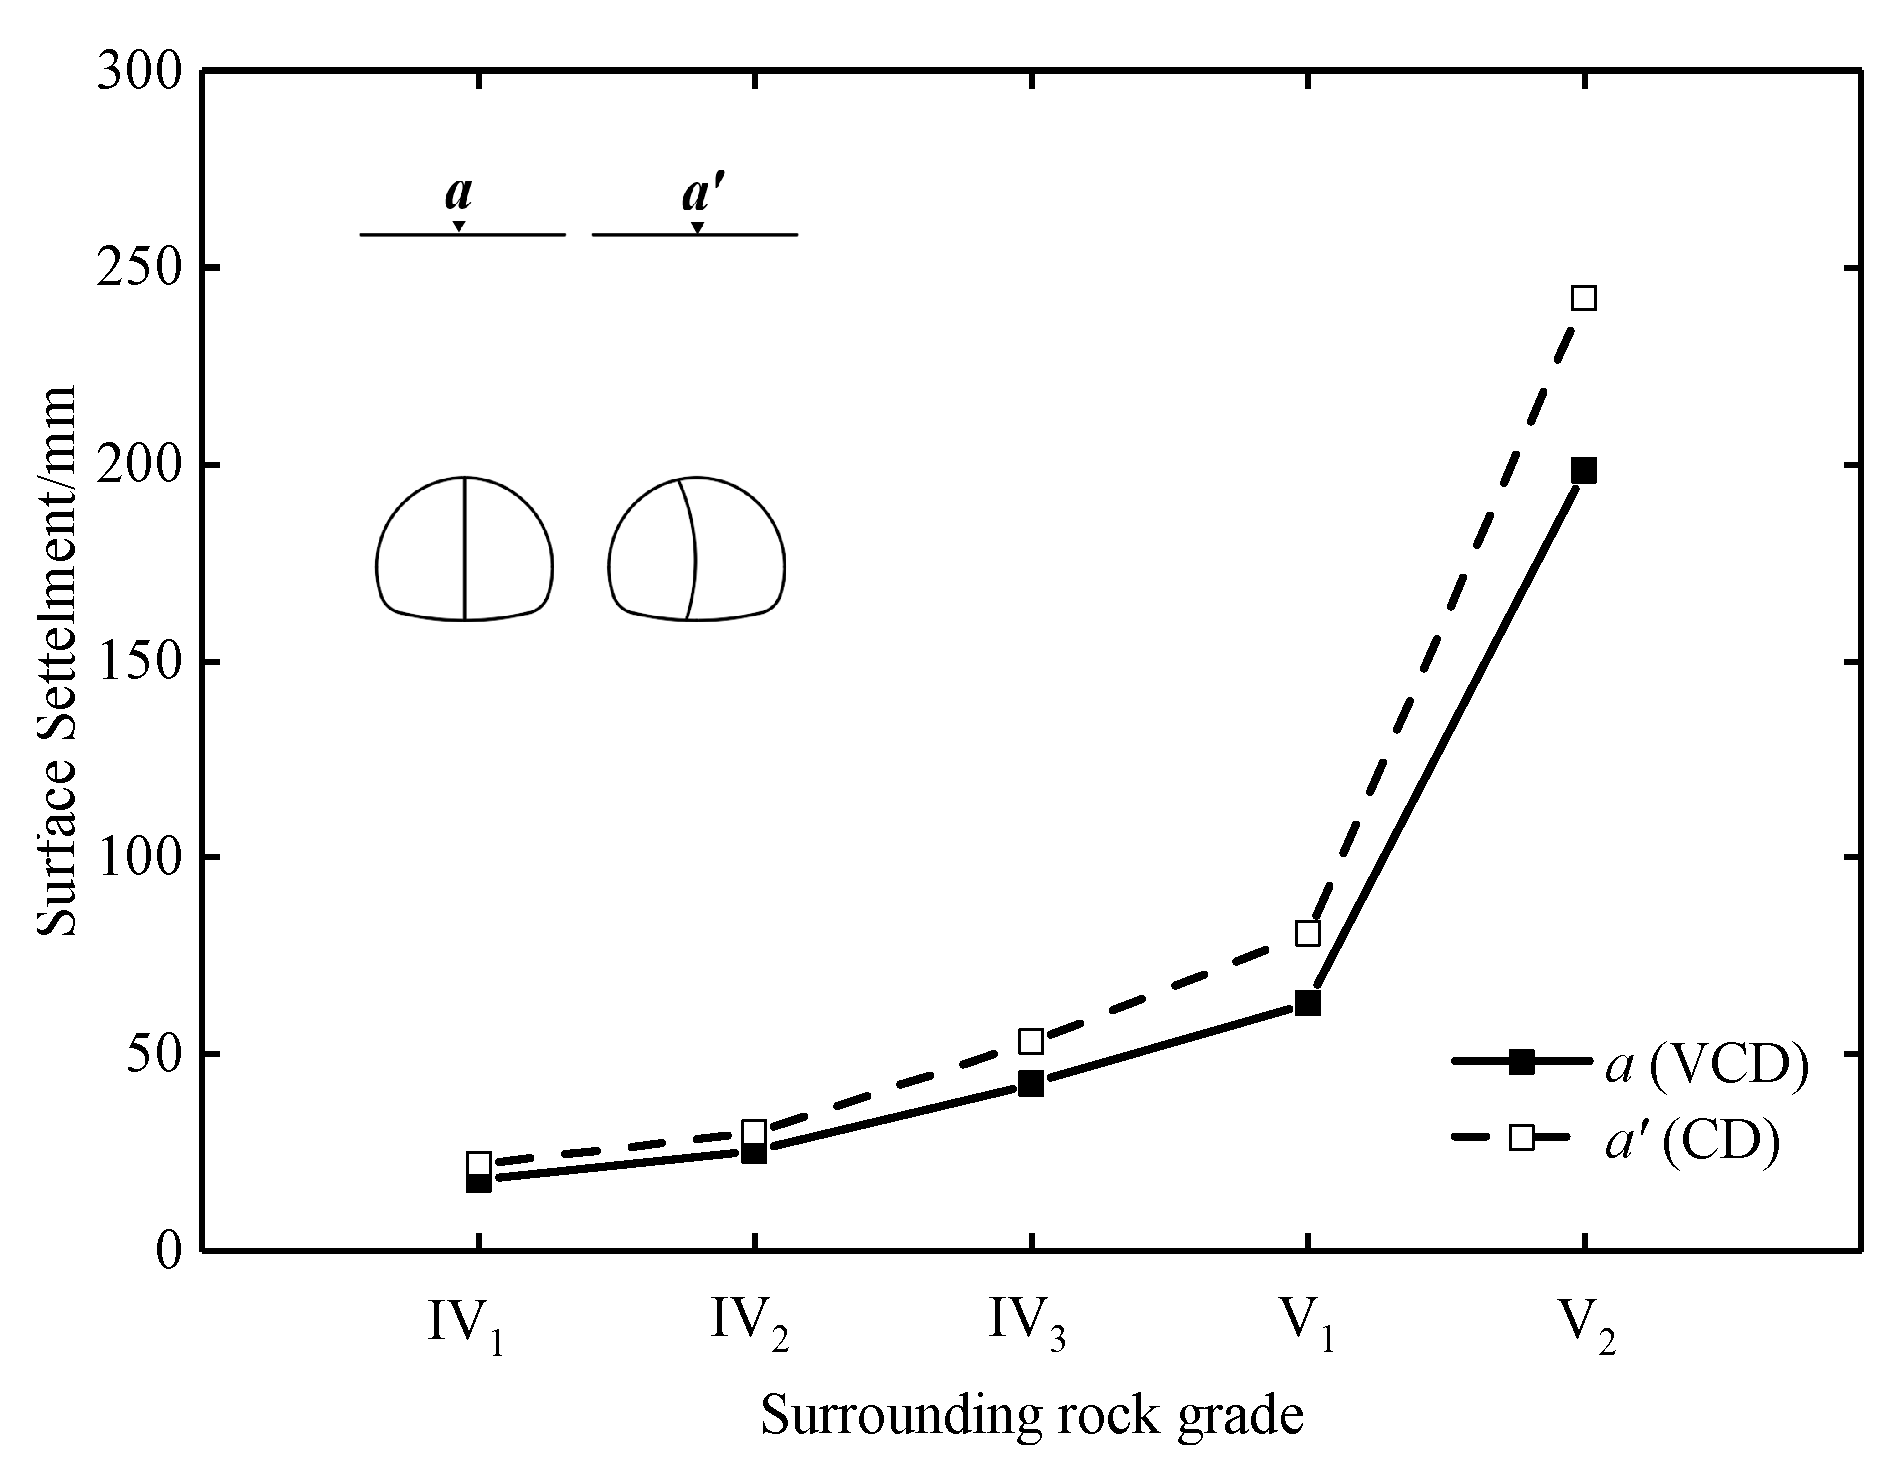
Figure 13 shows the relationship between the surface settlement and grade of surrounding rock in a buried depth of 20 m. It is clear that the surface settlements of the two methods have a similar trend of variation. As the surrounding rock changes from Grade IV1 to Grade V1, the surface settlement increases gradually, when it reaches Grade V2, the surface settlement increases rapidly. This is because the lower the surrounding rock strength, the larger the disturbance area caused by the tunnel construction, and the greater the impact on the surface. When the surrounding rock is Grade V2, the current strength of the support cannot meet the safety requirements of the project. As shown in Figure 13, the surface settlement of the CD method is 22.1–242.2 mm, and that of the VCD method is 18.2–198.4 mm. Compared with the CD method, the surface settlement of the VCD method is reduced by 17.6–24.8%, and the maximum reduced rate and minimum reduced rate are observed in Case2-2 and Case2-4, respectively. The results show that the surface settlement can be reduced with the VCD method by about 20% in a buried depth of 2D when the surrounding rock is Grade IV1 to Grade V2.
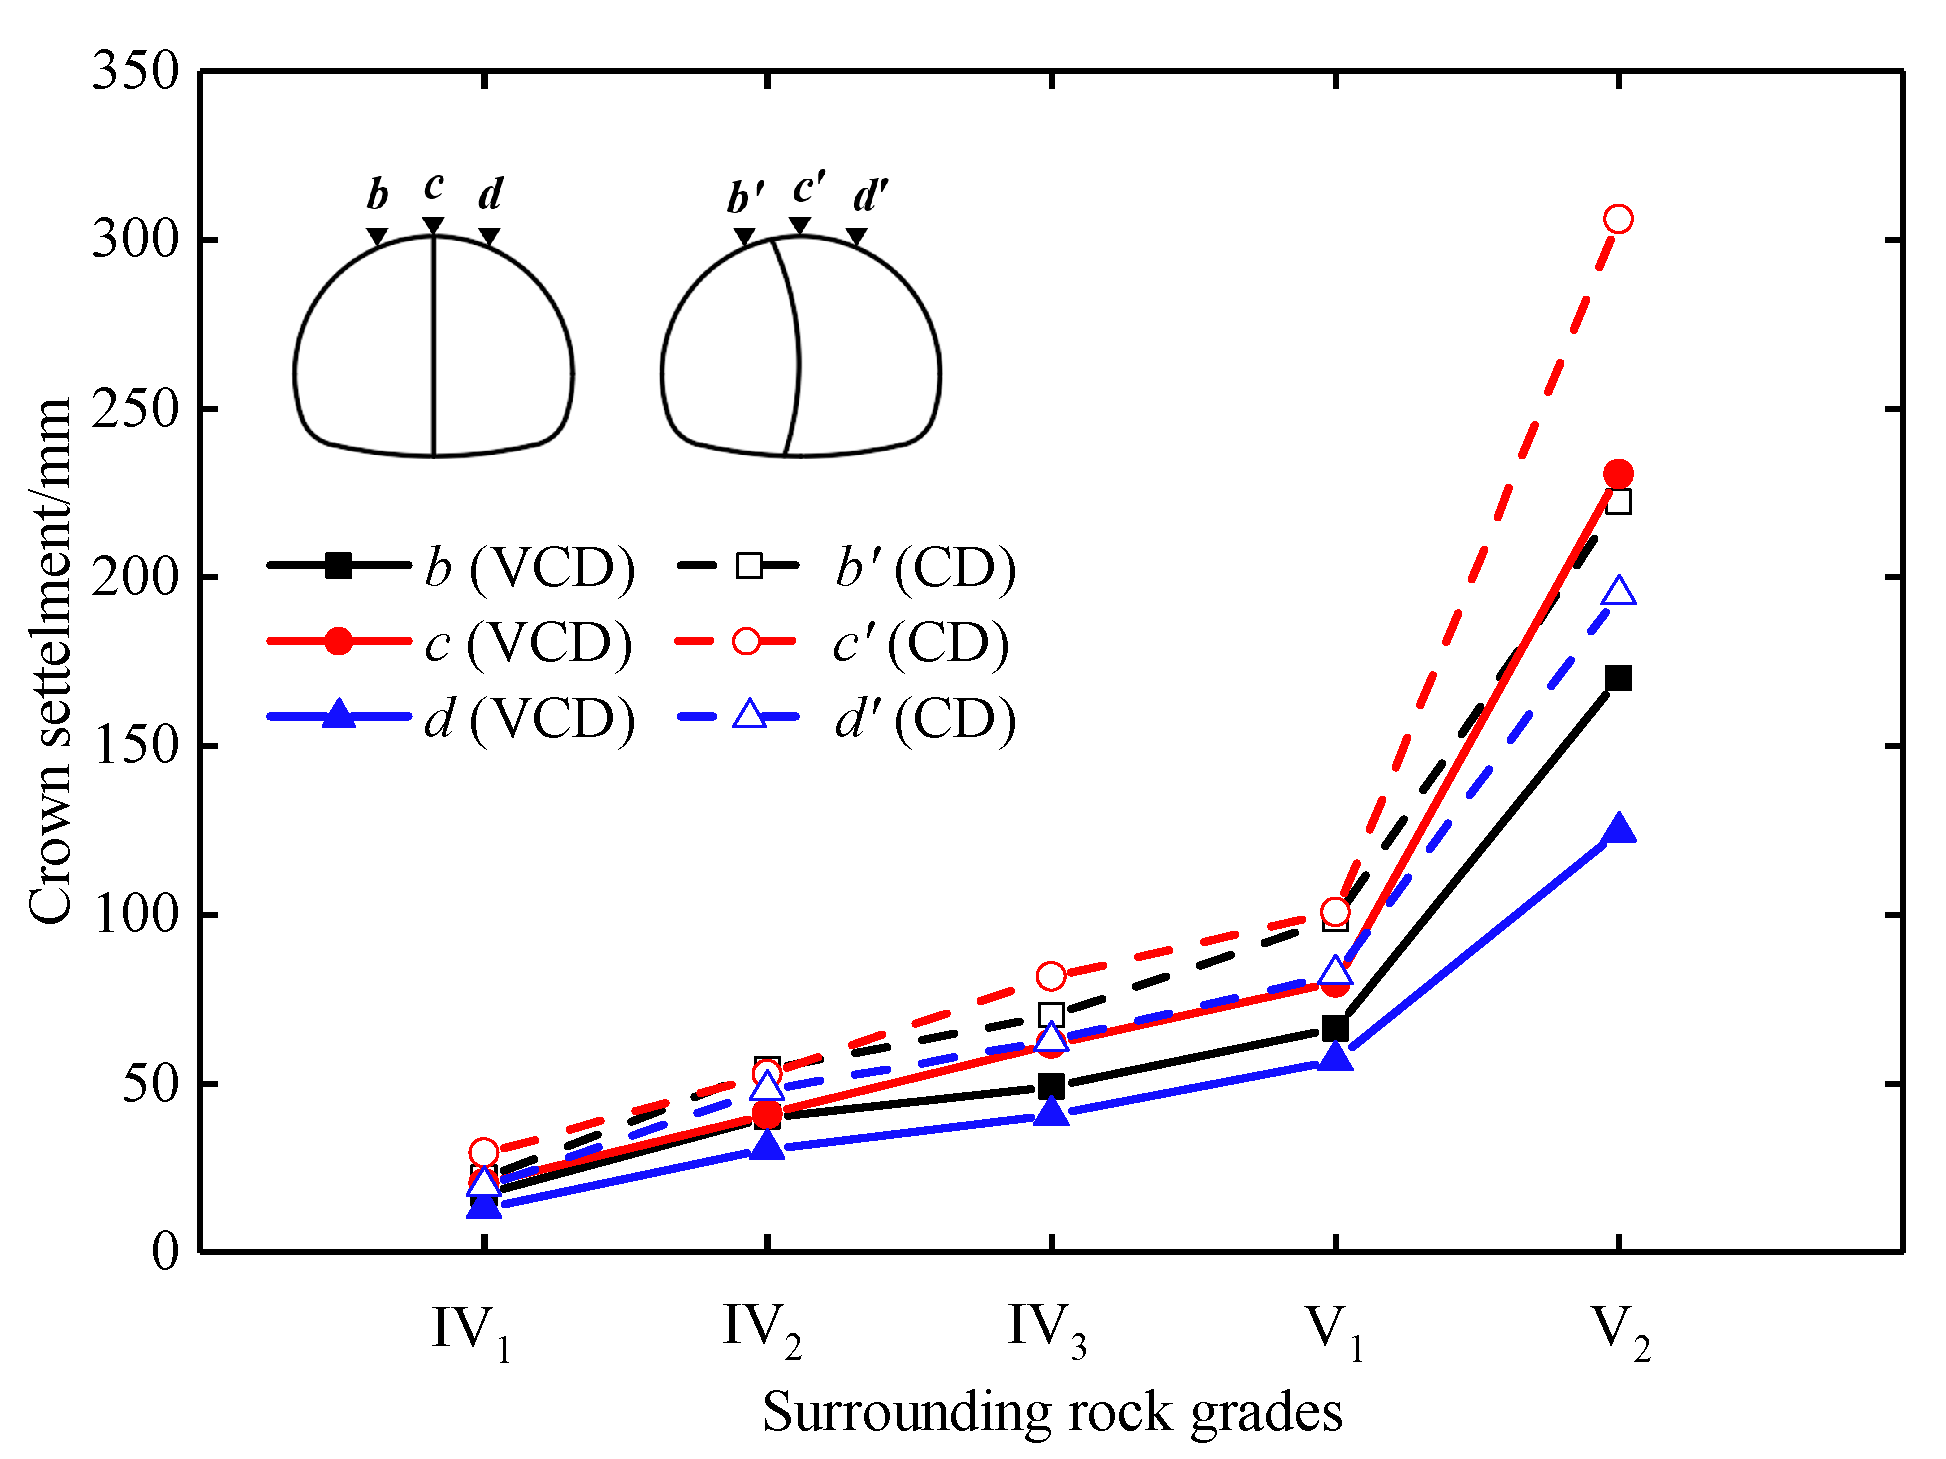
Figure 14 shows the relationship between the crown settlement and grade of surrounding rock in a buried depth of 20 m. It is clear that the variations in the crown settlements are similar to that of the surface settlements. This happens because the lower the surrounding rock strength, the larger the disturbance area caused by the tunnel construction, and the higher the pressure on the vault crown. Therefore, the crown settlements increase as the surrounding rock changes from Grade IV1 to Grade V. As shown in Figure 14, the left, middle, and right crown settlements of the CD method are 22.2–222.2, 29.4–306.2, and 19.8–194.8 mm, respectively, and those of the VCD method are 17.3–169.9, 20.4–230.4, and 13.1–124.5 mm, respectively. Compared with the CD method, the left, middle, and right crown settlements of the VCD method are reduced by 22.1–32.7%, 20.6–30.6%, and 30.9–36.6%, respectively. The results indicate that the crown settlement can be reduced by more than 20% with the VCD method in a buried depth of 20 m when the surrounding rock is Grade IV1 to Grade V2.
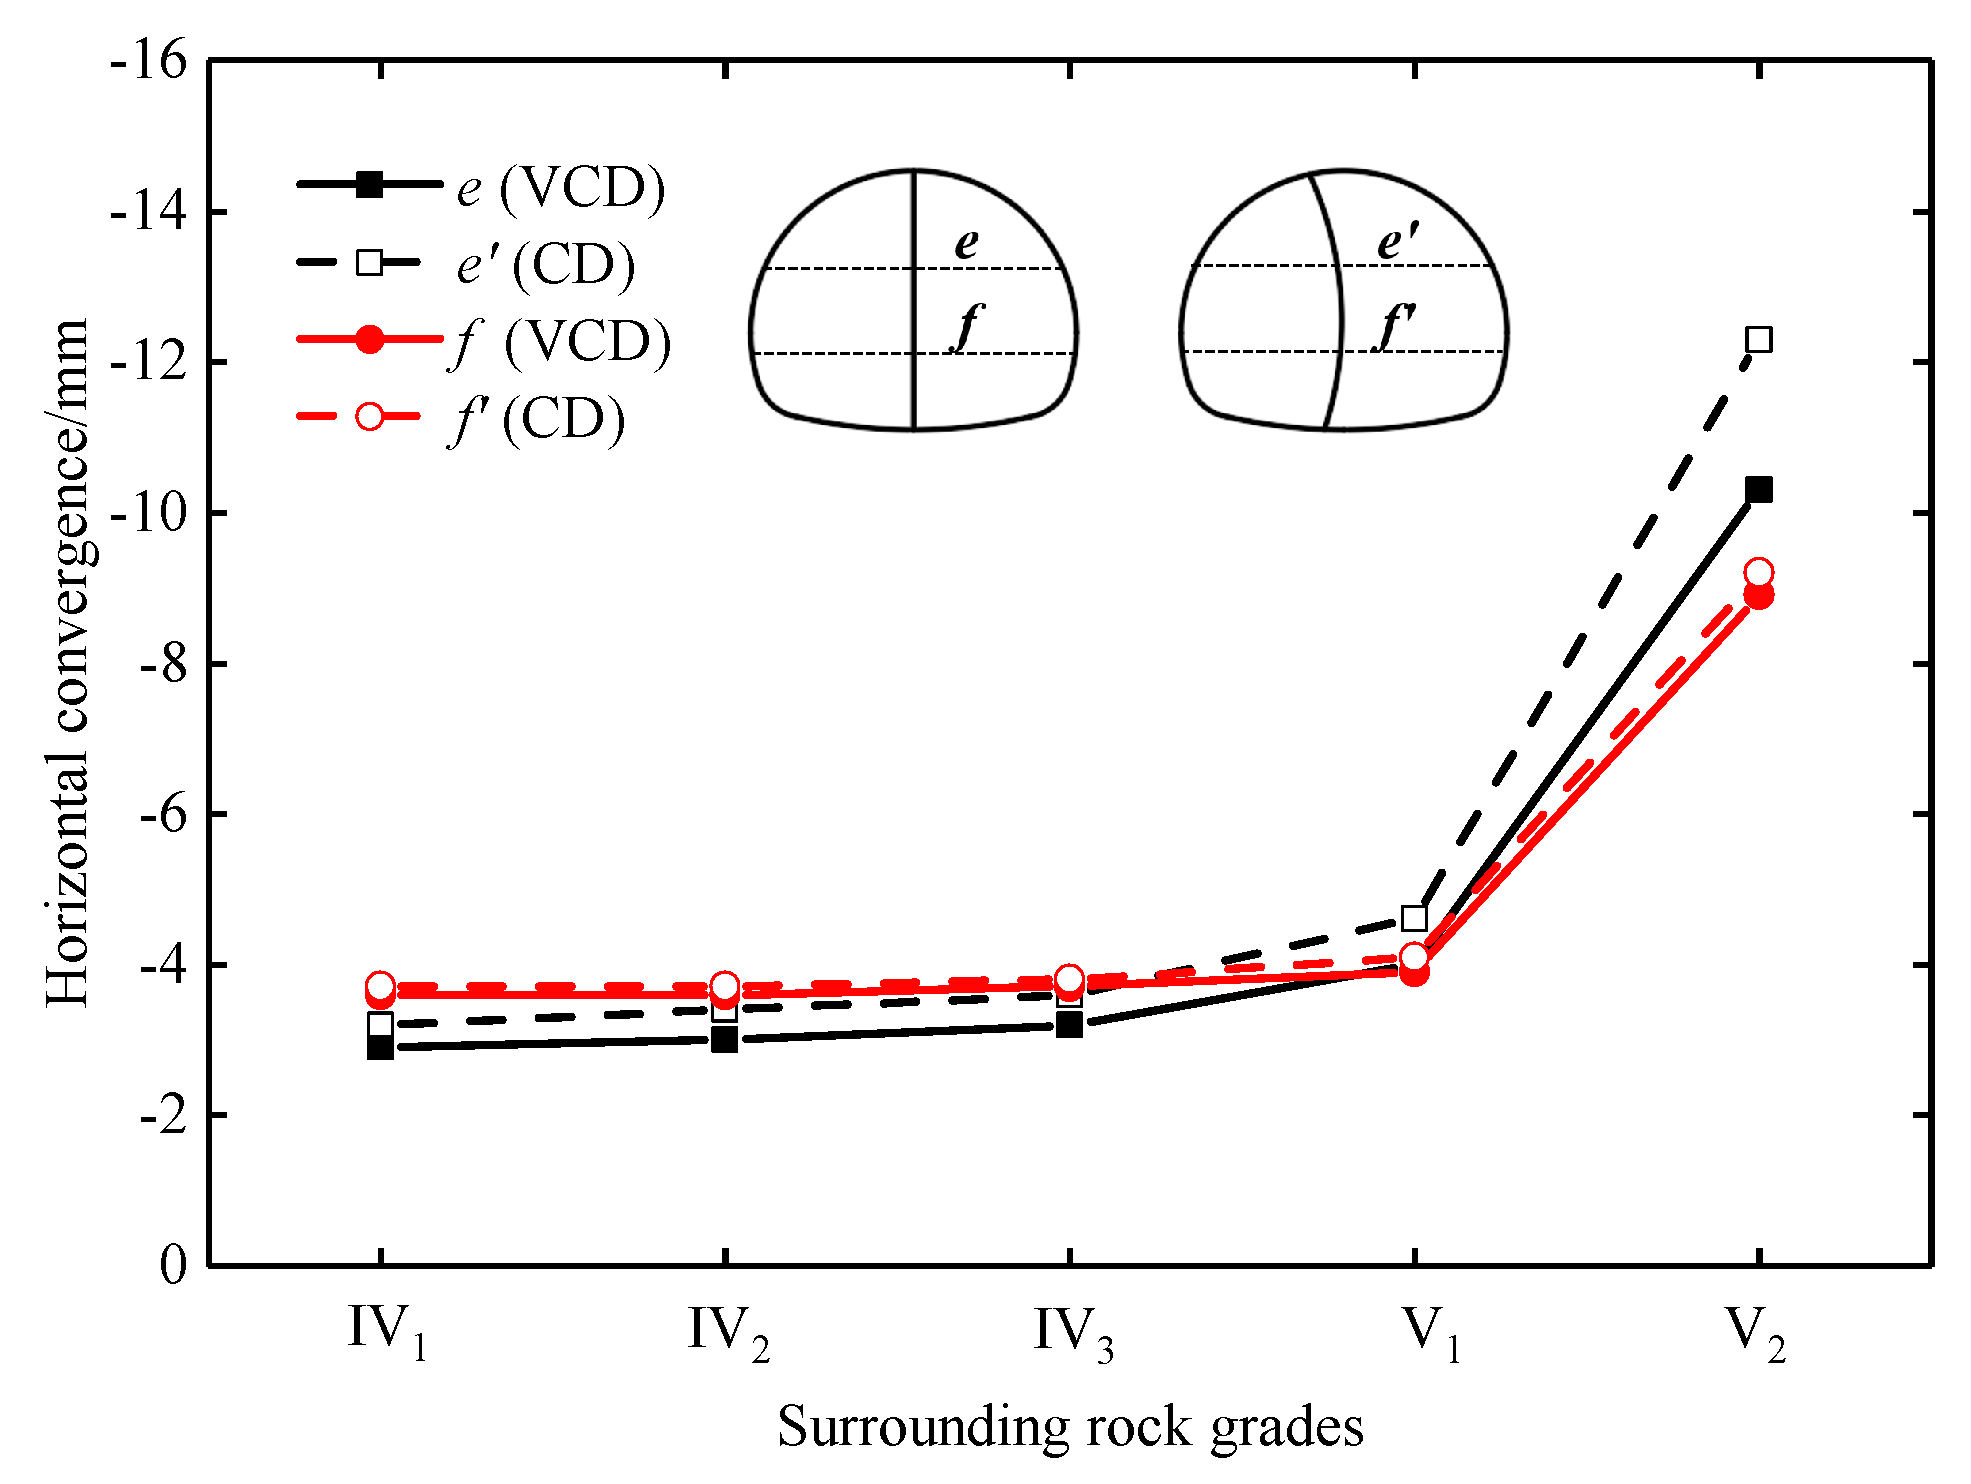
Figure 15 shows the relationship between the horizontal convergence and grade of surrounding rock in a buried depth of 20 m. The variations in the horizontal convergence are similar to that of the surface settlement and the crown settlements. This is because the crown settlement in Grade V2 surrounding rock is too large, which causes the global deformation of the primary support, resulting in a sudden increase in the horizontal convergence. As shown in Figure 15, the arch springing convergence of the CD method is 3.2–12.3 mm, and that of the VCD method is 2.9–10.3 mm. The side-wall convergence of the CD method is 3.7–9.2 mm, and that of the VCD method is 3.6–8.9 mm. Compared with the CD method, the arch springing convergence and the side-wall convergence of the VCD method are reduced by 9.4–16.3% and 2.6–4.9%, respectively. Furthermore, the reduced value of the horizontal convergence in each case is equal to or less than 2 mm. The results indicate that the VCD method has no significant effect on the reduction of the horizontal convergence in Grade IV and Grade V surrounding rock.
According to Equation (8), the allowed deformation values of the tunnel are calculated to be 80.9 mm in Grade IV surrounding rock and 129.4 mm in Grade V surrounding rock, respectively. Therefore, in Grade IV1–V1 surrounding rock, the VCD method could be a more appropriate choice than the CD method to meet the requirement of the surrounding rock stability.
4. Deformation Process and Mechanical Properties
4.1. Finite-Difference Models and Parameters
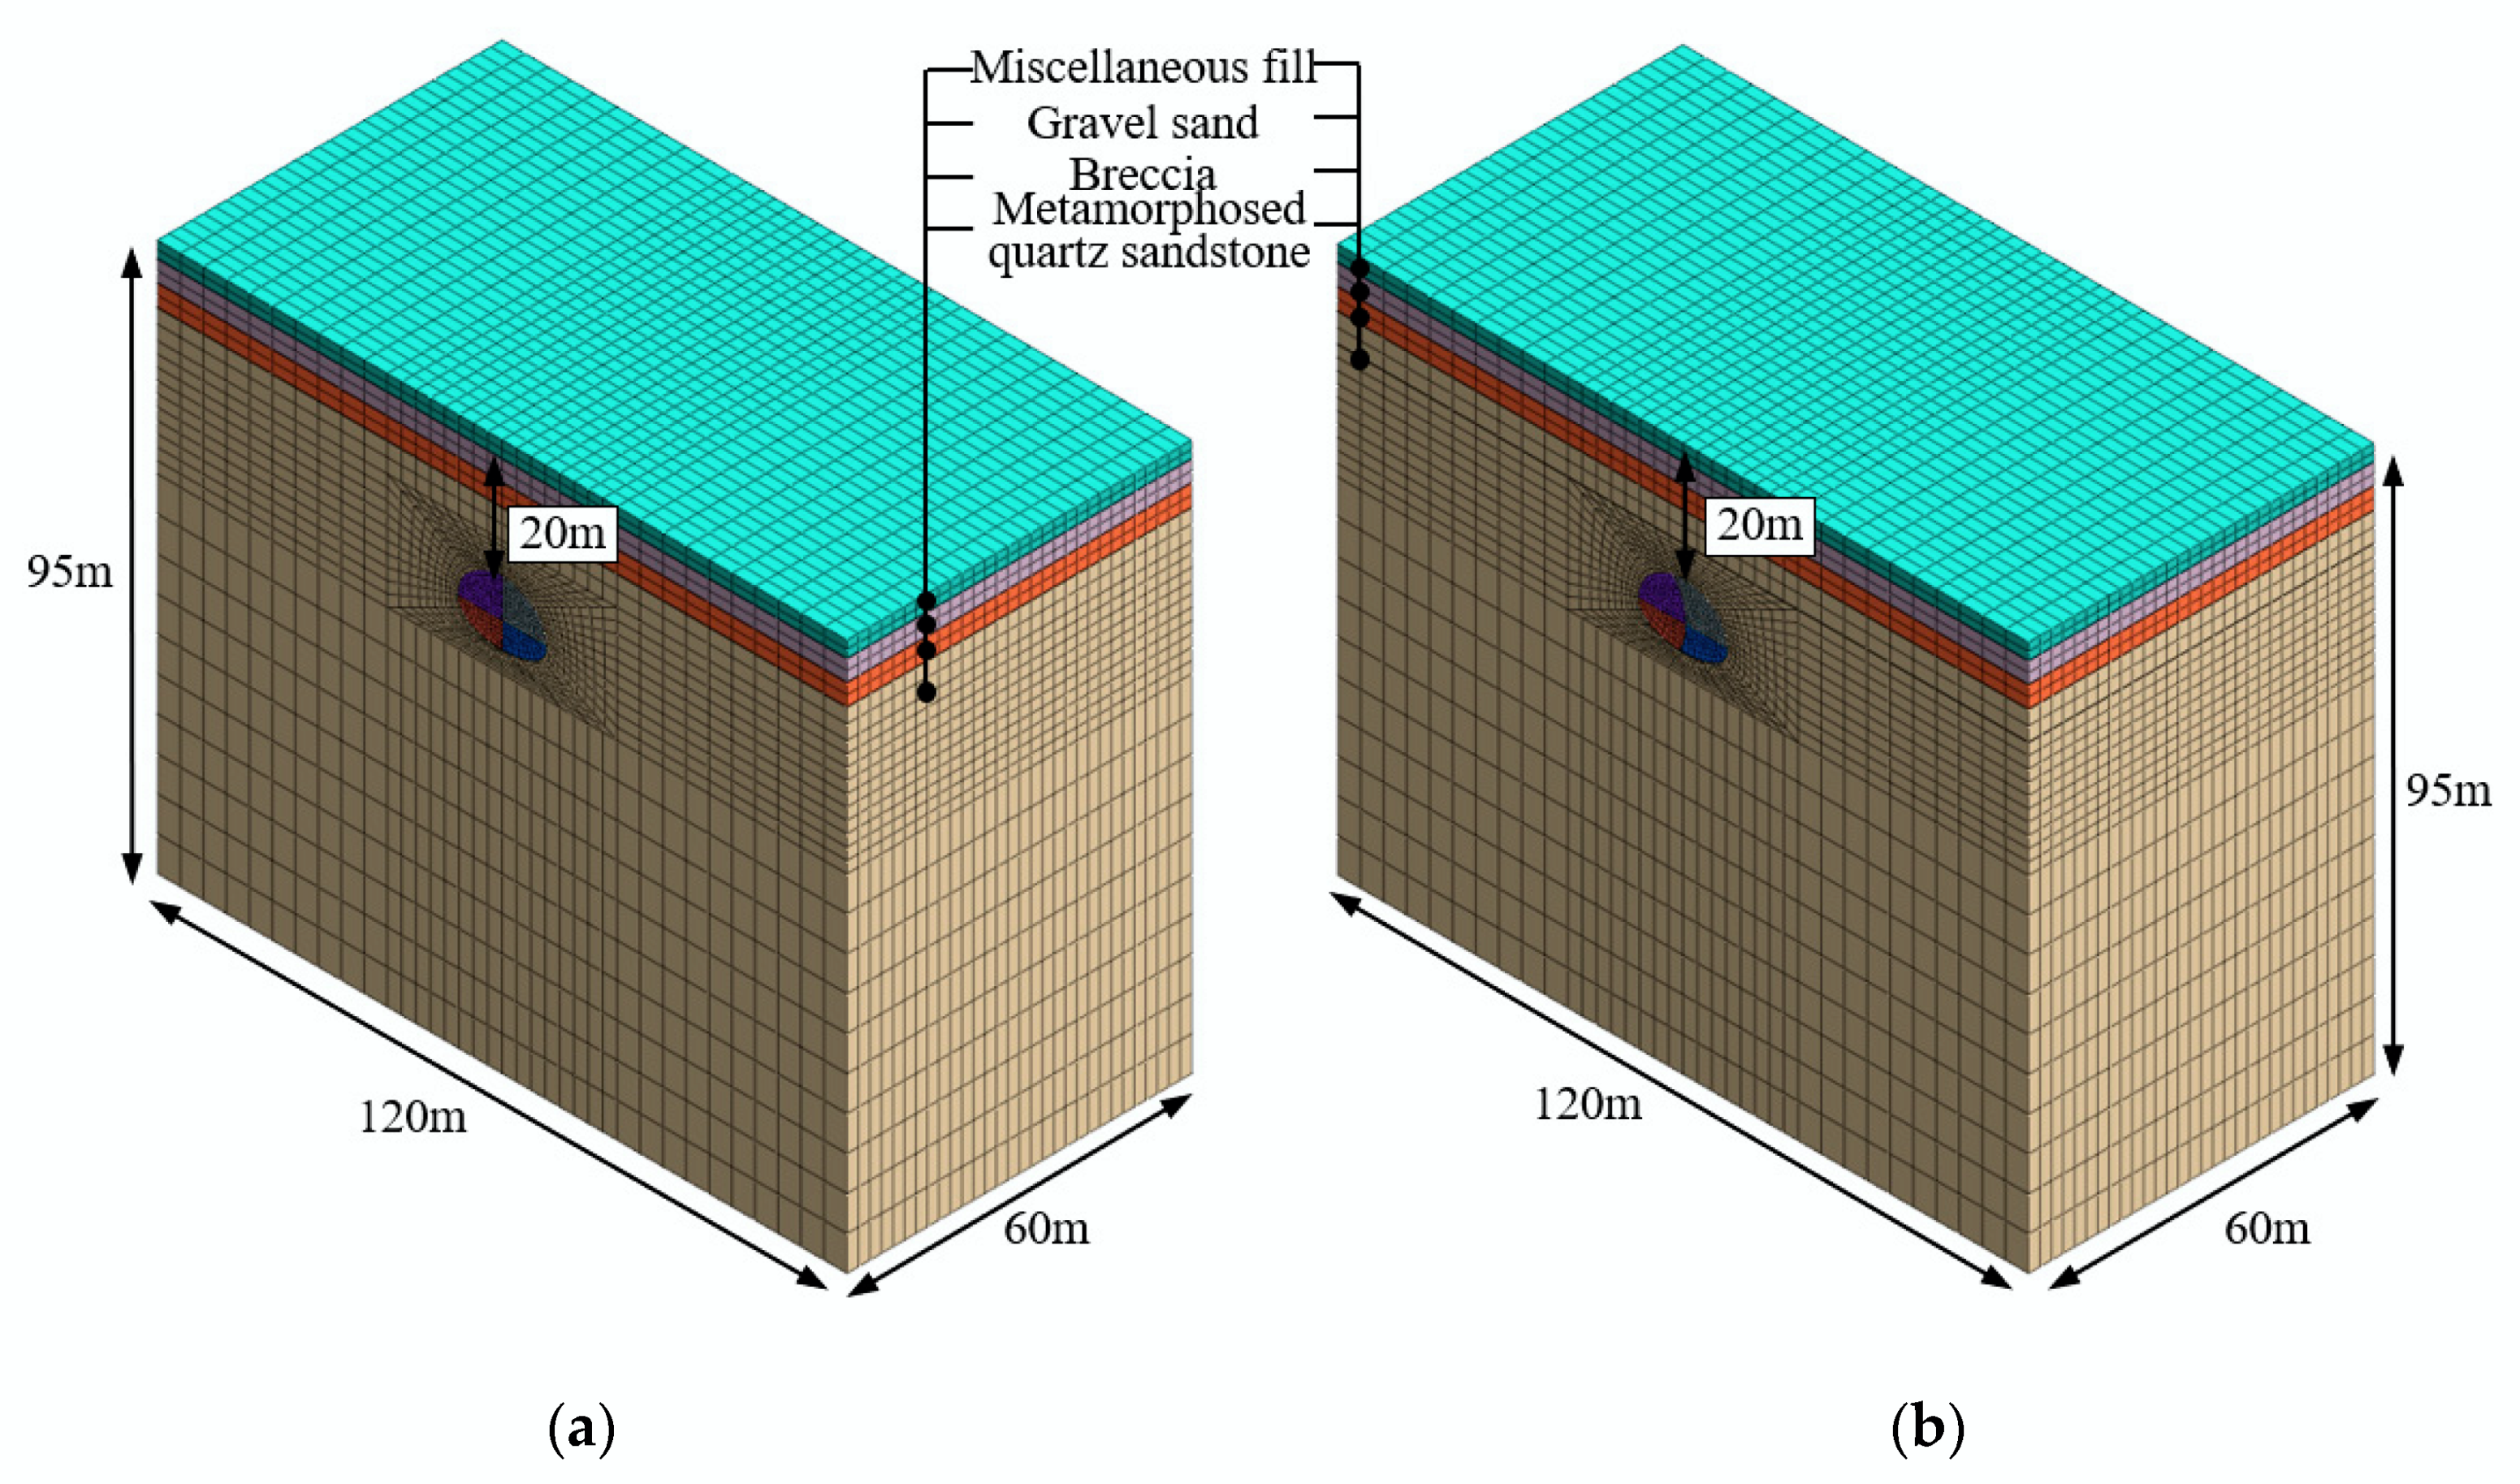
In order to study the deformation process and mechanical properties of the two methods, three-dimensional finite-difference models for the Shenzhen Eastern Transit Expressway Connection Line Tunnel were established by the FLAC3D software. As shown in Figure 16, the dimensions of X, Y, and Z are 120, 60, and 95 m, respectively, and the tunnel has a buried depth of 20 m. The number of elements and nodes in the model for the VCD method is 49,320 and 52,669, respectively, and that in the model for the CD method is 49,950 and 53,258, respectively. The constitutive relation used in the models is the modified Cam-clay model. Surrounding rocks and structures were simulated by solid elements and shell elements, respectively. In order to improve the calculation efficiency, the complicated stratigraphy was simplified by assuming that the thickness of each soil layer is uniform. The thickness of each soil layer in the models was determined by the average value of each soil layer thickness. As shown in Figure 17, the upper ground consists of a 2.8 m-thick miscellaneous fill layer, a 3.6 m-thick fully weathered gravel sand layer, and a 3.7 m-thick strongly weathered breccia layer. Under that, there is a slightly weathered metamorphosed quartz sandstone through which the tunnel passes. The models in Figure 16 are symmetrical in structure.
The boundary conditions are as follows. The displacement perpendicular to the lateral surfaces was restrained while the vertical displacement was allowed. There was no vertical or horizontal displacement on the bottom surface, and the top surface was not constrained.
According to the guidelines [22] and the geological exploration report, the calculation parameters for the surrounding rock were determined, as presented in Table 6. The calculation parameters for the structures are the same as those of Section 3.1, as presented in Table 5. The arrangement of measuring points is the same as that of Section 3.1, as shown in Figure 8.
4.2. Comparison of Surface Settlement
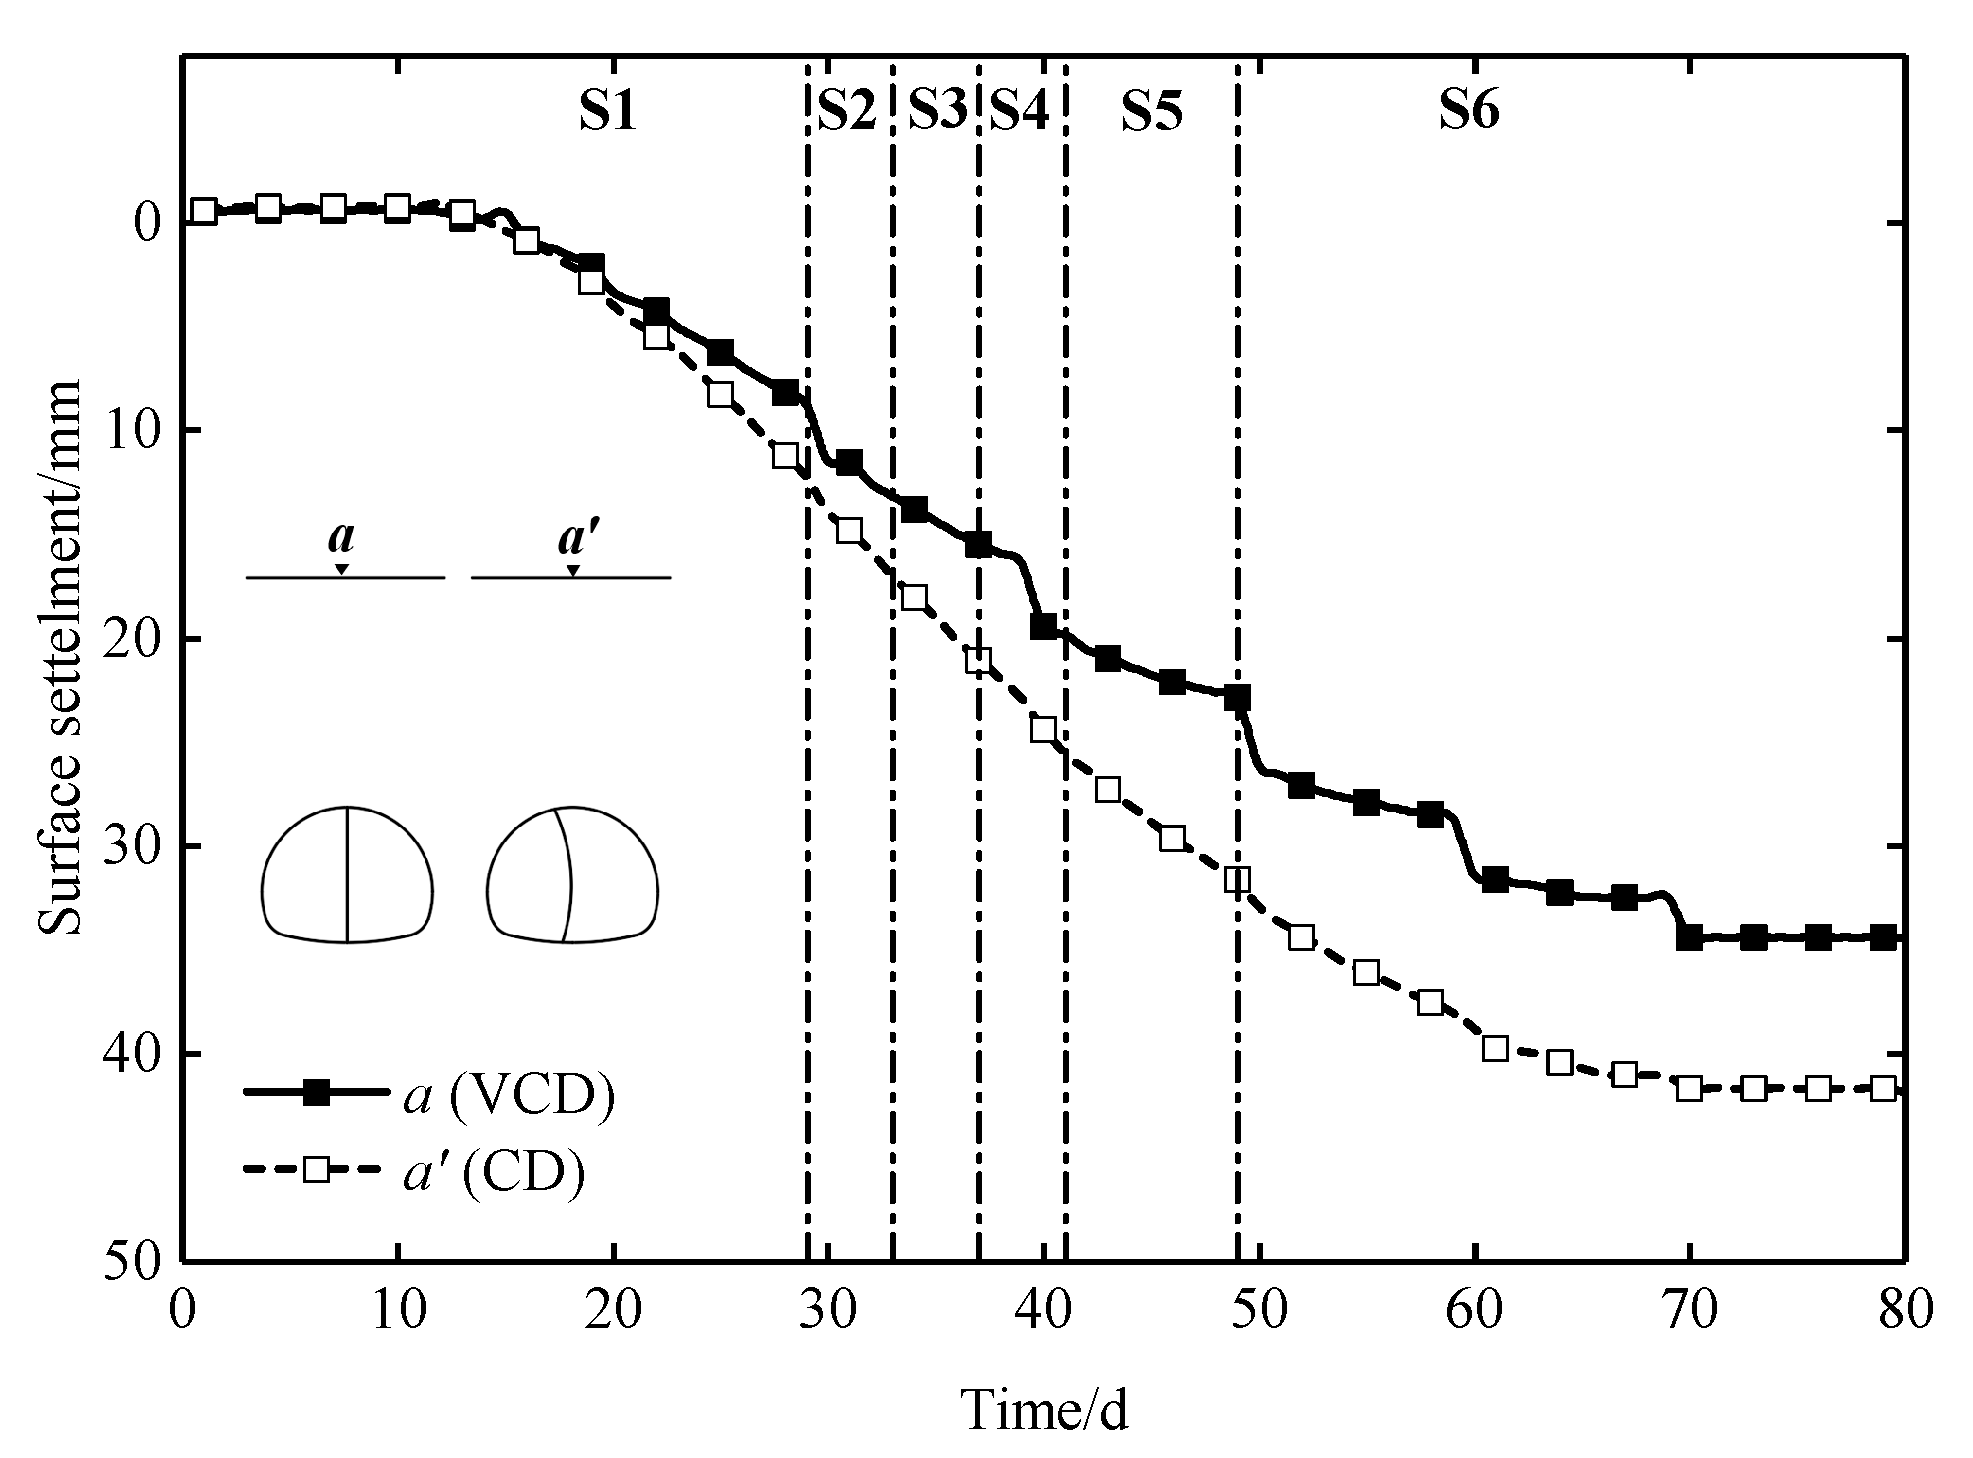
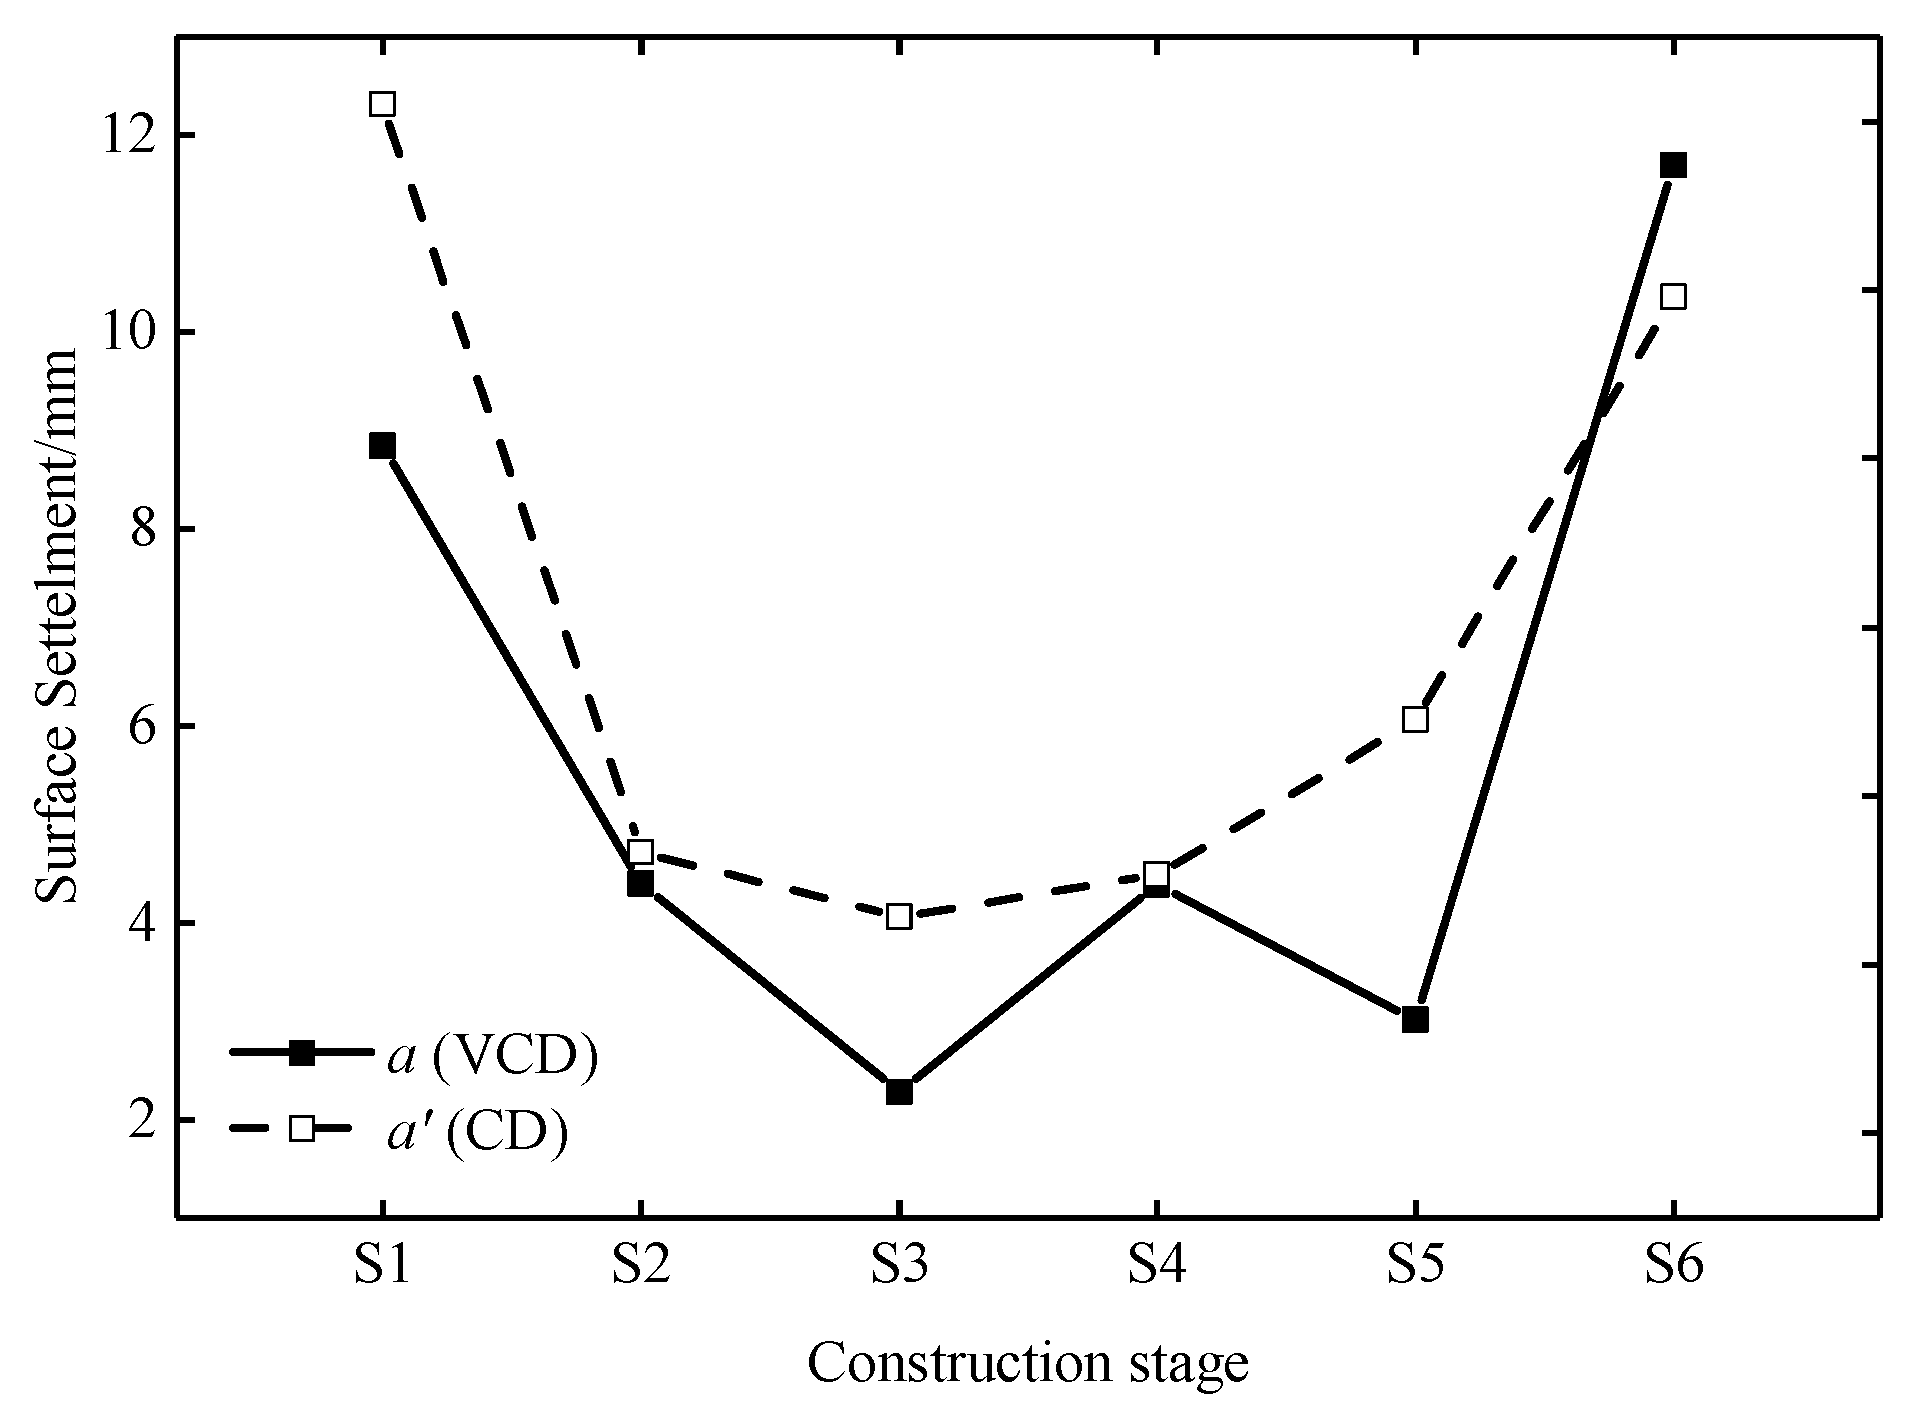
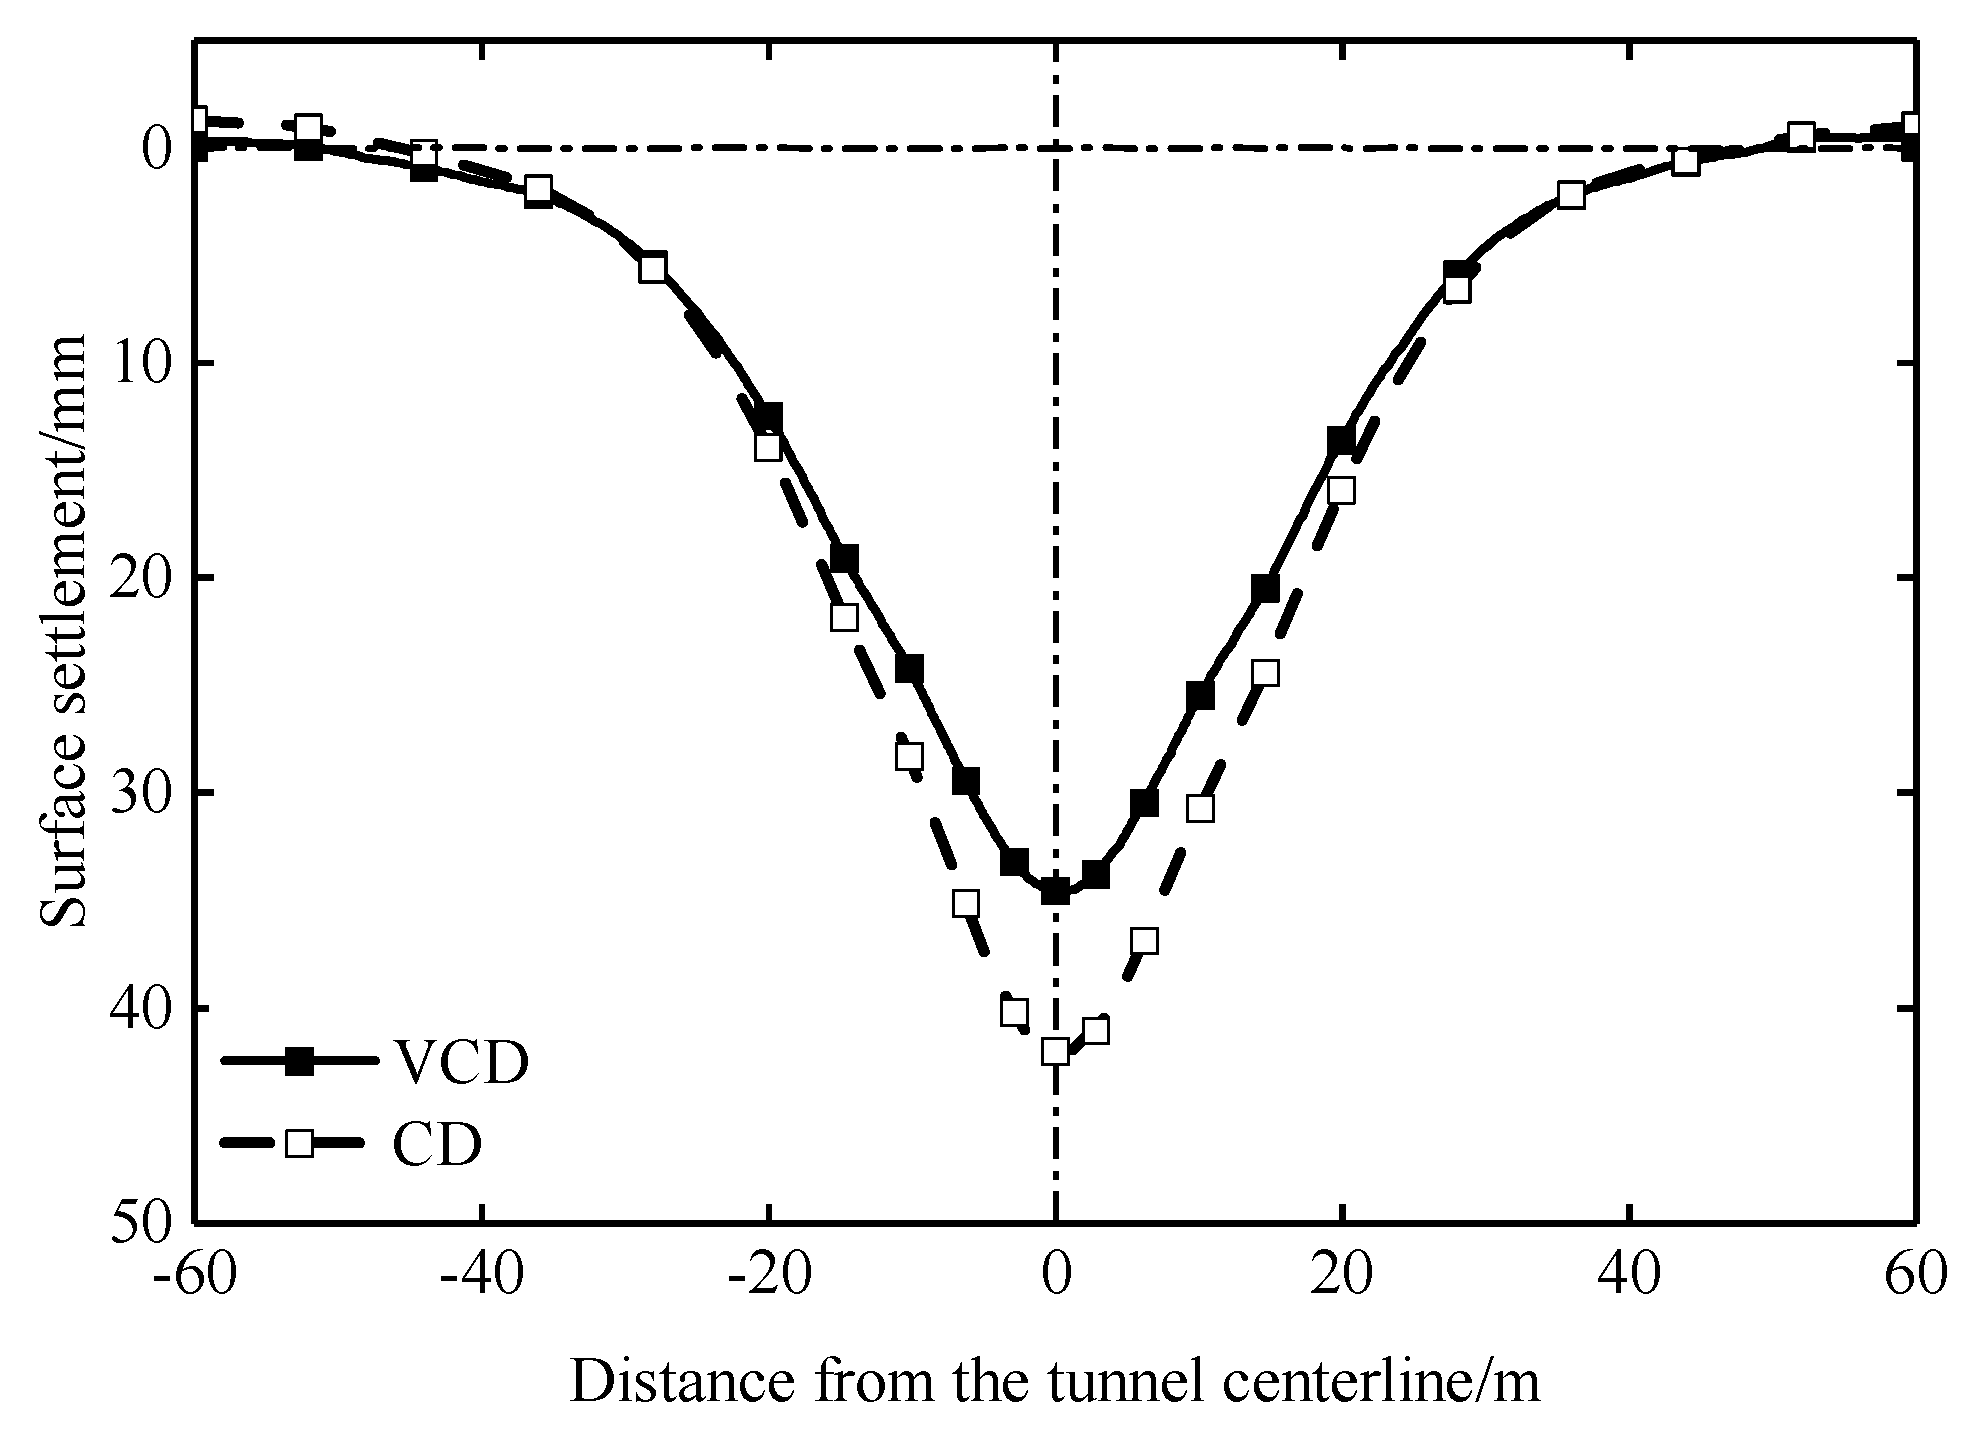
The time history curves of the surface settlement at the measuring points a (VCD model) and aʹ (CD model) are shown in Figure 18. The two points begin to settle almost at the same time. The time history curve of the surface settlement with the VCD method is stepped, and that with the CD method is smooth. Compared with the CD method, the total surface settlement of the VCD method is reduced by 18%. The comparison of the surface settlement in each construction stage is shown in Figure 19. The surface settlements of the VCD method in Stage 1, 2, 3, 4, and 5 are smaller than those of the CD method, while the surface settlement of the VCD method in Stage 6 is larger. The reduced values of the surface settlement in Stage 1, 2, 3, 4, 5, and 6 are 3.5, 0.3, 1.8, 0.1, 3.1, and -1.3 mm, respectively. This is because the support structure forms a closed cycle in Stage 3 and Stage 5, and the supporting performance of the vertical center diaphragm can be exerted well. The comparison of the settlement troughs is shown in Figure 20. The widths of the settlement troughs of the two methods are approximately equal, and the value is 90m(9D), while the depths of the settlement troughs of the two methods are different, and the values are 34.6 and 42.0 mm, respectively. Furthermore, the settlement tanks are symmetrical along the tunnel centerline.
The results indicate that the surface settlement within 20m(2D) from both sides of the tunnel centerline can be significantly reduced with the VCD method mainly in the pre-construction stage and excavation stage. When the center diaphragm is demolished, the surface settlement of the VCD method will increase suddenly. Therefore, the monitoring frequency should be increased and appropriate auxiliary measures should be taken to reduce the potential safety hazards caused by the demolition of the center diaphragm in the VCD method.
4.3. Comparison of Crown Settlement
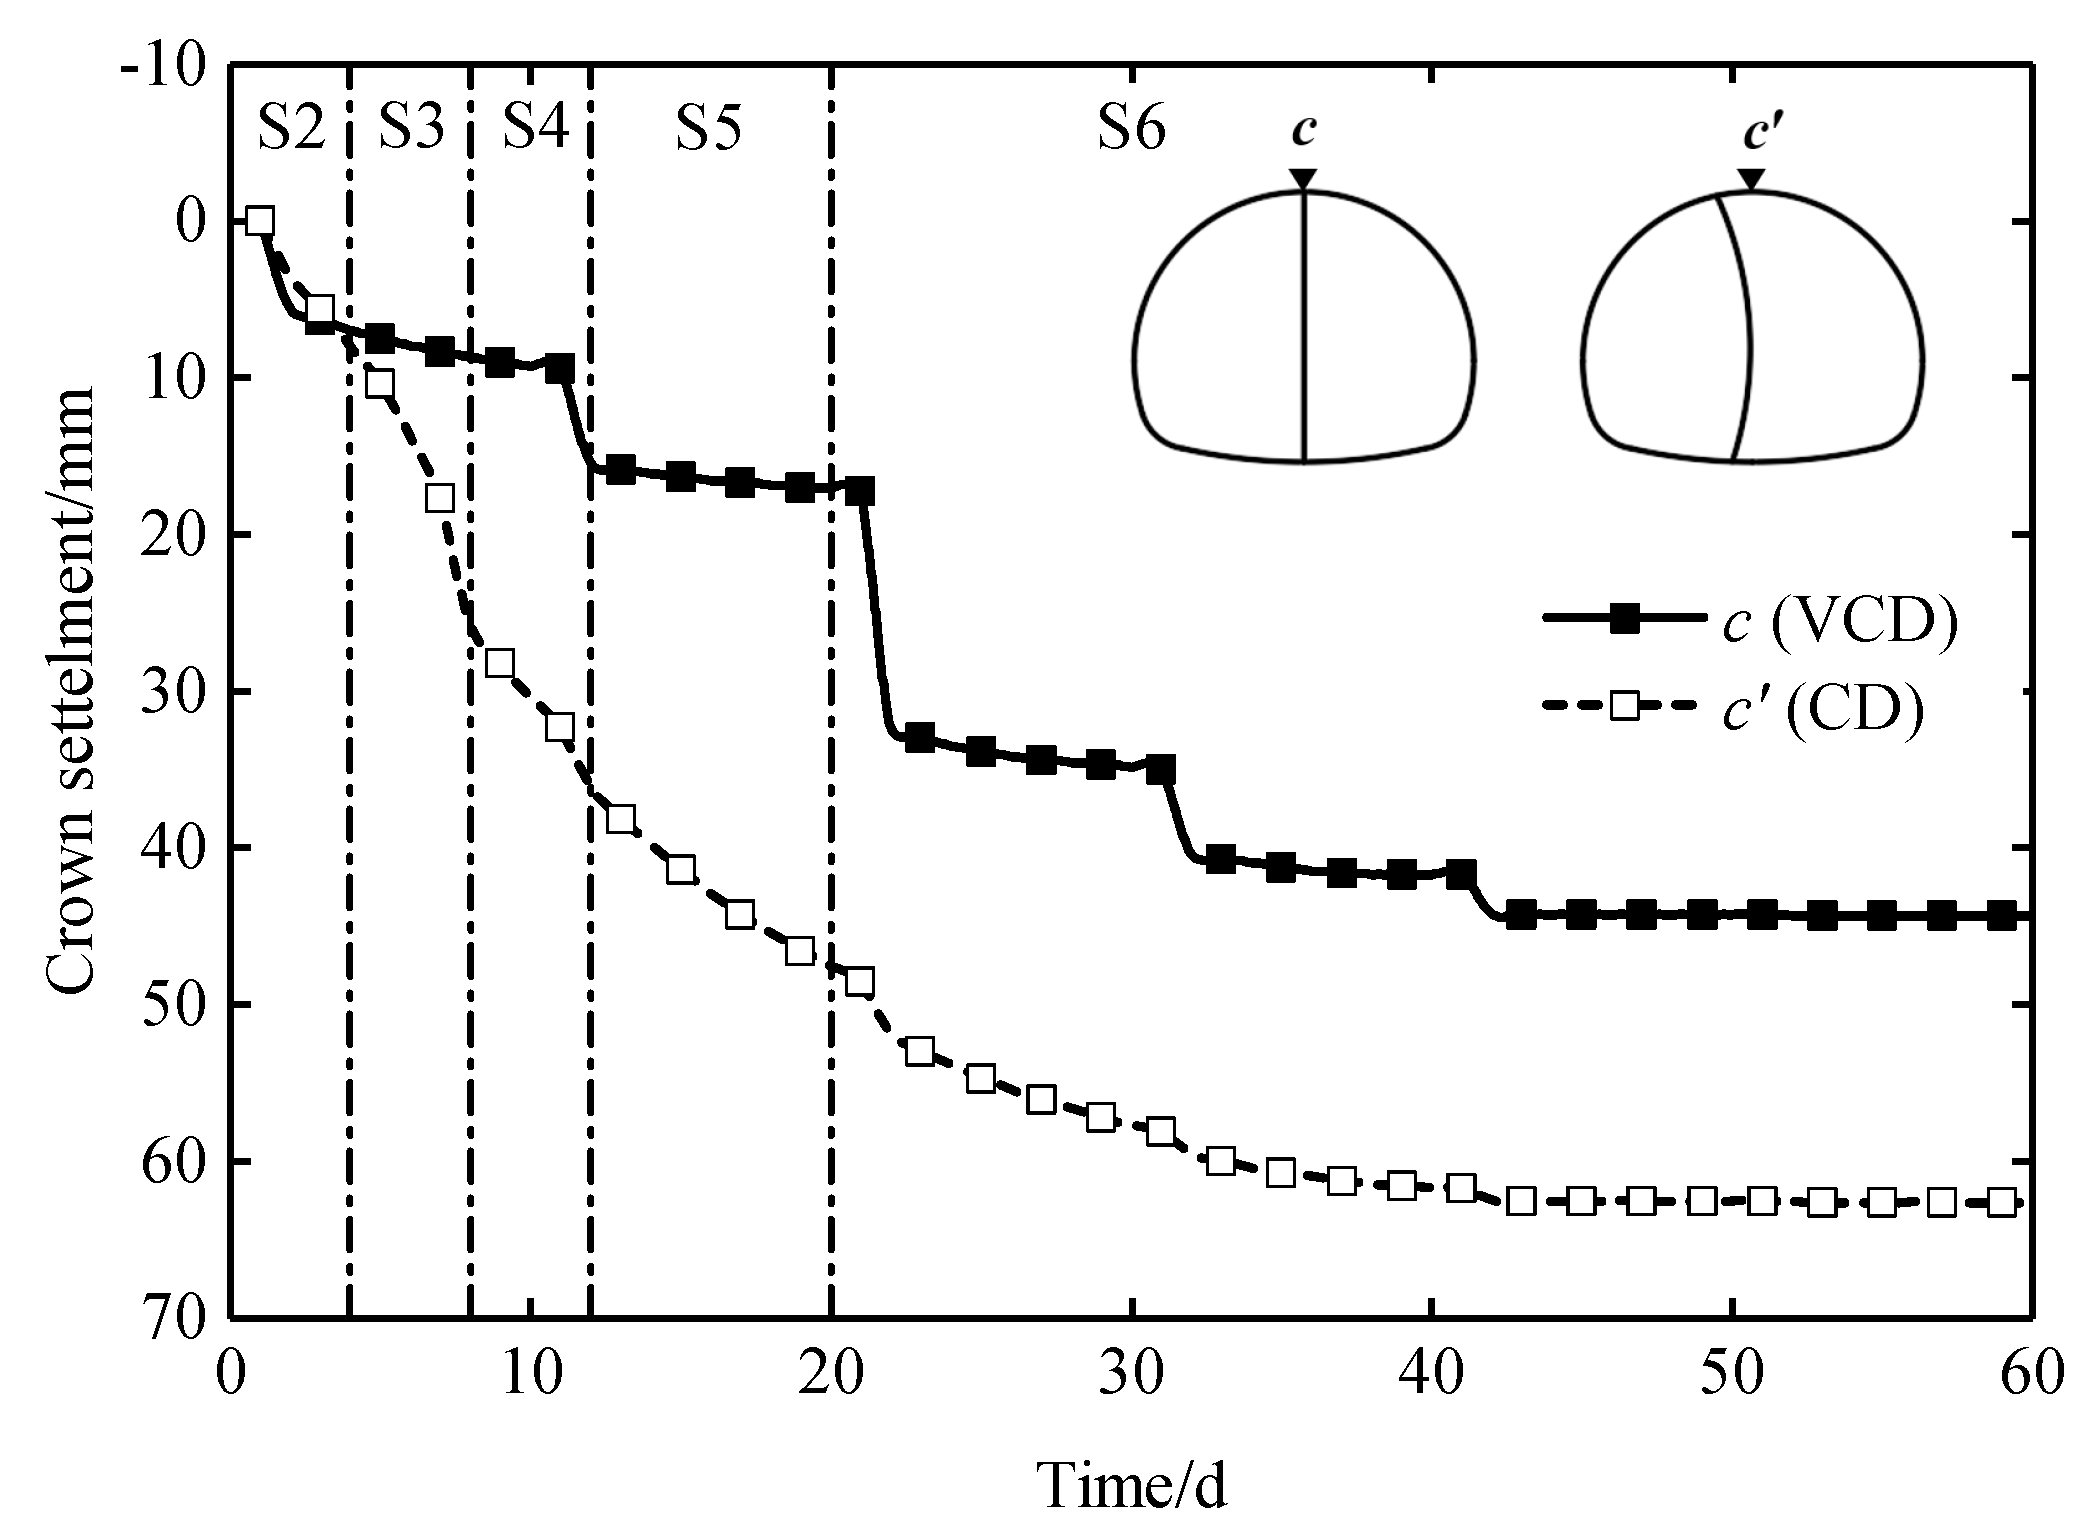
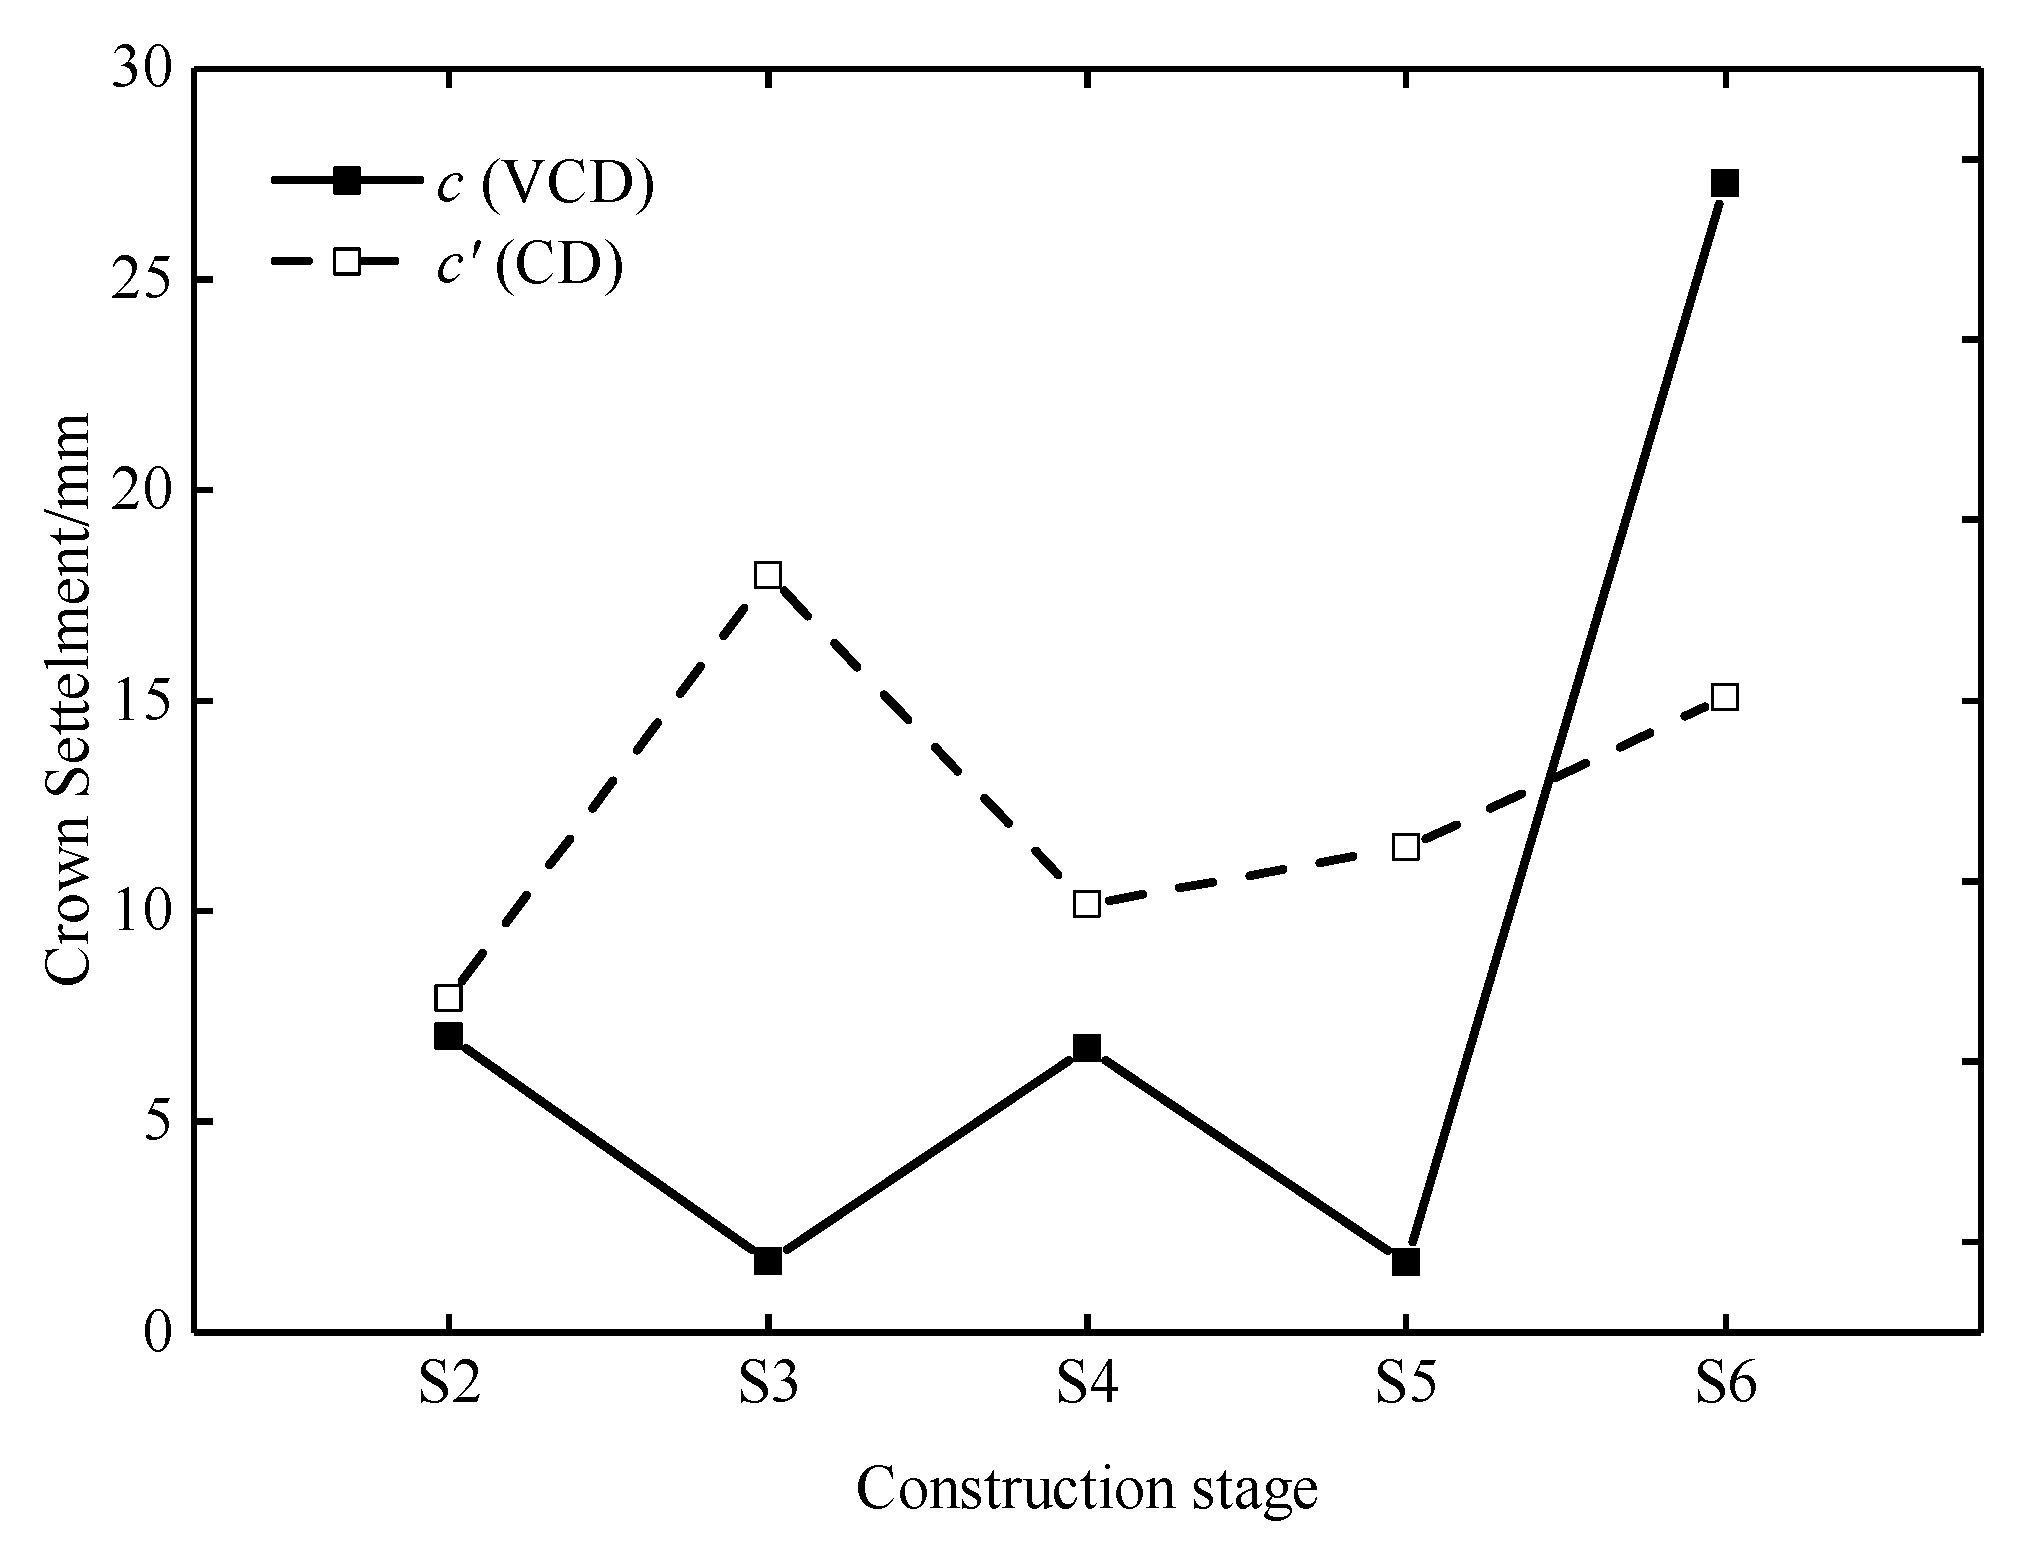
The time history curves of the crown settlement at the measuring points c (VCD model) and cʹ (CD model) are shown in Figure 21. It is observed that the growth trend of the crown settlement is similar to that of the surface settlement. Compared with the CD method, the total crown settlement of the VCD method is reduced by 29%. In Stage 2, as the support structure is not closed, the settlement rates of the two methods are approximately the same and relatively fast. In Stage 3, 4, and 5, the crown settlement of the CD method still increases rapidly, while that of the VCD method increases slowly and has a sudden change caused by the demolition of the center diaphragm of the previous construction cycle. In Stage 6, the crown settlement of the CD method increases more and more slowly, and stabilizes at 62.6 mm, while that of the VCD method first increases sharply, and stabilizes at 44.4 mm. The crown settlement caused by the demolition of the center diaphragm of the VCD method accounts for 34% of the total crown settlement. The comparison of the crown settlement in each construction stage is shown in Figure 22. The crown settlements of the VCD method in Stage 2, 3, 4, and 5 are smaller than those of the CD method, while the crown settlement of the VCD method in Stage 6 is larger. The reduced values of the crown settlement in Stage 2, 3, 4, 5, and 6 are 0.9, 16.3, 3.4, 9.8, and -12.2 mm, respectively. The results indicate that the crown settlement caused by excavation can be reduced with the VCD method.
4.4. Comparison of Horizontal Convergence
The time history curves of the horizontal convergence are shown in Figure 23. The growth trend of the horizontal convergence is similar to that of the crown settlement. This proves that the horizontal convergence is related to the crown settlement due to the global deformation of the primary support. The horizontal convergence caused by the demolition of the center diaphragm of the VCD method accounts for more than 60% of the total value. The difference values of the arch springing convergence and side-wall convergence between the two methods are 0.3 and 0.2 mm, respectively. The results indicate that the VCD method has no significant effect on reducing the horizontal convergence.
4.5. Comparison of Internal Forces on Center Diaphragm
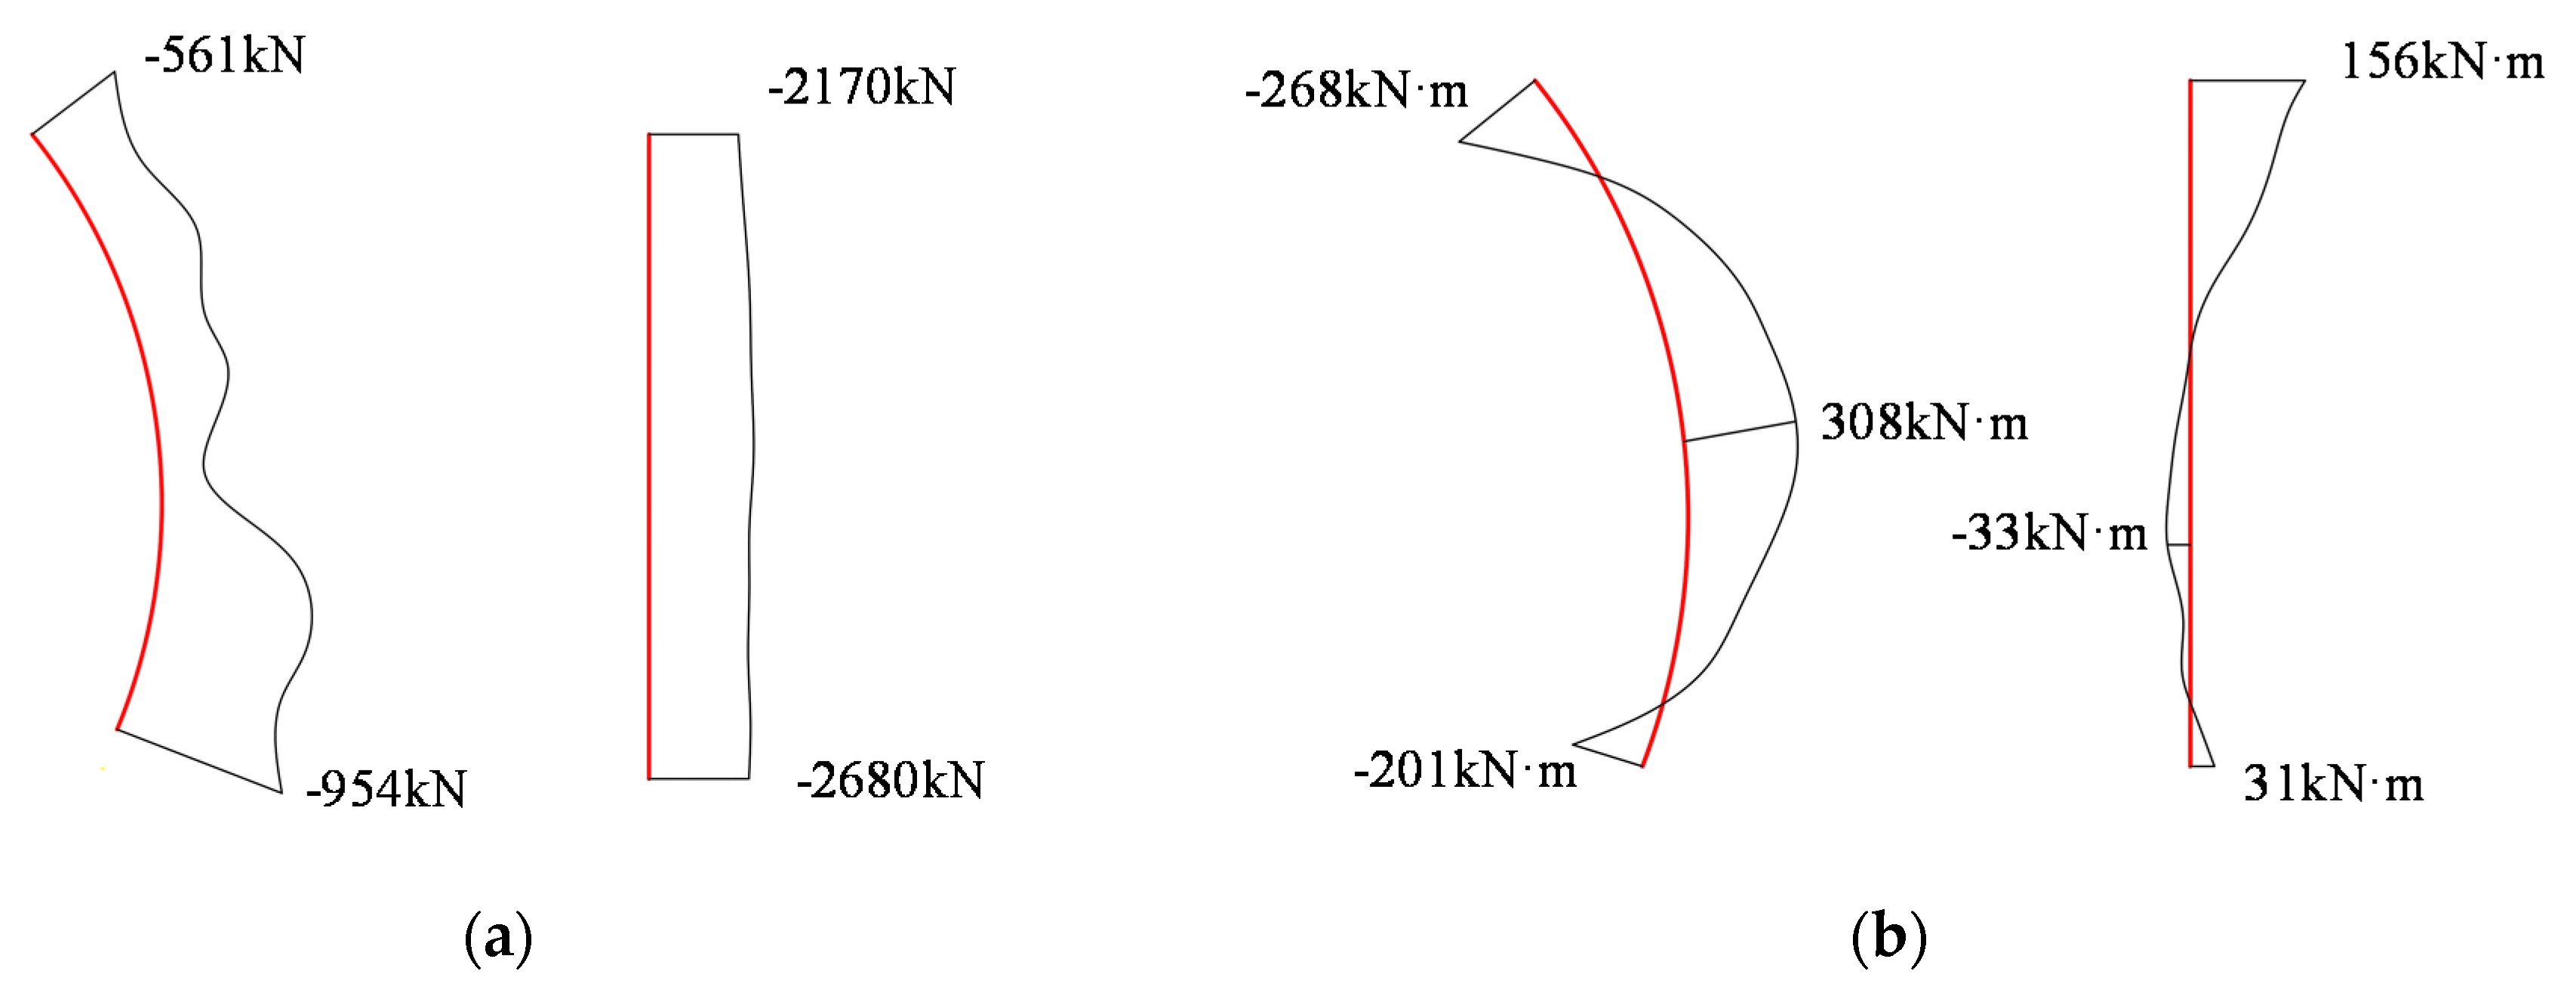
The connection between the center diaphragm and the primary support is the weak node of the CD method, which poses a significant threat to construction safety. The internal forces of the center diaphragm are shown in Figure 24. As shown in Figure 24a, the axial force distribution of the curved center diaphragm is uneven, which is large at both ends and small in the middle, while the axial force distribution of the vertical center diaphragm ranges between 2170 and 2680 kN. The maximum axial force of the vertical diaphragm is about three times that of the curved diaphragm. This shows that the vertical diaphragm can transfer the surrounding rock pressure from the crown more effectively. As shown in Figure 24b, the bending moment of the curved center diaphragm is negative at both ends and positive in the middle. The distribution of the vertical center diaphragm is the opposite of the distribution of the curved center diaphragm, with a positive bending moment at both ends and a negative bending moment in the middle. This is because the curved diaphragm is bent towards the right side under the vertical earth pressure, and the lateral earth pressure of the right side is too small to resist the deformation. However, under the lateral earth pressure of the right side, the vertical diaphragm is bent towards the left side. The maximum bending moment of the vertical diaphragm is about 1/3 that of the curved diaphragm. This indicates that the safety of the connection between the vertical diaphragm and primary support is more easily guaranteed than that between the curved diaphragm and primary support with the large axial force and the small bending moment.
5. Field Test at Shenzhen Eastern Transit Expressway
5.1. Scheme of Field Test
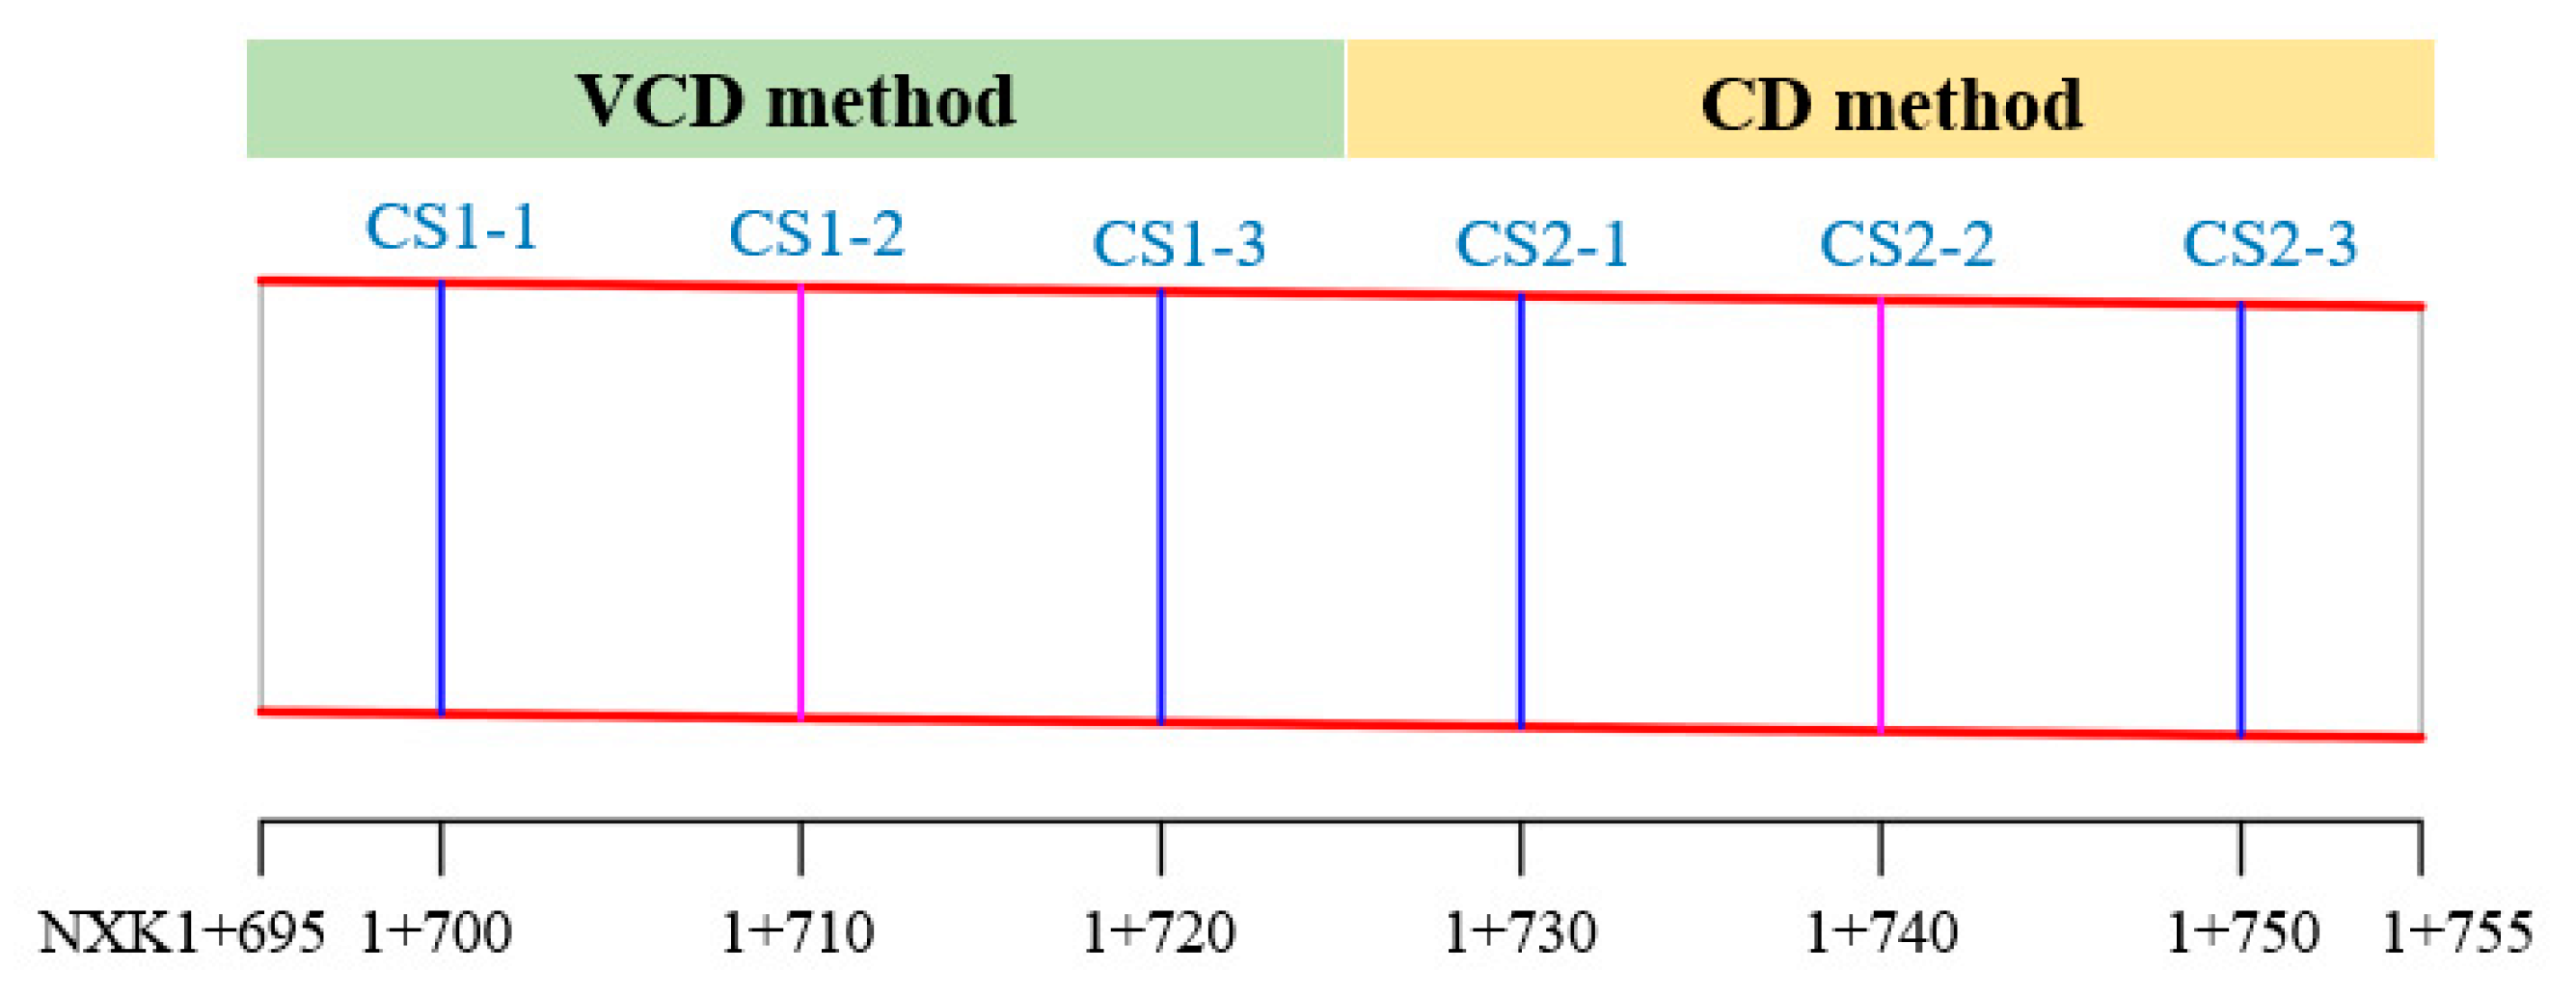
In order to prove the validity of the calculation results and study the mechanical properties of the two methods further, a comparative test area in Grade IV3 surrounding rock with a buried depth of 20 m was set up at the south line of the Shenzhen Eastern Transit Expressway Connection Line Tunnel. As shown in Figure 25, the length of the test area is 60 m, with the total stake number of NXK1+695–NXK1+755. The area with the stake number of NXK1+725–NXK1+755 was excavated by using the CD method, and another section with the stake number of NXK1+695–NXK1+725 was excavated by using the VCD method. The geological profile of the test area is shown in Figure 17.
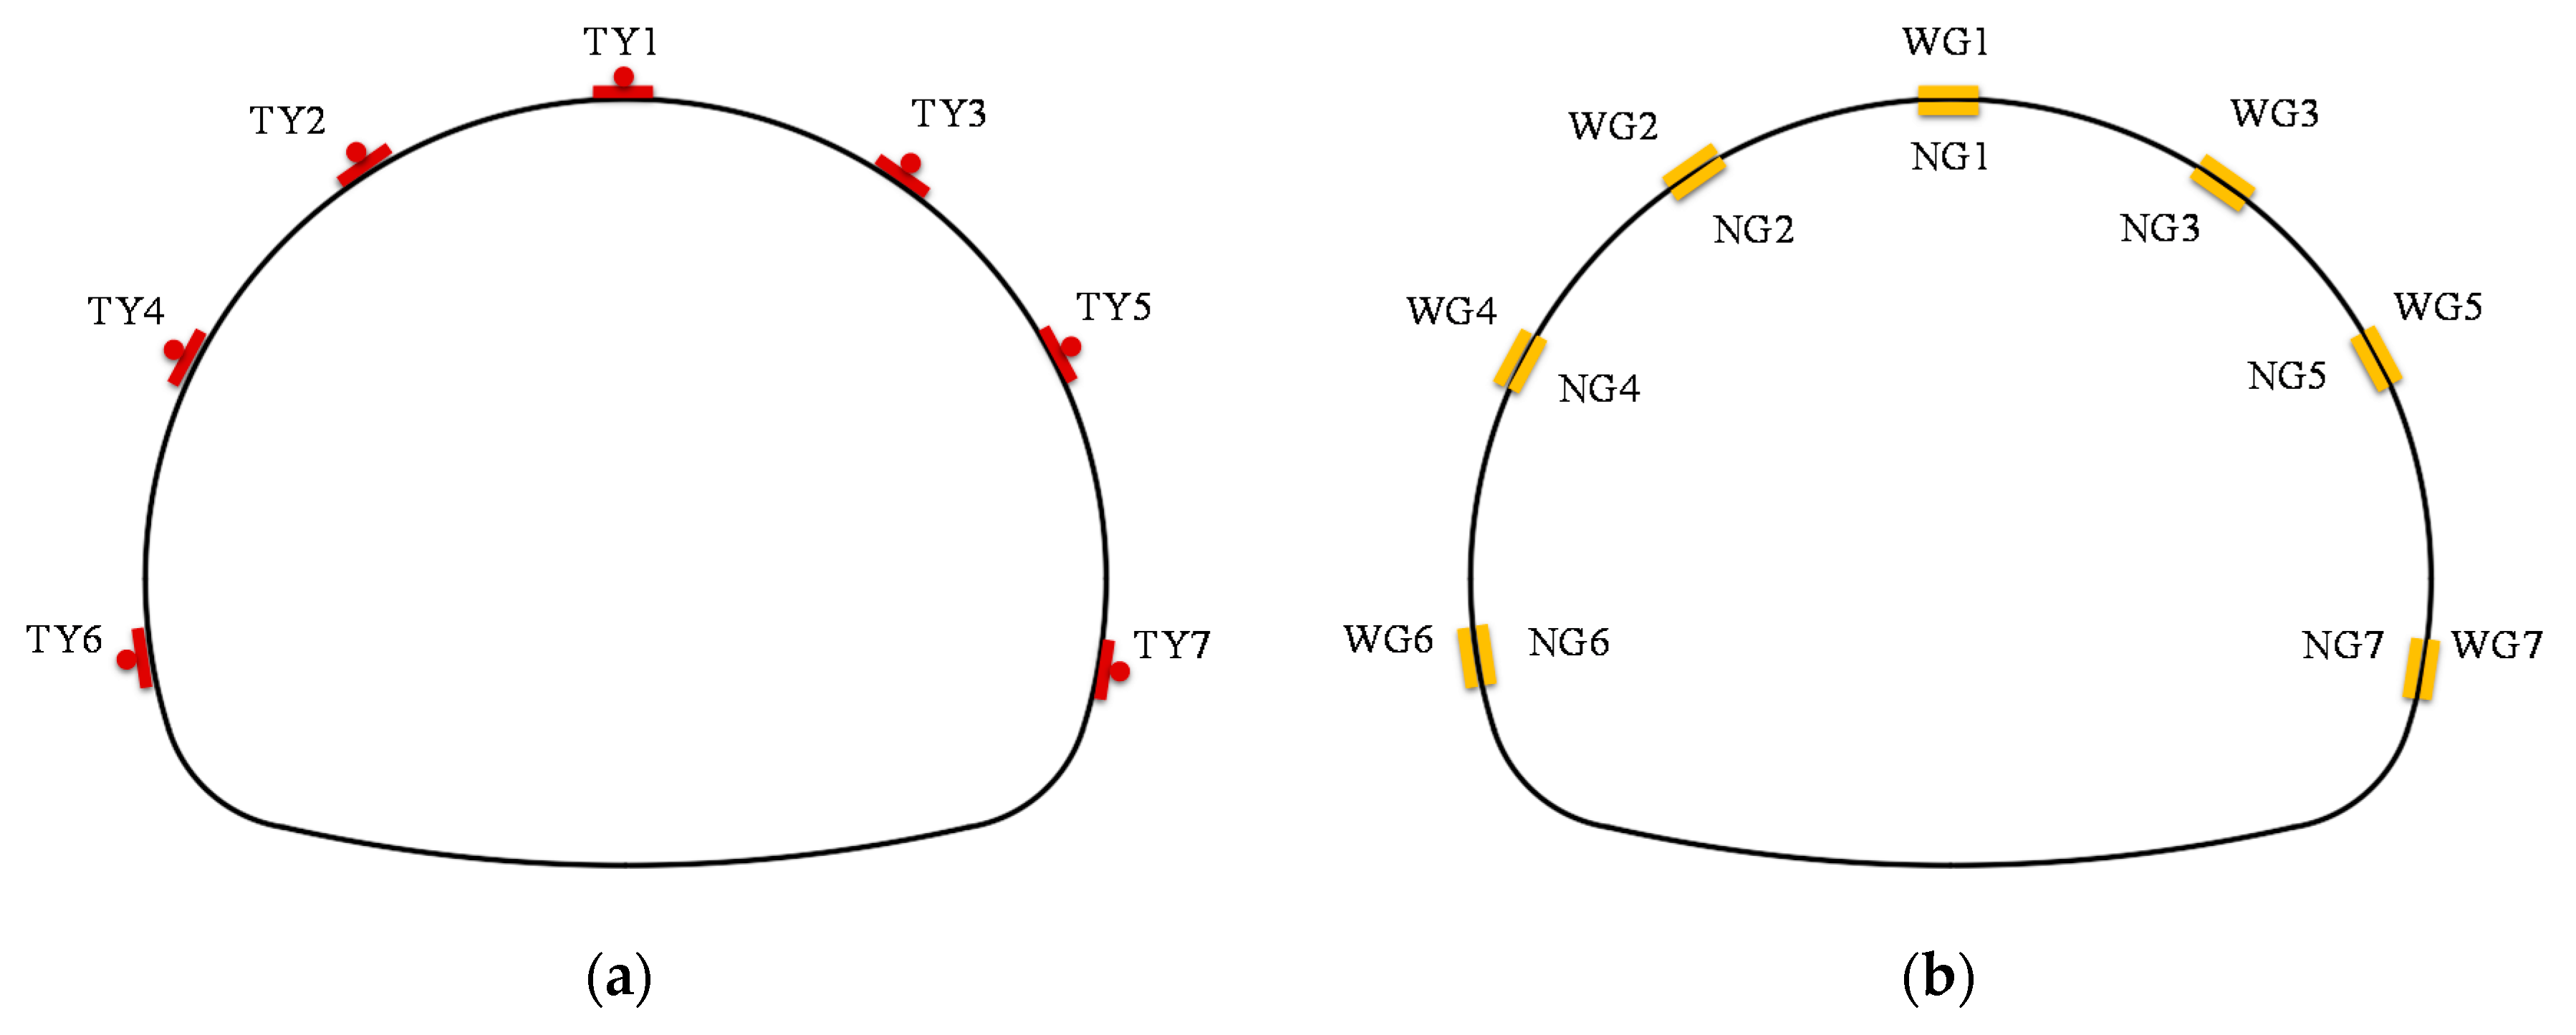
Six measuring sections CS1-1, CS1-2, CS1-3, CS2-1, CS2-2, and CS2-3 were set in the test area, in which the surface settlement, crown settlement, and horizontal convergence were measured and recorded. The arrangement of measuring points is the same as that in Section 3.1. The surrounding rock pressure and stress of the steel arch were measured in CS1-2 and CS2-2, and the arrangement of measuring points is shown in Figure 26. In Figure 26a, TY1–TY7 were the measuring points of the surrounding rock pressure. In Figure 26b, WG1–WG7 were the outer measuring points of the steel arch stress, and NG1–NG7 were the inner measuring points of the steel arch stress.
5.2. Settlement and Convergence
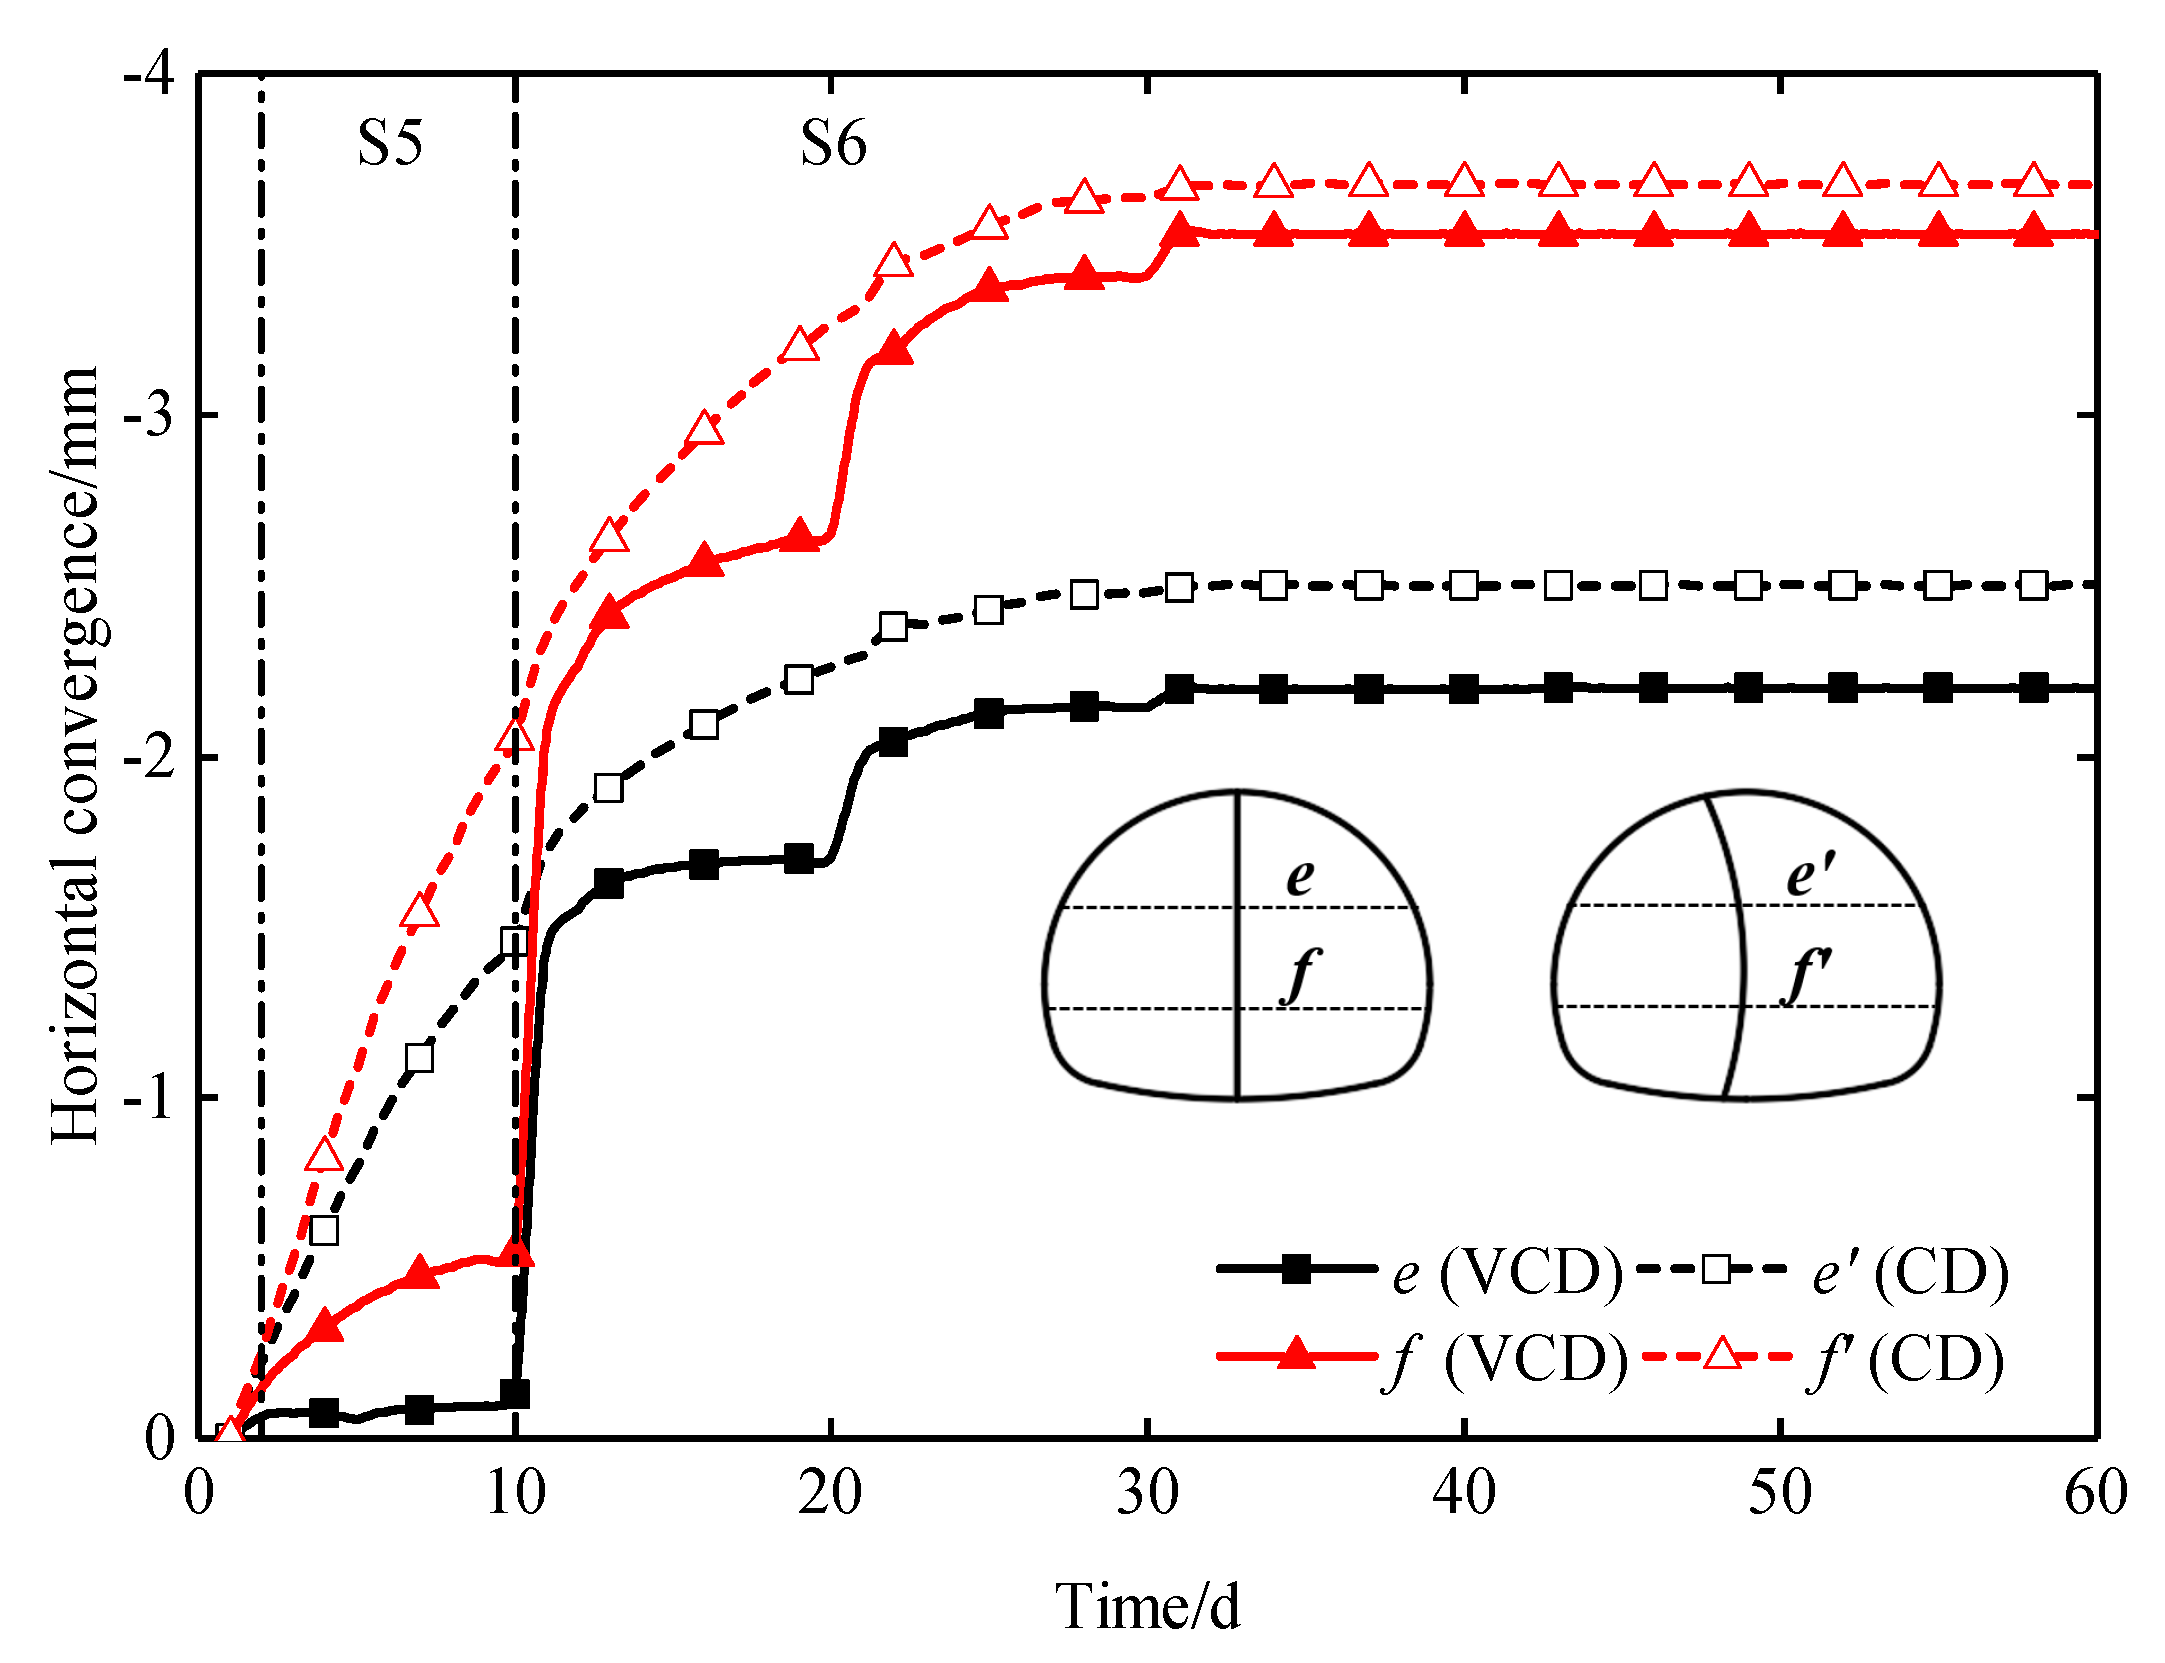
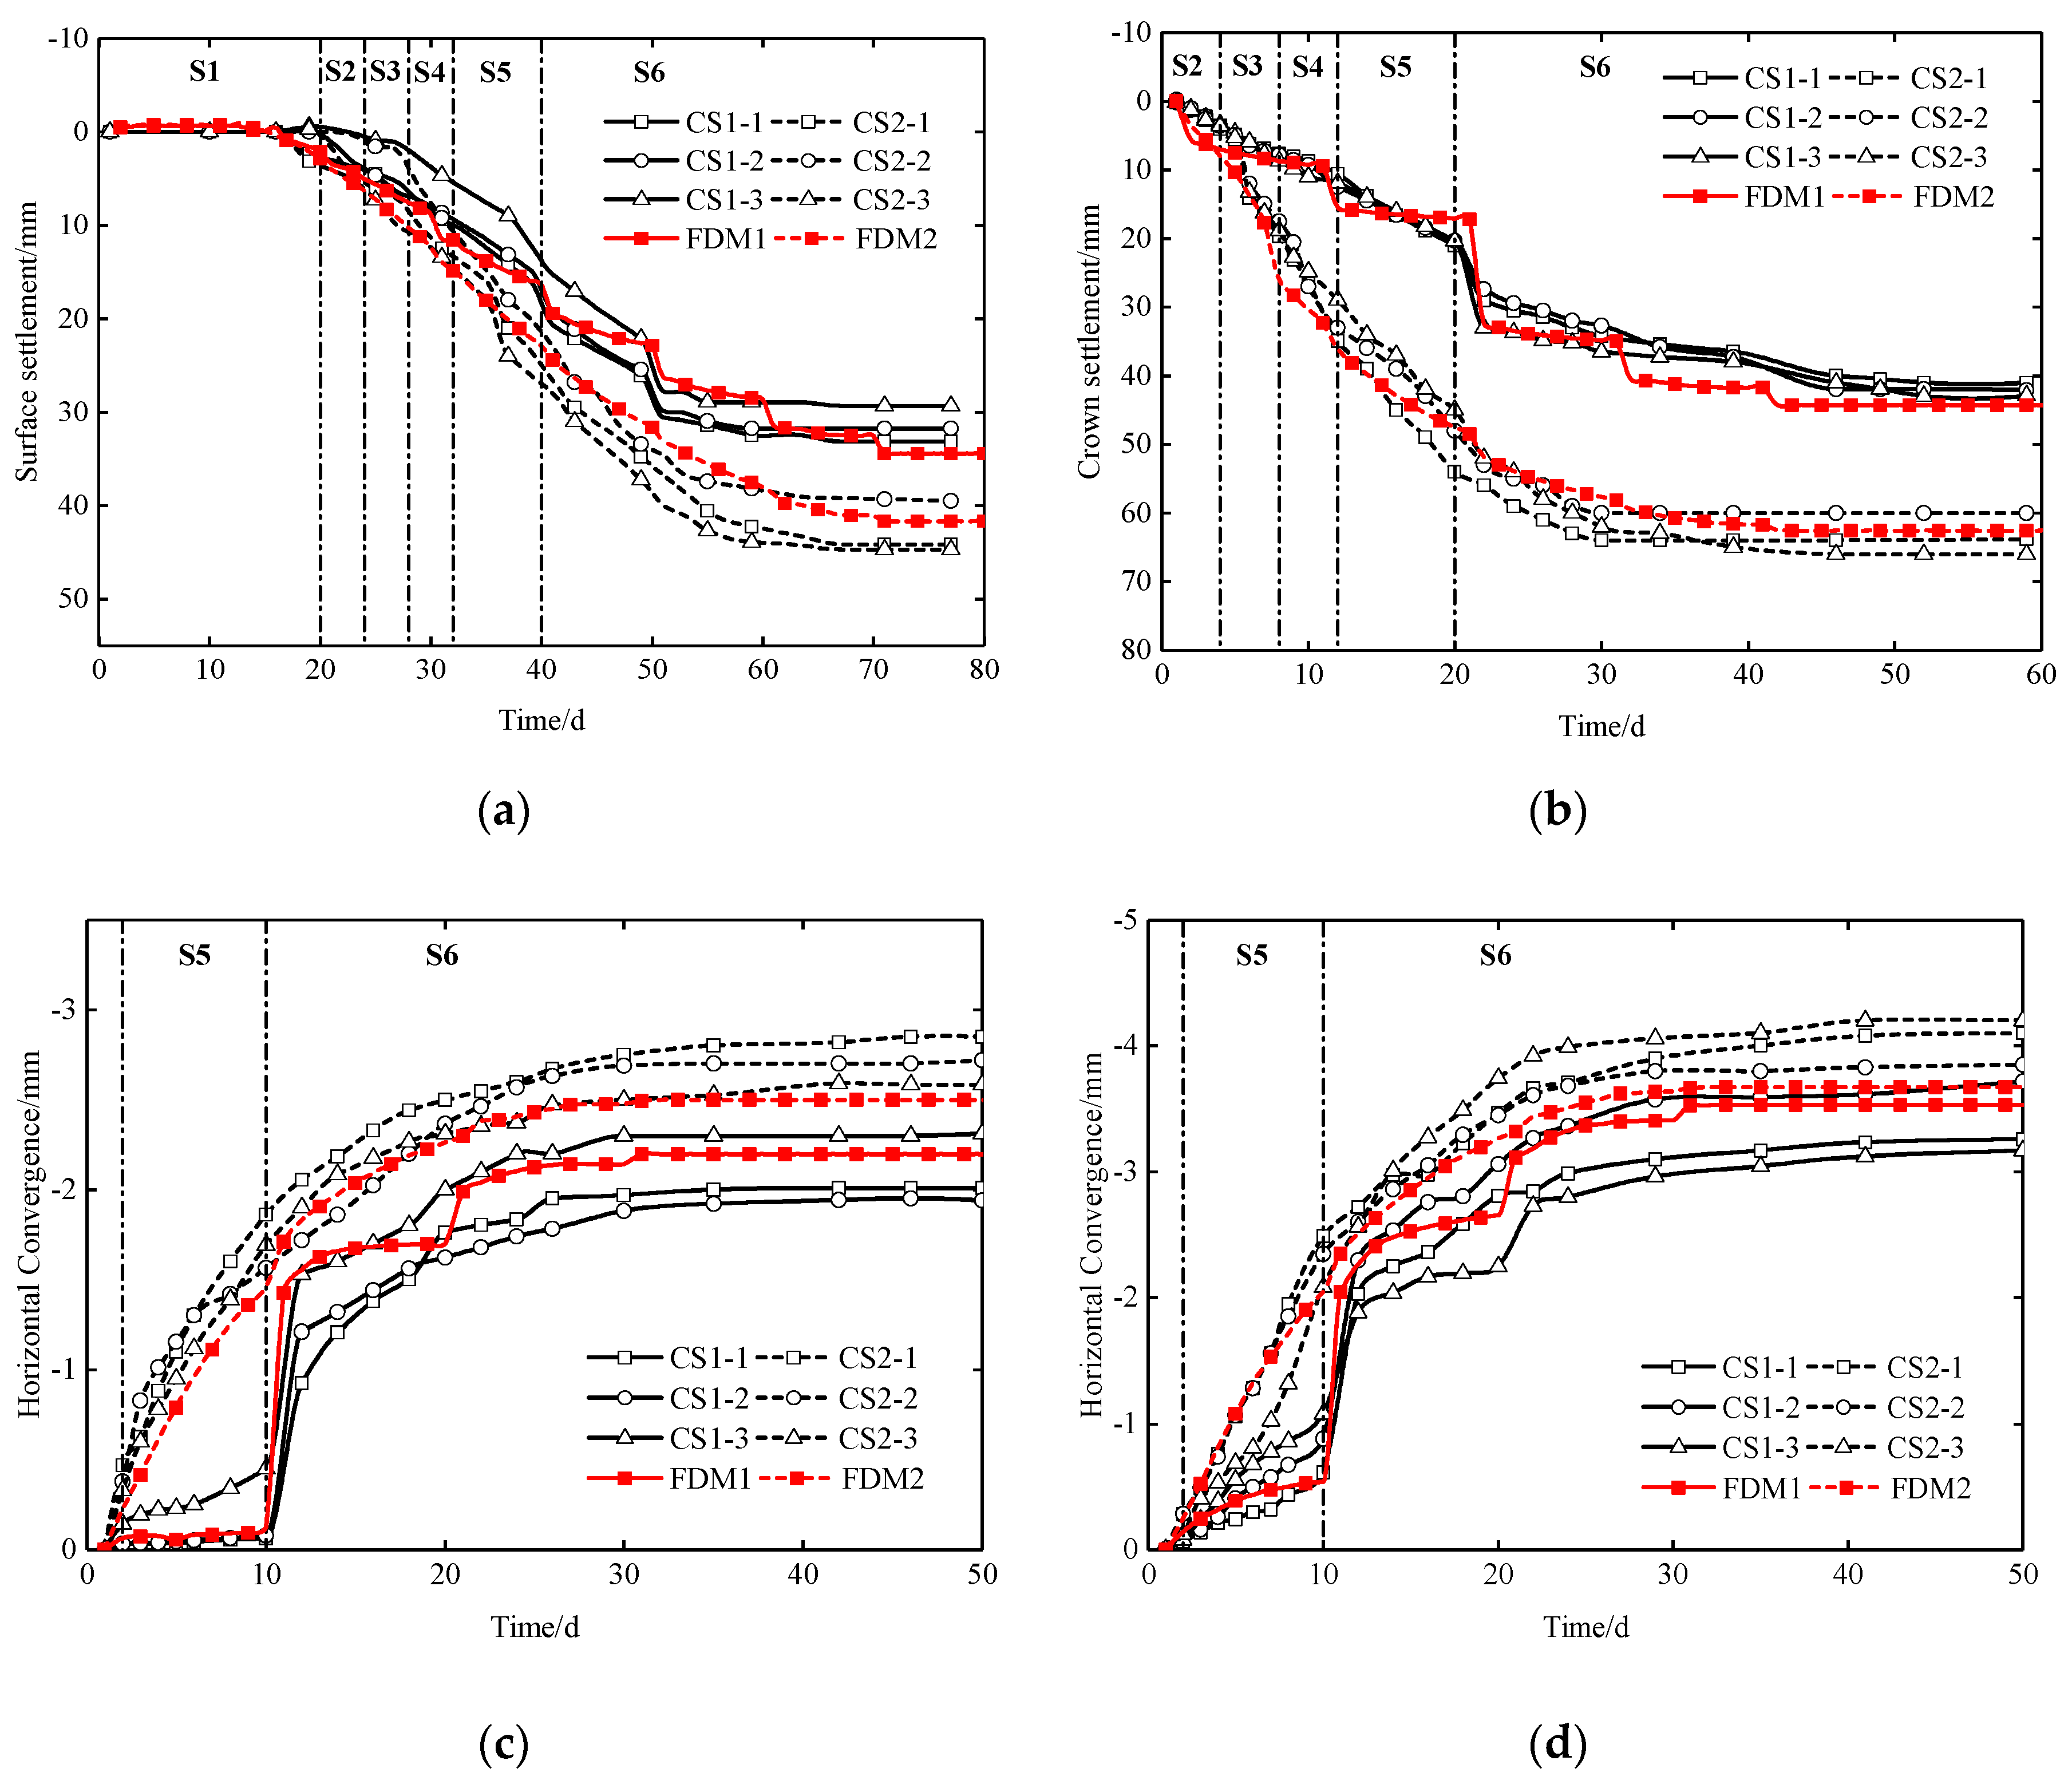
Figure 27 shows the time history curves of the settlement and convergence, including the field measurements in black and the results from the numerical calculation in red. It is clear that the deformation development trends in the field test were consistent with the results of the numerical calculation. The difference between the measured value and the calculated value was less than 3 mm. As shown in Figure 27a, the average value of the surface settlement of the CD method was 42.8 mm, and that of the VCD method was 31.4 mm. Compared with the CD method, the total surface settlement of the VCD method was reduced by 26%. As shown in Figure 27b, the average value of the crown settlement of the CD method was 63.3 mm, and that of the VCD method was 42.0 mm. Compared with the CD method, the total crown settlement of the VCD method was reduced by 34%. As shown in Figure 27c,d, the average value of the arch springing convergence of the CD method was −2.7 mm, and that of the VCD method was −2.1 mm. The average value of the side-wall convergence of the CD method was −4.3 mm, and that of the VCD method is −3.4 mm. The reason for such a behavior is that the primary support of the tunnel was mainly affected by the vertical earth pressure, and the vertical center diaphragm provided sufficient resistance, which reduced the crown settlement caused by excavation. When the center diaphragm was demolished, the primary support had been closed into a ring, which could effectively resist the deformation of the tunnel caused by the secondary disturbance. Due to the small lateral earth pressure, the advantage of the curved central diaphragm could not be exerted, and there was no significant difference in the horizontal convergence of the two methods.
5.3. Surrounding Rock Pressure
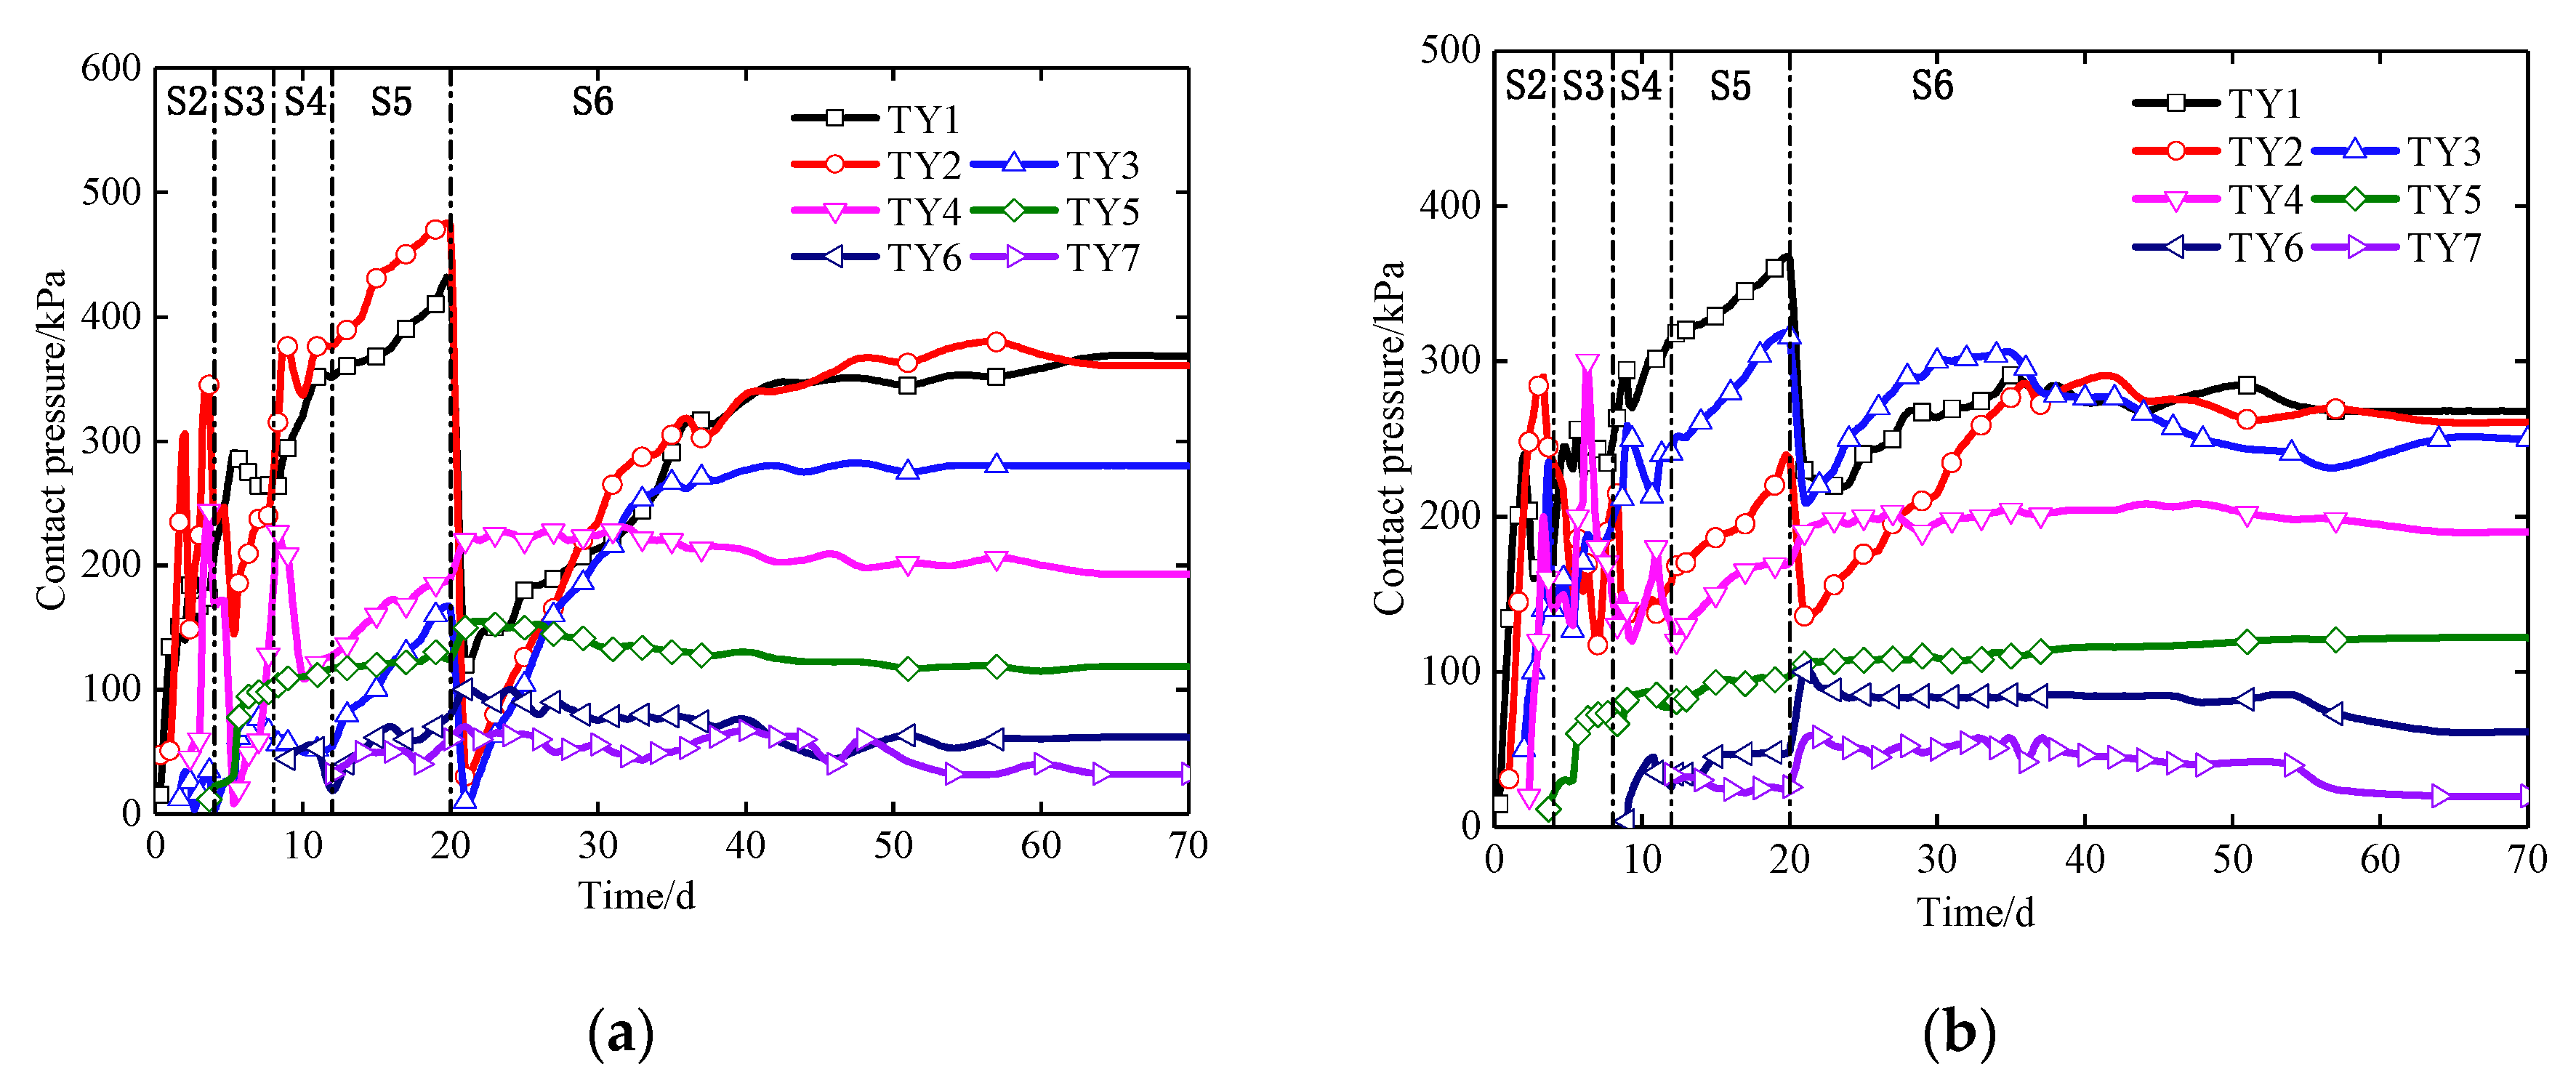
The time history curves of the surrounding rock pressure are shown in Figure 28. As shown in Figure 28a,b, the surrounding rock pressure increased rapidly in Stage 2–Stage 4. As the shotcrete strength was at a low level and the primary support structure had not been closed, the steel arch provided most of the support resistance. In Stage 5, the growth rate of the surrounding rock pressure slowed down. The support strength of the shotcrete had increased, the primary support structure was closed, and the stress releasing rate of the surrounding rock had decreased. In Stage 6, the surrounding rock pressures at the crown and the spandrels decreased suddenly, then increased rapidly, and tended to be stable finally. The surrounding rock pressures at the arch springings and the side-walls increased slowly until the steady states were reached. This is because when the center diaphragm was demolished, the support stiffness of the crown decreased suddenly. With the redistribution of the internal stress, the resistance capacity of the primary support had been fully developed. Furthermore, the crown pressure reduced value caused by the demolition of the center diaphragm of the VCD method was 310 kPa, while that of the CD method was 136 kPa.
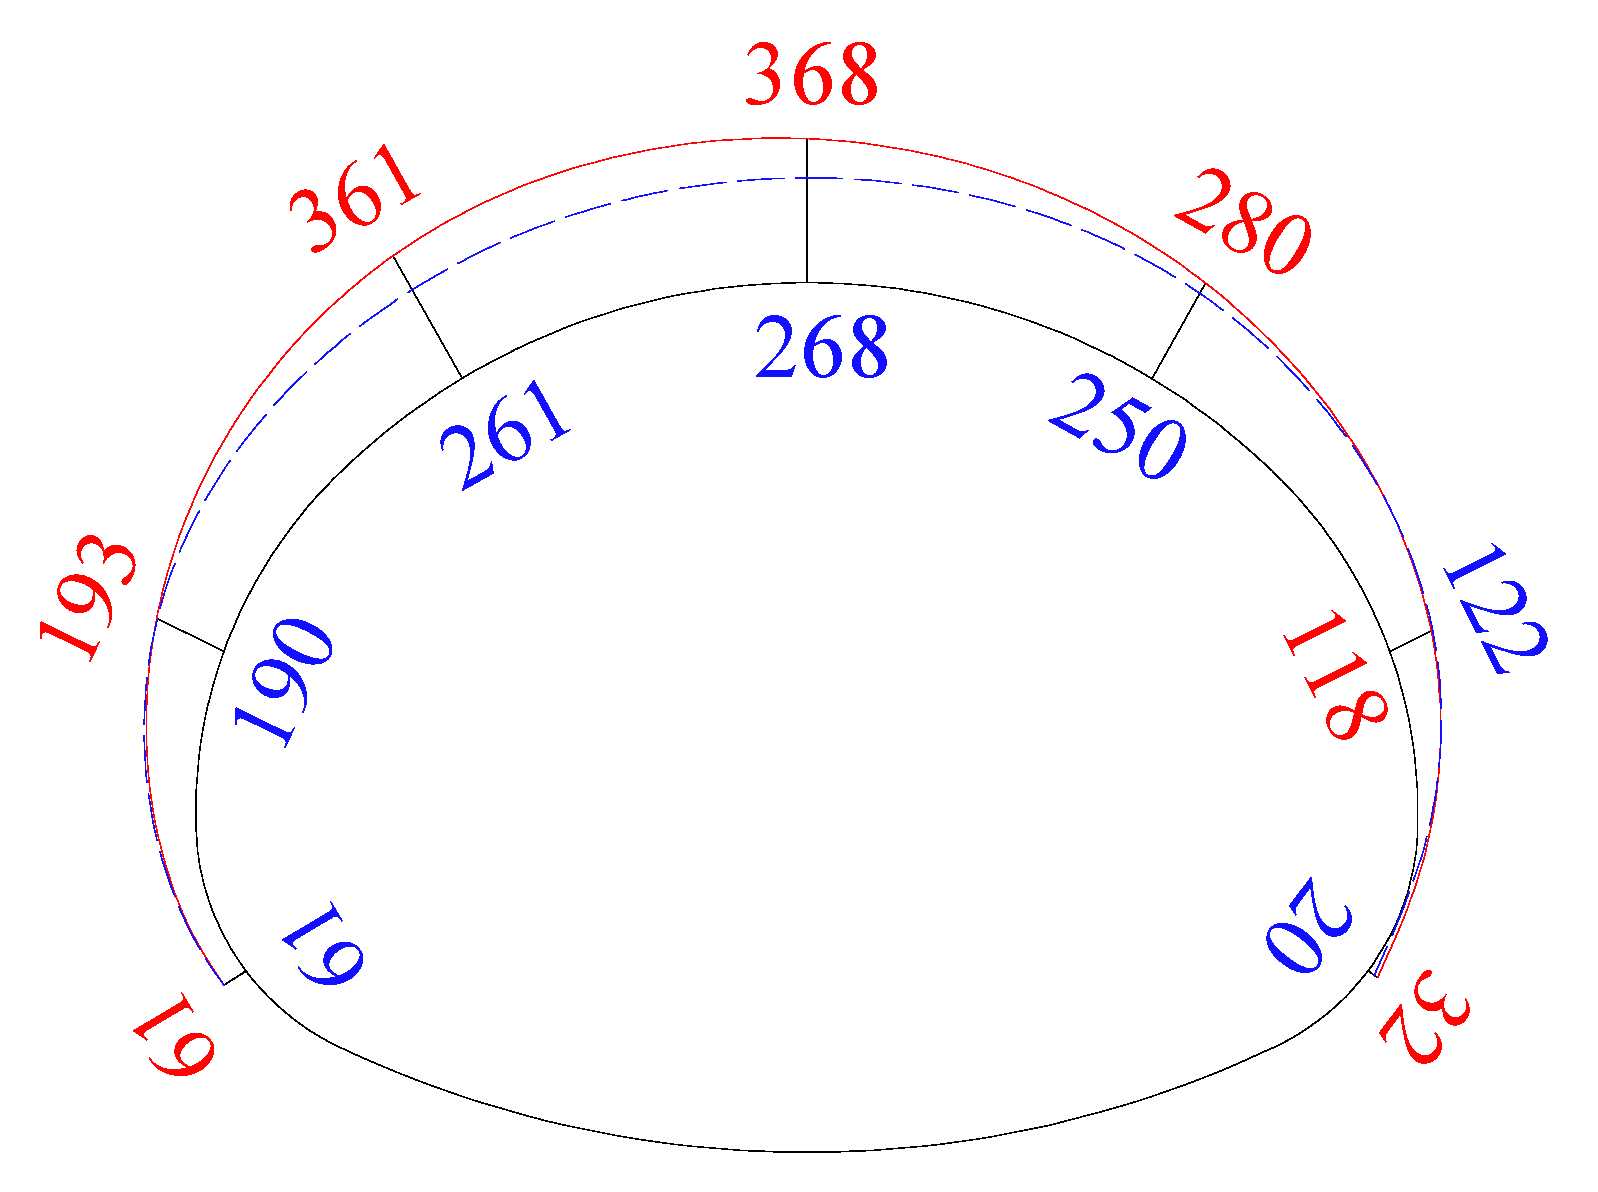
The envelope diagram of the asymptotic values of the surrounding rock pressure in Stage 6 is shown in Figure 29, the surrounding rock pressures of the two methods were irregular, which were larger at the arch and smaller at the side-walls. The pressure scale of the VCD method was 32–368 kPa, while that of the CD method was 20–268 kPa. On the whole, the surrounding rock pressures of the two methods were almost equal, but the surrounding rock pressures of the VCD method were more affected by the demolition of the center diaphragm.
5.4. Stress on Steel Arch
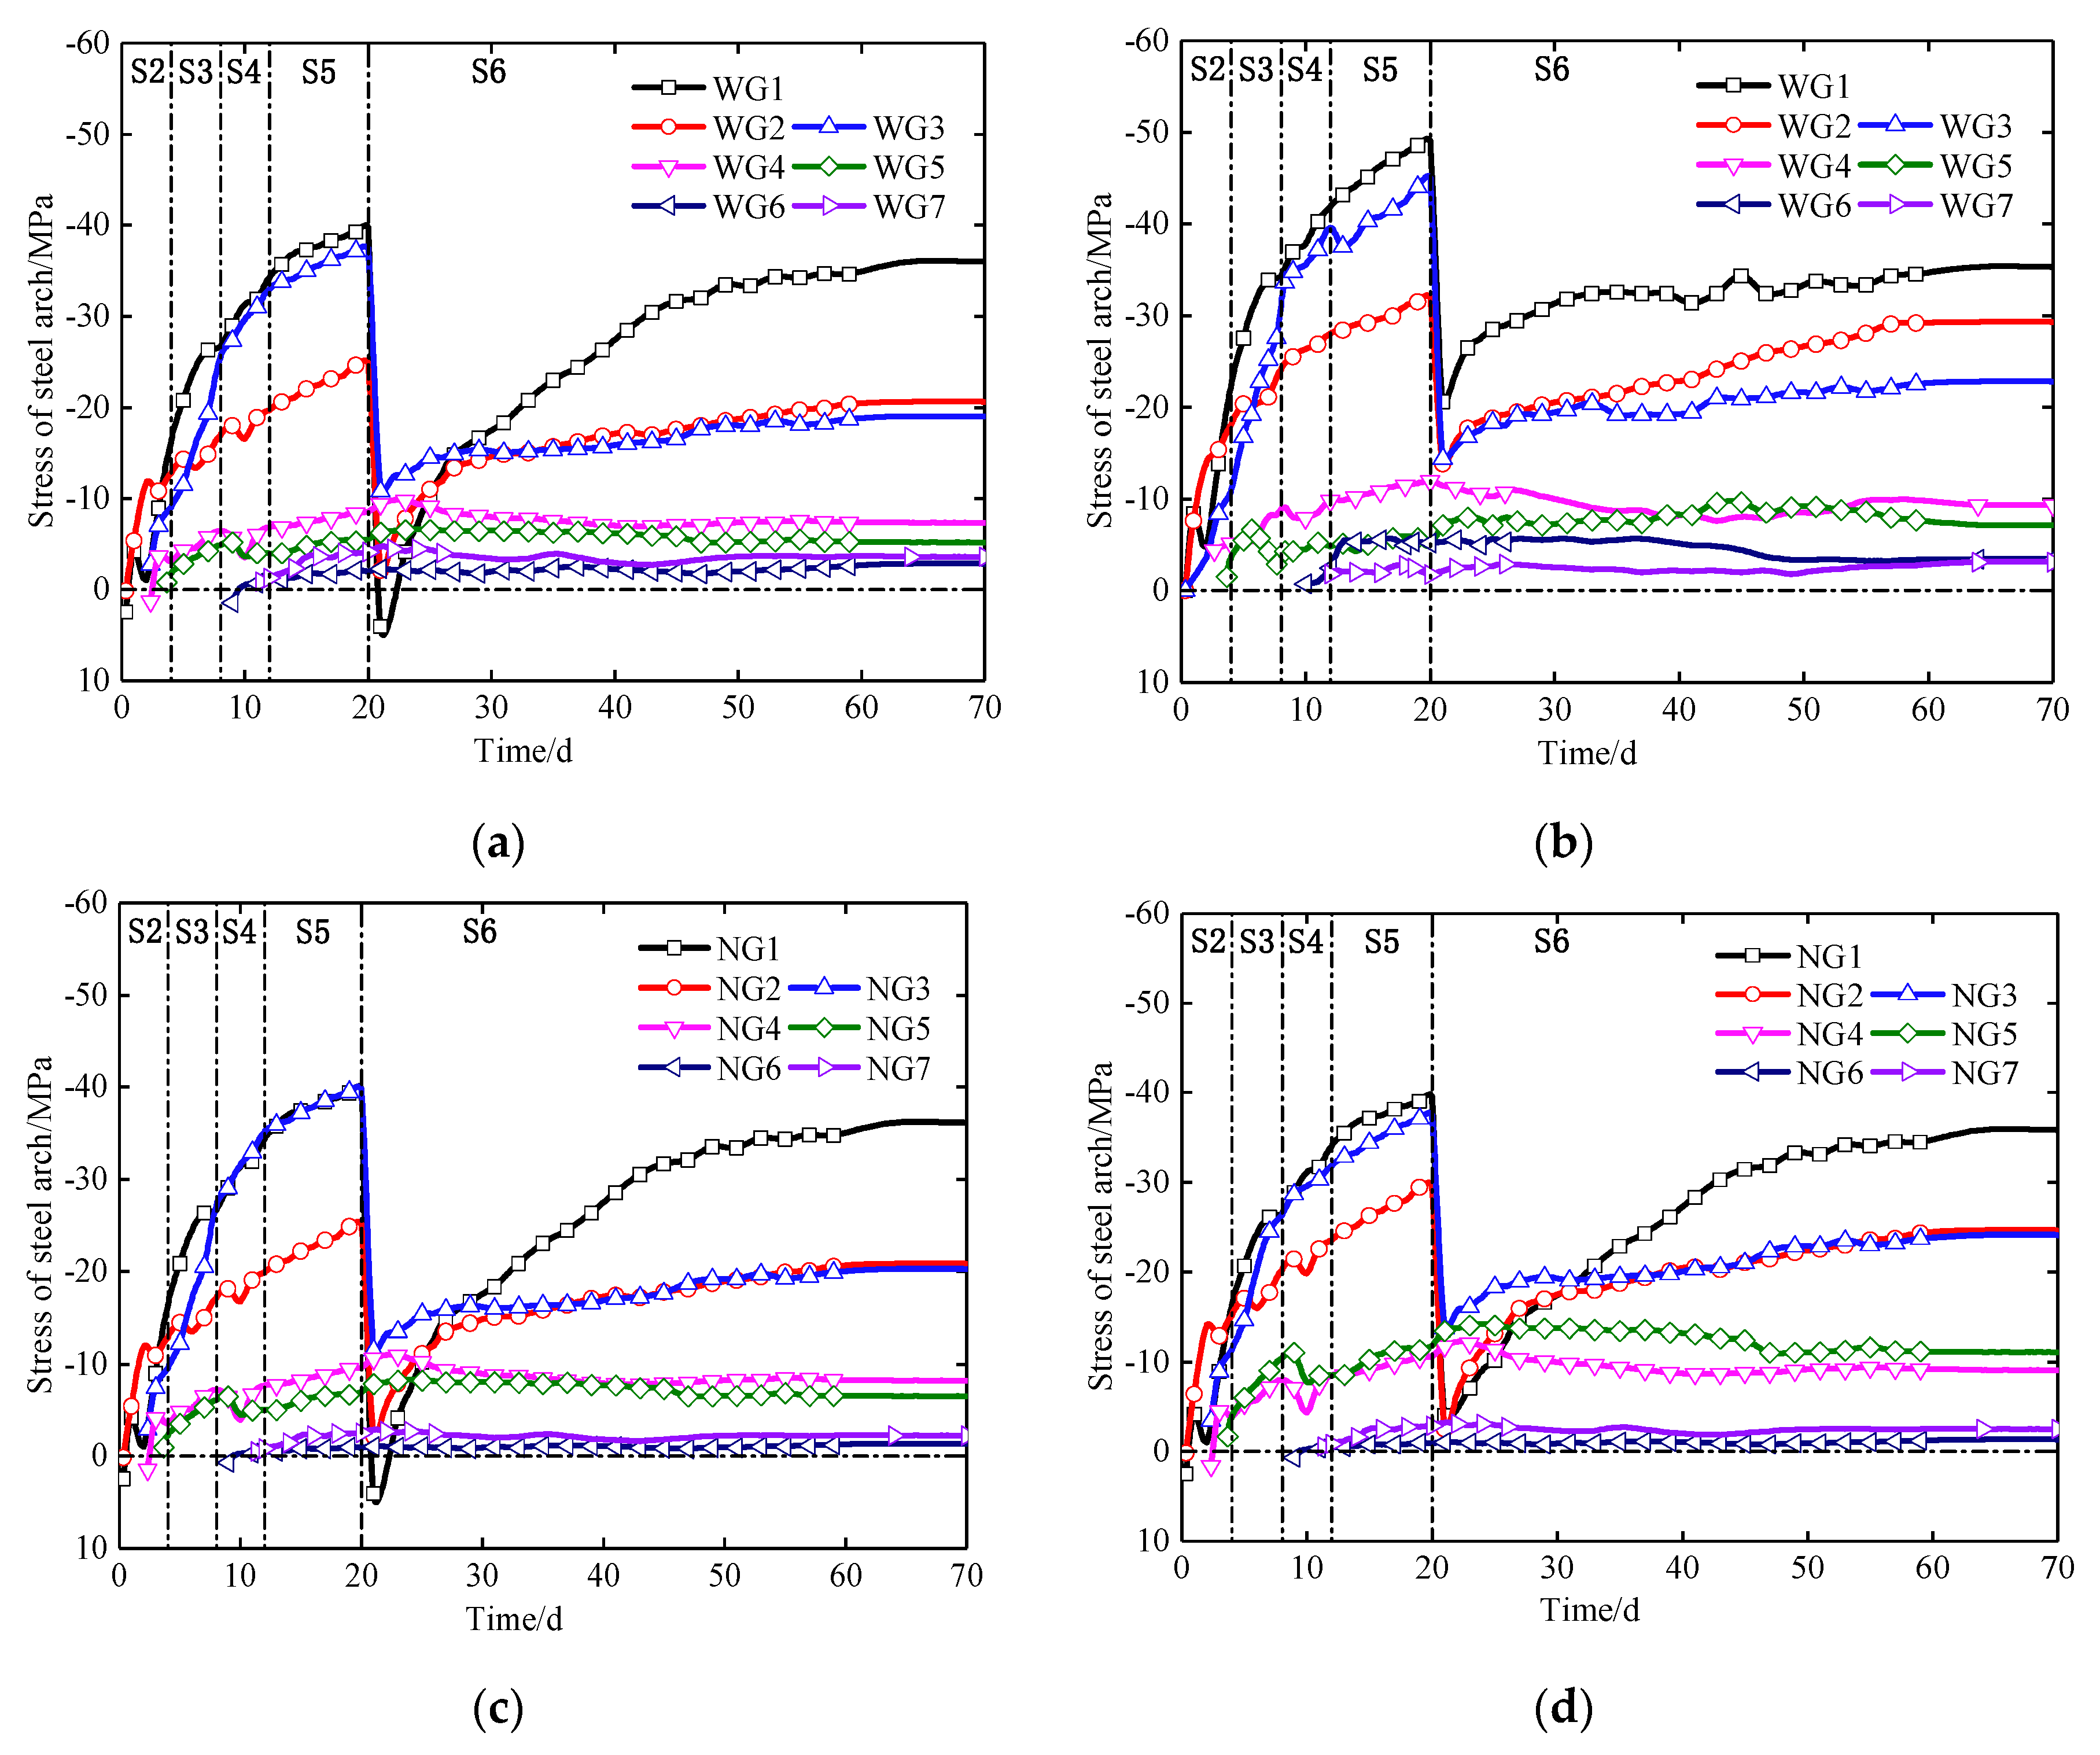
The time history curves of the stress on the steel arch are shown in Figure 30. Tension is expressed by the positive values and compression is expressed by the negative values. The development trends of the stress on the inner and outer edges of the steel arch were synchronous. In Stage 2–Stage 4, the stress on the steel arch increased rapidly, and the growth rate gradually slowed down in Stage 5. In Stage 6, the variation in the stress on the crown and spandrels of the steel arch waves violently, it suddenly dropped to the extreme value, then increased rapidly, and tended to be stable finally. Notably, when the vertical center diaphragm was demolished, the stress on the crown of the steel arch changed into tensile stress. Therefore, when the VCD method is adopted in construction, the primary support at the arch should be strengthened to prevent the collapse accident caused by the demolition of the center diaphragm.
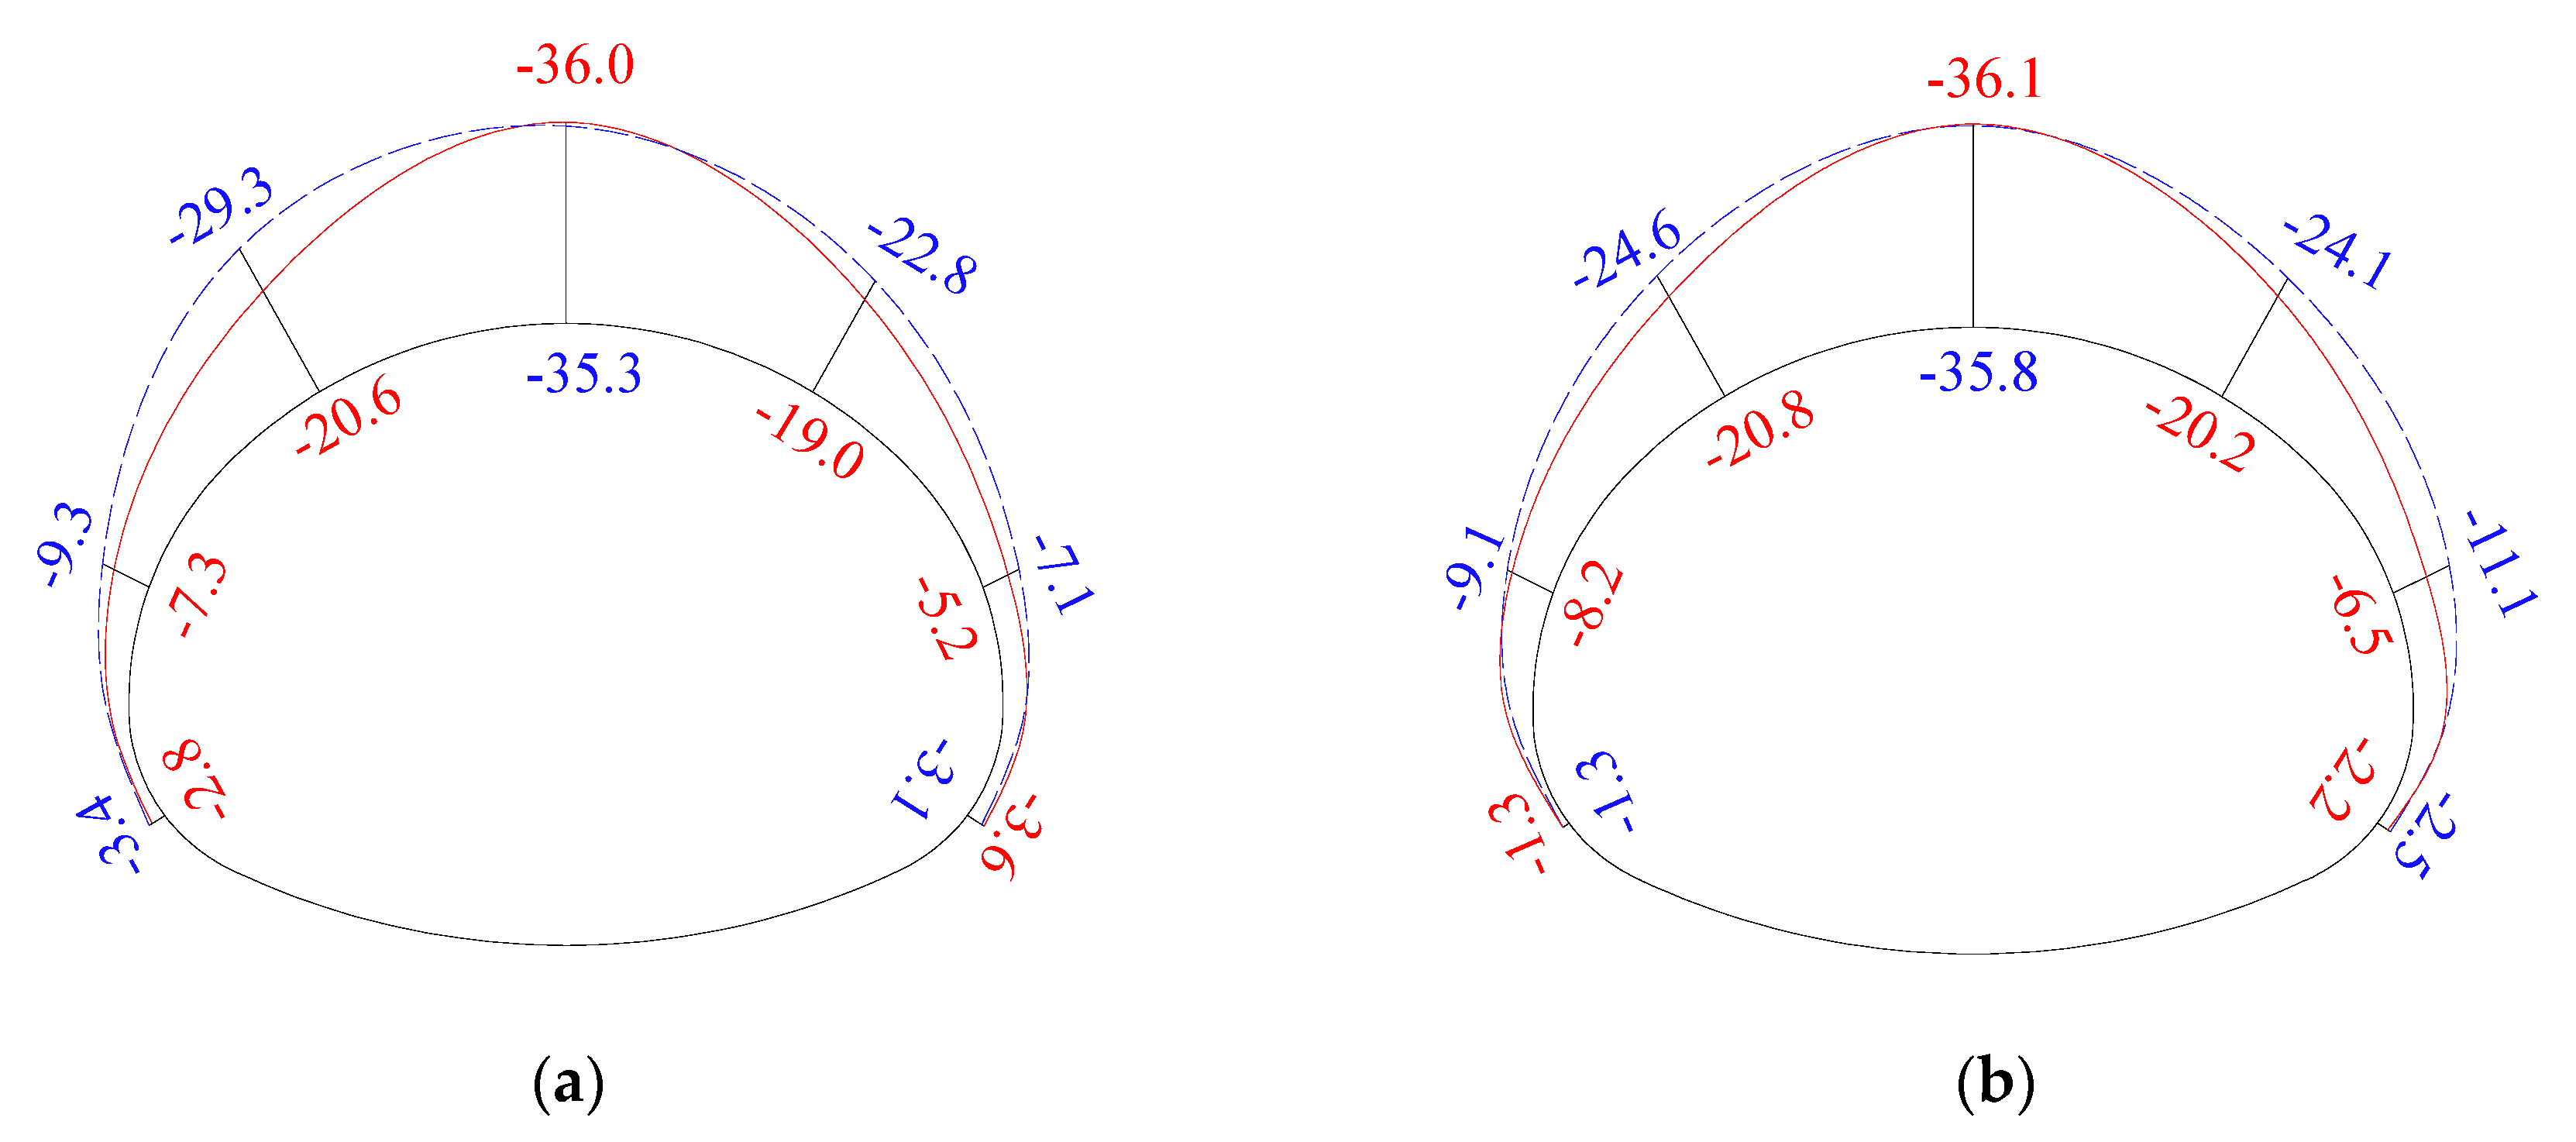
The envelope diagrams of the asymptotic values of the steel arch stress in Stage 6 are shown in Figure 31. In the test section with the VCD method, the scale of the stress on the outer edge of the steel arch was −2.8 to −36.0 MPa, and that on the inner edge of the steel arch was −1.3 to −36.1 MPa. The average stress difference between the inner edge and the outer edge of the steel arch of the VCD method was 0.11 MPa. In the test section with the CD method, the scale of the stress on the outer edge of the steel arch was −3.1 to −35.3 MPa, and that on the inner edge of the steel arch was −1.3 to −35.8 MPa. The average stress difference between the inner edge and the outer edge of the steel arch of the CD method was 0.26 MPa. The stresses are compressive at all measuring points, and all are less than the allowable stress of the steel arch. This indicates that the primary support can meet the safety requirements with the VCD method.
5.5. Construction Efficiency and Cost
The center diaphragm was divided into two parts, which were erected in Stage 2 and Stage 3, respectively. In order to compare the efficiency and economy of the two methods, 10 excavation cycles with the VCD method and 10 excavation cycles with the CD method were selected, and the erection time and the material cost of the center diaphragm were calculated. The results are presented in Table 7 and Table 8. As shown in Table 7, the average erection time of the upper part and the lower part of the vertical center diaphragm was 2.3 and 1.6 h, respectively. In contrast, that of the curved center diaphragm was 2.7 and 1.8 h, respectively. Compared with the curved center diaphragm, the erection time of the vertical center diaphragm was shortened by more than 10%. As shown in Table 8, the unit price of the vertical center diaphragm was 1573 yuan, while that of the curved center diaphragm was 1651 yuan. Compared with the curved center diaphragm, the material cost of the vertical center diaphragm was reduced by 5%. Additionally, the manufacturing process of the vertical center diaphragm was simpler, the connection quality was easier to guarantee, and the demolition was faster than the curved center diaphragm.
6. Conclusions
This study presented a new tunnel construction method by altering the shape of the center diaphragm. Based on the Shenzhen Eastern Transit Expressway Connection Line Tunnel, the VCD method was investigated by carrying out numerical calculations and a field test, and was compared with the CD method. The main findings of the study can be summarized as follows:
- In different buried depths, the deformation depends on the location of the disturbance area. For both the VCD and CD methods, if the buried depth changes from 0.5D to 4D, the surface settlement will increase first and then decrease, the crown settlement will increase first and then remain constant, the arch springing convergence will increase first and then decrease, and the side-wall convergence will remain constant;
- In different surrounding rock, the deformation depends on the scale of the disturbance area. For both the VCD and CD methods, if the surrounding rock changes from Grade IV1 to Grade V1, the surface settlement, the crown settlement, and the horizontal convergence will increase slowly. However, for Grade V2, the surface settlement, crown settlement, and horizontal convergence will increase rapidly;
- The VCD method could be an appropriate choice for tunnel construction when the buried depth is less than 4D and the surrounding rock is Grade IV1–V1. The numerical calculation results indicate that if the VCD method is adopted instead of the CD method, the surface settlement will be reduced by 14–29%, the crown settlement will be reduced by 16.2–46.0%, and the horizontal convergence will have no significant change. The surface settlement will be significantly reduced with the VCD method in the pre-excavation stage and the excavation stage, and the crown settlement will be significantly controlled in the excavation stage;
- If the VCD method is adopted in construction, the demolition of the center diaphragm may cause sudden changes in the surface settlement, the crown settlement, the horizontal convergence, the surrounding rock pressure, and the steel arch stress. It is recommended to eliminate potential safety hazards by demolishing the center diaphragm in stages and sections, taking appropriate auxiliary measures, and increasing the monitoring frequency;
- If the VCD method is adopted instead of the CD method, the erection time and material cost will be reduced by 10% and 5%, respectively. The manufacturing process of the vertical center diaphragm is simple, the connection quality is easier to be guaranteed, and the demolition is more convenient, which show significant economic and social benefits.
7. Patents
The vertical center diaphragm and the VCD method proposed herein are subject of a patent application (#CN 206860179U).
Author Contributions
Conceptualization, Z.Z. and Z.T.; data curation, J.Z.; funding acquisition, Z.T.; investigation, H.L.; software, J.Z.; supervision, Z.T.; validation, J.Z.; writing—original draft, Z.Z.; writing—review and editing, Z.Z. All authors have read and agreed to the published version of the manuscript.
Funding
The authors acknowledge the financial support provided by the Central Universities of China (Grant No. 2019YJS140) and the National Natural Science Foundation of China (Grant No. 51678034).
Conflicts of Interest
The authors declare no conflict of interest.
References
- Zhang, Z.G.; Huang, M.S. Geotechnical influence on existing subway tunnels induced by multiline tunneling in Shanghai soft soil. Comput. Geotech. 2014, 56, 121–132. [Google Scholar] [CrossRef]
- Jiang, M.; Yin, Z.Y. Influence of soil conditioning on ground deformation during longitudinal tunneling. Comptes Rendus Mécanique 2014, 342, 189–197. [Google Scholar] [CrossRef] [Green Version]
- Chen, R.P.; Meng, F.Y.; Li, Z.C.; Ye, Y.H.; Ye, J.N. Investigation of response of metro tunnels due to adjacent large excavation and protective measures in soft soils. Tunn. Undergr. Space Technol. 2016, 58, 224–235. [Google Scholar] [CrossRef] [Green Version]
- Wang, M.S. A summary and prospect of construction technologies for metro in China. Undergr. Space. 1998, 18, 98–103. (In Chinese) [Google Scholar]
- Sharifzadeh, M.; Kolivand, F.; Ghorbani, M.; Yasrobi, S. Design of sequential excavation method for large span urban tunnels in soft ground–Niayesh tunnel. Tunn. Undergr. Space Technol. 2013, 35, 178–188. [Google Scholar] [CrossRef]
- Hoek, E. Big tunnels in bad rock. J. Geotech. Geoenviron. Eng. 2001, 127, 726–740. [Google Scholar] [CrossRef]
- Daraei, A.; Zare, S.; Ghorbani, M. A new multi-graph approach for selecting the sequential excavation method of civil tunnels. Tunn. Undergr. Space Technol. 2019, 91, 102999. [Google Scholar] [CrossRef]
- Wang, L.C.; Hu, H.B.; Wang, S.B.; Jia, R.H. Study on construction methods for tunnels of large cross-section excavated in weak rocks. In Recent Advancement in Soil Behavior, in Situ Test Methods, Pile Foundations, and Tunneling; Ali, L., Correia, A.C., Yang, J.Y., Tao, M.J., Eds.; ASCE: Changsha, China, 2009; pp. 225–231. [Google Scholar] [CrossRef]
- Wu, K.; Zheng, Q.W.; Shao, Z.S.; Zhang, Z.L. Research into the effect of different tunnel excavation methods on rail track settlement. Indian Geotech. J. 2018, 48, 677–685. [Google Scholar] [CrossRef]
- Zhang, J.G. Study on construction method of double-track tunnel on passenger dedicated line by numerical simulation. Appl. Mech. Mater. 2012, 204–208, 1527–1531. [Google Scholar] [CrossRef]
- Bolghonabai, R.; Hossaini, M.F.; Mohammadi, M.; Nazem, A. On the selection of an appropriate excavation pattern for urban tunnels with big cross-section: A case study. Int. J. Min. Geo-Eng. 2015, 49, 297–307. [Google Scholar]
- Zhou, X.J.; Yang, C.Y. Study on Structural Design and Driving Process of a Subway Station with Large Transection by Tunneling Method. Appl. Mech. Mater. 2013, 353–356, 1325–1328. [Google Scholar] [CrossRef]
- Zhang, L. The analysis of lining stress and strain with working method from CRD to CD method. Geol. Prospect. 2007, 43, 93–98. (In Chinese) [Google Scholar]
- Hou, M.Z.; Zhang, Y.L.; Ding, C.L.; Shu, J. On construction parameters for a highway tunnel with large section. Mod. Tunn. Technol. 2014, 51, 36. (In Chinese) [Google Scholar] [CrossRef]
- Gao, H.J.; He, P.; Zheng, C.; Li, X.Y. A novel calculation method of process load for extra-large section tunnels. Symmetry 2019, 11, 1228. [Google Scholar] [CrossRef] [Green Version]
- Zhang, X.L. Research on the Stress Behavior of Surrounding Rock During Construction Adopting CD Method of Large Cross-Section Tunnel. Master’s Thesis, Southwest Jiaotong University, Chengdu, China, 2005. (In Chinese). [Google Scholar]
- Meng, D.X. Research on Spatial Deformation Characteristics and Supporting Mechanism of Shallow Loess Tunnels with Large Section in High-Speed Railway. Ph.D. Thesis, Beijing Jiaotong University, Beijing, China, 2016. (In Chinese). [Google Scholar]
- Tan, Z.S.; Meng, D.X.; Shi, X.D.; Ji, T.G.; He, L.C. Research on support system and construction method for large-section small spacing tunnel in loess. China J. Highw. Transp. 2015, 28, 82–97. (In Chinese) [Google Scholar]
- Gao, H.J.; He, P.; Chen, Z.; Li, X.Y. Study on a surrounding rock pressure calculation method for super-large section highway tunnels. Symmetry 2019, 11, 1133. [Google Scholar] [CrossRef] [Green Version]
- Brinkgreve, R.B.J. Selection of soil models and parameters for geotechnical engineering. In Soil Constitutive Models: Evaluation, Selection, and Calibration; Yamanuro, J.A., Kaliakin, V.N., Eds.; ASCE: New York, NY, USA, 2005; pp. 69–98. [Google Scholar] [CrossRef]
- Roscoe, K.H.; Burland, J.B. On the generalized stress-strain behaviour of ‘wet’ clay. In Engineering Plasticity; Heyman, J., Lekie, F.A., Eds.; Cambridge University Press: London, UK, 1968; pp. 535–609. [Google Scholar]
- JTG/T D70-2010 Guidelines for Design of Highway Tunnel; People’s Communications Publishing House: Beijing, China, 2010.
- JTG D70-2010 Code for Design of Road Tunnels; People’s Communications Publishing House: Beijing, China, 2010.
Figure 1.
Route plan of the Shenzhen Eastern Transit Expressway Connection Line.

Figure 2.
Section map of the Connection Line tunnel.

Figure 3.
Construction process of the center diaphragm (CD) method.

Figure 4.
Longitudinal section of the construction method.

Figure 5.
Section map of the construction method. (a) Section map of the CD method; (b) section map of the vertical center diaphragm (VCD) method.
Figure 5.
Section map of the construction method. (a) Section map of the CD method; (b) section map of the vertical center diaphragm (VCD) method.

Figure 6.
Finite-difference models. (a) Models for the VCD method; (b) models for the CD method.

Figure 7.
Yield surface of the modified Cam-clay model.

Figure 8.
Location of the measuring points. (Left schematic for VCD method, right schematic for VCD method).
Figure 8.
Location of the measuring points. (Left schematic for VCD method, right schematic for VCD method).

Figure 9.
Relationship between the surface settlement and buried depth.

Figure 10.
Tunnels with different buried depths.

Figure 11.
Relationship between the crown settlement and buried depth.

Figure 12.
Relationship between the horizontal convergence and buried depth.

Figure 13.
Relationship between the surface settlement and surrounding rock grade.

Figure 14.
Relationship between the crown settlement and surrounding rock grade.

Figure 15.
Relationship between the horizontal convergence and surrounding rock grade.

Figure 16.
Numerical models of the Shenzhen Eastern Transit Expressway Connection Line Tunnel. (a) Model for VCD method; (b) model for CD method.
Figure 16.
Numerical models of the Shenzhen Eastern Transit Expressway Connection Line Tunnel. (a) Model for VCD method; (b) model for CD method.

Figure 17.
Geological profiles of the construction site.

Figure 18.
Time history curves of the surface settlement.

Figure 19.
Time history curves of the surface settlement.

Figure 20.
Comparison of the settlement troughs.

Figure 21.
Time history curves of the crown settlement.

Figure 22.
Crown settlement of each construction stage.

Figure 23.
Time history curves of the horizontal convergence.

Figure 24.
Internal force diagram of the center diaphragm. (a) Axial force; (b) bending moment.

Figure 25.
Layout of the measuring sections.

Figure 26.
Arrangement of the measuring points. (a) Surrounding rock pressure measuring points; (b) steel stress measuring points.
Figure 26.
Arrangement of the measuring points. (a) Surrounding rock pressure measuring points; (b) steel stress measuring points.

Figure 27.
Time history curves of deformation. (a) Surface settlement; (b) crown settlement; (c) arch springing convergence; (d) side-wall convergence.
Figure 27.
Time history curves of deformation. (a) Surface settlement; (b) crown settlement; (c) arch springing convergence; (d) side-wall convergence.

Figure 28.
Time history curves of the surrounding rock pressure. (a) The VCD method; (b) the CD method.
Figure 28.
Time history curves of the surrounding rock pressure. (a) The VCD method; (b) the CD method.

Figure 29.
Envelope diagram of the surrounding rock (red line for the VCD method and blue line for the CD method) (unit: kPa).
Figure 29.
Envelope diagram of the surrounding rock (red line for the VCD method and blue line for the CD method) (unit: kPa).

Figure 30.
Time history curves of the stress on the steel arch. (a) Outer edge of the VCD method; (b) outer edge of the CD method; (c) inner edge of the VCD method; (d) inner edge of the CD method.
Figure 30.
Time history curves of the stress on the steel arch. (a) Outer edge of the VCD method; (b) outer edge of the CD method; (c) inner edge of the VCD method; (d) inner edge of the CD method.

Figure 31.
Envelope diagram of the stress on the steel arch. (red line for the VCD method and blue line for the CD method) (unit: MPa) (a) Outer edge; (b) inner edge.
Figure 31.
Envelope diagram of the stress on the steel arch. (red line for the VCD method and blue line for the CD method) (unit: MPa) (a) Outer edge; (b) inner edge.


Table 1.
Number of the nodes and elements.
| Dimension of Z (m) | 80 | 85 | 90 | 95 | 100 | 105 | 110 | 115 | |
|---|---|---|---|---|---|---|---|---|---|
| VCD method | Element | 40710 | 46110 | 51510 | 56910 | 62310 | 67710 | 73110 | 78510 |
| Node | 43524 | 49259 | 54994 | 60729 | 66464 | 72199 | 77934 | 83669 | |
| CD method | Element | 41220 | 46620 | 52020 | 57420 | 62820 | 68220 | 73620 | 79020 |
| Node | 44051 | 49786 | 55521 | 61256 | 66991 | 72726 | 78461 | 84196 | |
Table 2.
Classification of the rocky surrounding rock.
| Grades | I | II | III | IV | V | ||||
|---|---|---|---|---|---|---|---|---|---|
| III1 | III2 | IV1 | IV2 | IV3 | V1 | V2 | |||
| [BQ]min | 551 | 451 | 401 | 351 | 316 | 285 | 251 | 211 | 150 |
| [BQ]max | - | 550 | 450 | 400 | 350 | 315 | 284 | 250 | 210 |
Table 3.
Calculation cases.
| Number | Surrounding Rock Grades | Buried Depth | |
|---|---|---|---|
| Group 1 | 1-1 | IV3 | 5m/0.5D |
| 1-2 | IV3 | 10m/1.0D | |
| 1-3 | IV3 | 15m/1.5D | |
| 1-4 | IV3 | 20m/2.0D | |
| 1-5 | IV3 | 25m/2.5D | |
| 1-6 | IV3 | 30m/3.0D | |
| 1-7 | IV3 | 35m/3.5D | |
| 1-8 | IV3 | 40m/4.0D | |
| Group 2 | 2-1 | IV1 | 20m/2.0D |
| 2-2 | IV2 | 20m/2.0D | |
| 2-3 | IV3 | 20m/2.0D | |
| 2-4 | V1 | 20m/2.0D | |
| 2-5 | V2 | 20m/2.0D |
Table 4.
Calculation parameters for the surrounding rock.
| Parameter | Description (Unit) | Grade | ||||
|---|---|---|---|---|---|---|
| IV1 | IV2 | IV3 | V1 | V2 | ||
| γ | Unit weight (kN/m3) | 22.5 | 21.5 | 20.5 | 19.0 | 17.5 |
| M | Stress ratio at the characteristic state point | 0.80 | 0.70 | 0.60 | 0.45 | 0.35 |
| μ | Poisson’s ratio | 0.31 | 0.32 | 0.34 | 0.37 | 0.42 |
| λ | Slope of normal consolidation line | 0.080 | 0.083 | 0.086 | 0.090 | 0.093 |
| κ | Slope of elastic swelling line | 0.008 | 0.008 | 0.008 | 0.009 | 0.009 |
| Nr | Reference specific volume | 1.84 | 1.87 | 1.90 | 1.93 | 1.96 |
Table 5.
Calculation parameters for the structure.
| Parameter | Description (Unit) | Center Diaphragm | Primary Support |
|---|---|---|---|
| E | Young’s modulus (MPa) | 25E3 | 25E3 |
| ν | Poisson’s ratio | 0.2 | 0.2 |
| γ | Unit weight (kN/m3) | 22 | 22 |
Table 6.
Calculation parameters for the surrounding rock.
| Parameter(Unit) | Miscellaneous Fill | Gravel Sand | Breccia | Metamorphosed Quartz Sandstone |
|---|---|---|---|---|
| γ (kN/m3) | 22.5 | 21.5 | 20.5 | 19.0 |
| M | 0.80 | 0.70 | 0.60 | 0.45 |
| μ | 0.31 | 0.32 | 0.34 | 0.37 |
| λ | 0.080 | 0.083 | 0.086 | 0.090 |
| κ | 0.008 | 0.008 | 0.008 | 0.009 |
| Nr | 1.84 | 1.87 | 1.90 | 1.93 |
Table 7.
Erection time of the center diaphragm. (unit: min).
| No. | Vertical Center Diaphragm | Curved Center Diaphragm | ||
|---|---|---|---|---|
| Upper Part | Lower Part | Upper Part | Lower Part | |
| 1 | 149 | 102 | 154 | 97 |
| 2 | 120 | 96 | 165 | 107 |
| 3 | 149 | 84 | 152 | 105 |
| 4 | 149 | 99 | 156 | 115 |
| 5 | 132 | 101 | 152 | 115 |
| 6 | 143 | 96 | 153 | 101 |
| 7 | 119 | 98 | 167 | 108 |
| 8 | 129 | 97 | 165 | 107 |
| 9 | 147 | 91 | 157 | 112 |
| 10 | 143 | 96 | 170 | 113 |
| Average time | 138 | 96 | 159 | 108 |
| Standard deviation | 11.38 | 4.94 | 6.55 | 5.66 |
Table 8.
Material cost of the center diaphragm.
| Type | Length (m) | Steel Consumption (kg) | Price of Steel (yuan/kg) | Unit Price (yuan) |
|---|---|---|---|---|
| Vertical center diaphragm | 11.25 | 349.5 | 4.5 | 1573 |
| Curved center diaphragm | 11.81 | 366.9 | 4.5 | 1651 |
© 2020 by the authors. Licensee MDPI, Basel, Switzerland. This article is an open access article distributed under the terms and conditions of the Creative Commons Attribution (CC BY) license (http://creativecommons.org/licenses/by/4.0/).
Share and Cite
MDPI and ACS Style
Zhou, Z.; Tan, Z.; Zhao, J.; Liang, H. Development and Research on the Vertical Center Diaphragm Method Applied in Shallow Tunnel Construction. Symmetry 2020, 12, 855. https://0-doi-org.brum.beds.ac.uk/10.3390/sym12050855
AMA Style
Zhou Z, Tan Z, Zhao J, Liang H. Development and Research on the Vertical Center Diaphragm Method Applied in Shallow Tunnel Construction. Symmetry. 2020; 12(5):855. https://0-doi-org.brum.beds.ac.uk/10.3390/sym12050855
Chicago/Turabian StyleZhou, Zhenliang, Zhongsheng Tan, Jinpeng Zhao, and Han Liang. 2020. "Development and Research on the Vertical Center Diaphragm Method Applied in Shallow Tunnel Construction" Symmetry 12, no. 5: 855. https://0-doi-org.brum.beds.ac.uk/10.3390/sym12050855
Note that from the first issue of 2016, this journal uses article numbers instead of page numbers. See further details here.