Article

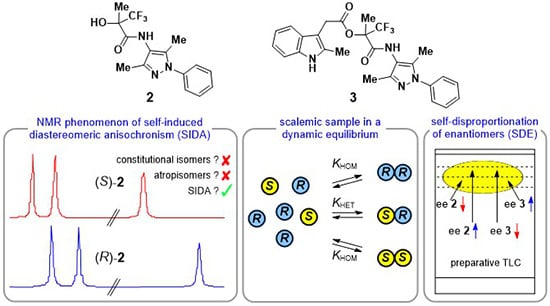
Potentially Mistaking Enantiomers for Different Compounds Due to the Self-Induced Diastereomeric Anisochronism (SIDA) Phenomenon

1
Cancer Drug Development, German Cancer Research Center (DKFZ), Im Neuenheimer Feld 280, D-69120 Heidelberg, Germany
2
Institute of Chemistry, Jan Kochanowski University in Kielce, Uniwersytecka 7, 25-406 Kielce, Poland
3
Department of Organic Chemistry I, Faculty of Chemistry, University of the Basque Country UPV/EHU, Paseo Manuel Lardizábal 3, E-20018 San Sebastián, Spain
4
IKERBASQUE, Basque Foundation for Science, Alameda Urquijo 36-5, Plaza Bizkaia, E-48011 Bilbao, Spain
*
Authors to whom correspondence should be addressed.
Submission received: 4 June 2020 / Revised: 15 June 2020 / Accepted: 19 June 2020 / Published: 2 July 2020
(This article belongs to the Special Issue Chiral Auxiliaries and Chirogenesis II)

Abstract

:
The NMR phenomenon of self-induced diastereomeric anisochronism (SIDA) was observed with an alcohol and an ester. The alcohol exhibited large concentration-dependent chemical shifts (δ’s), which initially led us to erroneously consider whether two enantiomers were in fact atropisomers. This highlights a potential complication for the analysis of chiral compounds due to SIDA, namely the misidentification of enantiomers. A heterochiral association preference for the alcohol in CDCl3 was determined by the intermolecular nuclear Overhauser effect (NOE) and diffusion measurements, the same preference as found in the solid state. The ester revealed more subtle effects, but concentration-dependent δ’s, observation of intermolecular NOE’s, as well as distinct signals for the two enantiomers in a scalemic sample all indicated the formation of associates. Intermolecular NOE and diffusion measurements indicated that homochiral association is slightly preferred over heterochiral association in CDCl3, thus masking association for enantiopure and racemic samples of equal concentration. As observed with the alcohol, heterochiral association was preferred for the ester in the solid state. The potential problems that SIDA can cause are highlighted and constitute a warning: Due care should be taken with respect to conditions, particularly the concentration, when measuring NMR spectra of chiral compounds. Scalemic samples of both the alcohol and the ester were found to exhibit the self-disproportionation of enantiomers (SDE) phenomenon by preparative TLC, the first report of SDE by preparative TLC.

Graphical Abstract

1. Introduction

The NMR phenomenon of self-induced diastereomeric anisochronism (SIDA) occurs when chiral molecules that associate in solution in a dynamic equilibrium that is fast on the NMR timescale have significant condition-dependent NMR chemical shifts (δ’s). In such systems, molecules can be present either as single molecules (SM), homochiral associates (HOM), or heterochiral associates (HET) in solution (Figure 1). Since the formation constant for the association of homochiral molecules (Khom), i.e., R with R or S with S, is likely to be different to the formation constant for the association of heterochiral molecules (Khet), the positions of the two equilibria will likely be different. The observed chemical shift (δobs) of a nucleus is therefore the population-weighted average of the δ’s of the nucleus in the three states SM, HOM, and HET [1,2]. Furthermore, as the equilibrium shifts with a change in conditions (e.g., concentration), the contributions of the δ’s from the SM, HOM, and HET states to the population-weighted average δ alter accordingly. Due to these dynamic effects, enantiopure and racemic solutions can exhibit distinct spectra, and even distinct signals for the two enantiomers can result in the case of scalemates [1,3]. The SIDA phenomenon has recently been well reviewed [1] and a deeper explanation of SIDA is provided in Appendix A.
In one of our drug discovery projects, we recently encountered the SIDA phenomenon, which caused us to ponder the identity of a pair of synthesized enantiomers and their resulting derivatives. This process and the enigmatic results presented by the compounds were examined in detail and the results are reported herein. In particular, we were interested in determining the solution-state association preference, i.e., whether HOM or HET are favored. There are a number of means to do this by NMR, including evaluation of T1s, T2s, and δ’s—though careful interpretation is generally required for these parameters—as well as by more direct methods, including diffusion measurements, enantiomeric titration [2,4], serial dilution, and nuclear Overhauser effect (NOE) measurements. Knowledge of the solution-state association preference can have valuable practical application: For example, which portion—the racemic portion or the enantiomeric excess portion—is likely to elute first under chromatographic conditions that will lead to the self-disproportionation of enantiomers (SDE), a related phenomenon [5,6,7,8,9] also based on the association of chiral molecules. Such knowledge is particularly applicable for size-exclusion chromatography [10]. An explanation of the SDE phenomenon is also provided in Appendix A.

2. Materials and Methods

2.1. Spectroscopy

NMR spectra were acquired at 25 °C using Bruker 14.1 T Avance and 9.4 T Avance III NMR spectrometers operating at 600 and 400 MHz, respectively, for 1H nuclei, 150 and 100 MHz, respectively, for 13C nuclei, and 376 MHz (9.4 T) for 19F nuclei. The chemical shifts of 1H and 13C nuclei are reported relative to TMS (δ = 0 ppm for both) using the solvent signals as secondary standards (δH = 7.26 ppm; δC = 77.16 ppm) while 19F nuclei were referenced externally to TFA (δ = −78.5 ppm). Diffusion measurements were made without sample spinning using the bipolar pulse pair longitudinal eddy current delay (BPPLED) sequence [11] employing half-sinusoidal gradient pulses. The gradient strength was incremented linearly in 16 steps from 0.65 to 61.75 or 64.35 G/cm; the diffusion delay big delta, Δ, was set to 50 ms; little delta, δ, to 2 ms; the gradient pulses to 1 ms; the eddy current delay, Te, to 5 ms; the Aq and post-acquisition delay (PAD) times together totaled 9.4 s; and the number of scans per gradient increment was 8 or 24. Numerical values for D were calculated based on the area using curve-fitting procedures available in the standard Bruker Software Package TopSpin 3.6. For selective 1-D NOESY spectra, 180° Gaussian-shaped pulses of 50- or 100-ms duration were used for the double pulse spin echo with an optimal mixing time, τm, of 300 ms for short-range contacts. The 13C NMR spectrum of (scl)-3 was acquired with a flip angle of 90°, an Aq time of 7 s, and a PAD of 0.1 s to avoid the prominent sinc wiggles when a more typical Aq time is used followed by Fourier transformation without any applied line broadening, necessary here to observe closely resonating signals. To exclude temperature effects on the position of the equilibria, samples introduced into the magnet were allowed to equilibrate for more than 5 min prior to the start of acquisition, a protocol considered sufficient for temperature equilibration when the temperatures of the probe and the room are effectively the same and when samples have been equilibrated to the temperature of the room for more than 20 min. Longer times, more than 20 min, were used for temperature equilibration within the magnet for probe temperatures different to the room temperature. In addition, proton spectra were routinely checked after other spectra had been run, e.g., after a set of 2-D spectra or after a carbon spectrum, and when re-inserting the sample at a later time. In all cases, changes in the proton spectra were not observed. Samples were prepared as solutions of 20 mg in 700 μL in various solvents; for (rac)-2 and (scl)-2, as saturated solutions (~3 mg mL−1) due to the insolubility of the racemate; or as otherwise indicated.
IR spectra were recorded using a Bruker LUMOS instrument equipped with a germanium crystal for ATR measurements. IR spectra were acquired at least twice for each sample using different aliquots to check for consistency.

2.2. Preparative TLC

For preparative TLC, scalemic samples of the alcohols 2 {37.0 mg, ~70% enantiomeric excess (ee)} and the esters 3 (20.2 mg, ~80% ee) were dissolved in chloroform and loaded onto preparative TLC plates (PLC Silica gel 60 F254, 2 mm thickness, 20 × 4 cm, Merck). After development (alcohols 2: Rf, 0.86; distance traversed, 12 cm; esters 3: Rf, 0.66; distance traversed, 9 cm) using ethyl acetate–n-hexane (8:1) as eluent, each of the resulting bands were divided into three fractions and the silica gel for each fraction scratched off and collected. The compounds were desorbed from the silica gel using methanol and, after filtration, the methanol removed under reduced pressure. The residual material was further dried under high vacuum for 1 h, yielding recovered weights of 7.2, 23.4, and 2.4 mg for fractions 1–3, respectively, for alcohols 2; and 3.5, 11.9, and 4.0 mg for fractions 1–3, respectively, for esters 3. The recovery process unexpectedly resulted in esters 3 undergoing methanolysis to provide the alcohols 2 as isolates (together with the methyl ester of the indole moiety). The ee’s of the fractions of both 2 and 3 were thus analyzed similarly. The ee’s of the fractions were evaluated by 19F NMR spectroscopy using (R)-1,1′-bi-2-naphthol as a chiral solvating agent (CSA) in CDCl3 at a concentration of 21 mg/mL. 19F{1H} NMR spectra with inverse-gated decoupling were acquired with a flip angle of 30°, an Aq time of 4 s, and a PAD of 3.0 s to ensure reliable quantitation of the ee. The 19F NMR FIDs were first processed with a double Gaussian window function prior to Fourier transformation and the signals of the enantiomers deconvoluted using Bruker NMR software (TopSpin 2.1). For the alcohols 2, ee’s of 71.4%, 67.4%, and 64.5% were found for fractions 1–3 (Δee, 6.9%), respectively; while for the esters 3, ee’s of 76.0%, 78.2%, and 86.8% were found for fractions 1–3 (Δee, −10.8%), respectively.

3. Results and Discussion

Starting from commercially available enantiopure acids (S)-1 and (R)-1, we synthesized the chiral alcohols (S)-2 and (R)-2 and then esters (S)-3 and (R)-3 (Figure 2) in parallel fashion as potential inhibitors of kallikrein-related peptidase 6 (KLK6) [12].

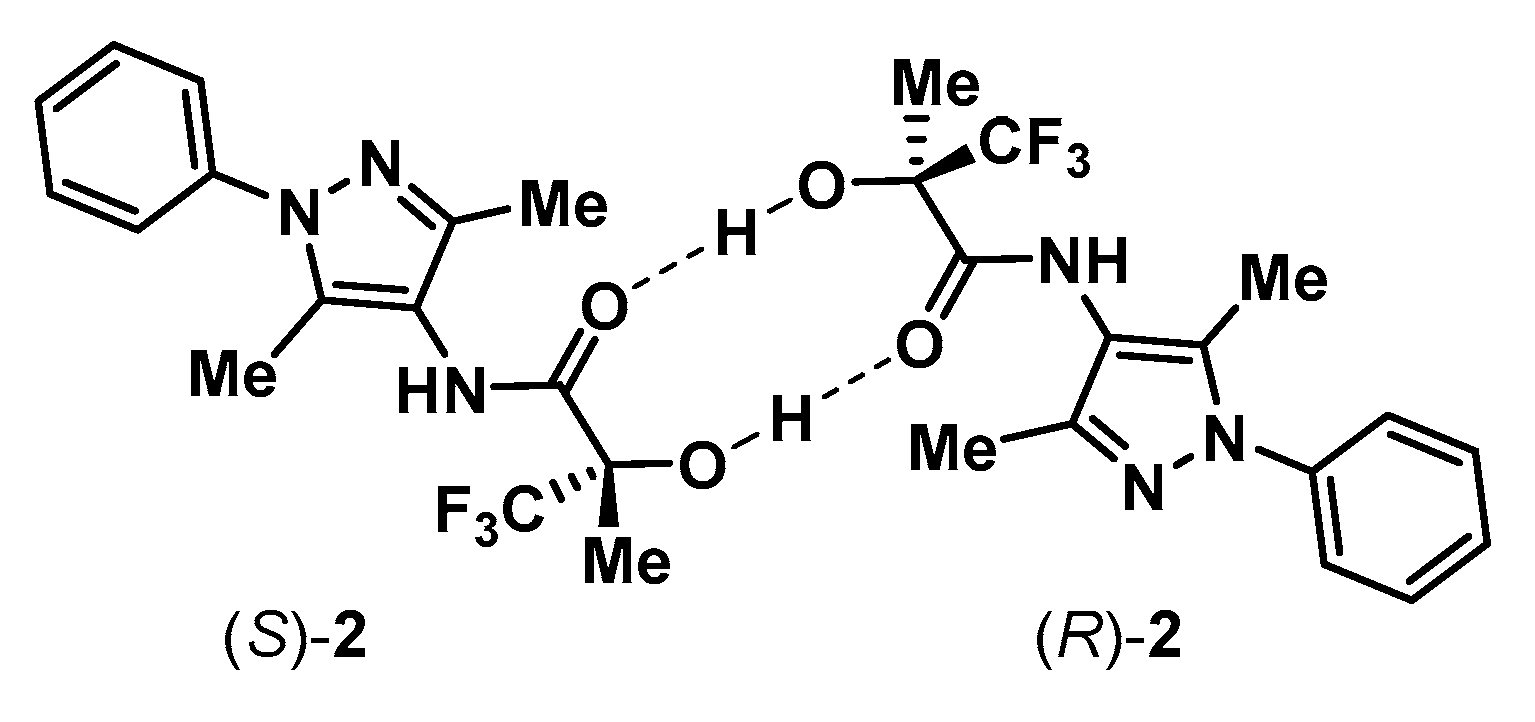
3.1. Analysis of Alcohols 2

Unexpectedly, the initially measured 1H NMR spectra of (S)-2 and (R)-2 in CDCl3 showed distinct δ differences for all three methyl resonances H-12, H-11, and H-4 (Δδ’s of 0.02, 0.03, and 0.07 ppm, respectively) (Figure 3). This led us to speculate that samples of (S)-2 and (R)-2 were not enantiomers but perhaps atropisomers that had been unwittingly isolated during purification. After considering that the NMR samples from which the spectra were recorded had been prepared with no attention directed toward the solution concentrations, we prepared new samples of (S)-2 and (R)-2 at the same concentration. The resulting 1H NMR spectra were essentially identical (Figure 3), suggesting that what we were observing was a relatively strong case of SIDA, i.e., the deviations in the original spectra were a result of differing degrees of molecular association as a consequence of only a 2-fold difference in concentration. Of note, while the Δδ’s were substantial for the methyl Hs, with the signals all more shielded at the increased concentration, only slight shielding was observed for the proton signals of the phenyl ring (Figures S1 and S2). Sizeable deshielding for both the amide and hydroxyl proton signals was seen at the increased concentration, indicative of strong hydrogen bonding and concomitant molecular association (Figures S1 and S2).
These observations are unsurprising as the –CF3 group, due to its high electron withdrawing capability, strongly enhances the hydrogen bonding capability of the hydroxyl group. Indeed, substances containing a –CF3 group [9,13,14], and trifluoromethyl lactic acid derivatives in particular [10,15,16,17,18,19,20,21,22,23,24], often highly express the SDE by chromatography, sublimation, and even distillation. What is unusual in the case of (S)-2 and (R)-2 is that a difference in spectra is observed between two enantiomers; usually, the differences in the spectra of two enantiomers are not stark. More often, it is the comparison of the enantiomer to the racemate where differences are discernible. There may be several reasons for this. First, the monomer vs. dimer/oligomer equilibrium probably lies well to the left in most cases, so a small difference in the concentrations of two solutions only leads to a small difference in the position of the equilibrium. This results in only a small change in the proportion of the associates and thus a minimal difference in the spectra. Second, HET may be more favored in general (Wallach’s rule [25]). This is not unlikely as >95% of compounds [26] that crystallize from a racemic solution form a racemic crystallographic unit, i.e., they are racemic compounds (see Appendix A for the definition of a racemic compound), though whether the solid-state preference is generally maintained in the solution state is unknown.
In the case of (S)-2 and (R)-2, the large differences in the initial spectra for what seemed to be inconsequential differences in concentration could be due to an intermediate value of Khom (hence small changes in concentration provide significant changes in the proportion of the associates) and/or due to large δ differences for the associate. This is possibly a result of the bulky substituents on both sides of the amide leading to sizeable steric compression effects and/or the aromatic groups providing significant aromatic ring current-induced shielding for proximally positioned nuclei. For the latter case, even small shifts in the equilibria are able to provide sizeable differences in the spectra. Large observable Δδ’s can thus arise either due to sizeable K’s, high concentrations, or the large differences between the δ’s of nuclei in the various states (SM, HOM, and HET).
After having convinced ourselves that (S)-2 and (R)-2 were indeed enantiomers, we decided to examine their unusual SIDA effects in more depth and to determine the association preference in solution. We first prepared a sample of (rac)-2 in CDCl3 at the same concentration as the enantiopure samples by mixing equal volumes of the (S)-2 and (R)-2 solutions. To our surprise, ~90% of the material promptly precipitated out of this solution. This result indicates that (rac)-2 is a racemic compound, at least when crystallizing from CDCl3 solution, and the association preference in the solid state is, therefore, heterochiral. Because of the low solubility of (rac)-2, only dilute CDCl3 solutions (~3 mg mL−1) of (S)-2, (rac)-2, and (scl)-2 (ee ~33%) could be compared, which limited the level of association to such an extent that Δδ’s between the solutions of (S)-2 and (rac)-2 were practically imperceptible. Furthermore, peak splitting (i.e., distinct signals for the two enantiomers) could not be observed for (scl)-2, see Supplementary Materials Figures S3–S5. Other solvents were found to be unsuitable as (rac)-2 showed a similarly low solubility in CD2Cl2 and (S)-2 was insoluble in CCl4 and d8-toluene. In d6-acetone, d8-THF, and d3-acetonitrile, Δδ’s between the spectra of (S)-2 and (rac)-2 samples at the same concentration were not observed, implying a lack of association in these solvents. In the case of d8-THF, this was further supported by a sample of (scl)-2 at −11.8 °C, wherein peak splitting was not observed for any 1H, 19F, or 13C nuclei.
That the association in CDCl3 is primarily hydrogen bond-based, as opposed to π–π stacking for example, was supported by the suppression of the SIDA process in d6-acetone, d8-THF, and d3-acetonitrile, and a possible hydrogen bond-based dimeric structure accounting for this is depicted in Figure 4. Dimeric associates are likely in the case of 2, and such a constrained structure could be expected to result in distinct K’s, as was found to be the case by NOE and D measurements (vide infra).
In order to directly detect association, we performed selective 1-D NOESY measurements on samples of (S)-2 and (rac)-2 in CDCl3 at the same concentration. Irradiating either of the imidazolyl methyls revealed that enhancement of the alkyl methyl signal (H-4) was greater for the racemic solution, regardless of which imidazolyl methyl was irradiated, in comparison to the enantiopure solution (Figure 5). The observed differences in the NOE’s must be due to association and the NOE’s are clearly intermolecular due to the internuclear distances involved, more so given that the τm of 300 ms used is optimal for short range contacts. The larger NOE enhancements for the racemic solution indicate that HET is favored over HOM.
To confirm HET preference in CDCl3, we measured diffusion coefficients (D), calculating a value of 1.11 × 10⁻⁹ m2s−1 for a sample of (rac)-2 and 1.44 × 10⁻⁹ m2s−1 for a sample of (S)-2 at the same concentration. The faster diffusion of the molecules in the sample of (S)-2 indicates that the equilibrium is positioned more toward single molecules, supporting the preference for HET found by NOE measurements. Further explanation of the associate preference is provided in Appendix A.
The IR spectra of crystals of (S)-2 and crystals formed from a solution of (rac)-2 revealed differences in the fingerprint region (Figures S19–S22), thus confirming the nature of the compound; crystal formation containing both enantiomers in the unit cell is favored over the formation of enantiopure crystals, i.e., it is a racemic compound. This is consistent with the solubility observation and also is in concert with the solution-state association preference. Most notable is the strong sharp band for the OH stretch at 3327 cm−1 in the IR spectrum of crystals of (rac)-2, indicative of the presence of strong hydrogen bonds, presumably intermolecular, and which was effectively absent in the IR spectrum of crystals of (S)-2.
Since there is a strong molecular association occurring between the alcohols (S)-2 and (R)-2 in solution, we wondered if this could result in manifestation of the SDE phenomenon and, moreover, if this could be discerned by TLC. Despite trying a number of eluents, including 50% and 60% ethyl acetate in n-hexane, 10% ethyl acetate in CHCl3, 10% methanol in CH2Cl2, and 40% methyl tert-butyl ether in CH2Cl2 as well as the NMR solvent CHCl3 itself, we could not discern any indication for the occurrence of the SDE (e.g., an enlargement of the spot for the scalemate relative to the spots for the enantiomer and the racemate or to see a difference in Rf between the enantiomer and the racemate). Though normally highly polar eluent mixtures are not recommended to observe the SDE in cases where the intermolecular interactions are based on either hydrogen bonding or dipole–dipole interactions due to suppression of the intermolecular interactions, highly polar eluent mixtures were required in this instance to force the compounds to migrate up the TLC plate. Even using low polarity eluents, e.g., 5% and 10% methyl tert-butyl ether in CHCl3, and recycling (i.e., developing the slide, drying the slide, and then re-developing the slide again) several times to effect migration with the type of “weak” eluent that is often most successfully used for SDE via column chromatography [13,27,28], was unsuccessful.
A sample of (scl)-2 was also subjected to preparative TLC using silica gel as the stationary phase and ethyl acetate–n-hexane (8:1) as the eluent. For a sample of ~70% ee loaded onto the plate, a Δee (see Appendix A) of 6.9% was found across the three factions extracted from the resulting band. The first eluting fraction was found to be more enantiopure than the ensuing fractions, which were progressively more racemic. To the best of our knowledge, this is the first reported occurrence of the SDE via preparative TLC. The fact that we could not observe any SDE effects by TLC was presumably due to the low Δee, and higher resolution systems might be required for the SDE to become apparent [29].

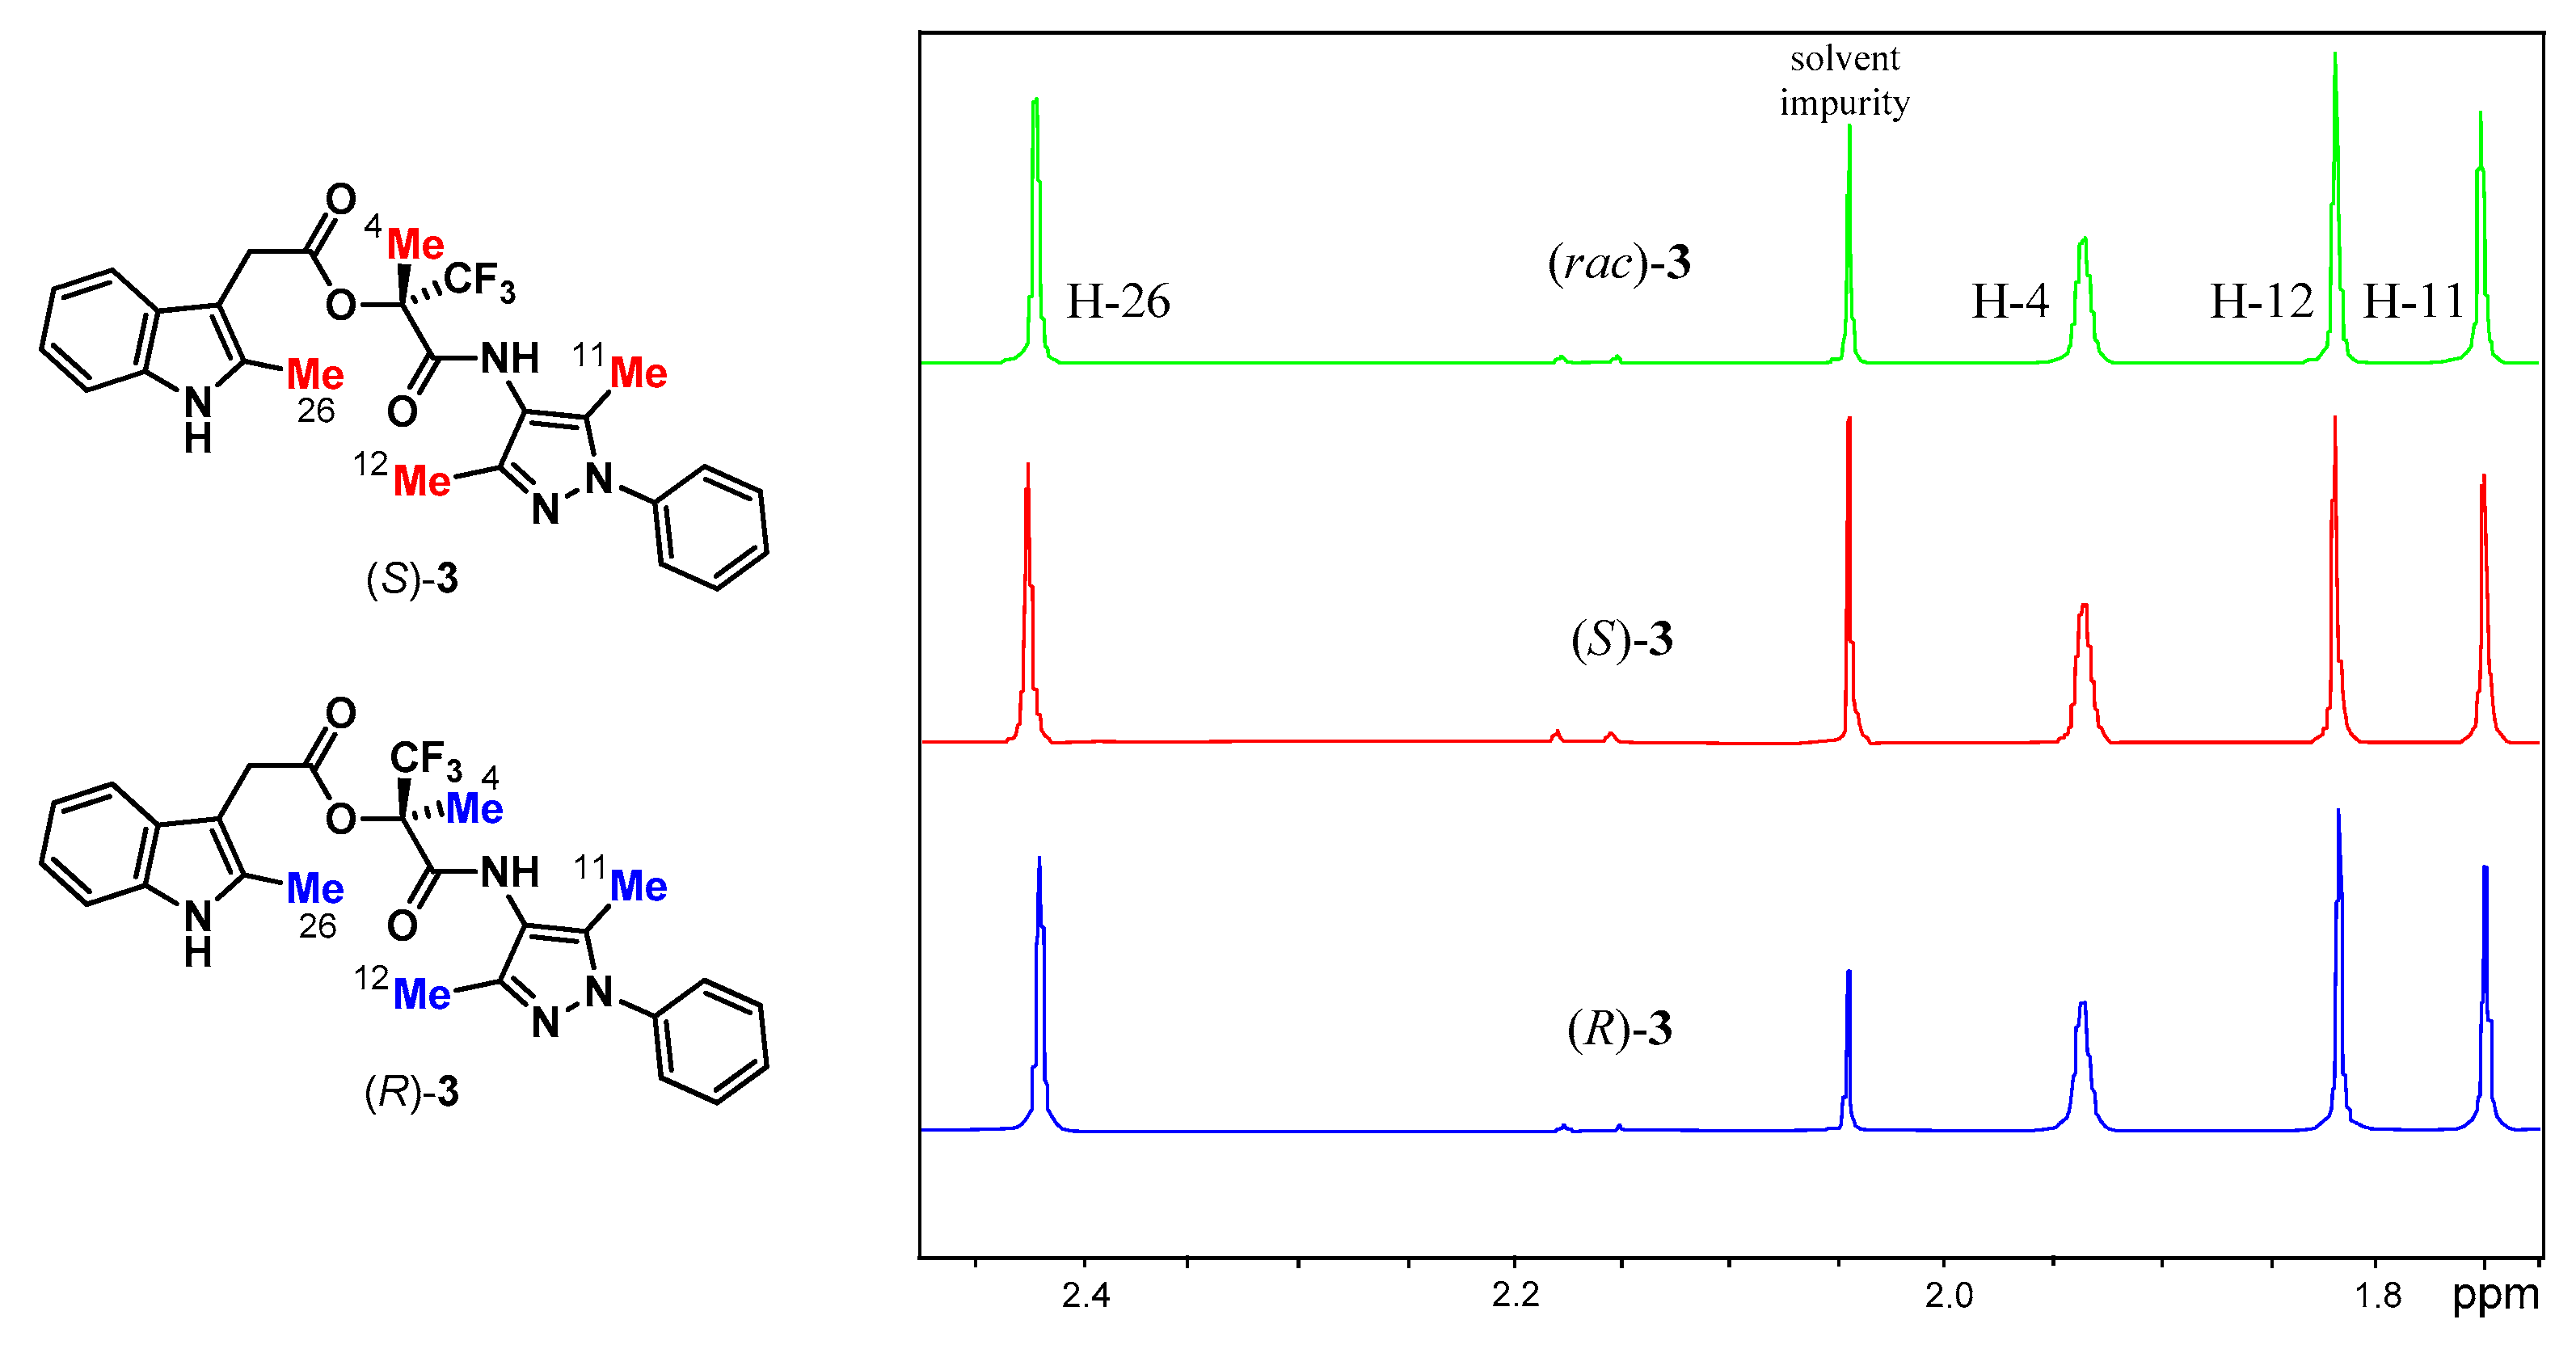
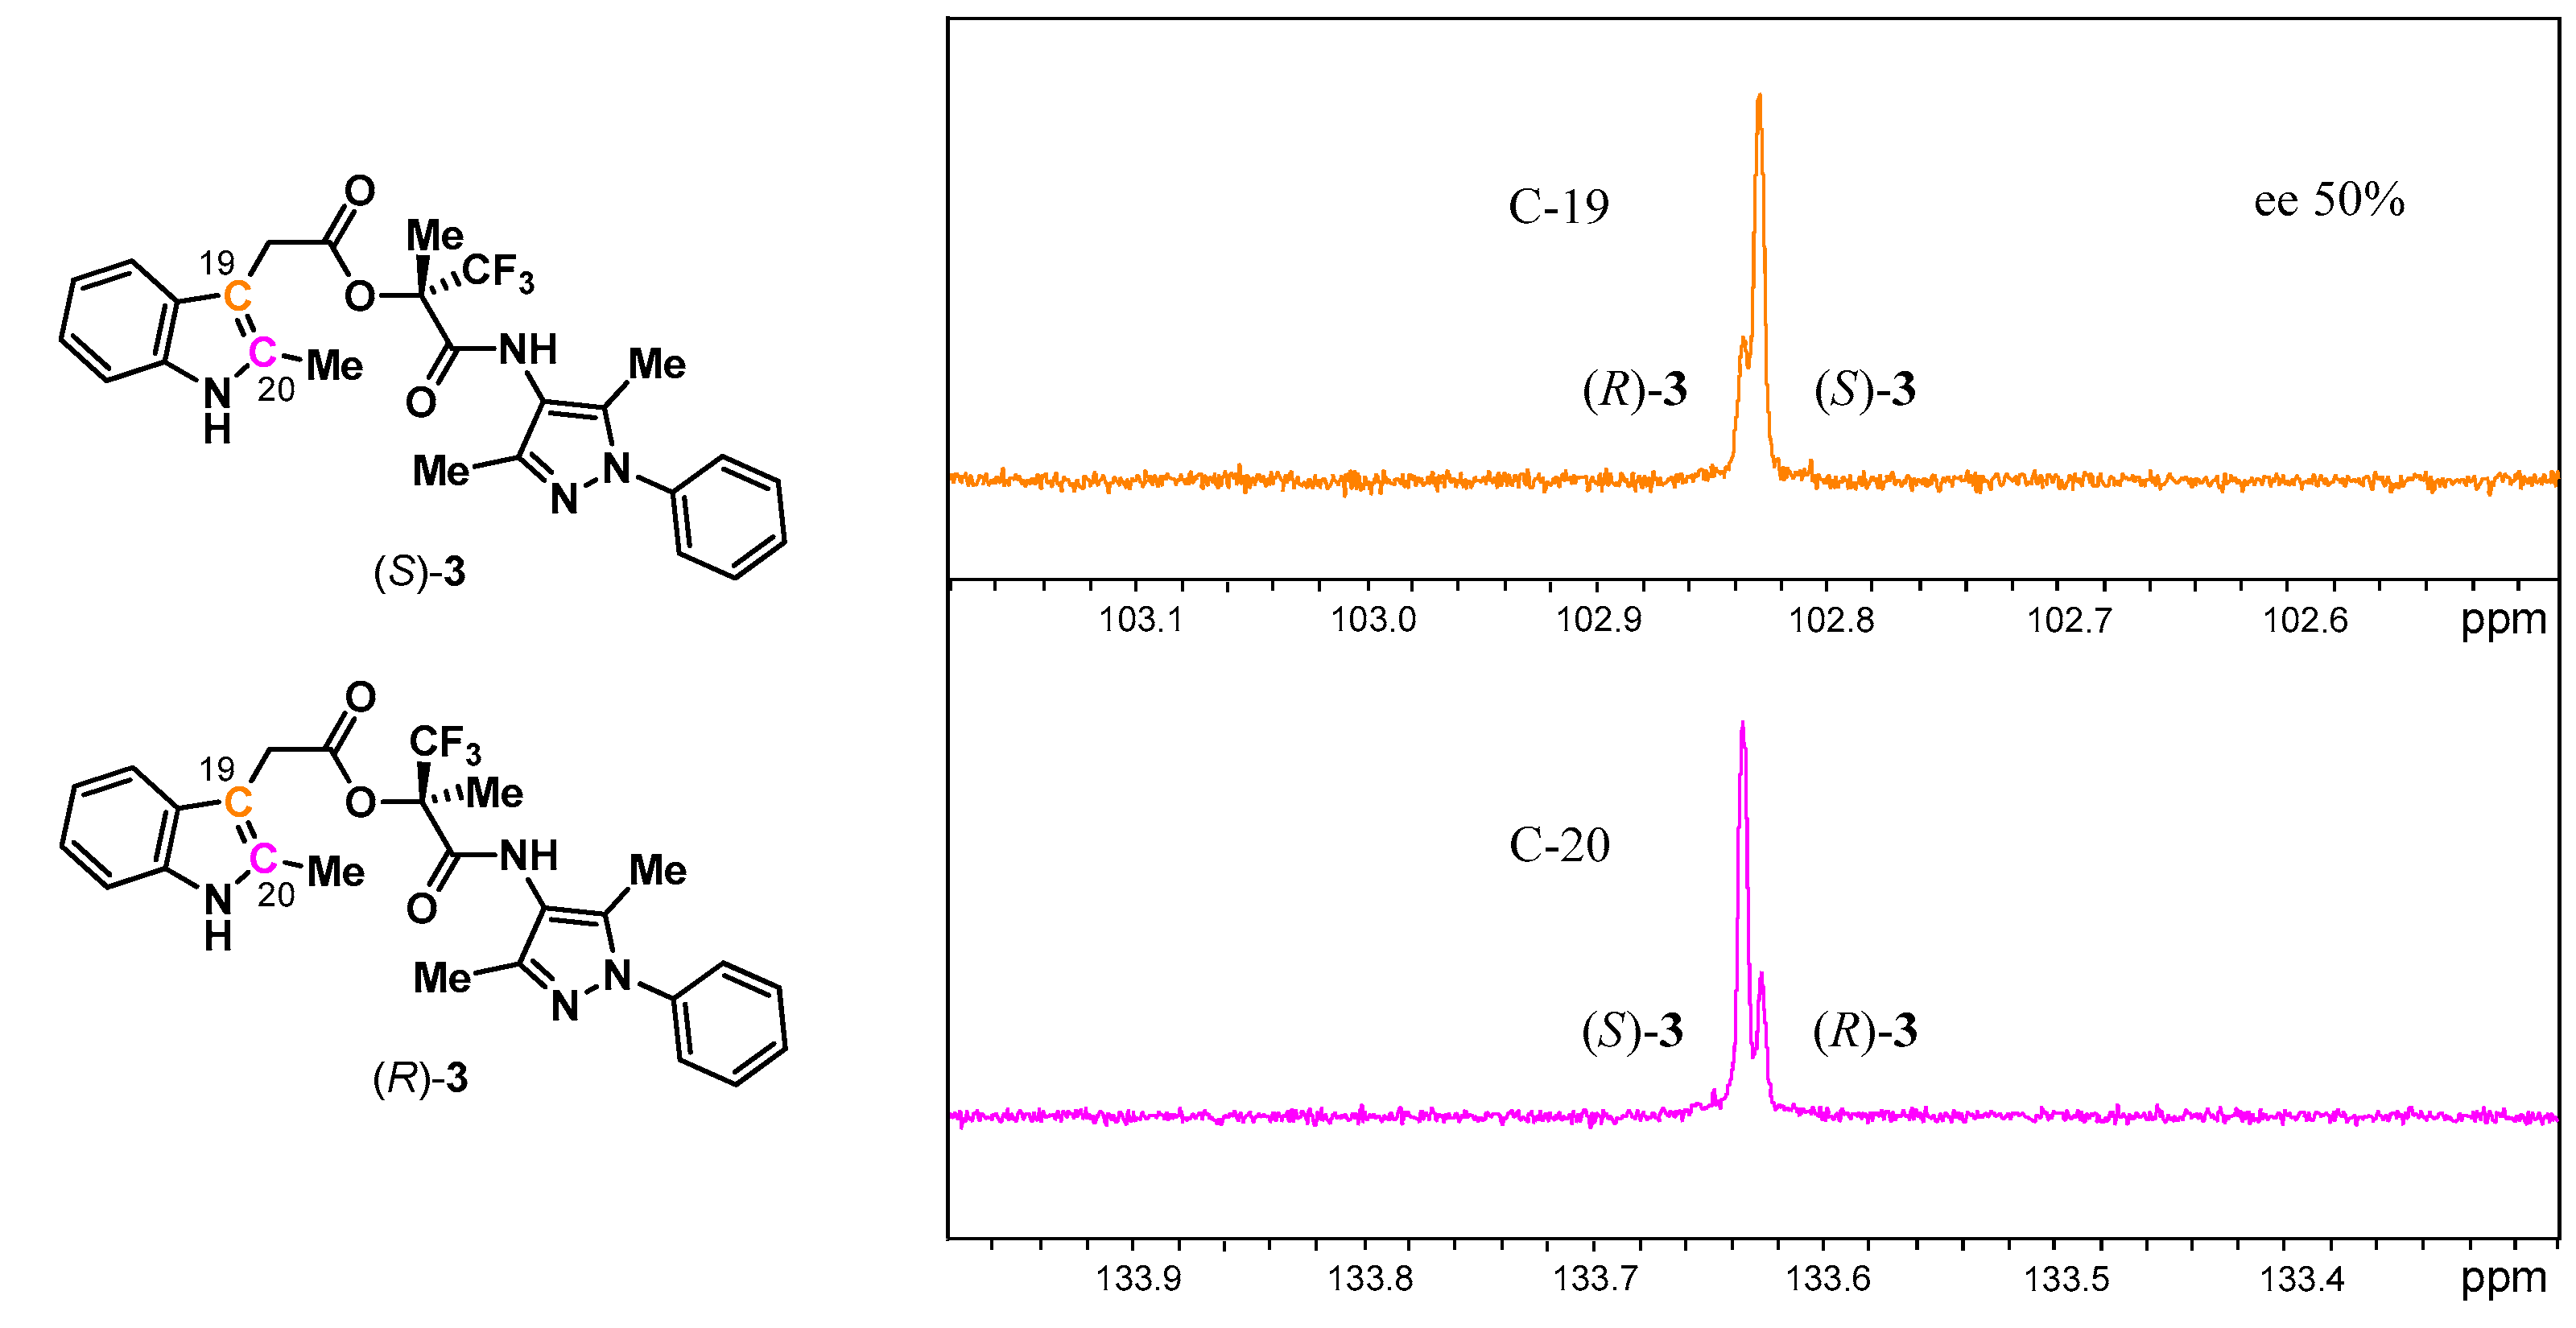
3.2. Analysis of Esters 3

We did not expect analogous intermolecular interactions, and therefore SIDA, for esters 3 as the hydroxyl group, which we thought to be important for forming the intermolecular hydrogen bonds in alcohols 2, is not available. Indeed, samples of (S)-3, (R)-3, and (rac)-3 at identical concentrations in CDCl3 all provided closely matched 1H (Figure 6, Figures S6 and S7), 19F (Figure S8), and 13C (Figures S9–S13) NMR spectra. While this pointed to the anticipated lack of association, we realized another scenario, although unlikely, was still possible: If 3 has similar values of Khom and Khet, together with very similar δ’s for HOM and HET, the spectra would appear nearly identical despite association being operative. Upon careful examination, association did appear to be taking place in CDCl3 as evidenced by concentration-dependent Δδ’s, albeit to a lesser extent than was observed with alcohols (S)-2 and (R)-2, and peak splitting of (scl)-3. For example, a 3.4-fold increase in the concentration for ester (S)-3 only led to slight shielding of the imidazolyl and alkyl methyl H’s (0.01, 0.01, and <0.00 ppm) (Figure S16) in comparison to the analogous Δδ’s for a 2-fold increase in the concentration for alcohols (S)-2 and (R)-2 (0.02, 0.03, and 0.07 ppm) (Figure 3). By contrast, the signals of the indolyl methyl Hs of ester (S)-3 were shielded by 0.05 ppm with a 3.4-fold increase in concentration (Figure S16). With increased concentration, the signals of the aromatic indolyl protons H-22 and H-23 were shielded significantly (by 0.06 and 0.03 ppm, respectively), while the signals of the phenyl H’s, like for alcohols (S)-2 and (R)-2, and the signals of the methylene H’s were only slightly shielded (Figures S17 and S18). As observed with alcohols 2, both the amide and indolyl NH signals of ester (S)-3 were deshielded with increasing concentration (Figure S17), thus in contrast to all other carbon-bound signals, which were shielded. The deshieldings of the amide and indolyl NH signals were smaller for 3 compared to 2, thereby indicating weaker hydrogen bonding in the molecular associates. Of note though, the indolyl NH signal shifted much more than the amide NH signal: 0.29 vs. 0.04 ppm. Furthermore, peak splitting (Figure 7 and Figure 8) in the spectrum for a sample of (scl)-3 in CDCl3 (50% ee) was only of very small magnitude and was only evident on two proton signals (H-11 and H-21), not evident at all on the fluorine signal, and only observed on five carbon signals (C-7, C-13, C-19, C-20, and C-23), none of which were methyls.
Small SIDA effects are consistent with smaller values for Khom and Khet or similar values for Khom and Khet. The intermolecular interactions are still based on hydrogen bonds, but now involve the indolyl NH rather than the hydroxyl, evident by the deshielding of the indolyl NH signal at the increased concentration and its splitting in the scalemic sample. π–π stacking may possibly also be involved in forming associates, and the amide NH too as its signal was also deshielded with increasing concentration, though it was not split in the scalemic sample.
If the ester forms a very flexible dimeric macrocycle involving the indolyl NH and the amide carbonyl, or an oligomeric chain, then it is unsurprising that there is little difference in the K’s. Additionally, there are no longer the large Δδ’s from steric compression and/or aromatic ring current-induced shielding that are present in the alcohols (S)-2 and (R)-2 for the imidazolyl and alkyl methyls. Hence, the spectra of the enantiopure and racemic samples are very similar and there is not a strong concentration dependency. If Khom = Khet, distinct spectra can still result for scalemates as long as δhomδhet. Although the mole fraction of each enantiomer present in the associates (i.e., HOM and HET together) would be the same for both enantiomers in such a case, the distribution between HOM and HET would not be the same. However, with similar contents of associates in both samples irrespective of their identity, and presumably similar δ’s between HOM and HET, little discernible difference results in the spectra.
Selective 1-D NOESY measurements in CDCl3 for samples of (S)-3 and (rac)-3 with irradiation of the imidazolyl methyl H’s revealed enhancements of the signals of the alkyl methyl (H-4), indolyl methyl (H-26), and the aromatic indolyl H’s in both cases. Since NOE’s from the imidazolyl methyls to the indole moiety can only be intermolecular, these NOE’s confirm the association. However, more pertinently, the enhancements of the signals of the alkyl methyl (H-4), the indolyl methyl (H-26), and the aromatic indolyl H’s could not be differentiated between samples of (S)-3 and (rac)-3 at the same concentration (Figures S14 and S15), thereby indicating that HET and HOM are virtually equally favorable, i.e., KhomKhet.
Measurement of D yielded a value of 9.05 × 10⁻¹⁰ m2s−1 for a sample of (rac)-3 and 8.43 × 10⁻¹⁰ m2s−1 for a sample of (S)-3 at the same concentration in CDCl3. The slightly faster diffusion of the molecules in the racemic sample implies that the equilibrium is positioned more toward the single molecules, i.e., HOM is preferred, though the small difference in diffusion rates clearly implies that the values of Khom and Khet are very similar, in concert with the NOE measurements.
Differences were also observed in the IR spectra of crystals of (R)-3 and crystals formed from a solution of (rac)-3 in the fingerprint region (Figures S23–S26), though the differences were less obvious in comparison to the differences observed between the spectra of (S)-2 and (rac)-2. With the hydroxyl group no longer available for strong hydrogen bonding, the intermolecular interactions for the ester are likely to be weaker in the solid state, or at least the differences are not accentuated between homo- and heterochiral interactions, thus resulting in only small differences between the enantiopure and racemic crystals. Again though, crystal formation containing both enantiomers (S)-3 and (R)-3 in the unit cell is favored over the formation of enantiopure crystals from a racemic solution, i.e., (rac)-3 is also a racemic compound.
Thus, the solution-state preference for esters (S)-3 and (R)-3 is different to their solid-state preference as determined by diffusion measurements where HOM was found to be favored over HET, albeit slightly, or at least HOM and HET are close in energy. Similar values for Khom and Khet were also consistent with NOE measurements. The concentration dependencies of the δ’s for the esters (S)-3 and (R)-3 are more typical for enantiomers in that the Δδ’s with changes in concentration are relatively small and, thus, less apparent. Similar values for Khom and Khet, along with likely similar δ’s for HOM and HET, explain why the spectra of the enantiomers and the racemate are nearly identical, and also why there was only minimal splitting of the peaks for a scalemic sample.
The same TLC analyses of a sample of (scl)-3 also failed to provide measurable detection of the SDE phenomenon, but nevertheless, (scl)-3 was also subjected to preparative TLC, again using silica gel as the stationary phase and ethyl acetate–n-hexane (8:1) as the eluent. For a sample of ~80% ee loaded onto the plate, a Δee of −10.8% was found across the three factions extracted from the resulting band. The negative sign for Δee indicates that the first eluting fraction was more racemic than the ensuing fractions, which were progressively more enantiopure, and, thus, the elution order is opposite to that of alcohols (S)-2 and (R)-2. Given that the elution order is unpredictable and varies among compounds [28,30], the reverse order for esters (S)-3 and (R)-3 relative to alcohols (S)-2 and (R)-2 is unsurprising, especially since there is a substantial change in the intermolecular interactions with esterification of the hydroxyl group. In line with this change, a shift in the solution-state association preference was also observed.

4. Conclusions and Final Comments

In addition to the well-known complications arising from SIDA in the comparison of enantiopure and racemic samples and peak splitting in the spectra of scalemic samples, sometimes the comparison of enantiopure samples can present problems. We suggest that the sizeable Δδ’s more often seen between enantiopure and racemic samples is because HET is much more preferred (Khet >> Khom), in accordance with Wallach’s rule [25] for crystal structures. For alcohol 2, particular structural features provided the large Δδ’s for enantiopure samples of varying concentrations even though HET was shown to be preferred over HOM. For 2 and 3, the solution-state association preference was demonstrated by intermolecular NOE’s and/or diffusion measurements. For 2, the heterochiral solution-state preference is the same as the solid-state preference while for 3, the homochiral solution-state preference is different to the solid-state preference, although the preference is slight. Similar values for Khom and Khet, along with likely similar δ’s for HOM and HET, explain why the spectra of (S)-3 and (R)-3 in comparison to (rac)-3 are nearly identical, and also why there was only very slight splitting observed for a few signals of (scl)-3.
There are a number of potential problems due to SIDA in addition to the aforementioned enantiopure vs. enantiopure sample comparison, such as the much more common problem of enantiopure vs. racemic sample comparison and the comparison of spectra to literature or databank spectra, where the concentration or composition (enantiopure or racemate) is unknown. In the latter case, spectra may look similar but are not exactly the same, yet researchers may have proven the structure of their compound, leading them to think that perhaps it is the racemate they possess and the literature or databank presents a spectrum of an enantiopure sample or vice versa. For scalemic samples, there is the additional problem that distinct peaks arising from the minor enantiomer can be misconstrued as impurities. We hope that this study presents a warning to practitioners to be on the lookout for the occurrence of SIDA in their own research and the problems it can cause, namely confusion, misidentification, and incorrect evaluation of purity, and thus caution is advised and care should be duly exercised when analyzing chiral compounds that are likely to form associates in solution with respect to the prevailing conditions, particularly the concentrations of the analytes. However, SIDA also represents an opportunity to be taken advantage of, e.g., the determination of the ee becomes simple when conditions are right [1,3]. Furthermore, with the occurrence of SIDA, one may consider if unconventional enantiopurification methods, such as SDE via chromatography, could be applicable as the two phenomena often occur together.
Finally, scalemic samples of both the alcohols 2 and the esters 3 were found to exhibit the phenomenon of SDE via preparative TLC; to the best of our knowledge, this is the first report of SDE by that form of chromatography. Interestingly, opposite orders of elution were observed for the two compounds. An interesting question is: Should the SDE be expected to be more or less prevalent for preparative TLC in comparison to column chromatography? Theory predicts that scaling down a system should result in enhancement of the SDE [29]; on the other hand, in practice, workers are likely to use lower loadings in preparative TLC in comparison to column chromatography and also to use stronger eluting solvents, conditions that are both expected to suppress the SDE [13,27,28].

Supplementary Materials

The following are available online at https://0-www-mdpi-com.brum.beds.ac.uk/2073-8994/12/7/1106/s1, further NMR spectra (Figures S1–S18) and IR spectra (Figures S19–S26).

Author Contributions

Conceptualization, K.D.K., A.K.M.; methodology, A.B., A.W., K.D.K., V.A.S.; formal analysis, A.B., A.W., K.D.K., V.A.S.; investigation, A.B., A.W., K.D.K.; resources, A.K.M.; data curation, A.B., A.W., K.D.K., V.A.S.; writing—original draft preparation, A.W., K.D.K.; writing—review and editing, A.B., A.W., V.A.S., K.D.K., A.K.M.; supervision, A.K.M.; project administration, A.K.M. All authors have read and agreed to the published version of the manuscript.

Funding

This research received no external funding.

Acknowledgments

Petra Krämer from the Organic Chemistry Institute, University of Heidelberg is thanked for acquiring the IR spectra. We also thank the anonymous referees for their insightful comments on some aspects of the work which we have included in the revised paper, in particular, the relaxation and NOE points.

Conflicts of Interest

The authors declare no conflict of interest.

Appendix A. Background to SIDA and SDE

Appendix A.1. SIDA

Appendix A.1.1. The Origin of SIDA

The SIDA phenomenon results from dynamic equilibria where chiral molecules can be present either as single molecules (SM), homochiral associates (HOM), or heterochiral associates (HET) in solution (Figure 1). Since the formation constant for the association of homochiral molecules (Khom), i.e., R with R or S with S, is likely to be different to the formation constant for the association of heterochiral molecules (Khet), then the positions of the two equilibria will differ at the same analyte concentration. The resulting observed chemical shift (δobs) of a nucleus for a dynamic equilibrium that is fast on the NMR timescale is therefore the population-weighted (based on mole fraction, χ) average of the δ’s of these three states (Equation (A1)) [1,2]:
δobs = χsm · δsm + χhom · δhom + χhet · δhet.
A possible consequence is that enantiopure and racemic solutions of a chiral compound may not have identical spectra, even at the same concentration. As a consequence of the position of the equilibrium shifting, the δ’s can be very temperature, concentration, and solvent dependent [1]. Moreover, it is possible for a scalemic sample to exhibit distinct NMR signals for the two enantiomers present for some of the nuclei since the mole fractions of each enantiomer within each state will not necessarily be the same. When distinct signals are present, integration or deconvolution of the signals provides the ee of the sample directly without any external chirality in favorable cases [1,3], i.e., a sample’s ee can be evaluated by simple achiral NMR without recourse to such methods as chiral shift reagents, chiral derivatizing agents, CSAs, or HPLC using chiral stationary phases. The phenomenon is illustrated schematically for a hypothetical scalemic sample in Figure A1.
Figure A1. Illustrative example for an NMR signal in a scalemic sample (2.5:1, ee = 43%), where the final summed result has distinct peaks representing the two enantiomers. Signal intensities have been set with respect to the χ of each species for each enantiomer present within that species and the relative concentrations of the enantiomers with respect to each other. In the net result, peak integration yields the sample ee directly.
Symmetry 12 01106 g0a1

Appendix A.1.2. Potential Sources of Error in the Quantitation of Ee by SIDA

It has been erroneously assumed [1] that the T1s and T2s for corresponding pairs of nuclei in the two enantiomers participating in a dynamic equilibrium in a scalemate are identical and thus equally affected by partial saturation and signal truncation arising from T1 and T2 abuse, respectively. Consequently, the possibility of misrepresentation of relative signal intensities for distinct SIDA signals due to these effects is disregarded for quantitation purposes if this is believed. These assumptions, however, are not valid.
Analogous to Equation (A1) for δobs, the T1 observed (T1,obs) for a particular nucleus is the population-weighted average of the T1s of the SM, HOM, and HET states (Equation (A2)):
T1,obs = χSM · T1,SM + χHOM · T1,HOM + χHET · T1, HET.
Since the distribution between the three states is not the same for the two enantiomers in a scalemate, the T1s of corresponding nuclei may potentially differ significantly for the two enantiomers in a particular system. If partial saturation occurs for the signals used for quantitation due to T1 abuse, i.e., poor choice of the time allowed for relaxation and/or flip angle, then erroneous evaluation of the ee may result. This is a consideration that should be borne in mind when quantifying signals under such conditions and, if need be, measurement of the T1s should be undertaken.
For nuclei with T2s that are long relative to the Aq times typically used, e.g., 13C nuclei, truncation of the FID can similarly potentially lead to erroneous quantitation of the ee. Analogous to Equations (A1) and (A2), the T2 observed (T2,obs) for a particular nucleus is similarly the population-weighted average of the T2s of the SM, HOM, and HET states (Equation (A3)):
T2,obs = χSM · T2,SM + χHOM · T2,HOM + χHET · T2, HET.
Since the distribution between the three states is not the same for the two enantiomers in a scalemate, the T2s of corresponding nuclei may potentially also differ significantly for the two enantiomers in a particular system. If truncation occurs for the signals used for quantitation due to T2 abuse, i.e., the Aq time is too short, then erroneous evaluation of the ee may result. This is also a consideration that should be borne in mind when quantifying signals under such conditions and, if need be, measurement of the T2s should be undertaken if it is not apparent otherwise that the FID is being truncated. To a degree, issues with T2 can be rectified by linear prediction processing.
Additionally, for nuclei that are routinely acquired with NOE enhancement, e.g., 13C nuclei, there is also the possibility of erroneous measurement of the ee due to the NOE since the NOE effects on the corresponding pairs of nuclei in the two enantiomers are again not necessarily equal. Differences can potentially arise from intermolecular NOE’s in the associates, intramolecular NOE’s altered by conformational changes due to association, and changes in the NOE enhancement due to changes in the molecular correlation time as a result of association. Again, any differences between corresponding nuclei pairs in the two enantiomers is a consequence of the unequal distribution among the SM, HOM, and HET states and the NOE observed (ηobs) for the signal of a particular nucleus is the population-weighted average of the η‘s of the SM, HOM, and HET states (Equation (A4)):
ηobs = χsm · ηsm + χhom · ηhom + χhet · ηhet.
In practice, errors in the measurement of ee due to the NOE are likely to be negligible in all but exceptional cases. Nevertheless, if pulse sequences that utilize decoupling and thus give rise to an NOE can be avoided (such is the case for 19F and 31P nuclei) or the NOE is suppressed by use of a relaxation agent, then it may be safer to do so since determination of the effect of NOE in these circumstances is difficult.
Of note, these concerns regarding quantitation apply equally well when using a CSA for the measurement of ee.

Appendix A.1.3. Identification of Associate Preference by Diffusion

As per δ, T1, T2, and η, the diffusion rate can also be described in terms of a population-weighted average of the SM, HOM, and HET states (Equation (A5)):
Dobs = χsm · Dsm + χhom · Dhom + χhet · Dhet.
For a comparison of racemic and enantiopure samples to ascertain the associate preference, the diffusion rates of HOM and HET are considered to be of equal value and to be greater than the diffusion rate of SM, i.e., DhomDhet > Dsm. If a racemic sample of equal total molecular concentration to an enantiopure sample is found to have a slower diffusion rate than an enantiopure sample, then the formation of associates in the racemic sample must be greater, which can only be accounted for by the formation of HET, since in an enantiopure sample, only HOM are possible. Thus, the formation of HET is concluded to be favored over HOM in such a scenario. The converse applies if the racemate has a faster diffusion rate than an enantiopure sample since in a racemic sample, the concentrations of each of the enantiomers are only half that of an enantiopure sample at the same total molecular concentration. Thus, a faster diffusion rate for a racemic sample infers that there is less overall association and HET is concluded to be less favored than HOM in such a scenario.

Appendix A.2. SDE

Analogous to the SIDA explanation, an alternative way to perceive SDE via chromatography (SDEvC) is to consider it in terms of contributing species to a population-weighted averaged velocity (νobs) along the chromatographic column for each enantiomer according to the χ spent in each state (Equation (A6)):
νobs = χsm · νsm + χhom · νhom + χhet · νhet.
A crucial difference to SIDA is that for SDEvC, the conditions change with the progress of the chromatography due to dilution and the separation of the enantiomeric excess and racemic portions. In other words, the concentrations and relative proportions of the enantiomers alter spatially with chromatographic development (i.e., along the peak profile—the SDE effect), thus it is a dynamic system and the situation at any time point is only transitory while SIDA is very much a static system at the macroscopic level. Therefore, it is important to note that the above equation does not describe the chromatographic outcome in reality, and it is only an illustrative guide for pedagogical purposes for comprehending the SDE phenomenon. The pertinent point of the equation is that there can be various contributions to the separation of the enantiomeric excess and racemic portions due to the SDE phenomenon: Single molecules vs. dimers, homochiral vs. heterochiral associates, oligomers vs. monomers/dimers, and so on. Thus, with different proportions spent in each state for each enantiomer, νobs is likely to be different for the two enantiomers. The proportions that each possible differentiating contrast contributes to the separation of the enantiomeric excess and racemic portions is dependent on the particular system: Compound, ee, stationary phase, and eluent. If the νobs’s for the two enantiomers happen to be the same for a particular system with a particular ee, no separation of the enantiomeric excess and racemic portions will be observed, i.e., no SDE will occur, at least until dilution due to chromatographic development takes effect. It is worth noting that, unlike SIDA, the appearance of partially separated peaks will not represent the two enantiomers; instead, they represent the burgeoning separation of the enantiomeric excess and racemic portions of the sample.

Appendix A.3. Some Notes on Terminology

A compound whose racemic solution preferentially deposits racemic crystals, i.e. the unit cell contains equal numbers of R and S configured molecules, is termed a racemic compound [26].
A number of parameters have been defined to quantify the SDE [8], but by far the most important is the magnitude of the SDE (Δee), defined [27] as (Equation (A7)):
Δee = eefraction with the highest ee − eefraction with the lowest ee.
It is worth noting that Δee is not necessarily the difference between the first and last fractions obtained, for example, from chromatography as these may not necessarily be the fractions with the highest and lowest ee’s.

References

  1. Szakács, Z.; Sánta, Z.; Lomoschitz, A.; Szántay, C., Jr. Self-induced recognition of enantiomers (SIRE) and its application in chiral NMR analysis. Trends Anal. Chem. 2018, 109, 180–197. [Google Scholar] [CrossRef]
  2. Nieminen, V.; Murzin, D.Y.; Klika, K.D. NMR and molecular modeling of the dimeric self-association of the enantiomers of 1,1’-bi-2-naphthol and 1-phenyl-2,2,2-trifluoroethanol in the solution state and their relevance to enantiomer self-disproportionation on achiral-phase chromatography (ESDAC). Org. Biomol. Chem. 2009, 7, 537–542. [Google Scholar] [CrossRef]
  3. Storch, G.; Haas, M.; Trapp, O. Attracting Enantiomers: Chiral Analytes That Are Simultaneously Shift Reagents Allow Rapid Screening of Enantiomeric Ratios by NMR Spectroscopy. Chem. Eur. J. 2017, 23, 5414–5418. [Google Scholar] [CrossRef]
  4. Klika, K.D.; Budovská, M.; Kutschy, P. Enantiodifferentiation of phytoalexin spirobrassinin derivatives using the chiral solvating agent (R)-(+)-1,1’-bi-2-naphthol in conjunction with molecular modeling. Tetrahedron Asymmetry 2010, 21, 647–658. [Google Scholar] [CrossRef]
  5. Soloshonok, V.A. Remarkable amplification of the self-disproportionation of enantiomers on achiral-phase chromatography columns. Angew. Chem. Int. Ed. 2006, 45, 766–769. [Google Scholar] [CrossRef] [PubMed]
  6. Soloshonok, V.A.; Roussel, C.; Kitagawa, O.; Sorochinsky, A.E. Self-disproportionation of enantiomers via achiral chromatography: A warning and an extra dimension in optical purifications. Chem. Soc. Rev. 2012, 41, 4180–4188. [Google Scholar] [CrossRef] [PubMed]
  7. Soloshonok, V.A.; Klika, K.D. Terminology related to the phenomenon ‘self-disproportionation of enantiomers’ (SDE). Helv. Chem. Acta 2014, 97, 1583–1589. [Google Scholar] [CrossRef]
  8. Han, J.; Kitagawa, O.; Wzorek, A.; Klika, K.D.; Soloshonok, V.A. The self-disproportionation of enantiomers (SDE): A menace or an opportunity? Chem. Sci. 2018, 9, 1718–1739. [Google Scholar] [CrossRef] [Green Version]
  9. Han, J.; Soloshonok, V.A.; Klika, K.D.; Drabowicz, J.; Wzorek, A. Chiral sulfoxides: Advances in asymmetric synthesis and problems with the accurate determination of the stereochemical outcome. Chem. Soc. Rev. 2018, 47, 1307–1350. [Google Scholar] [CrossRef]
  10. Aceña, J.L.; Sorochinsky, A.E.; Katagiri, T.; Soloshonok, V.A. Unconventional preparation of racemic crystals of isopropyl 3,3,3-trifluoro-2-hydroxypropanoate and their unusual crystallographic structure: The ultimate preference for homochiral intermolecular interactions. Chem. Commun. 2013, 49, 373–375. [Google Scholar] [CrossRef]
  11. Wu, D.H.; Chen, A.D.; Johnson, C.S., Jr. An Improved Diffusion-Ordered Spectroscopy Experiment Incorporating Bipolar-Gradient Pulses. J. Magn. Reson. Ser. A 1995, 115, 260–264. [Google Scholar] [CrossRef]
  12. De Vita, E.; Schüler, P.; Lovell, S.; Lohbeck, J.; Kullmann, S.; Rabinovich, E.; Sananes, A.; Hessling, B.; Hamon, V.; Papo, N. Depsipeptides Featuring a Neutral P1 Are Potent Inhibitors of Kallikrein-Related Peptidase 6 with On-Target Cellular Activity. J. Med. Chem. 2018, 61, 8859–8874. [Google Scholar] [CrossRef] [PubMed]
  13. Sorochinsky, A.E.; Katagiri, T.; Ono, T.; Wzorek, A.; Aceña, J.L.; Soloshonok, V.A. Optical purifications via self-disproportionation of enantiomers by achiral chromatography: Case study of a series of α-CF3-containing secondary alcohols. Chirality 2013, 25, 365–368. [Google Scholar] [CrossRef] [PubMed]
  14. Sorochinsky, A.E.; Aceña, J.L.; Soloshonok, V.A. Self-disproportionation of enantiomers of chiral, non-racemic fluoroorganic compounds: Role of fluorine as enabling element. Synthesis 2013, 45, 141–152. [Google Scholar] [CrossRef]
  15. Soloshonok, V.A.; Ueki, H.; Yasumoto, M.; Mekala, S.; Hirschi, J.S.; Singleton, D.A. Phenomenon of Optical Self-Purification of Chiral Non-Racemic Compounds. J. Am. Chem. Soc. 2007, 129, 12112–12113. [Google Scholar] [CrossRef]
  16. Yasumoto, M.; Ueki, H.; Soloshonok, V.A. Self-disproportionation of enantiomers of 3,3,3-trifluorolactic acid amides via sublimation. J. Fluor. Chem. 2010, 131, 266–269. [Google Scholar] [CrossRef]
  17. Yasumoto, M.; Ueki, H.; Soloshonok, V.A. Self-disproportionation of enantiomers of α-trifluoromethyl lactic acid amides via sublimation. J. Fluor. Chem. 2010, 131, 540–544. [Google Scholar] [CrossRef]
  18. Tsuzuki, S.; Orita, H.; Ueki, H.; Soloshonok, V.A. First principle lattice energy calculations for enantiopure and racemic crystals of α-(trifluoromethyl)lactic acid: Is self-disproportionation of enantiomers controlled by thermodynamic stability of crystals? J. Fluor. Chem. 2010, 131, 461–466. [Google Scholar] [CrossRef]
  19. Albrecht, M.; Soloshonok, V.A.; Schrader, L.; Yasumoto, M.; Suhm, M.A. Chirality-dependent sublimation of α-(trifluoromethyl)-lactic acid: Relative vapor pressures of racemic, eutectic, and enantiomerically pure forms, and vibrational spectroscopy of isolated (S,S) and (S,R) dimers. J. Fluor. Chem. 2010, 131, 495–504. [Google Scholar] [CrossRef]
  20. Yasumoto, M.; Ueki, H.; Ono, T.; Katagiri, T.; Soloshonok, V.A. Self-disproportionation of enantiomers of isopropyl 3,3,3-(trifluoro)lactate via sublimation: Sublimation rates vs. enantiomeric composition. J. Fluor. Chem. 2010, 131, 535–539. [Google Scholar] [CrossRef]
  21. Katagiri, T.; Takahashi, S.; Tsuboi, A.; Suzaki, M.; Uneyama, K. Discrimination of enantiomeric excess of optically active trifluorolactate by distillation: Evidence for a multi-center hydrogen bonding network in the liquid state. J. Fluor. Chem. 2010, 131, 517–520. [Google Scholar] [CrossRef]
  22. Katagiri, T.; Uneyama, K. Chiral Recognition by Multicenter Single Proton Hydrogen Bonding of Trifluorolactates. Chem. Lett. 2001, 30, 1330–1331. [Google Scholar] [CrossRef]
  23. Katagiri, T.; Yoda, C.; Furuhashi, K.; Ueki, K.; Kubota, T. Separation of an Enantiomorph and Its Racemate by Distillation: Strong Chiral Recognizing Ability of Trifluorolactates. Chem. Lett. 1996, 25, 115–116. [Google Scholar] [CrossRef]
  24. Han, J.; Nelson, D.J.; Sorochinsky, A.E.; Soloshonok, V.A. Self-disproportionation of enantiomers via sublimation; new and truly green dimension in optical purification. Curr. Org. Synth. 2011, 8, 310–317. [Google Scholar] [CrossRef]
  25. Wallach, O. Zur Kenntniss der Terpene und der ätherischen Oele. Ueber gebromte Derivate der Carvonreihe. Justus Liebigs Ann. Chem. 1895, 286, 119–143. [Google Scholar] [CrossRef]
  26. Jacques, J.; Collet, A.; Wilen, S.H. Enantiomers, Racemates, and Resolutions; J. Wiley & Sons, Inc.: New York, NY, USA, 1981. [Google Scholar]
  27. Wzorek, A.; Sato, A.; Drabowicz, J.; Soloshonok, V.A.; Klika, K.D. Enantiomeric Enrichments via the Self-Disproportionation of Enantiomers (SDE) by Achiral, Gravity-Driven Column Chromatography: A Case Study Using N-(1-Phenylethyl)acetamide for Optimizing the Enantiomerically Pure Yield and Magnitude of the SDE. Helv. Chim. Acta 2015, 98, 1147–1159. [Google Scholar] [CrossRef]
  28. Kwiatkowska, M.; Marcinkowska, M.; Wzorek, A.; Pajkert, R.; Han, J.; Klika, K.D.; Soloshonok, V.A.; Röschenthaler, G.-V. The self-disproportionation of enantiomers (SDE) via column chromatography of β-amino-α,α-difluorophosphonic acid derivatives. Amino Acids 2019, 51, 1377–1385. [Google Scholar] [CrossRef]
  29. Han, J.; Wzorek, A.; Soloshonok, V.A.; Klika, K.D. The self-disproportionation of enantiomers (SDE): The effect of scaling down, potential problems versus prospective applications, possible new occurrences, and unrealized opportunities? Electrophoresis 2019, 40, 1869–1880. [Google Scholar] [CrossRef]
  30. Nakamura, T.; Tateishi, K.; Tsukagoshi, S.; Hashimoto, S.; Watanabe, S.; Soloshonok, V.A.; Aceña, J.L.; Kitagawa, O. Self-disproportionation of enantiomers of non-racemic chiral amine derivatives through achiral chromatography. Tetrahedron 2012, 68, 4013–4017. [Google Scholar] [CrossRef]
Figure 1. The dynamic equilibria of a chiral compound that forms homo- (HOM) and heterochiral (HET) associates will yield different distributions of the enantiomers between the various associates depending on their concentrations and the values of Khom and Khet. The transitory associates formed in solution may consist of dimeric or higher-order oligomeric associates of variable size, but are depicted here only as dimers for clarity. Due to dissimilar δ’s for SM, HOM, and HET, enantiopure and racemic solutions can thus present distinct spectra, and even distinct signals for the two enantiomers can result in the case of scalemates [1,3].
Symmetry 12 01106 g001
Figure 2. The alcohols 2 and esters 3 studied in this work and the commercial acids 1 from which they were prepared.
Symmetry 12 01106 g002
Figure 3. 1H NMR spectra of (S)-2 (red spectra) and (R)-2 (blue spectra) in CDCl3. The original spectra (top two traces) showed considerable differences for the methyl signals H-4, H-11, and H-12 due to unequal concentrations (2-fold), while samples prepared at the same concentration (bottom two traces) are considered identical. Regions for the OH, NH, and aromatic signals are presented in the Supplementary Materials (Figures S1 and S2).
Symmetry 12 01106 g003
Figure 4. Possible structure of a hydrogen bond-based heterochiral dimeric associate of (S)-2 and (R)-2. Such a structure has Ci symmetry and is therefore achiral while a homochiral dimeric associate would have C2 symmetry and be chiral. The sizeable deshielding of the amide proton signal is also indicative of it participating in hydrogen bonding concomitant with molecular association and analogous dimeric associates involving it instead of the hydroxyl proton can be envisaged.
Symmetry 12 01106 g004
Figure 5. 1-D NOESY spectra of (rac)-2 (top two traces) and (S)-2 (bottom two traces) in CDCl3 at the same concentration showing the region for the alkyl methyl Hs (H-4) whereby the imidazolyl methyls H-11 and H-12 were successively selectively irradiated. The H-4 signal is more enhanced in both cases for the sample of (rac)-2 indicative of greater association.
Symmetry 12 01106 g005
Figure 6. 1H NMR spectra of (R)-3 (bottom trace), (S)-3 (middle trace), and (rac)-3 (top trace) in CDCl3 at the same concentration for the region encompassing the methyl signals H-4, H-11, H-12, and H-26 revealed little difference between the spectra. Spectra showing the NH, methylene, and aromatic signals are presented in the Supplementary Materials (Figures S6–S13).
Symmetry 12 01106 g006
Figure 7. 1H NMR spectra in CDCl3 of (scl)-3 for the indolyl NH (H-21, top trace) and one of the imidazolyl methyls (H-11, bottom trace). These were the only two proton signals to show distinct peaks for the two enantiomers. The time domain signal of the bottom trace was treated with a double exponential function (Gaussian broadening = 0.3 Hz and line broadening = −0.7 Hz) prior to Fourier transformation; no window function was applied to the top trace.
Symmetry 12 01106 g007
Figure 8. 13C NMR spectra in CDCl3 of (scl)-3 for C-19 (top trace) and for C-20 (bottom trace) of the indole moiety. These were the most divergent of the five carbon signals to show splitting. Misrepresentation of the relative signal intensities due to unequal partial saturation from disparate T1s or due to unequal truncation from disparate T2s for corresponding nuclei was not of concern as the data was not used for quantitation. A description of the problems for quantitation due to disparate T1s or T2s is presented in Appendix A.
Symmetry 12 01106 g008

