Research on a Sliding Detection Method for an Elevator Traction Wheel Based on Machine Vision


1
College of Quality and Safety Engineering, China Jiliang University, Hangzhou 310018, China
2
Faculty of Electrical Engineering, Automatics, Computer Science and Biomedical Engineering, AGH University of Science and Technology, Al. A. Mickiewicza 30, 30-059 Krakow, Poland
*
Author to whom correspondence should be addressed.
Symmetry 2020, 12(7), 1158; https://0-doi-org.brum.beds.ac.uk/10.3390/sym12071158
Submission received: 5 June 2020
/
Revised: 9 July 2020
/
Accepted: 10 July 2020
/
Published: 12 July 2020
(This article belongs to the Special Issue Symmetry in Mechanical Engineering Ⅱ)
Abstract
:To solve the problem that the elevator traction wheel slippage is difficult to detect quantitatively, a slippage detection method is proposed based on machine vision. The slip between the traction wheel and the wire rope will occur during the round-trip operation of the elevator, the displacement distance between the traction wheel and the wire rope in the circumferential direction is obtained through the image signal processing algorithm and related data analysis. First, the ROI (region of interest) of the collected original image is selected to reduce redundant information. Then, a nonlinear geometric transformation is carried out to transform the image into the target image with an equal object distance. Finally, the centroid method is used to obtain the slippage between the traction wheel and the wire rope. The field test results show that the absolute error of the system developed in this paper is 0.74 mm and the relative error is 2%, the extending uncertainty of the slip detection results is (33.8 ± 0.69) mm, the confidence probability is p = 0.95, and the degree of freedom is v = 8, which can meet accuracy requirements of elevator maintenance.
1. Introduction
With the continuous development of the social economy, the numbers of high-rise buildings are increasing, and the elevator has become an indispensable piece of equipment in modern buildings, among which the traction elevator is one of the most widely used pieces of equipment [1]. The power source of the traction elevator is the traction wheel, which uses the friction between the traction wheel and the steel wire rope to transfer the power to achieve the up and down movement of the elevator car. After long-term use of the elevator, the traction wheel and the steel wire rope become worn, and then, a slip phenomenon will occur. This kind of abnormal slip will affect the safety of the elevator and cause elevator accidents [2]. However, a clear slip quantitative detection method and failure standard are not put forward in the current national standards and safety technical specifications, so quantitatively evaluating the elevator traction wheel slip has become a hot issue in the elevator safety research.
At present, some relevant scholars around the world have conducted some studies on the detection of elevator slippage. Zheng et al. [3] analyzed the causes of the traction elevator wire rope slippage from the perspectives of the traction capacity, balance coefficient, cage quality, etc., but no in-depth quantitative research has been conducted. From the three perspectives of the matching of the wire rope and the tractive sheave groove, the wheel groove wear, and the angle between the traction wheel and the wire rope, Chen et al. [4] identified the causes of the change in the traction; in the case that the design value conforms to the national standard, the traction coefficient will increase due to improper installation, operation and maintenance, and relevant improvement suggestions are proposed. Ma et al. [5] established an exclusive test platform to study the effects of friction and slippage under different traction conditions, and concluded that slippage occurred at the end of the contact arc, expanded to the middle, then the entire traction wheel, and finally to the wire rope. Liu et al. [6] proposed a method to measure the slippage of the traction elevator wire rope by using a photoelectric encoder. The photoelectric encoder, the coupling, and the roller are combined into a speed measuring wheel. The speed measuring wheel needs to contact the traction wheel and the wire rope to complete the slippage measurement. This contact-type measuring method will accelerate the wear of the speed measuring wheel and decrease its service life. He et al. [7], according to the movement characteristics of the contact interface between the traction wheel and the wire rope, proposed a real-time, non-contact method based on image morphology, to measure the slippage between the traction wheel and the wire rope. However, there was no on-site test, so the feasibility of the detection algorithm in a real environment needs further validation.
Due to the problems of the above methods for detecting slippage, which cannot be quantitatively or qualitatively detected but will affect the service life of detecting components [8], in this paper, a non-contact measurement method for the elevator traction wheel slippage detection based on machine vision was proposed. We made a white line mark at the edge of the traction wheel and at the same position on the steel wire rope, and the two white marks were mismatched when the traction wheel slippage occurs after a round trip of the elevator. Then, the dislocation information of the original image was processed by the image processing algorithm to obtain the slippage of the elevator traction wheel. In this paper, the error of the slippage image detection method was studied by a systematic testing.
2. Slip Detection Scheme
2.1. Slip Detection Method
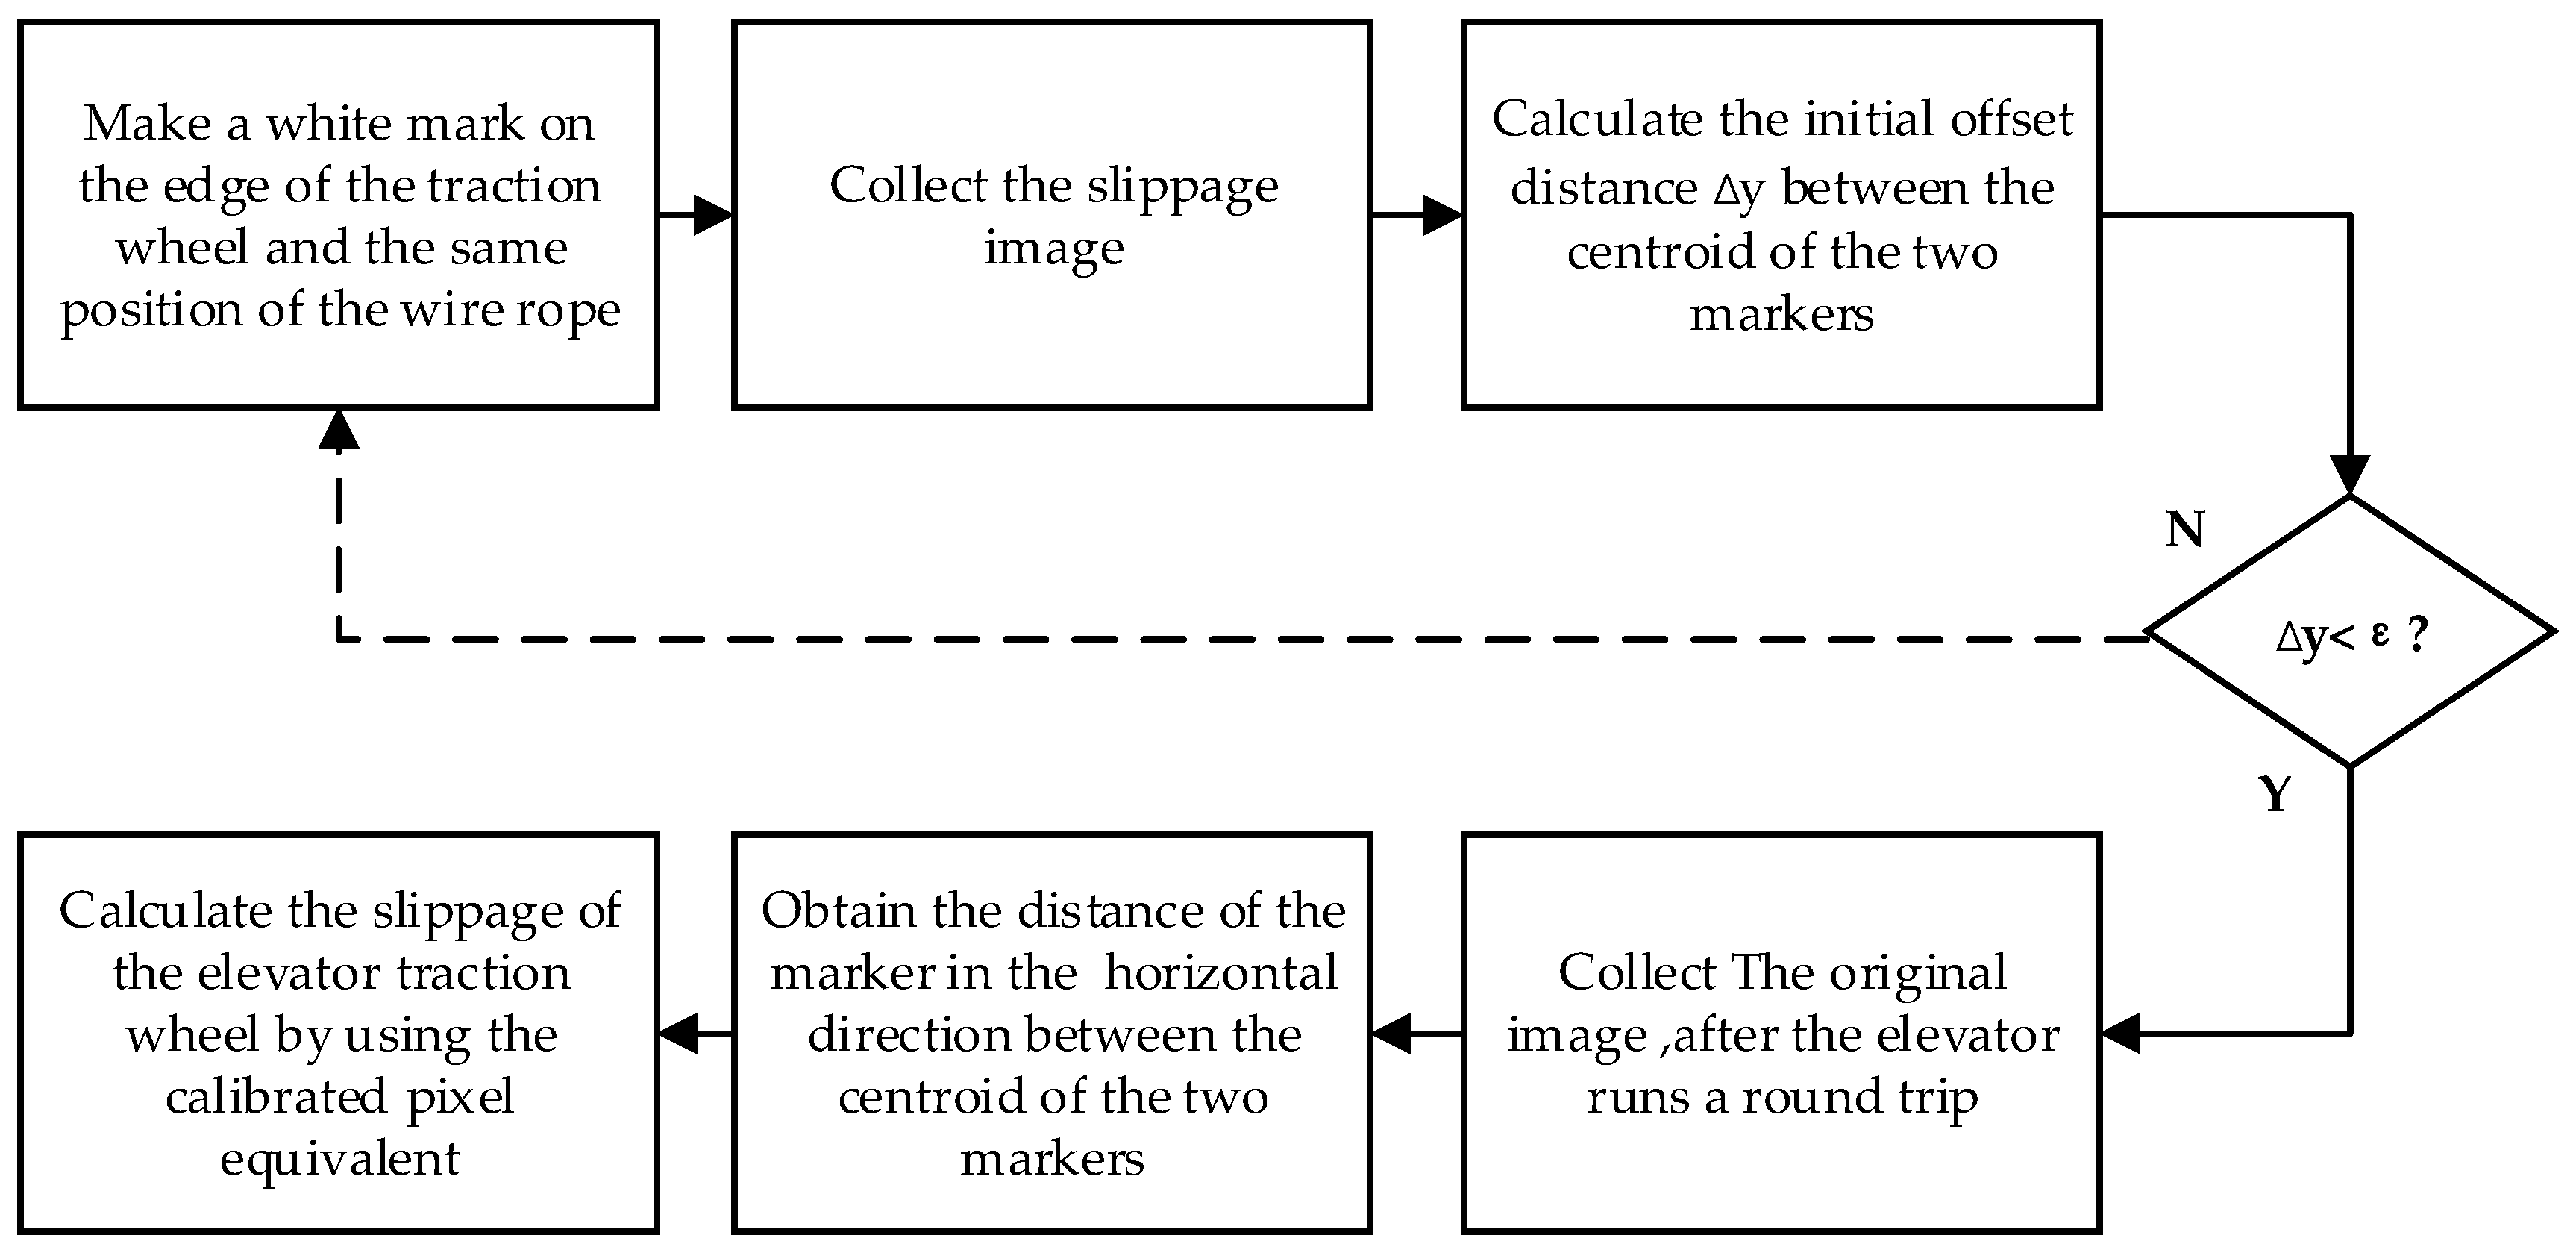
The displacement between the traction wheel and the wire rope will occur during the round-trip operation of the elevator, the slip detection method of the elevator traction wheel based on machine vision is to obtain the dislocation image of the traction wheel and the wire rope in the circumferential direction by marking, and the slippage between the traction wheel and the wire rope can be obtained by using the image nonlinear geometric transformation and centroid method. As shown in Figure 1, the slip detection process of the elevator traction wheel is as follows:
- (1)
- Make a white mark on the edge of the traction wheel and on the same position of the wire rope.
- (2)
- Collect the slippage image and use the image processing algorithm to obtain the offset distance between the centroid of the two white markers in the circumference direction ∆y. When ∆y < ε, the marker is qualified; otherwise, the marker is not qualified, and it needs to be marked again. ε is the preset minimum offset distance.
- (3)
- When the elevator runs a round trip and produces slippage, the white mark on the edge of the traction wheel and the wire rope will be misaligned. The original image of the mark will be collected by the CCD camera located directly above the traction wheel.
- (4)
- For the original image, the improved nonlinear geometric transformation algorithm is used to transform the sliding image with different object distances into the target image with the same object distances.
- (5)
- For the target image, the slippage detection algorithm is used to obtain the distance of the marker in the horizontal direction, and the slippage of the elevator traction wheel is calculated by using the calibrated pixel equivalent and the initial slip distance.
2.2. The Experiment Scheme
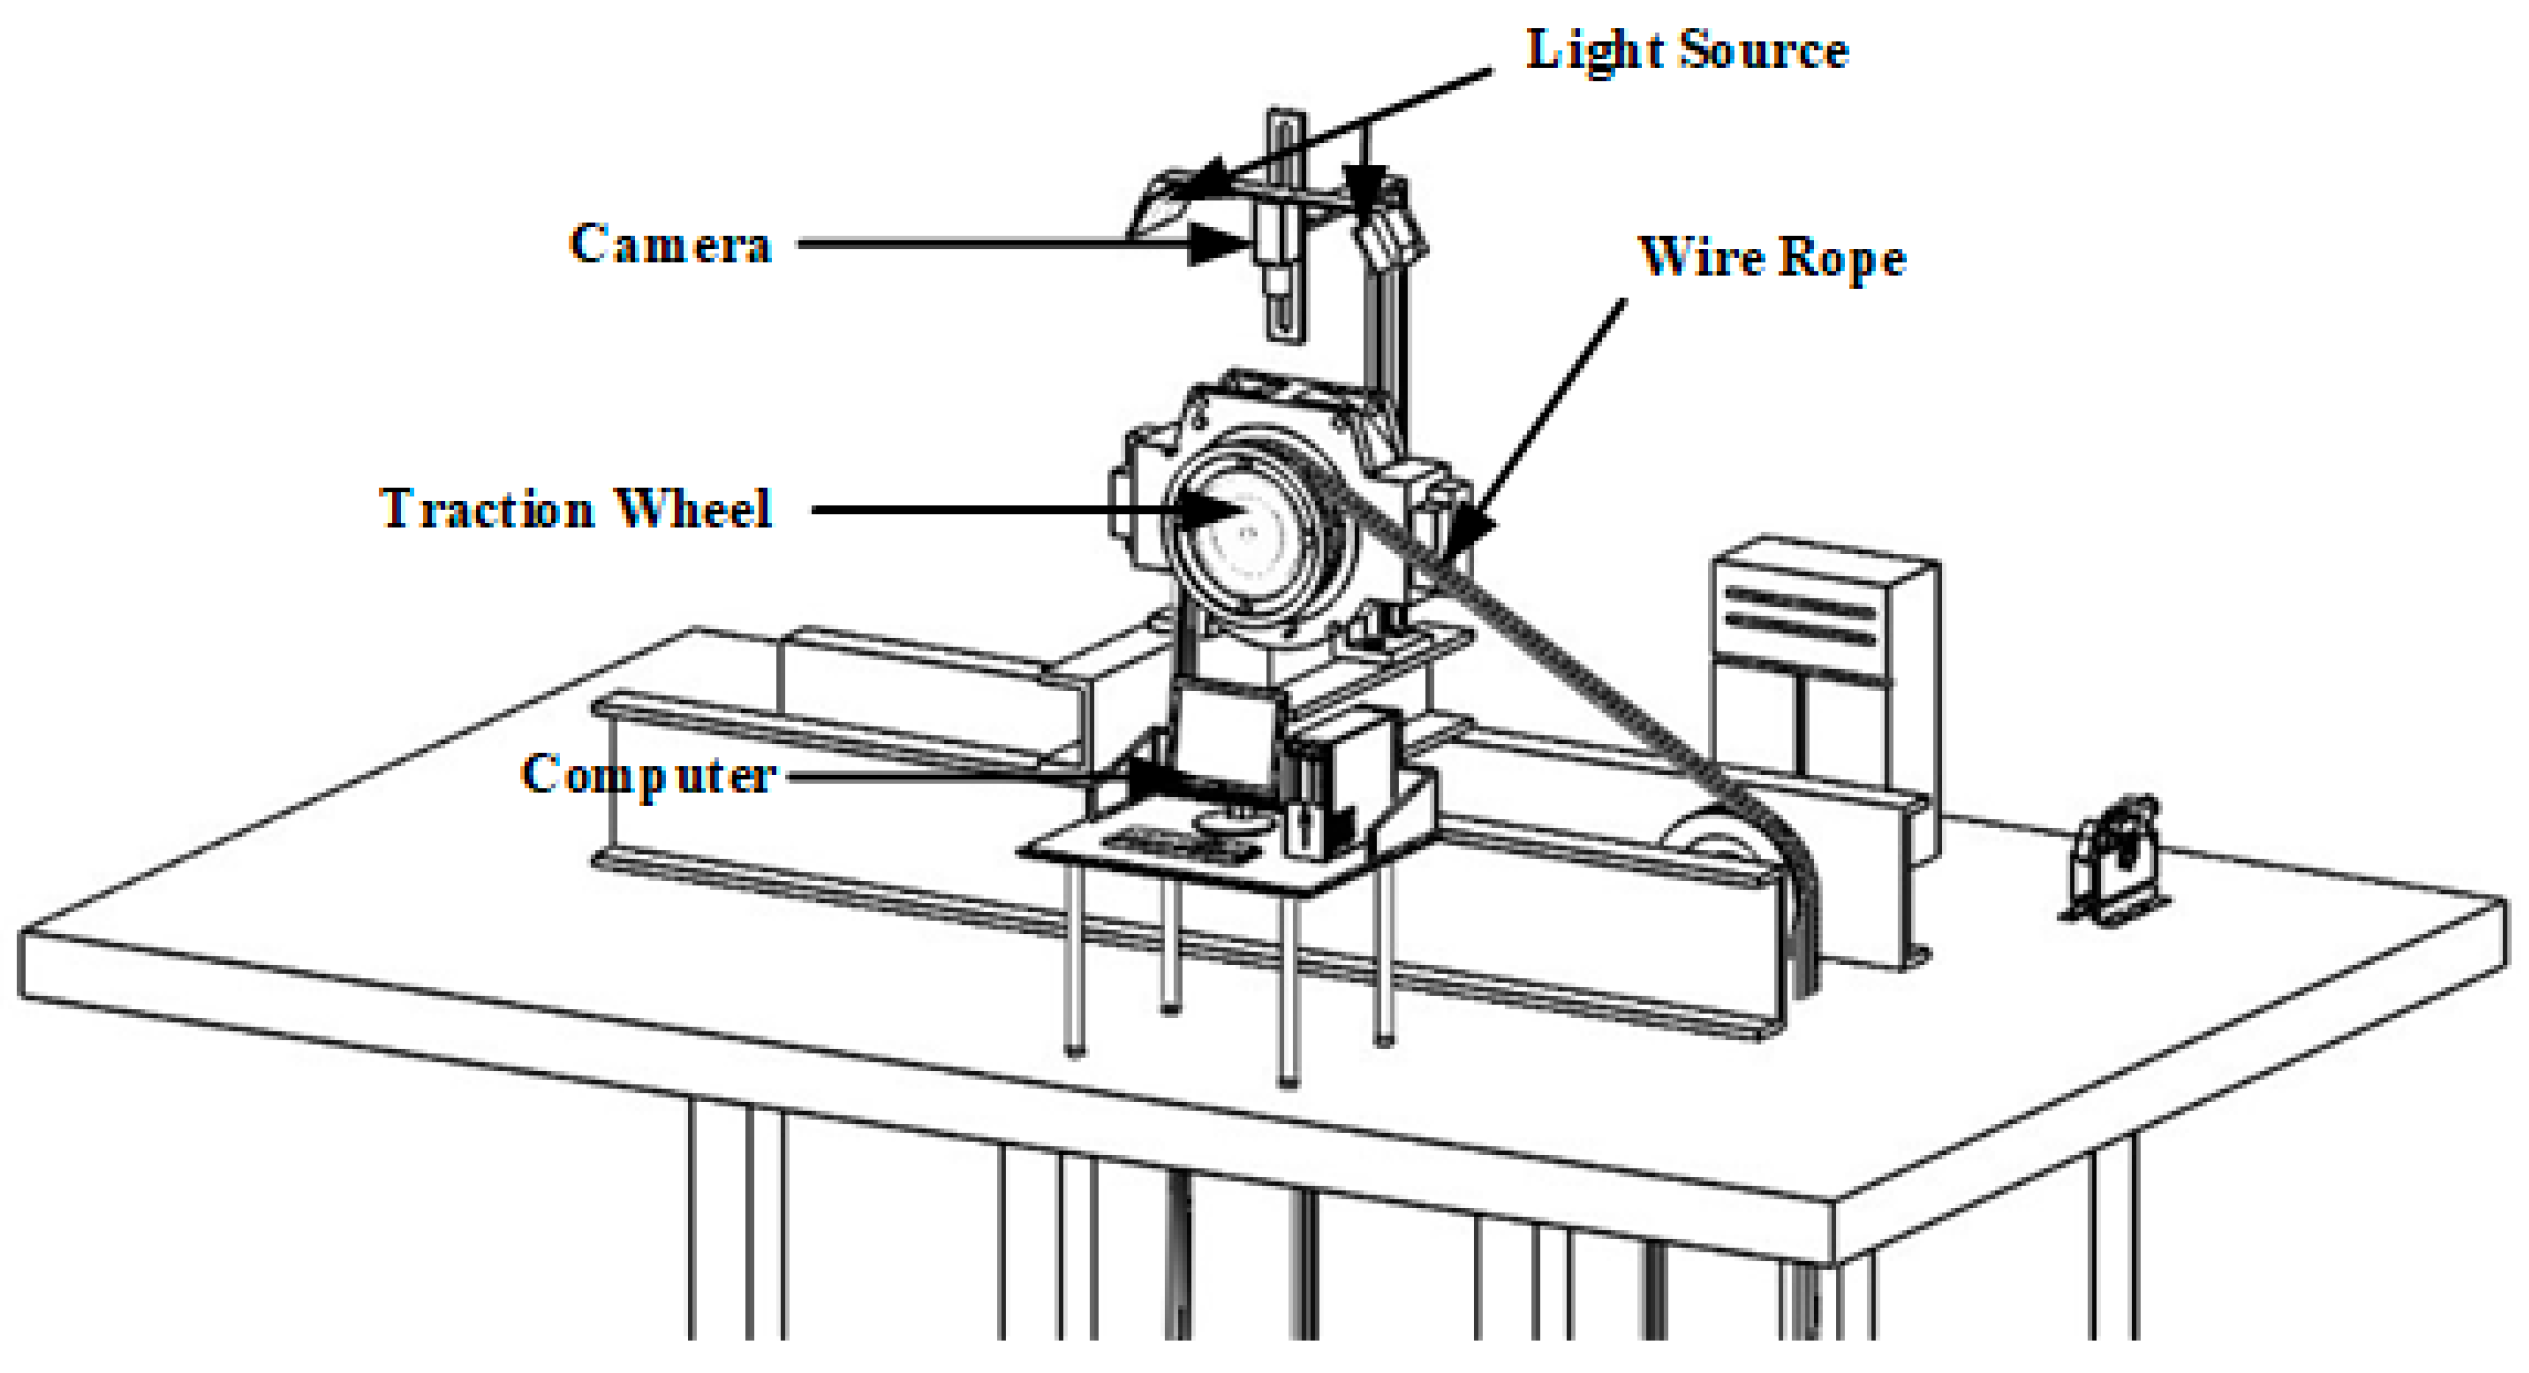
The experimental scheme of the elevator slip detection system is shown in Figure 2. The camera is placed directly above the elevator traction wheel through the aluminum profile bracket, and the centerline of the camera is adjusted to coincide with the central axis of the traction wheel. The camera is required to collect the slippage image that will be detected between the white marks on the traction wheel and the steel wire rope after a round-trip of the elevator. The slippage of the traction wheel is analyzed by using the image algorithm.
The experimental hardware platform includes a CCD camera, lens, white LED light source, a mobile platform with a range of 30 mm connected to the industrial camera, and an elevator test room, including the traction wheel, wire rope, and other accessories. The experimental test software was developed in LabView8.5. The elevator traction wheel slip detection system, which was designed and developed by our team, can achieve slippage image acquisition and algorithm processing, and the data analysis is carried out by combining the Excel software [9]. The slippage detection algorithm of the elevator traction wheel is the core of the experiment, which mainly includes a nonlinear geometric transformation algorithm and the slippage detection algorithm of the elevator traction wheel.
3. Slip Detection Algorithm
The processing flow chart of the slip detection algorithm of the elevator traction wheel based on machine vision is shown in Figure 3. First, a machine vision experimental platform for the traction wheel slip detection is constructed. Second, a white line is marked on the edge of the traction wheel and on the same position of the wire rope. Third, the original image of the elevator traction wheel slippage is acquired by the vision system. Since the two markers are not in the same plane, as shown in Figure 4, that is, the object distance is not equal in the same machine vision system, the distance measurement cannot be carried out directly, so the original image needs to be transformed into the target image with an equal object distance by a nonlinear geometric transformation. Finally, the slippage between the traction wheel and the wire rope is obtained by using the image processing algorithm.
3.1. Nonlinear Geometric Transformation of Images
Figure 5 shows the flow chart that describes the method of obtaining the target image through a nonlinear geometric transformation of the original image. To reduce the redundant information of the image, the ROI range of the original image is first selected to obtain the ROI image, which can reduce the computation amount of the algorithm and shorten the processing time of the algorithm [10,11]. The selection of ROI range in the X-axis direction should fully include the wire rope and the edge of the traction wheel; and the selection in the Y-axis direction, the main optical axis of the camera should be used as the symmetry axis with the two white markers included.
The principle of translation of the origin of the image coordinate system to the image center is shown in Figure 6. The origin of the ROI image coordinate system is transferred from the upper left corner of the image to the center of the image. The origin of the coordinate system is shifted to the point by using Formula (1), where is the length of the X-axis of the ROI image, is the length of the Y-axis direction, is the coordinate in the ROI image, and is the coordinate after translation.
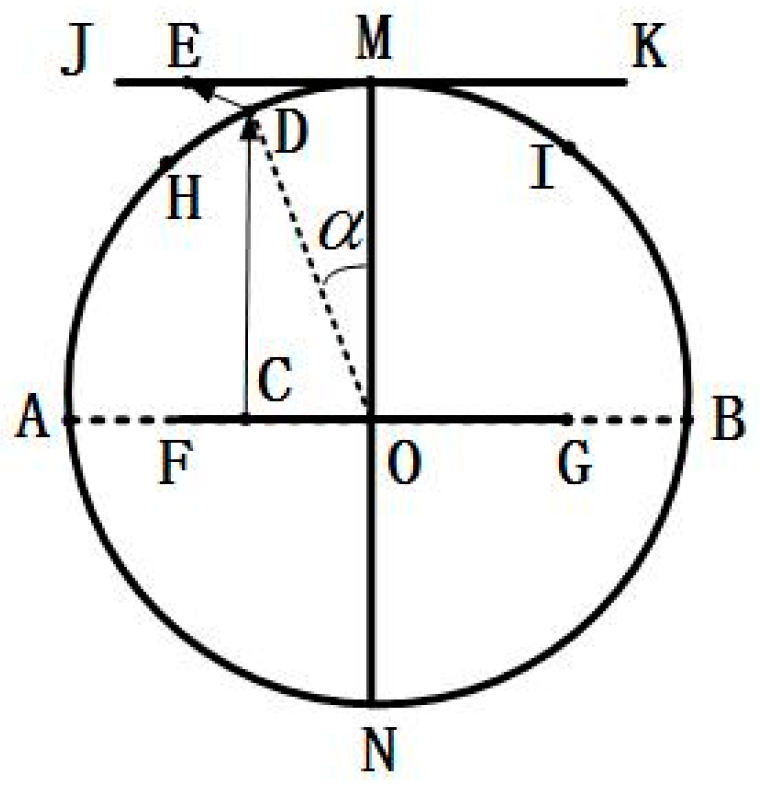
An image transformation is required after the image coordinate system has been shifted to the center. Figure 7 shows a schematic diagram of the nonlinear geometric transformation of the image. The circle is the main view of the traction wheel, and the reference position M is the intersection of the line where the main optical axis of the camera is located and the Y-axis of the ROI image. The target images JK and M are in the same plane and parallel to the camera lens. After being projected by the camera, the real image arc HI is transformed to the original image FG. Point C is any point in the original image, point D and point E are its corresponding point on the real image and target image, respectively.
The calculation method of line segment EM is shown in Formula (2), and then the whole ROI image is transformed through Formula (3). We can obtain the coordinates of the target image ().
R is the radius of the traction wheel.
is the pixel coordinate after translation, and () is the pixel coordinate in the target image.
Grayscale filling: The y coordinate of the target image obtained by the ROI image after image transformation is a kind of floating point, so it is impossible to directly fill the pixel with the grayscale; therefore, the linear interpolation method should be used in the Y-axis direction to fill the target image with the grayscale [12,13]. The principle of the linear interpolation is shown in Figure 8. y0 is the corresponding y coordinate of the pixel points in the ROI image after the inverse transformation of the nonlinear geometric transformation of the image, and y1 and y2 are the coordinates of integer parts adjacent to y0. f(y0) is the gray value to be filled. Formulas (4) and (5) can be used to calculate f(y0).
Formulas (4) can be reduced to:
After filling the grayscale with the linear interpolation method, to use the image processing algorithm of slip detection to process the target image, Formula (6) is required to shift the origin of the target image coordinate system to the upper left corner. and denote the length of the X-axis of the target image and the Y-axis, respectively.
A schematic diagram of the coordinate system translation is shown in Figure 9.
3.2. Image Processing Algorithm for Slip Detection
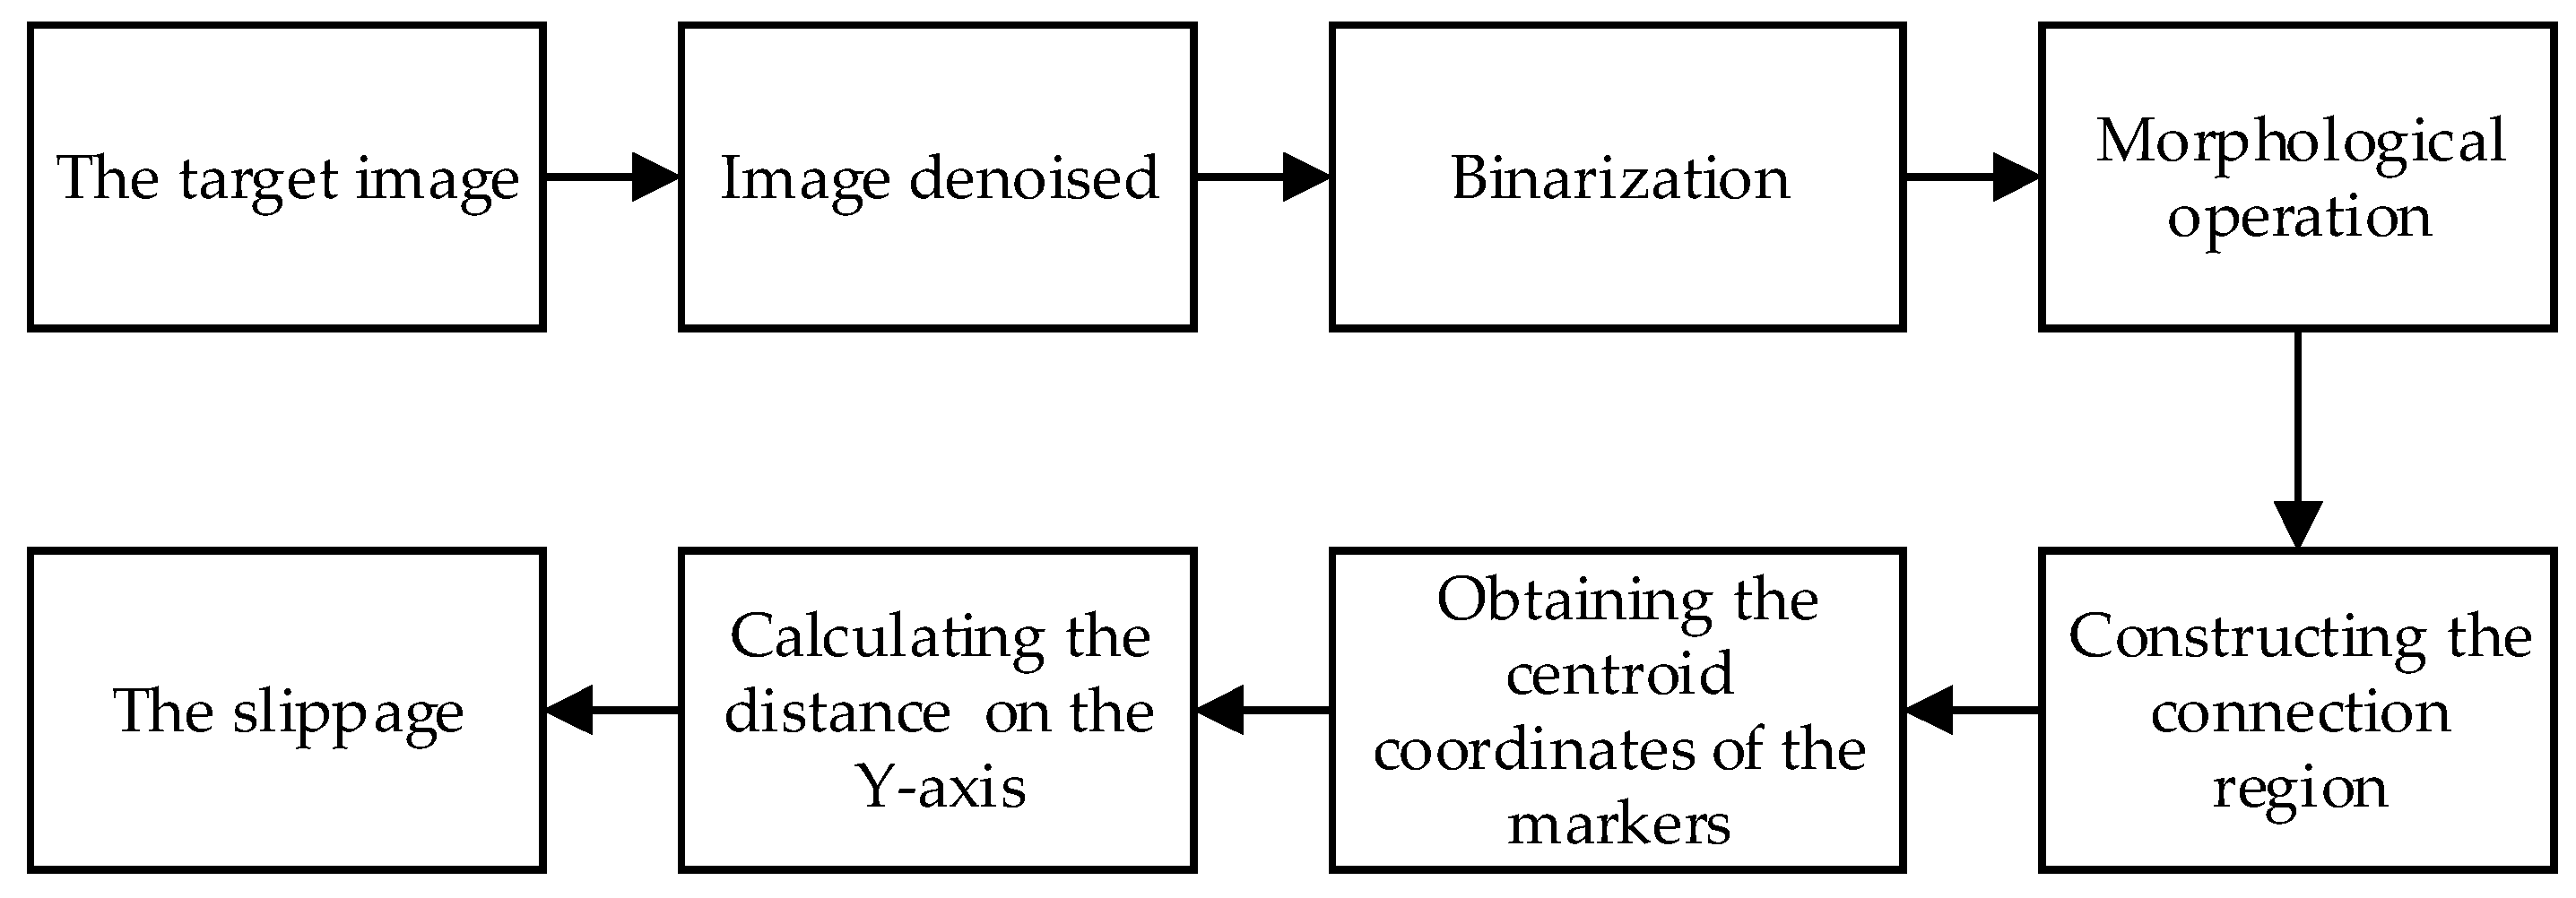
After the nonlinear geometric transformation of the image, the ROI image has been transformed into an image with equal distance, and its pixel equivalent is also a fixed value. The pixel-level distance between the two markers can be obtained by an image processing algorithm. The flow chart of the image processing algorithm for slippage detection is shown in Figure 11.
Due to environmental and hardware factors, the collected images contain salt and pepper noise and Gaussian noise [14]. Therefore, the median filter in the nonlinear smoothing filter [15] is used to remove the noise, and the detailed information of the image can be well retained.
In the test, white was used as the color of the marker, as there is an obvious contrast between white and black. As a result, there is a significant difference in the gray value between the marker and the background, and the fixed threshold method can be used to binarize the image [16,17]. The binarization image is shown in Figure 12a.
Since the wire rope is composed of twisted strands, the bright part of the wire rope after binarization will also be processed into white; however, the areas are small and not connected to each other, and there are more burrs on the edge of the two white markers for technical reasons. Therefore, the open operation of the morphological operation is chosen in this paper to address the above issue. A rectangular structure with 5 × 10 structural elements is used to remove the burrs and isolate the points. The image after the morphological operation is shown in Figure 12b.
The connection region was constructed with eight connections, and at least two connection regions were obtained. The two connection areas with the largest area are the marker regions, as shown in Figure 12c. The two largest connection regions are then extracted and denoted as the two marker regions.
After obtaining the connection region of the markers, to find the distance between the two markers, we used the centroid of the image to find the distance [18] and obtained the centroid coordinates of the markers through the zero-order matrix and the first-order matrix. The calculation method is shown in Formulas (7)–(10). The centroid coordinates obtained by this method are not sensitive to noise. When there is external noise, the calculated centroid will not produce an excessive deviation, which ensures the stability of the image processing algorithm for slippage detection. The image centroid of the marker is shown in Figure 12d. The distance between the two markers can be obtained by calculating the distance between the two image centroids of the two markers on the Y-axis, and then the slippage of the elevator can be obtained by converting the pixel equivalent.
Zero-order matrix
First-order matrix
The coordinates of the image centroid are as follows:
The zero-order matrix and the first-order matrix of the image are used to find the centroid coordinates of the markers .
The distance of markers in the Y direction is given by:
Since the initial offset distance ∆y in the circumference is small, it can be approximately equivalent to the distance in the Y-axis. The total slippage is given by:
4. Camera Calibration and the Building of the Experimental Platform
Based on the research of the image processing algorithm, to apply the slip detection algorithm to the actual field tests and build the experimental platform of the elevator traction wheel slip detection system, the detection system needs to be calibrated before the test to obtain the internal and external parameter matrix and pixel equivalent of the camera [19].
4.1. Camera Calibration
The calibration of the elevator traction wheel slip detection system based on machine vision includes two parts: Camera calibration, which is used to obtain the camera’s internal reference matrix and distortion coefficient to correct the detected centroid coordinates, and pixel equivalent calibration, which is used to obtain the conversion coefficient between the pixel size and the actual size.
Due to the deviation and lens distortion during the camera installation, the imaging model of the camera is not consistent with the ideal vacuum model, so it is necessary to calibrate the camera. The calibration plate used in this system is a checkerboard calibration plate with an external dimension of 120 × 120 mm, with a square side length of 5 mm and a pattern array of 21 × 21. The camera’s internal reference matrix A and radial distortion matrix B can be obtained. By using the internal reference matrix to transform the coordinates of the two obtained image centroids, the coordinates of the points after distortion correction can be obtained, and then the detection accuracy of the slippage can be improved.
The radial distortion coefficient is:
The slippage obtained by using the image processing algorithm requires the conversion of the pixel equivalents so that the actual slippage can be obtained. In this paper, a 10 mm standard test block with a precision of 0.001 mm is placed on the surface with a fixed object distance, and the camera is adjusted to a distance equal to the standard block by moving the platform. The image of the standard test block is captured, and the pixel size of the standard test block is detected. Then, the pixel equivalent k is obtained by Formula (15).
where Ls is the pixel size of the standard test block.
4.2. Building the Experimental Platform
As shown in Figure 13, the experimental platform of the elevator traction wheel slip detection system is built, which includes a camera, a lens, a light source, a moving platform for adjusting the camera distance, an elevator traction wheel, a wire rope, and a computer. The camera adopted is a CCD camera, the resolution is 2448 × 2050, the frame rate is 20 fps, the pixel size is 3.45 × 3.45 µm, the sensor size is Type 2/3, and an 8 mm lens is installed. The CCD camera is fixed directly above the connection part of the traction wheel and the wire rope by a moving platform, and the distance is approximately 400 mm. The light source is a 12 W white strip light source with an effective size of 190 × 42 mm. The light source is installed on the oblique top of the connection part between the traction wheel and the wire rope. The brightness of the light source can be adjusted by the controller. The reflected lights of the two white markers are collected through the camera, and the local enlarged images of the two marks are located on the upper left corner after the two white markers are displaced. The user interaction interface of the elevator traction wheel slip detection system is shown in Figure 14. Here, we can achieve the image acquisition, image algorithm processing, and data analysis of the traction wheel slip image.
5. Test Result Analysis
5.1. On-Site Testing
To verify the feasibility of the elevator traction wheel slip detection method based on machine vision and the performance of the detection algorithm, the elevator traction wheel slip field tests were conducted on the constructed experimental platform. The parameters of the elevator selected for testing are as follows: The rated speed is 95.5 r/min, the traction wheel radius R is 400 mm, the cage weight is 373 kg, and the maximum operating height is 2400 mm. During the test process, one round-trip operation of the elevator without a load was recorded as a group of test experiments, and nine groups of experiments were conducted continuously without interruption. Each group of experiments collected three original images for a total of 27 images. For each original image, the detection method in this paper is used to obtain a slip amount. In the experiment, when the pixel equivalent k = 0.86 mm, the initial deviation distance of the marker ∆y = 1.2 mm, the slippage of each group of experiments was obtained by averaging the three test results of each group of experiments. The experimental test results are shown in Table 1, the experimental data were processed by the Excel software.
During the experiment, the rotation angle information of the traction wheel drive motor was obtained from the elevator control cabinet under the cooperation of the elevator technicians. The true displacement of the traction wheel was obtained by combining the motor parameters and the radius of the traction wheel. Since the elevator cage returns to the initial position after a round trip, the running displacement of the steel wire rope is 0. At this time, the movement displacement of the traction wheel is the slippage. The slip precision obtained from the elevator control cabinet could reach up to 0.1 mm. However, if the slippage of the traction wheel is obtained from the elevator control cabinet, the risk of unsafe operation of the elevator may be caused, which is not suitable for on-site inspection by the elevator maintenance personnel. The method was used to obtain the true value of the elevator slippage and provide the basics for the test error analysis in this paper. It can be seen from Table 1 that the real slippage generated by each round trip of the elevator was different, and the average value is 33.06 mm. The average slippage value detected in the nine groups of experiments is . Compared with the real slippage, the absolute error is approximately 33.8 − 33.06 = 0.74 < 1 mm, and the relative error is 2%.
The original image should contain two white markers at the same time for the slippage detection method used in this paper. However, if the elevator traction wheel slips too much and exceeds the camera’s view range L, the marker images cannot be collected, and slippage cannot be detected. Formula (16) is the calculation method of the range L, and C is the camera resolution value. Since the diameter of the tractor wheel is 800 mm, the maximum effective distance that the camera can observe is 800 mm, too.
Next, we consider the multimark detection, that is, making a number of white labeled marks with a required spacing distance Dl, and Dl < 800 mm on the traction wheel and the wire rope. The markers are numbered in turn. In this way, the original collected image has only two white marks. When we use the detection method above to obtain the interval of the two markers, we need to identify the serial number on the markers by OCR to determine whether the two markers are the same as the two markers before the elevator runs. If the makers are the same, Formula (12) will be used to calculate the slippage, and if the markers are not the same, the distance between the mark in the image and the mark before the elevator ran should be added; then, the slip can be obtained by Formula (17).
Here, D is the slippage, Y is the distance along the Y-axis of the marker in the original image, is the interval of the two markers, and n is the mark number of the original image before the operation of the elevator.
5.2. Error and Measurement Uncertainty Analysis
5.2.1. Error Analysis
The test was repeated n = 9 times. According to the literature, the Grubbs criterion [20] was used to distinguish the gross errors. The average value of nine measurements is obtained from Table 1 . The standard deviation S = 1.1 mm is obtained by Formula (18). According to Formula (19), the residual value of each observed value can be obtained. The maximum absolute value of the residual value is 1.8 mm, and the corresponding observed value x = 35.6 mm is the suspicious value xd.
Taking p = 99% = 0.99, that is, α = 1 − 0.99 = 0.01 and n = 9, we can obtain G(0.01, 9) = 2.32, by the t-distribution table, since 1.64 < 2.32. Therefore, xd = 35.6 mm is not an abnormal point, and there is no gross error in the nine groups of experimental results.
5.2.2. Measurement Uncertainty Analysis
Due to the instability of the repeatability detection of elevator traction wheel slippage, the measurement capability of the system is evaluated by measuring the uncertainty analysis of detection results. The standard deviation σ = 1.1 mm of a single test result was calculated by the Bessel method [21,22], the standard deviation of the average value was also calculated.
Furthermore, the uncertainty and the degree of freedom v = 9 − 1 = 8 were calculated, respectively. Taking the confidence probability p = 95% and the degree of freedom v = 8 and by examining the t-distribution table, we can see that t0.95(8) = 1.86. The inclusion factor k = 1.86, and the extension uncertainty U of the elevator slippage can be calculated by Formula (21):
U = kuc = 1.86 × 0.37 mm = 0.688 ≈ 0.69 mm
UR is used to evaluate the uncertainty of the elevator slippage detection.
UR = (33.8 ± 0.69) mm, p = 0.95, and v = 8.
Through the evaluation of measurement uncertainty, the trust degree of the measurement results of the detection system can be known, which provides a basis for the better choice of the method.
6. Conclusions
A new method to detect the elevator traction wheel slippage using machine vision technology is introduced in this paper. This method is a non-contact measurement completely independent of the elevator system and has its own unique advantages over other methods. A white mark was made on the edge of the traction wheel and in the same position on the wire rope, and the original image was acquired by a CCD camera. After a nonlinear geometric transformation of the image, the image was preprocessed, the connection area was constructed, and the centroid of the connection area of the two markers was calculated. Finally, the distance between the two centroid Y-axes was calculated to obtain the slippage of the elevator traction wheel. The key techniques are to convert the original images with different object distances into the target with equal object distances and to extract the centroid of the image. The field test results show that the absolute error of the system is 0.74 mm and the relative error is 2%, which meet the inspection accuracy requirements of the elevator maintenance personnel. The extending uncertainty of the slip detection results is (33.8 ± 0.69) mm, the confidence probability is p = 0.95, and the degree of freedom is v = 8, which can meet site inspection requirements. To optimize the nonlinear geometric transformation of the image, in future work, the reduction of the X-axis coordinate transformation can be processed to improve the integrity and reusability of the nonlinear geometric transformation.
Author Contributions
J.C. and T.H. designed the scheme for the research, and conceived the image processing algorithm and the obtained inference. H.L. and A.G. processed the experimental data. L.J. performed the experiments and wrote the paper. All authors have read and agreed to the published version of the manuscript.
Funding
This research was funded by The Public Welfare Technology Research of Zhejiang Province in China, grant number LGG19E050015.
Acknowledgments
The authors are grateful to the editors and the anonymous reviewers for providing us with insightful comments and suggestions throughout the revision process.
Conflicts of Interest
The authors declare no conflict of interest.
References
- Wu, H. Analysis of wheel groove wear and inspection of traction elevator. China Stand. 2017, 8, 44. [Google Scholar]
- Yuan, X.L. Consideration on wheel groove wear and inspection of traction elevator. Sci. Technol. Innov. 2018, 8, 67–68. [Google Scholar]
- Zheng, K.; Shang, C. Analysis of skidding causes of wire rope in traction elevator. China Equip. Eng. 2017, 23, 87–88. [Google Scholar]
- Chen, Z.; Ma, Q.D.; Shen, J. Instance analysis of the failure test of no-load traction capacity of elevator. China Spec. Equip. Saf. 2016, 32, 44–46. [Google Scholar]
- Ma, X.; Pan, Y.; Shi, X. Experimental investigation of friction and slip at the traction interface of rope and sheave. J. Appl. Mech. 2018, 85, 23–29. [Google Scholar] [CrossRef]
- Liu, Z.H. A method for measuring slip of cable rope in traction drive. Mod. Manuf. Technol. Equip. 2017, 5, 72–74. [Google Scholar]
- He, Z.L.; Shi, X. Measurement of Traction Slip Based on Image Morphology Algorithm. Mach. Des. Res. 2015, 31, 98–100. [Google Scholar]
- Irfan, M.; Glowacz, A. Design of a novel electric diagnostic technique for fault analysis of centrifugal pumps. Appl. Sci. 2019, 9, 5093. [Google Scholar] [CrossRef] [Green Version]
- Huang, J.J.; Ke, W.; Wang, J. Color shading detection and rating system for denim based on computer vision. J. Text. Res. 2019, 40, 163–169. [Google Scholar]
- Skouroliakou, A.; Kalatzis, I.; Kalyvas, N. Infrared thermography quantitative image processing. J. Phys. Conf. Ser. 2017, 931, 012033. [Google Scholar] [CrossRef] [Green Version]
- Wang, Y.W.; Qu, G.T.; Liu, X.L. Image subtraction detection algorithm for surface defect of steel ball. J. Comput. Aided Des. Comput. Graph. 2016, 28, 1699–1704. [Google Scholar]
- Li, B.; Dong, M.L.; Zhang, F. Research of preparation and image processing method of PDMS micropost arrays with opaque top surface. Infrared Laser Eng. 2018, 47, 380–387. [Google Scholar]
- Glowacz, A.; Glowacz, W.; Glowacz, Z.; Kozik, J. Early fault diagnosis of bearing and stator faults of the single-phase induction motor using acoustic signals. Measurement 2018, 113, 1–9. [Google Scholar] [CrossRef]
- Xu, S.P.; Zhang, X.Q.; Jiang, Y.N. Noise level estimation based on local means and its application to the blind BM3D denoising algorithm. J. Image Graph. 2017, 22, 422–434. [Google Scholar]
- Wu, L.L.; Xing, Y.Q.; Zheng, B.Z. A preliminary study of zanthoxylurn bungeanum maxim varieties discriminating by computer vision. Chin. J. Sens. Actuators 2016, 29, 136–140. [Google Scholar]
- Li, J.F.; Li, M.R. Research on detecting method of light guide plate defect based on machine vision. Optoelectron. Laser 2019, 30, 256–265. [Google Scholar]
- Xu, Y.; Zhu, Z.C.; Sheng, X.W. Improvement recognition method of vamp’s feature points based on machine vision. J. Text. 2019, 40, 168–174. [Google Scholar]
- Xue, B.; Yang, Z.; Zhao, J.; Ma, R.; Guo, H. Grain size characterization by laser-based ultrasonics based on the centroid frequency shift method. Mater. Charact. 2019, 155, 109800. [Google Scholar]
- Caesarendra, W.; Gang, N.; Yang, B.S. Machine condition prognosis based on sequential monte carlo method. Expert Syst. Appl. 2010, 37, 2412–2420. [Google Scholar] [CrossRef]
- Xu, J.B.; Nie, J.L.; Wang, S. Robust filtering method for surface measurement based on rough error estimation. Acta Metrol. Sin. 2017, 38, 391–395. [Google Scholar]
- Liu, H.; Wang, Z.X.; Zhong, J.; Xie, Z.W. Early detection of spontaneous combustion disaster of sulphide ore stockpiles. Teh. Vjesn. 2015, 22, 1579–1587. [Google Scholar]
- Kong, F.D.; Chen, C.; Wang, C.; Ren, X.D. The effect of different stability calculation methods on the results of quantity comparison. Shanghai Metrol. Test 2008, 45, 37–39. [Google Scholar]
Figure 1.
Flow chart of the detection method.

Figure 2.
Experimental scheme.

Figure 3.
Processing flow chart of the slip detection algorithm.

Figure 4.
Schematic diagram of the object distance change.

Figure 5.
Flow chart of the nonlinear geometric transformation.

Figure 6.
Translation schematic diagram of the coordinate system.

Figure 7.
Schematic diagram of the nonlinear geometric transformation.

Figure 8.
Linear interpolation schematic diagram.

Figure 9.
Schematic diagram of the coordinate system translation.

Figure 10.
Geometric transformation contrast image.

Figure 11.
Flow chart of the image processing algorithm.

Figure 12.
The processed images.

Figure 13.
Experimental platform.

Figure 14.
Interface of the elevator traction wheel slip detection system.


Table 1.
Test results.
| Group Number | The Real Slippage/mm | Single Pixel Distance/pixel | Average Pixel Distance/pixel | Detection of Slippage/mm | Absolute Error/mm | Fractional Error/% | Residual Error/mm |
|---|---|---|---|---|---|---|---|
| 1 | 33.93 | 41 | 40.0 | 35.6 | 1.67 | 4.9% | 1.8 |
| 40 | |||||||
| 39 | |||||||
| 2 | 34.34 | 37 | 37.0 | 33.0 | −1.32 | −3.8% | −0.7 |
| 36 | |||||||
| 38 | |||||||
| 3 | 34.91 | 37 | 37.3 | 33.3 | −1.60 | −4.6% | −0.4 |
| 40 | |||||||
| 35 | |||||||
| 4 | 32.99 | 40 | 38.7 | 34.5 | 1.46 | 4.4% | 0.7 |
| 37 | |||||||
| 39 | |||||||
| 5 | 31.96 | 36 | 37.0 | 33.0 | 1.06 | 3.3% | −0.7 |
| 37 | |||||||
| 38 | |||||||
| 6 | 32.42 | 36 | 36.3 | 32.4 | 0.03 | 0.1% | −1.3 |
| 37 | |||||||
| 36 | |||||||
| 7 | 32.48 | 39 | 37.3 | 33.3 | 0.83 | 2.5% | −0.4 |
| 37 | |||||||
| 36 | |||||||
| 8 | 32.47 | 38 | 39.7 | 35.3 | 2.84 | 8.8% | 1.6 |
| 41 | |||||||
| 40 | |||||||
| 9 | 32.02 | 39 | 37.3 | 33.3 | 1.29 | 4.0% | −0.4 |
| 37 | |||||||
| 36 | |||||||
| Average value | 33.06 | 37.9 | 37.9 | 33.8 | 0.74 | 2.2% |
© 2020 by the authors. Licensee MDPI, Basel, Switzerland. This article is an open access article distributed under the terms and conditions of the Creative Commons Attribution (CC BY) license (http://creativecommons.org/licenses/by/4.0/).
Share and Cite
MDPI and ACS Style
Chen, J.; Jing, L.; Hong, T.; Liu, H.; Glowacz, A. Research on a Sliding Detection Method for an Elevator Traction Wheel Based on Machine Vision. Symmetry 2020, 12, 1158. https://0-doi-org.brum.beds.ac.uk/10.3390/sym12071158
AMA Style
Chen J, Jing L, Hong T, Liu H, Glowacz A. Research on a Sliding Detection Method for an Elevator Traction Wheel Based on Machine Vision. Symmetry. 2020; 12(7):1158. https://0-doi-org.brum.beds.ac.uk/10.3390/sym12071158
Chicago/Turabian StyleChen, Jiayan, Limeng Jing, Tao Hong, Hui Liu, and Adam Glowacz. 2020. "Research on a Sliding Detection Method for an Elevator Traction Wheel Based on Machine Vision" Symmetry 12, no. 7: 1158. https://0-doi-org.brum.beds.ac.uk/10.3390/sym12071158
Note that from the first issue of 2016, this journal uses article numbers instead of page numbers. See further details here.