
Development and Investigation of Fully Ventilated Deep Subwavelength Absorbers

School of Aircraft Engineering, Nanchang Hangkong University, 696 South Fenghe Avenue, Nanchang 330063, China
*
Author to whom correspondence should be addressed.
Symmetry 2021, 13(10), 1835; https://0-doi-org.brum.beds.ac.uk/10.3390/sym13101835
Submission received: 26 August 2021
/
Revised: 22 September 2021
/
Accepted: 26 September 2021
/
Published: 1 October 2021
(This article belongs to the Special Issue Symmetry and Asymmetry in Composite Materials and Its Applications)
Abstract
:A new type of deep subwavelength acoustic metamaterial (AMM) absorber with 100% ventilation is presented in this study. The proposed ventilation absorber consists of coiled-up half-wave resonators (HWRs) and quarter-wave resonators (QWRs). First, the sound absorption and sound transmission performances for absorbers were analyzed considering the thermal viscosity dissipation. Then, the prototype with ten HWRs and three QWRs composed of acrylic plates was manufactured based on the theoretical model. The acoustic performance of the absorber was tested in an air-filled acoustic impedance tube to determine the sound absorption and transmission loss performances. Good agreement was found between the measured and theoretically predicted results. The experimental results show that the proposed ventilation AMM absorber is able to achieve sound absorption in a range between 330 Hz and 460 Hz with a thickness of only 32 mm (about 3% of the wavelength in the air). Furthermore, the sound transmission loss can achieve 17 dB from 330 Hz to 460 Hz. The main advantage of the proposed absorber is that it can be completely ventilated in duct noise control.
1. Introduction
The problem of noise pollution has gradually increased in recent years. Research has shown that noise has a great impact on people’s physical and mental health [1,2,3,4,5,6,7,8], mostly having a direct effect on sleep [5]. Long-term exposure to noise will induce physiological disorders. Moreover, researchers have studied people exposed to noisy environments, such as roads, railways, and airports, and found that exposure to noise increases the risk of cardiovascular disease [1,2,3,7], whilst low-frequency noise affects human cognition [6] and has a more obvious impact on the health of vulnerable people [2]. Therefore, noise attenuation is important for human health. It is well known that high-frequency noise is easy to reduce by using conventional passive control techniques, such as fiber materials and synthetic foam [9,10,11,12,13,14]. However, it is difficult to reduce low-frequency noise, since the thickness of these materials, by rule of thumb, is approximately a quarter of the operating wavelength [15], which would certainly cause the oversize of these materials in low-frequency noise reduction. This can be attenuated with the use of acoustic metamaterials (AMMs), which have grown, after two decades of development, from the initial sonic crystals with effective negative elastic constants [16] to the current manifold structure AMMs that contain subwavelength structures and acoustic metasurfaces [17,18,19,20,21]. In recent years, it has been demonstrated that to improve the wavelength-to-thickness ratio, the back cavity can be processed into coiled-up Fabry–Pérot (FP) channels [22] to maximize the operating frequency wavelength in a limited space. Moreover, Long et al. [20] and Chang et al. [18] presented two new structures that can dampen sound with 17.7 and 7.1 times its own thickness wavelength (λ). Furthermore, Wu et al. [21] and Almeida et al. [23] proposed a hybrid structure, coupling a micro-perforated plate (MPP) with coiled-up FP channels whose working frequency wavelength can reach up to 30 times their own thickness.
AMMs can be used not only in sound absorption but also for sound insulation, as in the case of membrane-type AMM [24,25], which exhibits good sound insulation performance at low frequencies. However, the membrane itself has significant shortcomings, including subversion resistance and ventilation. More recently, Zhang et al. [26] built a corrective structure made from acrylonitrile–butadiene–styrene (ABS) plastic with a 63% ventilation rate so as to address the issues of lack of anti-destructiveness and ventilation, and Fusaro et al. [27] designed a metacage window structure (with a 33% opening ratio), which has a mean value of 30 dB of TL from 350 Hz to 5000 Hz.
From the above examples in the literature, it can be concluded that the current structure of AMM shows a huge advantage in sound absorption and insulation. However, high-efficiency, low-frequency sound absorption and insulation (concerning ventilation) remain significant challenges in acoustical engineering. Thus, in this study, we propose a symmetry absorber that has both sound absorption and insulation. Not only does it absorb noise with a deep subwavelength (0.03λ), but it is also noise proof in the case of a 100% ventilation rate. Moreover, under the same test conditions, the TL and sound insertion loss (IL) performances of this absorber in full ventilation are not available in the micropore AMMs.
The current paper starts with a description of an AMM, designed using the coiled-up channel. Then, the analytical method for sound absorption and insulation is reported. Subsequently, the experimental results are presented and compared to the theoretical results. Finally, we summarize our work on the subwavelength structure for the low-frequency integration study of sound absorption and insulation in the case of a 100% ventilation rate.
2. Analysis of the Ventilated AMM Absorber
2.1. Structure of the Ventilated AMM Absorber
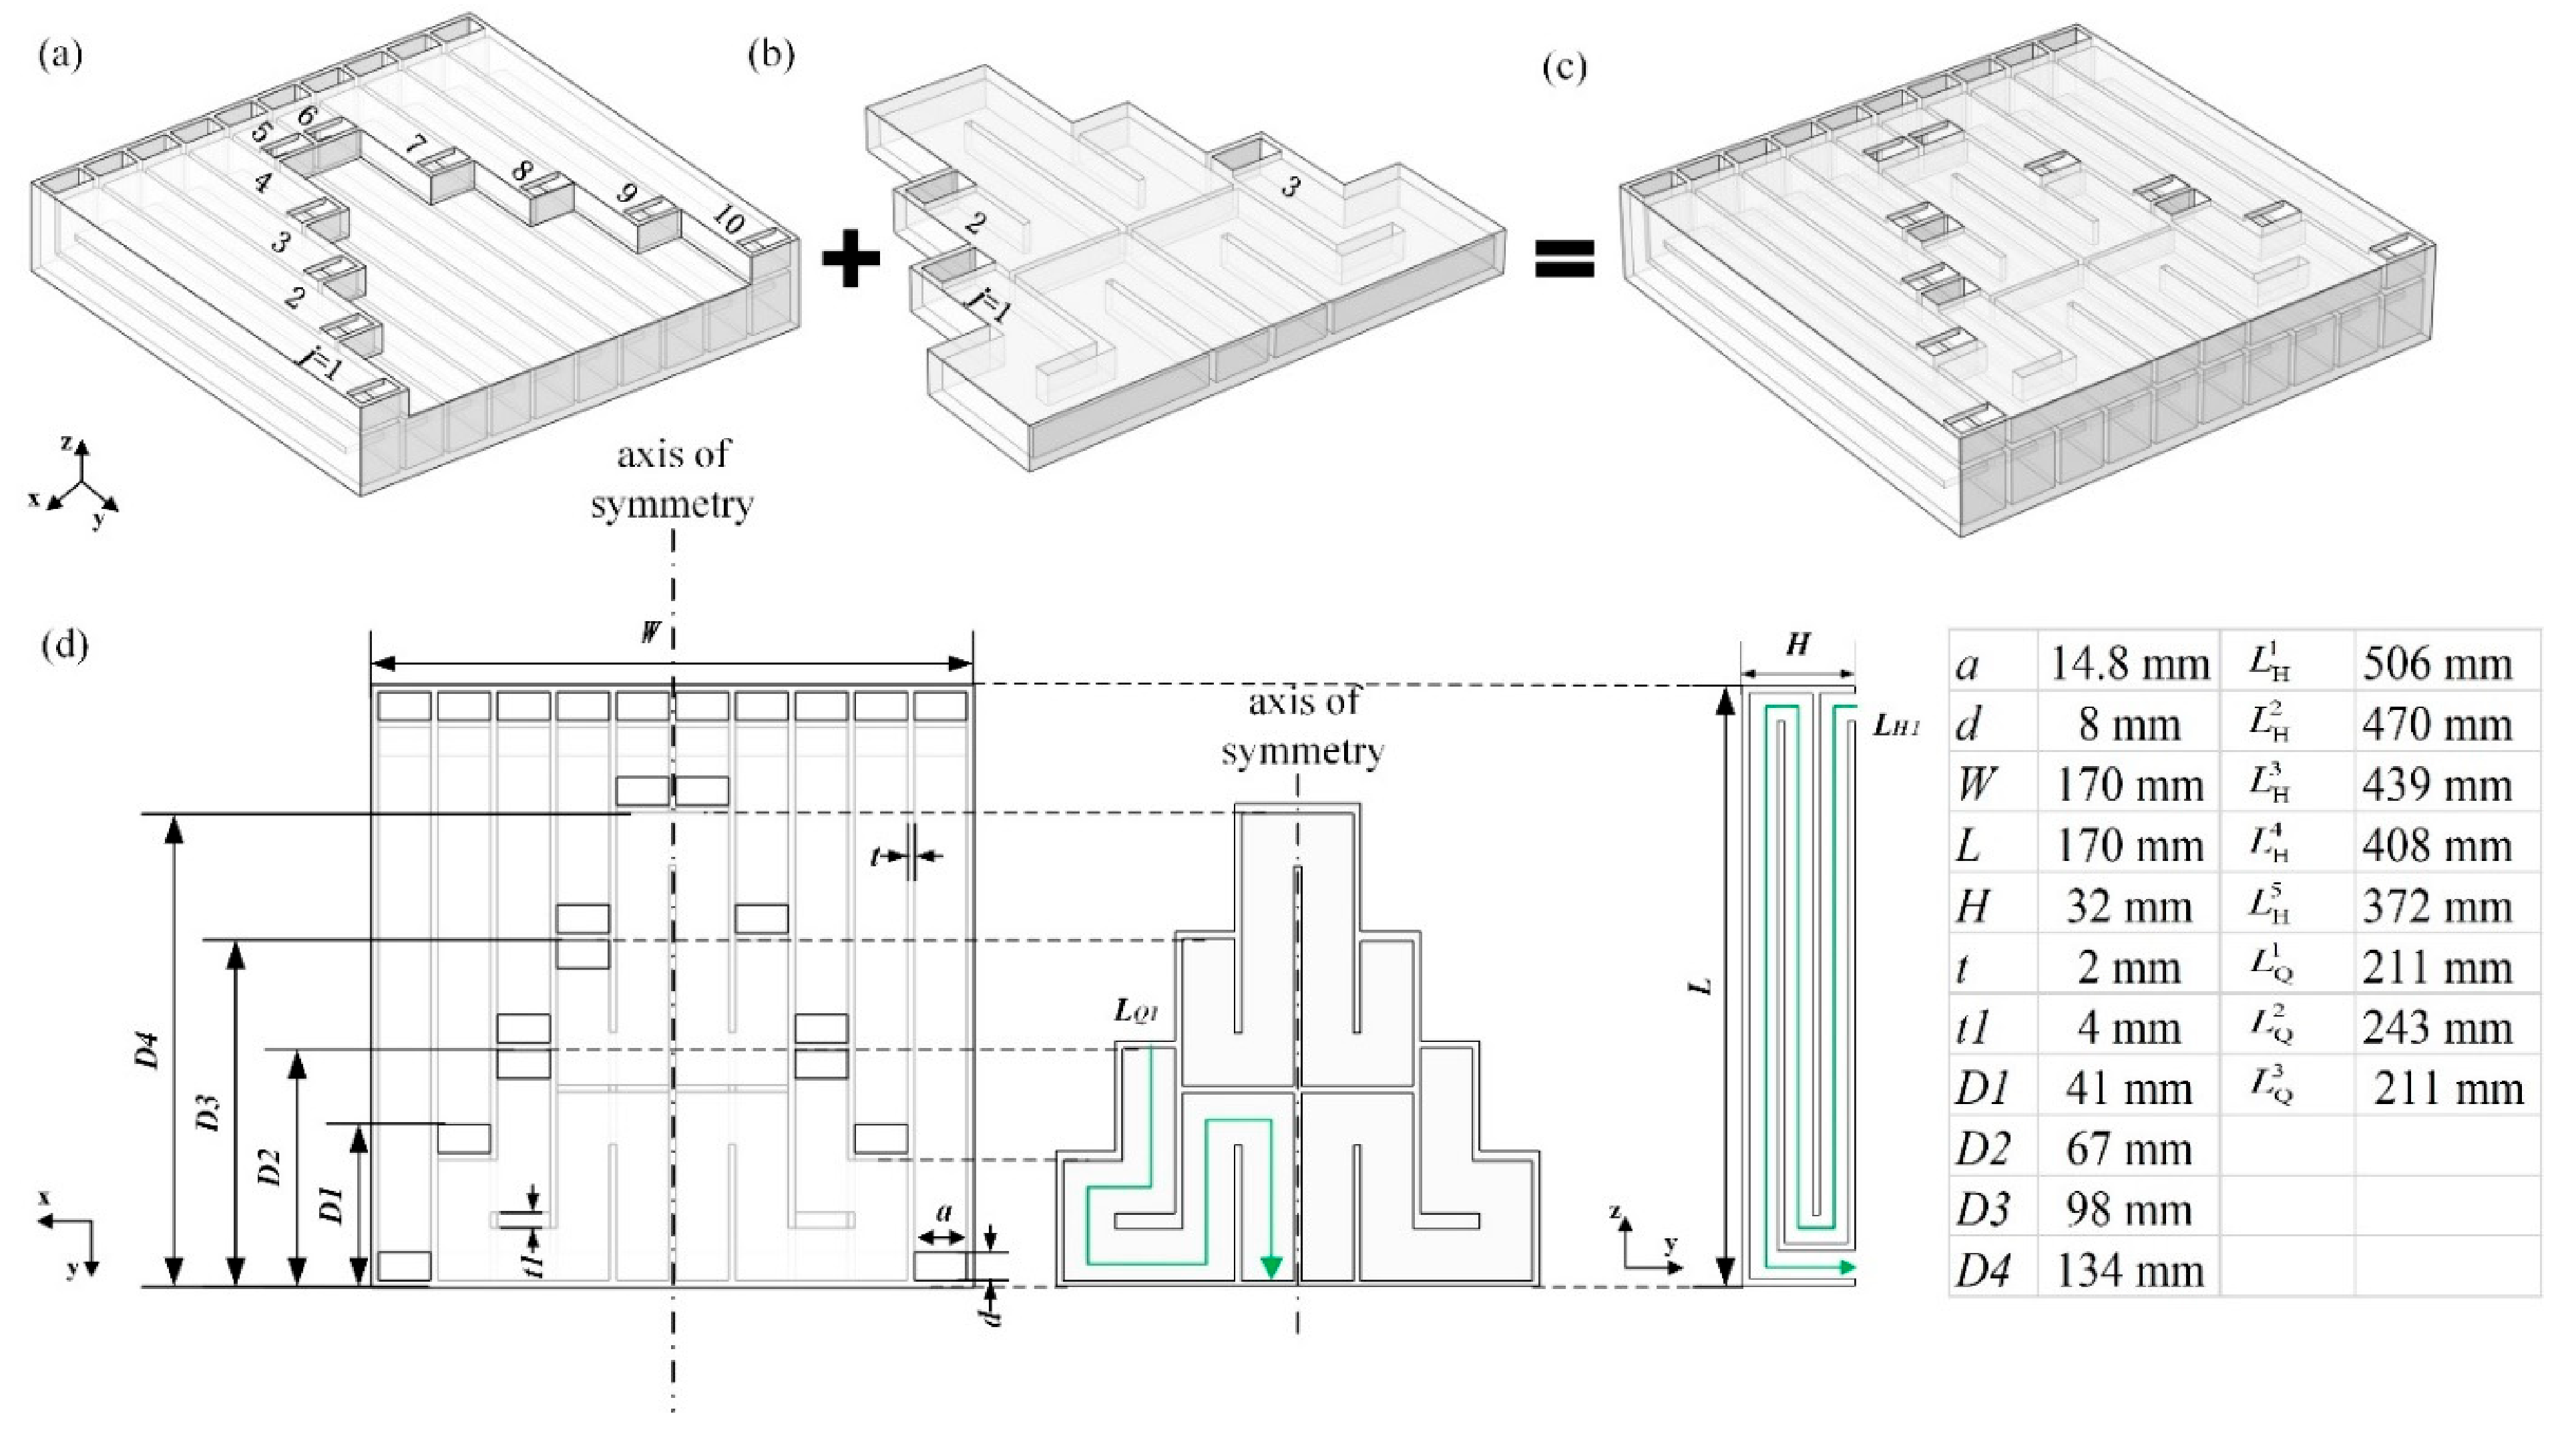
The proposed sound absorber is composed of five pairs of symmetrical HWRs formed by coiled-up space and, to improve the utilization of the remaining surface space in the upper level, three QWRs containing a pair of symmetrical numbers with the designed length were installed in the remaining volume. Thus, this sound-absorbing structure is a compound of two types of tubes, as shown in Figure 1a–c. Required geometrical parameters are marked in the top view of the model and in the cross-sectional view of a unit tube, as shown in Figure 1d.
2.2. Sound Absorption Coefficient
Assuming that the cavity is distributed on the rigid panel of the absorber (as shown in Figure 1c), the total impedance on the surface of the model () can be given by the sum of the impedance of the HWRs () and QWRs (), such as
where the superscript “j” stands for j-th coiling-space, i.e., the HWRs or QWRs, along the x-axis.
According to the authors of [15], the surface impedance and can be expressed as
and
where is the area in the xy plane of the absorber; is the cross-sectional area of the j-th square coiled-up units; [28] is the effective length of the QWRs, with the j-th physical length of the QWRs as and the modified parameters of wave propagation distance as ; and is the effective length of the HWRs, with the j-th physical length of the HWRs as .
Considering that the one-dimensional viscothermal plane wave propagates in the uniform square-section pipe, the effective acoustic propagation constant and the characteristic impedance can be expressed through the function [29,30], which yields
and
in which
where the constant coefficients and (m, n = 0, 1, 2, …); is angular frequency; the constants and with , , and indicating the thermal conductivity, specific heat at constant volume, and kinematic viscosity of air, respectively; is the specific heat ratio; is the imaginary unit; and is the independent variable of the function .
The degree of energy dissipation of the sound-absorbing material is reflected by the sound absorption coefficient . It is related to the ratio of the incident and reflected wave. Therefore, the sound absorption coefficient at the surface of the absorber can be expressed as
where is the reflection coefficient; and and are the density and sound velocity of air, respectively.
2.3. Transmission Loss Based on Transfer Matrix
A complex system can be divided into some basic acoustic units. The relationship of state variables between the inlet and outlet of each acoustic unit can be represented by the transfer matrix. By multiplying the transfer matrix of all the units, the transfer matrix of the whole system can be obtained [31].
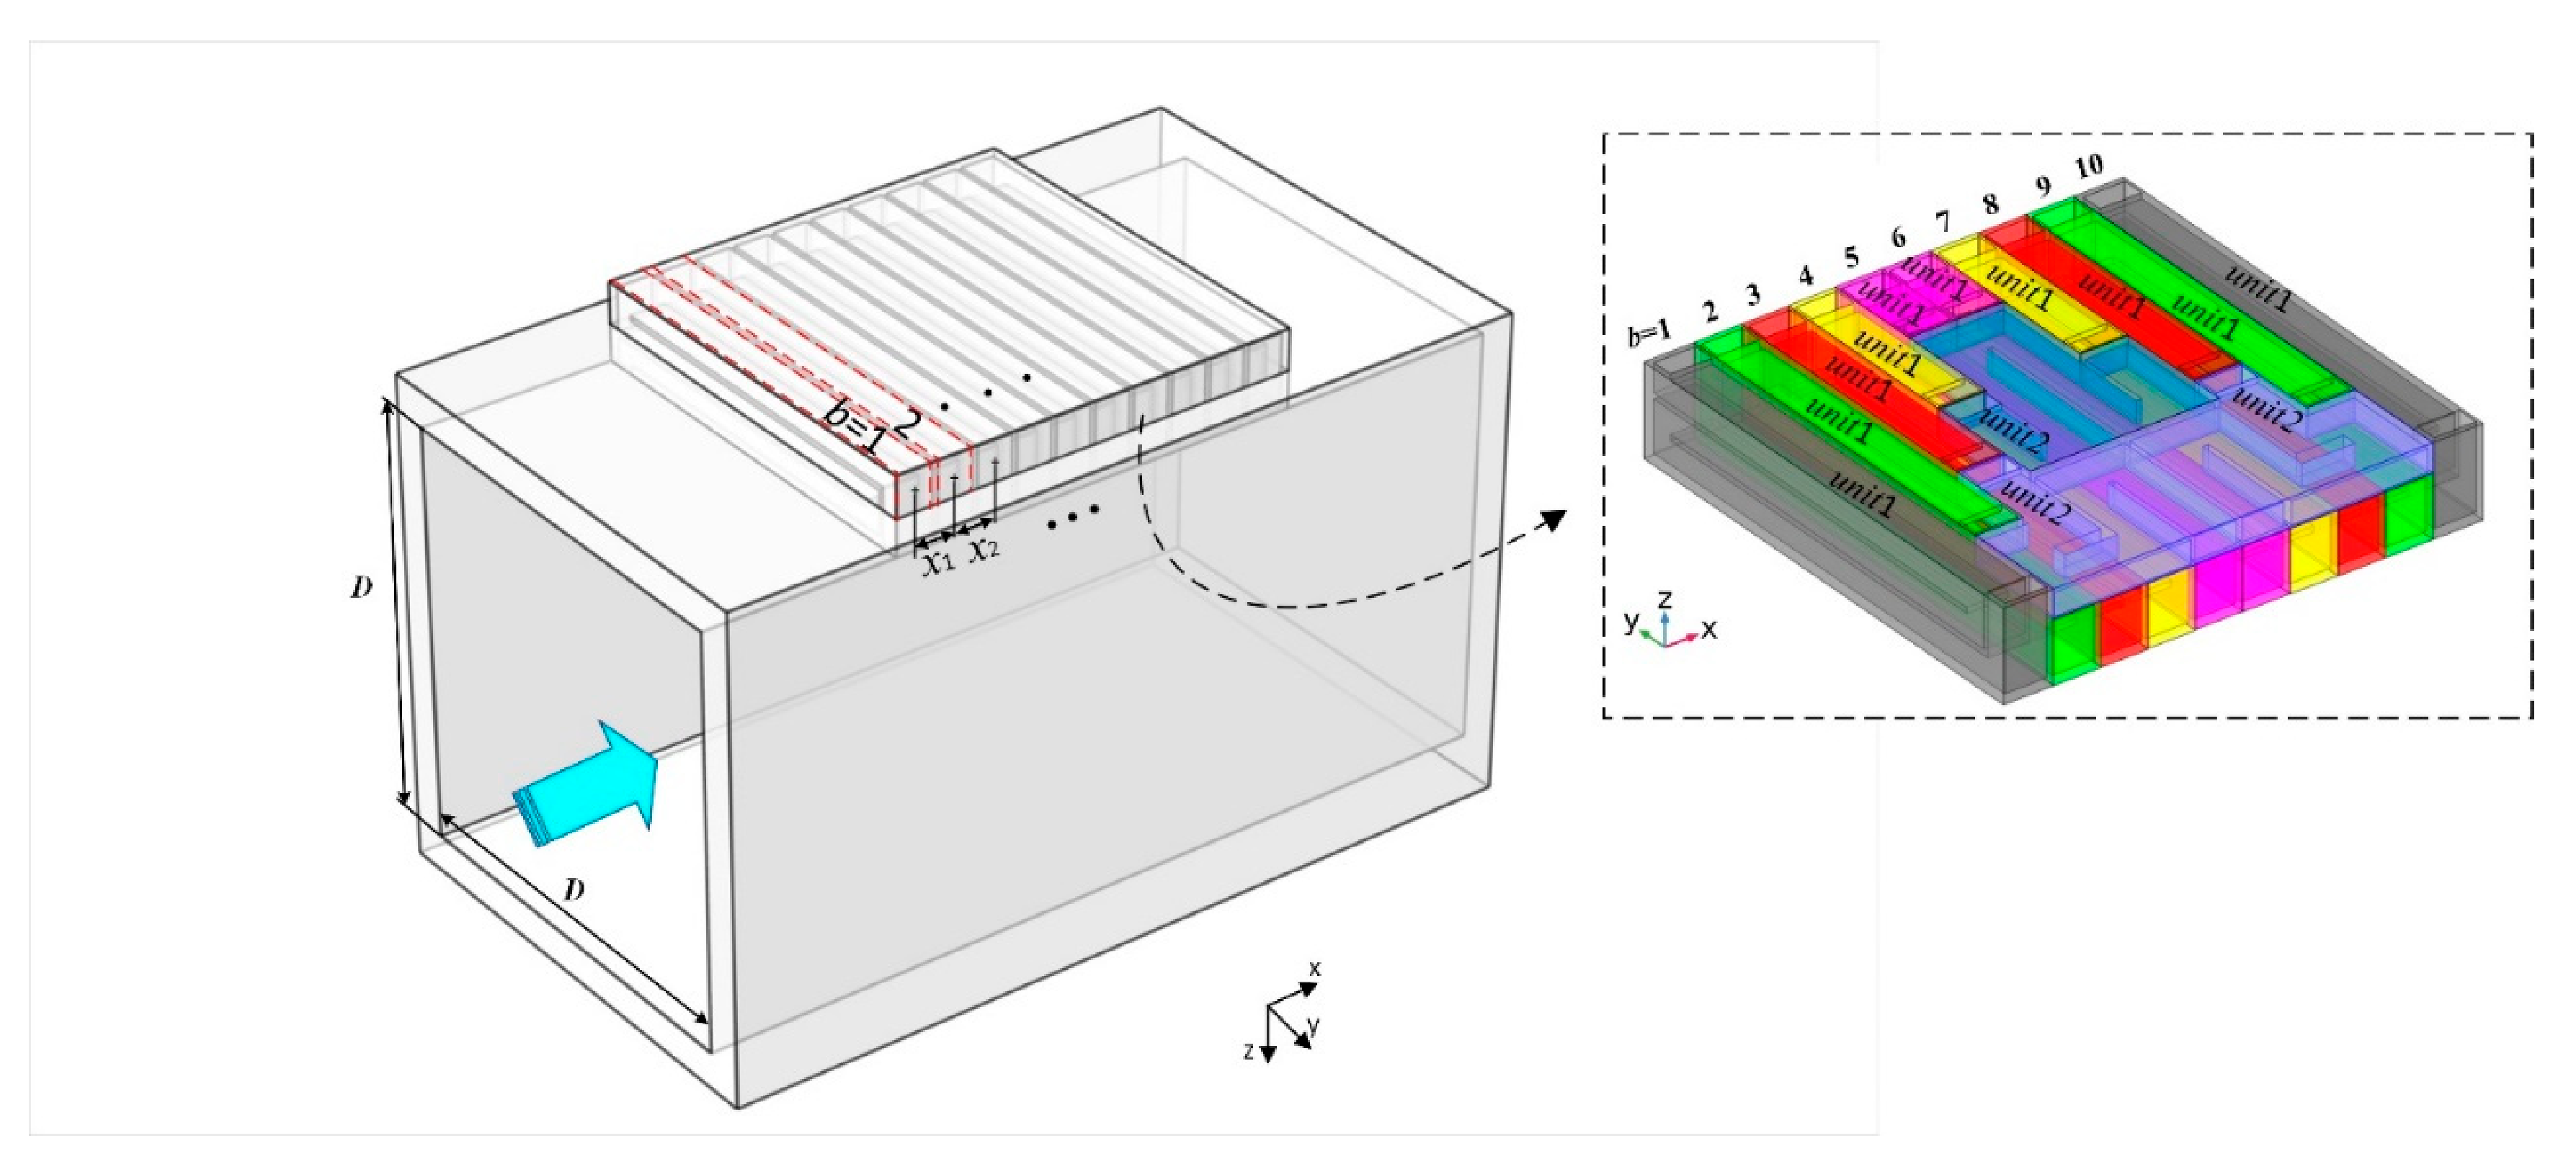
As shown in Figure 2, the complex pipeline system is divided, producing a multi-bypass system, and these two systems are equidistant from each other. Assuming plane wave propagation, transfer matrices expressing the relationship of state variables between the “in” and “out” of the b-th bypass system () and the connecting portion between b-th and (b + 1)-th bypass pipe system along the x-axis () can be expressed as
and
where is the area of the main tube; and are the cross-sectional areas of the HWRs and QWRs, respectively; and are the effective length for the HWRs and QWRs, respectively, in which and represent the physical length for the HWRs and QWRs, respectively; ; = 16.8 mm is the distance between two adjacent bypass systems (b-th and (b + 1)-th); and superscript “bu” denotes u-th bypass tube, i.e., the HWRs or QWRs, in b-th bypass system.
Finally, this complex pipeline system can be represented by the transfer matrices between basic acoustic units, such as
where and are the sound pressure and volume velocity at the inlet of the first acoustic unit in the complex system, respectively; and are the sound pressure and volume velocity at the outlet of the last acoustic unit in the complex system (as shown in Figure 2), respectively; and A, B, C, and D are the four matrix elements of the transfer matrix of the whole system ().
The expression of sound transmission loss (TL) of the whole system according to the matrix elements is obtained and expressed as follows:
Figure 2.
Schematic diagram of the process of solving the sound transmission loss based on the model studied in this paper, in which D = 170 mm and = = … = 16.8 mm.
Figure 2.
Schematic diagram of the process of solving the sound transmission loss based on the model studied in this paper, in which D = 170 mm and = = … = 16.8 mm.

3. Comparison and Analysis of the Results of the Experiment and Calculations
3.1. Experiment Setup
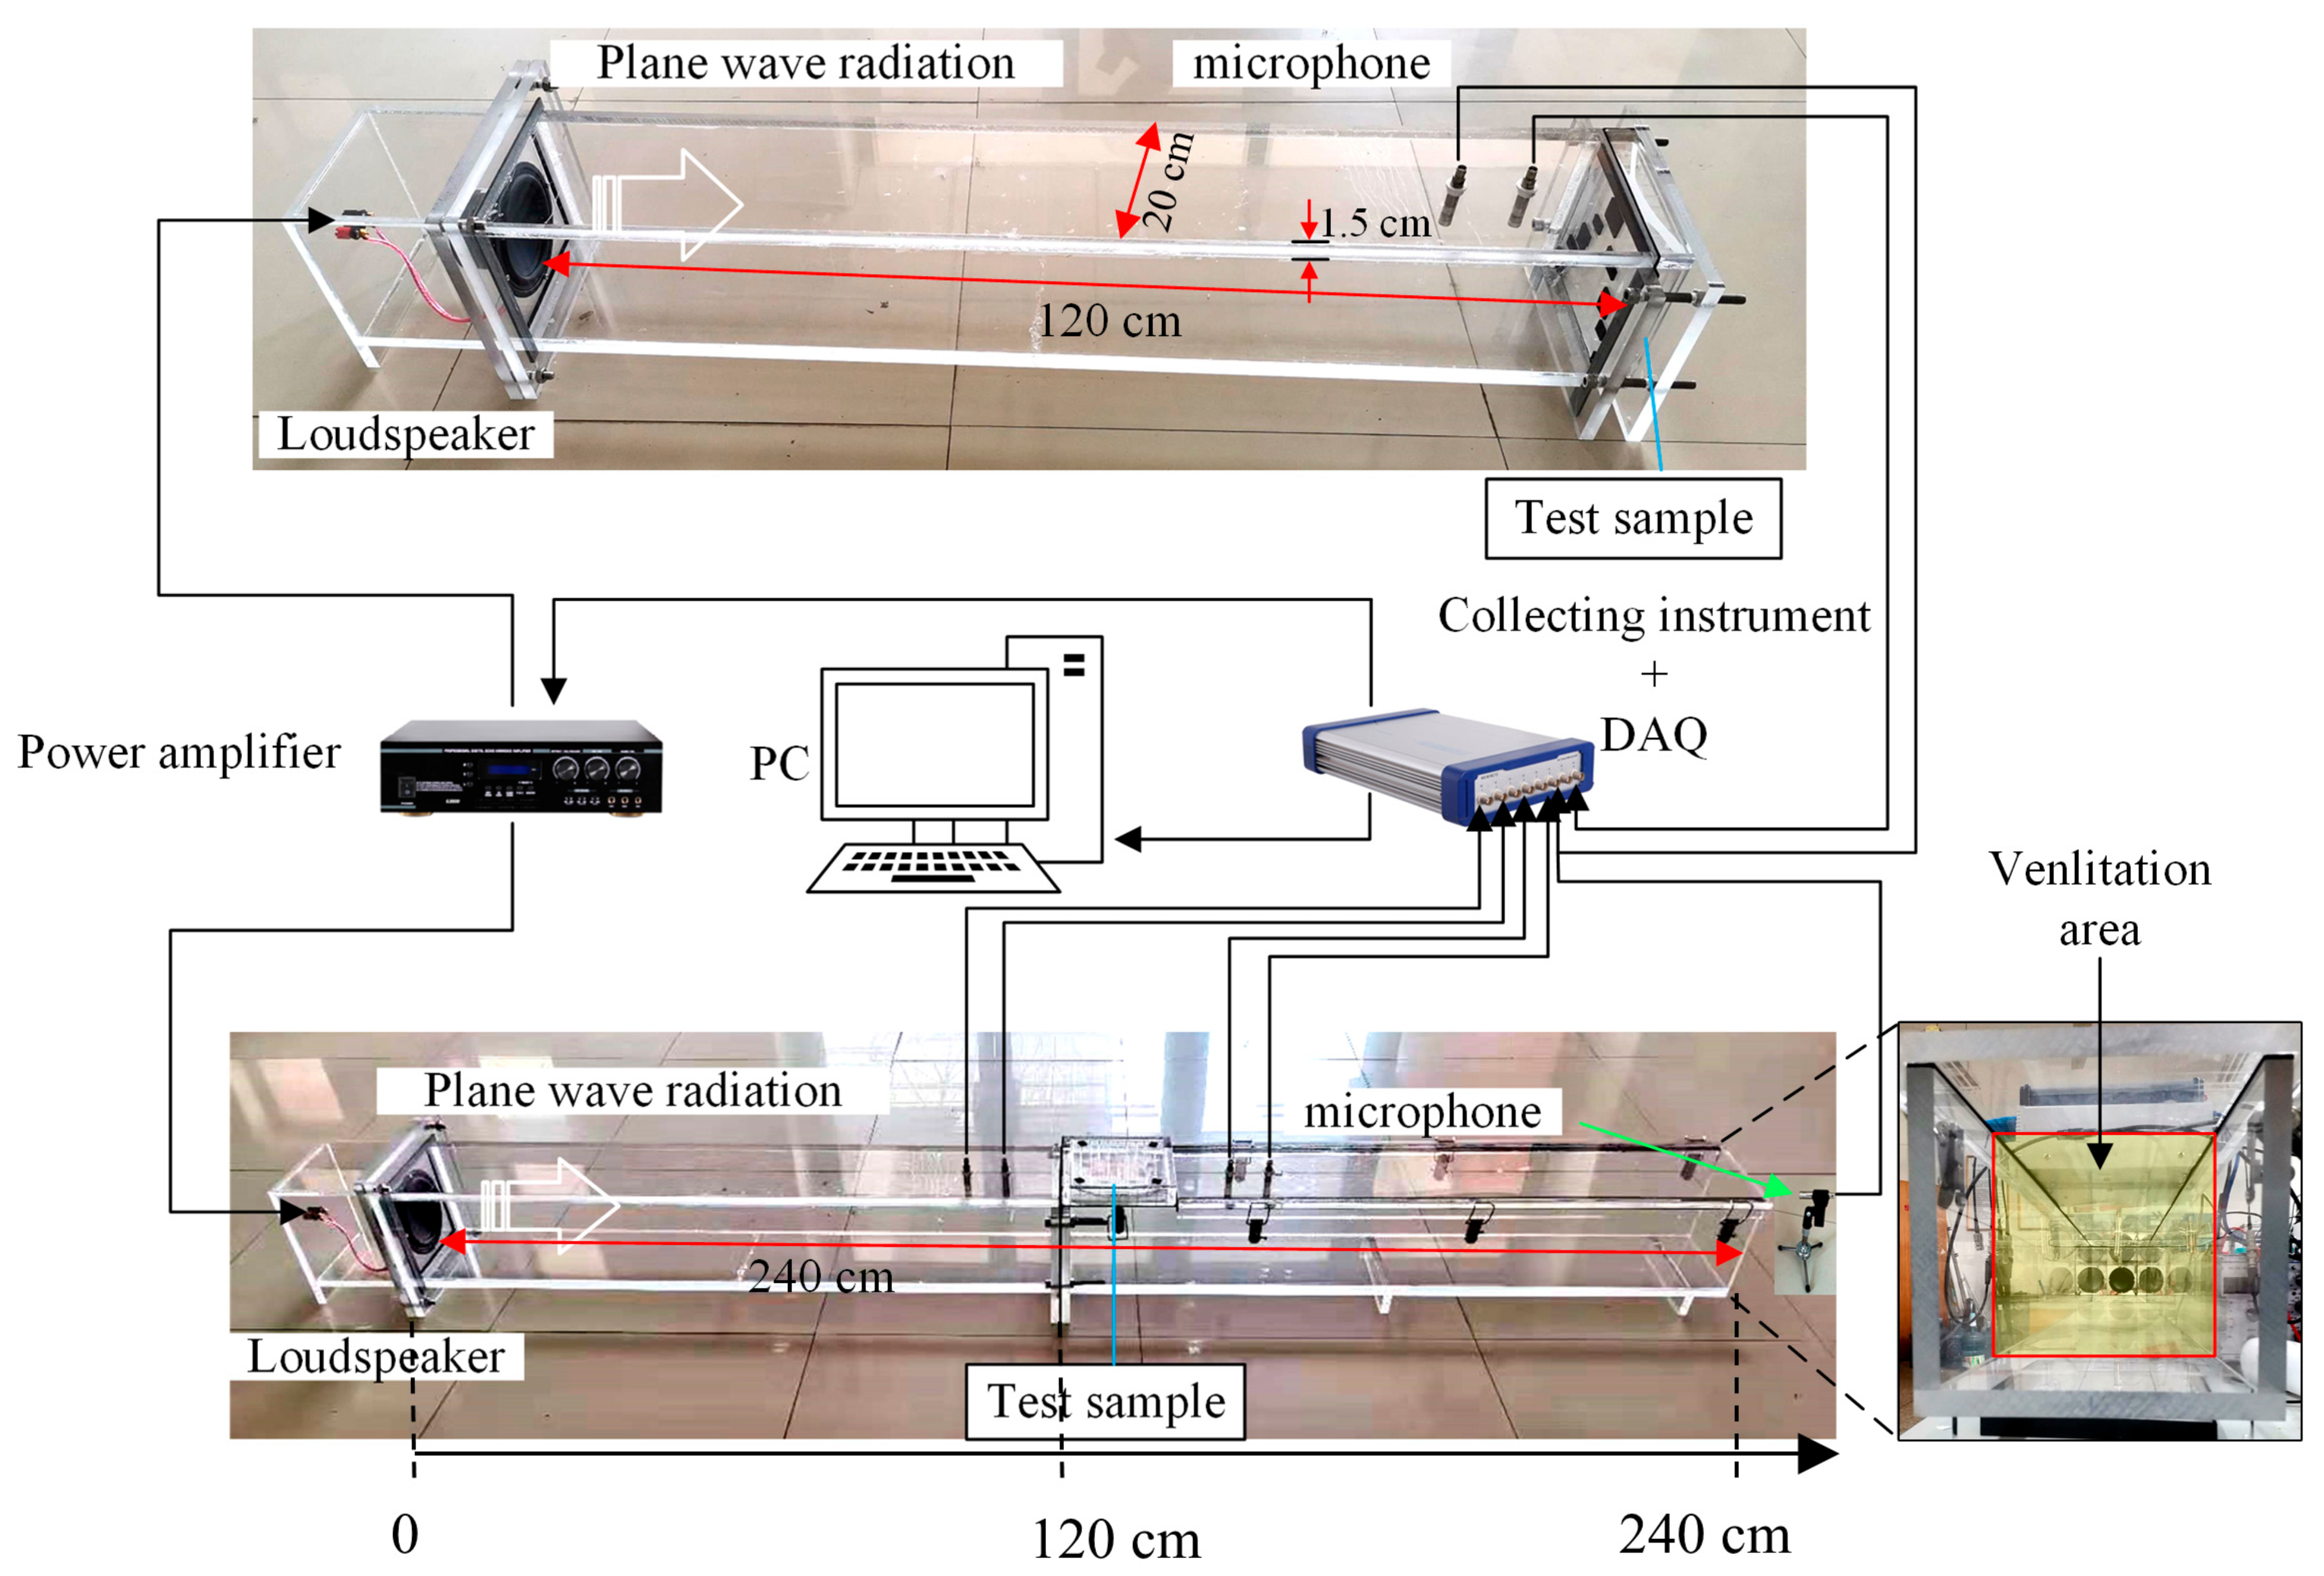
According to the given parameters, we cut polymethyl methacrylate (PMMA) to fabricate the prototypes. In order to examine the acoustic attenuation performance of the prototype, we set up measuring systems of sound absorption, sound transmission (TL), and insertion loss (IL), as shown in Figure 3, of which the limiting frequency was 1133 Hz. The prototypes were excited using a broadband sound source over a frequency range of 10 Hz–1000 Hz in measurement. Firstly, based on the sound absorption measuring system, a single pair of symmetrical HWRs or QWRs cells and another single QWR cell (as the color parts show in Figure 4 and Figure 5) were measured using the two-microphone transfer function method [32]. To further investigate the sound absorption property in the broadband, we measured the model containing only symmetrical HWRs and the whole absorber. Except for the measured unit cells in the whole absorber, as described in the measuring process above, the other cells were temporarily sealed. Secondly, to analyze the potential in sound transmission loss and based on the TL measuring system, we measured one, two, and four absorbers with and without sponge, respectively using the four-microphone method [33]. Finally, in order to further reflect the noise reduction effect of the whole pipe testing system before and after the installation of the absorbers, we carried out the measurement of one, two, and four absorbers, respectively, by placing a microphone at the outlet of the main tube (as shown in Figure 3).
3.2. Sound Absorption
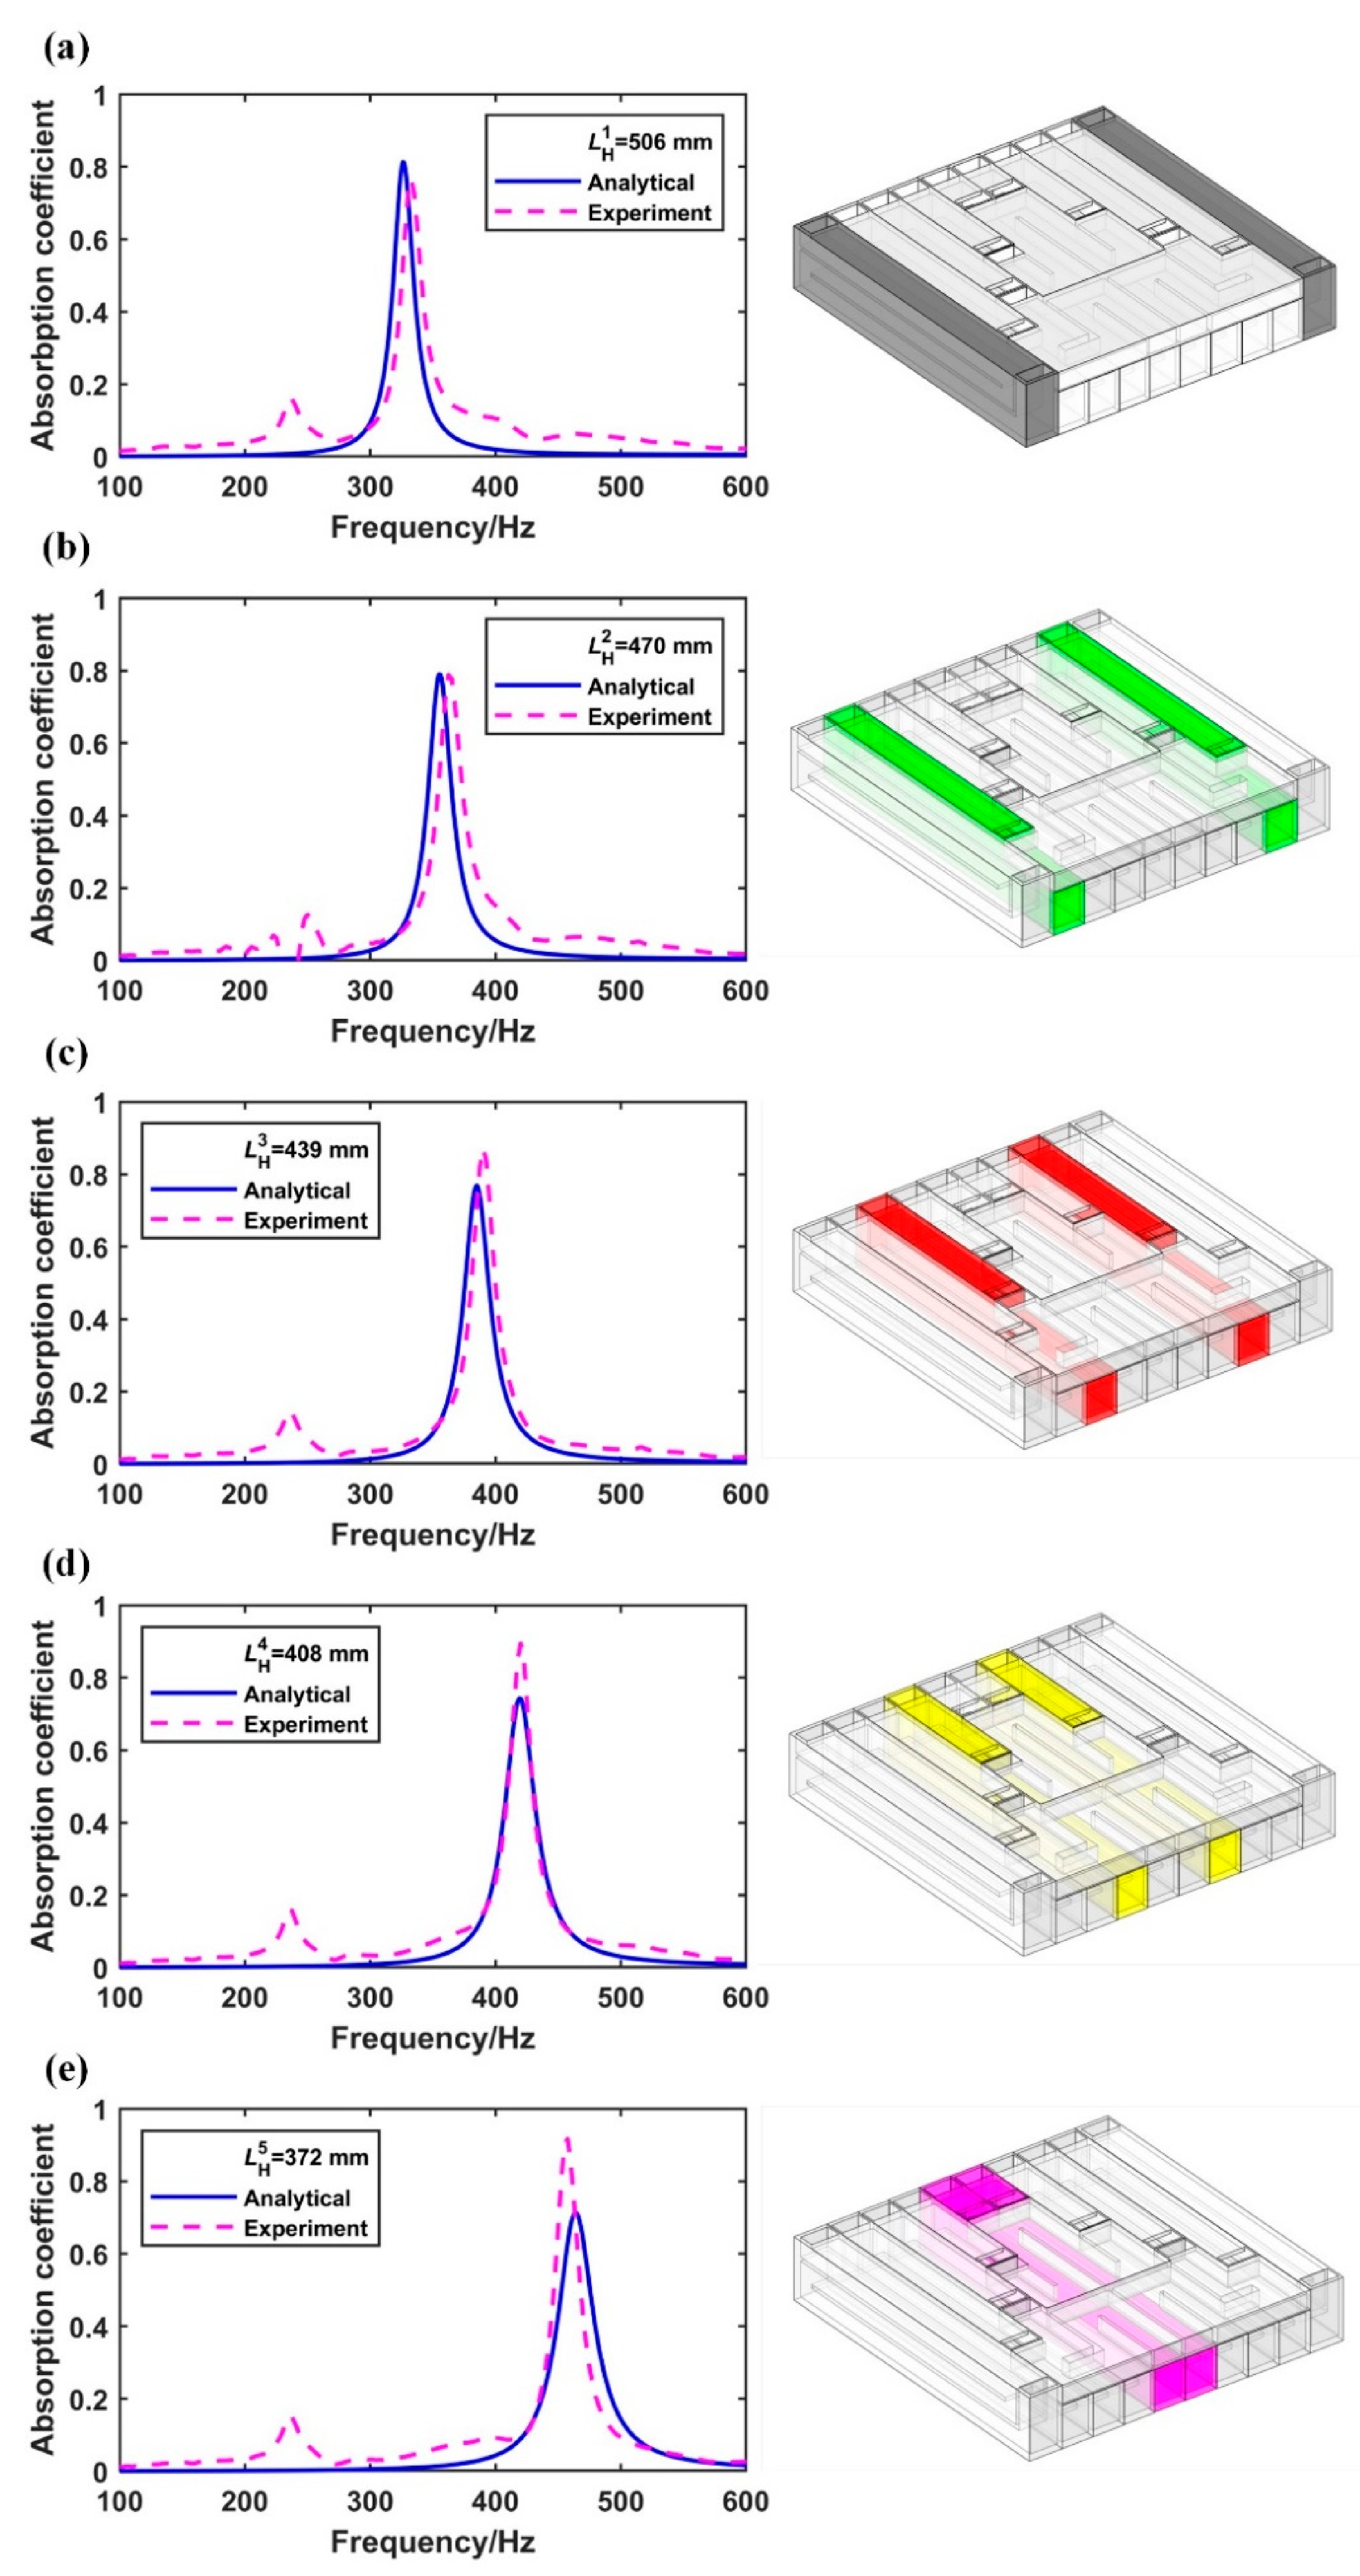
The measured sound absorption coefficients of a pair HWRs or QWRs or a single QWR are presented in Figure 4. In order to verify the theoretical model, the calculated results are also shown in Figure 4. From Figure 4, it can be deduced that the computed results agree reasonably well with the experimental results. For example, as Figure 4d shows, the sound absorption peaks corresponding to the natural frequencies of 419 Hz and 420 Hz are 0.74 and 0.89 for the analytical and experimental results, respectively, and the relative bandwidth at 50% of the maximum absorption is 29 Hz and 20 Hz for the analytical and experimental results, respectively. Comparing the other images in Figure 4 shows that the maximum relative difference between theory and experiment is less than 0.2 Hz, 7 Hz, and 10 Hz for the absorption peak, the natural frequency, and the relative bandwidth, respectively. The errors are mainly attributed to two aspects. On the one hand, errors were introduced in the manufacturing and assembling processes and were unavoidable. On the other hand, errors arose from the differences between the theoretical hypothesis and the actual circumstances of the experiment. In the theoretical model, we assumed that the surface that includes the impedance tube and the absorber was perfectly smooth and that the plane wave was propagated in the impedance tube. However, the experiment showed that some surface roughness inevitably exists in the impedance tube and the absorber, and the local non-planar wave exists in the discontinuous section, i.e., in the interface between the impedance tube and the absorber [17].
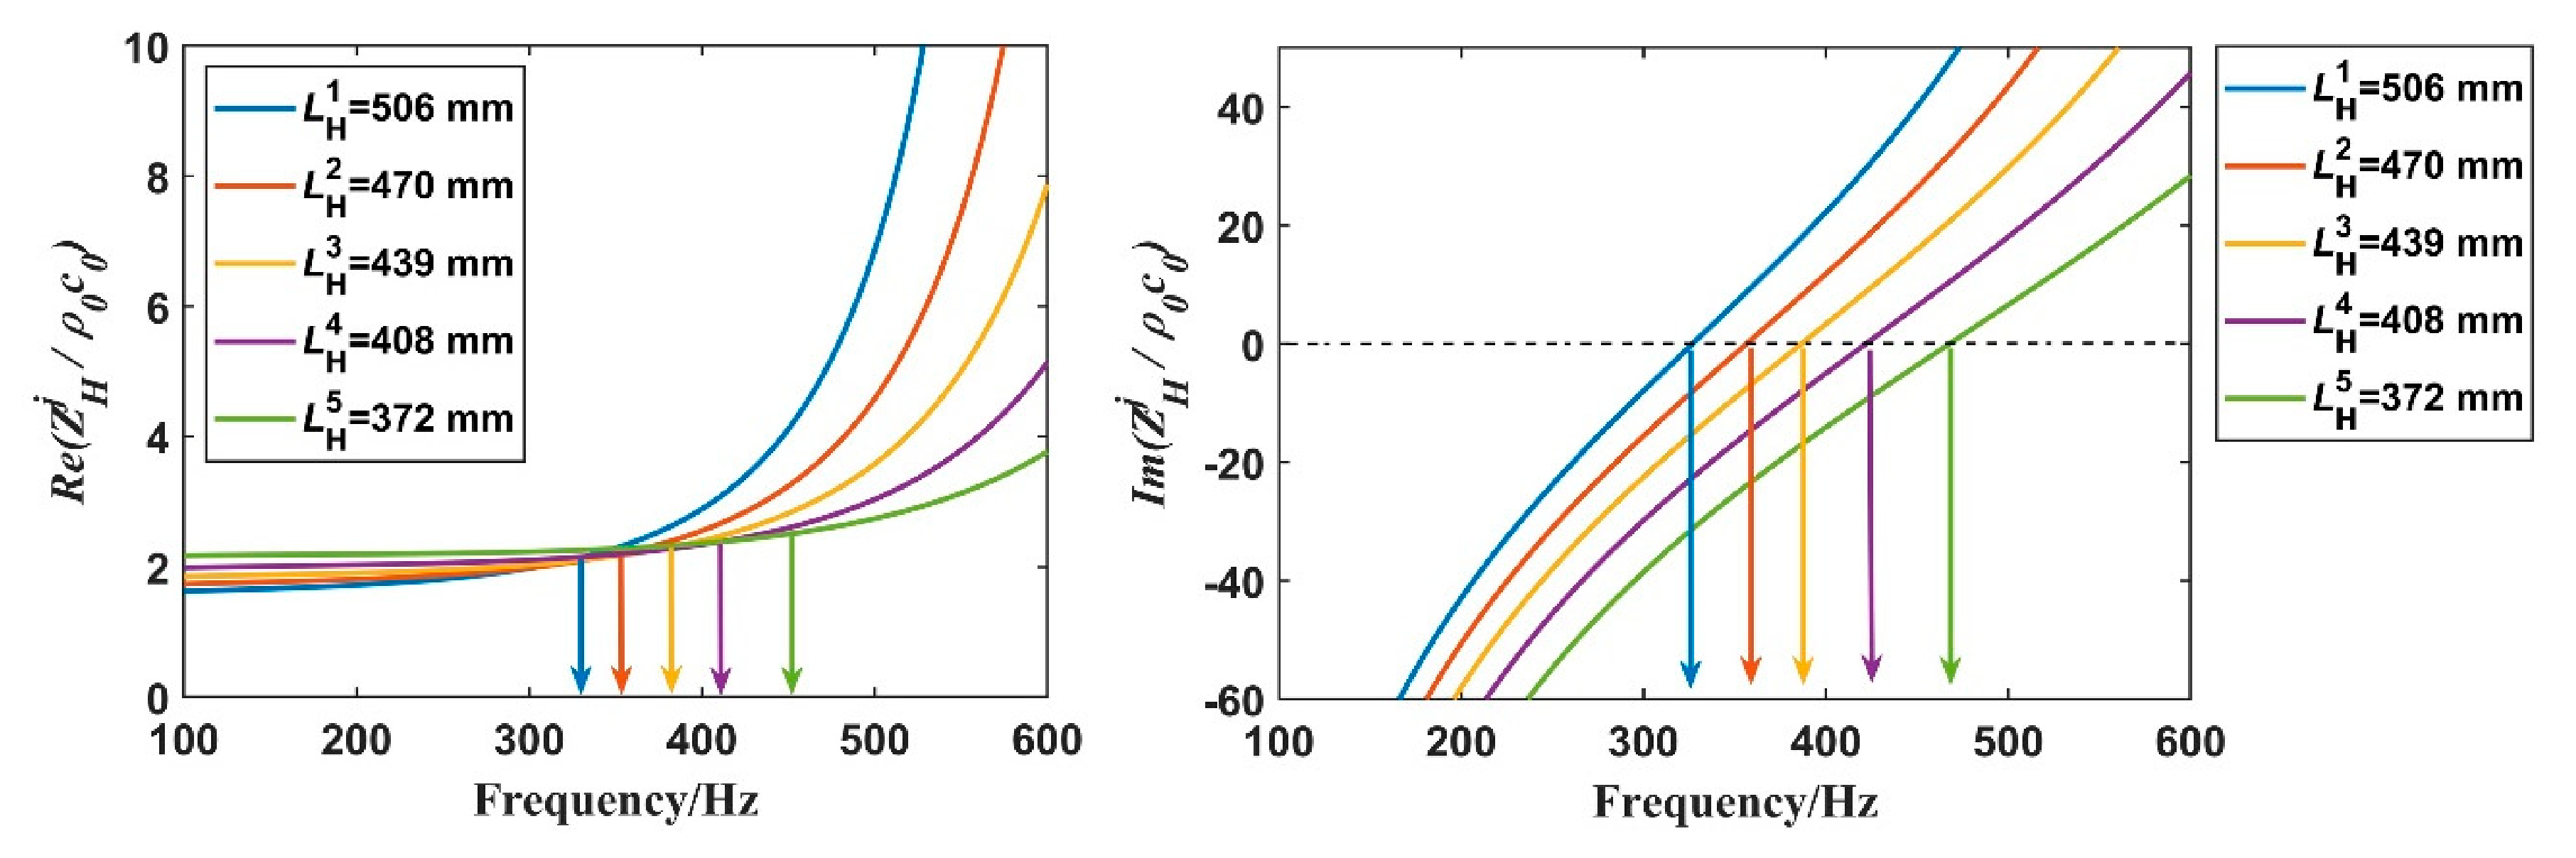
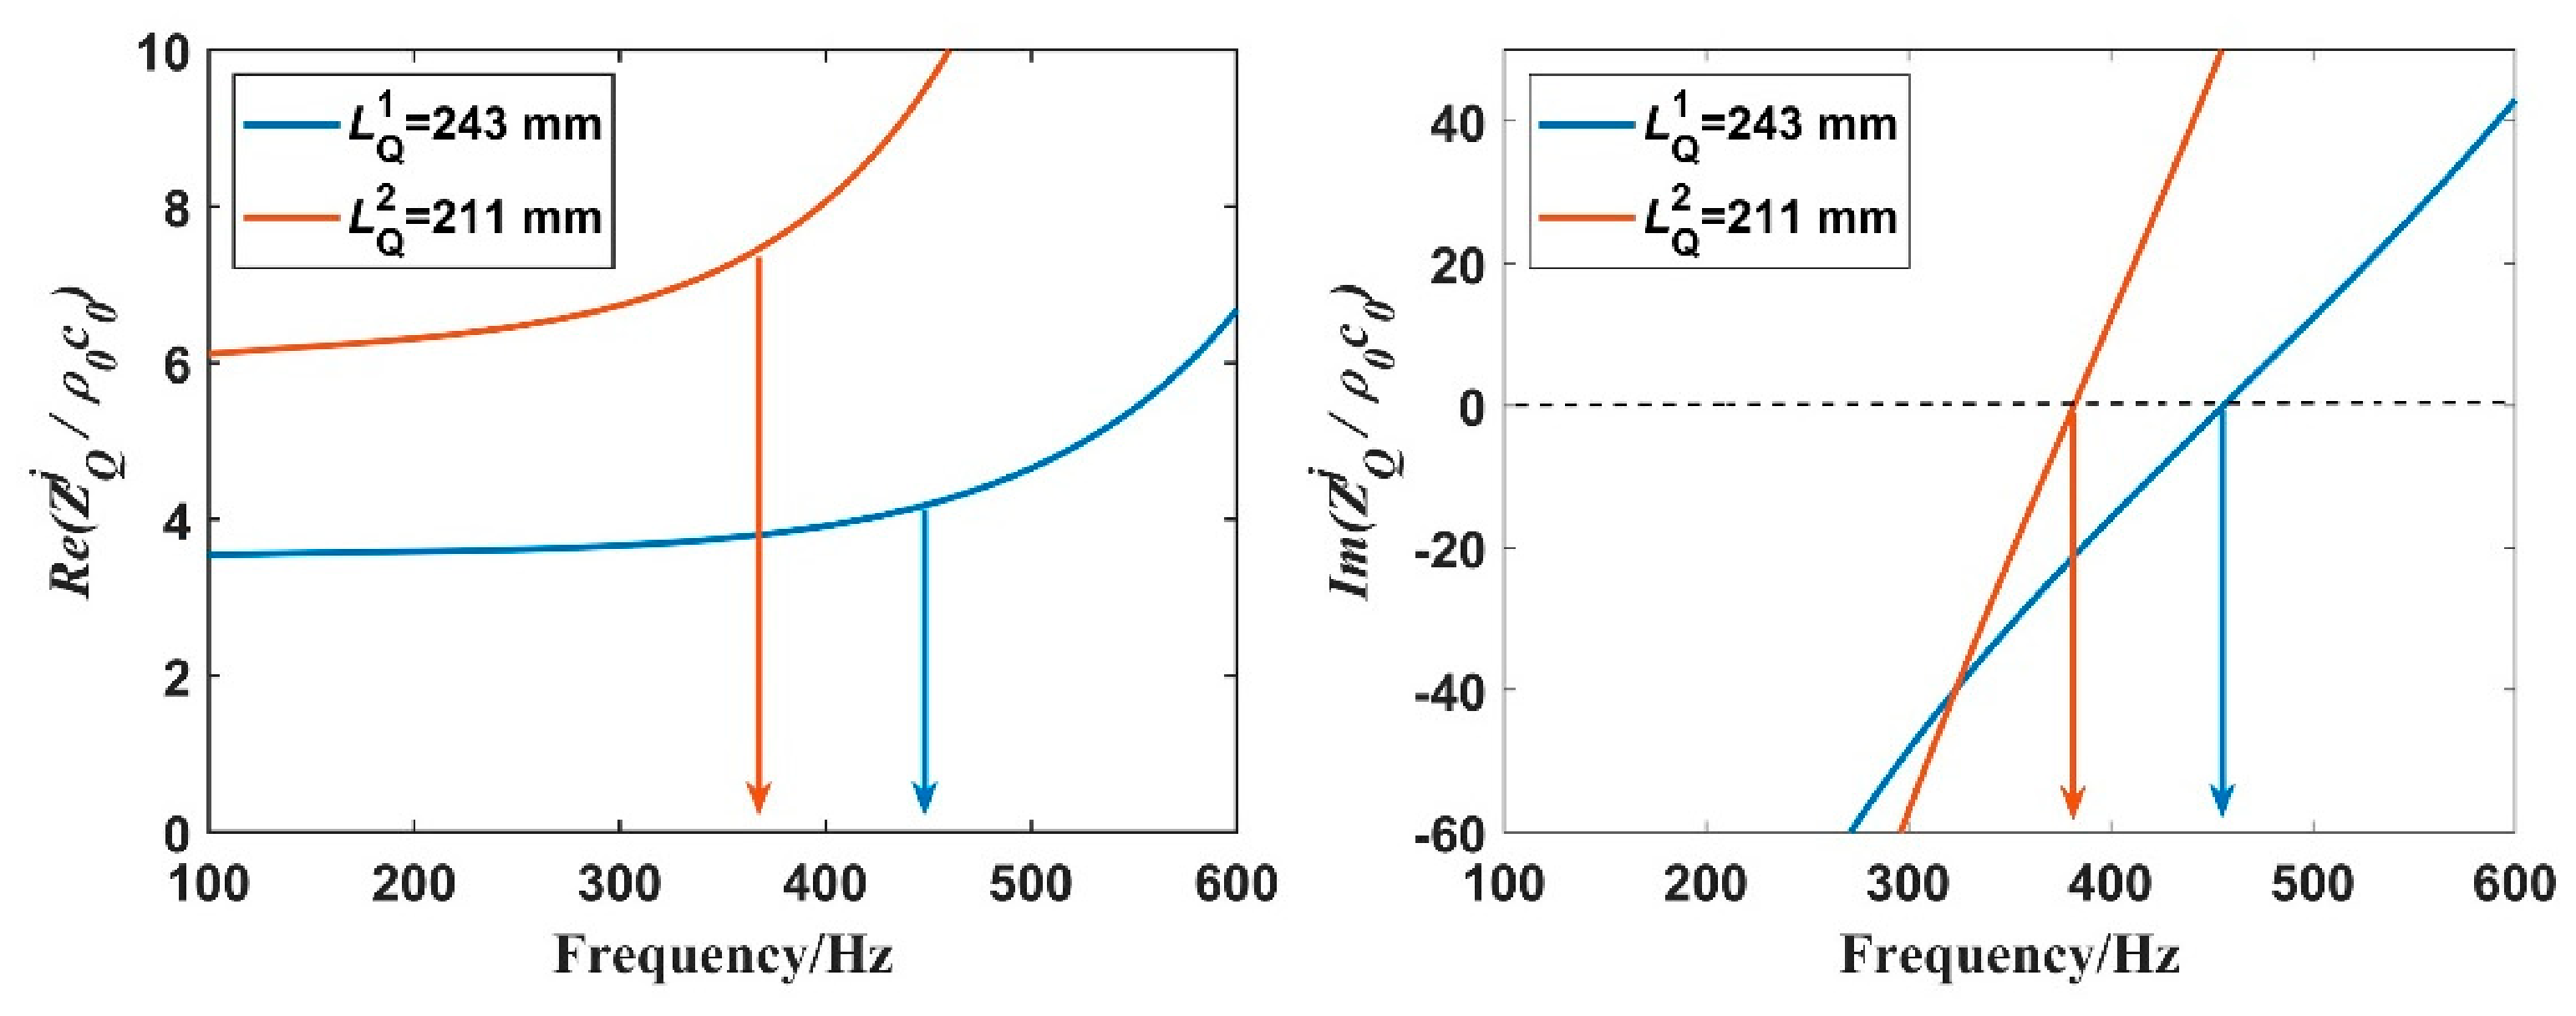
The sound absorption performance of the material is closely related to its total surface impedance. The perfect sound absorption effect can be obtained by matching the surface impedance () of the material and the impedance of the air (). It can be ascertained from the sound wave propagation characteristics that, when the sound wave enters one medium from another medium, only when the impedance of the two media are well matched can there be a good incident amount; otherwise, it will be completely reflected. For noise in the air, if and of the sound-absorbing material, the noise is completely absorbed. Figure 5 shows the matching results of the proposed metamaterial. The real part at the corresponding frequency of zero imaginary part is close to 2, which means that there is a better sound absorption effect at the natural frequency (as shown in Figure 4). Furthermore, it can be seen from Figure 5 that, when the cross-sectional area of the folded channel is constant, the tube length can control its natural frequency but has little effect on the value of the real part. Therefore, the natural frequency can be controlled by adjusting the tube length. Thus, by combining these HWRs units with suitable length differences as an absorber, the one-peak curves presented in Figure 4 can be a multi-peak coupling curve. However, from the analysis of Figure 6 and Figure 7, it can be deduced that the number of QWRs increases the curve of the real part close to the unit value, for which reason an increase in the number of tubes results in an increase in the opening area. Therefore, increasing the opening area can improve the sound absorption coefficient, which further proves that the two-port tube has more advantages than the one-end open tube in sound absorption.
Figure 4.
Measured (solid line) and calculated (dotted line) absorption spectra are shown when the physical length of symmetrical HWRs is 506 mm (a), 470 mm (b), 439 mm (c), 408 mm (d), and 372 mm (e). On the left is the corresponding tube of the experiment and calculations.
Figure 4.
Measured (solid line) and calculated (dotted line) absorption spectra are shown when the physical length of symmetrical HWRs is 506 mm (a), 470 mm (b), 439 mm (c), 408 mm (d), and 372 mm (e). On the left is the corresponding tube of the experiment and calculations.

Figure 5.
Total normalized surface impedance behavior of the HWRs with different lengths.

Figure 6.
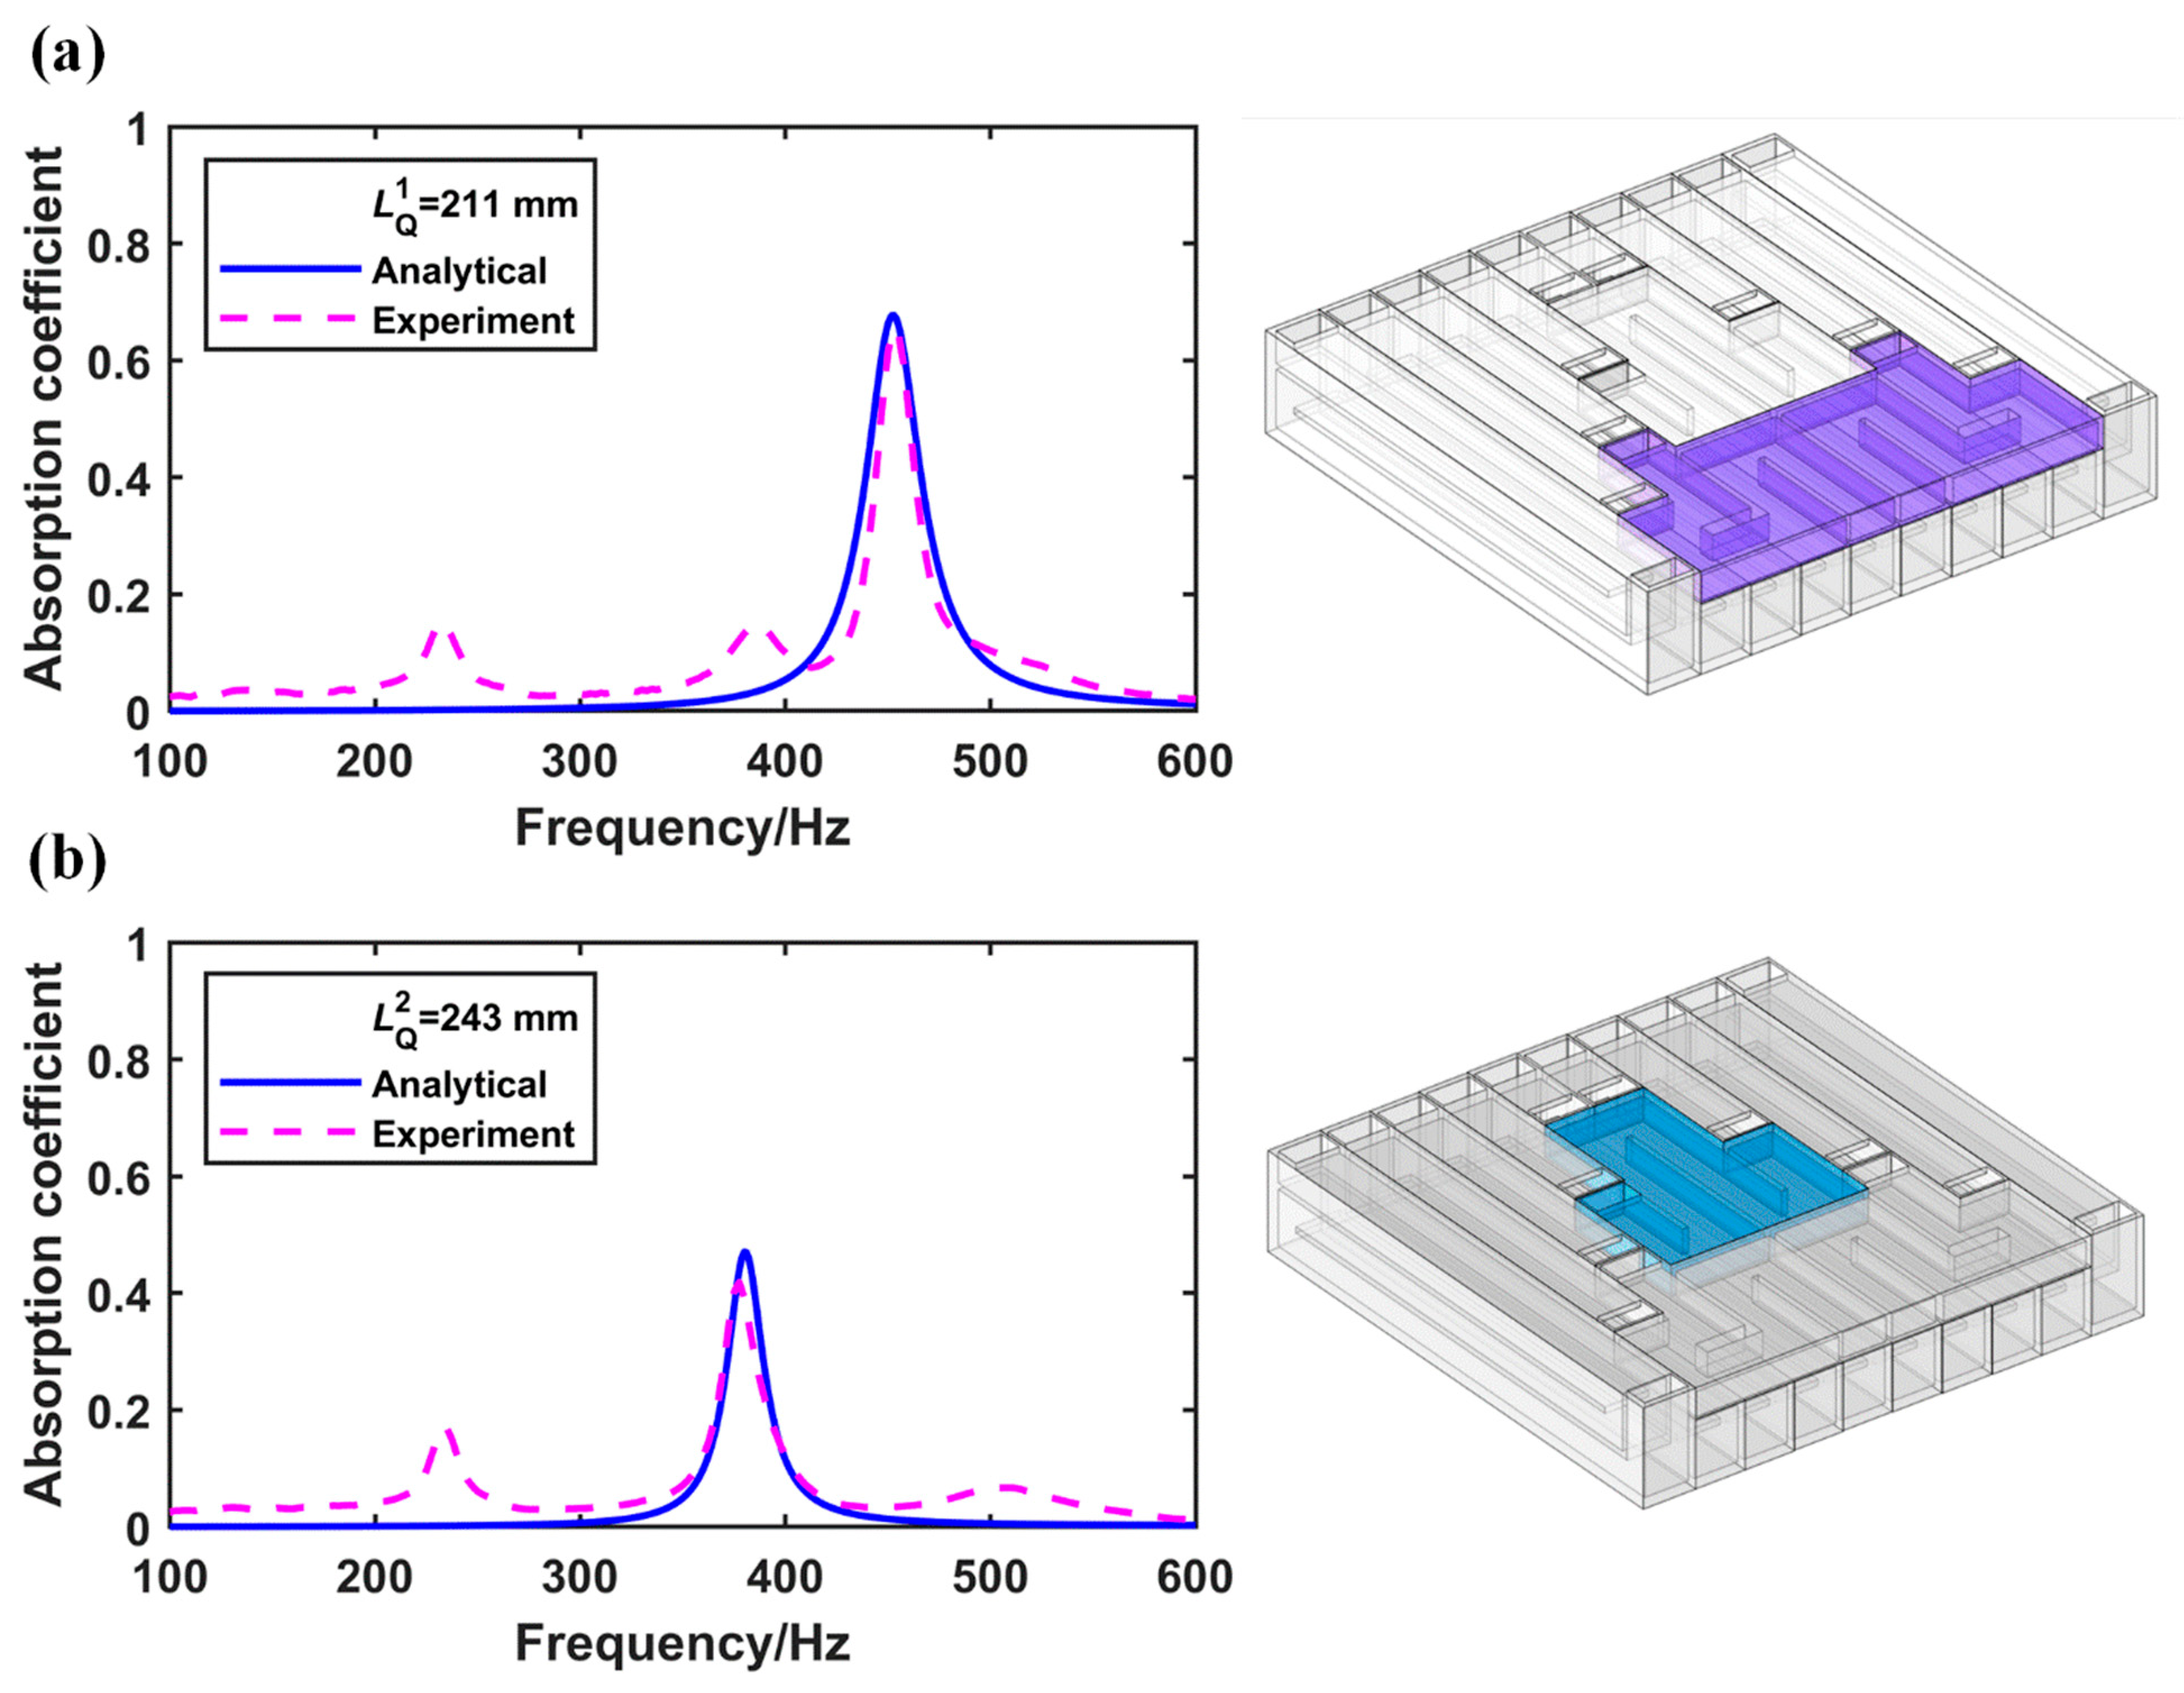
The sound absorption coefficient corresponding to the area of the QWRs (as shown on the left) with different lengths (211 mm and 243 mm). (a) the sound absorption coefficient curves of symmetry QWRs with length of 211 mm, (b) the sound absorption coefficient curves of single QWRs with length of 243 mm.
Figure 6.
The sound absorption coefficient corresponding to the area of the QWRs (as shown on the left) with different lengths (211 mm and 243 mm). (a) the sound absorption coefficient curves of symmetry QWRs with length of 211 mm, (b) the sound absorption coefficient curves of single QWRs with length of 243 mm.

Figure 7.
Total normalized surface impedance behavior of the QWRs with different lengths.

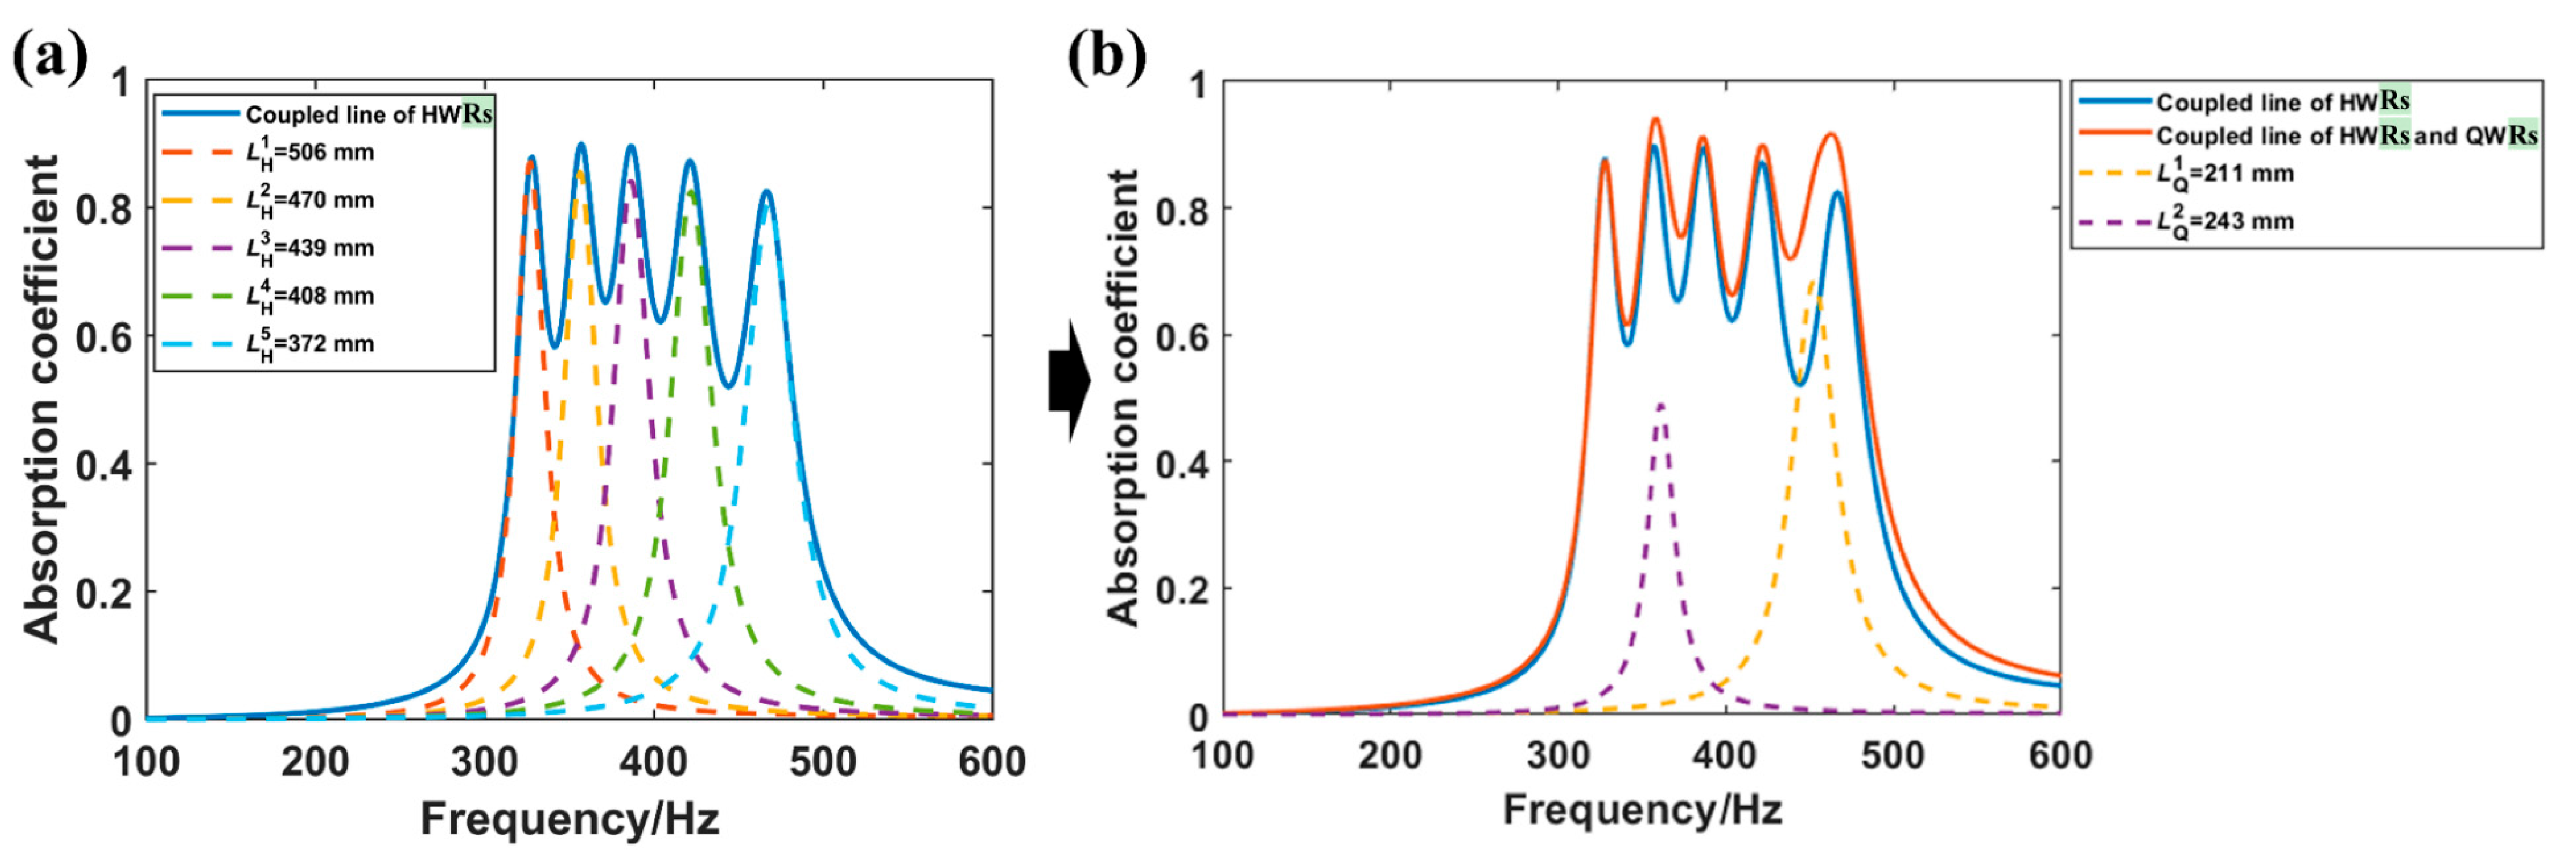
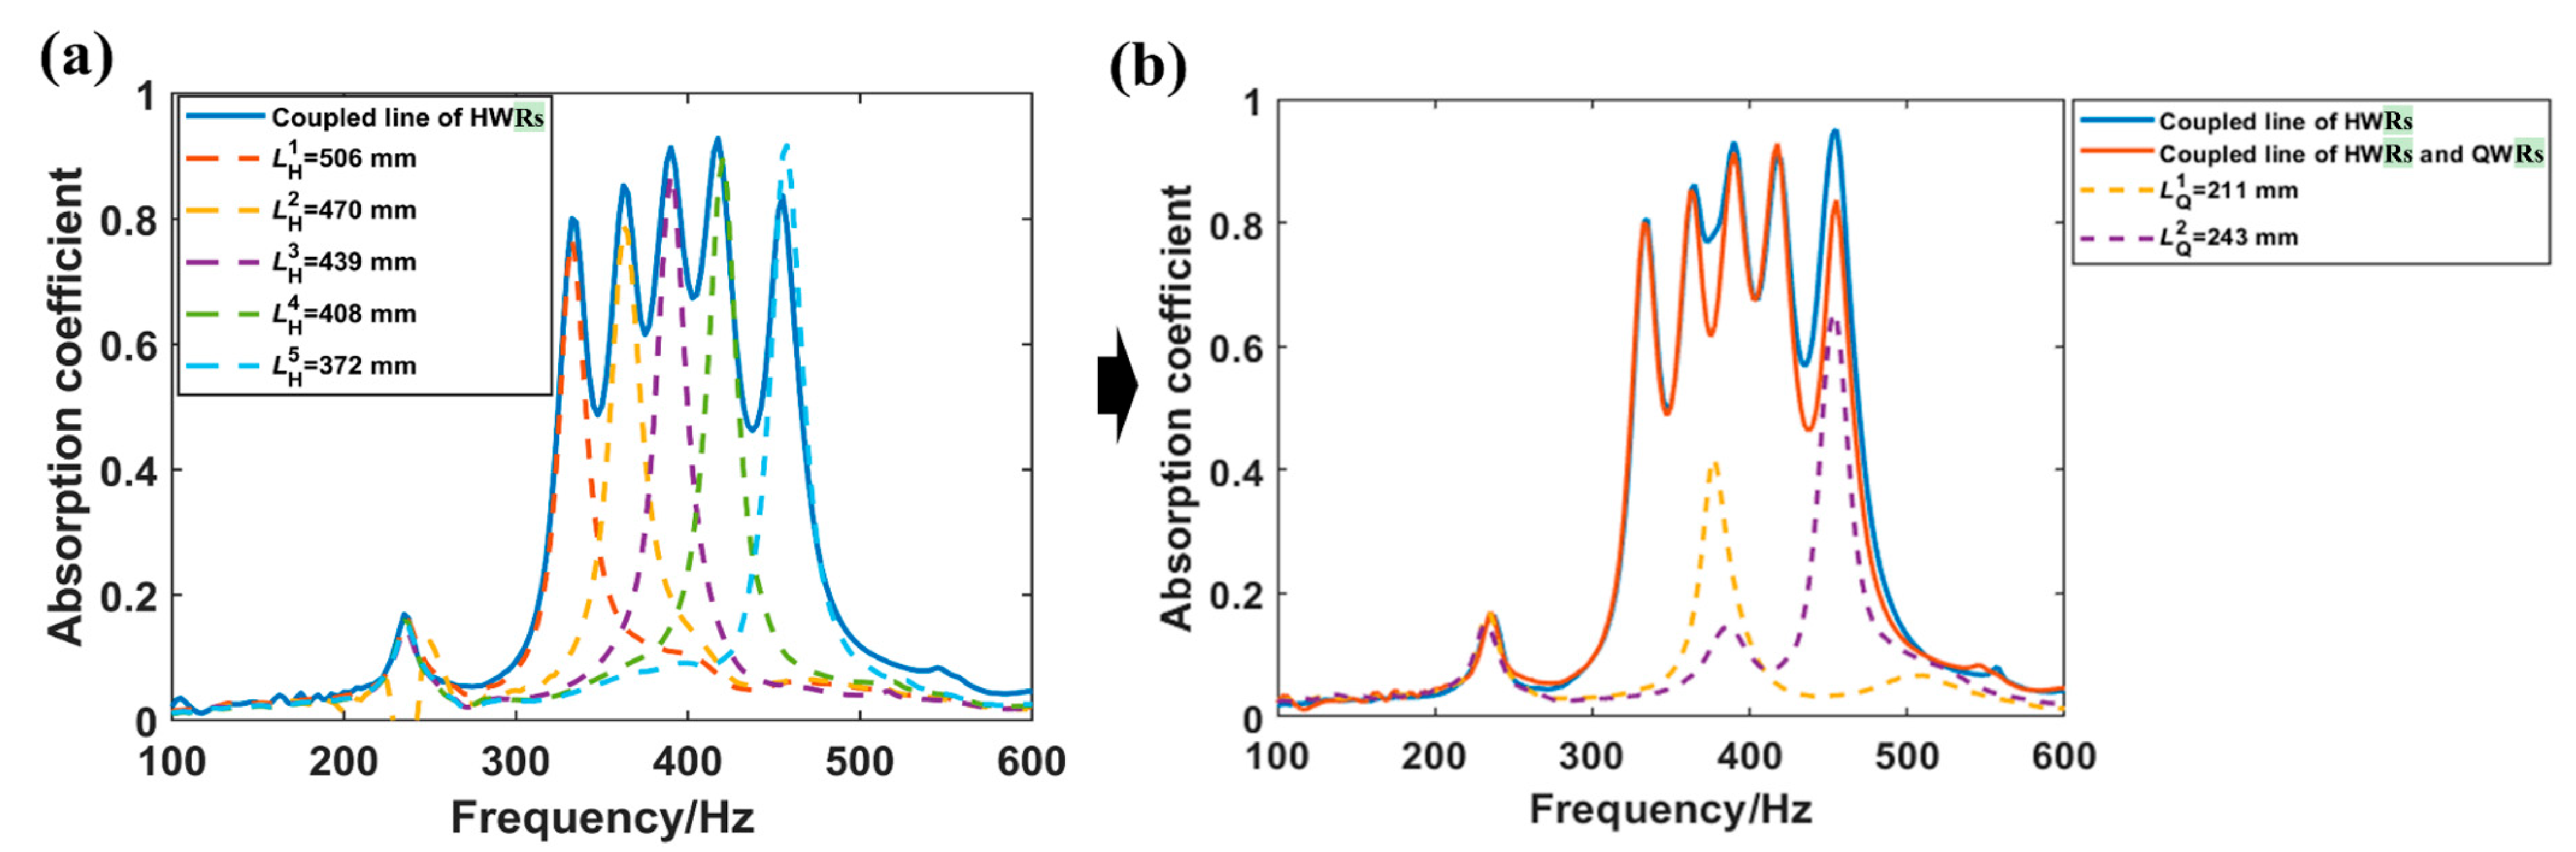
In Figure 8a and Figure 9a, it can be seen that the coupling curves, whether produced by calculating or measuring, have several deep valleys between the adjacent peaks. Therefore, to optimize the sound absorption coefficient, we used the remaining space in the absorber to design three QWRs, as shown in Figure 1b. Consequently, Figure 8b and Figure 9b show that this optimized method can improve the sound absorption performance of the absorber, and, from 330 Hz to 460 Hz, the average sound absorption rates increased by 6% and 10% for the experimental and analytical methods, respectively. Furthermore, it can be seen that the valleys corresponding to the peak frequency of the QWRs shown in Figure 8b and Figure 9b have improved. In addition, a tiny peak of no more than 0.2 around 250 Hz can be seen. The reason is that the wavelength of 1.3 m at 250 Hz is close to the length of the impedance tube (1.2 m), which makes the impedance tube produce a sound absorption peak caused by weak vibration.
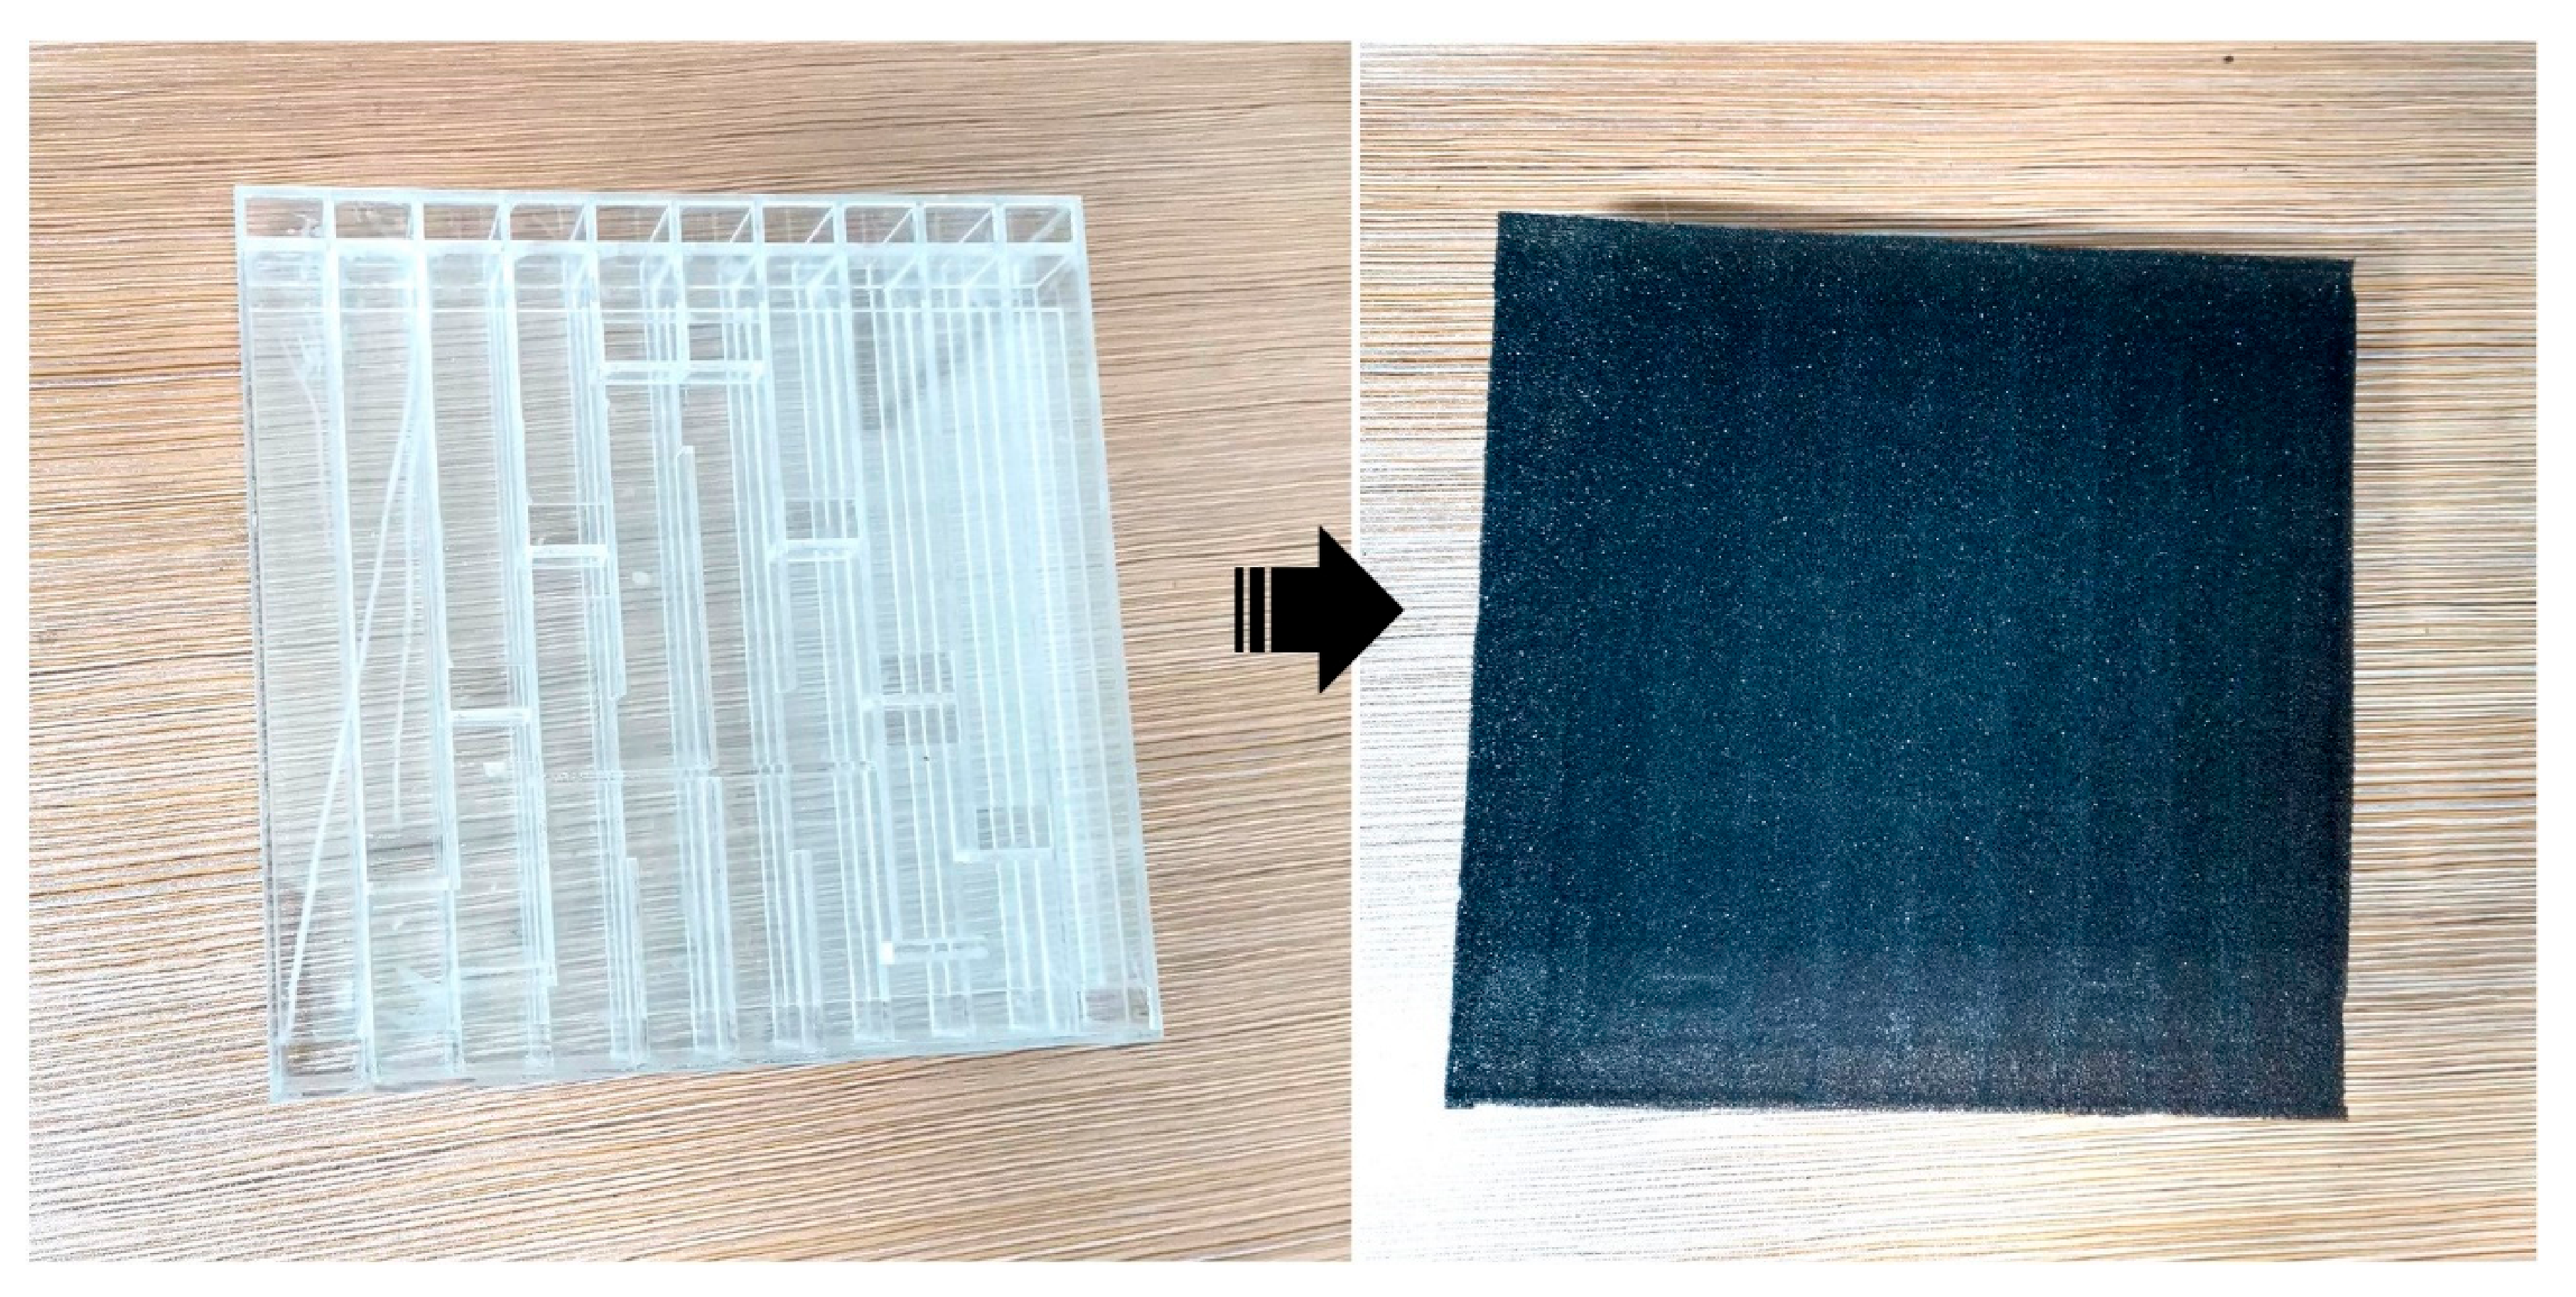
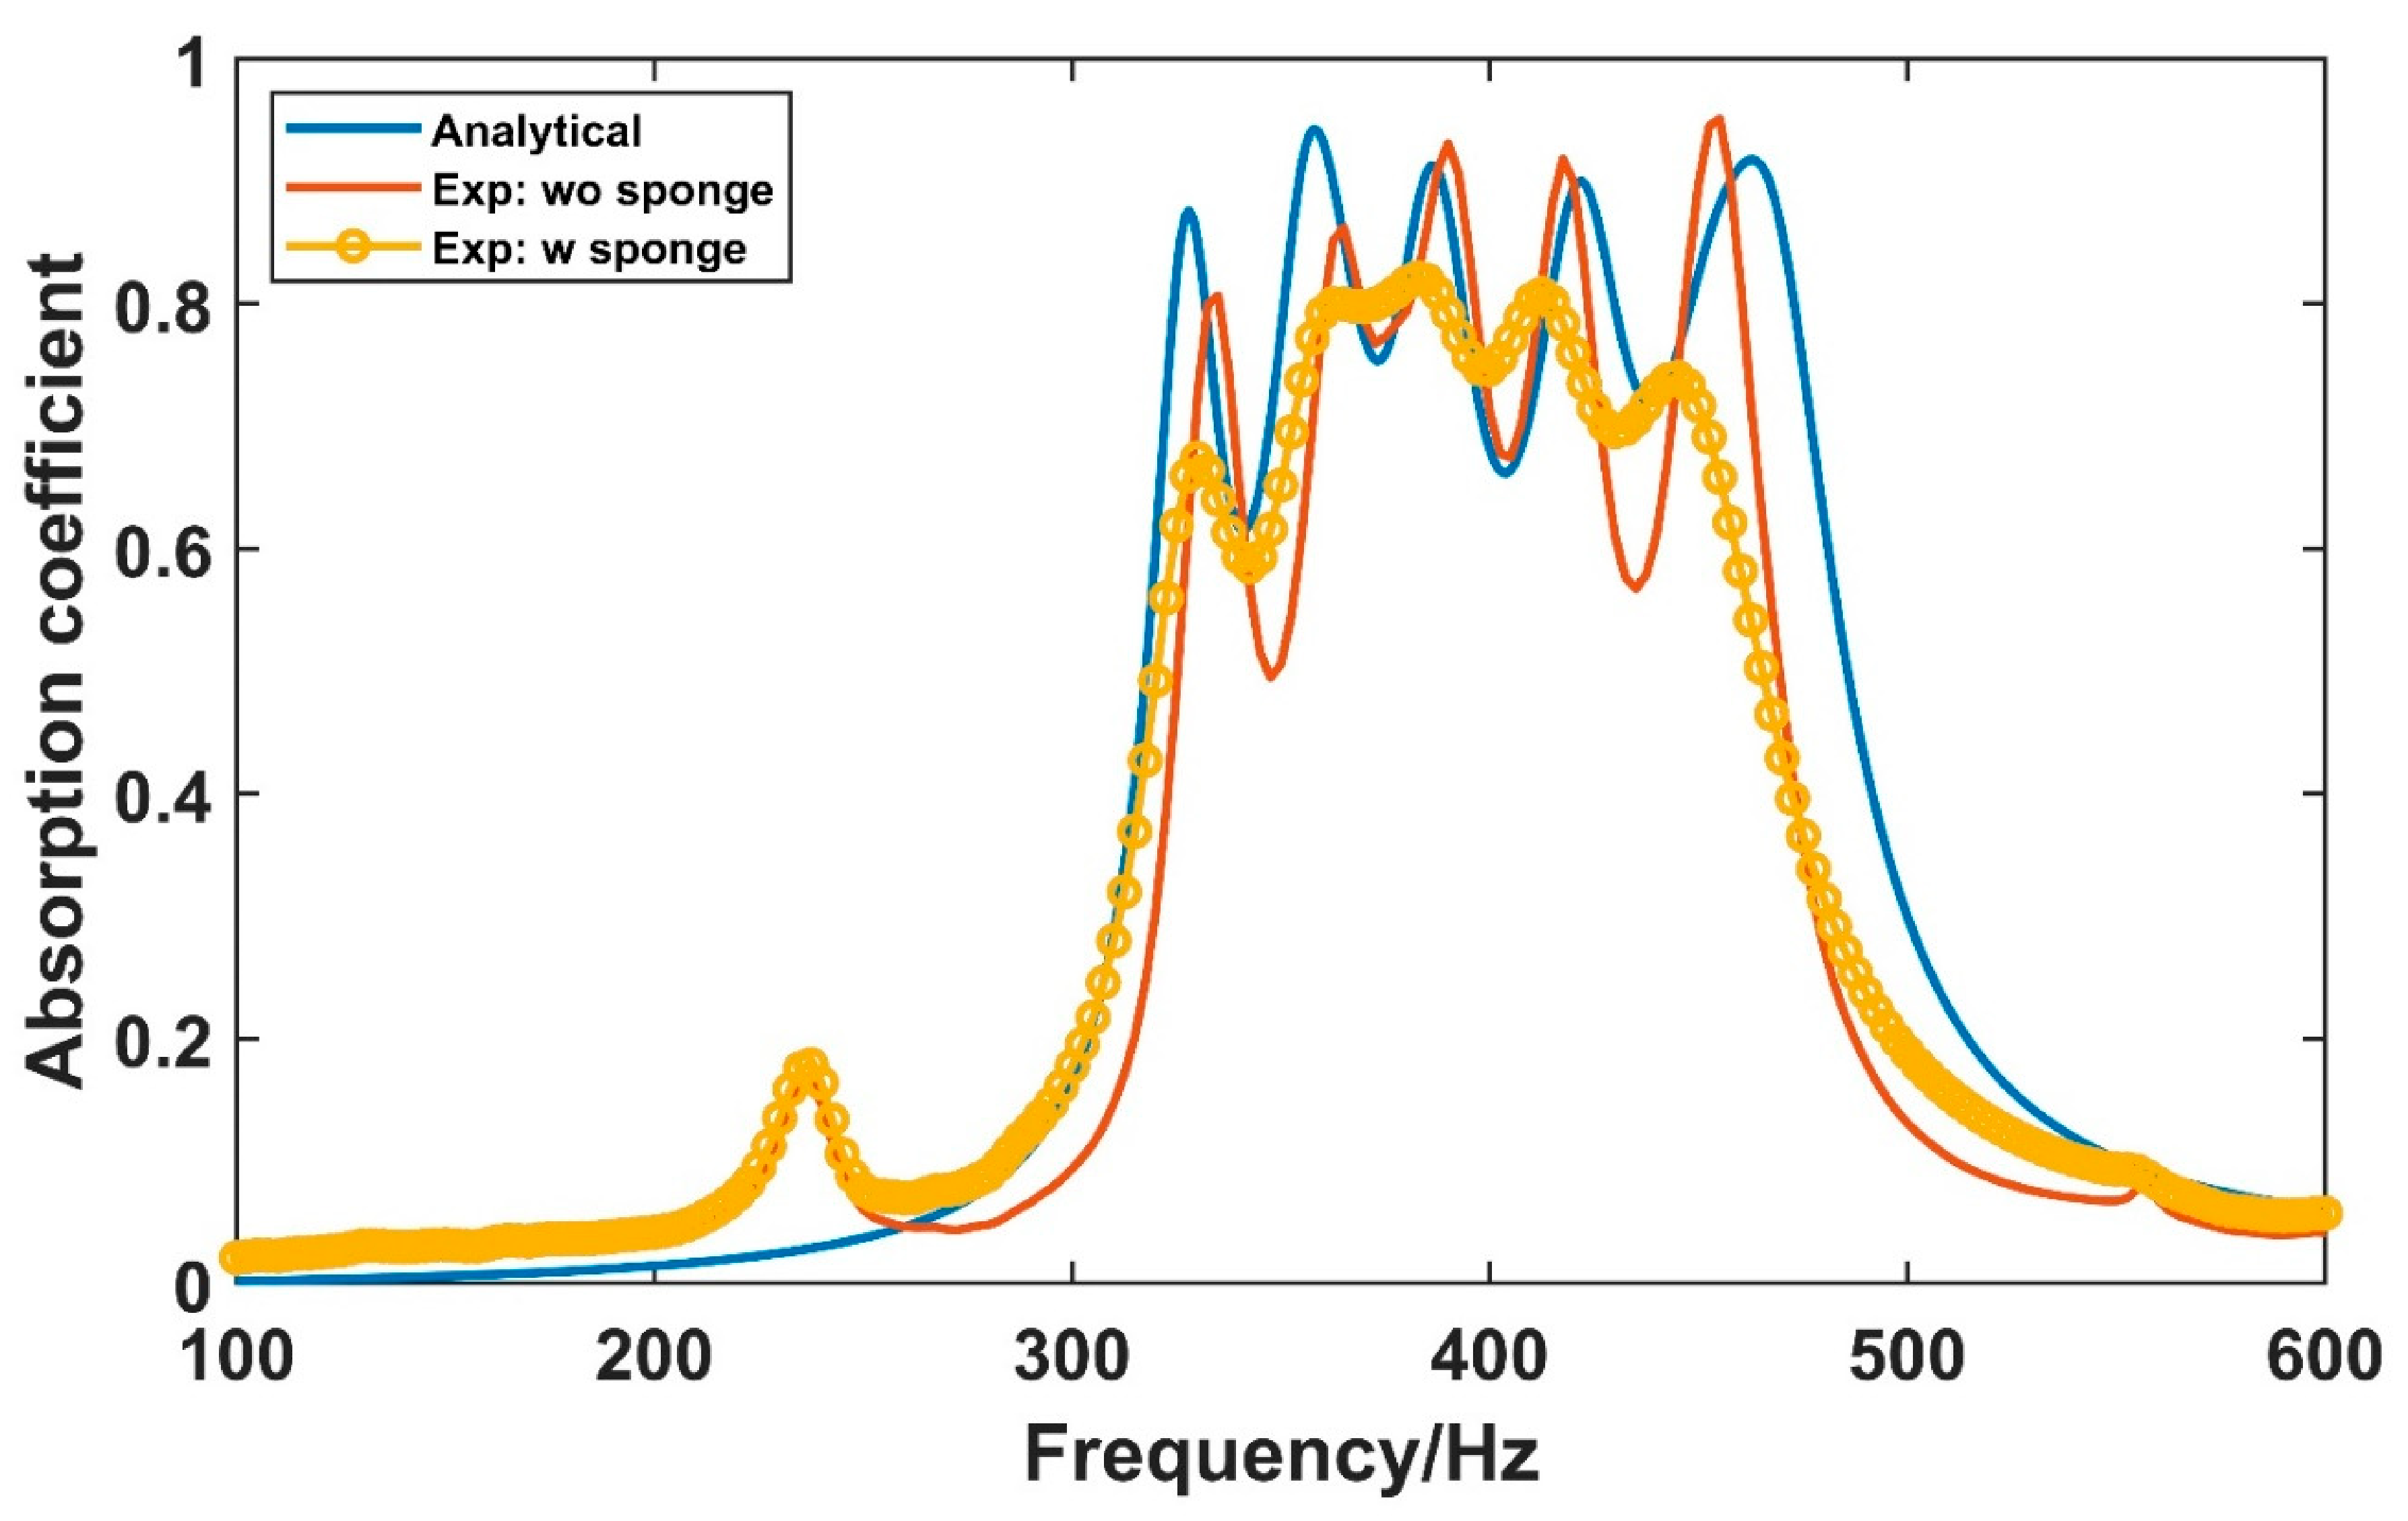
Finally, to make the sound absorption coefficient curve smoother, the absorber was pasted with a 3 mm thickness sponge on the surface (as shown in Figure 10). As shown in Figure 11, the sound absorption coefficient has a curve with small amplitudes. Furthermore, it can be seen that the theoretical and experimental results in Figure 11 are in good agreement. It is important to note that the thickness of the absorber that achieves the absorption effect described above is only 3% of the working wavelength (0.03λ).
3.3. Sound Transmission Loss (TL) Performance for Complete Cross-Ventilation
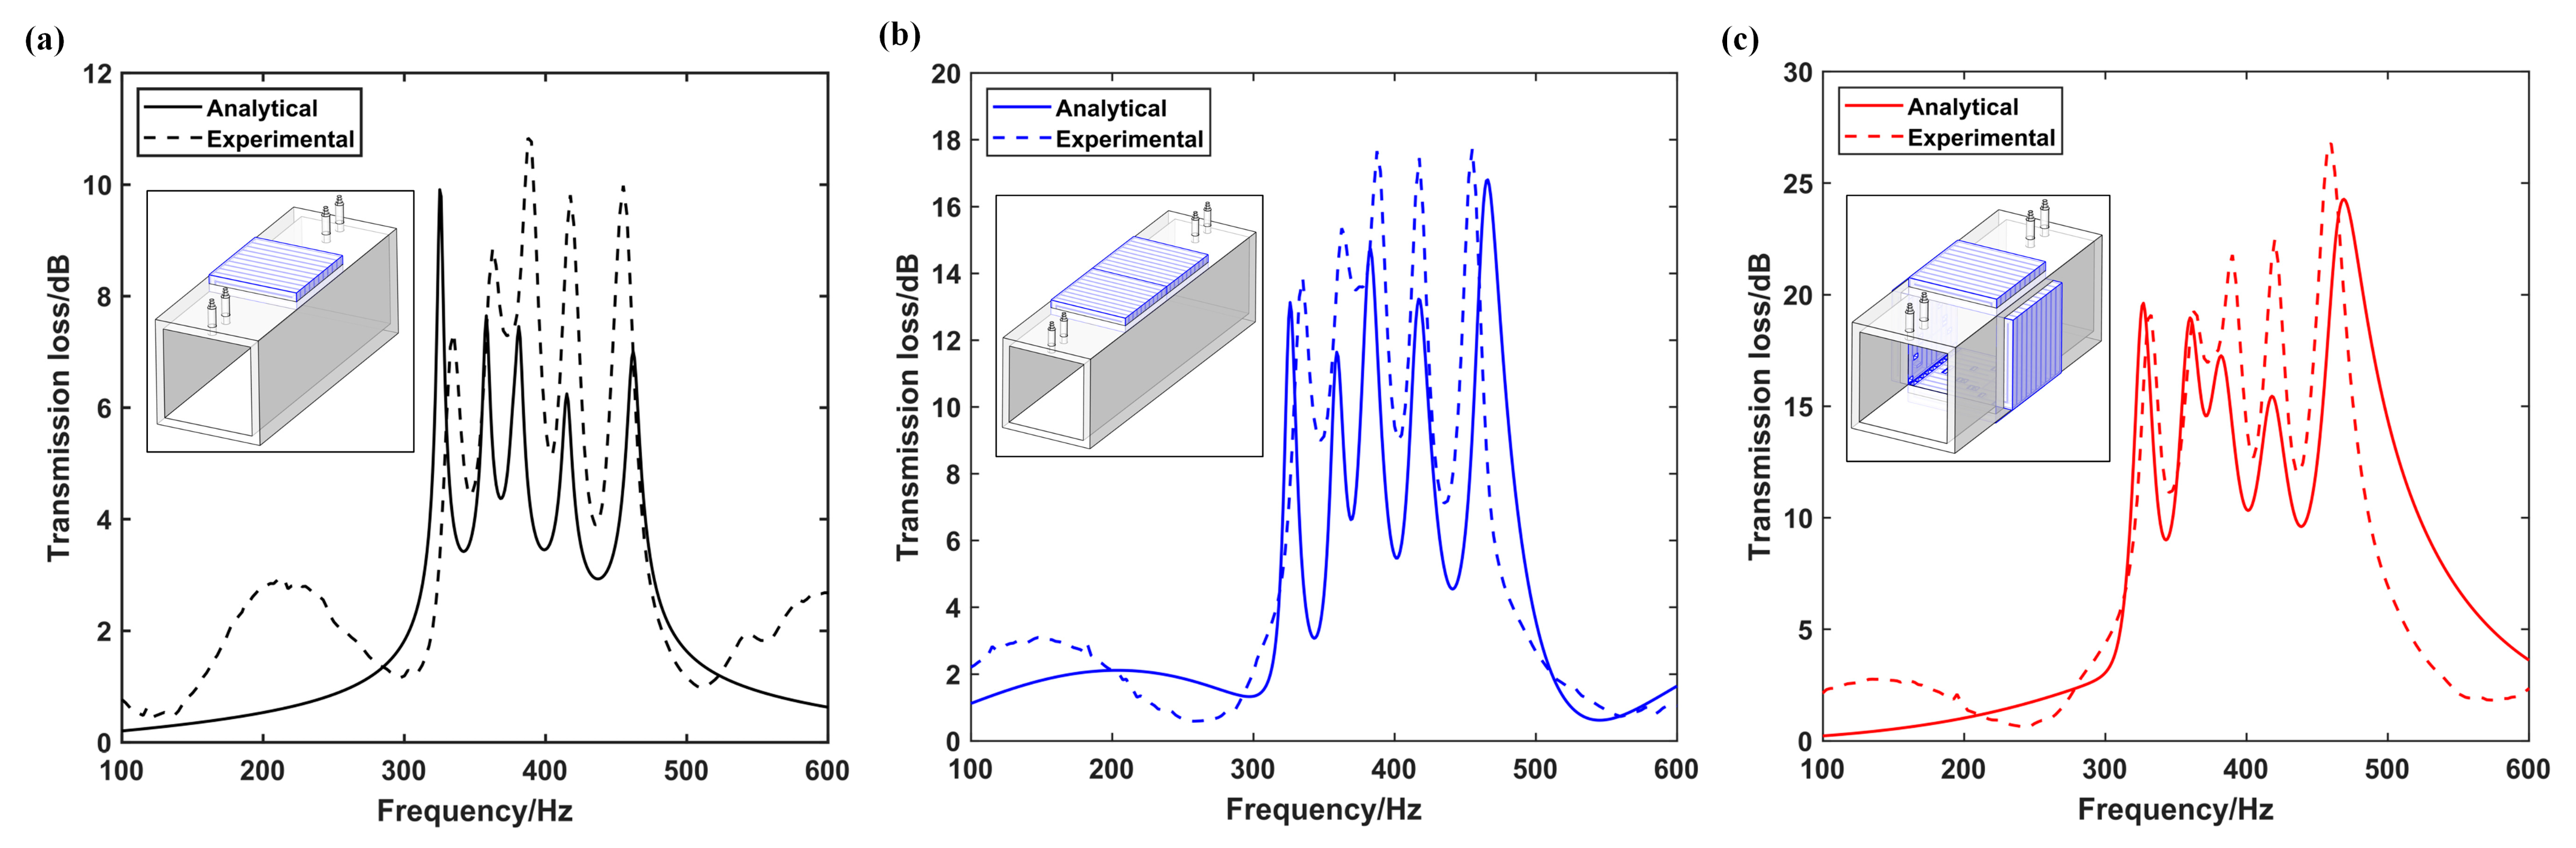
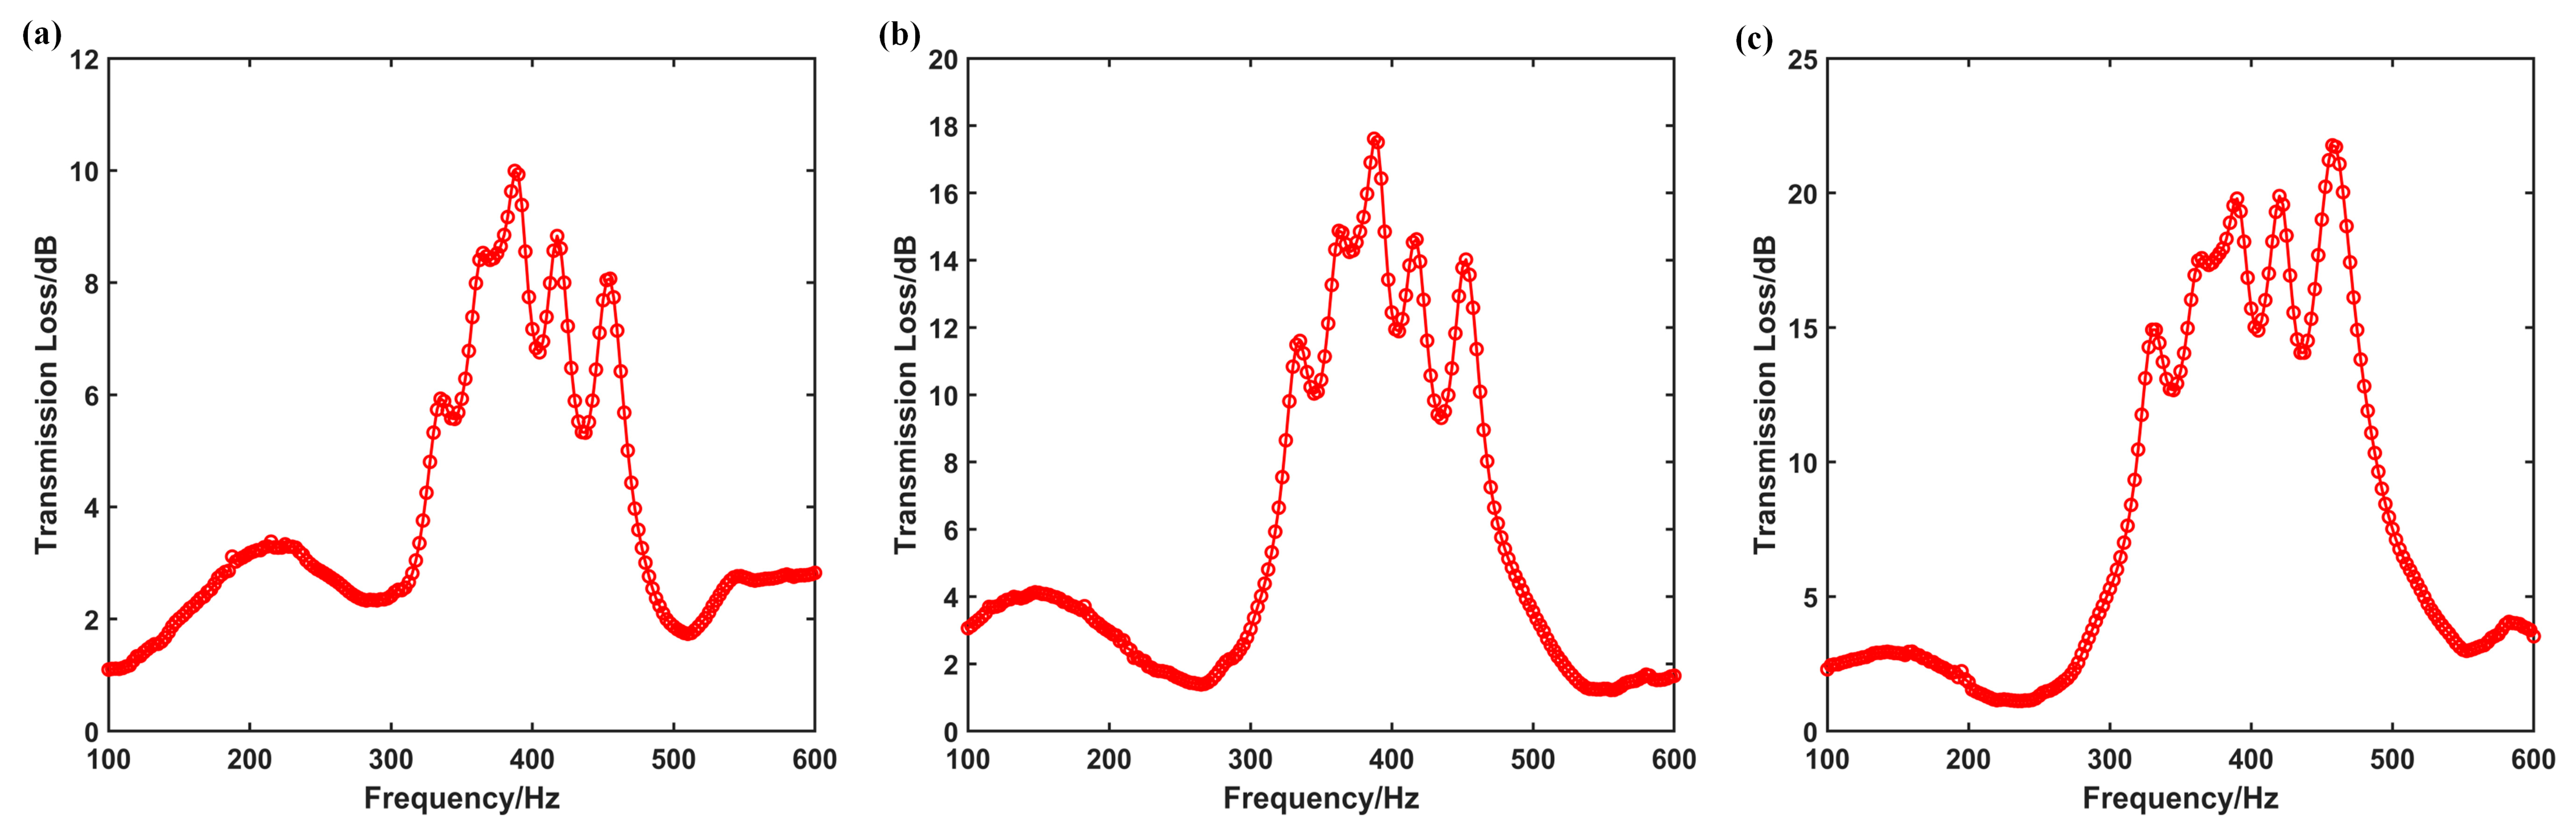
In this section, we demonstrate the TL performance of the absorber for complete cross-ventilation, as shown in Figure 3. Figure 12 and Figure 13 show the calculated and measured TL curves under different numbers of ventilated AMM absorbers with and without sponges. It can be seen that the theoretical results of TL in Figure 12a–c are in agreement with those of the experiments. Specifically, the differences between the mean value of TL obtained from the experimental and analytical methods are 2.4 dB, 4.1 dB, and 2.9 dB from 330 Hz to 460 Hz in Figure 12a–c, respectively, which are within the accepted error range. The experimental set-up for the corresponding number of absorbers is shown in the upper left corner of Figure 12a–c. Figure 12 reveals that TL improves significantly with the increase in the number of absorbers.
Similarly to the sound absorption curve, the TL curve has five peaks. To smooth the peaks, the different numbers of absorbers covered with the sponge were measured, and the results are shown in Figure 13a–c. By comparing the three pictures, it can be deduced that the TL curves are higher and smoother around 380 Hz. This is mainly because the natural frequency that corresponds to the added quarter-wavelength tube is also approximately 380 Hz. Thus, the higher the number of tubes with the same natural frequency, the higher the TL that can be obtained. Furthermore, the ratio of the cross-sectional area of the main pipe to all bypass pipes with the same natural frequency determines the value of the TL.
As shown in Figure 13c, the mean value of TL is 17 dB from 330 Hz to 460 Hz, which is 2.4 times that of the absorber in Figure 13a. Therefore, we can predict that better TL performance can be obtained by using more absorbers. It is worth mentioning again that, as a metasurface structure (H ≈ 0.03λ), it not only has a certain broadband sound absorption function, but it also has a 100% ventilation and sound insulation performance.
3.4. Sound Insertion Loss (IL) Performance for Complete Cross-Ventilation
The IL results (as shown in Figure 14) with the different number of ventilated AMM absorbers can be obtained by bringing the measurement data into the following formula:
where and are the pressures measured by the microphone at the outlet of the main tube before and after the installation of the absorber, respectively.
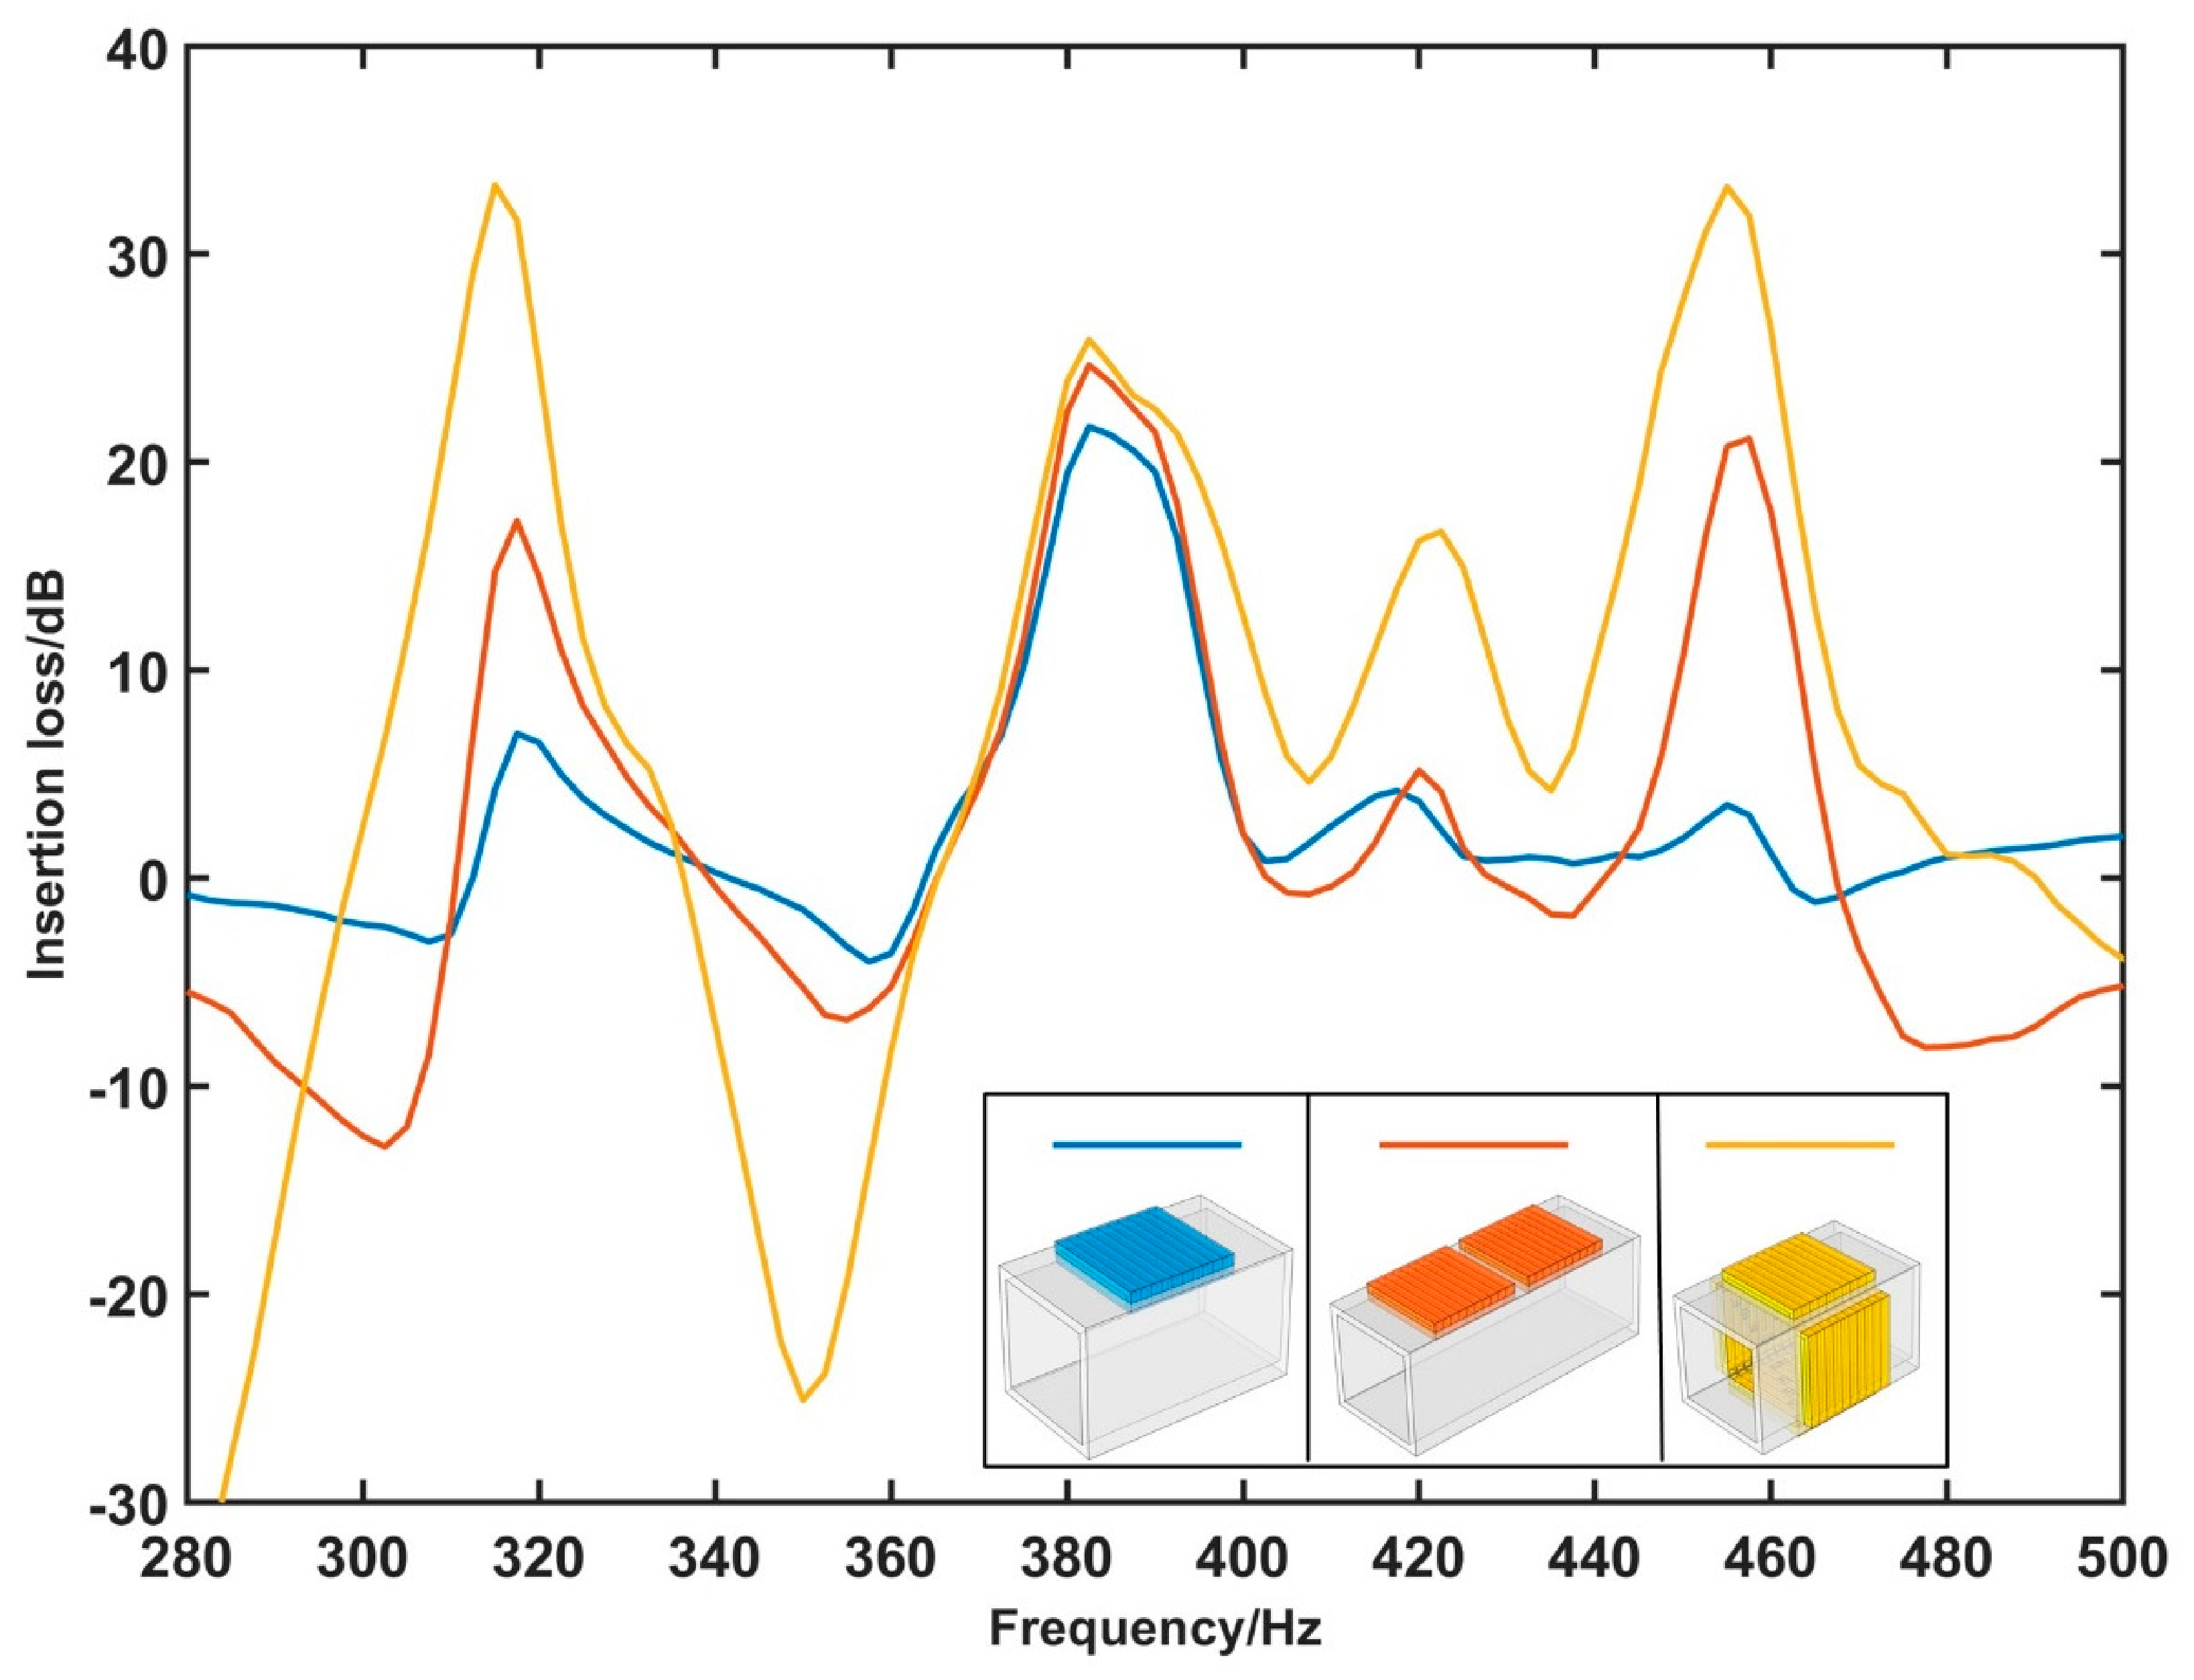
From Figure 14, it can be seen that IL is largely determined by the number of the absorbers embedded in the wall of the main tube. This proves that a pipe system with a larger number of absorbers will have a more ideal muffling effect, especially at 317 Hz, 420 Hz, and 455 Hz. Moreover, it shows a good attenuation in noise from 365 Hz to 467 Hz, and, within this range, the average of IL is up to 15 dB for the pipe system with four absorbers, which increased by 200% compared to an absorber. Hence, IL will have a more significant improvement if the main tube is composed of this absorber. Once again, these results were produced under thorough ventilation and the operating wavelength is 33 times the thickness of the absorber.
4. Conclusions
In this study, a new type of ventilated AMM absorber is proposed for simultaneous low-frequency noise attenuation and air ventilation. To predict acoustic performance, we deduced the theoretical model of the absorber, and, to validate the theoretical solutions, it was compared with the experimental data; good agreement was obtained. The results demonstrate that the maximum average sound absorption rate and TL that can be achieved are 0.69 and 17 dB in the frequency range of 330 Hz to 460 Hz, respectively. The IL reached 33 dB around the frequency of 317 Hz when the pipe system contained four absorbers, and noise could be continuously reduced at an average IL of 15 dB in the frequency range of 365 Hz to 467 Hz. In this work, the most challenging issue was obtaining the expected acoustic performance with a 100% ventilation rate and deep subwavelength structure. We accomplished that for which we hoped and, subsequently, we will further expand the bandwidth of noise attenuation based on the present study.
Author Contributions
Conceptualization, Q.M.; methodology, H.W.; software, H.W.; validation, H.W.; formal analysis, H.W.; writing-original draft preparation, H.W.; writing-review and editing, Q.M. and H.W.; supervision, Q.M.; project administration, Q.M.; funding acquisition, Q.M. All authors have read and agreed to the published version of the manuscript.
Funding
This research was funded by the National Natural Science Foundation of China, grant number 51975266; the Natural Science Foundation of Jiangxi, China, grant number 20192BAB206024; and the Aeronautical Science Foundation of China, grant number 2020Z073056001.
Institutional Review Board Statement
Not applicable.
Informed Consent Statement
Not applicable.
Data Availability Statement
The data that support the findings of this study are available from the corresponding authors upon reasonable request.
Conflicts of Interest
The authors declare no conflict of interest.
References
- Babisch, W.; Beule, B.; Schust, M.; Kersten, N.; Ising, H. Traffic noise and risk of myocardial infarction. Epidemiology 2005, 16, 33–40. [Google Scholar] [CrossRef] [PubMed]
- Dratva, J.; Phuleria, H.C.; Foraster, M.; Gaspoz, J.M.; Keidel, D.; Kunzli, N.; Liu, L.J.; Pons, M.; Zemp, E.; Gerbase, M.W.; et al. Transportation noise and blood pressure in a population-based sample of adults. Environ. Health Perspect. 2012, 120, 50–55. [Google Scholar] [CrossRef] [PubMed]
- Miedema, H.; Groothuis-Oudshoorn, C. Annoyance from Transportation Noise: Relationships with Exposure Metrics DNL and DENL and Their Confidence Intervals. Environ. Health Perspect. 2001, 109, 409–416. [Google Scholar] [CrossRef] [PubMed]
- Minichilli, F.; Gorini, F.; Ascari, E.; Bianchi, F.; Coi, A.; Fredianelli, L.; Licitra, G.; Manzoli, F.; Mezzasalma, L.; Cori, L. Annoyance Judgment and Measurements of Environmental Noise: A Focus on Italian Secondary Schools. Int. J. Environ. Res. Public Health 2018, 15, 208. [Google Scholar] [CrossRef] [Green Version]
- Muzet, A. Environmental noise, sleep and health. Sleep Med. Rev. 2007, 11, 135–142. [Google Scholar] [CrossRef]
- Rossi, L.; Prato, A.; Lesina, L.; Schiavi, A. Effects of low-frequency noise on human cognitive performances in laboratory. Build. Acoust. 2018, 25, 17–33. [Google Scholar] [CrossRef]
- Vukic, L.; Mihanovic, V.; Fredianelli, L.; Plazibat, V. Seafarers’ Perception and Attitudes towards Noise Emission on Board Ships. Int. J. Environ. Res. Public Health 2021, 18, 6671. [Google Scholar] [CrossRef]
- Zacarías, F.F.; Molina, R.H.; Ancela, J.L.C.; López, S.L.; Ojembarrena, A.A. Noise Exposure in Preterm Infants Treated with Respiratory Support Using Neonatal Helmets. Acta Acust. United Acust. 2013, 99, 590–597. [Google Scholar] [CrossRef]
- Fatima, S.; Mohanty, A.R. Acoustical and fire-retardant properties of jute composite materials. Appl. Acoust. 2011, 72, 108–114. [Google Scholar] [CrossRef]
- Guan, D.; Wu, J.H.; Wu, J.; Li, J.; Zhao, W. Acoustic performance of aluminum foams with semiopen cells. Appl. Acoust. 2015, 87, 103–108. [Google Scholar] [CrossRef]
- Han, F.; Seiffert, G.; Zhao, Y.; Gibbs, B.M. Acoustic absorption behaviour of an open-celled aluminium foam. J. Phys. D Appl. Phys. 2003, 36, 294–302. [Google Scholar] [CrossRef] [Green Version]
- Hur, B.Y.; Park, B.K.; Ha, D.-I.; Um, Y.S. Sound Absorption Properties of Fiber and Porous Materials. Mater. Sci. Forum 2005, 475–479, 2687–2690. [Google Scholar] [CrossRef]
- Kim, K.W.; Jeong, Y.-S. Experimental Study on the Comparison of the Material Properties of Glass Wool Used as Building Materials. Mater. Sci. 2014, 20, 103–107. [Google Scholar] [CrossRef] [Green Version]
- Xiang, H.-F.; Tan, S.-X.; Yu, X.-L.; Long, Y.-H.; Zhang, X.-L.; Zhao, N.; Xu, J. Sound absorption behavior of electrospun polyacrylonitrile nanofibrous membranes. Chin. J. Polym. Sci. 2011, 29, 650–657. [Google Scholar] [CrossRef]
- Eerden, F. Noise Reduction with Coupled Prismatic Tubes. Ph.D. Thesis, University of Twente, Enschede, The Netherlands, 2000. [Google Scholar]
- Liu, Z.; Zhang, X.; Mao, Y.; Zhu, Y.Y.; Yang, Z.; Chan, C.T.; Sheng, P. Locally resonant sonic materials. Science 2000, 289, 1734–1736. [Google Scholar] [CrossRef]
- Almeida, G.d.N.; Vergara, E.F.; Barbosa, L.R.; Brum, R. Low-frequency sound absorption of a metamaterial with symmetrical-coiled-up spaces. Appl. Acoust. 2021, 172, 107593. [Google Scholar] [CrossRef]
- Chang, H.; Liu, L.; Zhang, C.; Hu, X. Broadband high sound absorption from labyrinthine metasurfaces. AIP Adv. 2018, 8, 045115. [Google Scholar] [CrossRef] [Green Version]
- Jiménez, N.; Huang, W.; Romero-García, V.; Pagneux, V.; Groby, J.P. Ultra-thin metamaterial for perfect and quasi-omnidirectional sound absorption. Appl. Phys. Lett. 2016, 109, 121902. [Google Scholar] [CrossRef]
- Long, H.; Liu, C.; Shao, C.; Cheng, Y.; Chen, K.; Qiu, X.; Liu, X. Subwavelength broadband sound absorber based on a composite metasurface. Sci. Rep. 2020, 10, 13823. [Google Scholar] [CrossRef]
- Wu, F.; Xiao, Y.; Yu, D.; Zhao, H.; Wang, Y.; Wen, J. Low-frequency sound absorption of hybrid absorber based on micro-perforated panel and coiled-up channels. Appl. Phys. Lett. 2019, 114, 151901. [Google Scholar] [CrossRef]
- Jiang, X.; Liang, B.; Li, R.-q.; Zou, X.-y.; Yin, L.-l.; Cheng, J.-c. Ultra-broadband absorption by acoustic metamaterials. Appl. Phys. Lett. 2014, 105, 243505. [Google Scholar] [CrossRef]
- Almeida, G.d.N.; Vergara, E.F.; Barbosa, L.R.; Lenzi, A.; Birch, R.S. A low-frequency sound absorber based on micro-slit and coiled cavity. J. Braz. Soc. Mech. Sci. Eng. 2021, 43, 1–9. [Google Scholar] [CrossRef]
- Li, Y.; Zhang, Y.; Xie, S. A lightweight multilayer honeycomb membrane-type acoustic metamaterial. Appl. Acoust. 2020, 168, 107427. [Google Scholar] [CrossRef]
- Lu, Z.; Yu, X.; Lau, S.-K.; Khoo, B.C.; Cui, F. Membrane-type acoustic metamaterial with eccentric masses for broadband sound isolation. Appl. Acoust. 2020, 157, 107003. [Google Scholar] [CrossRef]
- Zhang, H.-L.; Zhu, Y.-F.; Liang, B.; Yang, J.; Yang, J.; Cheng, J.-C. Omnidirectional ventilated acoustic barrier. Appl. Phys. Lett. 2017, 111, 203502. [Google Scholar] [CrossRef] [Green Version]
- Fusaro, G.; Yu, X.; Kang, J.; Cui, F. Development of metacage for noise control and natural ventilation in a window system. Appl. Acoust. 2020, 170, 107510. [Google Scholar] [CrossRef]
- Komkin, A.I.; Mironov, M.A. Radiation impedance of a piston at the wall of a rectangular duct. Acoust. Phys. 2013, 59, 257–260. [Google Scholar] [CrossRef]
- Cummings, A. Sound Propagaton In Narrow Tubes Of Arbitrary Cross-section. J. Sound Vib. 1993, 162, 27–42. [Google Scholar] [CrossRef]
- Stinson, M. The propagation of plane sound waves in narrow and wide circular tubes, and generalization to uniform tubes of arbitrary cross-sectional shape. J. Acoust. Soc. Am. 1991, 89, 550–558. [Google Scholar] [CrossRef]
- Desantes, J.M.; Torregrosa, A.J.; Climent, H.; Moya, D. Acoustic performance of a Herschel–Quincke tube modified with an interconnecting pipe. J. Sound Vib. 2005, 284, 283–298. [Google Scholar] [CrossRef]
- Labašová, E.; Ďuriš, R. Measurement of the Acoustic Absorption Coefficient by Impedance Tube. Res. Pap. Fac. Mater. Sci. Technol. Slovak Univ. Technol. 2019, 27, 94–101. [Google Scholar] [CrossRef] [Green Version]
- Wang, Y.S.; He, H.; Geng, A.L. Comparison and application of the experimental methods for multi-layer prediction of acoustical properties of noise control materials in standing wave-duct systems. Appl. Acoust. 2008, 69, 847–857. [Google Scholar] [CrossRef]
Figure 1.
Schematic diagram of the 3D structure of the acoustic metamaterial, with the geometrical parameters annotated in the 2D plan view. (a) Five pairs of symmetrical HWRs with coiled-up space, (b) the designed QWRs in the remaining space, (c) complete absorber, (d) the top view of the absorber and section view for designed QWRs and HWRs in the xy and yz plane. The geometric dimensions that need to be paid attention to in the structure are: height (H), length (L) and width (W) of the absorber; Thickness of partition (t, t1); The length difference between the HWRs (D1, D2, D3, D4). The required physical length for the absorber are shown on the right.

Figure 3.
Measuring system for acoustic performance. The top half of the figure shows the measuring system of the sound absorption. The bottom half of the figure shows the measuring system of the TL and the ventilation area of the pipe while the specimen is measured.
Figure 3.
Measuring system for acoustic performance. The top half of the figure shows the measuring system of the sound absorption. The bottom half of the figure shows the measuring system of the TL and the ventilation area of the pipe while the specimen is measured.

Figure 8.
The theoretical results: (a) broadband absorption line coupled with multi-length HWRs and (b) the line optimized by the QWRs and the comparison between optimized and unoptimized methods.
Figure 8.
The theoretical results: (a) broadband absorption line coupled with multi-length HWRs and (b) the line optimized by the QWRs and the comparison between optimized and unoptimized methods.

Figure 9.
The experimental results: (a) broadband absorption line coupled with multi-length HWRs and (b) the line optimized by the QWRs and the comparison between optimized and unoptimized methods.
Figure 9.
The experimental results: (a) broadband absorption line coupled with multi-length HWRs and (b) the line optimized by the QWRs and the comparison between optimized and unoptimized methods.

Figure 10.
An absorber covered with the sponge.

Figure 11.
The sound absorption curve of optimized absorber for the theory and the experiment with and without a sponge.
Figure 11.
The sound absorption curve of optimized absorber for the theory and the experiment with and without a sponge.

Figure 12.
The TL curves produced by measuring and calculating complete cross-ventilation with 1 (a), 2 (b), and 4 (c) absorbers, respectively, as shown in the upper left corner of the respective figure.
Figure 12.
The TL curves produced by measuring and calculating complete cross-ventilation with 1 (a), 2 (b), and 4 (c) absorbers, respectively, as shown in the upper left corner of the respective figure.

Figure 13.
The TL curves were produced by measuring the 1 (a), 2 (b), and 4 (c) absorbers with the sponge (3 mm thick).
Figure 13.
The TL curves were produced by measuring the 1 (a), 2 (b), and 4 (c) absorbers with the sponge (3 mm thick).

Figure 14.
The insertion loss of a pipe system with 1, 2, and 4 absorbers from 280 Hz to 500 Hz.

Publisher’s Note: MDPI stays neutral with regard to jurisdictional claims in published maps and institutional affiliations. |
© 2021 by the authors. Licensee MDPI, Basel, Switzerland. This article is an open access article distributed under the terms and conditions of the Creative Commons Attribution (CC BY) license (https://creativecommons.org/licenses/by/4.0/).
Share and Cite
MDPI and ACS Style
Wang, H.; Mao, Q. Development and Investigation of Fully Ventilated Deep Subwavelength Absorbers. Symmetry 2021, 13, 1835. https://0-doi-org.brum.beds.ac.uk/10.3390/sym13101835
AMA Style
Wang H, Mao Q. Development and Investigation of Fully Ventilated Deep Subwavelength Absorbers. Symmetry. 2021; 13(10):1835. https://0-doi-org.brum.beds.ac.uk/10.3390/sym13101835
Chicago/Turabian StyleWang, Heng, and Qibo Mao. 2021. "Development and Investigation of Fully Ventilated Deep Subwavelength Absorbers" Symmetry 13, no. 10: 1835. https://0-doi-org.brum.beds.ac.uk/10.3390/sym13101835
Note that from the first issue of 2016, this journal uses article numbers instead of page numbers. See further details here.