
Enhance Contrast and Balance Color of Retinal Image

Division of Computational Science, Faculty of Science, Prince of Songkla University, Songkhla 90110, Thailand
*
Author to whom correspondence should be addressed.
Symmetry 2021, 13(11), 2089; https://0-doi-org.brum.beds.ac.uk/10.3390/sym13112089
Submission received: 6 September 2021
/
Revised: 19 October 2021
/
Accepted: 20 October 2021
/
Published: 4 November 2021
(This article belongs to the Special Issue Simulation and Modelling in Natural Sciences, Economics, Biomedicine and Engineering II)
Abstract
:This paper proposes a simple and effective retinal fundus image simulation modeling to enhance contrast and adjust the color balance for symmetric information in biomedicine. The aim of the study is for reliable diagnosis of AMD (age-related macular degeneration) screening. The method consists of a few simple steps. Firstly, local image contrast is refined with the CLAHE (Contrast Limited Adaptive Histogram Equalization) technique by operating CIE L*a*b* color space. Then, the contrast-enhanced image is stretched and rescaled by a histogram scaling equation to adjust the overall brightness offsets of the image and standardize it to Hubbard’s retinal image brightness range. The proposed method was assessed with retinal images from the DiaretDB0 and STARE datasets. The findings in the experimentation section indicate that the proposed method results in delightful color naturalness along with a standard color of retinal lesions.
1. Introduction
The World Health Organization (WHO) reported 65 million patients of AMD around the world, and the numbers could increase to 300 million patients by 2040 [1]. Currently, AMD evaluation is based on clinical retinal color photography analysis, which relies on camera properties and the retinal photographer’s experience. These images could be unsatisfactory for the experts to diagnose because of their low quality, such as low contrast, under and overexposure, etc. [2]. Hence, prior to usage, these low-quality images need to be enhanced to ameliorate a superior appearance of the retinal anatomical details.
Contrast Limited Adaptive Histogram Equalization (CLAHE) is a technique to increase the low contrast of an image [3]. It was developed from Histogram Equalization (HE) and provided a full range enhancement [4]. The global enhancement sometimes increases some noise or artifacts along with contrast because it amplifies all levels of light intensity, causing images to be too bright. Adaptive Histogram Equalization (AHE) [5], which is a local enhancement, was introduced to fix this issue in HE by distributing the overall brightness of the image to enhance contrast while disclosing hidden details. However, this approach still significantly amplifies noise, especially when applied to images with high noise levels, such as in medical images. Therefore, CLAHE was developed to address the above-mentioned issues, where the CLAHE algorithm sharpens images and limits noise.
In order to categorize breast tumors, a classification technique for mammographic images was proposed by combining the machine learning techniques Gaussian Radial Basis Kernel ELM (Extreme Learning Machine) and KPCA (Kernel Principal Component Analysis) [6]. In the preprocessing step, CLAHE was applied to improve the quality of low-contrast images enhancing the hidden information in the mammograms. CLAHE did not only increase the contrast of the images but also limited the noise in the mammograms.
To assist ophthalmologists, computer-aided diagnosis based on the enhancement of degraded fundus photographs made use of the CLAHE technique to improve retina color image quality via CIE L*a*b* color model [7]. First, the input image was converted to CIE L*a*b* color space, where L* represents lightness and a*, b* represent chromaticity. The information in all three channels in the CIE L*a*b* space was equalized. The normalized information was processed with CLAHE and then un-normalized to CIE L*a*b*. The result obtained was then reverted to RGB (red, green, blue) color space. The enhanced images led ophthalmologists to 97.5% accurate AMD classification.
Color retinal image enhancement based on Luminosity and Contrast Adjustment (LCA) [8] uses luminance gain matrix based on gamma correction, followed by image contrast enhancement by CLAHE in the L*a*b* color space. This method improved important anatomical structures of the retina and also preserved the naturalness of the images. Nine hundred and sixty-one poor-quality images with an average quality of 0.0404 were enhanced, providing good quality images up to an average of 0.4565, with quality assessment in the range 0–1.
Automated brightness and contrast adjustment of color fundus photographs for the grading of AMD [9] was developed with a scaling technique to automatically standardize the brightness, contrast, and color balance of digital color fundus images. Each image was adjusted to Hubbard et al.’s color retinal image standard by spanning the brightness curve four times the standard deviation of the image covering 95.5% distribution of the brightness values. This method decreased non-gradable AMD retinal images from 23% to the remaining 5.7% of 370 eyes.
Retinal image enhancement using Edge-based Texture Histogram Equalization (ETHE) [10] was proposed to correct the contrast and illumination problems in color retinal images. First, a Sobel edge detector revealed significant edges. By applying a threshold of 1 to the detected edges, an edge map was created to identify the dominant edges. The input images were enhanced by applying the newly calculated histogram from the map.
Pixel color amplification [11] enhanced retinal fundus images by amplification theory and enhancement methods to support segmentation tasks on fundus images. The open-source code image enhancement toolkit (IETK) was applied to enhance the images. Any combinations of methods represented by letters A, B, C, D, W, X, Y, X, sA, sB, sC, etc., were applied to control brightening, darkening, and sharpening methods.
Recently, a retinal image enhancement was proposed via low-pass filtering and α-rooting [12]. The images were improved in four steps: (1) background padding to prevent a boundary over enhancement, (2) contrast improvement by removing low frequency in the input image’s root domain, (3) grayscale adjustment in all color channels to recover the original color, and (4) refinement process to enhance the result image’s contrast.
Adaptive histogram equalization tuned with non-similar grouping curvelet (HET-NOSCU) [13] canceled noise and enhanced contrast of retina images. Through curvelet features, the quality of edges remained in the input image during the denoising process and blocked halo ringing and artifacts from appearing in the result images.
A novel approach, PSO System and Measure of Fuzziness [14], enhanced retinal fundus images by fuzzy framework applying particle swarm optimization (PSO) to define the fitness function of the fuzzy system. The system divided an input image into two fuzzy sub-regions determined by a type-2 fuzzy system, then applied the S-shape function to the sub-regions. Applying PSO in a fuzzy system improved, for example, blurriness and other traditional problems of PSO while enhancing retinal images.
In order to enhance blurry retinal images based on non-uniform contrast stretching and intensity transfer [15], the blurry images were divided into two groups: insufficient illuminated and sufficient illuminated. The images were applied to contrast stretching and intensity transfer technique. The authors assumed that the base intensity in input images could be neglected and, thus, the base-intensity value, calculated with a Gaussian function, was subtracted. In a second step, a compressed Gamma map was applied to enhance image contrast.
The latest image decomposition and visual adaptation [16] were applied to enhance retina images. Input images were separated into three layers: base, detail, and noise layers. These layers were then processed by illumination correction, detail enhancement, and denoising, respectively. The authors applied the weight fusion function to enhance and denoise image details. This method corrected uneven illumination via a regular visual adaptation model.
Our proposed method is inspired by analyzed brightness, contrast, and color balance of digital compared with film retinal images in the Age-Related Eye Disease Study (AREDS) [17] proposed by Hubbard et al. They represented retina images by dividing 16 intensity scales out of 256 levels of RGB color model. The histogram of intensity curves in their study peaked at 12/16, 6/16, and 2/16 for R, G, and B correspondingly; the color balance of band ratios was G/R = 0.5 and B/R = 0.17. Lastly, the overall brightness ranged between [7/16, 15/16] for R, [1/16, 9/16] for G, and [1/16, 3/16] for B color bands. This color model was since applied for grading AMD [9].
The purpose of this retinal fundus image enhancement technique is to improve the quality of retinal fundus images aiding specialists to analyze retinal diseases effortlessly and precisely. It also contributes to a specified color model for AMD lesions with easier to identify structural information. The paper contributes as follows:
- (1)
- AREDS proposed convenient retinal image brightness values to be a guideline for retinal image adjustment. The proposed histogram scaling technique evolves the AREDS manually adjusted values to adjust the AREDS brightness values and maintain color balance automatically. However, the provided color model of AREDS [17] enhances only the macular area while excluding the optic disk. The proposed method is developed for a region of interest (ROI) to cover all the retinal regions;
- (2)
- Combining the AREDS retinal image brightness values with the Rayleigh CLAHE enhancement technique, including the parameter values experimented with in this paper, improves the quality of the adjusted images by increasing their contrast reasonably;
- (3)
- When tested on the two datasets, STARE and DiaretDB0, and compared with several state-of-the-art methods, the proposed method was measured visually and objectively with global contrast factor (GCF) [18] for colorfulness (M(3)) [19], lightness order error (LOE) [20], and quaternion structural similarity (QSSIM) [21]. The proposed method performs excellent for directly enhancing AMD and for general retinal image enhancement.
2. Materials and Methods
The method was evaluated via two publicly available datasets, the Diabetic Retinopathy Database (DiaretDB0) and Structured Analysis of the Retina (STARE). Collected by Kauppi et al. [22], the DiaretDB0 consists of 130 images taken with a 50° field of view (FOV) with 1500 × 1152 pixels in dimension. The STARE consists of 397 images captured by Hoover et al. [23] with a 35° FOV and 700 × 605 pixels in dimension. The proposed method could handle the differences in both datasets, as demonstrated in Section 1.
Hubbard et al. proposed a method to enhance color retinal images manually by using Photoshop with the focus on color enhancement at the macular area. They adjusted and specified the color data according to their criteria for visual inspection. The criteria were set as standard to improve the image quality. When applied with the scaling [9] and CLAHE technique, it could then automatically enhance the image with MATLAB (2015 version 8.6).
For the proposed algorithm, 70 images were randomly selected with uniform distribution and stored for next use as a data representative to sample for parameter optimization. In total, 70 sample images were selected equally from both datasets used in this paper; thus, 35 images from each dataset.
To adjust the brightness and color correctness of images, we applied the histogram stretching technique with the CLAHE technique to automatically match the output image properties to Hubbard’s standard. The method consists of two modules: (i) CLAHE algorithm to improve the contrast of the image. (ii) Histogram stretching to expand the tightened histogram in each color band to Hubbard’s standard. Each module is thoroughly described in the following subsections. For an extensive overview, typical retinal images have a black border that must be removed before use. Images in the STARE and DiaretDB0 datasets are not consistent, i.e., many images appear with a darker to black area due to uneven lightness, unbalanced camera flash reflection caused by the curves of eye lenses, and green or red timestamps on the border. In order to eliminate these anomalies, Otsu’s method was applied to obtain pixels in the ROI of the images. The final product of the ROI extraction is a circular area of the retina with the black background eliminated.
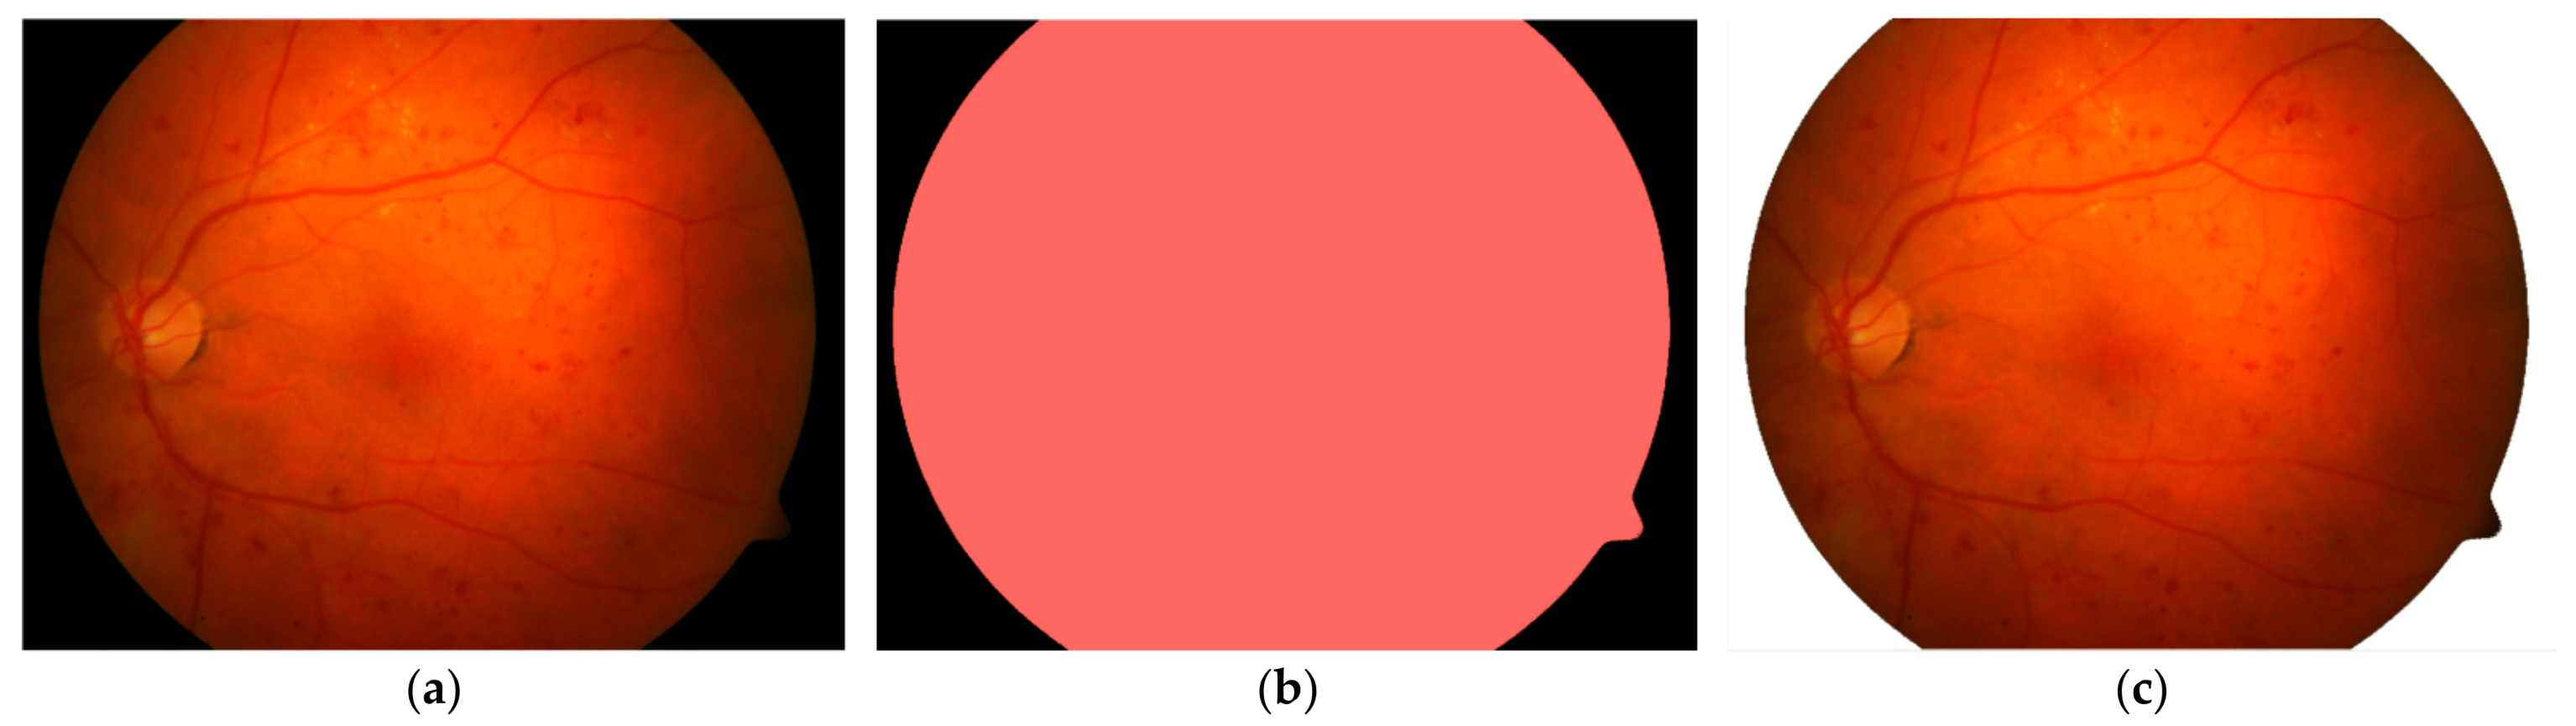
2.1. Otsu’s Threshold to Select ROI
An image file from DiaretDB0 illustrates the ROI selection. To obtain the ROI, as shown in Figure 1, the red channel of the input image was used as a threshold for Otsu’s method to create a mask. The method was mainly applied to separate the dark background from the retina. For this reason, the threshold value was then scaled down with 0.25 to guarantee the separation between the background and the retina. The mark was then used to create the index of the pixels in the ROI. This process resulted in a retina-only image.
2.2. Improving Contrast of the Image with CLAHE
In order to enhance the contrast and balance color of a retinal image, the proposed method employs CIE L*a*b* color space because it provides a representation of color opponent in measuring colorfulness [19]. The color space divides color information into lightness (L*) and chromatic information (a*, b*) on a red/green (a*) and yellow/blue (b*) axis. The lightness of the color varies as a function of L*, in the range of 0 (black) to 100 (white). It increases the saturation (or chroma) as it shifts from the central region to the edge of the sphere. It changes the hue angle when it moves around the sphere.
In order to convert data in RGB color space to CIE L*a*b* color space, the RGB data are converted to XYZ color space first, then converted to CIE L*a*b* color space. The transformation function to convert RGB to XYZ color space is shown below:
where X, Y, and Z are tristimulus values of the XYZ color space sample.
The equations to convert XYZ to CIE L*a*b* coordinates [24] are shown in the following:
where function is given by:
, and in Equations (2)–(4) are reference tristimulus white point values, which are assigned to 255 for the 8-bit images.
CLAHE is a technique for enhancing low-contrast images, usually to enhance retinal images [7,25,26]. The proposed method develops Rayleigh CLAHE in [26], which enhances only the intensity component of images for improving both the color contrast and color balance.
In the Rayleigh probability density function [27], provides to specify histogram intensity data is given by:
where represents the CIE L*a*b* color components that are scaled in the range [0, 1]. α is a shape parameter.
In our algorithm, the shape parameter provides to manage the brightness distribution in each color component. The parameter value will affect in more significant contrast the components; thus, we assign the α parameter by:
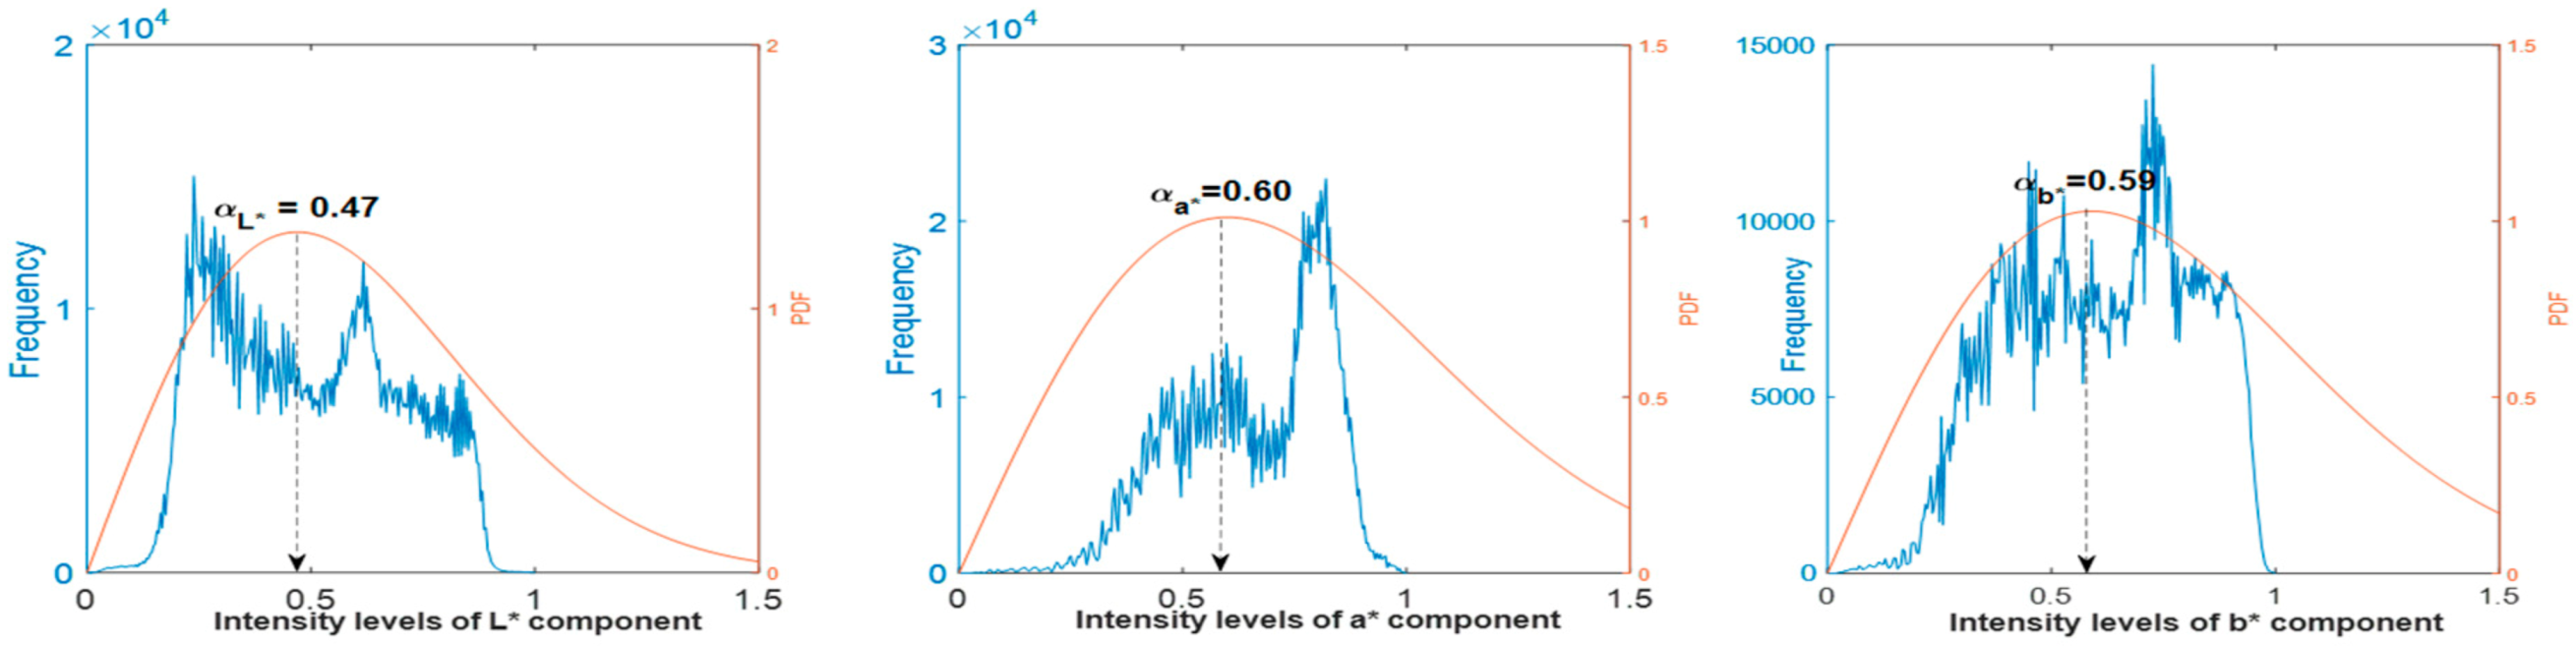
where ) denotes the arithmetic mean of the scaled intensity component . From ROI of Figure 1c, when transferred to L*a*b* color space, we obtain the components L*, a*, and b* from the Equations (2)–(4), as scaled and illustrated the data distributions with the blue graph histogram in Figure 2. The scaled data are provided to estimate the shape parameter by Equation (7). The estimated parameters of the components L*, a*, and b* are , , and , respectively. The shape parameters are fed to the Rayleigh function in Equation (6), with the density function represented with the red curves demonstrated in Figure 2.
In our scheme, the shape parameter functions not only as a mean value but also provides the mode value, as depicted in Figure 2. The mode value represents the brightness parameter of each color component. The brightness is then translated to provide color balance as described in the next subsection.
However, the transfer function consists of multiple factors of the CLAHE method, such as window size, also named “tile”, and “clip-limit” factors, which necessarily define the optimum values.
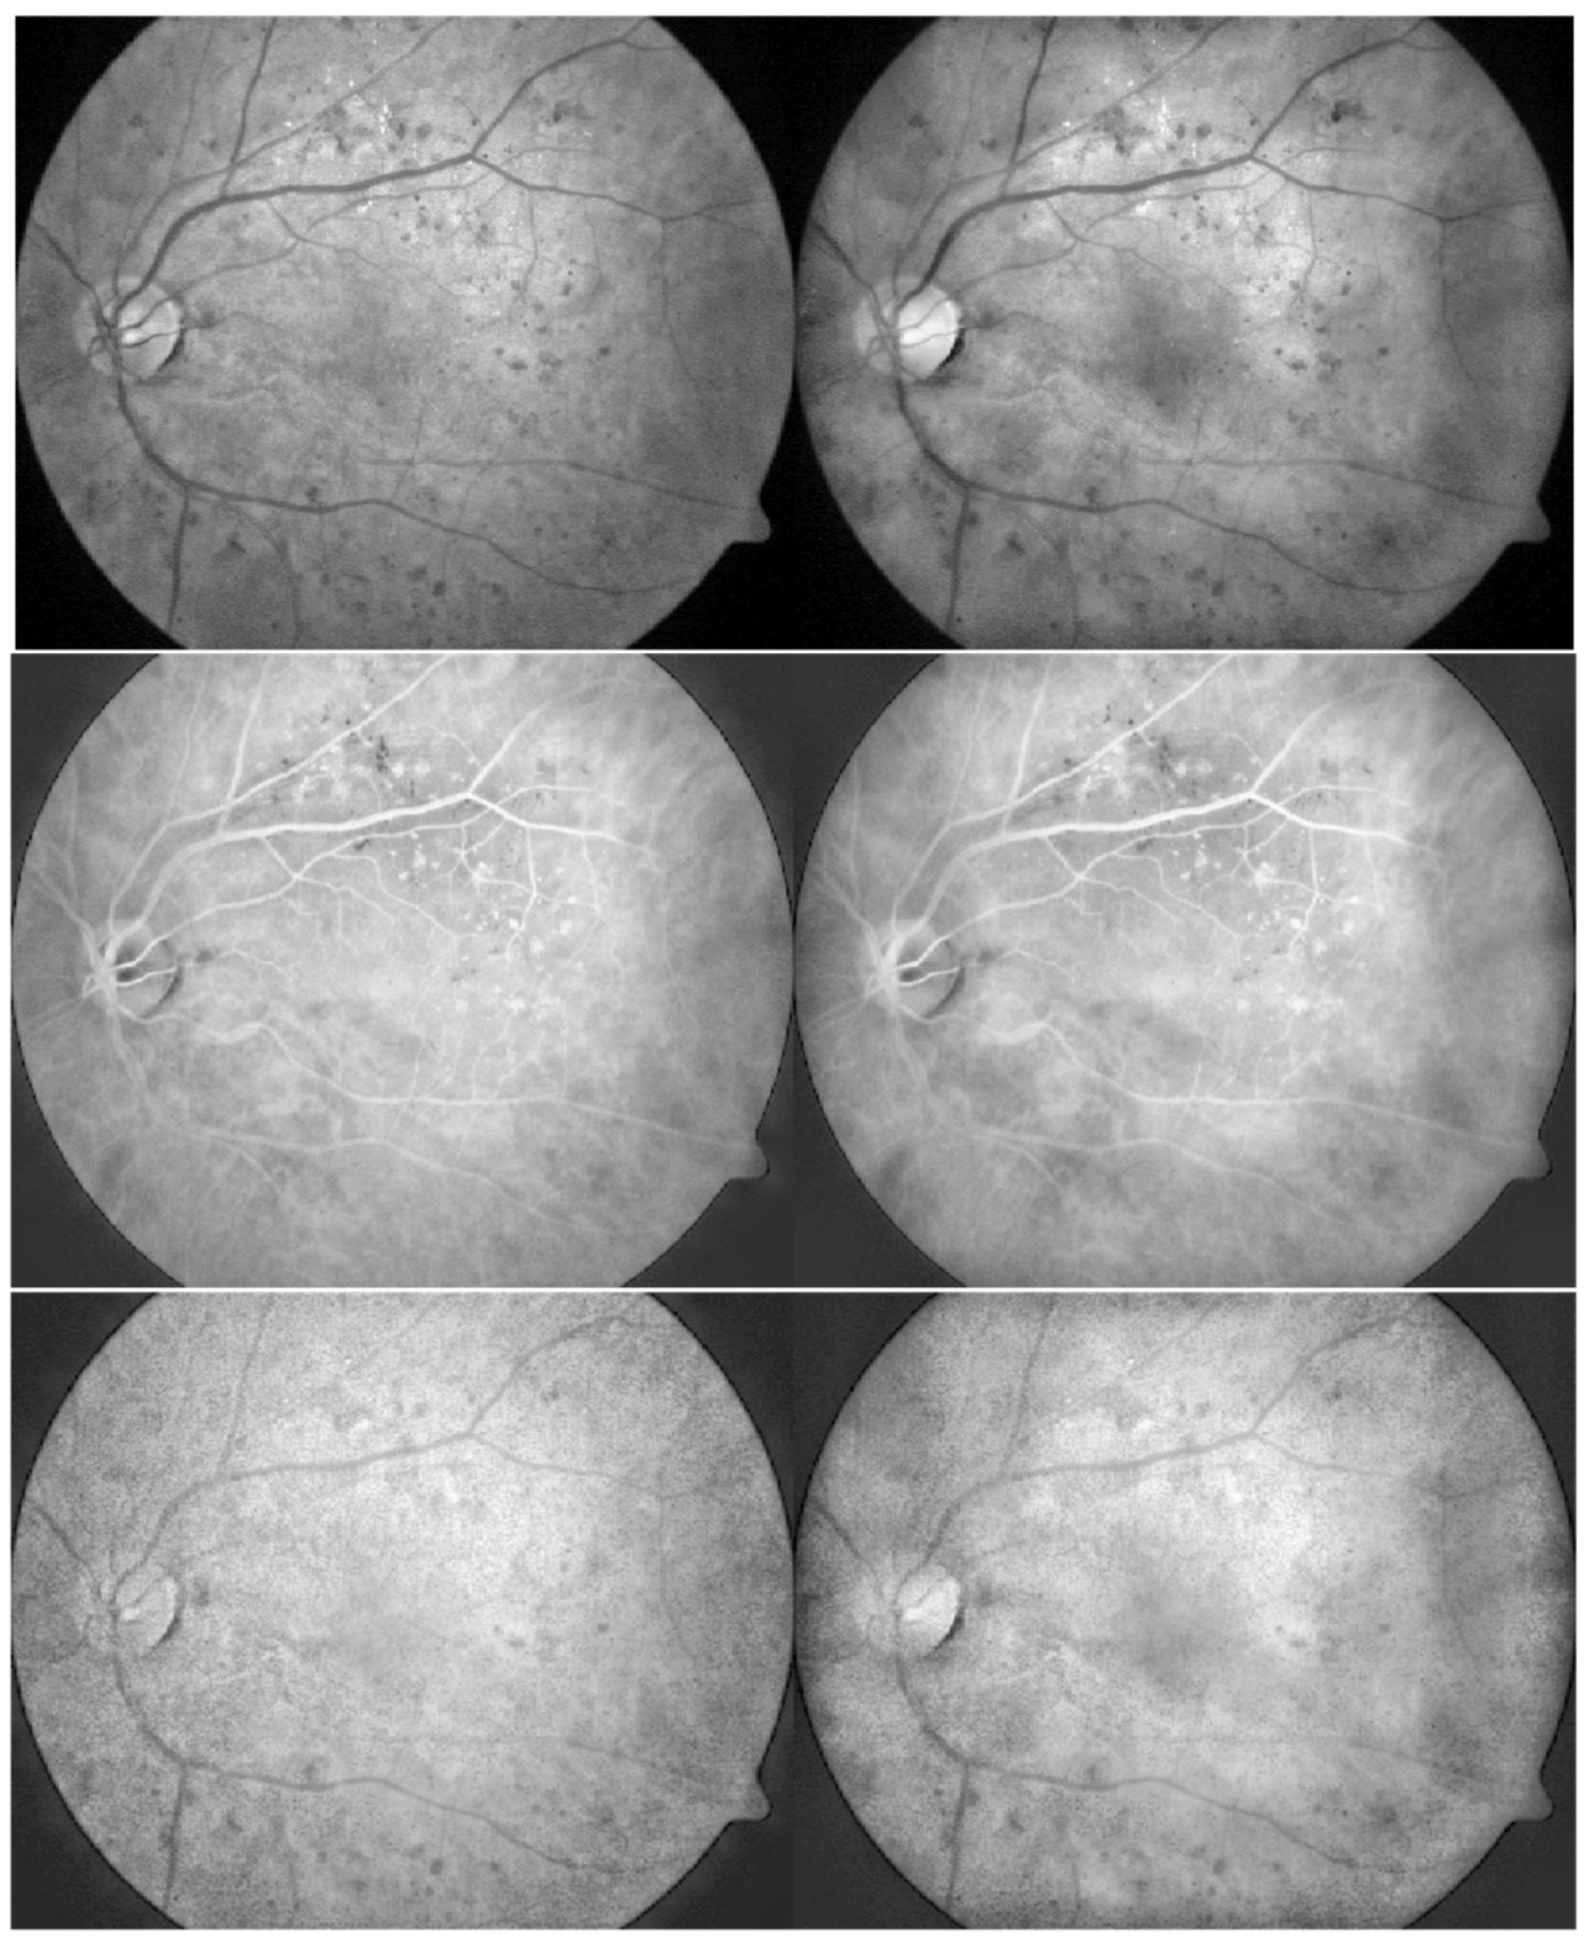
In order to optimize the remaining parameters of CLAHE under Rayleigh distribution, the 70 sample images were employed to design the parameters by fine-tuned and visual observance. Examples from our study under Rayleigh distribution, tile-size and clip-limit parameters are defined as shown in Figure 3. The first column was formulated by tile-size, 32 × 32 pixels, with clip-limit values equal to 0.01, 0.005, and 0.01 for L*, a*, and b* components, respectively. For the second column, the L*, a*, and b* components were operated by the tile-size, 8 × 8 pixels, at the same clip-limit values of the first column. The images were operated with the bigger tile-size appearing smoother than the smaller tile-size; however, the image tone of the smaller tile appears better in the component a*, which represents the red–green channels.
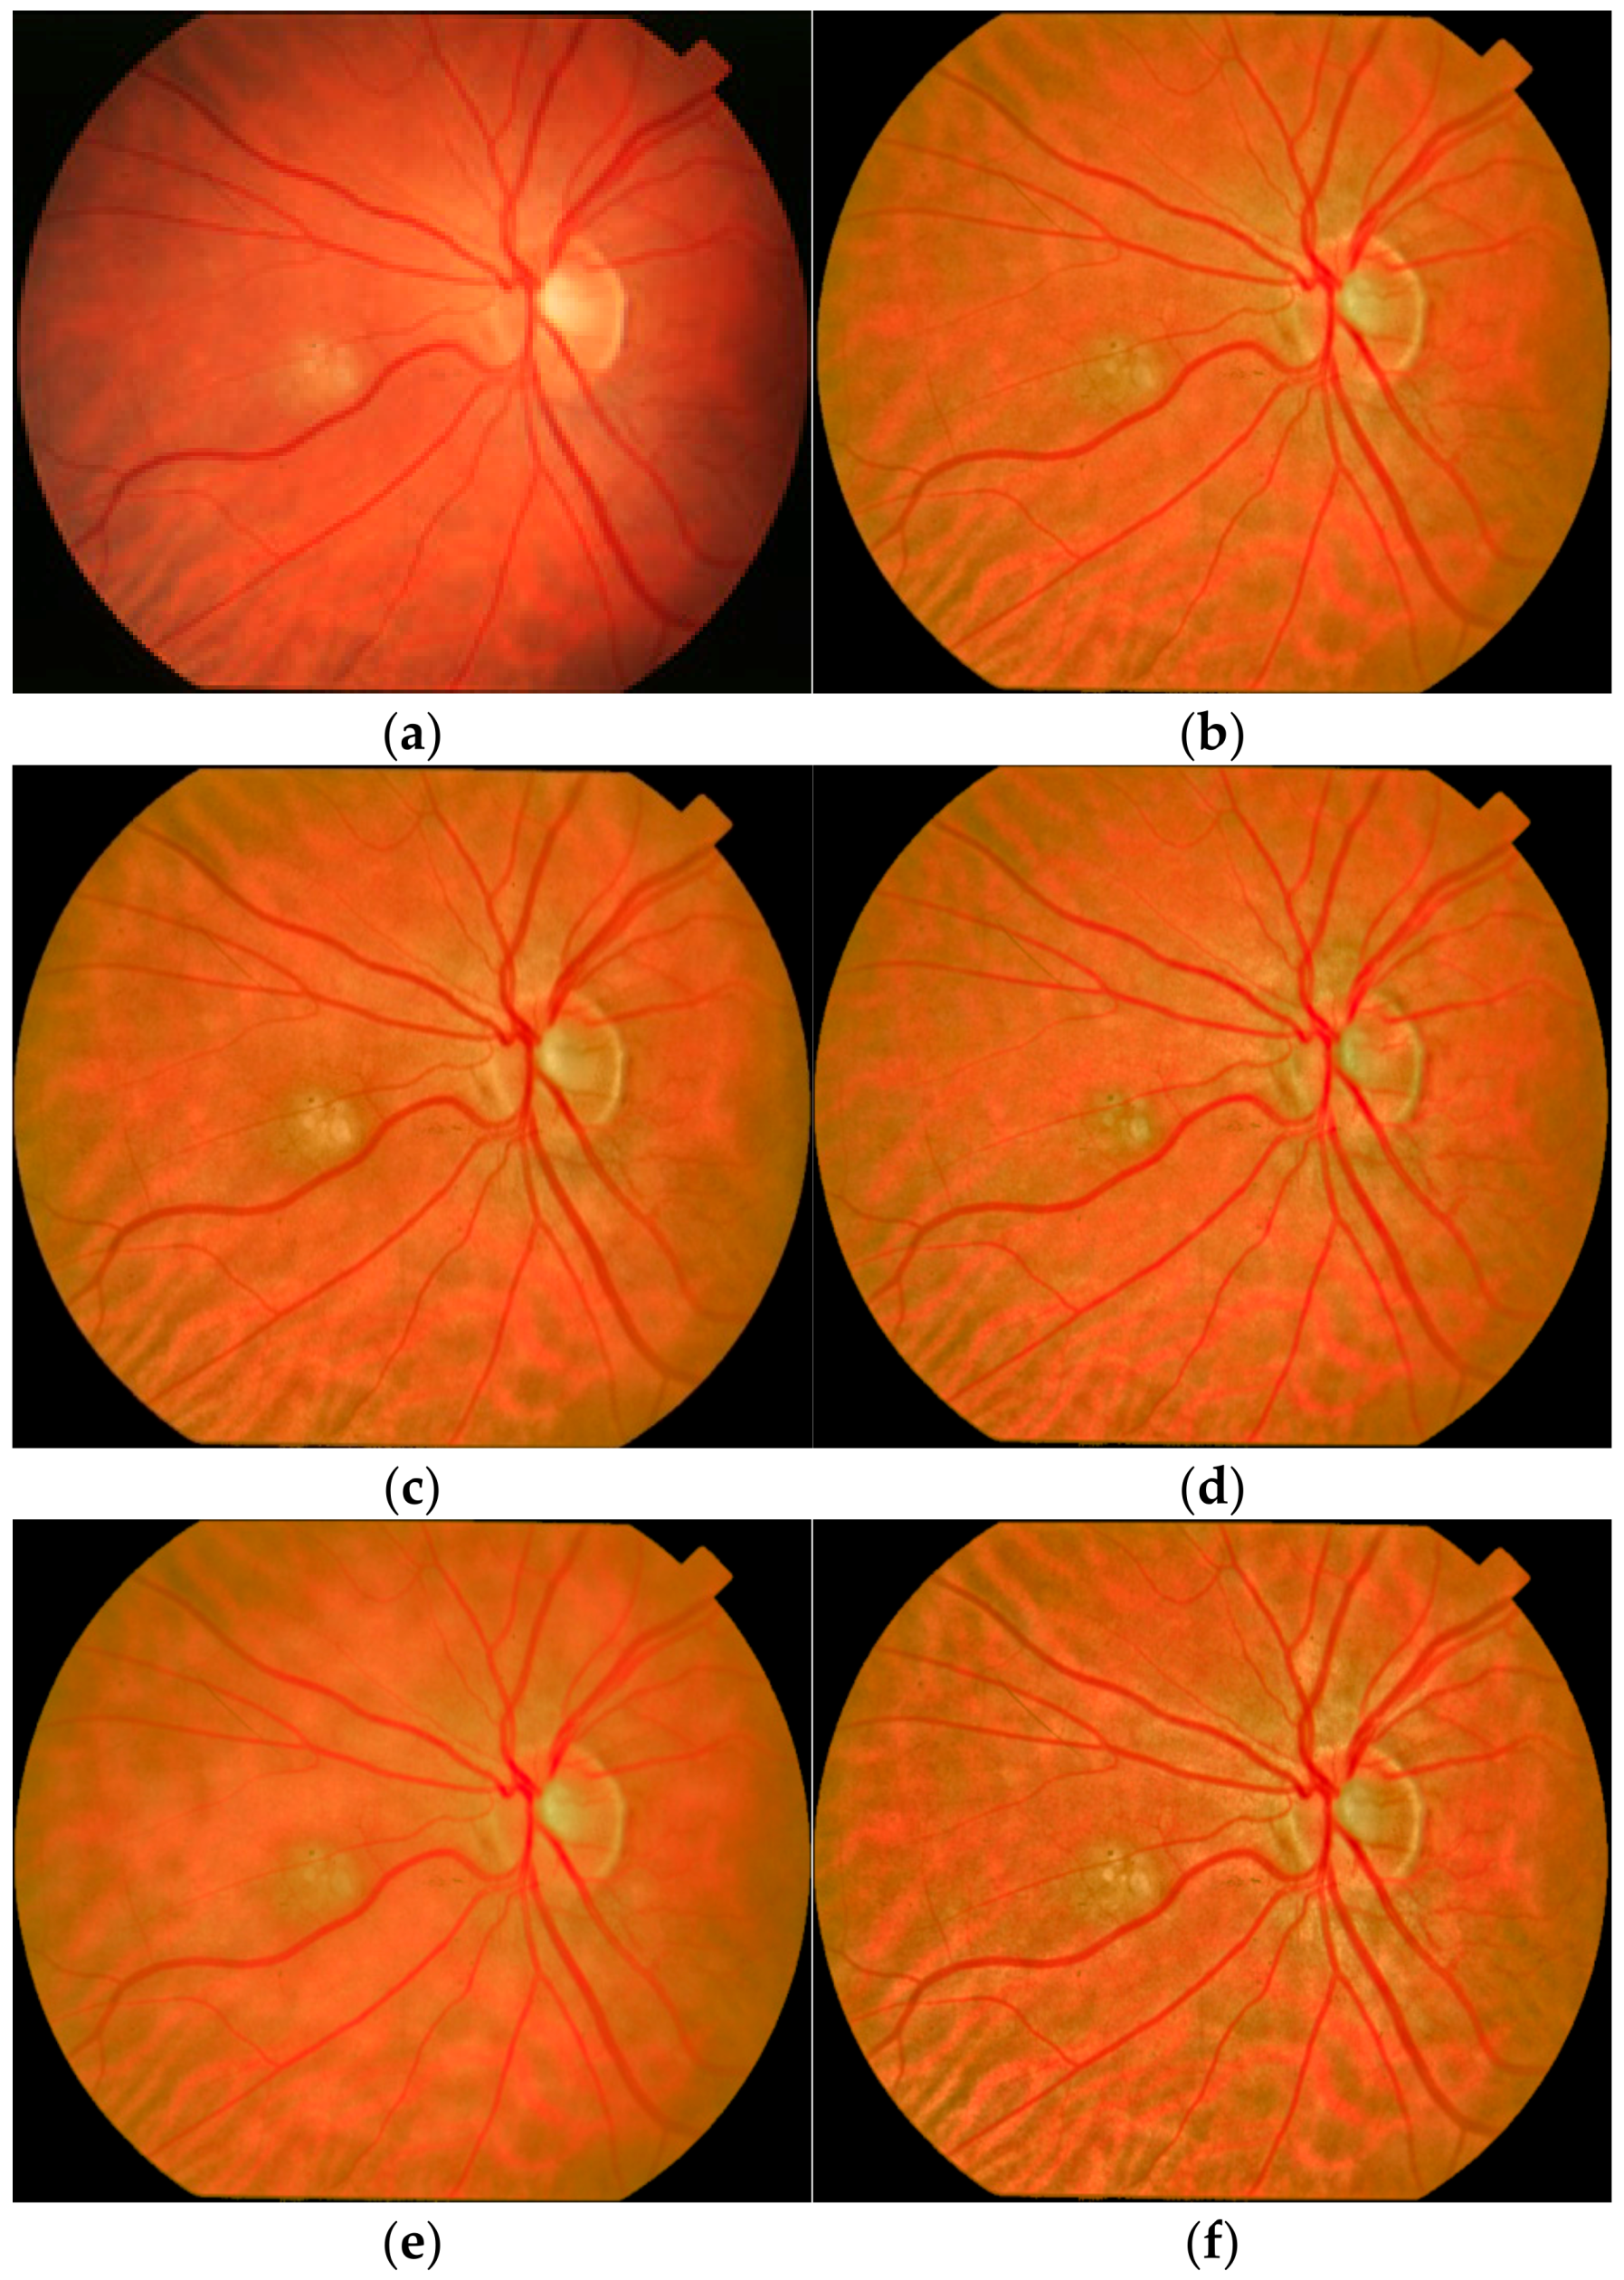
After manual adjustment, examples for tile-size and clip-limit values are provided in Figure 4, where Figure 4b was adjusted with tile-size 32 × 32, 8 × 8, and 32 × 32 and clip-limit 0.01, 0.005, and 0.01; Figure 4c,d were fixed with clip-limit at 0.01, 0.005, 0.01 in varying tile-sizes; Figure 4e,f with fixed tile-size at 32 × 32, 8 × 8, 32 × 32 but varying clip-limit values. Figure 4c used a tile-size of 16 × 16, 4 × 4, 16 × 16 for the three components and appeared a bit greener, with veins less red than in Figure 4b. Figure 4d with a higher tile-size number also enhanced artifacts significantly. Figure 4e used smaller clip-limit values than Figure 4b, and the output was smooth but omitted a bunch of information while Figure 4f, which had greater clip-limit numbers, overly emphasized artifacts. It is suggested that the optimum tile-size should be 32 × 32, 8 × 8, 32 × 32, and clip-limit values should be 0.01, 0.005, 0.01 for L*, a*, and b* components, respectively.
Figure 4 demonstrates the effect from clip-limit and tile-size parameters; however, the stretched histogram of the image result with offset and scale of Hubbard et al. is further described in the following subsection.
2.3. Stretching Histogram
After enhancing the local contrast by CLAHE, the color components were adjusted to the offset and scale values. According to Hubbard’s scale [11], the intensity ranges of each band of the image are 112, 240 for the red band, 16, 144 for the green band, and 16, 48 for the blue band. Hence, the overall brightness range of the scale in R, G, and B bands is 32, 128, and 128, respectively. The average intensity in each band is 32, 96, and 192 for R, G, and B, respectively. We then converted the scale values from RGB color space to CIE L*a*b* color space. We obtain 32.3438, 65.8206, and 10.0466 as the brightness range, for L*, a*, and b* channels, respectively. The brightness () values are 51.4732, 34.5079, and 51.0550 for L*, a*, and b*, respectively.
To enhance the image by stretching its histogram, we substituted (8) and (9) from Tsikata et al. with the converted brightness range and intensity above.
where γ is the scale value to stretch the image histogram, is the brightness range, and σ is the standard deviation of each band of the image. Then calculate as follows:
where equals the pixel of the image components derived from the CLAHE step. is the average intensity of each image band. is the brightness value of each channel provided to translate the brightness parameters for adjusting the color offset to produce the color balance of the retinal images.
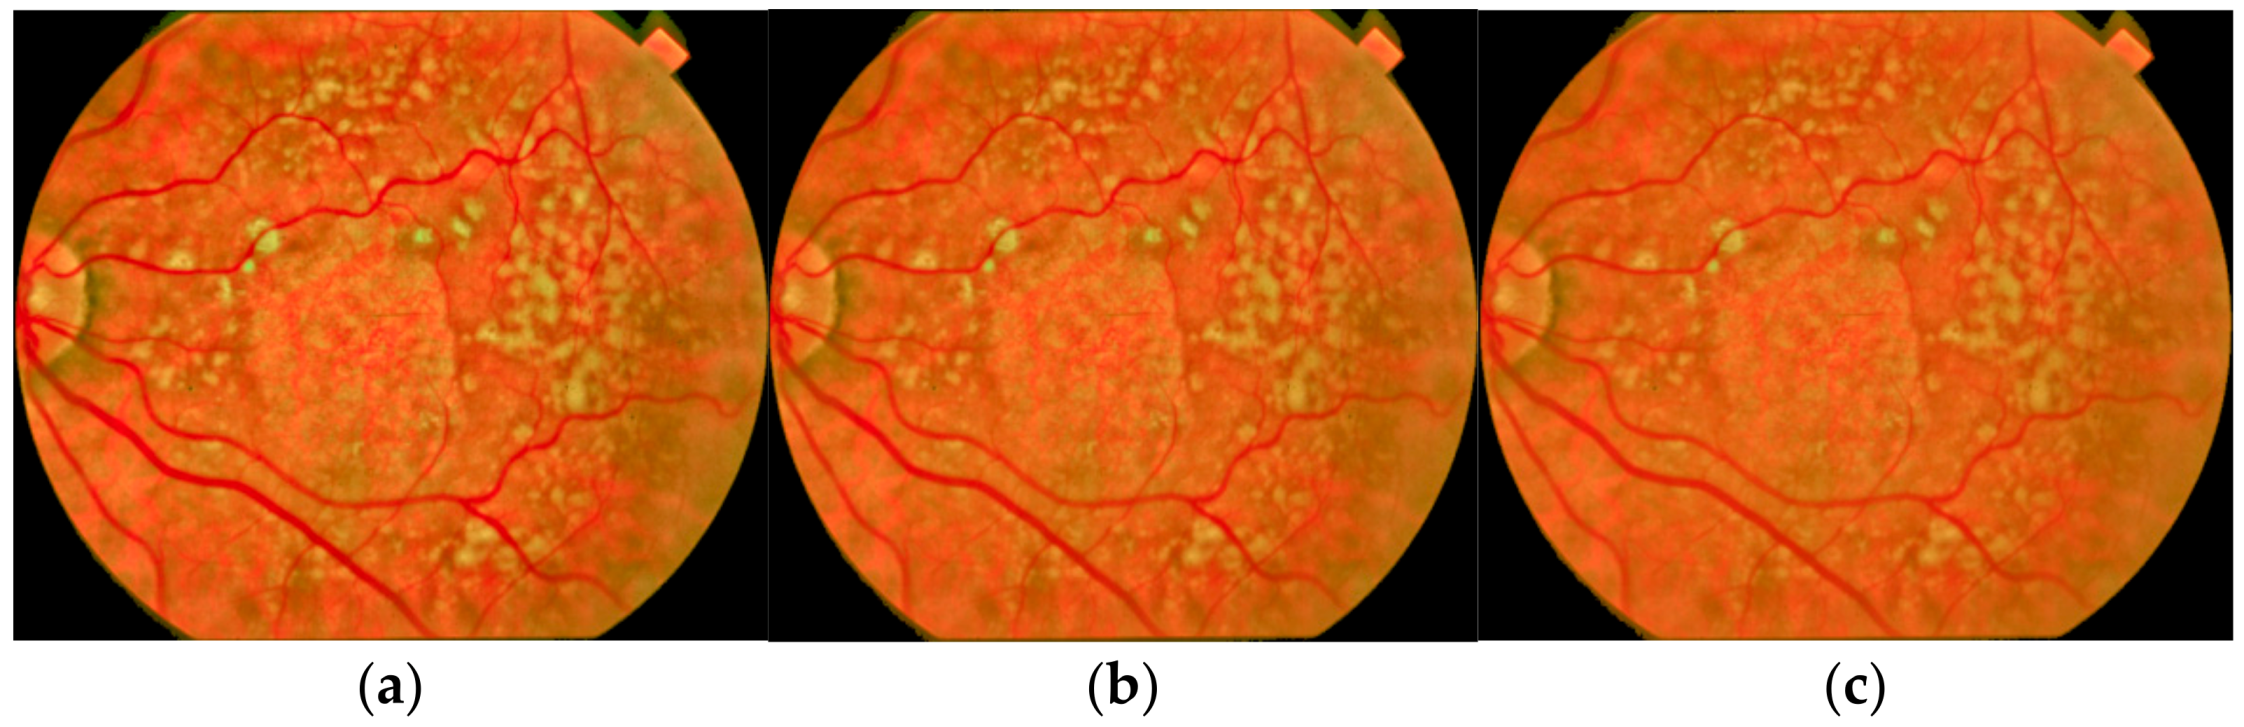
In Equation (8), the scale parameter, γ, is controlled by σ denominator; the bigger the denominator, the smaller γ, and vice versa. The 70 sample images were employed to proper scale value to enhance and give a good result, as depicted in Figure 5. There were three examples of the denominator values. Figure 5a–c were adjusted with the denominator values of 5σ, 6σ, and 7σ, respectively. The output of Figure 5a,b were high in contrast, and Figure 5a had a higher color saturation so that it appeared unrealistic, while the contrast and color saturation in Figure 5c were too low. Figure 5b had appropriate contrast and color saturation for experts to analyze lesions. This suggested that the appropriate denominator should be 6σ to achieve good results as Hubbard’s specifications.
In this step, the image histogram is adjusted to span in the expected range and brightness value so that the overall brightness and color balance would meet the specifications of Hubbard et al. The results of our method are illustrated in the experimentation.
3. Results
In Section 1, our proposed method was compared with two motivating methods: the scaling technique [9], designed for enhancing AMD lesions, and the CLAHE technique [3]. We also compared our proposed method with other projects designed for enhancing the poor quality of the retinal images: luminosity and contrast adjustment (LCA) [8], retinal image enhancement using edge-based texture histogram equalization (ETHE) [10], and enhancement of retinal fundus images via pixel color amplification (IETK) [11]. We used 397 images from the STARE dataset and 130 images from the DiaretDB0 dataset to evaluate the performance of the methods. This section presents the comparison of inefficient images between before and after enhancement, objective assessment, and inspection of visual quality.
3.1. Number of Inefficient Images before and after Enhancement
There are four categories of undesirable retinal images stated in Hubbard et al. [17]: (1) red oversaturation, (2) marked under illumination, (3) weak green or strong red, and (4) excessive blue. The red oversaturation occurs when over 15% of the red intensity values ≥ 240. The marked under illumination arises when the red channel brightness values less than 96. When the brightness ratio G/R < 0.40, it produces weak green or strong red. Lastly, excessive blue occurs when the brightness ratio is B/R > 0.25.
The dataset investigation in Table 1 shows statistical information of STARE database as 47.10% of the images occur red oversaturated and 28.21% of which appear blue oversaturated. DiaretDB0 database has weak green or strong red images for 48.46%. Table 1 also illustrates the percentage of unacceptable images before and after enhancement by all mentioned methods, including the proposed method. The ETHE method significantly increased the excessive blue undesirable to both datasets to 100% for DiaretDB0 and 97.98% for STARE. The IETK method outstandingly increased the red oversaturation to 100% for both datasets. The scaling and proposed method have almost identical percentage numbers because both were designed to enhance retinal fundus images to the standard of Hubbard et al.
Based on the image characteristics derived from Hubbard et al., the color retinal images were evaluated. The images from both datasets were examined for their brightness, contrast, and color balance statistical information. The images enhanced by the proposed method obtained the targeted characteristic values as follows. The average brightness of red, green, and blue channels were 192.0 ± 0.1, 95.2 ± 0.1, and 31.7 ± 0.1, respectively, for that of the images in the DiaretDB0 database, and were 191.9 ± 0.2, 95.0 ± 0.2, and 32.0 ± 0.2, respectively, for that of the images in STARE database. The average ratios of Green-to-Red and Blue-to-Red were 0.496 ± 0.000 and 0.165 ± 0.000, respectively, for that of the images in the DiaretDB0 database and 0.495 ± 0.001 and 0.167 ± 0.001, respectively, for that of the images in the STARE database. Table 2 shows statistical information of images in DiaretDB0 and STARE database before and after enhancement by the proposed method.
3.2. Objective Assessment
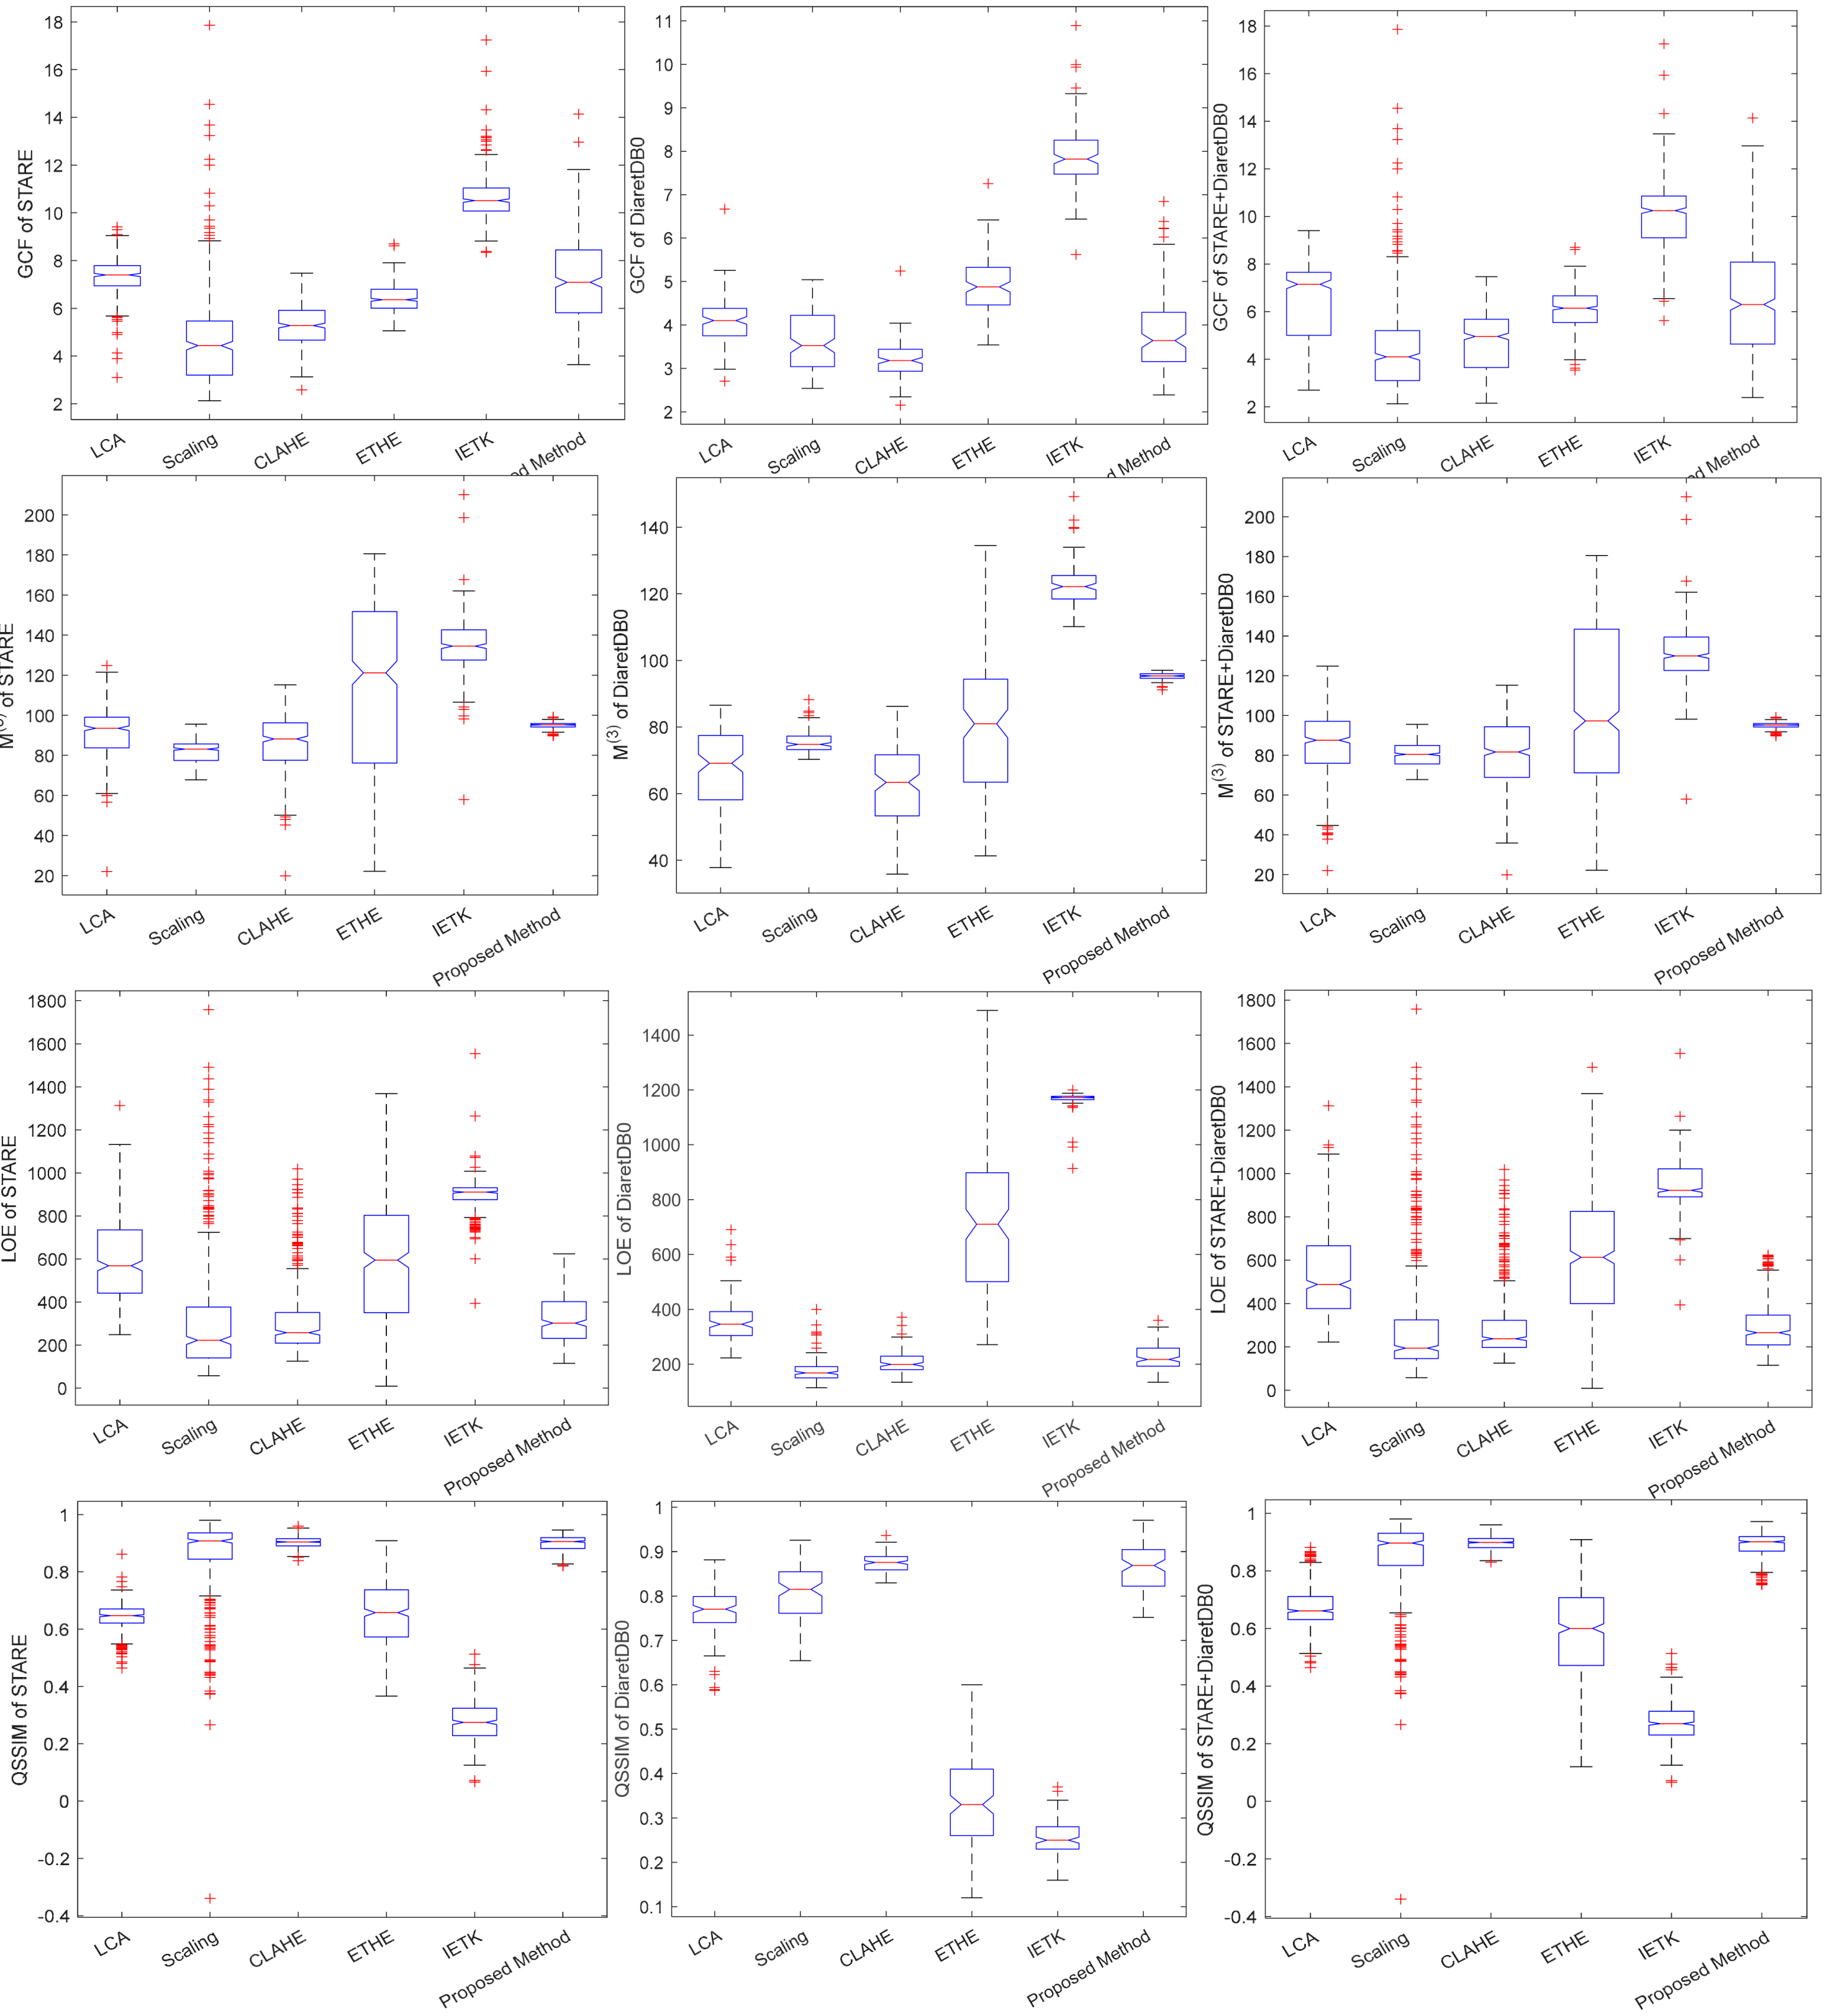
Besides the statistical image information, this experiment aimed to evaluate the performance of the proposed method in terms of contrast, color balance, naturalness preservation, and structural preservation by four quantitative metrics, global contrast factor (GCF), measuring colorfulness (M(3)), lightness order error (LOE), and quaternion structural similarity (QSSIM), respectively.
GCF [18] measures the edge contrast of an image at multilevel resolution by calculating a weighted average to obtain a global contrast factor. The GCF measures grayscale images only. Therefore, the green channel was selected to represent information of retina structures in the examined images, as those informative details are stored in the channel.
M(3) [19] measures the image colorfulness suiting the sensory data obtained from the psychophysical experiment. Its calculations are based on the opponent color model CIE L*a*b*.
LOE [20] assesses the naturalness preservation from the output image to the input image. Smaller LOE values indicate better naturalness preservation in an image. On the other hand, it implies a better enhancement method.
QSSIM [21] is one of the visual quality matrix tools designed for color image structural quality evaluation. The QSSIM scores range from 0 to 1; the score of 1 means an output image perfectly preserving the structural information from the input image.
Figure 6 shows the quantitative metrics of GCF, M(3), LOE, and QSSIM, providing good overall scores for the proposed method by the four measured indexes, starting with the GCF index compared to the methods in the same group for the scaling and CLAHE methods. The score of the proposed method is higher; it has a median score of 7.08, which is almost the same as the LCA method but less than the IETK. For colorfulness, M(3), the proposed method scored 94.56, which is higher than scaling and CLAHE methods; however, it scored lower than ETHE and IETK methods. The LOE index measures naturalness; the proposed method provides an index at the same level as scaling and CLAHE, but it surpasses LCA, ETHE, and IETK. Regarding information preservation, the QSSIM index of the proposed method has a median value of 0.89, which is at the same level as the scaling and CLAHE methods; however, it equates to better values than the LCA, ETHE, and IETK methods.
3.3. Visual Assessment
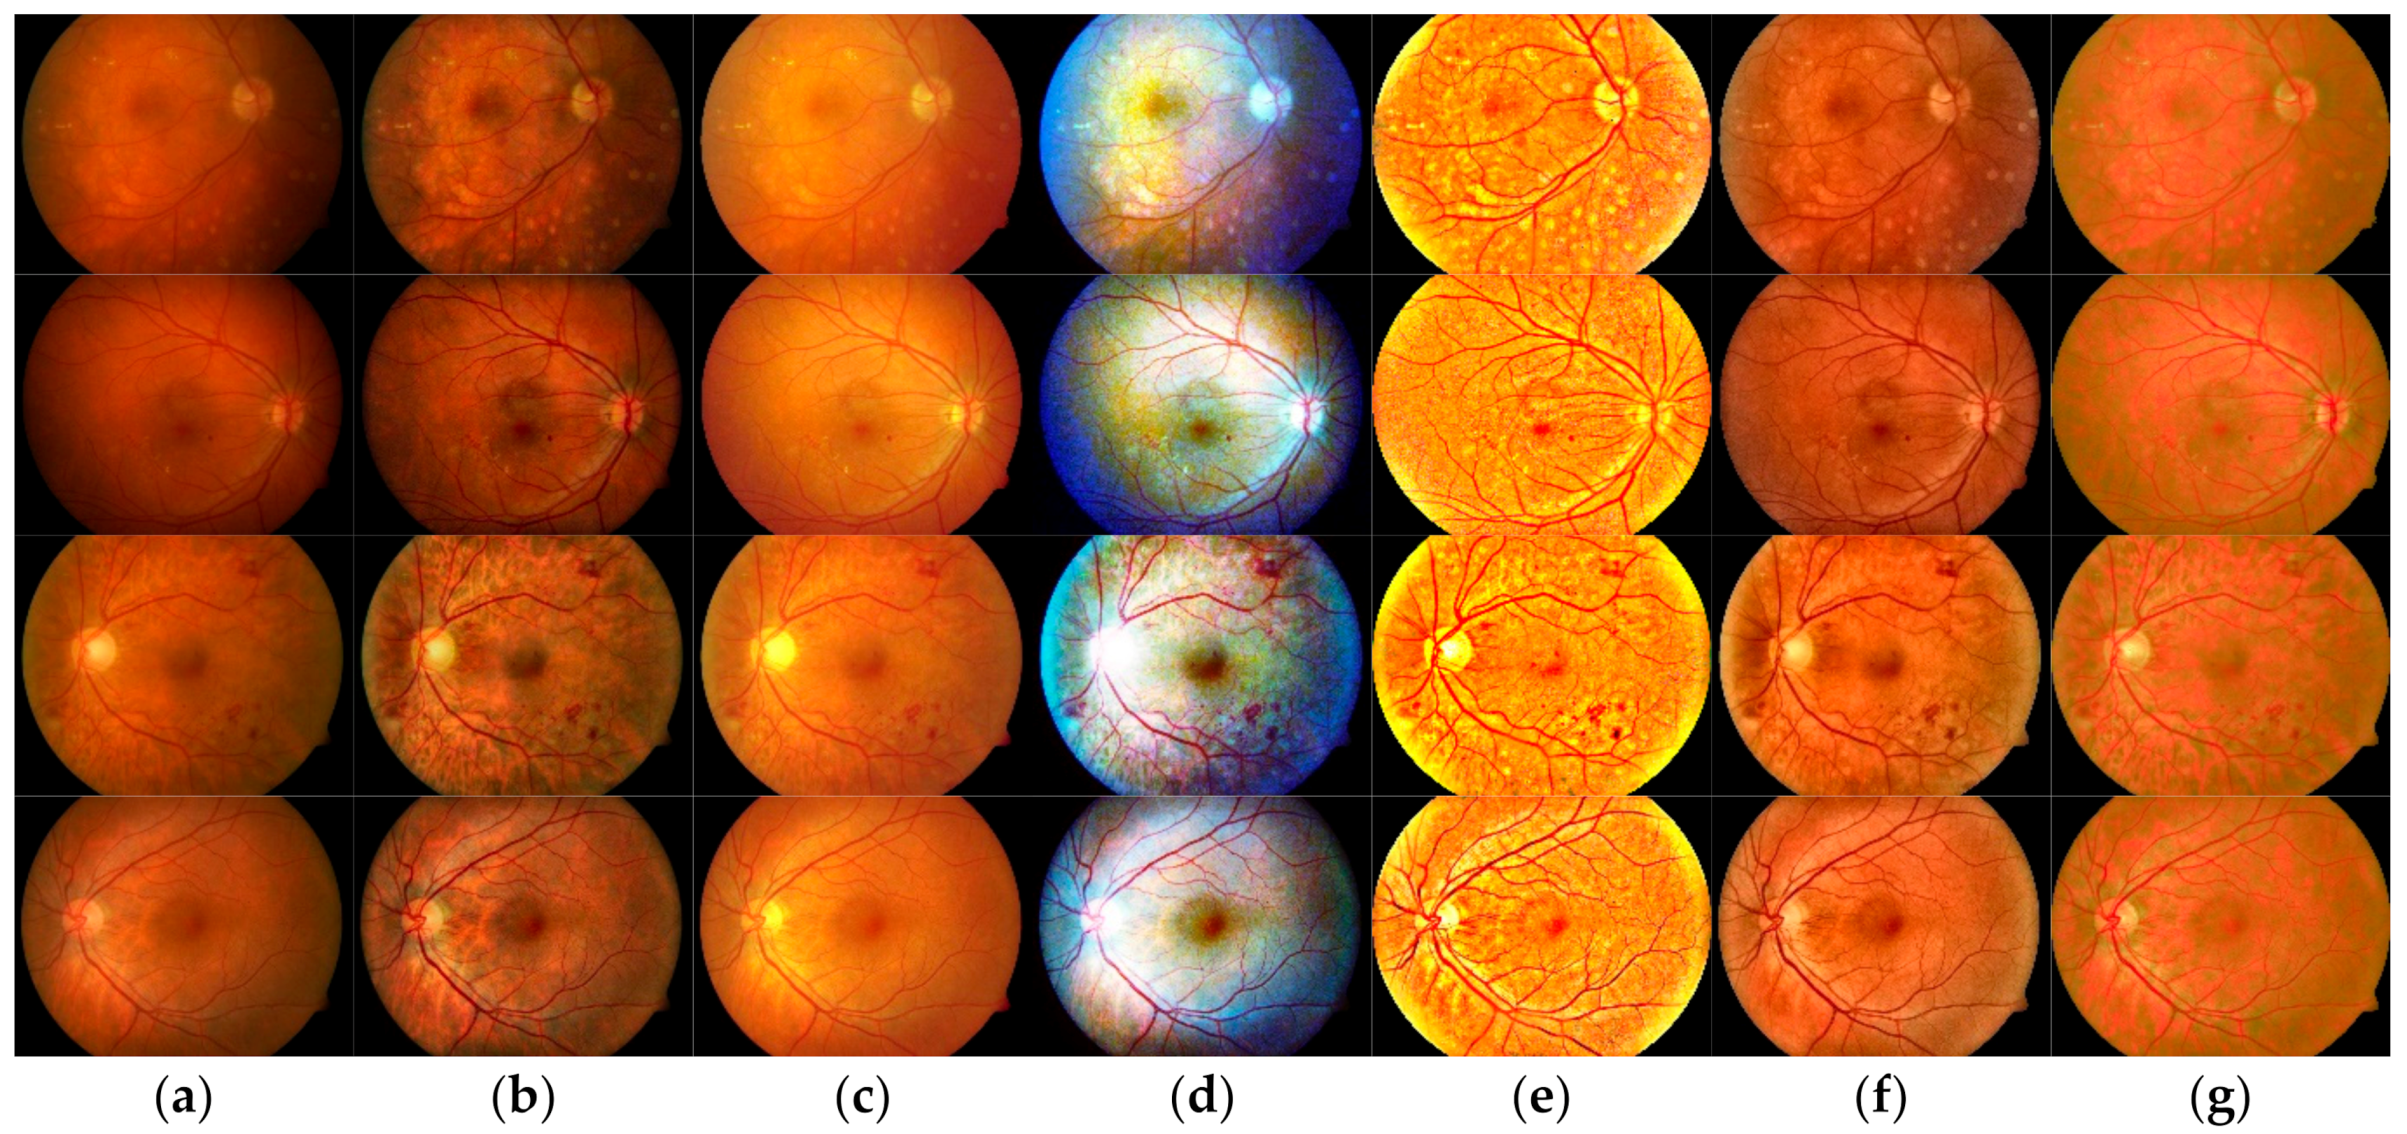
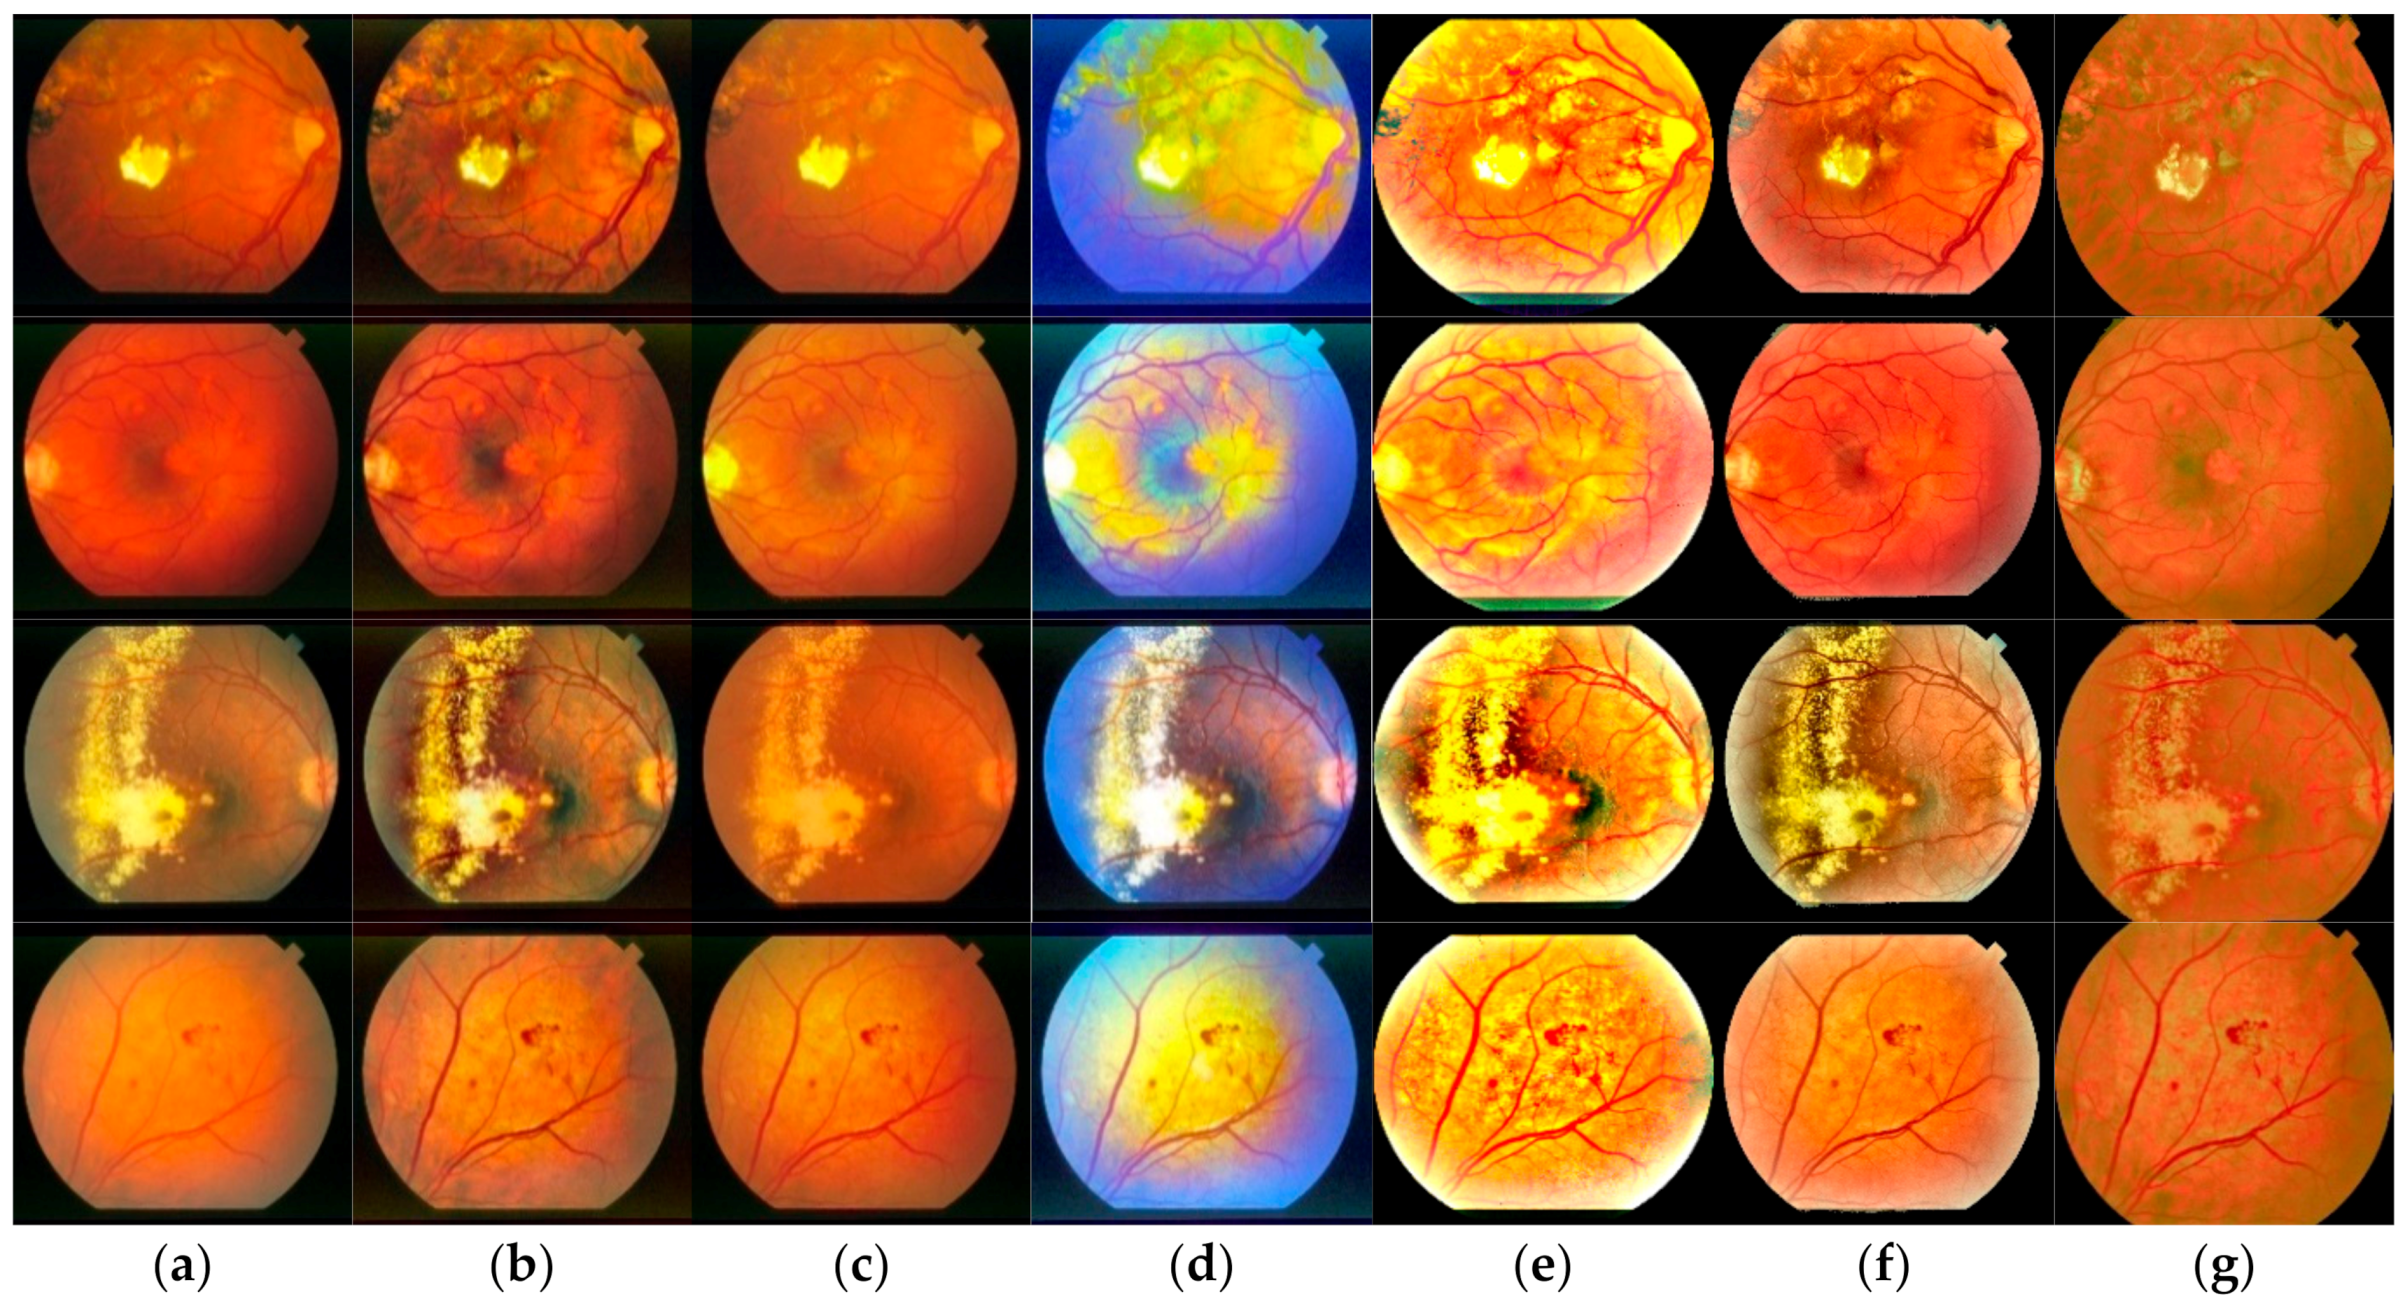
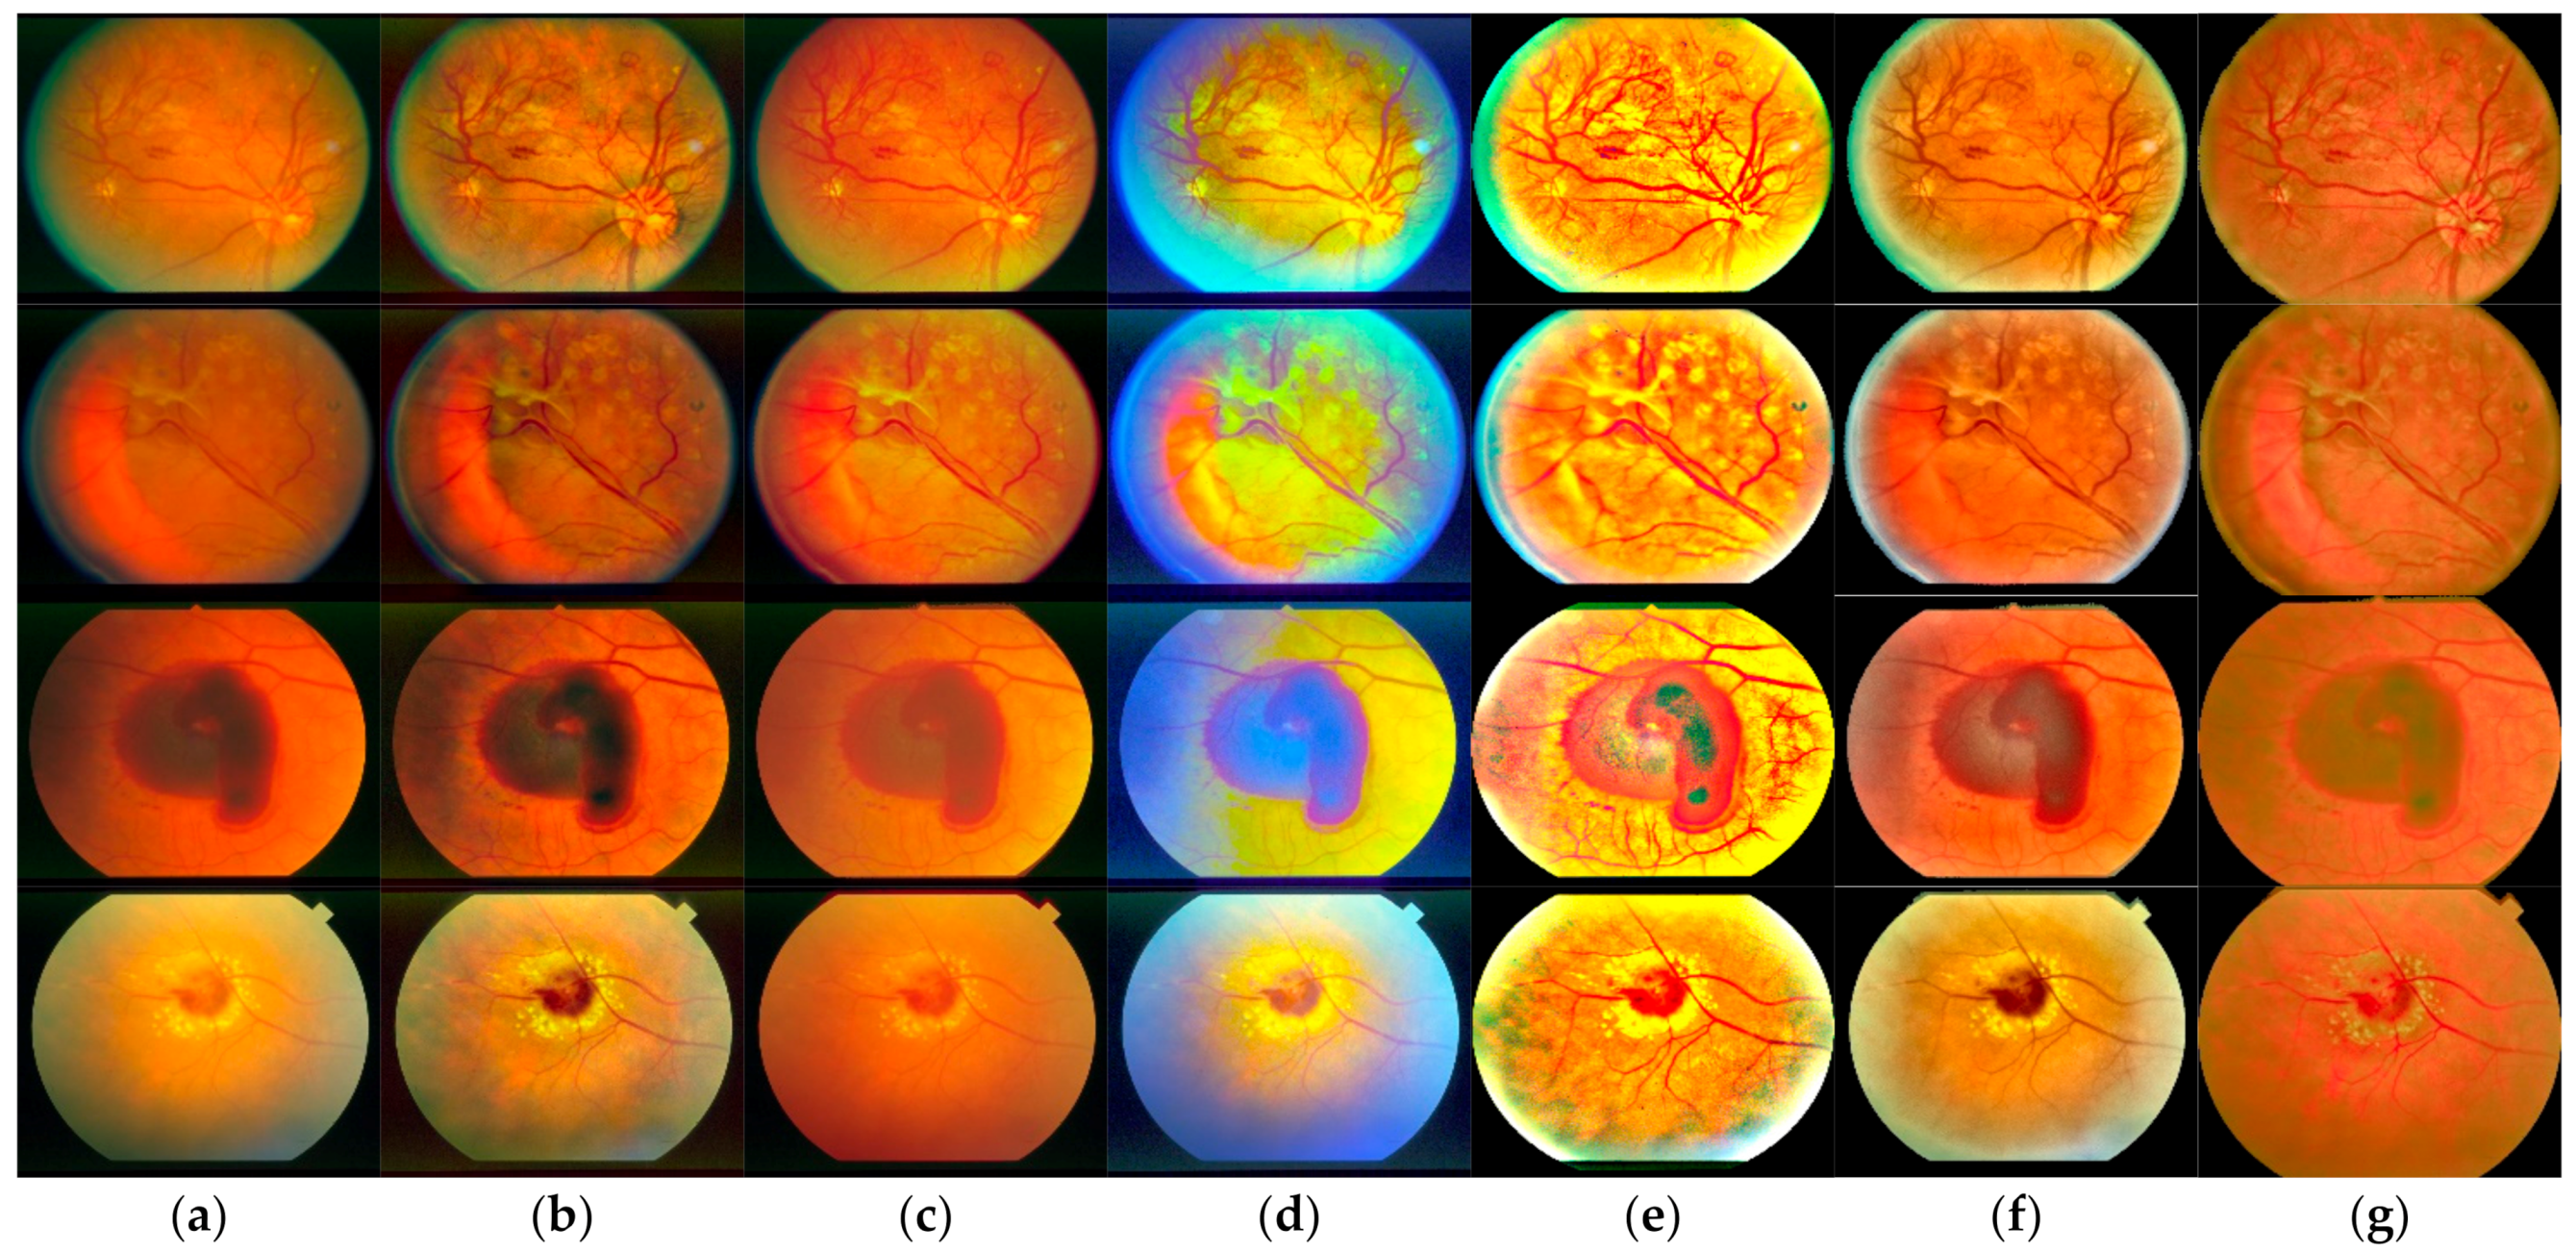
From the statistical information evaluation shown above, the proposed method performed well. However, the visual assessment would secure the statistical results for the experiment. Figure 7, Figure 8, Figure 9 show the outcomes from DiaretDB0 and STARE datasets, where each row provides an image from the dataset, and each column presents the method of the enhanced image. By starting from the first column, the original, the images were enhanced with CLAHE [3], scaling [9], ETHE [10], IETK [11], LCA [8], and the proposed method, respectively. In Figure 7, CLAHE images increase the contrast of the original images, yet they seem slightly darker. Although the scaling technique results in similar unacceptable percentage numbers to the proposed method, they differ when compared visually. The scaling technique leads to good quality in color brightness and color balance, but the contrast grades are low, whereas the proposed method provides better contrast. ETHE enhances a good contrast as the vessels separated clearly from the other parts; however, it led to unnatural color in the retinal image. IETK gives the brightest and most colorful result so that the vessels are easy to spot as they are in red color, which is different than those in the aforementioned three methods with brownish vessel color. LCA also gives good contrast and overall brightness result with a brownish tone but is less colorful. However, a great colorfulness does not imply to be most suitable for this kind of image as other factors such as the overall brightness and color balance in the RGB channels are also important. The proposed method results in good contrast, brightness, color balance, and colorfulness, yet it also maintains the overall brightness and brightness ratio between red, green, and blue compared to the standard. The blood vessels are easy to diagnose as it is in desired red color.
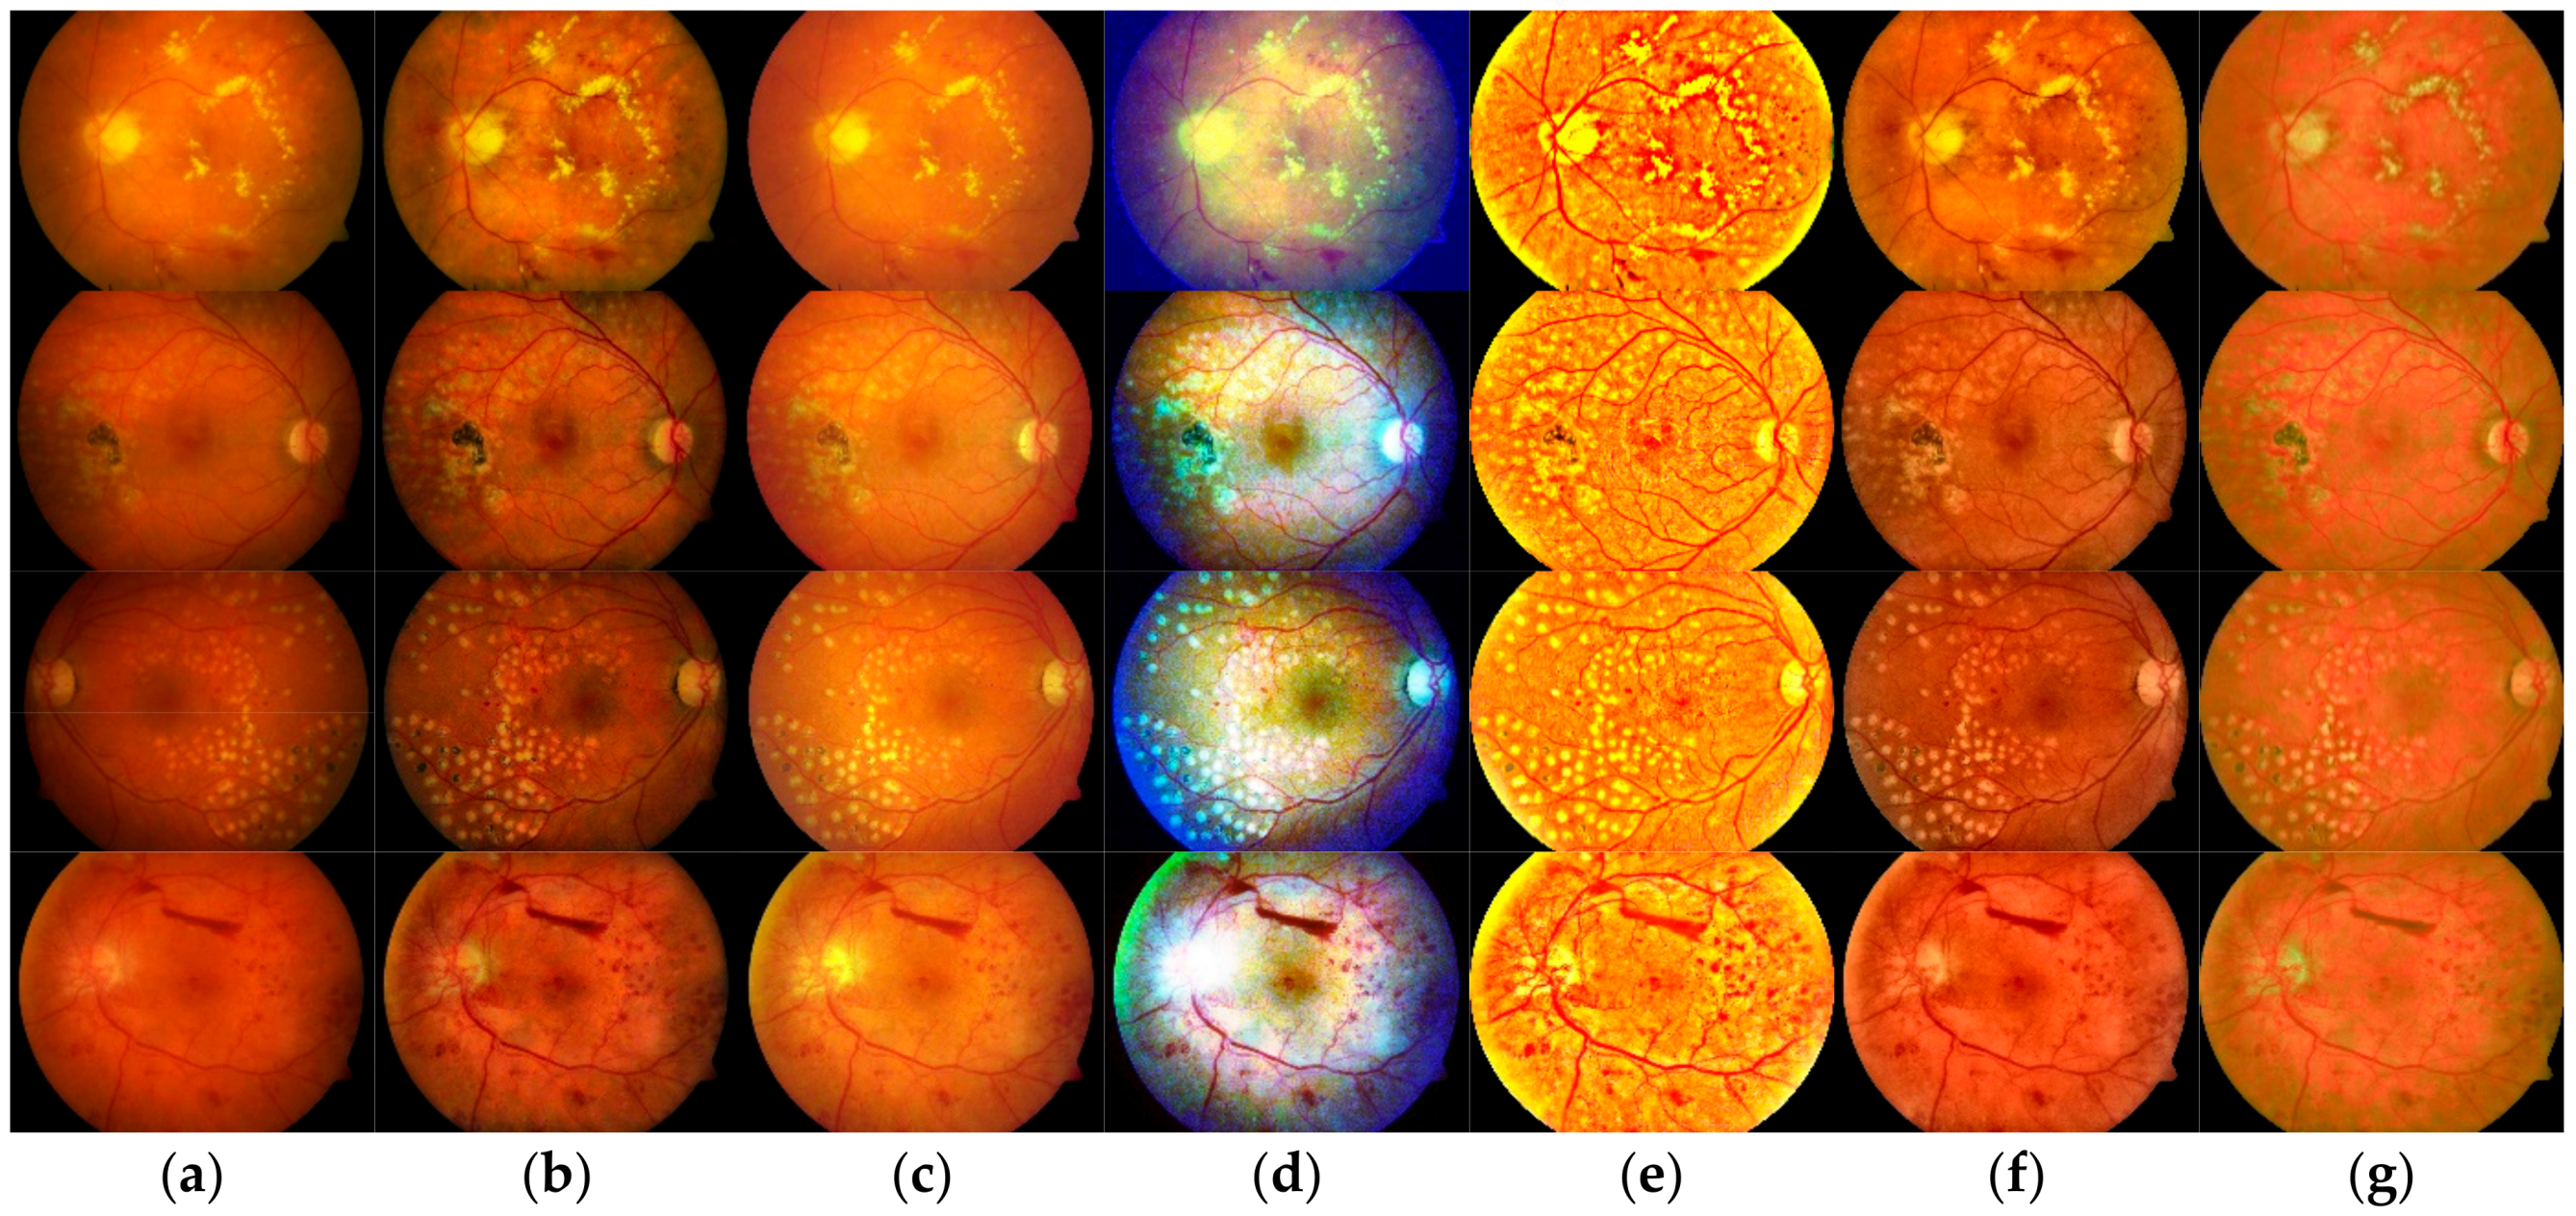
Figure 8 depicts abnormal lesions such as hard or soft exudates and hemorrhages. ETHE and IETK produce high saturation so that it might overexpose the information of those lesions as shown in Figure 8d,e, where exudate lesions are too saturate and too bright to maintain the information, and some hemorrhages are eradicated unintentionally.
Bright areas such as the optic disc are depicted in Figure 9 and yellowish dots in Figure 10. The proposed method can provide a better brightness compared to the other methods where the proposed method suppresses the excess brightness, and the others exaggerate the brightness to overexpose the information inside the areas.
As supported by outcomes provided in Figure 7, Figure 8, Figure 9 as well as Table 1 and Table 2, the proposed method can enhance retinal fundus from different sources, resolutions, and exposures to the same standard as defined by Hubbard et al. It increases the brightness, contrast, and color balance of the output images while preserving the structural information and naturalness of the output images. Therefore, the proposed method is suitable for enhancing images used in AMD screening.
4. Conclusions
In this paper, the proposed method enhances retinal fundus images by employing CLAHE and adjusting color coordinate techniques. Input images are adjusted to the specified color model used to diagnose AMD lesions. It enhances the local contrast yet preserves the color naturalness of the output image. The method was experimented on with retinal images from DiaretDB0 and STARE datasets. It improved the image quality, as shown in the experiment results. The proposed method could significantly reduce unsatisfactory images in all four undesirable types (red over-saturation, marked under illumination, weak green/strong red, and excessive blue). The reduction rate approached 0% while some of the compared methods reduced only some types, and others even increased dissatisfaction in some undesirable types. The proposed method could also preserve structural information and color naturalness to a greater extent than the other compared methods, as shown in Figure 6.
This paper focused only on the improved image quality. In future research, we plan to extend the proposed enhancement to a comparative study of automatic medical image classification. In a preprocessing step, we aim for the technique that yields a higher success result percentage, as suggested by Vetova (2021) [28]. The future comparative study could be settled between a proposed neural network algorithm from an improved neural network algorithm for remote sensing image classification [29] and a convolution neural network with a fuzzy c-mean model used with MR brain images [30].
Lastly, we also plan to extend the quality improvement of retinal images to oRGB color space. As the oRGB claims to be a true opponent color space since the angle between the red and green opponent completes 180°, whereas the angle between the color red and green of the CIE L*a*b* is more narrow. With such property, we estimate that the output would be ameliorated in terms of contrast, color balance, and color saturation.
Author Contributions
Conceptualization, S.I.; methodology, J.D.; software, J.D.; validation, J.D., S.I. and S.K.; formal analysis, S.I.; investigation, J.D.; resources, J.D.; data curation, S.K.; writing—original draft preparation, J.D.; writing—review and editing, S.K.; visualization, J.D. and S.I.; supervision, S.I. All authors have read and agreed to the published version of the manuscript.
Funding
This work was supported by the Faculty of Science Research Fund, Prince of Songkla University, Contract no. 2-2561-02-017.
Institutional Review Board Statement
Not applicable.
Informed Consent Statement
Not applicable.
Data Availability Statement
Not applicable.
Conflicts of Interest
The authors declare that there is no conflict of interest regarding the publication of this paper.
Remark
The article was orally selected at the 25th International Conference on Circuits, Systems, Communications, and Computer (CSCC2021).
References
- Wong, W.L.; Su, X.; Li, X.; Cheung, C.M.; Klein, R.; Cheng, C.; Ronald, K.; Cheng, C.; Wong, T.Y. Global prevalence of age-related macular degeneration and disease burden projection for 2020 and 2040: A systematic review and meta-analysis. Lancet Glob. Health 2014, 2, 106–116. [Google Scholar] [CrossRef] [Green Version]
- Hubbard, L.D. Digital Color Fundus Image Quality: The Impact of Tonal Resolution. J. Ophthalmic. Photogr. 2009, 31, 15–20. Available online: http://www.opsweb.org/?page=crareference (accessed on 16 June 2015).
- Zuiderveld, K. Contrast Limited Adaptive Histograph Equalization. In Graphics Gems IV; Academic Press Professional: San Diego, CA, USA, 1994; pp. 474–485. [Google Scholar]
- Cheng, H.D.; Shi, X.J. A simple and effective histogram equalization approach to image enhancement. Digit. Signal Process. 2004, 14, 158–170. [Google Scholar] [CrossRef]
- Pizer, M.S.; Amburn, E.P.; Austin, D.J. Adaptive Histogram Equalization and Its Variations. Comput. Vis. Graph. Image 1987, 39, 355–368. [Google Scholar] [CrossRef]
- Sawssen, B.; Okba, T.; Noureeddine, L. A mammographic images classification technique via the Gaussian Radial Basis Kernel ELM and KPCA. Int. J. Appl. Math. 2020, 2, 92–98. [Google Scholar]
- Jin, K.; Zhou, M.; Wang, S.; Lou, L.; Xu, Y.; Qian, D. Computer-aided diagnosis based on enhancement of degraded fundus photographs. Acta Ophthalmol. 2018, 96, 320–326. [Google Scholar] [CrossRef] [Green Version]
- Zhou, M.; Jin, K.; Wang, S.; Ye, J.; Qian, D. Color Retinal Image Enhancement Based on Luminosity and Contrast Adjustment. IEEE Rev. Biomed. Eng. 2017, 65, 521–527. [Google Scholar] [CrossRef] [PubMed]
- Tsikata, E.; Laíns, I.; Gil, J.; Marques, M.; Brown, K.; Mesquita, T.; Melo, P.; Cachulo, M.D.L.; Kim, I.; Vavvas, D.; et al. Automated Brightness and Contrast Adjustment of Color Fundus Photographs for the Grading of Age-Related Macular Degeneration. Transl. Vis. Sci. Technol. 2017, 6, 3. [Google Scholar] [CrossRef] [Green Version]
- Kandpal, A.; Jain, N. Retinal Image Enhancement Using Edge-based Texture Histogram Equalization. In Proceedings of the International Conference on Signal Processing and Integrated Networks, Noida, India, 27–28 February 2020. [Google Scholar]
- Gaudio, A.; Smailagic, A.; Campilho, A. Enhancement of Retinal Fundus Images via Pixel Color Amplification. In Proceedings of the 17th International Conference, ICIAR 2020, Póvoa de Varzim, Portugal, 24–26 June 2020. [Google Scholar] [CrossRef]
- Cao, L.; Zhang, Y. Retinal image enhancement using low-pass filtering and α-rooting. Signal Process. 2020, 170, 107445. [Google Scholar] [CrossRef]
- Bala, A.A.; Priya, A.P.; Maik, V. Retinal image enhancement using adaptive histogram equalization tuned with nonsimilar grouping curvelet. Int. J. Imaging Syst. Technol. 2021, 31, 1050–1064. [Google Scholar] [CrossRef]
- Ghosh, S.K.; Biswas, B.; Ghosh, A. A novel Approach of Retinal Image Enhancement using PSO System and Measure of Fuzziness. Proc. Comput. Sci. 2020, 167, 1300–1311. [Google Scholar] [CrossRef]
- Cao, L.; Li, H. Enhancement of blurry retinal image based on non-uniform contrast stretching and intensity transfer. Med. Biol. Eng. Comput. 2020, 58, 483–496. [Google Scholar] [CrossRef]
- Wang, J.; Li, Y.-J.; Yang, K.-F. Retinal fundus image enhancement with image decomposition and visual adaptation. Comput. Biol. Med. 2021, 128, 104116. [Google Scholar] [CrossRef] [PubMed]
- Hubbard, L.D.; Danis, R.P.; Neider, M.W.; Thayer, D.W.; Wabers, H.D.; White, J.K.; Pugliese, A.J.; Pugliese, M.F. Contrast, and Color Balance of Digital versus Film Retinal Images in the Age-Related Eye Disease Study 2. Investig. Ophthalmol. Vis. Sci. 2008, 49, 3269–3282. [Google Scholar] [CrossRef] [Green Version]
- Matkovic, K.; Neumann, L.; Neumann, A.; Psik, T.; Purgathofer, W. Global contrast factor—A new approach to image contrast. In Proceedings of the First Eurographics conference on Computational Aesthetics in Graphics, Visualization and Imaging, Girona, Spain, 18 May 2005. [Google Scholar]
- Hasler, D.; Susstrunk, S. Measuring colorfulness in natural images. Proc. SPIE 2003, 5007, 87–95. [Google Scholar]
- Wang, S.; Zheng, J.; Hu, H.; Li, B. Naturalness preserved enhancement algorithm for non-uniform illumination images. Trans. Image Process. 2013, 22, 60–70. [Google Scholar] [CrossRef]
- Kolaman, A.; Pecht, O. Quaternion Structural Similarity a New Quality Index for Color Images. IEEE Trans. Image Process. 2012, 21, 1526–1536. [Google Scholar] [CrossRef]
- Kauppi, T.; Kalesnykiene, V.; Kammarainen, J.K.; Lensu, L.; Sorri, L.; Uusitalo, H.; Kalviainen, H. DIARETDB0: Evaluation Database and Methodology for Diabetic Retinopathy Algorithms; Technical Report; Lappeenranta University of Technology: Lappeenranta, Finland, 2006. [Google Scholar]
- Hoover, A.; Kouznetsova, V.; Goldbaum, M. Locationg blood vessels in retinal images by piecewise threshold probing of a matched filter response. IEEE Trans. Med. Imag. 2000, 19, 203–210. [Google Scholar] [CrossRef] [PubMed] [Green Version]
- Hunt, R.W.G.; Pointer, M.R. Measuring Colour, 4th ed.; John Wiley & Sons Ltd.: Chennai, India, 2011. [Google Scholar]
- Setiawan, A.W.; Mengko, T.R.; Santoso, O.S. Color Retinal Image Enhancement using CLAHE. In Proceedings of the ICISS International Conference, Jakarta, Indonesia, 13–14 June 2013. [Google Scholar]
- Jintasuttisak, T.; Intajag, S. Color Retinal Image Enhancement by Rayleigh Contrast-Limited Adaptive Histogram Equalization. In Proceedings of the 14th International Conference on Control, Automation and Systems (ICCAS 2014), Gyeonggi-do, Korea, 22–25 October 2014. [Google Scholar]
- Pratt, W.K. Digital Image Processing, 4th ed.; John Wiley & Sons, Inc.: Hoboken, NJ, USA, 2007. [Google Scholar]
- Vetova, S. A Comparative Study of Image Classification Models using NN and Similarity Distance. Int. J. Electr. Eng. Comput. Sci. (EEACS) 2021, 3, 109–113. [Google Scholar]
- Zhao, L. An Improved Neural Network Algorithm for Remote Sensing Image Classification. Int. J. Circuits 2020, 14, 1034–1039. [Google Scholar]
- Isselmou, A.; Xu, G.; Shuai, Z.; Saminu, S.; Javaid, I.; Ahmad, I. Brain Tumor identification by Convolution Neural Network with Fuzzy C-mean Model Using MR Brain Images. Int. J. Circuits 2020, 14, 1096–1102. [Google Scholar]
Figure 1.
ROI retinal image. (a) original image; (b) ROI mask; (c) after removing background.

Figure 2.
Probability density function of shape parameters with the mean values of L*, a*, and b* color components.
Figure 2.
Probability density function of shape parameters with the mean values of L*, a*, and b* color components.

Figure 3.
L*, a*, and b* components (from top to bottom) operated by CLAHE with tile-size 32 × 32 in the first column, and the second column operated by tile-size, 8 × 8; both columns use clip-limit values equal to 0.01, 0.005, and 0.01 for L*, a*, and b* components, respectively.
Figure 3.
L*, a*, and b* components (from top to bottom) operated by CLAHE with tile-size 32 × 32 in the first column, and the second column operated by tile-size, 8 × 8; both columns use clip-limit values equal to 0.01, 0.005, and 0.01 for L*, a*, and b* components, respectively.

Figure 4.
(a) original image; (b) image adjusted with tile-size 32 × 32, 8 × 8, 32 × 32, clip-limit 0.01, 0.005, 0.01; (c) image adjusted with tile-size 16 × 16, 4 × 4, 16 × 16; (d) image adjusted with tile-size 64×64, 16 × 16, 64 × 64; (e) image adjusted with clip-limit 0.005, 0.002, 0.005; (f) image adjusted with clip-limit 0.02, 0.01, 0.02.

Figure 5.
The effect of scale parameter in Equation (8). (a) 5σ; (b) 6σ; (c) 7σ.

Figure 6.
Performance of various methods on DiaretDB0 and STARE database.

Figure 7.
The result of enhancement by different methods for 4 images (rows) from DiaretDB0 dataset. The columns represent (a) original, and outcome images are enhanced by (b) CLAHE, (c) scaling, (d) ETHE, (e) IETK, (f) LCA, and (g) proposed methods.
Figure 7.
The result of enhancement by different methods for 4 images (rows) from DiaretDB0 dataset. The columns represent (a) original, and outcome images are enhanced by (b) CLAHE, (c) scaling, (d) ETHE, (e) IETK, (f) LCA, and (g) proposed methods.

Figure 8.
The result of enhancement by different methods for 4 images (rows) from DiaretDB0 dataset. The columns represent (a) original, and outcome images are enhanced by (b) CLAHE, (c) scaling, (d) ETHE, (e) IETK, (f) LCA, and (g) proposed methods.
Figure 8.
The result of enhancement by different methods for 4 images (rows) from DiaretDB0 dataset. The columns represent (a) original, and outcome images are enhanced by (b) CLAHE, (c) scaling, (d) ETHE, (e) IETK, (f) LCA, and (g) proposed methods.

Figure 9.
The result of enhancement by different methods for 4 images (rows) from STARE dataset. The columns represent (a) original, and outcome images are enhanced by (b) CLAHE, (c) scaling, (d) ETHE, (e) IETK, (f) LCA, and (g) proposed methods.
Figure 9.
The result of enhancement by different methods for 4 images (rows) from STARE dataset. The columns represent (a) original, and outcome images are enhanced by (b) CLAHE, (c) scaling, (d) ETHE, (e) IETK, (f) LCA, and (g) proposed methods.

Figure 10.
The result of enhancement by different methods for 4 images (rows) from STARE dataset. The columns represent (a) original, and outcome images are enhanced by (b) CLAHE, (c) scaling, (d) ETHE, (e) IETK, (f) LCA, and (g) proposed methods.
Figure 10.
The result of enhancement by different methods for 4 images (rows) from STARE dataset. The columns represent (a) original, and outcome images are enhanced by (b) CLAHE, (c) scaling, (d) ETHE, (e) IETK, (f) LCA, and (g) proposed methods.


Table 1.
Percentage of unacceptable images before and after enhancement.
| CLAHE | Scaling | ETHE | IETK | LCA | Proposed | |||
|---|---|---|---|---|---|---|---|---|
| Undesirable Type | Dataset | Before | After | |||||
| Red Over saturation | DiaretDB0 | 0.77 | 0 | 0 | 0 | 100 | 5.38 | 0 |
| STARE | 47.10 | 9.07 | 0.25 | 23.17 | 100 | 77.58 | 0 | |
| Marked Under Illumination | DiaretDB0 | 20.77 | 11.54 | 0 | 0 | 0 | 0.77 | 0 |
| STARE | 1.51 | 2.52 | 0 | 0 | 0 | 0 | 0 | |
| Weak green/Strong red | DiaretDB0 | 48.46 | 20.00 | 0 | 0 | 0 | 26.92 | 0 |
| STARE | 8.82 | 5.29 | 0 | 0 | 0 | 6.05 | 0 | |
| Excessive blue | DiaretDB0 | 0 | 3.85 | 0 | 100 | 0.77 | 3.08 | 0 |
| STARE | 28.21 | 35.26 | 0 | 97.98 | 27.96 | 34.26 | 0 | |
Table 2.
Statistical information of images in DiaretDB0 and STARE database before and after enhancement.
Table 2.
Statistical information of images in DiaretDB0 and STARE database before and after enhancement.
| Features | Channel | DiaretDB0 | STARE | ||
|---|---|---|---|---|---|
| Original Image Mean ± SD [Min–Max] | Enhanced Image Mean ± SD [Min–Max] | Original Image Mean ± SD [Min–Max] | Enhanced Image Mean ± SD [Min–Max] | ||
| Brightness | Red | 122.800 ± 28.300 [59.900–186.300] | 192.000 ± 0.100 [191.500–192.200] | 183.700 ± 34.700 [79.100–244.500] | 191.900 ± 0.200 [191.300–192.300] |
| Green | 49.800 ± 13.400 [22.200–91.500] | 95.200 ± 0.100 [94.800–95.300] | 99.000 ± 25.200 [38.300–185.600] | 95.000 ± 0.200 [94.400–95.400] | |
| Blue | 11.700 ± 7.200 [0.300–40.3] | 31.700 ± 0.100 [31.500–32.000] | 34.700 ± 23.400 [1.000–199.700] | 32.000 ± 0.200 [31.400–32.500] | |
| Color Balance | Green/Red | 0.408 ± 0.062 [0.283–0.556] | 0.496 ± 0.000 [0.494–0.497] | 0.545 ± 0.122 [0.224–1.113] | 0.495 ± 0.001 [0.493–0.498] |
| Blue/Red | 0.097 ± 0.054 [0.002–0.243] | 0.165 ± 0.000 [0.164–0.167] | 0.202 ± 0.146 [0.004–1.197] | 0.167 ± 0.001 [0.163–0.170] | |
Publisher’s Note: MDPI stays neutral with regard to jurisdictional claims in published maps and institutional affiliations. |
© 2021 by the authors. Licensee MDPI, Basel, Switzerland. This article is an open access article distributed under the terms and conditions of the Creative Commons Attribution (CC BY) license (https://creativecommons.org/licenses/by/4.0/).
Share and Cite
MDPI and ACS Style
Dissopa, J.; Kansomkeat, S.; Intajag, S. Enhance Contrast and Balance Color of Retinal Image. Symmetry 2021, 13, 2089. https://0-doi-org.brum.beds.ac.uk/10.3390/sym13112089
AMA Style
Dissopa J, Kansomkeat S, Intajag S. Enhance Contrast and Balance Color of Retinal Image. Symmetry. 2021; 13(11):2089. https://0-doi-org.brum.beds.ac.uk/10.3390/sym13112089
Chicago/Turabian StyleDissopa, Jessada, Supaporn Kansomkeat, and Sathit Intajag. 2021. "Enhance Contrast and Balance Color of Retinal Image" Symmetry 13, no. 11: 2089. https://0-doi-org.brum.beds.ac.uk/10.3390/sym13112089
Note that from the first issue of 2016, this journal uses article numbers instead of page numbers. See further details here.