
Brain Immunoinformatics: A Symmetrical Link between Informatics, Wet Lab and the Clinic
by
 , ,
, ,
Ismini Papageorgiou
1,2,* ,
,
Daniel Bittner
3,
Marios Nikos Psychogios
4 and
Stathis Hadjidemetriou
5 1
Institute of Diagnostic and Interventional Radiology, Jena University Hospital–Friedrich Schiller University Jena, Am Klinikum 1, 07747 Jena, Germany
2
Institute of Radiology, Suedharz Hospital Nordhausen, Dr.-Robert-Koch-Str. 39, 99734 Nordhausen, Germany
3
Department of Neurology, Suedharz Hospital Nordhausen, Dr.-Robert-Koch-Str. 39, 99734 Nordhausen, Germany
4
Diagnostic and Interventional Neuroradiology, University Hospital Basel, Petersgraben 4, CH-4031 Basel, Switzerland
5
Applied Computer Science, Cyprus International Institute of Management, Akadimias Avenue 21, Nicosia 2107, Cyprus
*
Author to whom correspondence should be addressed.
Symmetry 2021, 13(11), 2168; https://0-doi-org.brum.beds.ac.uk/10.3390/sym13112168
Submission received: 14 October 2021
/
Revised: 2 November 2021
/
Accepted: 5 November 2021
/
Published: 12 November 2021
(This article belongs to the Section Life Sciences)
Abstract
:Breakthrough advances in informatics over the last decade have thoroughly influenced the field of immunology. The intermingling of machine learning with wet lab applications and clinical results has hatched the newly defined immunoinformatics society. Immunoinformatics of the central neural system, referred to as neuroimmunoinformatics (NII), investigates symmetrical and asymmetrical interactions of the brain-immune interface. This interdisciplinary overview on NII is addressed to bioscientists and computer scientists. We delineate the dominating trajectories and field-shaping achievements and elaborate on future directions using bridging language and terminology. Computation, varying from linear modeling to complex deep learning approaches, fuels neuroimmunology through three core directions. Firstly, by providing big-data analysis software for high-throughput methods such as next-generation sequencing and genome-wide association studies. Secondly, by designing models for the prediction of protein morphology, functions, and symmetrical and asymmetrical protein–protein interactions. Finally, NII boosts the output of quantitative pathology by enabling the automatization of tedious processes such as cell counting, tracing, and arbor analysis. The new classification of microglia, the brain’s innate immune cells, was an NII achievement. Deep sequencing classifies microglia in “sensotypes” to accurately describe the versatility of immune responses to physiological and pathological challenges, as well as to experimental conditions such as xenografting and organoids. NII approaches complex tasks in the brain-immune interface, recognizes patterns and allows for hypothesis-free predictions with ultimate targeted individualized treatment strategies, and personalizes disease prognosis and treatment response.
1. Introduction
Breakthrough advances in informatics have thoroughly shaped the field of immunology. The intermingling of machine learning applications with wet lab and clinical results, facilitated by the expanding marketing of user-friendly computer interfaces for lab scientists, has hatched the newly defined society of immunoinformatics. Immunoinformatics flourished in the last decade by detangling tumor immunology, predicting cancer epitopes, and sequencing the adaptive immune receptor repertoires, as has been widely reviewed previously [1,2].
In this review, the immunoinformatics of the central neural system (CNS) is referred to as neuroimmunoinformatics (NII). NII emerges as a minor subfield out of the broader immunoinformatics community, with outlined aims and purposes that diverge from the more established neuroinformatics field. In the latter, computational advances, including deep learning, engage in explaining, imitating, or predicting the output of neuronal networks towards the probability “to spike or not-to-spike” in symmetrical models, usually without encountering the role of parallel existing, asymmetrically intermingling cellular structures: the glial cells [3]. NII aims to bridge this gap by determining immunological tissue states using molecular and morphological information and associating immunology with physiological processes, developmental stages, and disease pathogenesis. The contribution of NII in exploring the brain-immune interface contributes to designing individualized treatment strategies, thus personalizing disease prognosis and treatment response.
One individuality of NII compared to classical immunoinformatics is the multifaceted, asymmetrical, and diverse profile of the CNS immune system. Microglial cells (MG), the main orchestrators of the innate immunity behind the blood-brain barrier, are dual receptors of both immunological signals and neuronal activity. This duality as immune and homeostatic cells perplexes the MG responses to diseases and expands the field of NII far beyond conventional immunological questions to embrace (patho-)genetic models of development, aging, degeneration, and synaptic transmission [4]. Another challenge confronting NII is the existence of the “blood-brain barrier”, optimally formulated as the “blood-brain selective communication”. An essential pharmacokinetic component in NII modeling is a complex epithelial barrier that modifies MG-lymphocyte communication, antigen presentation, cytokine diffusion kinetics, and surface receptor expression in a disease-selective manner.
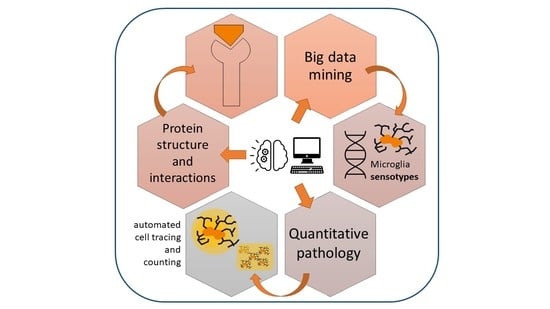
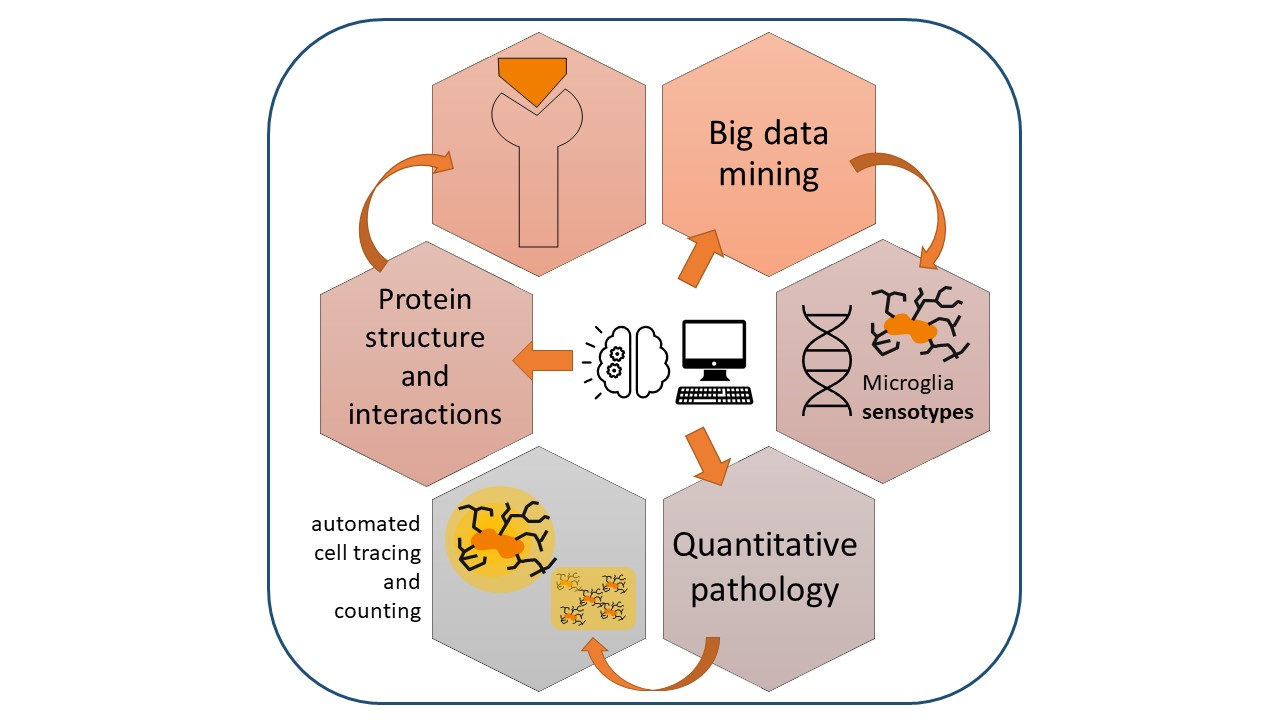
The aim of this review is to provide a balanced interdisciplinary overview of informatic approaches in the current NII research, its dominating trajectories, field-shaping achievements, and future directions. Computation, varying from statistical modeling to advanced deep learning approaches, fuels neuroimmunology through three core directions: (i) providing analysis software for high-throughput methods and big-data; (ii) designing deep learning models for automated analysis and prediction of symmetrical and asymmetrical protein morphology, functions, interactions and molecular mechanisms, and downstream pathways; and (iii) inspiring visualization tools of high-dimensional data that inspire associations and reveal higher-order symmetries of the brain function. Another non-amenable contribution of informatics with a crucial impact on globalization or research is the organization of public repositories and analysis platforms, which broaden the availability of multivendor data and rare material. Some indicative neuroimmunological databases are listed in this review (Table 1), and plenty of others can be retrieved from the cited literature. Interdisciplinary readability is supported by a glossary (Table 2).
2. Literature Search and Field Definition
Broad literature research in NII was conducted in PubMed using the following MeSH terms and modulations in several possible combinations: deep learning, artificial intelligence, machine learning, informatics, transcriptome [AND] Immunology, microglia, antibod*, complement, inflammation, immune cells, macrophages, lymphocytes [AND] brain, brain development, brain aging, epilepsy, brain tumor*, brain degeneration, dementia.
From a wealth of literature, we selected the most representative and impactful publications. All MeSH hits were evaluated for scientific rigor, editorial quality, journal reputation, and indexing status in consensus. Meticulous work was granted to select:
- Original publications and methods that contributed to breakthrough observations in the field (result-oriented selection approach), such as the TYROBP role in Alzheimer’s disease;
- Well-renowned public databases that set a new cornerstone for data science (data-driven approach);
- Outstanding longitudinal works that reshaped the doctrines of neuroimmunology in the last decade, such as the innovative classification of microglial cell activation and the development of image reconstruction tools (longitudinal approach).
The broadness of this review required the inclusion of a wide range of data, varying from in vitro to in vivo and in silico, deriving primarily from rats, mice, and human beings. With particular references to public databases, neuroimmunoinformatics allows for maximizing the usage and amplifying the impact of rare data, such as human databases of rare diseases. Unless explicitly stated, the laboratory research is based on rodent models.
This review includes a selection of current breakthrough methods, such as the deep learning implementation in immunological research on induced human Pluripotent Stem Cells (iPSC) organoids.
3. Big Data-Omics in Neuroimmunoinformatics
In the following sections, we summarize some machine-learning facilitated neuroimmunological achievements from the field of MG genomics. Detailed resources and technical details on available machine learning tools and platforms have been reviewed elsewhere [2,4,5,6,7,8]. This chapter is structured to illustrate genetic research in a top-down approach, from tissue-based to the single-cell or even subcellular level. A separate paragraph describes the influence of NII on epigenetics.
3.1. Genome-Wide Studies
Genome-Wide Transcriptional Profiling (GWTP) applies genome-wide transcriptomics to create hypothesis-free associations between genetic changes with disparate states of the immune system, hence constructing genotype-phenotype associations [6]. Although GWTP studies offer a precious substrate for data-driven research, the method is tissue-based and includes non-weighted information from various cell types. Machine learning powers the implementation of signature gene libraries, i.e., cell type-specific gene clusters, to infer single-cell profiles from GWTP tissue data, a process called “single-cell profile deconvolution”. Thus, using machine learning, deconvolution studies predict cell-specific profiles from GWTP big-data [9,10]. Some powerful deconvolution algorithms in immunoinformatics are CIBERSORT [11], trained on microarray data of immunological databases such as the Immunological Genome Project (ImmGen) [12], TIMER [13], and MCP counter [14], trained on RNA sequencing (RNA-seq) data. Both can predict immune cell populations in a tissue sample genome or transcriptome based on signature genes [1]. In recent original work, Elkjaer et al. used GWTP to describe lesion endophenotypes in the progressive type of multiple sclerosis. TGFβ-R2 was identified as a central hub, and deconvolution analysis revealed astrocytes as the cellular source of TGFβ-R2 in remyelinating lesions [15]. Deep sequencing and deconvolution studies showed an unexpected microglial transformation between normal white matter and active lesions. The marker CD26/DPP4 was expressed by microglia in the normal white matter and by mononuclear cells in active lesions, indicating that a unique subset of microglia transforms to mononuclear cells in the context of active multiple sclerosis lesions [15]. The authors emphasize the critical contribution of transcriptomics and deconvolution in endophenotyping and accentuate that gene expression should be interpreted in the context of different lesion types [15].
Despite recent controversies [16], Genome-Wide Association Studies (GWAS) [17] and Epigenome Wide Association studies (EWAS) [18] are established robust tools to infer genotype-phenotype associations and create risk-genome-clusters for diseases of interest, such as bipolar disorder [19]. The statistical methods of GWAS [20,21] and EWAS have massively profited by informatics developments, including the recent establishment of the EWAS2.0 software [22]. Deep learning expands the mining depth into big data and integrates regulatory effect predictions of single variants into a multivariate GWAS setting. Publicly available software resources, such as the DeepWAS [23] and the GenoWAP [24], are worth mentioning. Integration of single nucleotide polymorphisms (SNP), expression- and methylation-Quantitative Trait Loci (eQTL and meQTL) improved the identification of disease- or trait-relevant, transcriptionally active genomic loci for multiple sclerosis and major depressive disorder compared to GWAS alone [23]. Genetical polymorphism of the tumor necrosis factor alpha receptor 1 (TNFRSF1A gene) was associated with multiple sclerosis in genome-wide association studies. The same group linked the polymorphism of a negative regulator of NFkB (TNFAIP3 gene) to multiple sclerosis as well as other autoimmune diseases [25].
Next-generation sequencing, wide-genome-association, and epigenome-association, as well as whole-brain transcriptome studies assisted by informatics and deep learning applications, have constructed a robust scaffold to elucidate the biological complexity and re-classify the “reactive” profiles of brain macrophages, the MG cells, as comprehensively reviewed by Wes et al. [8]. The “omics-based” MG analysis, referred to as “microglial sensome” is a fundamental neuroimmunology achievement powered by deep learning technologies, discussed in detail in the dedicated Section 4.
3.2. Single-Cell Studies
Massively parallel RNA sequencing (RNA-seq) is a standard gene expression assay that interrogates relative transcript abundance and diversity. Deep learning and informatics approaches that enable the administration of RNA-seq big data, as well as online platforms and tutorials for RNA-seq, have been meticulously reviewed by Griffith et al. [5]. The Tuxedo suite is a cloud computing RNA-seq software available at rnaseq.wiki [5]. RNA-seq modalities include reference genome databases, quality control modalities, and detection of alternative splicing and splice variants with Cufflinks [5,26], or differential usage of exons using DEXSeq [27].
Single-cell genomics and single-cell RNA-seq (scRNA-seq) is a crucial study tool of the immunological repertoire. ScRNA-seq provides high-throughput and high-resolution data that enable an understanding of the single-cell fine-tuning, metabolic changes, lineage trajectories of lymphocytes via B-cell Receptor (BCR) and T-cell Receptor (TCR) characterization, and other details that are likely masked under the data volume of wide genome studies [7]. In a prototype study, Zhang et al. [28] purified eight different cell types from the mouse cortex, including microglia, other glial cells, neurons, and vascular elements, to construct scRNA-seq transcriptome databases and interrogate for cell-type enriched genes as well as splicing isoforms. Besides characterizing crucial metabolic and alternative spicing differences between the included cell populations, studies such as Zhang et al. [28] set a new trajectory in neuroimmunology and signalized the necessary shift from the classical morphological and immunohistochemical “low throughput” approaches towards high-throughput, informatics-assisted-omics.
Single-cell RNA-seq can be combined with Cytometry by Time of Flight (CyTOF). CyTOF is a hybrid method of mass spectrometry and flow cytometry, based on isotope reporters. Compared to conventional flow cytometry, CyTOF can offer a significantly increased cell marker number (up to 40 markers/cell), simultaneously analyzed. Cells are stained with antibodies conjugated to transition element isotopes and vaporized to ionization. Time of flight mass spectrometry reads the resulting elemental ions and can separate cells based on the targets’ expression. CyTOF requires tedious analysis using biaxial plots and Spearman associations (SPADE software, http://pengqiu.gatech.edu/software/SPADE/, accessed on 1 July 2021).
3.3. Expression Quantitative Trait Loci
Expression quantitative trait loci (eQTL) are chromosomal loci that explain the variance in expression traits of mRNA or a protein; eQTL analysis requires massively parallel RNA sequencing in the same sample, allowing for a real-time linking of the transcriptional profile and DNA–RNA interactions. Matrix-eQTL is an algorithm for eQTL analysis [6,29] compatible with R [30] and MATLAB (The Mathworks, Natick, CA, USA), which has been broadly applied in cancer research [31]. Combined genome-wide association studies (GWAS) with eQTL and SNP were used for defining the downstream regulatory effect of expression-modifying SNPs. Mirza et al. characterized epilepsy-associated hippocampal cis-eQTLs and associated them with samples of epileptic patients and febrile seizures, but not with other hippocampal pathologies such as Alzheimer’s disease and schizophrenia [32,33]. QTL studies have promoted research on human MG by enabling the characterization of sophisticated models such as the human monocyte-derived microglia-like cells for in vitro studies of degenerative diseases [34].
3.4. Epigenetics, ChIP-Seq, and ATAC-Seq
Epigenetic studies emphasize the sequencing of transcriptionally active DNA. Chromatin Immunoprecipitation and massively parallel DNA-seq constitute the ChIP-seq method, which precipitates histones and sequences the co-precipitated DNA. The Assay for Transposase-Accessible Chromatin using sequencing (ATAC-seq) method reveals the chromatin accessibility landscape in epigenetic studies [4]. Gene enhancers were classified according to the ChIP-seq method as “active”, “poised”, or “latent”/“repressed” [35], allowing for differential chromatin accessibility in homeostasis, development, and cancer. The ChIP-seq method has received particular interest in investigating immune memory in MG and macrophages (MΦ). Immune memory was determined to be an epigenetic event, defined by alterations at the expression levels of gene enhancers, i.e., latent gene enhancer activation and co-aggregating with MG lineage determining factors such as PU.1, SALL1, etc. [4]. Moreover, ChIP-seq studies have significantly contributed to isolating and studying T-helper cell subtypes, such as Th17 [36,37,38] and follicular T-helper cells [24,39].
Wheeler et al. implemented RNA-seq, ATAC-seq, and ChIP-seq to study the environmental effects in neurologic disorders. The herbicide “linuron” is an astrocytic pro-inflammatory stimulus that activates the signaling pathway of the sigma receptor 1, inositol-requiring enzyme-1α (IRE1α), and X-box binding protein 1 (XBP1). RNA-seq, ATAC-seq, and ChIP-seq analysis strongly associated IRE1α-XBP1 signaling with the murine model for multiple sclerosis [40].
A thorough synopsis of ChIP and ATACseq compatible software has been published by Kidd et al. [6].
4. Microglial “Next-Generation” Classification: From “Resting” to “Active”, to “Polarized”, to “De Novo Classified”
MG are antigen-presenting, macrophage-like cells of myeloid origin [41] that orchestrate the innate immunity core response on the “brain” side of the blood-brain barrier [42,43,44]. Due to their central role in immune CNS responses and their well-studied nature, MG are a significant attraction pole to neuroimmunologists [45]. Based on previous MΦ knowledge, pertaining attempts aim to associate morphology with function and correlate anatomical variants with immune activity under the established terms “resting” or “scavenging”, ramified cells, and “activated” or “ameboid” MG [46,47]. Sequencing and flow cytometry, as well as protein expression, allowed for a further sub-classification of “activated” MG to M1-inflammatory and M2-cytoprotective polarization [48], analogous to previous findings from the field of peripheral MΦ [49,50]. Recent technological advances in sequencing, including next-generation sequencing and other high-throughput methods, revealed new dimensions of the MG genome. Transcription and expression mechanisms could be studied both in-depth by scRNA-seq and in-width as part of a cell population in a tissue, in health and disease through GWAS [8]. Extensive sequencing data and dedicated computational approaches for meaningful analysis and visualization [6,7] have established a new era of data-driven experimental approaches and theory formulation, magnifying the efficacy of the conventional hypothesis-driven, wet-lab experimental designs. Hence, the current immunological field grows beyond the “resting”, “active”, and “polarized” microglial phenotypes to introduce the “de-novo classified” microglia. The new-established terms “sensome” and “sensotypes” have emerged to describe microglia-enriched genes as detected by the technologically expanding scRNA-seq [7]. The current deep cellular understanding abandons the theory of microglia-specific markers and moves towards microglia-enriched genome constellations, with a specificity dependent on the study tissue and its rest molecular signature [51]. Ongoing studies on microglial sensotypes can be registered in a central repository, the Glia Open Access Database [52]. Outstanding field reviews summarizing original breakthrough works are cited below [4,8,51,53,54].
Examples of Microglial Sensotypes
De-novo MG classification based on the transcriptional profile (RNA-seq) is a significant NII achievement. In contrast to the classical names “resting”, “surveying”, and “activated”, new emerging terms provide a more detailed functional description. Some of them are listed below:
- Homeostatic/resting sensotype or “sensing” MG: is the sensotype that differentiates MG from MΦ in the healthy brain, based on gene expression. Such differentiation is morphologically not possible. Transcripts such as Hexb, Tmem119, Siglech, P2ry12, and Olfm13 are unique to mice MG, distinguishing them from brain MΦ [4,28,55,56]. Cx3cr1 is a gene with strong MG expression, suggested as a signature gene for MG, despite controversies [57]. Micro-RNAs (miRNA) such as miRNA99a, miRNA125b-5p, and miRNA342-3p are expressed only in MG and not in other myeloid cells in murine models [57], whereas the fingerprint of human versus murine MG is still a challenging research terrain [58]. Evidence converges towards Tyrobp as an important sensing factor [56], PU.1 as the most decisive transcription factor, and TGFβ as the most robust lineage upstream stimulator of human MG [4,51].
- Induced human MG (iMG): informatics has supported stem-cell technology and provided tools to characterize iMG in vitro, either in an austere environment or in co-culture with h-iPSC organoids. Besides co-culture induced changes such as SIGLECH upregulation and Tmem119/Tyrobp downregulation, scRNA-seq technology allowed for spotting iMG sensome differences between ventral and dorsal h-iPSC organoids, with significant overexpression of inflammatory genes such as TNFa, IL6, and TREM2 in the ventral organoid iMG [62].
- Xenografted human MG (xMG) in mouse brain chimeras; Xu et al. applied scRNA-seq to sensotype xenografted human brain microglia in MG-depleted mouse brain chimeras [63]. The xMG sensome was evidenced to retain microglial (TMEM119, P2Ry12, SALL1, and OLFML3) and hominid (SPP1, A2M, and C3) traits as xenograft [58].
5. Machine Learning for Prediction of Protein, Cellular, and Network Interactions
Studying protein–protein interactions (PPI) is an essential research strategy in molecular biology, including neurobiology. However, screening for PPIs is a time- and resource-consuming process only performed by labs with the required capacity and equipment. Deep learning is a game-changer in PPI research because it allows for the assembling of molecular databanks, which can be screened for interactive domains in a cost-effective and less time-consuming way [64]. Despite the still low coverage and the low signal-to-noise ratio, computational methods conquer the position of the gold standard in screening, discovering new PPIs, and benchmarking experimental methods.
PPI deep learning methods profit from high-throughput sequencing to reconstruct the primary protein structure. Secondary and tertiary units in possible interaction are predicted based on amino-acid interaction databases [65,66,67,68,69]. Deep learning models, such as the suggested network by Hashemifar et al., predict protein-protein interactions, including homodimerizations, based on the amino-acid sequence alone [64].
5.1. Protein-Epitope Affinity Prediction, Cytokine-Receptor Interactions, and Epitope Prediction
Within the large field of PPIs and sequence-based neuroinformatics, the subfield of protein-epitope interactions is particularly attractive to CNS research. Within this large subcategory, cytokine-receptor interactions (CRI) epitomize a growing field in brain physiology, immunity, and immune-oncology. Numerous examples, such as the role of the CX3CL1-CX3CR1 axis in aging [70,71], synaptic pruning and social behavior [72,73], the role of inflammatory cytokines in depression [74], CCL5-CCR5 in the neurobiology of the glioblastoma multiforme [75], the SDF-1/CXCR4 axis in metastatic brain disease [76], as reviewed by Ransohoff et al. [77,78], should be mentioned. Neural networks can predict CRIs using deep autoencoders; classifiers such as the random forest and K-means have performed satisfactorily in previous research [79]. Deep learning approaches in CRI perpetuate the significance of public repositories. The classifier can be supplied with large databases for high-throughput and data-driven research, which would have been impossible with the available wet lab methods. An indicative list of public repositories that can be engaged in CRI research is provided in Table 1.
Besides exploring deep sequencing data for possible PPI/CRI, informatics can provide virtual benchmarks, exploiting the negative sample space in protein interactions. Nath et al. created a database of non-interacting protein pairs, to be used as a gold standard for benchmarking and standardizing the training of CRI-classifiers [80].
Deep learning as a PPI tool is increasingly implemented in epitope prediction after protein folding in secondary and tertiary structures. Liu et al. used deep learning to predict B-cell epitopes and developed a tool (http://ccb1.bmi.ac.cn:81/dlbepitope/) (accessed on 1 July 2021) to be used in adjunction with the IEDB database (Table 1) [81]. The authors used a four-layered network (DLBEpitope) to define the optimal peptide length necessary for accurate epitope prediction of the folded protein, hence offering an epitope-prediction solution and computational economy to the user. Similar developments were noted in the field of epitope-HLA interaction prediction. The SYFPEITHI tool (http://www.syfpeithi.de/bin/MHCServer.dll/EpitopePrediction.htm, accessed on 1 July 2021) predicts the ligation strength of an amino-acid sequence to a defined HLA type [82]. Another promising recurrent neural network was published under the abbreviation “MARIA” by Chen et al. MARIA predicts an epitope’s probability to elicit a strong CD4+ T-cell response with an AUC of approximately 0.9 [83]. Similar software solutions for the prediction of HLA-class-I and HLA-class-II B- and T-cell repertoires are of particular relevance in the field of vaccine design and have been extensively reviewed elsewhere [84,85,86].
5.2. Cell-Cell Interactions and Multiscale Network Modeling
Besides the classical computational neuroscience models integrating pure neuronal circuits [87], machine learning applications are increasingly implemented in studying neuron-glia interactions. Nakae et al. [88] introduce a paradigm of linear modeling to predict neuron-astrocyte interactions using calcium signaling. Transferring this model to the context of NII, a challenging approach would integrate MG to build a three-compartment network model based on the two-compartment Nakae et al. model. Hampered by the lack of excitable membranes [89,90], MG is not accessible by fast signaling methodologies, field-potential electrophysiology, or calcium imaging. While it is known that MG membranes are rich in voltage-, stretch-, or ligand-gated ion channels that tune homeostatic and reactive functions, this type of channel activity is only measurable by single-cell low-throughput methods, such as patch-clamp recording. Therefore, the lack of electrophysiological high-throughput data hampers MG integration into multiscale network modeling [89]. Alternative methodological approaches such as tomato-lectin staining and two-photon in vivo imaging [91,92,93] can infer functional changes and provide material for data-driven hypotheses, especially when combined with deep sequencing methods. Simultaneous gene regulatory network reconstruction from scRNA-seq data such as SCENIC [94] could provide a scaffold for multiscale network models and open new research paths. To our current knowledge, integrating microglial activity in a multimodal gene network context [95] remains an open challenge in neuroimmunoinformatics.
5.3. Probabilistic and Causal Gene Regulatory Networks
Integration of large-scale public datasets with large-scale -omics (e.g., genomic data from whole-genome sequencing and transcriptional data) and implementation of Bayesian statistics can conclude causal inferences on the immunological basis of diseases [6]. As a widely recognized contribution, the association of TYROBP as a key driver gene to sporadic Alzheimer’s disease was discovered by probabilistic causal network models [96,97]. Despite the broad dynamic of gene regulatory networks in illuminating gene-disease associations, possible pitfalls call for critical interpretation. Regulatory networks are usually cross-sectional studies with a considerable variety of different time points of the disease of interest, which might be a significant confounding factor. Large sample sizes and critical result interpretation should compensate for misconceptions, and cohort studies should opt for different time points of the disease.
6. Machine Learning in Neuropathology and Immunoprofiling
Artificial intelligence applications are gaining popularity in pathology because they bear the attractive potential to overwhelm the rate-limiting step of human processing: the low throughput. Deep learning-based immunopathology takes advantage of high-throughput data from digital pathology [98,99,100,101]. Both supervised and unsupervised machine learning applications are implemented in immunoneuropathology for different purposes [102] and claim improvements in the reading time as well as solutions to subjectivity problems such as the inter-reader variability.
Cell classification from peripheral blood samples is an established computational field with many competing applications. Kutlu et al. compared recurrent convolutional neuronal networks for the white blood cell classification from peripheral blood samples, finding a superior performance of Res-Net [103]. Beyond peripheral blood samples, deep learning algorithms can cope with the complexity of tissues and challenge not only the manual histological semiquantitative imaging, but also older methods of unbiased cell counting [104].
6.1. Microglial Segmentation and Counting
In contrast to peripheral blood cells, MG should be segmented from a noisy background [105]. The highly ramified MG structure [90], described as lacunarity and fractal dimension in the technical language of applied mathematics and image analysis, is at the same time a good indicator of the microglial activation status and a technical challenge for computer vision in immunopathology [106,107]. Previous attempts to automatically segment MG have reached a detection accuracy from 80–90%, facing, however, the problem of false negatives due to cell overlapping, texture variabilities, noisy background, and staining inhomogeneities that prohibit the success of standard thresholding models [105,108,109].
Liu et al. circumvented the bottleneck of manual histological image analysis of arborized cells by an unsupervised machine learning pipeline for the high throughput counting of MG and astrocytes [110]. The pipeline improved the analysis time 200 times using an Opera Phenix High Content Screening (PerkinElmer Inc., Hamburg, Germany) high-throughput imaging input. PhenoLOGIC (Phenologic, MI, USA) computer vision is a training image set utilizing supervised machine learning to differentiate background from tissue, integrated by the Harmony High Content Imaging and Analysis software (PerkinElmer), which segmented MG by intensity thresholding. The suggested pipeline for automated image analysis provides the total Iba1 brain coverage and extends the analysis to other cellular compartments, such as astrocytes (GFAP and AQP4). Most false-negative results were derived due to inhomogeneities in staining intensity, thus confirming previous observations from independent groups that staining intensity fluctuations are a significant burden for artificial intelligence methods in cell counting [105,109].
Unbiased stereology is an established statistical model for predicting the density of geometrical structures in space (e.g., cells, cellular processes or arbors, synapses, particles) based on randomized cell counting from thick tissue slices. Stereology has contributed to significant advances in the field of neuroimmunology, bridging immune reactions with cognition [111], dementia [112], and epilepsy [47], among others. Mouton et al. [113] performed a longitudinal scientific work towards the automation of the software Stereologer® (SRC Biosciences, Tampa FL, USA), and suggested an Automated Segmentation Algorithm (ASA) for the deep learning stereology of immunostained neurons and MG in mouse neocortex. ASA is intended to work in a human-in-the-loop interactive pipeline to perform cell segmentation without a priori shape assumptions. Despite the increased shape-complexity of MG, ASA performed a better detection of MG than NeuN-stained neurons [113]. The primary software drawback was the spatial cell overlapping. ASA was subjected to improvements by the same group; Alahmari et al. introduced a next-generation unbiased stereology approach, the FAST-Stereology (Fully Automated Stereology Technology), in a model that improves ASA reading time and reliability for neuronal detection with less than 2% error [114]. The deep learning convolutional neuronal network U-net [115] is trained on a supervised mask for automated cell counts in the dissector field, thus boosting unbiased stereology with the multiplication power of deep learning. FAST was successfully tested for NeuN measurements in mouse neocortex slices and opened new frontiers for the measurement of more complex and challenging cell appearances, such as densely packed, ramified cells and fragmented branches of astroglia and MG.
Horvath et al. brought about improvements in the detection of ramified cells, influenced by the innovative work of Suleymanova et al. [116]. A deep convolutional neural network approach for astrocyte detection (made available in the software platform FindMyCells©, www.findmycells.org, accessed on 1 July 2021) outperformed classical methods such as ilastik© (https://www.ilastik.org/, accessed on 1 July 2021) and ImageJ© (https://imagej.nih.gov/ij/, accessed on 1 July 2021) in both accuracy and time performance. Compared to manual counts, FindMyCells did not underperform human intelligence in astrocyte counting. Challenging FindMyCells with MG counts and one-by-one by comparing FindMyCells with ASA- or FAST Stereology are open challenges in the field of automated quantitative neuroimmunopathology.
Beyond the field of cell detection and segmentation in statical images, immunoinformatics shapes the field of cell detection and cell tracking in video microscopy. Gregorio da Silva et al. [117] trained a network to detect leukocyte recruitment using intravital video microscopy in different contexts, including inflammatory models of the CNS. By setting their available code, the authors provide a valuable immunoinformatic tool to the field of inflammation research in models such as the experimental autoimmune encephalomyelitis [118].
6.2. Cell Arborization Analysis
Dendritic arborization, also known as dendritic branching, is the property of MG, neurons, astrocytes, and other cells, to form new dendritic trees and branches, which anatomically support the establishment of new contact points to their environment. While manual reconstructions of the cell bodies and arbors using standard tools such as Neurolucida® (MBF Bioscience, Williston, VT, USA) can provide clues on the brain immune status [47], they are extremely time-consuming. The urge for an errorless and time-effective automated arborization analysis of cell traces has two constituents: (i) automated cell tracing and (ii) systematic, unbiased quantitative arborization analysis.
Ascoli et al. extensively addressed the problem of a time-effective and objective arborization analysis. Introduced by Scorcioni et al. as the LM-tool and improved by Luisi et al. in the FARSIGHT tool, this standalone freeware platform offers a multiparametric quantitative arborization analysis using unsupervised co-clustering [119,120]. Lu et al. [121] developed the Scorcioni L-Measure by adding diffusion distance measure and harmonic analysis. Lu et al. identified hierarchical arborization in reconstructed cells and offered a valuable tool for creating hypothesis-free assumptions on microglia morphology and function. Available as the FARSIGHT standalone tool or packaged for MATLAB (MathWorks, Natick, MA, USA), Lu’s quantitative analysis is a powerful analysis tool, limited only by the availability of computational resources.
6.3. Automated Cell Arbor Tracing
Automated deep learning-based trace analysis copes with the demand for high-speed processing of reconstructed cells. Even though most automated trace analysis methods were inspired by and dedicated to neuronal arbors, there is an obvious shift towards glia research. MG arborization is associated with functionality. Glia populations are, compared to neurons, more numerous and densely packed, and the deduction of dynamical population trajectories requires the tracing and arborization analysis of large cell datasets, which is hugely time-consuming [47]. This scientific problem drives the design of automated tracing analysis algorithms. Megjhani et al. [122] performed large-scale automated microglial arborization analysis from confocal images. The algorithm is based on a sparse over-complete dictionary learning method and 3D-seeding. The authors feed automated traced cells to a harmonic co-clustering L-measure data analysis pipeline [120] to create cell clusters similar to the benchmark manual reconstructions. Megjhani’s results override the accuracy scores of previous methods [123,124], offering a 73% specificity and 95% sensitivity compared to the human benchmark.
6.4. End-to-End Solutions for Microglia Characterization: Interfaces for Implementation by Biologists and Non-Computer Scientists
The penetration of innovative tools depends on the simplicity and ease of use by non-informatic professionals, such as biologists, immunologists, and clinicians. Various study groups have promoted the necessity of automated end-to-end solutions with closed-loop intermediate states, available as standalone software independent of the ground programming language (Java, Python, C++, etc.).
Roysam et al. [125] compiled an end-to-end cell arborization analysis solution performing image registration, segmentation, tracing, and feature extraction in a single, PythonTM (https://www.python.org/, accessed on 1 July 2021) orchestrated pipeline. The Python-based tool integrates building blocks from different programming languages, including FARSIGHT (C++) and Fiji (Java). It incorporates a self-developed automated tracer based on seed points, with satisfactory results compared to the benchmark. The pipeline receives as input confocal microscope images and provides a detailed analysis of MG arborization in a region of interest as a final product.
The term “pattern prediction” describes cell function prediction based on cell morphology using mathematical modeling. Kyriazis et al. [126] suggest an end-to-end system for automatic characterization of Iba1 immunopositive MG using whole-slide imaging as input. The model focuses on analyzing MG in white matter and integrates a Support Vector Machine (SVM)-based white matter classifier. MG is reconstructed with Otsu’s multi-thresholding method, tackling the problem of varying staining intensity, which has been a drawback of previous models [105]. The leading indicators of microglial shape in the algorithm of Kyriazis et al. [126] are the box-fractal dimension and lacunarity, offering a sensitivity and specificity of 76% and 84% over the human standard of an experienced neuroscientist.
7. Conclusions
This interdisciplinary overview of informatic approaches in the current neuroimmunological research highlights the dominating trajectories and field-shaping achievements and elaborates on future directions. Computation, varying from linear modeling to multiplexed deep learning approaches, fuels neuroimmunology through three core directions: (i) providing analysis software for high-throughput methods and big-data such as next-generation sequencing and genome-wide association studies; (ii) designing deep learning models for automated analysis and prediction of symmetrical or asymmetrical protein morphology, functions, interactions, and molecular mechanisms; and (iii) boosting the output of quantitative neuroimmunopathology in terms of automated cell counting, tracing, and arbor analysis applications. Significant field achievements are set to intrigue the interest of both computer scientists and wet-lab scientists. Neuroimmunoinformatics is a promising environment in terms of individualized treatment strategies, personalization of disease prognosis, and treatment response, with a high potential to analyze the high throughput of asymmetrical processes and reveal higher-order symmetries and associations in the brain–immune interface.
Author Contributions
I.P., conceptualization, resources, writing original draft, project administration; D.B., project administration, text editing; M.N.P., project administration, software, text editing; S.H., supervision, validation, visualization, review, and editing. All authors have read and agreed to the published version of the manuscript.
Funding
This research received no specific grant from any funding agency in the public, commercial, or not-for-profit sectors.
Institutional Review Board Statement
Not applicable.
Informed Consent Statement
Not applicable.
Data Availability Statement
No original data applied.
Conflicts of Interest
The authors declare no competing financial interest.
References
- Hammerbacher, J.; Snyder, A. Informatics for cancer immunotherapy. Ann. Oncol. Off. J. Eur. Soc. Med. Oncol. 2017, 28, xii56–xii73. [Google Scholar] [CrossRef]
- Jabbari, P.; Rezaei, N. Artificial intelligence and immunotherapy. Expert Rev. Clin. Immunol. 2019, 15, 689–691. [Google Scholar] [CrossRef]
- Richards, B.A.; Lillicrap, T.P.; Beaudoin, P.; Bengio, Y.; Bogacz, R.; Christensen, A.; Clopath, C.; Costa, R.P.; de Berker, A.; Ganguli, S.; et al. A deep learning framework for neuroscience. Nat. Neurosci. 2019, 22, 1761–1770. [Google Scholar] [CrossRef]
- Yeh, H.; Ikezu, T. Transcriptional and Epigenetic Regulation of Microglia in Health and Disease. Trends Mol. Med. 2019, 25, 96–111. [Google Scholar] [CrossRef] [PubMed]
- Griffith, M.; Walker, J.R.; Spies, N.C.; Ainscough, B.J.; Griffith, O.L. Informatics for RNA Sequencing: A Web Resource for Analysis on the Cloud. PLoS Comput. Biol. 2015, 11, e1004393. [Google Scholar] [CrossRef] [Green Version]
- Kidd, B.A.; Peters, L.A.; Schadt, E.E.; Dudley, J.T. Unifying immunology with informatics and multiscale biology. Nat. Immunol. 2014, 15, 118–127. [Google Scholar] [CrossRef] [Green Version]
- Neu, K.E.; Tang, Q.; Wilson, P.C.; Khan, A.A. Single-Cell Genomics: Approaches and Utility in Immunology. Trends Immunol. 2017, 38, 140–149. [Google Scholar] [CrossRef] [PubMed] [Green Version]
- Wes, P.D.; Holtman, I.R.; Boddeke, E.W.G.M.; Möller, T.; Eggen, B.J.L. Next generation transcriptomics and genomics elucidate biological complexity of microglia in health and disease. Glia 2016, 64, 197–213. [Google Scholar] [CrossRef] [PubMed]
- Ahn, J.; Yuan, Y.; Parmigiani, G.; Suraokar, M.B.; Diao, L.; Wistuba, I.I.; Wang, W. DeMix: Deconvolution for mixed cancer transcriptomes using raw measured data. Bioinforma. Oxf. Engl. 2013, 29, 1865–1871. [Google Scholar] [CrossRef]
- Shen-Orr, S.S.; Tibshirani, R.; Khatri, P.; Bodian, D.L.; Staedtler, F.; Perry, N.M.; Hastie, T.; Sarwal, M.M.; Davis, M.M.; Butte, A.J. Cell type-specific gene expression differences in complex tissues. Nat. Methods 2010, 7, 287–289. [Google Scholar] [CrossRef]
- Newman, A.M.; Liu, C.L.; Green, M.R.; Gentles, A.J.; Feng, W.; Xu, Y.; Hoang, C.D.; Diehn, M.; Alizadeh, A.A. Robust enumeration of cell subsets from tissue expression profiles. Nat. Methods 2015, 12, 453–457. [Google Scholar] [CrossRef] [Green Version]
- Heng, T.S.P.; Painter, M.W. Immunological Genome Project Consortium, The Immunological Genome Project: Networks of gene expression in immune cells. Nat. Immunol. 2008, 9, 1091–1094. [Google Scholar] [CrossRef] [PubMed]
- Li, B.; Severson, E.; Pignon, J.C.; Zhao, H.; Li, T.; Novak, J.; Jiang, P.; Shen, H.; Aster, J.C.; Rodig, S.; et al. Comprehensive analyses of tumor immunity: Implications for cancer immunotherapy. Genome Biol. 2016, 17, 174. [Google Scholar] [CrossRef] [Green Version]
- Becht, E.; Giraldo, N.A.; Lacroix, L.; Buttard, B.; Elarouci, N.; Petitprez, F.; Selves, J.; Laurent-Puig, P.; Sautès-Fridman, C.; Fridman, W.H.; et al. Estimating the population abundance of tissue-infiltrating immune and stromal cell populations using gene expression. Genome Biol. 2016, 17, 218. [Google Scholar] [CrossRef] [PubMed]
- Elkjaer, M.L.; Frisch, T.; Reynolds, R.; Kacprowski, T.; Burton, M.; Kruse, T.A.; Thomassen, M.; Baumbach, J.; Illes, Z. Molecular signature of different lesion types in the brain white matter of patients with progressive multiple sclerosis. Acta Neuropathol. Commun. 2019, 7, 205. [Google Scholar] [CrossRef] [Green Version]
- Tam, V.; Patel, N.; Turcotte, M.; Bossé, Y.; Paré, G.; Meyre, D. Benefits and limitations of genome-wide association studies. Nat. Rev. Genet. 2019, 20, 467–484. [Google Scholar] [CrossRef] [PubMed]
- Dehghan, A. Genome-Wide Association Studies. Methods Mol. Biol. Clifton NJ 2018, 1793, 37–49. [Google Scholar] [CrossRef]
- Flanagan, J.M. Epigenome-wide association studies (EWAS): Past, present, and future. Methods Mol. Biol. Clifton NJ 2015, 1238, 51–63. [Google Scholar] [CrossRef]
- Stahl, E.A.; Breen, G.; Forstner, A.J.; McQuillin, A.; Ripke, S.; Trubetskoy, V.; Mattheisen, M.; Wang, Y.; Coleman, J.R.I.; Gaspar, H.A.; et al. Genome-wide association study identifies 30 Loci Associated with Bipolar Disorder. Nat. Genet. 2019, 51, 793–803. [Google Scholar] [CrossRef]
- Ball, R.D. Statistical analysis of genomic data. Methods Mol. Biol. Clifton NJ 2013, 1019, 171–192. [Google Scholar] [CrossRef]
- Hayes, B. Overview of Statistical Methods for Genome-Wide Association Studies (GWAS). Methods Mol. Biol. Clifton NJ 2013, 1019, 149–169. [Google Scholar] [CrossRef]
- Xu, J.; Zhao, L.; Liu, D.; Hu, S.; Song, X.; Li, J.; Lv, H.; Duan, L.; Zhang, M.; Jiang, Q.; et al. EWAS: Epigenome-wide association study software 2.0. Bioinforma. Oxf. Engl. 2018, 34, 2657–2658. [Google Scholar] [CrossRef]
- Arloth, J.; Eraslan, G.; Andlauer, T.F.M.; Martins, J.; Iurato, S.; Kühnel, B.; Waldenberger, M.; Frank, J.; Gold, R.; Hemmer, B.; et al. DeepWAS: Multivariate genotype-phenotype associations by directly integrating regulatory information using deep learning. PLoS Comput. Biol. 2020, 16, e1007616. [Google Scholar] [CrossRef] [Green Version]
- Lu, Q.; Yao, X.; Hu, Y.; Zhao, H. GenoWAP: GWAS signal prioritization through integrated analysis of genomic functional annotation. Bioinformatics 2016, 32, 542–548. [Google Scholar] [CrossRef]
- Hoffjan, S.; Okur, A.; Epplen, J.T.; Wieczorek, S.; Chan, A.; Akkad, D.A. Association of TNFAIP3 and TNFRSF1A variation with multiple sclerosis in a German case-control cohort. Int. J. Immunogenet. 2015, 42, 106–110. [Google Scholar] [CrossRef]
- Trapnell, C.; Roberts, A.; Goff, L.; Pertea, G.; Kim, D.; Kelley, D.R.; Pimentel, H.; Salzberg, S.L.; Rinn, J.L.; Pachter, L. Differential gene and transcript expression analysis of RNA-seq experiments with TopHat and Cufflinks. Nat. Protoc. 2012, 7, 562–578. [Google Scholar] [CrossRef] [Green Version]
- Anders, S.; Reyes, A.; Huber, W. Detecting differential usage of exons from RNA-seq data. Genome Res. 2012, 22, 2008–2017. [Google Scholar] [CrossRef] [PubMed]
- Zhang, Y.; Chen, K.; Sloan, S.A.; Bennett, M.L.; Scholze, A.R.; O’Keeffe, S.; Phatnani, H.P.; Guarnieri, P.; Caneda, C.; Ruderisch, N.; et al. An RNA-sequencing transcriptome and splicing database of glia, neurons, and vascular cells of the cerebral cortex. J. Neurosci. Off. J. Soc. Neurosci. 2014, 34, 11929–11947. [Google Scholar] [CrossRef] [PubMed]
- Shabalin, A.A. Matrix eQTL: Ultra fast eQTL analysis via large matrix operations. Bioinforma. Oxf. Engl. 2012, 28, 1353–1358. [Google Scholar] [CrossRef] [PubMed] [Green Version]
- R Development Core Team. A language and environment for statistical computing. In R Foundation for Statistical Computing; Vienna, Austria, 2021; Available online: http://www.R-project.org (accessed on 1 July 2021).
- Liu, Y.; Ye, Y.; Gong, J.; Han, L. Expression Quantitative Trait Loci (eQTL) Analysis in Cancer. Methods Mol. Biol. Clifton NJ 2020, 2082, 189–199. [Google Scholar] [CrossRef]
- Mirza, N.; Appleton, R.; Burn, S.; du Plessis, D.; Duncan, R.; Farah, J.O.; Feenstra, B.; Hviid, A.; Josan, V.; Mohanraj, R.; et al. Genetic regulation of gene expression in the epileptic human hippocampus. Hum. Mol. Genet. 2017, 26, 1759–1769. [Google Scholar] [CrossRef] [PubMed] [Green Version]
- Schulz, H.; Ruppert, A.K.; Herms, S.; Wolf, C.; Mirza-Schreiber, N.; Stegle, O.; Czamara, D.; Forstner, A.J.; Sivalingam, S.; Schoch, S.; et al. Genome-wide mapping of genetic determinants influencing DNA methylation and gene expression in human hippocampus. Nat. Commun. 2017, 8, 1511. [Google Scholar] [CrossRef] [PubMed] [Green Version]
- Ryan, K.J.; White, C.C.; Patel, K.; Xu, J.; Olah, M.; Replogle, J.M.; Frangieh, M.; Cimpean, M.; Winn, P.; McHenry, A.; et al. A human microglia-like cellular model for assessing the effects of neurodegenerative disease gene variants. Sci. Transl. Med. 2017, 9, 421. [Google Scholar] [CrossRef] [PubMed] [Green Version]
- Li, F.; Wan, M.; Zhang, B.; Peng, Y.; Zhou, Y.; Pi, C.; Xu, X.; Ye, L.; Zhou, X.; Zheng, L. Bivalent Histone Modifications and Development. Curr. Stem Cell Res. Ther. 2018, 13, 83–90. [Google Scholar] [CrossRef]
- Ciofani, M.; Madar, A.; Galan, C.; Sellars, M.; Mace, K.; Pauli, F.; Agarwal, A.; Huang, W.; Parkhurst, C.N.; Muratet, M.; et al. A validated regulatory network for Th17 cell specification. Cell 2012, 151, 289–303. [Google Scholar] [CrossRef] [Green Version]
- Dong, C. Targeting Th17 cells in immune diseases. Cell Res. 2014, 24, 901–903. [Google Scholar] [CrossRef] [Green Version]
- Miraldi, E.R.; Pokrovskii, M.; Watters, A.; Castro, D.M.; De Veaux, N.; Hall, J.A.; Lee, J.Y.; Ciofani, M.; Madar, A.; Carriero, N.; et al. Leveraging chromatin accessibility for transcriptional regulatory network inference in T Helper 17 Cells. Genome Res. 2019, 29, 449–463. [Google Scholar] [CrossRef] [Green Version]
- Lu, K.T.; Kanno, Y.; Cannons, J.L.; Handon, R.; Bible, P.; Elkahloun, A.G.; Anderson, S.M.; Wei, L.; Sun, H.; O’Shea, J.J.; et al. Functional and epigenetic studies reveal multistep differentiation and plasticity of in vitro-generated and in vivo-derived follicular T helper cells. Immunity 2011, 35, 622–632. [Google Scholar] [CrossRef] [Green Version]
- Wheeler, M.A.; Jaronen, M.; Covacu, R.; Zandee, S.E.J.; Scalisi, G.; Rothhammer, V.; Tjon, E.C.; Chao, C.C.; Kenison, J.E.; Blain, M.; et al. Environmental Control of Astrocyte Pathogenic Activities in CNS Inflammation. Cell 2019, 176, 581–596.e18. [Google Scholar] [CrossRef] [Green Version]
- Ginhoux, F.; Greter, M.; Leboeuf, M.; Nandi, S.; See, P.; Gokhan, S.; Mehler, M.F.; Conway, S.J.; Ng, L.G.; Stanley, E.R.; et al. Fate mapping analysis reveals that adult microglia derive from primitive macrophages. Science 2010, 330, 841–845. [Google Scholar] [CrossRef] [Green Version]
- Eggen, B.J.; Raj, D.; Hanisch, U.K.; Boddeke, H.W. Microglial phenotype and adaptation. J. Neuroimmune Pharmacol. 2013, 8, 807–823. [Google Scholar] [CrossRef] [PubMed]
- Hanisch, U.K.; Kettenmann, H. Microglia: Active sensor and versatile effector cells in the normal and pathologic brain. Nat. Neurosci. 2007, 10, 1387–1394. [Google Scholar] [CrossRef] [PubMed]
- Ransohoff, R.M.; Cardona, A.E. The myeloid cells of the central nervous system parenchyma. Nature 2010, 468, 253–262. [Google Scholar] [CrossRef] [PubMed]
- Aloisi, F. Immune function of microglia. Glia 2001, 36, 165–179. [Google Scholar] [CrossRef]
- Kettenmann, H.; Ransom, B.R. Neuroglia, 2nd ed.; Oxford University Press: New York, NY, USA, 2005. [Google Scholar]
- Papageorgiou, I.E.; Fetani, A.F.; Lewen, A.; Heinemann, U.; Kann, O. Widespread activation of microglial cells in the hippocampus of chronic epileptic rats correlates only partially with neurodegeneration. Brain Struct. Funct. 2015, 220, 2423–2439. [Google Scholar] [CrossRef] [PubMed]
- Boche, D.; Perry, V.H.; Nicoll, J.A.R. Review: Activation patterns of microglia and their identification in the human brain. Neuropathol. Appl. Neurobiol. 2013, 39, 3–18. [Google Scholar] [CrossRef]
- Gordon, S.; Plűddemann, A. Tissue macrophage heterogeneity: Issues and prospects. Semin. Immunopathol. 2013, 35, 533–540. [Google Scholar] [CrossRef]
- Gordon, S.; Plüddemann, A.; Martinez Estrada, F. Macrophage heterogeneity in tissues: Phenotypic diversity and functions. Immunol. Rev. 2014, 262, 36–55. [Google Scholar] [CrossRef] [Green Version]
- Crotti, A.; Ransohoff, R.M. Microglial Physiology and Pathophysiology: Insights from Genome-wide Transcriptional Profiling. Immunity 2016, 44, 505–515. [Google Scholar] [CrossRef] [Green Version]
- Holtman, I.R.; Noback, M.; Bijlsma, M.; Duong, K.N.; van der Geest, M.A.; Ketelaars, P.T.; Brouwer, N.; Vainchtein, I.D.; Eggen, B.J.L.; Boddeke, H.W.G.M. Glia Open Access Database (GOAD): A comprehensive gene expression encyclopedia of glia cells in health and disease. Glia 2015, 63, 1495–1506. [Google Scholar] [CrossRef]
- Murray, P.J.; Allen, J.E.; Biswas, S.K.; Fisher, E.A.; Gilroy, D.W.; Goerdt, S.; Gordon, S.; Hamilton, J.A.; Ivashkiv, L.B.; Lawrence, T.; et al. Macrophage activation and polarization: Nomenclature and experimental guidelines. Immunity 2014, 41, 14–20. [Google Scholar] [CrossRef] [PubMed] [Green Version]
- Xue, J.; Schmidt, S.V.; Sander, J.; Draffehn, A.; Krebs, W.; Quester, I.; De Nardo, D.; Gohel, T.D.; Emde, M.; Schmidleithner, L.; et al. Transcriptome-based network analysis reveals a spectrum model of human macrophage activation. Immunity 2014, 40, 274–288. [Google Scholar] [CrossRef] [Green Version]
- Bennett, M.L.; Bennett, F.C.; Liddelow, S.A.; Ajami, B.; Zamanian, J.L.; Fernhoff, N.B.; Mulinyawe, S.B.; Bohlen, C.J.; Adil, A.; Tucker, A.; et al. New tools for studying microglia in the mouse and human CNS. Proc. Natl. Acad. Sci. USA 2016, 113, E1738–E1746. [Google Scholar] [CrossRef] [PubMed] [Green Version]
- Hickman, S.E.; Kingery, N.D.; Ohsumi, T.K.; Borowsky, M.L.; Wang, L.; Means, T.K.; El Khoury, J. The microglial sensome revealed by direct RNA sequencing. Nat. Neurosci. 2013, 16, 1896–1905. [Google Scholar] [CrossRef] [Green Version]
- Butovsky, O.; Jedrychowski, M.P.; Moore, C.S.; Cialic, R.; Lanser, A.J.; Gabriely, G.; Koeglsperger, T.; Dake, B.; Wu, P.M.; Doykan, C.E.; et al. Identification of a unique TGF-β-dependent molecular and functional signature in microglia. Nat. Neurosci. 2014, 17, 131–143. [Google Scholar] [CrossRef] [PubMed] [Green Version]
- Gosselin, D.; Skola, D.; Coufal, N.G.; Holtman, I.R.; Schlachetzki, J.C.M.; Sajti, E.; Jaeger, B.N.; O’Connor, C.; Fitzpatrick, C.; Pasillas, M.P.; et al. An environment-dependent transcriptional network specifies human microglia identity. Science 2017, 356, 6344. [Google Scholar] [CrossRef] [Green Version]
- Hammond, T.R.; Dufort, C.; Dissing-Olesen, L.; Giera, S.; Young, A.; Wysoker, A.; Walker, A.J.; Gergits, F.; Segel, M.; Nemesh, J.; et al. Single-Cell RNA Sequencing of Microglia throughout the Mouse Lifespan and in the Injured Brain Reveals Complex Cell-State Changes. Immunity 2019, 50, 253–271.e6. [Google Scholar] [CrossRef] [Green Version]
- Krasemann, S.; Madore, C.; Cialic, R.; Baufeld, C.; Calcagno, N.; El Fatimy, R.; Beckers, L.; O’Loughlin, E.; Xu, Y.; Fanek, Z.; et al. The TREM2-APOE Pathway Drives the Transcriptional Phenotype of Dysfunctional Microglia in Neurodegenerative Diseases. Immunity 2017, 47, 566–581.e9. [Google Scholar] [CrossRef] [Green Version]
- Holtman, I.R.; Raj, D.D.; Miller, J.A.; Schaafsma, W.; Yin, Z.; Brouwer, N.; Wes, P.D.; Möller, T.; Orre, M.; Kamphuis, W.; et al. Induction of a common microglia gene expression signature by aging and neurodegenerative conditions: A co-expression meta-analysis. Acta Neuropathol. Commun. 2015, 3, 31. [Google Scholar] [CrossRef] [Green Version]
- Song, Y.; Yang, Y.; Liu, L.; Liu, X. Association between five polymorphisms in vascular endothelial growth factor gene and urinary bladder cancer risk: A systematic review and meta-analysis involving 6671 subjects. Gene 2019, 698, 186–197. [Google Scholar] [CrossRef] [PubMed]
- Xu, R.; Li, X.; Boreland, A.J.; Posyton, A.; Kwan, K.; Hart, R.P.; Jiang, P. Human iPSC-derived mature microglia retain their identity and functionally integrate in the chimeric mouse brain. Nat. Commun. 2020, 11, 1577. [Google Scholar] [CrossRef] [PubMed] [Green Version]
- Hashemifar, S.; Neyshabur, B.; Khan, A.A.; Xu, J. Predicting protein-protein interactions through sequence-based deep learning. Bioinforma. Oxf. Engl. 2018, 34, i802–i810. [Google Scholar] [CrossRef] [PubMed] [Green Version]
- Huang, Y.A.; You, Z.H.; Chen, X.; Chan, K.; Luo, X. Sequence-based prediction of protein-protein interactions using weighted sparse representation model combined with global encoding. BMC Bioinform. 2016, 17, 184. [Google Scholar] [CrossRef] [Green Version]
- Miskei, M.; Horvath, A.; Vendruscolo, M.; Fuxreiter, M. Sequence-Based Prediction of Fuzzy Protein Interactions. J. Mol. Biol. 2020, 432, 2289–2303. [Google Scholar] [CrossRef]
- Shen, J.; Zhang, J.; Luo, X.; Zhu, W.; Yu, K.; Chen, K.; Li, Y.; Jiang, H. Predicting protein-protein interactions based only on sequences information. Proc. Natl. Acad. Sci. USA 2007, 104, 4337–4341. [Google Scholar] [CrossRef] [Green Version]
- Yu, J.; Guo, M.; Needham, C.J.; Huang, Y.; Cai, L.; Westhead, D.R. Simple sequence-based kernels do not predict protein-protein interactions. Bioinforma. Oxf. Engl. 2010, 26, 2610–2614. [Google Scholar] [CrossRef] [PubMed] [Green Version]
- Debès, C.; Wang, M.; Caetano-Anollés, G.; Gräter, F. Evolutionary optimization of protein folding. PLoS Comput. Biol. 2013, 9, e1002861. [Google Scholar] [CrossRef] [Green Version]
- Mecca, C.; Giambanco, I.; Donato, R.; Arcuri, C. Microglia and Aging: The Role of the TREM2-DAP12 and CX3CL1-CX3CR1 Axes. Int. J. Mol. Sci. 2018, 19, 318. [Google Scholar] [CrossRef] [Green Version]
- Pocock, J.M.; Kettenmann, H. Neurotransmitter receptors on microglia. Trends Neurosci. 2007, 30, 527–535. [Google Scholar] [CrossRef]
- Paolicelli, R.C.; Bolasco, G.; Pagani, F.; Maggi, L.; Scianni, M.; Panzanelli, P.; Giustetto, M.; Ferreira, T.A.; Guiducci, E.; Dumas, L.; et al. Synaptic pruning by microglia is necessary for normal brain development. Science 2011, 333, 1456–1458. [Google Scholar] [CrossRef] [Green Version]
- Zhan, Y.; Paolicelli, R.C.; Sforazzini, F.; Weinhard, L.; Bolasco, G.; Pagani, F.; Vyssotski, A.L.; Bifone, A.; Gozzi, A.; Ragozzino, D.; et al. Deficient neuron-microglia signaling results in impaired functional brain connectivity and social behavior. Nat. Neurosci. 2014, 17, 400–406. [Google Scholar] [CrossRef]
- Felger, J.C.; Lotrich, F.E. Inflammatory cytokines in depression: Neurobiological mechanisms and therapeutic implications. Neuroscience 2013, 246, 199–229. [Google Scholar] [CrossRef] [PubMed] [Green Version]
- Kranjc, M.K.; Novak, M.; Pestell, R.G.; Lah, T.T. Cytokine CCL5 and receptor CCR5 axis in glioblastoma multiforme. Radiol. Oncol. 2019, 53, 397–406. [Google Scholar] [CrossRef] [Green Version]
- Chen, L.; Li, L.; Zhou, C.; Chen, X.; Cao, Y. Adenosine A2A receptor activation reduces brain metastasis via SDF-1/CXCR4 axis and protecting blood-brain barrier. Mol. Carcinog. 2020, 59, 390–398. [Google Scholar] [CrossRef]
- Pranzatelli, M.R. Advances in Biomarker-Guided Therapy for Pediatric- and Adult-Onset Neuroinflammatory Disorders: Targeting Chemokines/Cytokines. Front. Immunol. 2018, 9, 557. [Google Scholar] [CrossRef] [PubMed]
- Ransohoff, R.M.; Schafer, D.; Vincent, A.; Blachère, N.E.; Bar-Or, A. Neuroinflammation: Ways in Which the Immune System Affects the Brain. Neurother. J. Am. Soc. Exp. Neurother. 2015, 12, 896–909. [Google Scholar] [CrossRef] [PubMed] [Green Version]
- Wei, L.; Zou, Q.; Liao, M.; Lu, H.; Zhao, Y. A novel machine learning method for cytokine-receptor interaction prediction. Comb. Chem. High Throughput Screen. 2016, 19, 144–152. [Google Scholar] [CrossRef]
- Nath, A.; Leier, A. Improved cytokine-receptor interaction prediction by exploiting the negative sample space. BMC Bioinform. 2020, 21, 493. [Google Scholar] [CrossRef]
- Liu, T.; Shi, K.; Li, W. Deep learning methods improve linear B-cell epitope prediction. BioData Min. 2020, 13, 1. [Google Scholar] [CrossRef] [PubMed]
- Rammensee, H.G.; Bachmann, J.; Emmerich, N.P.N.; Bachor, O.A.; Stevanović, S. SYFPEITHI: Database for MHC ligands and peptide motifs. Immunogenetics 1999, 50, 213–219. [Google Scholar] [CrossRef]
- Chen, B.; Khodadoust, M.S.; Olsson, N.; Wagar, L.E.; Fast, E.; Liu, C.L.; Muftuoglu, Y.; Sworder, B.J.; Diehn, M.; Levy, R.; et al. Predicting HLA class II antigen presentation through integrated deep learning. Nat. Biotechnol. 2019, 37, 1332–1343. [Google Scholar] [CrossRef]
- Potocnakova, L.; Bhide, M.; Pulzova, L.B. An Introduction to B-Cell Epitope Mapping and In Silico Epitope Prediction. J. Immunol. Res. 2016, 2016, 6760830. [Google Scholar] [CrossRef] [Green Version]
- Raoufi, E.; Hemmati, M.; Eftekhari, S.; Khaksaran, K.; Mahmodi, Z.; Farajollahi, M.M.; Mohsenzadegan, M. Epitope Prediction by Novel Immunoinformatics Approach: A State-of-the-art Review. Int. J. Pept. Res. Ther. 2020, 26, 1155–1163. [Google Scholar] [CrossRef] [PubMed]
- Teraguchi, S.; Saputri, D.S.; Llamas-Covarrubias, M.A.; Davila, A.; Diez, D.; Nazlica, S.A.; Rozewicki, J.; Ismanto, H.S.; Wilamowski, J.; Xie, J.; et al. Methods for sequence and structural analysis of B and T cell receptor repertoires. Comput. Struct. Biotechnol. J. 2020, 18, 2000–2011. [Google Scholar] [CrossRef] [PubMed]
- Kawakubo, H.; Matsui, Y.; Kushima, I.; Ozaki, N.; Shimamura, T. A network of networks approach for modeling interconnected brain tissue-specific networks. Bioinforma. Oxf. Engl. 2019, 35, 3092–3101. [Google Scholar] [CrossRef] [PubMed]
- Nakae, K.; Ikegaya, Y.; Ishikawa, T.; Oba, S.; Urakubo, H.; Koyama, M.; Ishii, S. A statistical method of identifying interactions in neuron-glia systems based on functional multicell Ca2+ imaging. PLoS Comput. Biol. 2014, 10, e1003949. [Google Scholar] [CrossRef] [Green Version]
- Garaschuk, O.; Verkhratsky, A. Physiology of Microglia. Methods Mol. Biol. Clifton NJ 2019, 2034, 27–40. [Google Scholar] [CrossRef]
- Kettenmann, H.; Hanisch, U.K.; Noda, M.; Verkhratsky, A. Physiology of microglia. Physiol. Rev. 2011, 91, 461–553. [Google Scholar] [CrossRef] [PubMed]
- Cheng, H.; Tong, S.; Deng, X.; Li, J.; Qiu, P.; Wang, K. In vivo deep-brain imaging of microglia enabled by three-photon fluorescence microscopy. Opt. Lett. 2020, 45, 5271–5274. [Google Scholar] [CrossRef] [PubMed]
- Füger, P.; Hefendehl, J.K.; Veeraraghavalu, K.; Wendeln, A.C.; Schlosser, C.; Obermüller, U.; Wegenast-Braun, B.M.; Neher, J.J.; Martus, P.; Kohsaka, S.; et al. Microglia turnover with aging and in an Alzheimer’s model via long-term in vivo single-cell imaging. Nat. Neurosci. 2017, 20, 1371–1376. [Google Scholar] [CrossRef]
- Nimmerjahn, A.; Kirchhoff, F.; Helmchen, F. Resting microglial cells are highly dynamic surveillants of brain parenchyma in vivo. Science 2005, 308, 1314–1318. [Google Scholar] [CrossRef] [Green Version]
- Aibar, S.; González-Blas, C.B.; Moerman, T.; Huynh-Thu, V.A.; Imrichova, H.; Hulselmans, G.; Rambow, F.; Marine, J.C.; Geurts, P.; Aerts, J.; et al. SCENIC: Single-cell regulatory network inference and clustering. Nat. Methods 2017, 14, 1083–1086. [Google Scholar] [CrossRef] [PubMed] [Green Version]
- Sinha, S.; Jones, B.M.; Traniello, I.M.; Bukhari, S.A.; Halfon, M.S.; Hofmann, H.A.; Huang, S.; Katz, P.S.; Keagy, J.; Lynch, V.J.; et al. Behavior-related gene regulatory networks: A new level of organization in the brain. Proc. Natl. Acad. Sci. USA 2020, 117, 23270–23279. [Google Scholar] [CrossRef]
- Haure-Mirande, J.V.; Audrain, M.; Fanutza, T.; Kim, S.H.; Klein, W.L.; Glabe, C.; Readhead, B.; Dudley, J.T.; Blitzer, R.D.; Wang, M.; et al. Deficiency of TYROBP, an adapter protein for TREM2 and CR3 receptors, is neuroprotective in a mouse model of early Alzheimer’s pathology. Acta Neuropathol. 2017, 134, 769–788. [Google Scholar] [CrossRef] [PubMed]
- Haure-Mirande, J.V.; Wang, M.; Audrain, M.; Fanutza, T.; Kim, S.H.; Heja, S.; Readhead, B.; Dudley, J.T.; Blitzer, R.D.; Schadt, E.E.; et al. Integrative approach to sporadic Alzheimer’s disease: Deficiency of TYROBP in cerebral Aβ amyloidosis mouse normalizes clinical phenotype and complement subnetwork molecular pathology without reducing Aβ burden. Mol. Psychiatry 2019, 24, 431–446. [Google Scholar] [CrossRef]
- Barisoni, L.; Lafata, K.J.; Hewitt, S.M.; Madabhushi, A.; Balis, U.G.J. Digital pathology and computational image analysis in nephropathology. Nat. Rev. Nephrol. 2020, 16, 669–685. [Google Scholar] [CrossRef] [PubMed]
- Madabhushi, A.; Lee, G. Image analysis and machine learning in digital pathology: Challenges and opportunities. Med. Image Anal. 2016, 33, 170–175. [Google Scholar] [CrossRef] [Green Version]
- Niazi, M.K.K.; Parwani, A.V.; Gurcan, M.N. Digital pathology and artificial intelligence. Lancet Oncol. 2019, 20, e253–e261. [Google Scholar] [CrossRef]
- Tizhoosh, H.R.; Pantanowitz, L. Artificial Intelligence and Digital Pathology: Challenges and Opportunities. J. Pathol. Inform. 2018, 9, 38. [Google Scholar] [CrossRef]
- Kan, A. Machine learning applications in cell image analysis. Immunol. Cell Biol. 2017, 95, 525–530. [Google Scholar] [CrossRef]
- Kutlu, H.; Avci, E.; Özyurt, F. White blood cells detection and classification based on regional convolutional neural networks. Med. Hypotheses 2020, 135, 109472. [Google Scholar] [CrossRef]
- Howard, C.V.; Reed, M.G. Unbiased Stereology: Three-Dimensional Measurement in Microscopy; Garland Science/BIOS Scientific Publishers: Oxon, UK, 2005. [Google Scholar]
- Valous, N.A.; Lahrmann, B.; Zhou, W.; Veltkamp, R.; Grabe, N. Multistage histopathological image segmentation of Iba1-stained murine microglias in a focal ischemia model: Methodological workflow and expert validation. J. Neurosci. Methods. 2013, 213, 250–262. [Google Scholar] [CrossRef]
- Karperien, A.L.; Jelinek, H.F. Fractal, multifractal, and lacunarity analysis of microglia in tissue engineering. Front. Bioeng. Biotechnol. 2015, 3, 51. [Google Scholar] [CrossRef] [Green Version]
- Karperien, A.; Ahammer, H.; Jelinek, H. Quantitating the subtleties of microglial morphology with fractal analysis. Front. Cell. Neurosci. 2013, 7, 3. [Google Scholar] [CrossRef] [Green Version]
- Ding, Y.; Pardon, M.C.; Agostini, A.; Faas, H.; Duan, J.; Ward, W.O.C.; Easton, F.; Auer, D.; Bai, L. Novel Methods for Microglia Segmentation, Feature Extraction, and Classification. IEEE ACM Trans. Comput. Biol. Bioinform. 2017, 14, 1366–1377. [Google Scholar] [CrossRef] [Green Version]
- Kongsui, R.; Johnson, S.J.; Graham, B.A.; Nilsson, M.; Walker, F.R. A combined cumulative threshold spectra and digital reconstruction analysis reveal structural alterations of microglia within the prefrontal cortex following low-dose LPS administration. Neuroscience 2015, 310, 629–640. [Google Scholar] [CrossRef] [PubMed]
- Liu, M.; Ylanko, J.; Weekman, E.; Beckett, T.; Andrews, D.; McLaurin, J. Utilizing supervised machine learning to identify microglia and astrocytes in situ: Implications for large-scale image analysis and quantification. J. Neurosci. Methods. 2019, 328, 108424. [Google Scholar] [CrossRef] [PubMed]
- de Oliveira, T.C.G.; Carvalho-Paulo, D.; de Lima, C.M.; de Oliveira, R.B.; Santos Filho, C.; Diniz, D.G.; Bento Torres Neto, J.; Picanço-Diniz, C.W. Long-term environmental enrichment reduces microglia morphological diversity of the molecular layer of dentate gyrus. Eur. J. Neurosci. 2020, 52, 4081–4099. [Google Scholar] [CrossRef] [PubMed]
- Ohm, D.T.; Fought, A.J.; Martersteck, A.; Coventry, C.; Sridhar, J.; Gefen, T.; Weintraub, S.; Bigio, E.; Mesulam, M.M.; Rogalski, E.; et al. Accumulation of neurofibrillary tangles and activated microglia is associated with lower neuron densities in the aphasic variant of Alzheimer’s disease. Brain Pathol. Zurich Switz. 2021, 31, 189–204. [Google Scholar] [CrossRef] [PubMed]
- Ahmady Phoulady, H.; Goldgof, D.; Hall, L.O.; Mouton, P.R. Automatic ground truth for deep learning stereology of immunostained neurons and microglia in mouse neocortex. J. Chem. Neuroanat. 2019, 98, 1–7. [Google Scholar] [CrossRef]
- Alahmari, S.S.; Goldgof, D.; Hall, L.; Phoulady, H.A.; Patel, R.H.; Mouton, P.R. Automated Cell Counts on Tissue Sections by Deep Learning and Unbiased Stereology. J. Chem. Neuroanat. 2019, 96, 94–101. [Google Scholar] [CrossRef] [PubMed]
- Ronneberger, O.; Fischer, P.; Brox, T. U-Net: Convolutional Networks for Biomedical Image Segmentation. In Medical Image Computing and Computer Assisted Intervention—MICCAI 2015; Navab, N., Hornegger, J., Wells, W.M., Frangi, A.F., Eds.; Lecture Notes in Computer Science; Springer: Cham, Switzerland, 2015; Volume 9351, pp. 234–241. [Google Scholar] [CrossRef] [Green Version]
- Suleymanova, I.; Balassa, T.; Tripathi, S.; Molnar, C.; Saarma, M.; Sidorova, Y.; Horvath, P. A deep convolutional neural network approach for astrocyte detection. Sci. Rep. 2018, 8, 12878. [Google Scholar] [CrossRef] [PubMed]
- da Silva, B.C.G.; Tam, R.; Ferrari, R.J. Detecting cells in intravital video microscopy using a deep convolutional neural network. Comput. Biol. Med. 2021, 129, 104133. [Google Scholar] [CrossRef] [PubMed]
- Rom, S.; Zuluaga-Ramirez, V.; Dykstra, H.; Reichenbach, N.L.; Ramirez, S.H.; Persidsky, Y. Poly(ADP-ribose) polymerase-1 inhibition in brain endothelium protects the blood-brain barrier under physiologic and neuroinflammatory conditions. J. Cereb. Blood Flow Metab. Off. J. Int. Soc. Cereb. Blood Flow Metab. 2015, 35, 28–36. [Google Scholar] [CrossRef] [PubMed] [Green Version]
- Luisi, J.; Narayanaswamy, A.; Galbreath, Z.; Roysam, B. The FARSIGHT trace editor: An open source tool for 3-D inspection and efficient pattern analysis aided editing of automated neuronal reconstructions. Neuroinformatics. 2011, 9, 305–315. [Google Scholar] [CrossRef] [PubMed]
- Scorcioni, R.; Polavaram, S.; Ascoli, G.A. L-Measure: A web-accessible tool for the analysis, comparison and search of digital reconstructions of neuronal morphologies. Nat. Protoc. 2008, 3, 866–876. [Google Scholar] [CrossRef]
- Lu, Y.; Carin, L.; Coifman, R.; Shain, W.; Roysam, B. Quantitative arbor analytics: Unsupervised harmonic co-clustering of populations of brain cell arbors based on L-measure. Neuroinformatics 2015, 13, 47–63. [Google Scholar] [CrossRef]
- Megjhani, M.; Rey-Villamizar, N.; Merouane, A.; Lu, Y.; Mukherjee, A.; Trett, K.; Chong, P.; Harris, C.; Shain, W.; Roysam, B. Population-scale three-dimensional reconstruction and quantitative profiling of microglia arbors. Bioinforma. Oxf. Engl. 2015, 31, 2190–2198. [Google Scholar] [CrossRef] [Green Version]
- Galbreath, Z.S. Boyer K.L.Tracing, Extracting Features, and Classifying Microglia from Volumetric Images of Brain Tissue. Master’s Thesis, Rensselaer Polytechnic Institute, New York, NY, USA, 2011. [Google Scholar]
- Wang, Y.; Narayanaswamy, A.; Tsai, C.L.; Roysam, B. A broadly applicable 3-D neuron tracing method based on open-curve snake. Neuroinformatics 2011, 9, 193–217. [Google Scholar] [CrossRef]
- Rey-Villamizar, N.; Somasundar, V.; Megjhani, M.; Xu, Y.; Lu, Y.; Padmanabhan, R.; Trett, K.; Shain, W.; Roysam, B. Large-scale automated image analysis for computational profiling of brain tissue surrounding implanted neuroprosthetic devices using Python. Front. Neuroinformatics 2014, 8, 39. [Google Scholar] [CrossRef]
- Kyriazis, A.D.; Noroozizadeh, S.; Refaee, A.; Choi, W.; Chu, L.T.; Bashir, A.; Cheng, W.H.; Zhao, R.; Namjoshi, D.R.; Salcudean, S.E.; et al. An End-to-end System for Automatic Characterization of Iba1 Immunopositive Microglia in Whole Slide Imaging. Neuroinformatics 2019, 17, 373–389. [Google Scholar] [CrossRef] [PubMed]

Table 1.
Public repositories in the neuroimmunological research.
| Database | URL | Content |
|---|---|---|
| Sequencing | ||
| Glial heterogeneity | www.glia-network.de/index.php/databases.html (accessed on 1 July 2021) | RNA-seq databases of glial cells |
| BrainRNAseq | www.BrainRNAseq.org (accessed on 1 July 2021) | RNA-seq database of glial cells |
| ImMunoGeneTics | www.imgt.org (accessed on 1 July 2021) | sequence, genome, structure and monoclonal antibodies database |
| MSigDB, Molecular Signature DataBase | www.gsea-msigdb.org/gsea/msigdb (accessed on 1 July 2021) | Gene Set Enrichment Analysis database |
| GTEx, Genotype Tissue-Expression repository | www.gtexportal.org/home/ (accessed on 1 July 2021) | eQTL database |
| ImmPort and ImmuneSpace | www.immuneprofiling.org (accessed on 1 July 2021) | cross-essay human immunological data, including computational interface |
| IEDB, Immune Epitope DataBase | www.iedb.org/ (accessed on 1 July 2021) | antibody and T cell epitopes studied in humans, non-human primates, and other animal species in the context of infectious disease, allergy, autoimmunity, and transplantation |
| ImmGen | www.immgen.org/ (accessed on 1 July 2021) | microarray dissection of gene expression and its regulation in the immune system of the mouse |
| InnateDB | www.innatedb.com/ (accessed on 1 July 2021) | genes, proteins, experimentally-verified interactions, and signaling pathways involved in the innate immune response of humans, mice, and bovines to microbial infection |
| Morphology | ||
| Neuromorph | www.neuromorpho.org (accessed on 1 July 2021) | morphology, tracing reconstructions of neurons, astroglia, and microglia |
| FARSight | farsight-toolkit.ee.uh.edu/wiki/Main_Page (accessed on 1 July 2021) | Toolkit for Python, cell arborization visualization, analysis, and quantitation applying unsupervised clustering |
| FindMyCells | www.findmycells.org/index.html (accessed on 1 July 2021) | Deep learning tool for single-cell detection |
Table 2.
Glossary.
| Assay for Transposase-Accessible Chromatin Using Sequencing (ATAC-Seq) | Method for Determining Chromatin Accessibility Across the Genome by Sequencing Regions of Open Chromatin |
| Automated Segmentation Algorithm (ASA) Stereology | Stereology with an integrated automated segmentation algorithm for cell recognition |
| Blood-brain barrier | Anatomical and functional blood vessels “seal” that keeps harmful substances from reaching the brain |
| Chromatin Immunoprecipitation and DNAseq (ChIPseq) | Chromatin Immunoprecipitation (ChIP) and next-generation sequencing (ChIPseq) explores interactions between DNA, histones, and transcription factors |
| Cytometry by Time of Flight (CyTOF) | CyTOF is a hybrid method of mass spectrometry and flow cytometry, based on isotope reporters |
| Epigenetics | Heritable changes in gene expression that take place without altering DNA sequence or modifications of the chromatin environment |
| Epigenome Wide Association studies (EWAS) | An epigenome-wide association study (EWAS) is an examination of a genome-wide set of quantifiable epigenetic marks, such as DNA methylation, in different individuals to derive associations between epigenetic variation and a particular identifiable phenotype/trait |
| Expression and methylation Quantitative Trait Loci (eQTL, meQTL) | Genomic loci that explain the variation in RNA expression |
| Genome-Wide Association Studies (GWAS) | A genome-wide association study (GWAS) associates genetic variations with diseases. The method involves a population-wide genome screening and isolates genetic markers with possible disease predictive value |
| Genome-Wide Transcriptional Profiling (GWTP) | Unbiased, hypothesis-free approach that associates genetic changes with disparate states of the immune system to construct genotype-phenotype associations |
| h-iPSC organoids | Organoids are in vitro cultured three-dimensional structures that recapitulate key aspects of in vivo organs. They can be established from pluripotent stem cells (PSC) and induced adult stem cells (iPSC). The abbreviation “h-” speaks for the human PSC origin |
| Human Leukocyte Antigen (HLA) type | HLA are proteins that are located on the surface of the white blood cells and other tissues in the body. There are three general groups of HLA: HLA-A, HLA-B, and HLA-DR |
| Lacunarity and fractal dimension | The fractal dimension represents the roughness (hence texture) Lacunarity is a measure of gaps between (the fractal) objects |
| Lineage trajectories | Clonal lineage tracing of stem cells to define the outcome of differentiation |
| Microglial sensome | Proteomics, genomics, and epigenomics defining microglial reactive states |
| Microglial sensotypes | Newly-introduced categorization of microglia based on the deep sequencing profile (sensome) as a response to stimuli |
| Micro-RNAs (miRNA) | A microRNA (abbreviated miRNA) is a small single-stranded non-coding RNA molecule (containing about 22 nucleotides) found in plants, animals, and some viruses that functions in RNA silencing and post-transcriptional regulation of gene expression |
| Neuroimmunoinformatics | Immunoinformatics of the central neural system |
| Neuroinformatics | Neuroinformatics is the field that combines informatics and neuroscience. Neuroinformatics is related to neuroscience data and information processing by artificial neural networks |
| Probabilistic causal network models | More popular with the name “Bayesian networks”, probabilistic causal networks provide a mathematical model for inferring causal relationships among molecular and higher-order phenotypes. Bayesian networks represent the most popular subcategory of probabilistic causal networks |
| PU.1 | Transcription factor that activates gene expression during myeloid and B-lymphocyte development |
| SALL1 | Transcriptional regulator encoding gene allocated in microglia |
| Signature gene libraries | Cell type-specific gene clusters |
| Single-cell profile deconvolution | Predict cell-specific profiles from large cell populations using machine learning and signature gene libraries |
| T-helper cell | Helper T cell, also called the CD4+ cell, T helper cell, or helper T lymphocyte, a type of white blood cell and key mediator of the immune function |
| Ventral and dorsal h-iPSC organoids | Organoids deriving from ventral and dorsal neurotube stem cells |
| Xenografting | Xenotransplantation or heterologous transplant, the transplantation of living cells, tissues or organs from one species to another. |
Publisher’s Note: MDPI stays neutral with regard to jurisdictional claims in published maps and institutional affiliations. |
© 2021 by the authors. Licensee MDPI, Basel, Switzerland. This article is an open access article distributed under the terms and conditions of the Creative Commons Attribution (CC BY) license (https://creativecommons.org/licenses/by/4.0/).
Share and Cite
MDPI and ACS Style
Papageorgiou, I.; Bittner, D.; Psychogios, M.N.; Hadjidemetriou, S. Brain Immunoinformatics: A Symmetrical Link between Informatics, Wet Lab and the Clinic. Symmetry 2021, 13, 2168. https://0-doi-org.brum.beds.ac.uk/10.3390/sym13112168
AMA Style
Papageorgiou I, Bittner D, Psychogios MN, Hadjidemetriou S. Brain Immunoinformatics: A Symmetrical Link between Informatics, Wet Lab and the Clinic. Symmetry. 2021; 13(11):2168. https://0-doi-org.brum.beds.ac.uk/10.3390/sym13112168
Chicago/Turabian StylePapageorgiou, Ismini, Daniel Bittner, Marios Nikos Psychogios, and Stathis Hadjidemetriou. 2021. "Brain Immunoinformatics: A Symmetrical Link between Informatics, Wet Lab and the Clinic" Symmetry 13, no. 11: 2168. https://0-doi-org.brum.beds.ac.uk/10.3390/sym13112168
Note that from the first issue of 2016, this journal uses article numbers instead of page numbers. See further details here.