Article

UAV-Assisted Three-Dimensional Spectrum Mapping Driven by Spectrum Data and Channel Model

1
Key Laboratory of Dynamic Cognitive System of Electromagnetic Spectrum Space, Ministry of Industry and Information Technology, Nanjing University of Aeronautics and Astronautics, Nanjing 211106, China
2
State Key Laboratory of Integrated Services Networks, Xidian University, Xi’an 710000, China
3
College of Communications Engineering, Army Engineering University, Nanjing 210007, China
4
College of Astronautics, Nanjing University of Aeronautics and Astronautics, Nanjing 211106, China
*
Author to whom correspondence should be addressed.
Submission received: 8 October 2021 / Revised: 25 October 2021 / Accepted: 9 November 2021 / Published: 3 December 2021
(This article belongs to the Special Issue Propagation Model Driven Spectrum Twin and Its Applications)

Abstract

:
As the number of civil aerial vehicles increase explosively, spectrum scarcity and security become an increasingly challenge in both the airspace and terrestrial space. To address this difficulty, this paper presents an unmanned aerial vehicle-assisted (UAV-assisted) spectrum mapping system and a spectrum data reconstruction algorithm driven by spectrum data and channel model are proposed. The reconstruction algorithm, which includes a model-driven spectrum data inference method and a spectrum data completion method with uniformity decision mechanism, can reconstruct limited and incomplete spectrum data to a three-dimensional (3D) spectrum map. As a result, spectrum scarcity and security can be achieved. Spectrum mapping is a symmetry-based digital twin technology. By employing an uniformity decision mechanism, the proposed completion method can effectively interpolate spatial data even when the collected data are unevenly distributed. The effectiveness of the proposed mapping scheme is evaluated by comparing its results with the ray-tracing simulated data of the campus scenario. Simulation results show that the proposed reconstruction algorithm outperforms the classical inverse distance weighted (IDW) interpolation method and the tensor completion method by about 12.5% and 92.3%, respectively, in terms of reconstruction accuracy when the collected spectrum data are regularly missing, unevenly distributed and limited.

1. Introduction

As a limited resource, spectrum is not only an important national strategy resource but also core of 5th Generation (5G) communication technologies [1,2]. Along with the rapidly increasing number of wireless devices and the scarcity of spectrum resources, the challenges, including spectrum resource scarcity and serious spectrum security status, are extending to aerospace from terrestrial space [3]. The question of how to efficiently manage and utilize the existing limited spectrum resources has received considerable attention [4,5,6]. Spectrum map is a database integrated technique that can visually display the distribution of different radio parameters such as received signal strength (RSS) over a geographical area and provide rich and accurate knowledge of radio context [7]. After the services providers get the spectrum map of the area of interest, they can deploy new base stations and allocate channels to customers according to the spectrum map. In the existing literatures, the most spectrum maps only consider one frequency point rather than a frequency band. The users can use several spectrum maps of different frequencies of interest to satisfy their own requirements. For the services providers, they mainly consider the licensed band. Hence, it is necessary and urgent to develop a three-dimensional (3D) spectrum mapping system that can collect the aerial spectrum data and display 3D spectrum situation and to design a corresponding 3D spectrum mapping scheme that can achieve precise 3D spectrum map constructions.
Using spectrum measurement instruments to collect original spectrum data of the measurement area is the first step of the spectrum map reconstruction. Most of existing methods deploy a large number of ground spectrum sensors in the measurement region of interest [8]. For example, in [9,10], the measurement data are obtained by crowdsourcing with individual mobile users or vehicles. These methods can only obtain the ground based spectrum data, while the 3D spectrum map that can display aerial spectrum situations is required for space-air-ground integrated communication networks. Moreover, the spectrum data collected by these instruments are usually incomplete, so that data processing method should be employed to acquire complete data. Spectrum data processing methods typically fall into two major categories: direct methods and indirect methods [4]. Direct methods, which are driven by the spectrum data, usually use inverse distance weighted (IDW) interpolation to process data [11]. In [12,13,14], the authors adopted Kriging spatial interpolation to recover incomplete original spectrum data. In [15], a tensor completion method combining an inference model was proposed, which can acquire complete spectrum map of the measurement area. In [16], the authors proposed a novel spectrum mapping scheme in large-scale cognitive radio networks (CRNs), in which historical spectrum decision results are used. Indirect methods are driven by the channel model. The authors adopted a LocatIon Estimation based (LIvE) method and a SNR-aided method in [17,18], respectively. They utilized prior information about the electromagnetic environment, e.g., radio propagation models, to improve the performance of data recovery. In [19], the authors used Kriging spatial interpolation to estimate shadow fading based on the LIvE method. In [20], the authors firstly obtained the preliminary spectrum map according to the prior information about the measurement area, and then corrected the preliminary spectrum map according to the actual measured data.
Most direct methods are based on the spatial interpolation, their estimated values of the unknown elements cannot be greater than the maximum value of the collected spectrum data, and cannot be less than the minimum value of the collected spectrum data. Therefore, direct methods can achieve satisfactory performance in spectrum map reconstruction when the known collected spectrum data are evenly distributed in the measurement area. However, their performance would degrade when the known data are unevenly distributed (e.g., concentrated in a certain part of the measurement area). Moreover, the aforementioned indirect methods such as LIvE method generally have better performance than the direct methods, and the indirect methods have the same performance whether the collected spectrum data are evenly distributed in the measurement area. Nevertheless, most indirect methods in the existing literature have the assumption that there is only one radiation source in the entire measurement area, which is impractical. To address these drawbacks, this paper presents an efficient method which can achieve high-precision 3D spectrum map reconstruction. The main contributions of this paper are summarized as follows:
(1) We propose an unmanned aerial vehicle-assisted (UAV-assisted) 3D spectrum mapping scheme driven by the spectrum data and the channel model. We first use a UAV platform to collect a part of the spectrum data in the measurement area. Then, we use a spectrum data reconstruction algorithm driven by the spectrum data and the propagation channel model to obtain all spectrum data in the measurement area. Finally, we reconstruct the 3D spectrum map of the measurement area according to the obtained data.
(2) We propose a model-driven spectrum data inference method to estimate a part of the unknown spectrum data before the spectrum data completion, which utilizes the strong directivity of the directional antenna and channel propagation model.
(3) We propose a model-driven spectrum data completion algorithm with a uniformity decision mechanism to estimate the spectrum data of the locations adjacent to the locations with the measured or inferred data with a high level of accuracy, which has relatively good performance even if the measured data are unevenly distributed.
(4) We verify the effectiveness of the proposed spectrum mapping scheme by leveraging the ray-tracing technique to acquire the simulation data of the measurement area.
The remainder of the article is organized as follows. Section 2 presents the scenario of 3D spectrum mapping. Section 3 introduces the model-driven spectrum data inference method. Section 4 introduces the model-driven spectrum data completion method. The simulation and tested results are provided in Section 5. The conclusions are drawn in Section 6.

2. System Model and Problem Formulation

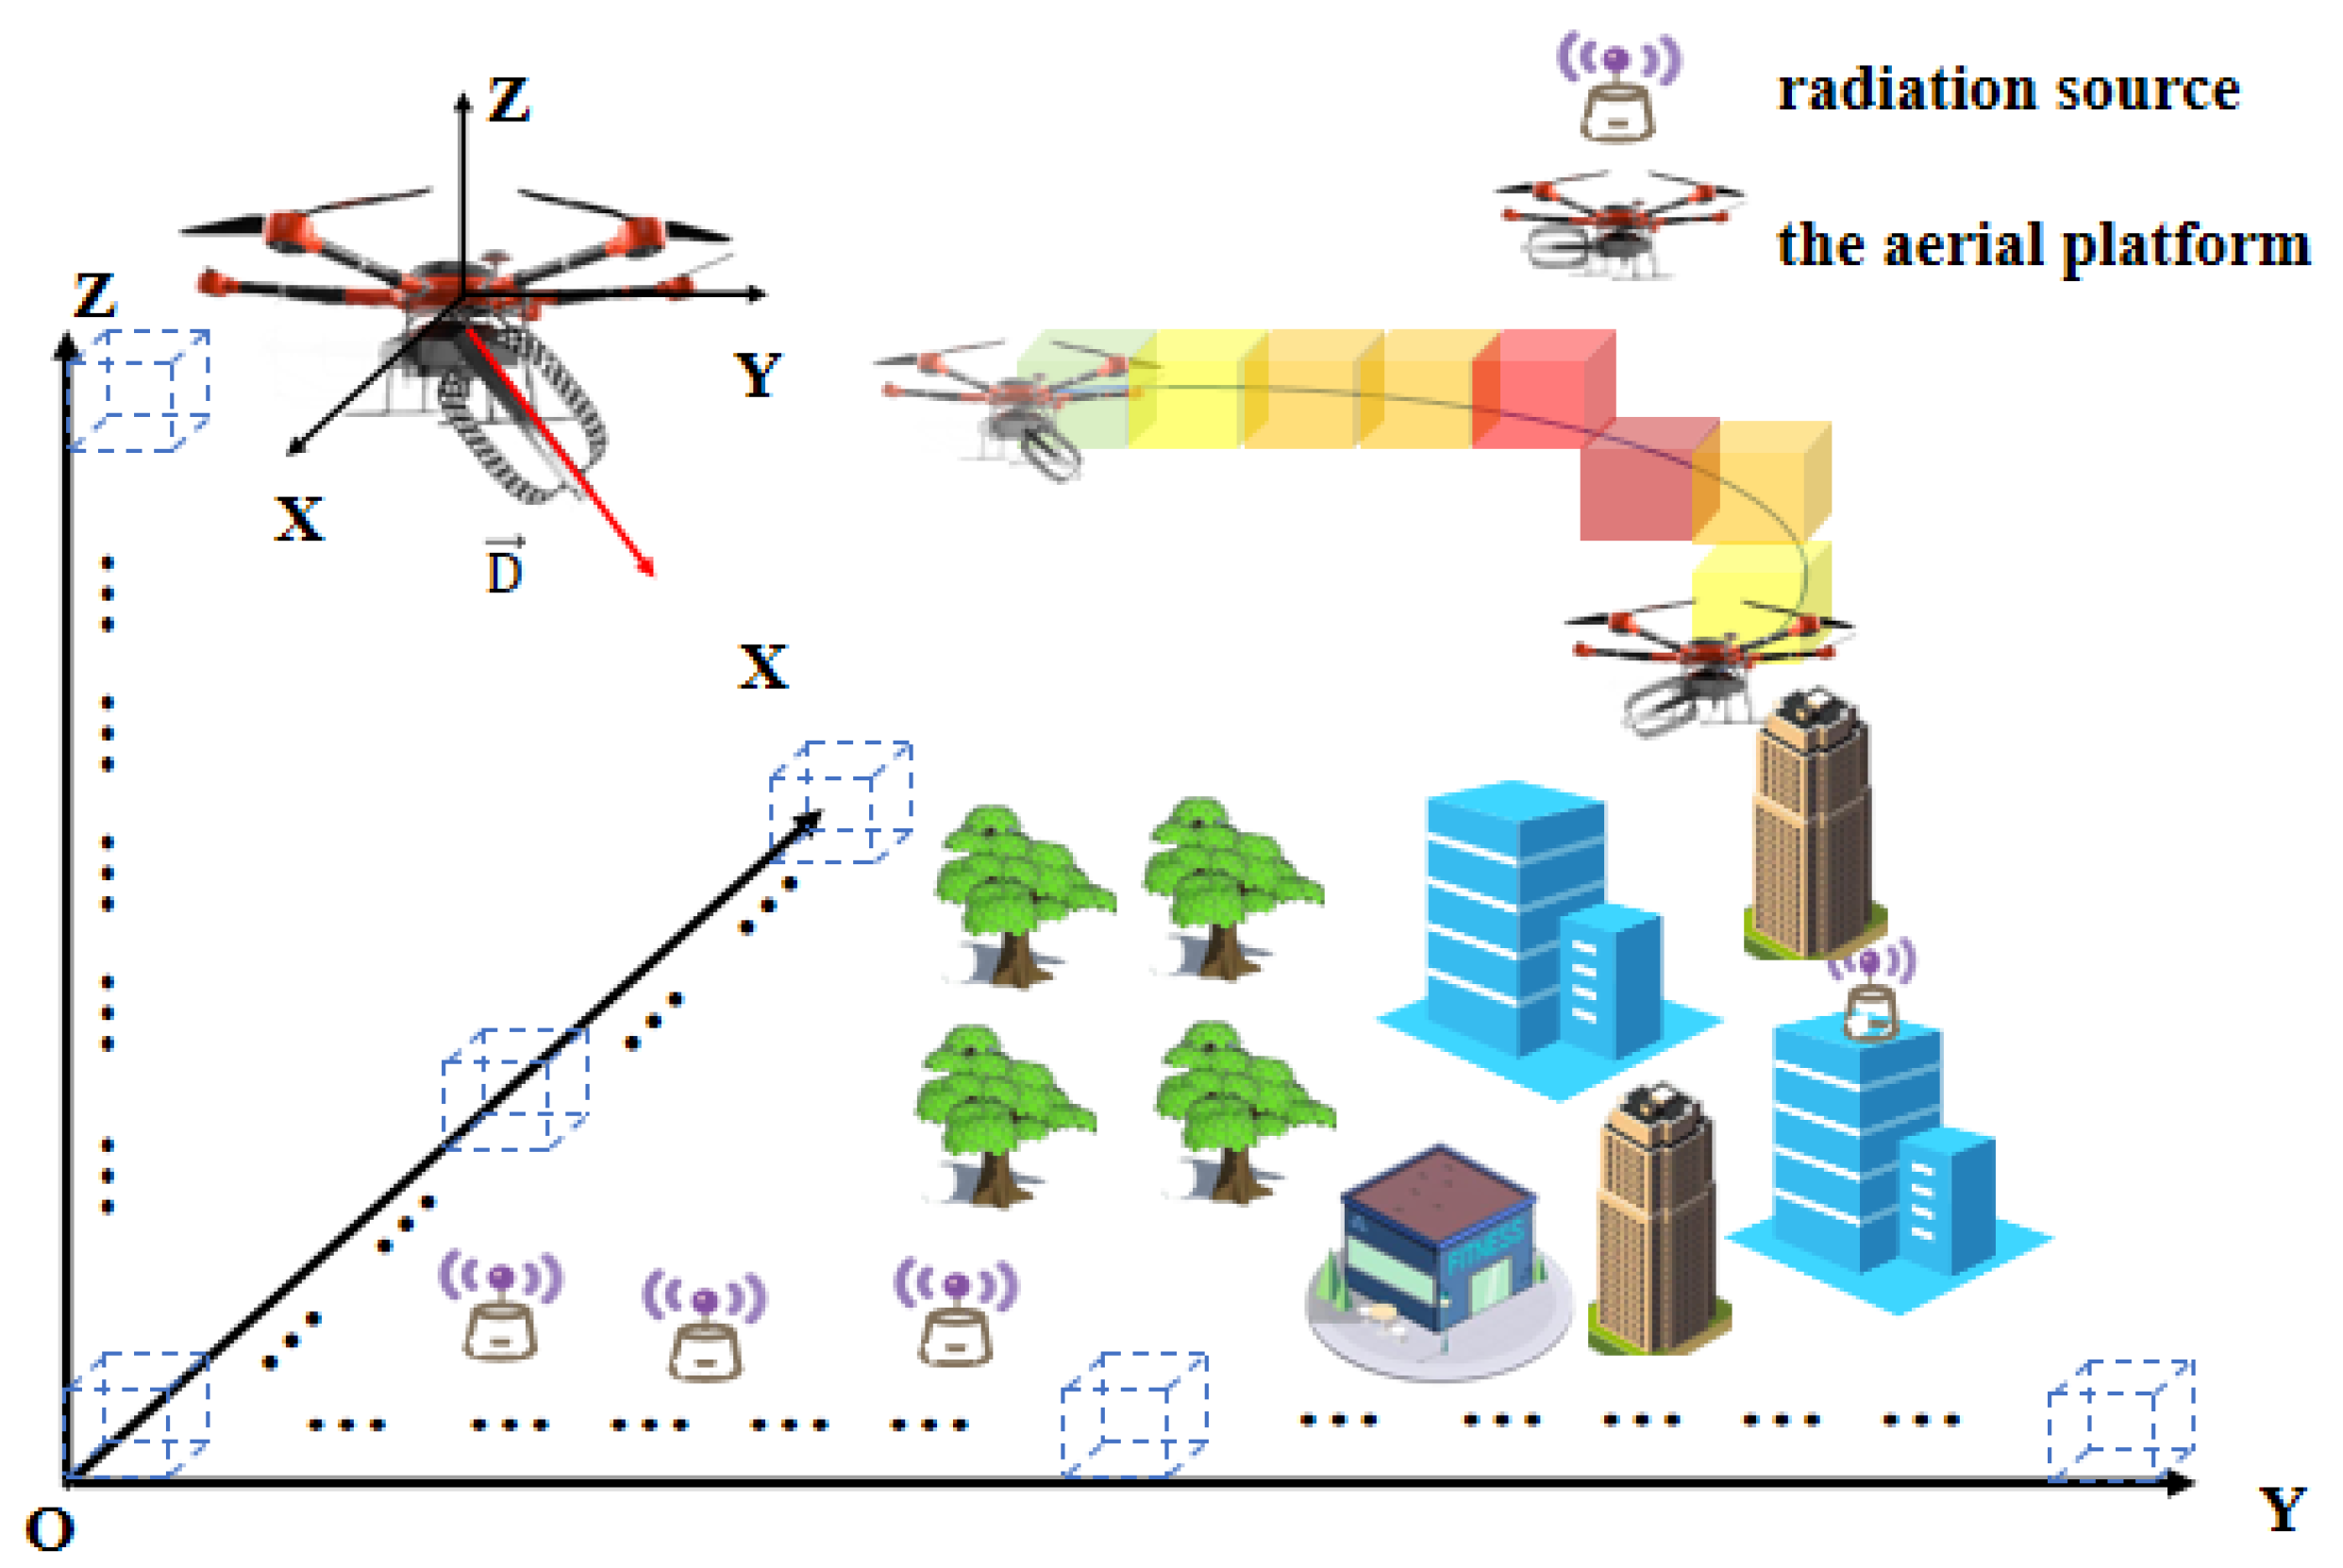
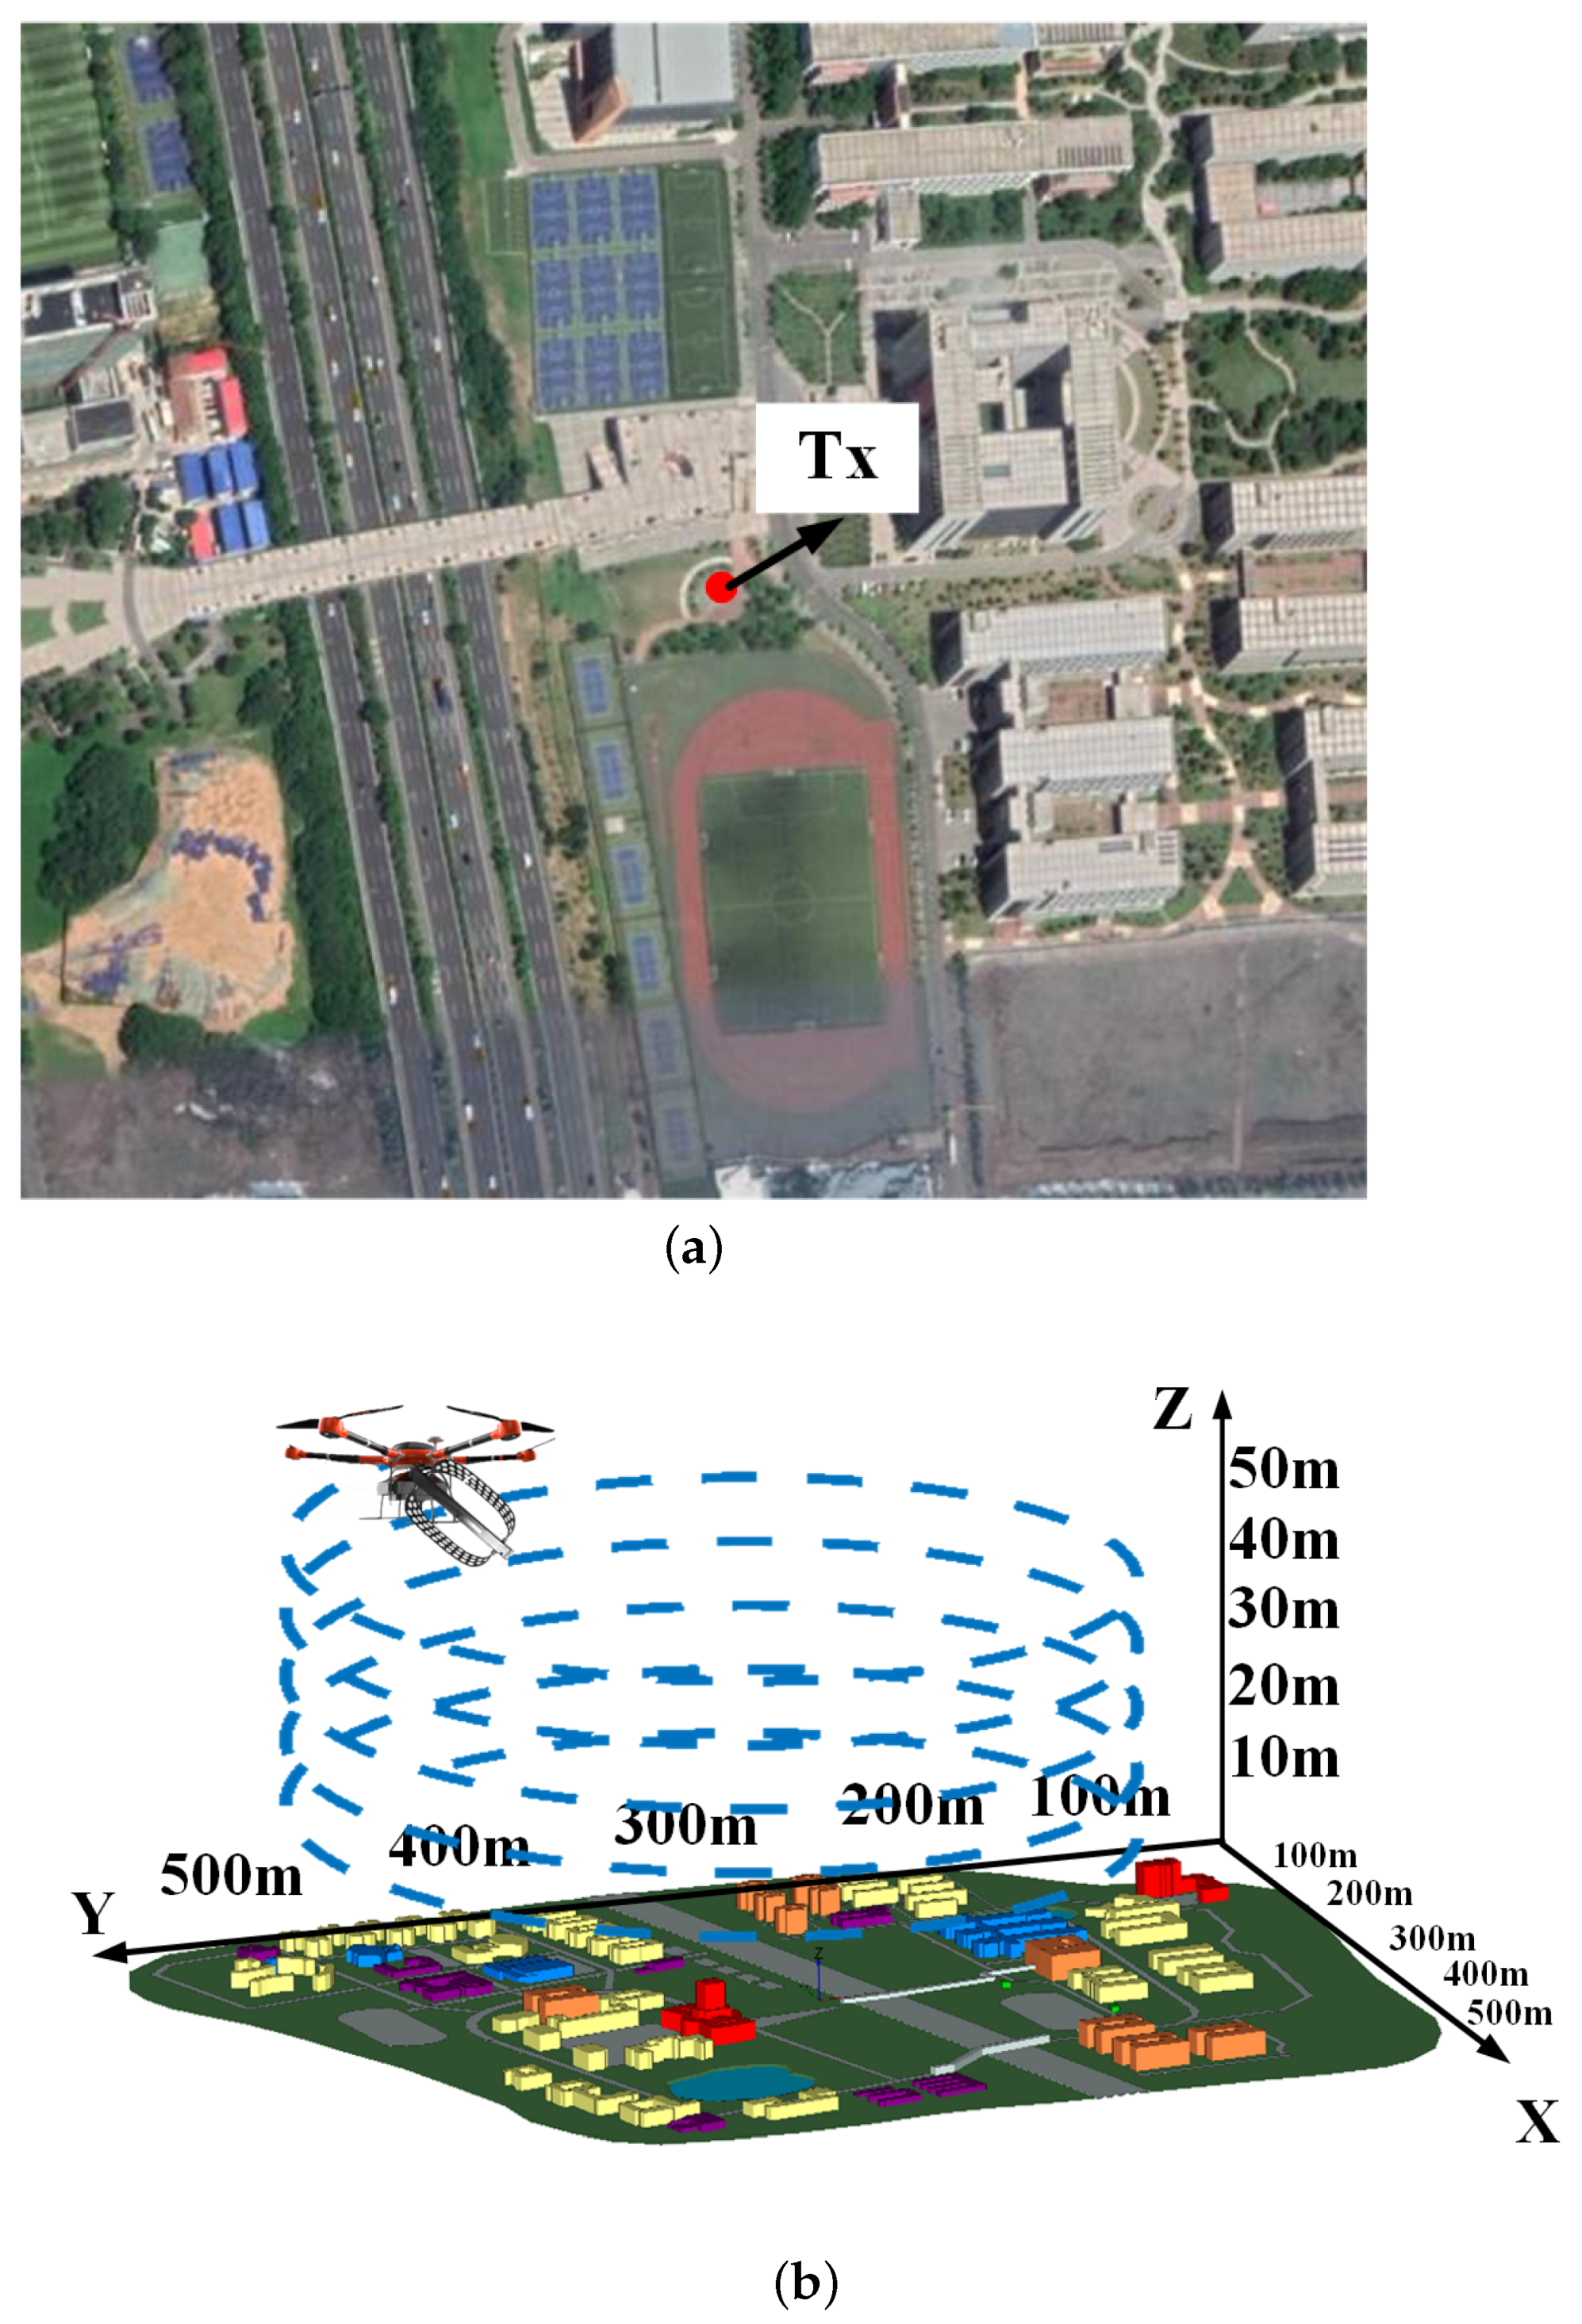
2.1. Spectrum Mapping System

Figure 1 shows a typical scenario of 3D spectrum mapping, where the radiation sources are unknown. The measurement area is divided into several cubes and the size is dependent on the precision requirement of users. We have developed a UAV-assisted spectrum mapping system in [21], which consists of an aerial platform and a ground terminal.
The aerial platform can collect the spectrum information and other information such as geographical location information in real time. A UAV is equipped with an omnidirectional antenna, a directional antenna and a pan-tilt that comes with the antenna. The directional antenna has the definite directionality by using the beamforming technology [22]. The ground terminal can process the collected information to construct the 3D spectrum map of the measurement area.
As shown in Figure 1, the aerial platform of the developed system can fly over the measurement area according to requirements, gather the data, and use different colors to display the RSS values of the cubes where the UAV is located in real time. The RSS values of other cubes can be estimated by model-driven spectrum data inference and completion methods, and then the 3D spectrum map can be reconstructed.

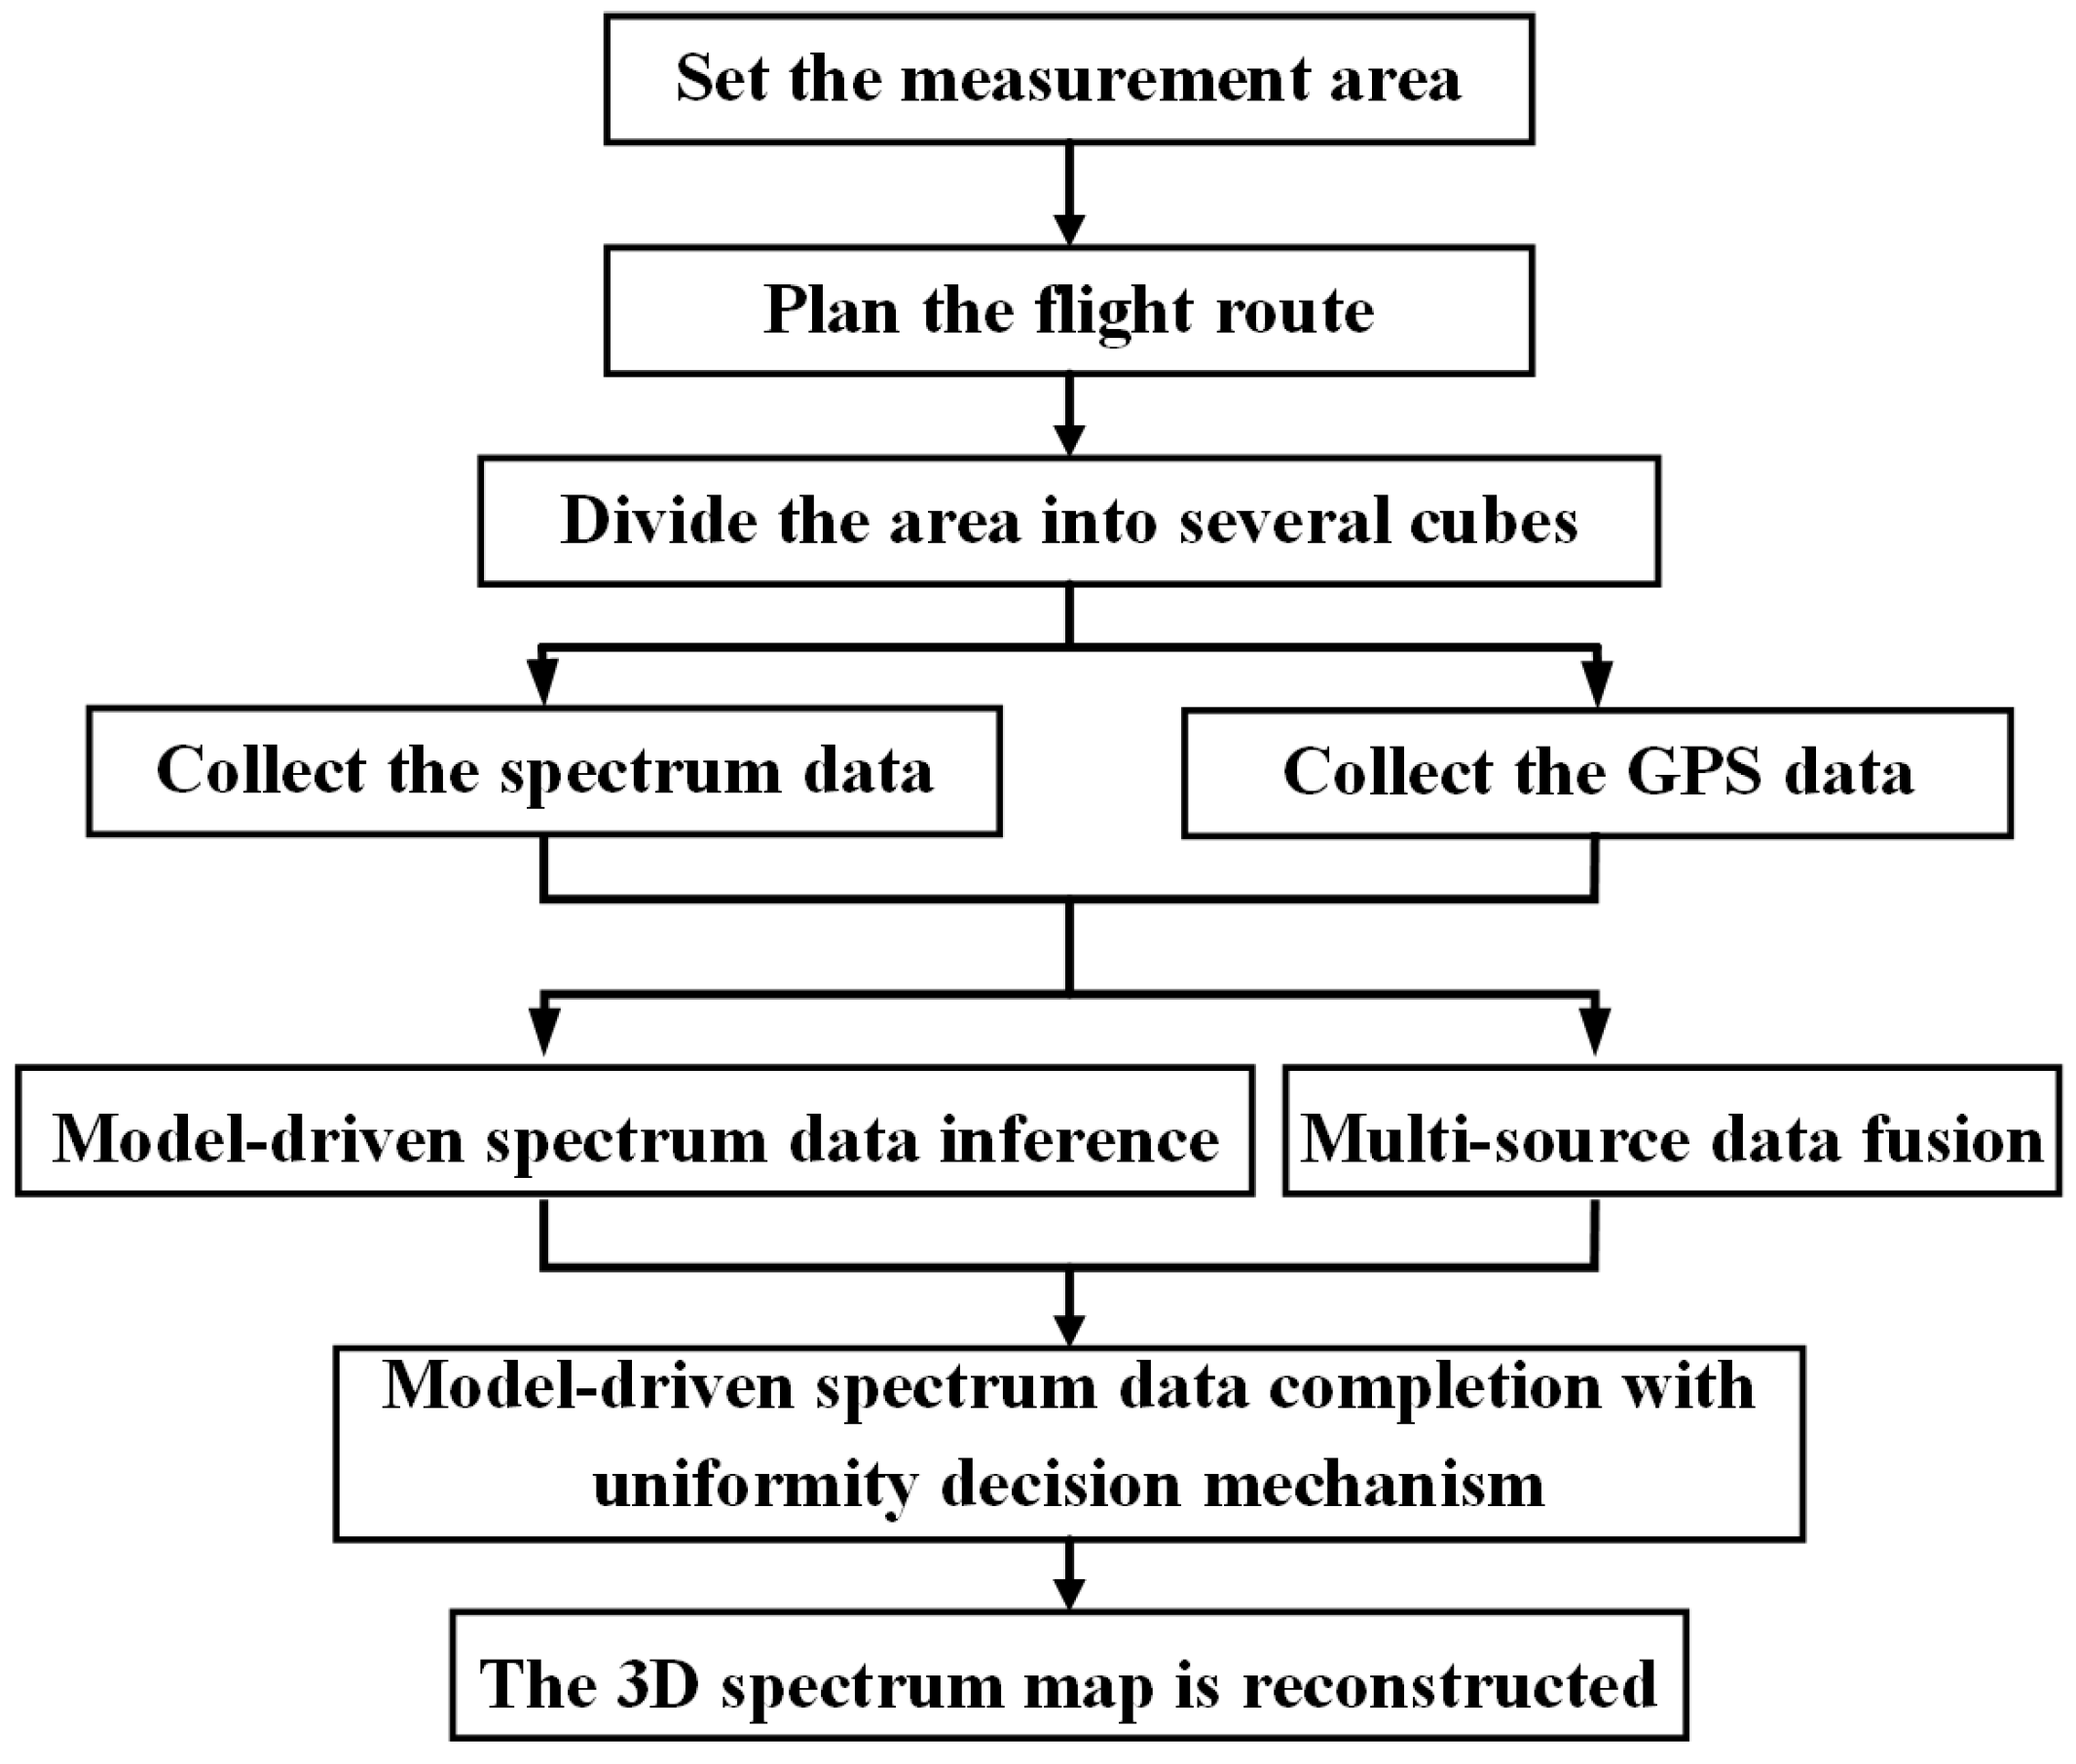
2.2. Spectrum Map Reconstruction Scheme

Spectrum maps adopt the form of thermodynamic diagram to represent the received signal strength (RSS) or other radio parameters in spatial domain. In our case, the reconstructed spectrum map indicates the spatial distribution of RSS, which means that different colors are used in denoting different RSS values.
According to the start point and the end point of the measurement area, a 3D rectangular coordinates system is established. Then, the measurement area is divided into N 1 × N 2 × N 3 cubes according to our requirement. Number each cube according to their center point coordinates. The center point coordinates of the cube with the serial number n 1 , n 2 , n 3 are ( n 1 0.5 ) × d 1 , ( n 2 0.5 ) × d 2 , ( n 3 0.5 ) × d 3 , where d 1 , d 2 and d 3 are the length, width, and height of the cube, respectively. After the area partition is completed, the spectrum data of the entire measurement area can be modeled as a three-order tensor χ N 1 × N 2 × N 3 . The tensor is the extension of the matrix, the element x n 1 , n 2 , n 3 in the spectrum tensor χ denotes the RSS value of the cube whose serial number is n 1 , n 2 , n 3 .
The flowchart of the spectrum map reconstruction scheme is shown in Figure 2, and the schematic diagram of the reconstruction scheme is shown in Figure 3. When the aerial platform of the UAV-assisted spectrum mapping system flies over the measurement area, the aerial platform measures and records the RSS value of the cube where the UAV is located currently. Meanwhile, it infers the RSS values of the cubes that the current directional antenna receiving direction vectors come by according to the propagation model. Then the final RSS values of these cubes are determined by a multi-source spectrum data fusion method if there are two or more inferred values on the cubes. When the planned flight route is completed, a model-driven spectrum data completion method with uniformity decision mechanism is used to reconstruct the 3D spectrum map of the entire measurement area. Note that we use the collected data from the directional antenna only when inferring the spectrum data.

3. Model-Driven Spectrum Data Interference

3.1. Propagation Channel Model

RSS depends on the path loss (PL) model (i.e., the propagation channel model) and the transmitting power of all radiation sources in the entire measurement area. In this paper, the considered PL model is determined by the characteristics of the propagation environment [17,23]. We consider log-normal shadowing environments for fading channel analysis.
In the log-normal channel, RSS measurements (in dB) obey a normal distribution. The ideal RSS P r x of a certain cube can be expressed as:
P i r x dBm = P i t x dBm L i dB P i r x [ mW ] = 10 P i r x dBm / 10 P r x [ mW ] = i = 1 N t x P i r x [ mW ] ,
where P i t x is the transmitting power of i-th radiation source, and L i is the path loss between the cube and the i-th radiation source.
Note that it is important to choose an appropriate propagation model, since it directly affects the performance of the model-driven RSS inference and completion methods [24]. Traditional close-in (CI) model are only applicable for land mobile communications, and most of them do not consider the antenna height factor [25]. To address this problem, the UAV technique is used for spectrum mapping in this paper, in which UAV heights are considered when calculating the path losses [26].
The used PL model remains physically grounded to the free space path loss at a close-in distance while the path loss exponent (PLE) dependence on UAV heights should be added as well, which emphasizes the importance of PLE and encapsulates a fundamental physical basis of frequency dependence due to Friis’ equation as:
L f c , d , h UAV dB = 32.4 + 20 log 10 f c + 10 A + h UAV B · log 10 d + χ σ ,
where A and B are the parameters that depend on the environment and may be quite different in different scenarios such as line-of-sight (LoS) and non-line-of-sight (NLoS) scenarios; χ σ is a zero-mean Gaussian variable representing the factor of shadow fading; and d, f c and h UAV are the distance, the carrier frequency and the UAV height, respectively.

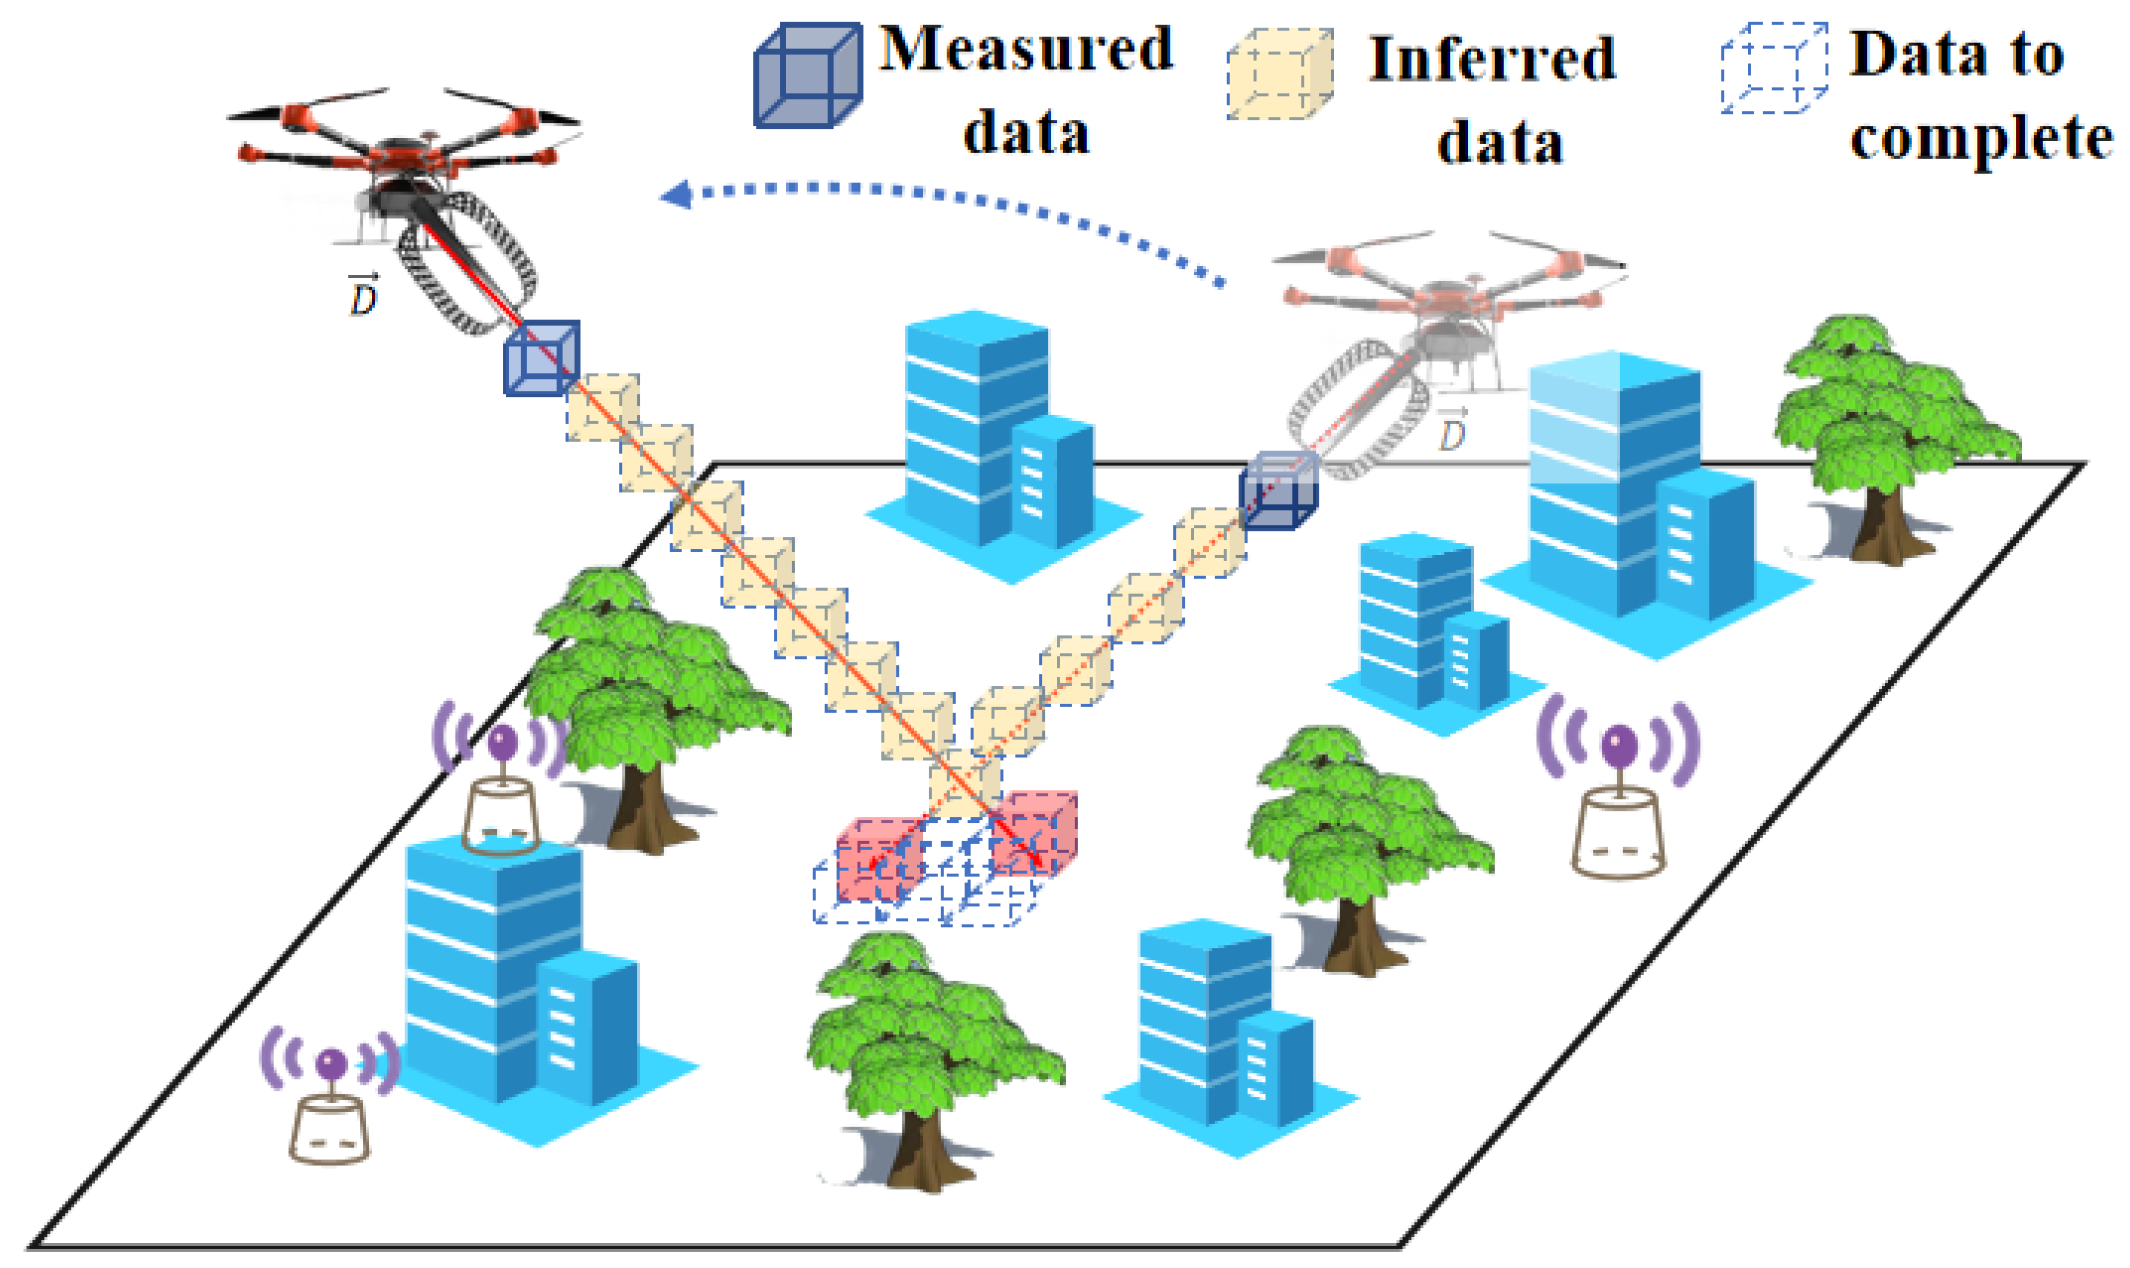
3.2. Spectrum Data Inference

Let P r , dir be the RSS value of the current position of the UAV whose rectangular coordinate is X UAV , Y UAV , Z UAV , which is measured by the directional antenna. When P r , dir is strong enough, there exists a radiation source in the beam direction of the used directional antenna. Under this condition, the spectrum data inference is feasible. Assume that most radiation sources are on the ground. We use the following equations to determine if the RSS value is strong enough, as given by:
Δ P = P ^ T P r , dir ,
θ ^ , φ ^ = arg min θ , φ P r , dir P ^ T G r θ , φ L f c , d = h U A V cos θ , h U A V ,
P ^ T G r θ ^ , φ ^ L h U A V , f c , d = h U A V cos θ ^ P r , dir ε ,
where P ^ T is the transmitting power of the equivalent radiation source near the current position of the UAV, which is estimated based on the measured RSS values collected by the omnidirectional antenna near the current position of the UAV; θ ^ , φ ^ are the estimated spherical coordinates of the directional antenna receiving direction vector D ; G r θ , φ is the pattern function of the directional antenna; ε is the maximum permissible error; and P r , d i r is judged to be strong enough when Equation (5) is workable.
As shown in Figure 3, since the directional antenna is used, the inferred RSS values of these cubes in its receiving direction can be obtained by:
P n 1 , n 2 , n 3 ( d B m ) = P r , dir G r θ ^ , φ ^ + L
where n 1 , n 2 , n 3 is the index of the cubes that the directional antenna receiving direction vector D comes by; and L is the path loss between the UAV’s location and the center point of the cube to be inferred. The serial numbers of the cubes to be inferred can be calculated as:
x X UAV a = y Y UAV b = z Z UAV c ( n 1 1 ) × d 1 < x n 1 × d 1 ( n 2 1 ) × d 2 < y n 2 × d 2 ( n 3 1 ) × d 3 < z n 3 × d 3 0 z Z UAV n 1 = 1 , 2 , , N 1 n 2 = 1 , 2 , , N 2 n 3 = 1 , 2 , , N 3 ,
where a , b , c are the 3D rectangular coordinates of the directional antenna receiving direction vectors D .

3.3. Multi-Source Data Fusion

When the UAV flies in the measurement area, the flight route and the directional antenna orientation are decided by the users. Thus, some cubes may be located on two or more directional antenna receiving direction vectors when the UAV locates at different positions, as shown in Figure 3. In this case, the multi-source spectrum data fusion is necessary in order to determine the final RSS values of these cubes.
Considering the RSS of a cube may be affected by two and more radiation sources, it is reasonable that the sum of the inferred and measured RSS values of the cube approaches to the real RSS value. Therefore, when there are two or more inferred values or the measured values on the same cube, the final RSS value of the cube can be calculated as:
P n 1 , n 2 , n 3 , final = P ( n 1 , n 2 , n 3 ) , inf _ i , P n 1 , n 2 , n 3 , mea ,
where P n 1 , n 2 , n 3 , final is the final RSS value of the cube whose serial number is n 1 , n 2 , n 3 ; P ( n 1 , n 2 , n 3 ) , inf _ 1 , . . . , P ( n 1 , n 2 , n 3 ) , inf _ N are the inferred RSS values of the cube according to Equation (6) when the UAV locates at different positions; and P n 1 , n 2 , n 3 , mea is the measured RSS value if the UAV passed the cube.

4. Model-Driven Spectrum Data Completion with Uniformity Decision Mechanism

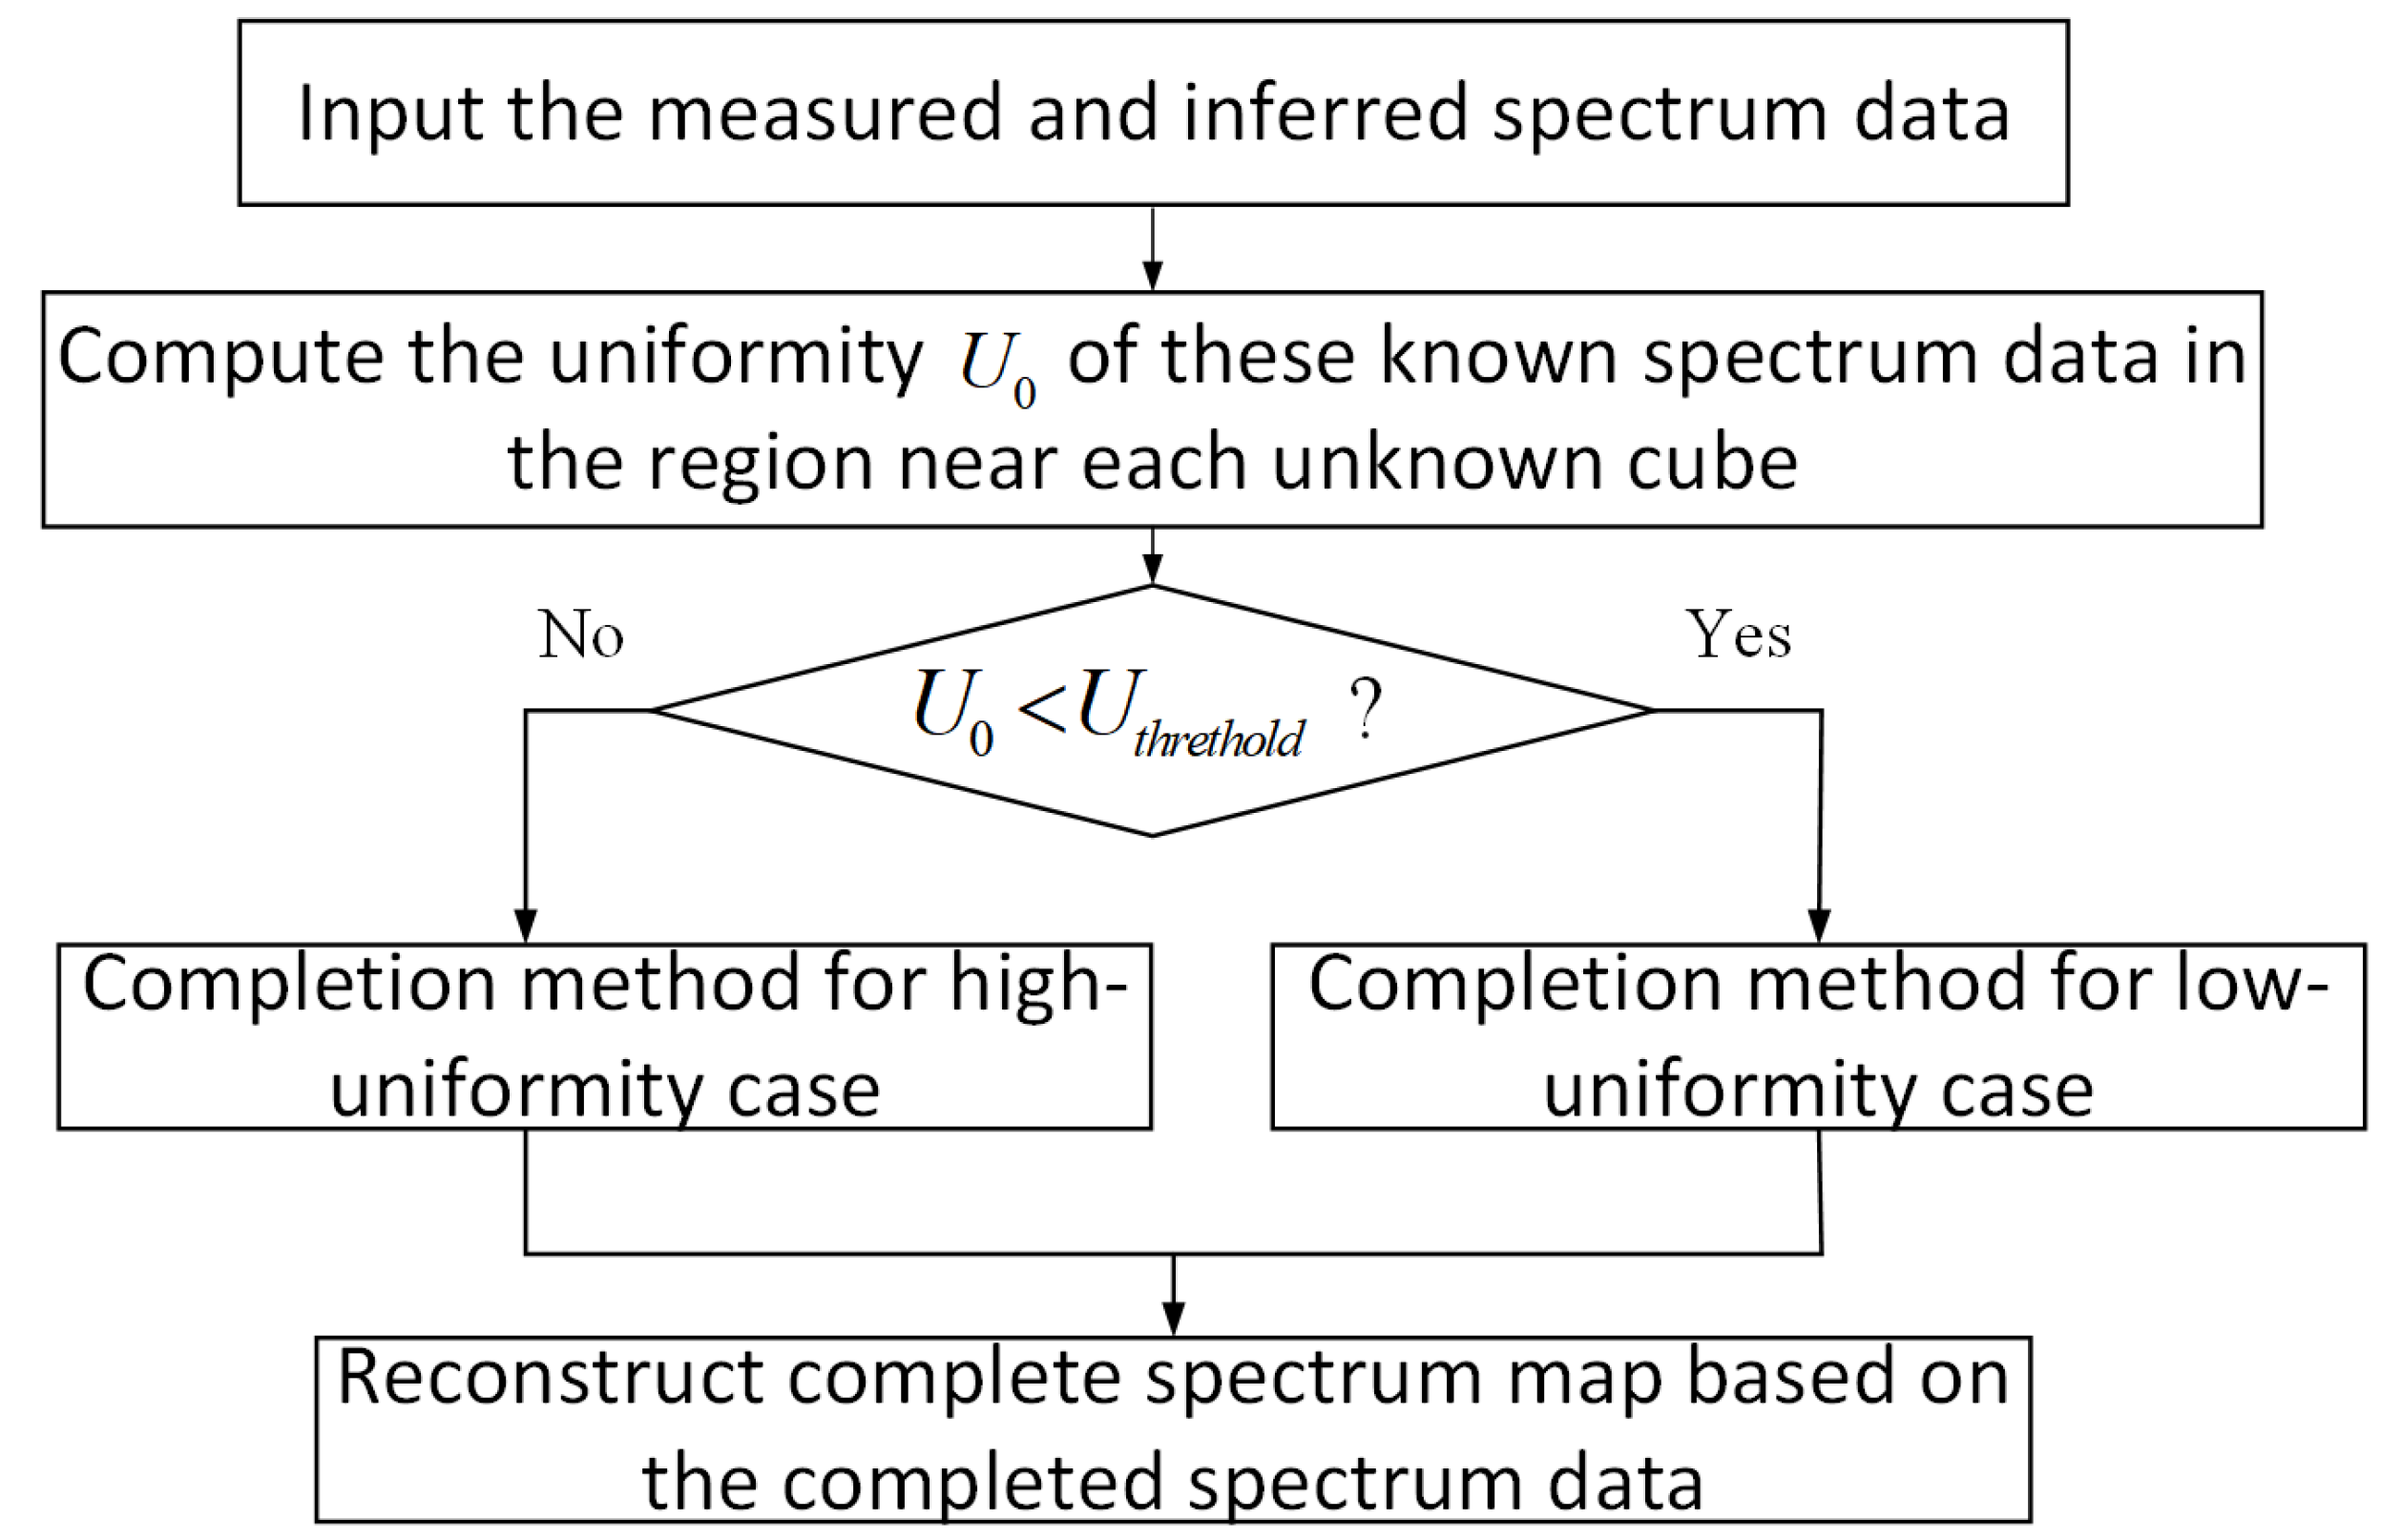
4.1. Completion Scheme

After the measurement and inference of the spectrum data, there are still some cubes whose RSS values are unknown. Thus, an appropriate spectrum data completion method is necessary to reconstruct the complete spectrum map of the measurement area. In this section, we estimate the RSS values of these unknown cubes without the inferred or measured data. Note that the measured data used by the completion method are collected by the omnidirectional antenna. The flowchart of the proposed model-driven spectrum data completion method with uniformity decision mechanism completion method is shown in Figure 4.
Specifically, we first compute the 3D spatial distribution uniformity U 0 of these known RSS data in the region near each unknown cube without the measured or inferred RSS data after spectrum data inference. Secondly, we choose the appropriate completion method according to the computed uniformity U 0 . When U 0 is equal or greater than the set threshold value U t h r e s h o l d , the spectrum data interpolation method driven by spectrum data and channel model is chosen as the completion method to estimate the RSS value of the unknown cube. When U 0 < U t h r e t h o l d , the equivalent radiation source location estimation based method is chosen. Lastly, the spectrum map of the entire measurement area is reconstructed based on the completed RSS data.

4.2. 3D Spatial Distribution Uniformity Computation

In order to determine whether the measured and inferred spectrum data are evenly distributed in the measurement area, we propose a 3D spatial distribution uniformity computation algorithm.
In order to estimate the RSS P S 0 of the cube without the measured and inferred data whose center point is S 0 and coordinates are x 0 , y 0 , z 0 , we firstly choose the region that only contains S 0 and the center points S i , i = 1 , , N of N cubes with known RSS data are the nearest to S 0 as the computing region, whose coordinates are x i , y i , z i , i = 1 , , N . The points S 0 and S i are regarded as sample points. Secondly, we divide the entire computing region into several first-level unit cubes, which cover the entire computing region. The volume of each first-level unit cube is the ratio of the total volume of the computing region to N + 1 . Thirdly, we divide these first-level unit cubes where the number of S 0 and S i is greater than one into 8 second-level unit cubes with the same volume. Fourthly, we divide these second-level unit cubes where the number of S 0 and S i is greater than one into 8 third-level unit cubes with the same volume. Fifthly, we repeat the above steps until there is only 0 or 1 sample point in each divided unit cube. Lastly, we encode S 0 and S i according to which level unit cube it is located in, it can be expressed as follows:
C l = 1 8 t 1 ,
where C l is the coded value of the point S l , l = 0 , , N , and t represents that S l is located in t-level unit cube. Furthermore, the 3D spatial distribution uniformity U 0 of these known RSS data in the computing region can be expressed as follows:
U 0 = l = 0 N C l N + 1 .
U 0 is a decimal that is greater than 0 and less than 1, the greater the uniformity U 0 is the more evenly the known measured and inferred data are distributed.

4.3. Completion Method for High-Uniformity Case

Conventional IDW methods are based on the assumption that the unknown RSS values are close to the measured counterparts [27,28]. These methods only take the impact of the distance into consideration, while the other factors, e.g., the antenna angle and the path loss, which affect the RSS in real electromagnetic propagation environments, are ignored [29].
Firstly, we take into account that the distance factor based on the modified Shepard’s method (MSM), which is an enhanced inverse distance weighted interpolation method based on the mathematical functions [11]. The distance factor can be expressed as follows:
p i = 1 d i if 0 < d i r 3 27 4 r d i r 1 2 if r 3 < d i r ,
where d i is the Euclidean distance between S i and S 0 , and r denotes the radius of the influence area which has N known RSS values.
Then, we take into account that the angle factor based on the method proposed in [30], which considers all the possible set of angles that the position of each known data makes with all the positions of all other known data, the angles are used to compute the effect of direction of the positions of the known data. The angle factor can be expressed as follows:
a i = j = 1 , j i N p i 1 cos φ i j j = 1 , j i N p i ,
cos φ i j = v i v j v i × v j , v i = ( x i x 0 ) , ( y i y 0 ) , ( z i z 0 ) , v j = ( x j x 0 ) , ( y j y 0 ) , ( z j z 0 ) .
Lastly, we consider the characteristics of the propagation environment of the measurement area synthetically, which can be expressed as follows:
l i = L i 1 j = 1 N L j 1 ,
where L i is the path loss between S i and S 0 . L i is depends on the used channel model such as the free space propagation model and the path loss model in Equation (2), so the proposed completion method for high-uniformity case is a spectrum data interpolation method driven by spectrum data and channel model.
Simultaneously considering all aforementioned factors, the weighing factor w i of the RSS value of S i can be calculated as:
w i = p i t 1 1 + a i t 2 ( l c + l i ) t 3 j = 1 N p j t 1 1 + a j t 2 ( l c + l j ) t 3 ,
where t 1 , t 2 and t 3 are used to control the impact on weights of the distance, angle and path loss factor, respectively. The estimated P ^ S 0 can be calculated as:
P ^ S 0 = i = 1 N ω i P S i ,
where P S 0 is the measured or inferred RSS value of the S i .

4.4. Completion Method for Low-Uniformity Case

When the known RSS data in the region near the unknown cube without the measured and inferred data are relatively unevenly distributed, the assumption that the RSS value of S 0 is decided by an equivalent radiation source whose location and transmitting power are computed according to the RSS values of N cubes with the known RSS values closest to S 0 is reasonable. We hence adopt a 3D equivalent radiation source location estimation based method whose basis is the LIvE method in [17] to compute the RSS of S 0 , it can be expressed as follows:
A = 2 x 1 2 y 1 2 z 1 10 G P L P S 1 5 A 1 2 x 2 2 y 2 2 z 2 10 G P L P S 2 5 A 1 2 x N 2 y N 2 z N 10 G P L P S N 5 A 1 , θ = x t y t z t 10 P t 5 A x t 2 + y t 2 + z t 2 ; b = x 1 2 + y 2 2 + z 2 2 x 2 2 + y 2 2 + z 2 2 x N 2 + y N 2 + z N 2 , G P L = 32.4 + 20 log 10 f c , θ = A T A 1 A T b ; h UAV = z t ; d = ( x 0 x t ) 2 + ( y 0 y t ) 2 + ( z 0 z t ) 2 , P ^ S 0 = P t L f c , d , h UAV ,
where x t , y t , z t is the coordinate of the equivalent radiation source, A is the parameter in Equation (2), and P t is the transmitting power of equivalent radiation source.

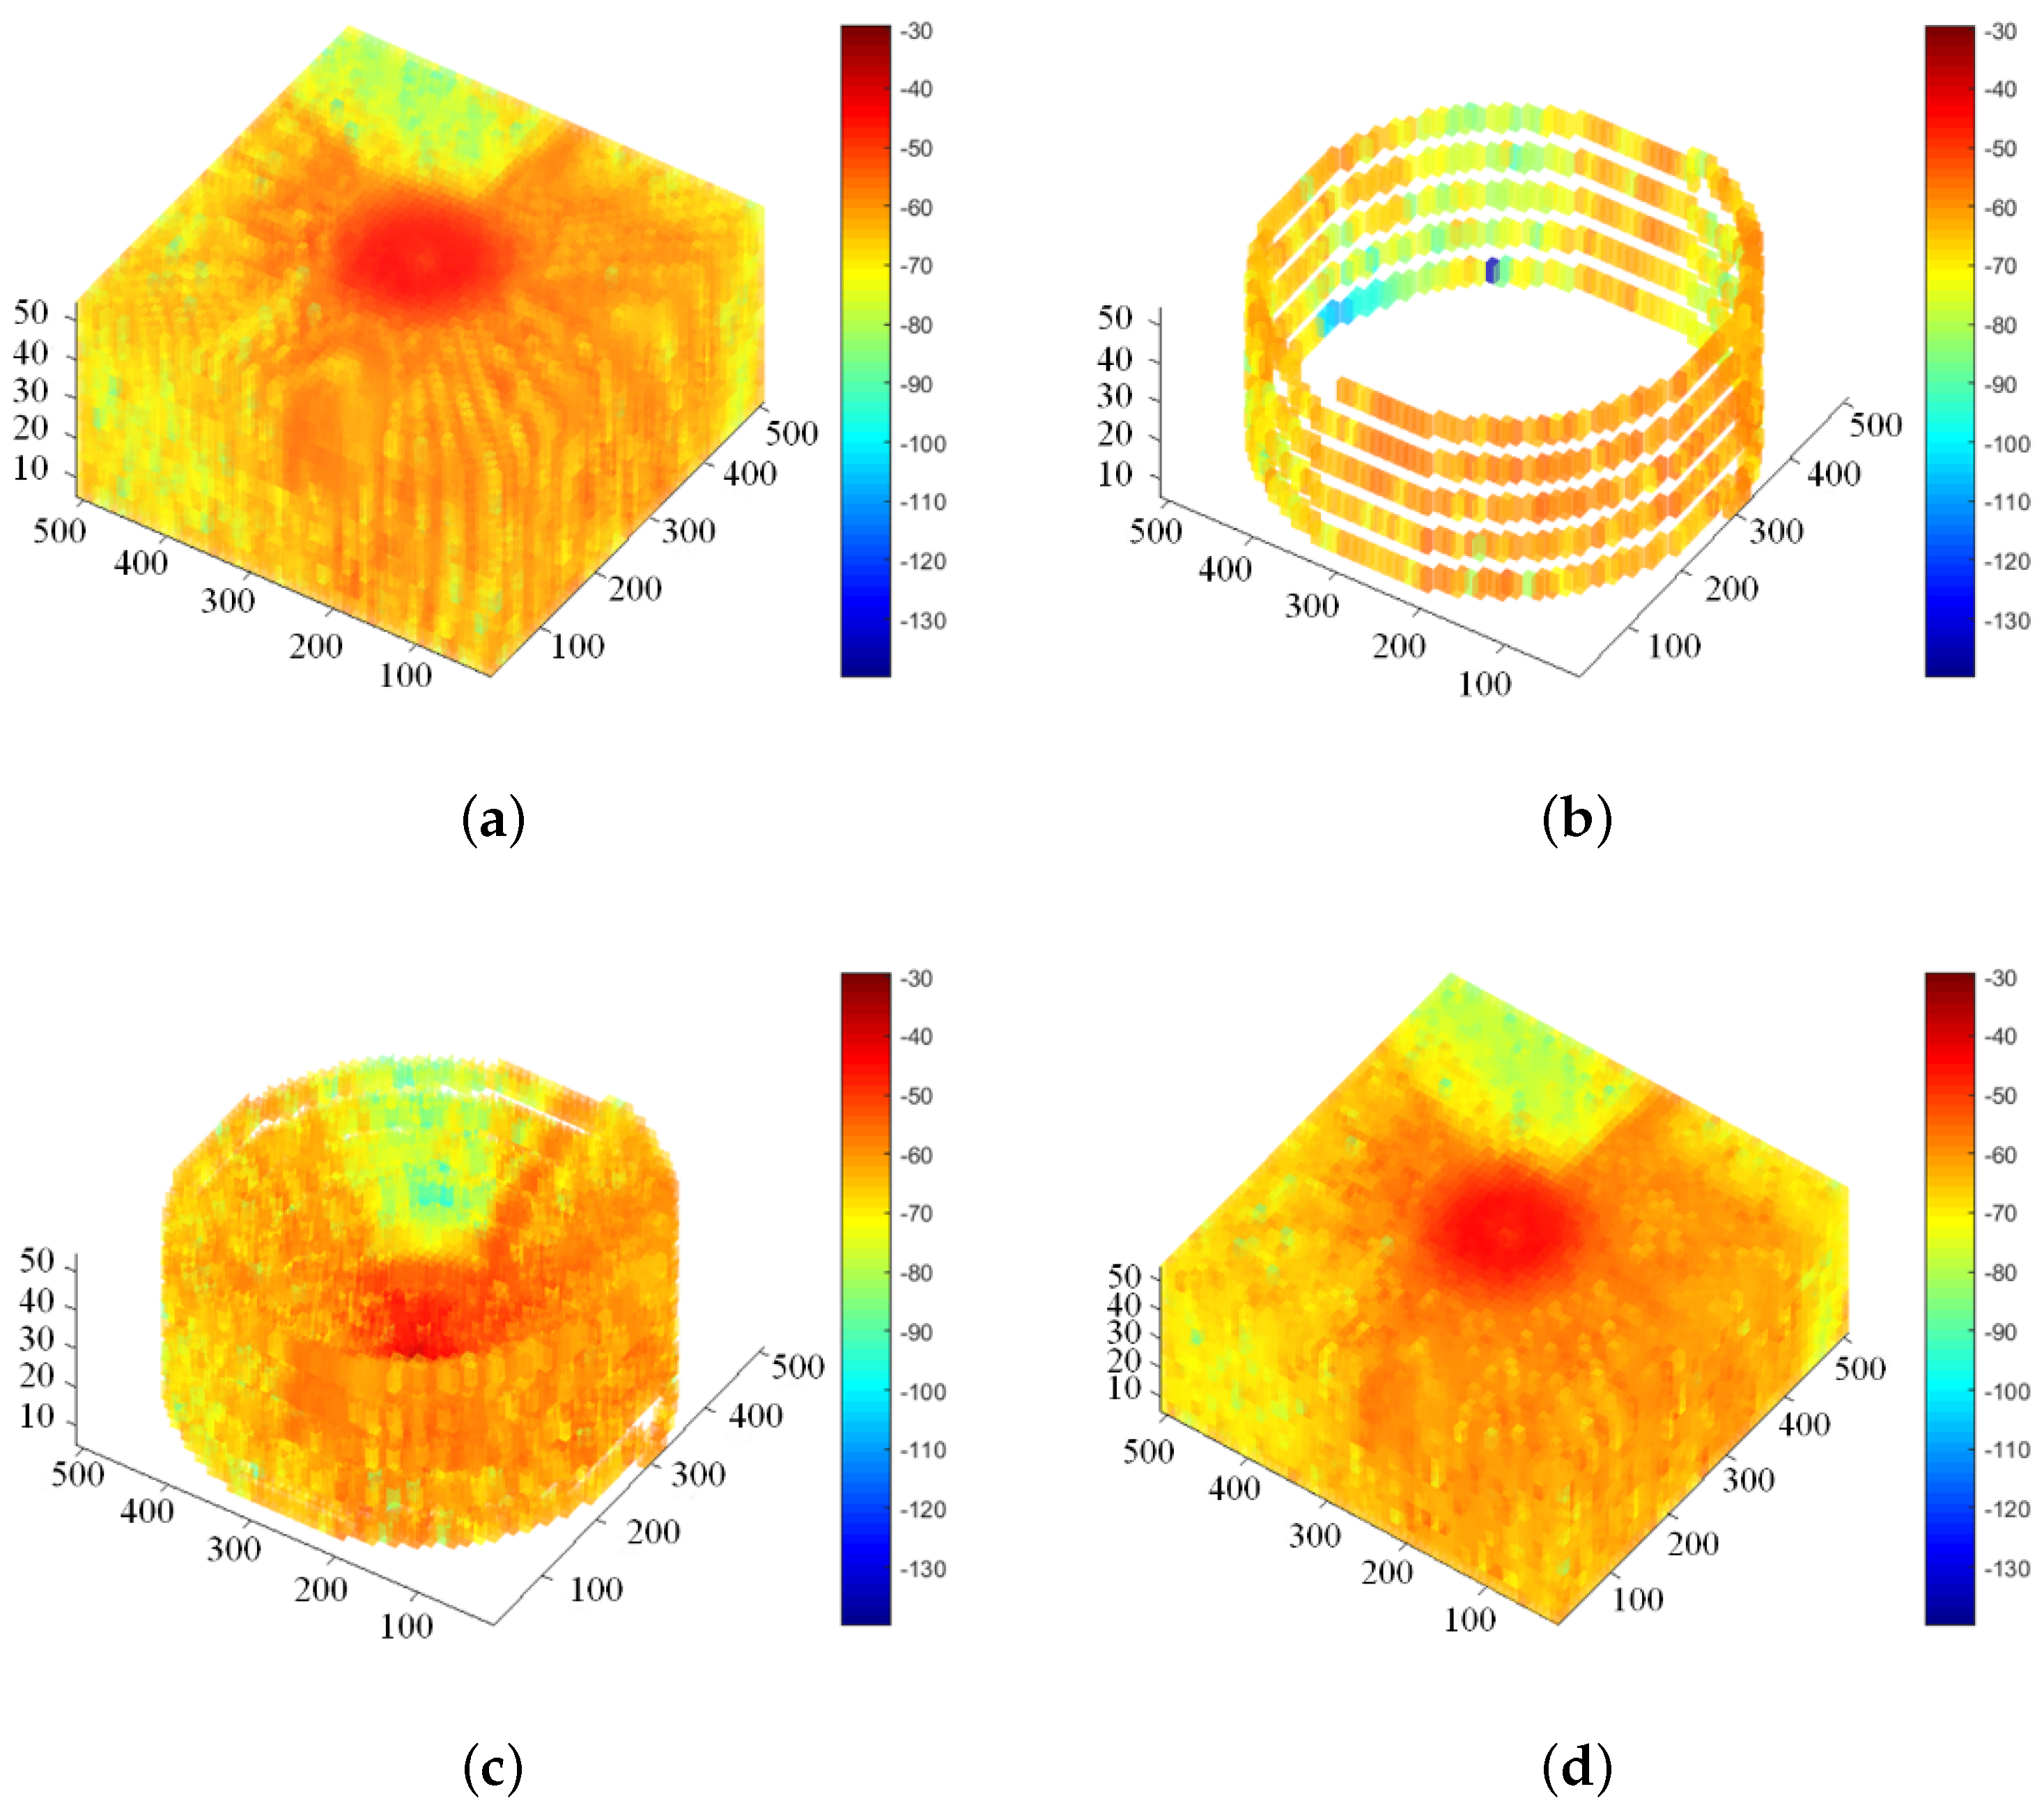
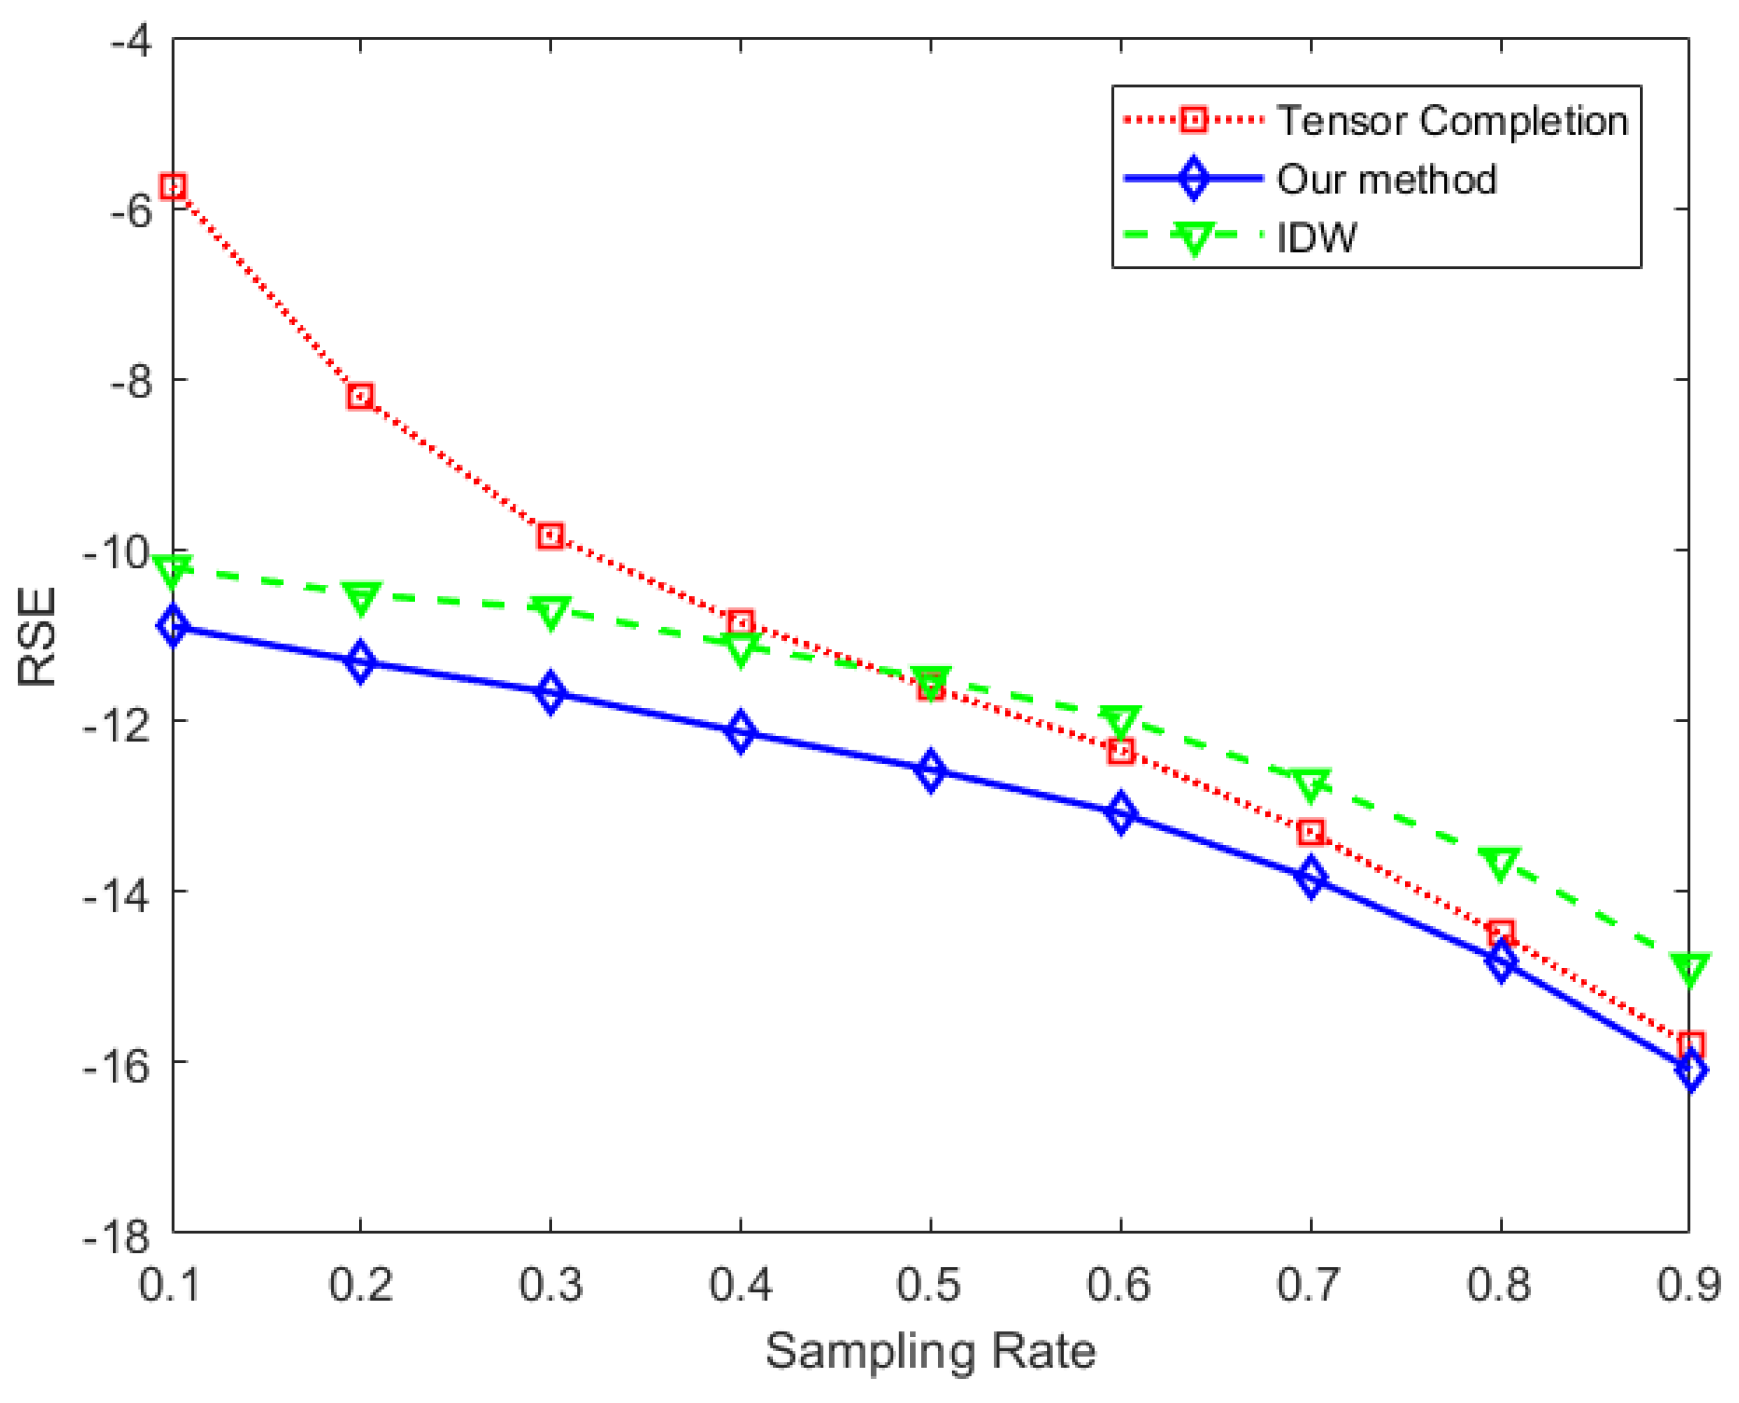
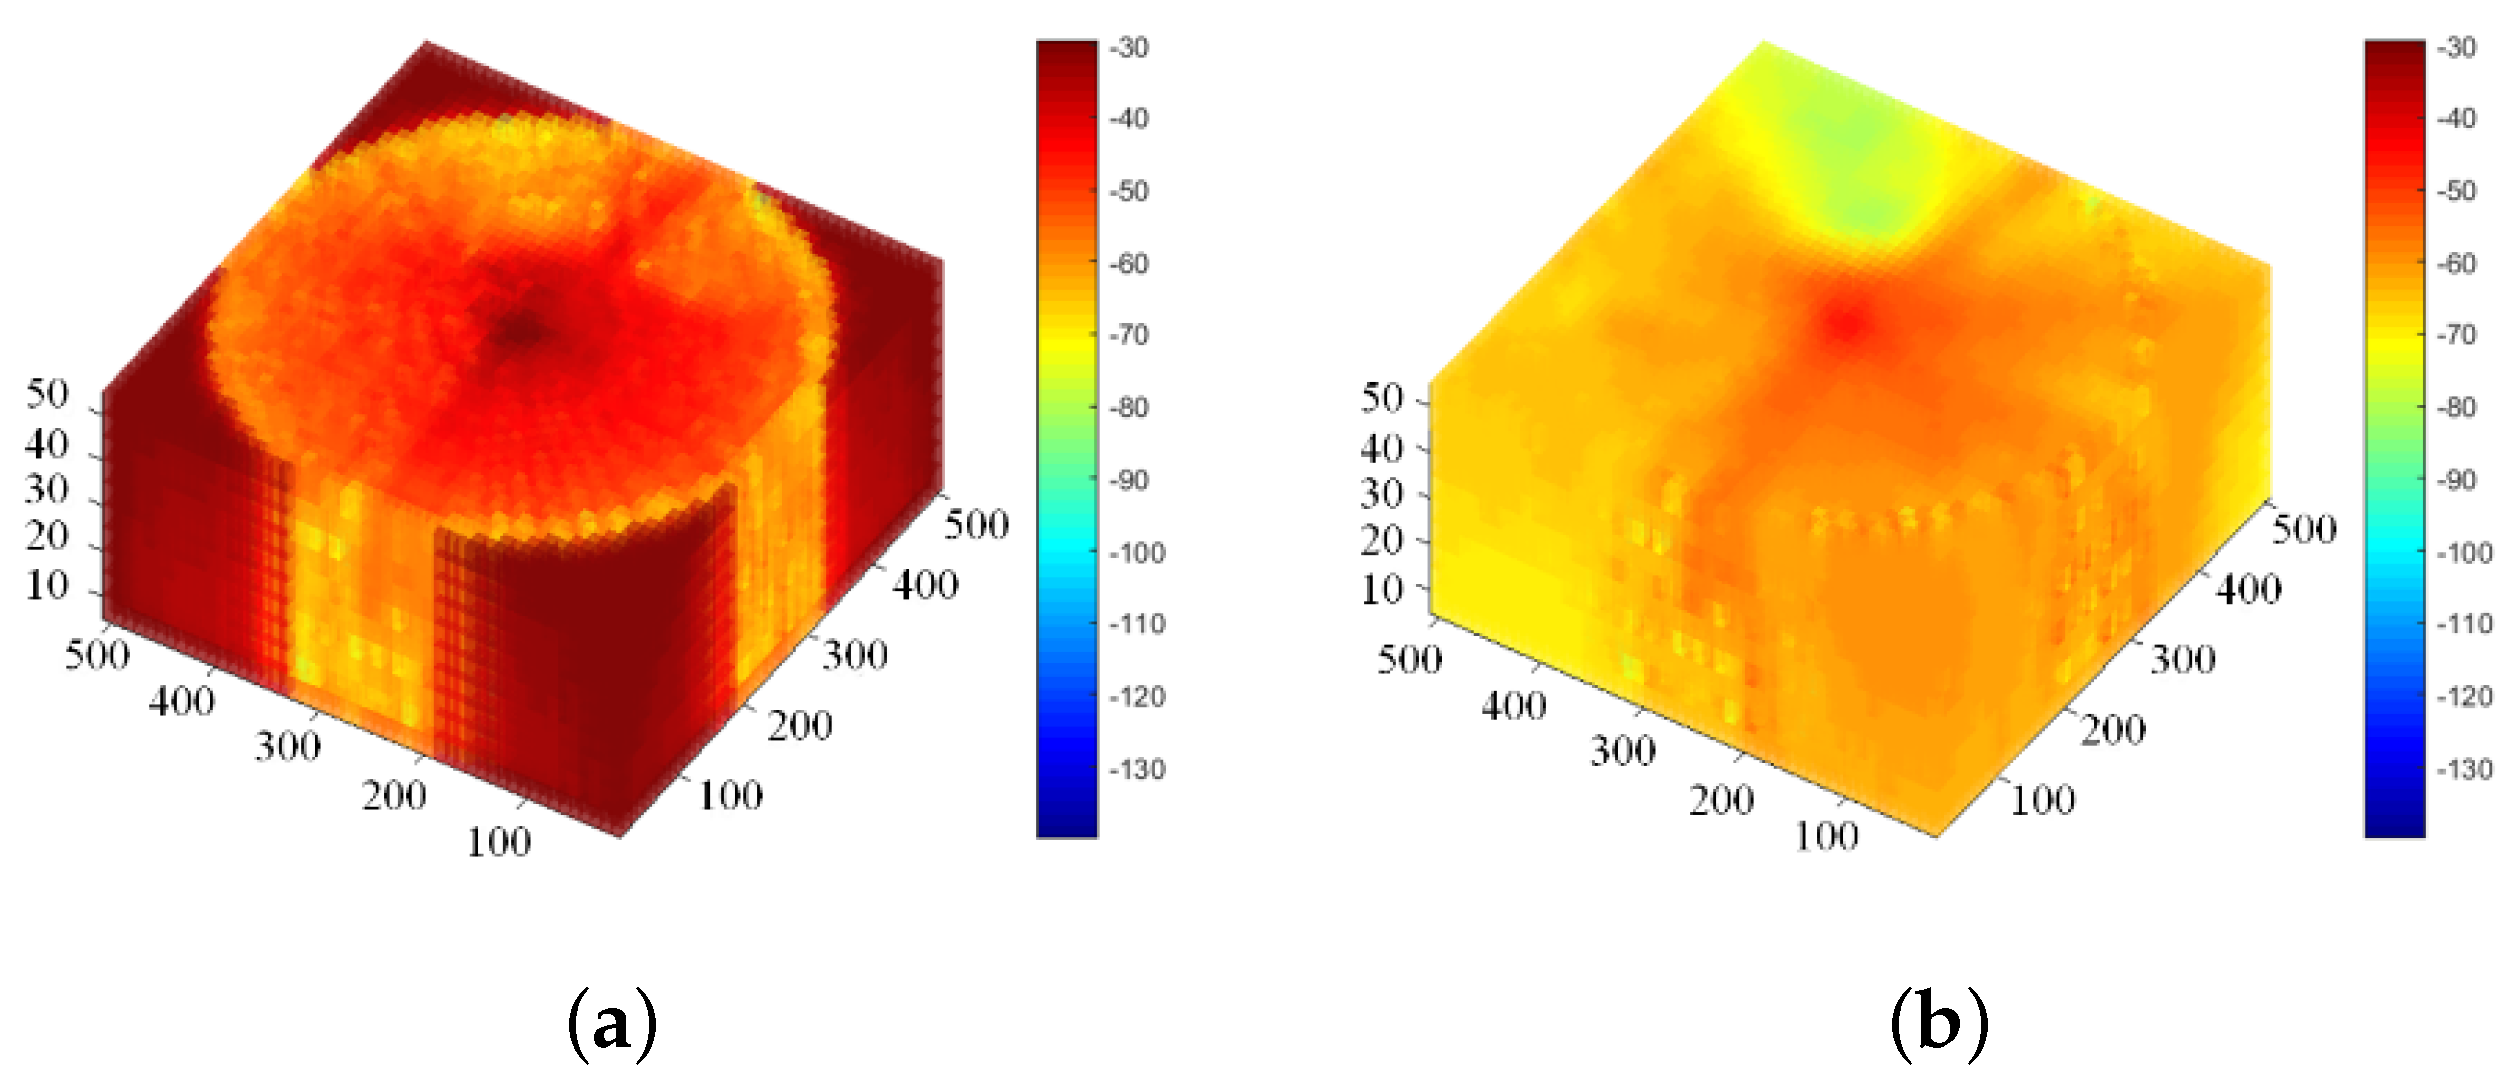
5. Simulation Results and Analysis

Generally, the field measurement for UAV channels is very hard and costly. Some channel modeling methods based on the ray-tracing (RT) simulations have been presented as an alternative option [31,32]. Similarly, it is impossible to acquire all spectrum data of the measurement area in a real world. However, it is necessary for the performance evaluation of the spectrum map construction methods to acquire all spectrum data of the measurement area. In this case, we leverage the RT technique to acquire the simulation spectrum data used for the performance evaluation.
Since the 90s, the RT technique has been widely used for radio propagation modeling, which has good performance for the small specific area and high frequency. All possible propagation paths by tremendous amounts of rays are considered by RT technique. When these rays interact with the scatterer surface and wedge, they can be reflected and diffracted. After all rays are tracked with the forward technique or the reverse technique, propagation parameters, i.e., electric field intensity or received signal strength of each ray, can be acquired. In this article, we only concentrate on the received signal strength.
In this section, we evaluate the effectiveness and performance of the proposed spectrum mapping method. We also compare the proposed method with two existing spectrum map reconstruction methods, i.e., the IDW method and the tensor completion method. The satellite and side view of the measurement area in Nanjing, China, is given in Figure 5. A radiation source with 100 MHz center frequency and 0 dBm transmitting power, is set at the center of the measurement on the ground. The measurement area is a typical campus scenario. There are 9 buildings with the heights from 19 m to 35 m, and most of them are about 20 m. The dimensions of terrain are 500 m by 500 m, which means there are about 7.7854 × 10 5 buildings per square meter. The height of the measurement area ranges from 10 m to 55 m. The UAV carrying the spectrum sensor equipped with a directional antenna and an omnidirectional antenna flies all over the area at the height of 10, 15, 20, 25, 30, 35, 40, 45, 50 and 55 m, respectively, and then it obtains the simulated RSS data of the entire measurement area. The pattern functions of two antennas are known. The length, width and height of a cube are set to 10, 10 and 5 m, respectively. The measurement area is divided into 50 × 50 × 10 cubes, and therefore the RSS data of the entire measurement area can be modeled as the tensor χ 50 × 50 × 10 . The rest parameters are given in Table 1.
In the simulation, the flight route of the UAV is spiral as shown in Figure 5b, where the directional antenna used to collect RSS data always points to the center of the measurement area on the ground. Figure 6 presents the reconstruction process of our proposed spectrum mapping scheme. The reconstruction result is shown in Figure 6d, which verifies the effectiveness of our proposed spectrum mapping scheme when the collected spectrum data is limited (the RSS sampling rate is approximately 3.37%). Figure 6a is the simulation result of acquired by RT technique. The impact of the buildings in the measurement area is considered, and therefore there exist some abrupt changes in the simulation result. It should be noted that the data collected by the directional antenna are used only when making the spectrum data inference, so the data shown in Figure 6 are collected by the omnidirectional antenna.
In order to measure the reconstruction performance of the spectrum map reconstruction methods, we define the root square error (RSE) as:
R S E dB = 10 log 10 χ ˜ χ 2 χ 2 ,
where χ ˜ is the reconstructed tensor, and χ is the original simulation spectrum tensor.
When comparing the performance of the spectrum data processing methods, we sample the data randomly, so that only a part of entries is retained in the spectrum tensor. The sampling rate indicates the percentage of the observed elements in the tensor. Figure 7 compares the RSE of our proposed method with the classical IDW method and the tensor completion method versus the sampling rates. In the simulation, the adopted tensor completion method is High Accuracy Low Rank Tensor Completion (HaLRTC). It can be seen that when sampling rate is low, i.e., the amount of valid observed measurements is small, our proposed method is relatively accurate and stable, while the reconstruction performance of the tensor completion is very terrible. The reconstruction performance of the IDW method is worse than our proposed method. This is because we exploit the characteristics of the propagation environment (i.e., PL model).
In practice, random sampling is very difficult because the trajectory of the UAV is consecutive and regular. Figure 8 shows the reconstructed data of the IDW method and the tensor completion method when continuous and regular sampling is used (such as the case shown in Figure 6c). Besides, these sampling data shown in Figure 6c are relatively unevenly distributed in the measurement area. The sampling rate is roughly equivalent to 0.5. It can be seen that the reconstruction performance of the tensor completion method is very poor when there are continuous and regular losses in the spectrum tensor even if the sampling rate is high. Our method is still relative accurate in this case (see Figure 6a,d). The RSE of our method is −11.4513 dB, while the RSE of the tensor completion is −5.8758 dB, and the RSE of the IDW method is −10.0421 dB. The results show that our proposed scheme outperforms the IDW method and tensor completion method by about 12.5% and 92.3% respectively in terms of reconstruction accuracy, when the collected spectrum data are regularly missing, unevenly distributed and limited.

6. Conclusions

In this paper, the UAV-assisted spectrum mapping scheme and the spectrum data reconstruction algorithm have been presented. Driven by the spectrum data and the channel model, the spectrum data reconstruction algorithm can infer and complete the spectrum data by employing the uniformity decision mechanism. In the proposed spectrum mapping scheme, the UAV carrying the spectrum sensor equipped with an omnidirectional antenna and a directional antenna flies over the measurement area to acquire the multi-dimensional spectrum situation information, and then the reconstruction algorithm is used to acquire the complete spectrum data of the entire measurement area, and finally the 3D spectrum map is reconstructed, which enables inference of environmental characteristics such as locations of transmitters, prevailing propagation conditions, and estimates of spectrum usage over time and space. The performance of the proposed mapping scheme has been evaluated in the campus scenario by comparing with the ray-tracing simulated data. The analyzed results have shown that our proposed scheme outperforms the IDW method and the tensor completion method by about 12.5% and 92.3% respectively in reconstruction accuracy, when the collected spectrum data is regularly missing and limited. In the future, the frequency and time information will be taken into account when measuring spectrum data. In this way, the amount of the information in the reconstructed multi-dimensional spectrum map can be increased significantly.

Author Contributions

Conceptualization, X.D. and Q.Z.; investigation, X.D., J.L., W.Z. and T.L.; software, L.H.; writing—original draft preparation, X.D., Q.Z. and Q.W.; writing—review and editing, Z.L., X.D., Q.Z., G.D., J.L. and W.Z.; funding acquisition, Q.Z. and Q.W. All authors have read and agreed to the published version of the manuscript.

Funding

This work was supported in part by the National Key Scientific Instrument and Equipment Development Project under Grant No. 61827801, in part by the open research fund of State Key Laboratory of Integrated Services Networks, No. ISN22-11, and in part by the Fundamental Research Funds for the Central Universities, No. NS2020026 and No. NS2020063.

Institutional Review Board Statement

Not applicable.

Informed Consent Statement

Not applicable.

Data Availability Statement

The codes used for the numerical computations are available upon request.

Acknowledgments

The authors are thankful to anonymous reviewers for their instructive reviewing of the manuscript.

Conflicts of Interest

The authors declare no conflict of interest.

Abbreviations

The following abbreviations are used in this manuscript:
3DThree-dimensional
RSSReceived signal strength
UAVUnmanned aerial vehicle
IDWInverse distance weighted
LIvELocatIon Estimation based method

References

  1. Tang, M.; Zheng, Z.; Ding, G. Efficient TV white space database construction via spectrum sensing and spatial inference. In Proceedings of the 34th International Performance Computing and Communications Conference (IPCCC 2015), Nanjing, China, 14–16 December 2015; pp. 1–5. [Google Scholar]
  2. Ding, G.; Wu, Q.; Zhang, L.; Yun, L.; Tsiftsis, T.A.; Yao, Y. An Amateur Drone Surveillance System Based on the Cognitive Internet of Things. IEEE Commun. Mag. 2018, 56, 29–35. [Google Scholar] [CrossRef] [Green Version]
  3. Apaza, R.D.; Knoblock, E.J.; Li, H. A New Spectrum Management Concept for Future NAS Communications. In Proceedings of the 39th Digital Avionics Systems Conference (DASC), San Antonio, TX, USA, 11–16 October 2020; pp. 1–7. [Google Scholar]
  4. Pesko, M.; Javornik, T.; Kosir, A.; Stular, M.; Mohorcic, M. Radio Environment Maps: The Survey of Construction Methods. KSII Trans. Internet Inf. Syst. 2014, 81, 3789–3809. [Google Scholar]
  5. Vanhoy, G.; Volos, H.; Bastidas, C.E.C.; Bose, T. A Spatial Interpolation Method for Radio Frequency Maps Based on the Discrete Cosine Transform. In Proceedings of the 2013 IEEE Military Communications Conference (MILCOM 2013), San Diego, CA, USA, 18–20 November 2013; pp. 1045–1050. [Google Scholar]
  6. Jayawickrama, B.A.; Dutkiewicz, E.; Oppermann, I.; Fang, G.; Ding, J. Improved performance of spectrum cartography based on compressive sensing in cognitive radio networks. In Proceedings of the 2013 IEEE International Conference on Communications (ICC 2013), Budapest, Hungary, 9–13 June 2013; pp. 5657–5661. [Google Scholar]
  7. Lu, J.; Zha, S.; Huang, J.; Liu, P.; Chen, G.; Xu, S. The iterative completion method of the spectrum map based on the difference of measurement values. In Proceedings of the 3rd International Conference on Signal and Image Processing (ICSIP 2018), Shenzhen, China, 13–15 July 2018; pp. 255–259. [Google Scholar]
  8. Zha, S.; Huang, J.; Qin, Y.; Zhang, Z. A Novel Non-Parametric Algorithm for Spectrum Map Construction. In Proceedings of the 2018 International Symposium on Electromagnetic Compatibility (EMC EUROPE 2018), Amsterdam, The Netherland, 27–30 August 2018; pp. 941–944. [Google Scholar]
  9. Chakraborty, A.; Rahman, M.S.; Gupta, H.; Das, S.R. SpecSense: Crowdsensing for efficient querying of spectrum occupancy. In Proceedings of the IEEE Conference on Computer Communications (IEEE INFOCOM 2017), Atlanta, GA, USA, 1–4 May 2017; pp. 1–9. [Google Scholar]
  10. Akimoto, M.; Wang, X.; Umehira, M.; Ji, Y. Crowdsourced Radio Environment Mapping by Exploiting Machine Learning. In Proceedings of the 22nd International Symposium on Wireless Personal Multimedia Communications (WPMC 2019), Lisbon, Portugal, 24–27 November 2019; pp. 1–6. [Google Scholar]
  11. Denkovski, D.; Atanasovski, V.; Gavrilovska, L.; Riihijärvi, J.; Mähönen, P. Reliability of a radio environment Map: Case of spatial interpolation techniques. In Proceedings of the 7th International ICST Conference on Cognitive Radio Oriented Wireless Networks and Communications (CROWNCOM 2012), Stockholm, Sweden, 18–20 June 2012; pp. 248–253. [Google Scholar]
  12. Melvasalo, M.; Koivunen, V.; Lundn, J. Spectrum maps for cognition and coexistence of communication and radar systems. In Proceedings of the 50th Asilomar Conference on Signals, Systems and Computers (ACSSC 2016), Pacific Grove, CA, USA, 6–9 November 2016; pp. 58–63. [Google Scholar]
  13. Janakaraj, P.; Wang, P.; Chen, Z. Towards Cloud-Based Crowd-Augmented Spectrum Mapping for Dynamic Spectrum Access. In Proceedings of the 25th International Conference on Computer Communication and Networks (ICCCN 2016), Waikoloa, HI, USA, 1–4 August 2016; pp. 1–7. [Google Scholar]
  14. Mao, D.; Shao, W.; Qian, Z.; Xue, H.; Lu, X.; Wu, H. Constructing accurate Radio Environment Maps with Kriging Interpolation in Cognitive Radio Networks. In Proceedings of the 2018 Cross Strait Quad-Regional Radio Science and Wireless Technology Conference (CSQRWC 2018), Xuzhou, China, 21–24 July 2018; pp. 1–3. [Google Scholar]
  15. Tang, M.; Ding, G.; Wu, Q.; Xue, Z.; Tsiftsis, T.A. A Joint Tensor Completion and Inference Scheme for Multi-Dimensional Spectrum Map Construction. IEEE Access 2016, 4, 8044–8052. [Google Scholar] [CrossRef]
  16. Huang, X.; Gao, Y.; Tang, X.; Wang, S. Spectrum Mapping in Large-Scale Cognitive Radio Networks with Historical Spectrum Decision Results Learning. IEEE Access 2018, 6, 21350–21358. [Google Scholar] [CrossRef]
  17. Yilmaz, H.B.; Tugcu, T. Location estimation-based radio environment map construction in fading channels. Wirel. Commun. Mob. Comput. 2015, 15, 561–570. [Google Scholar] [CrossRef]
  18. Sun, G.; Beek, J. Simple distributed interference source localization for radio environment mapping. In Proceedings of the 2010 IFIP Wireless Days (WD 2010), Venice, Italy, 20–22 October 2010; pp. 1–5. [Google Scholar]
  19. Sato, K.; Inage, K.; Fujii, T. Radio Environment Map Construction with Joint Space-Frequency Interpolation. In Proceedings of the 2020 International Conference on Artificial Intelligence in Information and Communication (ICAIIC 2020), Fukuoka, Japan, 19–21 February 2020; pp. 051–054. [Google Scholar]
  20. Isselmou, Y.O.; Wackernagel, H.; Tabbara, W.; Wiart, J. Geostatistical interpolation for mapping radio-electric exposure levels. In Proceedings of the First European Conference on Antennas and Propagation (EUCAP 2006), Nice, France, 6–10 December 2006; pp. 1–6. [Google Scholar]
  21. Du, X.; Zhu, Q.; Wu, Q.; Zhong, W.; Liu, D. UAV-Assisted Spectrum Mapping System Based on Tensor Completion Scheme. In Proceedings of the 5th Machine Learning and Intelligent Communications (MLICOM 2020), Shenzhen, China, 26–27 September 2020; pp. 16–26. [Google Scholar]
  22. Zhong, W.; Gu, Y.; Zhu, Q.; Li, P.; Chen, X. A novel spatial beam training strategy for mmWave UAV communications. Phys. Commun. 2020, 41, 101106. [Google Scholar] [CrossRef]
  23. Zhu, Q.; Dang, X.; Xu, D.; Chen, X. High Efficient Rejection Method for Generating Nakagami-m Sequences. Eletron. Lett. 2011, 47, 1100–1101. [Google Scholar] [CrossRef]
  24. Gajewski, P. Propagation models in radio environment map design. In Proceedings of the 2018 Baltic URSI Symposium (URSI 2018), Poznan, Poland, 14–17 May 2018; pp. 234–237. [Google Scholar]
  25. Zhang, Y.; Ghazal, A.; Wang, C.; Zhou, H.; Duan, W.; Aggoune, E.M. Accuracy-Complexity Tradeoff Analysis and Complexity Reduction Methods for Non-Stationary IMT-A MIMO Channel Models. IEEE Access 2019, 7, 178047–178062. [Google Scholar] [CrossRef]
  26. Yao, M.; Chen, X.; Wang, J.; Hua, B.; Yang, J. Ray Tracing Based Path Loss Modeling for UAV-to-Ground mmWave Channels in Campus Scenario. In Proceedings of the 5th Machine Learning and Intelligent Communications (MLICOM 2020), Shenzhen, China, 26–27 September 2020; pp. 459–471. [Google Scholar]
  27. Shepard, D. A two-dimensional interpolation function for irregularly-spaced data. In Proceedings of the 23rd ACM National conference (ACMNC 1968), New York, NY, USA, 27–29 August 1968; pp. 517–524. [Google Scholar]
  28. Azpurua, M.A.; Ramos, K.D. A comparison of spatial interpolation methods for estimation of average electromagnetic field magnitude. Prog. Electromagn. Res. 2010, 14, 135–145. [Google Scholar] [CrossRef] [Green Version]
  29. Zhang, X.; Xu, L.; Xu, D. Direction of Departure (DOD) and Direction of Arrival (DOA) Estimation in MIMO Radar with Reduced-Dimension MUSIC. IEEE Commun. Lett. 2010, 14, 1161–1163. [Google Scholar] [CrossRef]
  30. Debroy, S.; Bhattacharjee, S.; Chatterjee, M. Spectrum Map and Its Application in Resource Management in Cognitive Radio Networks. IEEE Trans. Cogn. Commun. 2015, 1, 406–419. [Google Scholar] [CrossRef]
  31. Bithas, P.S.; Nikolaidis, V.; Kanatas, A.G.; Karagiannidis, G.K. UAV-to-Ground Communications: Channel Modeling and UAV Selection. IEEE Trans. Commun. 2020, 68, 5135–5144. [Google Scholar] [CrossRef]
  32. Zhu, Q.; Li, H.; Fu, Y.; Wang, C.; Tan, Y.; Chen, X.; Wu, Q. A Novel 3D Non-Stationary Wireless MIMO Channel Simulator and Hardware Emulator. IEEE Trans. Commun. 2018, 66, 3865–3878. [Google Scholar] [CrossRef]
Figure 1. UAV-assisted spectrum mapping in the 3D space.
Symmetry 13 02308 g001
Figure 2. Flowchart of reconstruction scheme.
Symmetry 13 02308 g002
Figure 3. Schematic diagram of reconstruction scheme.
Symmetry 13 02308 g003
Figure 4. Flowchart of spectrum sensing data completion.
Symmetry 13 02308 g004
Figure 5. Scenario of the measurement area: (a) satellite view and (b) side view.
Symmetry 13 02308 g005
Figure 6. Reconstruction process of our proposed spectrum mapping scheme: (a) RT-based data, (b) collected data, (c) inferred data, and (d) completed data.
Symmetry 13 02308 g006
Figure 7. RSE performance of our method, IDW and tensor completion method.
Symmetry 13 02308 g007
Figure 8. Reconstructed data by (a) tensor completion and (b) IDW method.
Symmetry 13 02308 g008
Table 1. Simulation parameters.
ParameterValue
Frequency100 MHz
Bandwidth5 MHz
Transmitting power0 dBm
Antenna typeDirectional and omnidirectional
UAV height10 m to 55 m
Publisher’s Note: MDPI stays neutral with regard to jurisdictional claims in published maps and institutional affiliations.

