Article

Prediction of Band Gap Energy of Doped Graphitic Carbon Nitride Using Genetic Algorithm-Based Support Vector Regression and Extreme Learning Machine

by
Taoreed O. Owolabi
1,2 and
Mohd Amiruddin Abd Rahman
2,*
1
Physics and Electronics Department, Adekunle Ajasin University, Akungba Akoko, Ondo 342111, Nigeria
2
Department of Physics, Faculty of Science, Universiti Putra Malaysia, UPM Serdang 43400, Malaysia
*
Author to whom correspondence should be addressed.
Submission received: 21 January 2021 / Revised: 3 February 2021 / Accepted: 3 February 2021 / Published: 3 March 2021
(This article belongs to the Special Issue Materials Science: Synthesis, Structure, Properties)

Abstract

:
Graphitic carbon nitride is a stable and distinct two dimensional carbon-based polymeric semiconductor with remarkable potentials in organic pollutants degradation, chemical sensors, the reduction of CO2, water splitting and other photocatalytic applications. Efficient utilization of this material is hampered by the nature of its band gap and the rapid recombination of electron-hole pairs. Heteroatom incorporation due to doping alters the symmetry of the semiconductor and has been among the adopted strategies to tailor the band gap for enhancing the visible-light harvesting capacity of the material. Electron modulation and enhancement of reaction active sites due to doping as evident from the change in specific surface area of doped graphitic carbon nitride is employed in this work for modeling the associated band gap using hybrid genetic algorithm-based support vector regression (GSVR) and extreme learning machine (ELM). The developed GSVR performs better than ELM-SINE (with sine activation function), ELM-TRANBAS (with triangular basis activation function) and ELM-SIG (with sigmoid activation function) model with performance enhancement of 69.92%, 73.59% and 73.67%, respectively, on the basis of root mean square error as a measure of performance. The four developed models are also compared using correlation coefficient and mean absolute error while the developed GSVR demonstrates a high degree of precision and robustness. The excellent generalization and predictive strength of the developed models would ultimately facilitate quick determination of the band gap of doped graphitic carbon nitride and enhance its visible-light harvesting capacity for various photocatalytic applications.

1. Introduction

Graphitic carbon nitride (GCN) is a stable, metal-free and economical polymeric semiconductor characterized by tristriazine units coupled with connected planar amino group [1]. The high stability, low cost and visible light absorption capacity of GCN contributes significantly to its photocatalytic activity for environmental remediation and solar energy conversion [2,3,4]. The intrinsic challenges of undoped GCN for photocatalysis include low separation rate of charge carriers and inefficient solar energy utilization due to the nature of its wide band gap [5,6,7]. The electronic structure of photocatalytic material plays an important role in its light harvesting capacity, while heteroatom incorporation in the lattice structure of GCN results in electron modulation which could enhance its solar energy utilization through band gap tuning. The crystal lattice heteroatom incorporation alters the symmetry of GCN, changes the material band structure and could further destroy the long-chain atomic order, change the spin density, result in a negative/positive charge effect due to the electronegativity difference or give rise to the ligand effect consequent upon unsaturated coordination [8]. This ultimately modifies the surface area of the material. The specific surface area resulting from doping for photocatalytic enhancement is employed in this contribution to model the corresponding band gap of doped GCN.
The versatility of carbon coupled with its unique bonding capacity contributes enormously to useful the properties exhibited by carbon-based materials and further strengthens their applications in diverse areas. Combining carbon with nitrogen to form new compounds has attracted significant interest since nitrogen is also characterized with unique feature to form triple, double or single bonds with other elements [9]. Graphitic carbon nitride (GCN) is a carbon and nitrogen-based material with a graphene like layered structure. GCN has useful applications in water reduction and oxidation (which yields hydrogen and oxygen), carbon IV oxide reduction in the production of hydrocarbon fuels and has shown remarkable performance in photocatalysis [10]. The wide band gap of GCN, the high recombination rate of charge carriers as well as its blue light absorbing limit of 460 nm practically limits the material’s usefulness in photocatalytic activity. However, an effective method of band gap engineering in this compound is still challenging [9]. Among the practical methods of addressing the challenges of the wide band gap of this compound are hetero or nanostructuring with other conductors or semiconductors as well as the elemental doping technique [11]. Heteroatom insertion into GCN framework has been a common method of band gap modification in this compound. However, the nonuniform distribution of dopants in the GCN crystal lattice has high tendency to further widen the band gap of the compound or lead to complete closure [9]. The doping of GCN with elements changes the symmetry of the compound and has become one of the effective methods of performance improvement in polymeric semiconductors due to electronic structure modification as well as enhancing surface properties for a better photocatalytic activity. Improvement in surface properties such as specific surface area after doping can be attributed to the enhancement of reaction active sites as well as high porosity, which greatly promotes the mass transfer of the product and reactant molecules. Sulfur doped GCN has been reported to enlarge the specific surface area as well as light harvesting capacity [12]. Similar electronic and band structure modulation coupled with enhanced specific surface area has been reported for oxygen doped GCN [12]. Therefore, doping GCN enhances specific surface area as well as band gap energy. This present work correlates enhancement in surface area with band gap tailoring for specific application using a hybrid genetic algorithm (GA)-based support vector regression (SVR) and extreme learning machine (ELM).
Support vector regression (SVR) is a prominent supervised intelligent technique with excellent generalization and predictive strength. The algorithm was initially developed for classification problems but later extended to address regression problems [13]. The unique features of SVR that have promoted its implementation in various research fields include the ease of convergence to global solutions, its robust and powerful mathematical background and its intrinsic capacity to address and approximate nonlinear problems. These uniqueness have rendered the algorithm relevant in addressing many challenges that are difficult to handle using conventional methods. The user defined hyperparameters of the algorithm control the precision of the model and are tuned in this contribution using the heuristic genetic algorithm optimization method [14].
Extreme learning machines are a special class of single hidden layer feedforward neural network with reportedly excellent approximation capacity [15,16]. The random generation of the hidden neuron weights results in fast training speeds attributed to ELM algorithms. Therefore, a reduced computational time as compared with other classical methods characterized this ELM computational intelligence method. These promising qualities have widened the applicability of ELM algorithms in several research areas [17,18,19]. This present work explores the uniqueness of ELM algorithms in modeling the band gap of doped GCN using specific surface area as a descriptor.
The organization of the remaining part of the manuscript is structured as follows: Section 2 describes the mathematical background of the developed hybrid support vector regression and genetic algorithm (GSVR) as well as extreme learning machines (ELM) while Section 3 presents the computational strategies of the developed models. Reports on the dataset acquisition and description are presented in Section 3 of the manuscript. Discussions of the outcomes of the developed models are reported in Section 4. Section 5 concludes the manuscript.

2. Mathematical Formulation of the Proposed Hybrid Algorithms

This present section reports the mathematical description of the support vector regression algorithm and the implemented genetic population-based optimization algorithm. The mathematical formulation of extreme learning machine is also presented.

2.1. Support Vector Regression Machine Learning Algorithm

Support vector machine is a statistical learning theory-based intelligent algorithm developed originally for addressing classification problems [13]. The incorporation of loss function purposely for approximating the acquired pattern connecting the descriptors with the target allows the extension of the algorithm for handling regression problems. Hence, support vector regression (SVR) conveniently solves regression problems through data transformation to feature space where linear regression is to be constructed. The structural risk minimization principle upon which the SVR algorithm is built gives peculiar uniqueness to the algorithm as compared to the traditional empirical risk minimization principle characterized with some challenges [17]. The SVR algorithm aims at mapping training data samples g = [ { x 1 , E 1 } , { x t , E t } in which x t R m , E t R and t = 1 , 2 , T , where T is the number of training samples, to feature space P of high dimensionality using mapping function μ . Equation (1) presents the regression function for the SVR algorithm [20,21,22].
E ( x ) = ω · μ ( x ) + b μ : R m P       ω P
The empirical risk is minimized using ε i n s e n s i t i v e loss function and the minimization equation is presented in Equation (2) while the ε i n s e n s i t i v e model is depicted by Equation (3)
L f u n c t i o n = t = 1 T l ( E ( x t ) E t )
l ( x , E , E ) = E E ε = 0 E ( x ) E ε E ( x ) E ε E ( x ) E > ε
In primal space formulation, the minimization characterizing the resulted optimization problem is depicted by Equation (4)
L = L f u n c t i o n + 1 2 ω 2
The incorporation of slack variables that enhance actualization of the flat function in the SVR algorithm formulates the convex optimization problem as presented in Equation (5). With the constraints presented in Equation (6), the dual problem can be addressed. Implementation of the condition of saddle point characterizing the Langrage function yields the formulation presented in Equation (7) while the final regression function is depicted by Equation (8) [23,24].
1 2 ω 2 + t = 1 T χ t χ t Subject   to E t ( ω · E + b ) ε + χ ( ω · E + b ) E t ε χ χ , χ 0
t = 1 T η t η t = 0 0 η t η t C T , t = 1 , 2 , T
Q ( η , η ) = 1 2 t = 1 T η t η t η i η i μ ( x t , x i ) + ε t = 1 T η t + η t t = 1 T E η t η t
E ( x ) = t = 1 T η t η t μ ( x t , x i ) + b
The kernel function that transforms the specific surface area and band gap energy of doped GCN to feature space is presented in Equation (9).
μ ( x t , x i ) = exp x t x i 2 λ
where λ is the kernel option.
The development of a reliable and robust SVR-based model strongly depends on the choice of the hyperparameters. The regularization factor C contained in Equation (6) trades off between margin error minimization and maximization. The kernel option controls data transformation while the epsilon controls the insensitive loss zone. These three parameters are optimized in this contribution with the aid of a genetic optimization algorithm.

2.2. Brief Description of Genetic Population-Based Optimization Algorithm

The genetic algorithm is a population driven heuristic optimization algorithm-based upon the Darwin’s evolution theory and proposed by Holland for addressing real life problems [14]. The algorithm employs natural selection process to attain global solutions in a complex search space with multidimensionality [25]. It generates new strings of better fit from the current strings through the implementation of variant of operators with defined probabilities. Thereby, weak individuals are disposed of at the expense of the strongest surviving individuals following a stochastic search [23]. The operational processes of the algorithm involve the random generation of an initial population, individual population evaluation, offspring creation through selection, crossover and mutation operations, the inspection of stopping conditions and iterative repetition processes purposely to achieve one of the stopping conditions. The random generation of the initial population involves the initialization of a number of chromosomes that encodes the parameters to be optimized, each carrying a defined character called a “gene” [26,27]. During the evaluation process, a defined function is employed for determining the potency of the individual and allows the strongest individual chromosomes to be dichotomized for subsequent transition to the next generation. Selection, crossover and mutation operations are the navigating procedures of this algorithm in attaining quick and mature convergence to a global solution.

2.3. Extreme Learning Machine

Extreme learning machine (ELM) is an intelligent algorithm with fixed network architecture of a single hidden layer feedforward neural network [19,28]. The algorithm generates weights attached to the hidden nodes randomly and implements a pseudoinverse matrix for the computation of output weights. The ELM-based approximated function for determining band gap of doped GCN is presented in Equation (10).
E ( x k ) = t = 1 T β t f ( ω t x k + b t ) = E
where the specific surface area descriptor is represented by x, the maximum number of nodes in the hidden layer is represented by T, β t stands for the output weights linking the hidden layer with the output layer, ω t represents the weights connecting the input with the hidden layer, b t defines the bias of the input and hidden layer and f ( ω t x k + b t ) is the activation function.
From the function presented in Equation (10), it can be observed that band gap of doped GCN premises on the computation of β t . The input weights ω t and the bias b t are randomly generated by the algorithm using a pseudorandom number generator in the MATLAB environment. The approximated linear function can be represented as depicted in Equation (11) [29,30].
E = H β
where matrix components of H and β are, respectively, presented in Equation (12) and Equation (13)
H ( ω 1 , ω T , x 1 , x k , b 1 , b T ) = f ( ω 1 x 1 + b 1 ) f ( ω T x k + b T ) : : f ( ω 1 x k + b 1 ) f ( ω T x k + b T )
β = β 1 , β 2 , β k T
The monolayer neural network is trained through iterative variation of the hidden bias layer and input layer, which results in a programming problem characterized with minimum error presented in Equation (14)
H ( ω 1 , ω k , b 1 , b k ) β E = min ω , b , β H ( ω 1 , ω k , b 1 , b k ) β E
The ELM algorithm addresses the problem presented in Equation (10) using the minimum norm least square method with ultimate transformation to generalized inverse problem for matrix computation. In the case that β does not lead to a unique solution due to the larger number of training samples as compared with the number of nodes, generalized Moore–Penrose inverse ( H + ) is invoked for β computation as presented in Equation (15).
β = H + E
where H + represents the pseudoinverse matrix of H.
Assuming that ( H T H ) 1 exists, the pseudoinverse matrix can be expressed as defined in Equation (16).
H + = ( H T H ) 1 H T
Therefore, β can be obtained as presented in Equation (17)
β = ( H T H ) 1 H T E

3. Computational Methodology of the Proposed Hybrid GSVR and ELM

The presentation of the computational strategies employed in hybridizing genetic algorithm with support vector regression is contained in this section. Dataset acquisition and computation descriptions of the proposed extreme learning machine are also presented.

3.1. Dataset Acquisition and Description

Band gap modeling of doped GCN utilizes experimental data obtained from 105 GCN-based compounds. The experimental data consists of band gap and Brunauer–Emmett–Teller specific surface area extracted from the literature [1,3,4,5,6,7,31,32,33,34,35,36,37,38,39,40,41]. Preliminary statistical analysis was carried out on the dataset purposely to extract useful statistical information guiding the implementation as well as the suitability of the proposed algorithms. The results of statistical analysis presented in Table 1 show the dataset content, range (from maximum and minimum values) and the degree of linear relationship between descriptor and the band gap energy. The low value of correlation coefficient between the surface area and band gap of doped GCN shows that the descriptor and the target are not linearly correlated and any attempt to develop a linear model would definitely lead to poor performance. This observation necessitates the nature of nonlinear models such as hybrid support vector regression and extreme learning machine developed in this work.

3.2. Support Vector Regression and Genetic Algorithm Hybridization

The entire computational task involved in the hybridization of SVR with GA was conducted within the MATALAB computing environment. Randomization of the whole dataset precedes separation of the dataset into training and testing phases. Randomization allows even distribution and diffusion of the dataset and ultimately leads to efficient computation. A ratio of 8:2 was adopted for dataset partitioning into training and testing phases. Therefore, 84 GCN-based compounds were employed for support vector acquisition while the accessibility of the future generalization and predictive strength of the developed model was conducted using testing dataset. The genetic algorithm aids hyperparameter searching and consequently promotes the precision and robustness of the model. The optimized hyperparameters include the kernel option, epsilon and regularization factor. The computational processes of the developed hybrid GSVR model are itemized as detailed below.
Step a: Population generalization and initialization: Initial population is initiated though random generation of many individual solutions. The size of the generated initial population depends on the nature of the problem and the size of the search space. The size of the population generated in this work covers the whole range of probable solutions and varies from 50 to 300 solutions.
Step b: Possible solution evaluation: The probable solutions initiated and generated are evaluated using fitness function that determines the goodness of the solution. Root mean square error (RMSE) between the measured and predicted band gap serves as the fitness function in this work. The fitness evaluation procedures are itemized as follows
  • Kernel function selection: choose a function from Gaussian, Sigmoid or Polynomial that serves as the kernel function.
  • Each chromosome that depicts hyperparameters (in a known and defined order) goes into the chosen kernel function and SVR algorithm is trained using the training set of data. RMSE-training value corresponding to each of the trained models is recorded while the support vectors acquired during the training are saved.
  • The support vectors saved in (ii) are employed in further evaluation of each of the trained SVR algorithm using testing dataset. The associated RMSE-testing for each of the chromosome is saved
  • Each of the developed models is evaluated using RMSE-testing obtained in (iii). The model characterized with the lowest value of RMSE-testing is regarded as the best model, while the model with largest value of RMSE-testing is the worst of the models.
Step c: Population selection (reproduction): Breeding of new generation is carried out through selection of some proportion of the existing population. Fitness-based procedure is followed for individual solution selection and 0.8 probability is employed for ensuring breeding of new population with best fitness.
Step d: Implementation of crossover operator: The crossover operator varies or alters the programing of the chromosomes from previous generation to the subsequent ones. The genetic crossover operator might be sexual, asexual or multirecombination depending on the number of the parents (also known as arity). In sexual crossover, two parents produce one or two offspring while an offspring is generated from a parent in asexual crossover. Multirecombination allows more than two parents to produce one or more offspring. The sexual crossover probability implemented in this work was set at 0.65.
Step e: Mutation operation: The genetic diversity is maintained between generations with the aid of mutation operator. It also ensures the accessibility of full range of allele for each gene. The mutated offspring were generated in this work using mutation probability of 0.009. The mutation probability was set at this small value to prevent distorted solutions.
Step f: Population replacement: New individuals replace the least-fit in the population.
Step g: Stopping conditions: The algorithm stops when RMSE-testing gives zero value or same value of RMSE-testing is obtained after fifty consecutive iterations. If either of these conditions is not met, the algorithm follows a new iterative loop as detailed in Step b to Step f.

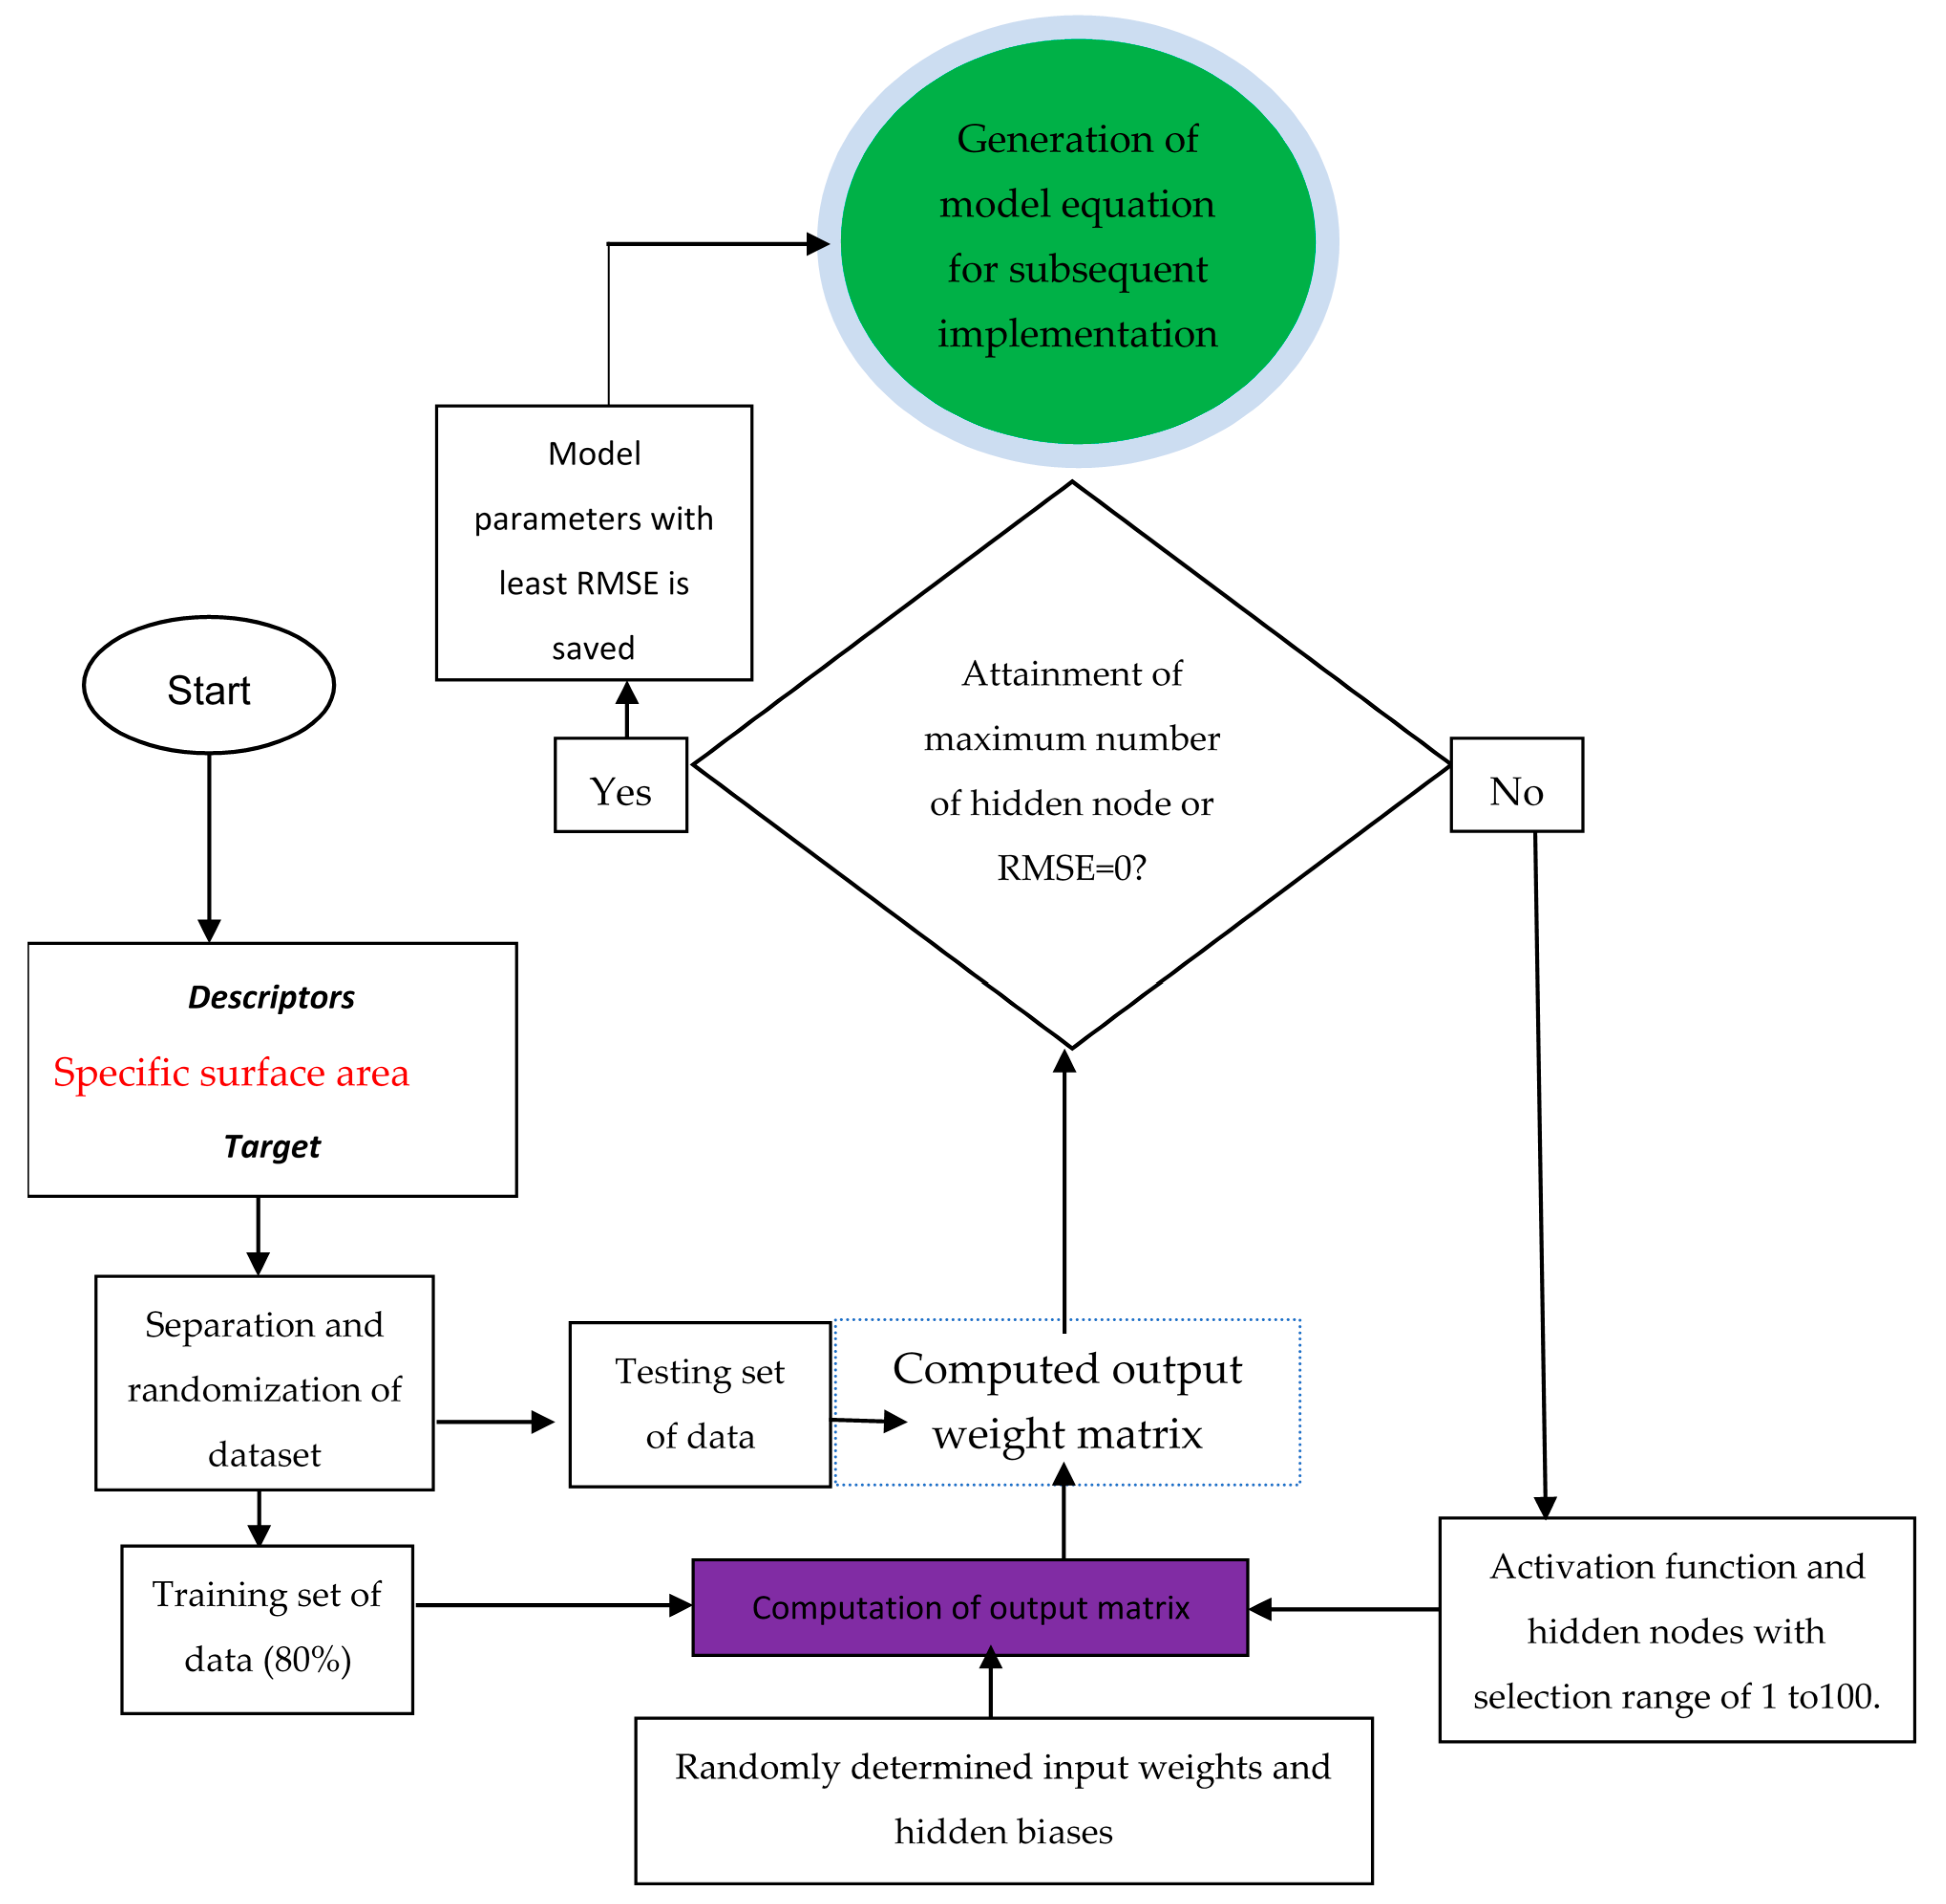
3.3. Computational Implementation of Extreme Learning Machine-Based Model

In order to ensure even and just comparison between GSVR- and ELM-based models, the randomized and separated data implemented while developing GSVR model was also implemented for developing ELM-based models. The functions that serve as activation functions include sine function (SINE), sigmoid function (SIG) and triangular basis function (TRANBAS). Computational implementation of ELM involves random generation of hidden layer neurons bias and the weights joining the hidden layer with input layer. The activation function is then selected for the hidden layer neurons while the hidden layer output matrix is computed. The weights linking the hidden with the output layer are computed. The schematic diagram of the developed ELM-based models is presented in Figure 1.

4. Results and Discussion

The discussion and the actual results of this research work are presented in this section. The influence of population numbers on the convergence of SVR hyperparameters is also presented in this section. Performance comparison between the developed models is presented. The significance of several dopants on the photocatalytic activity of GCN compounds is contained in this section.

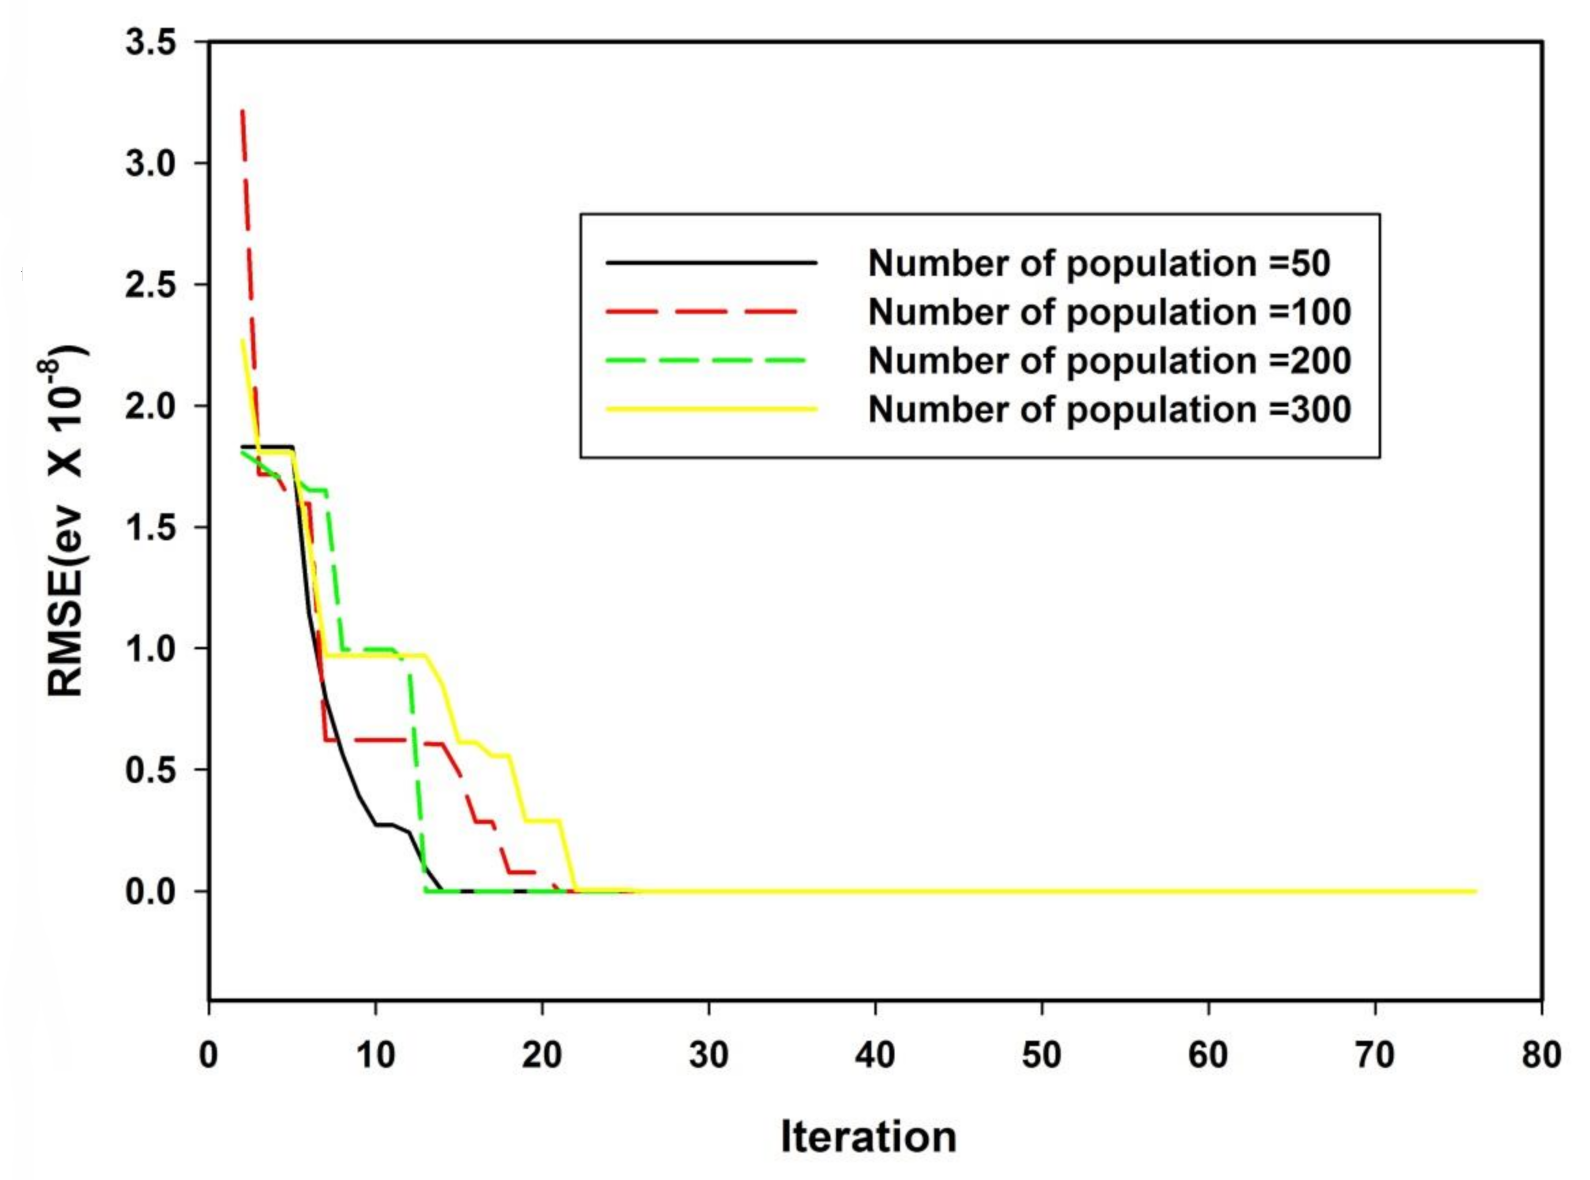
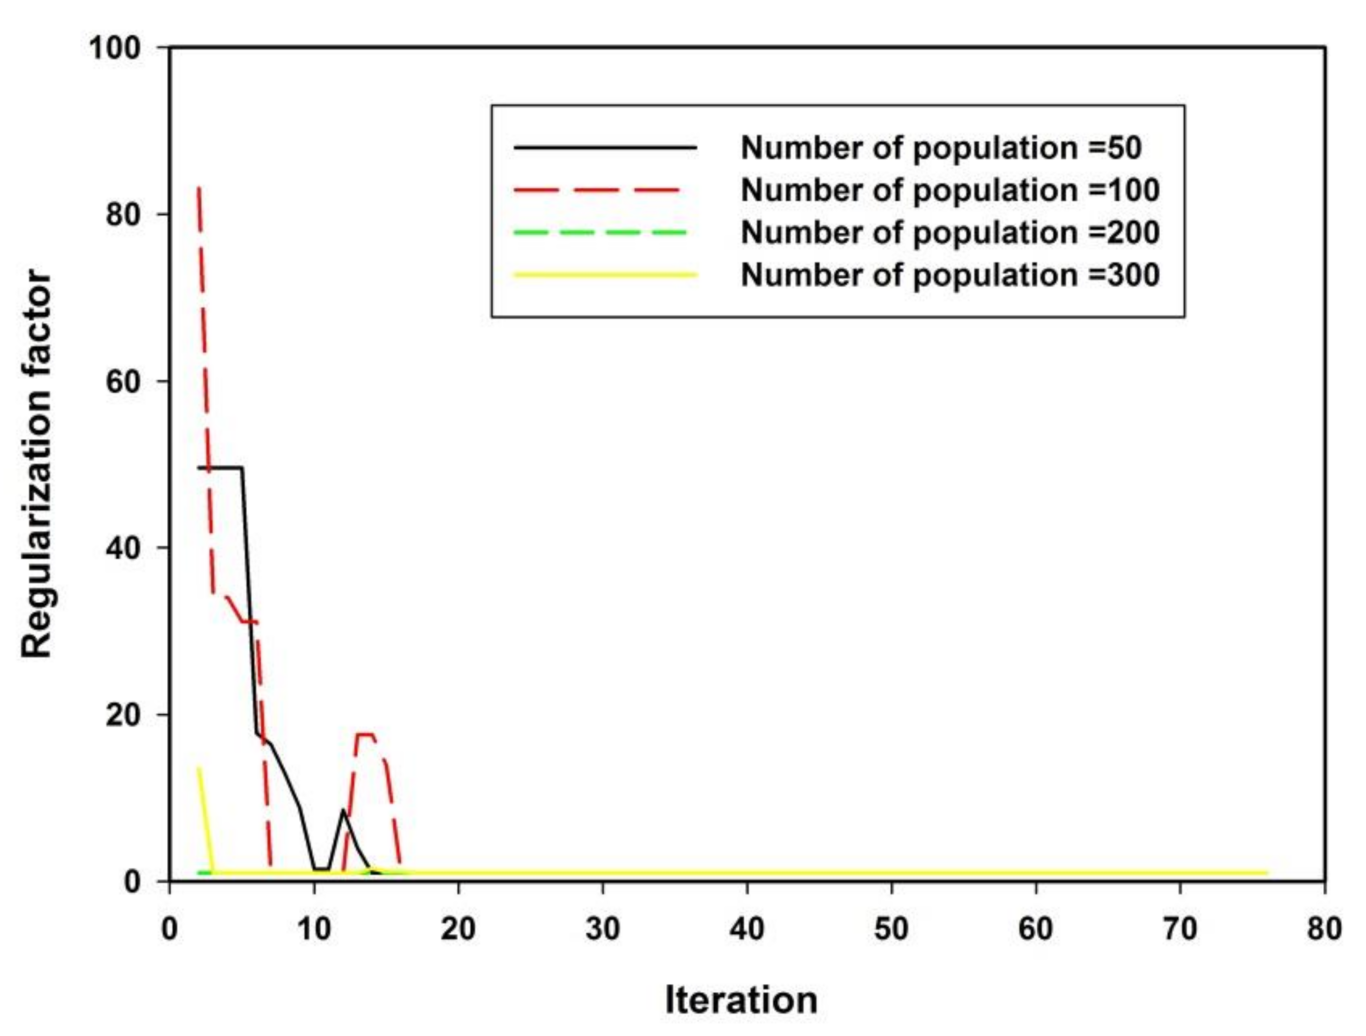
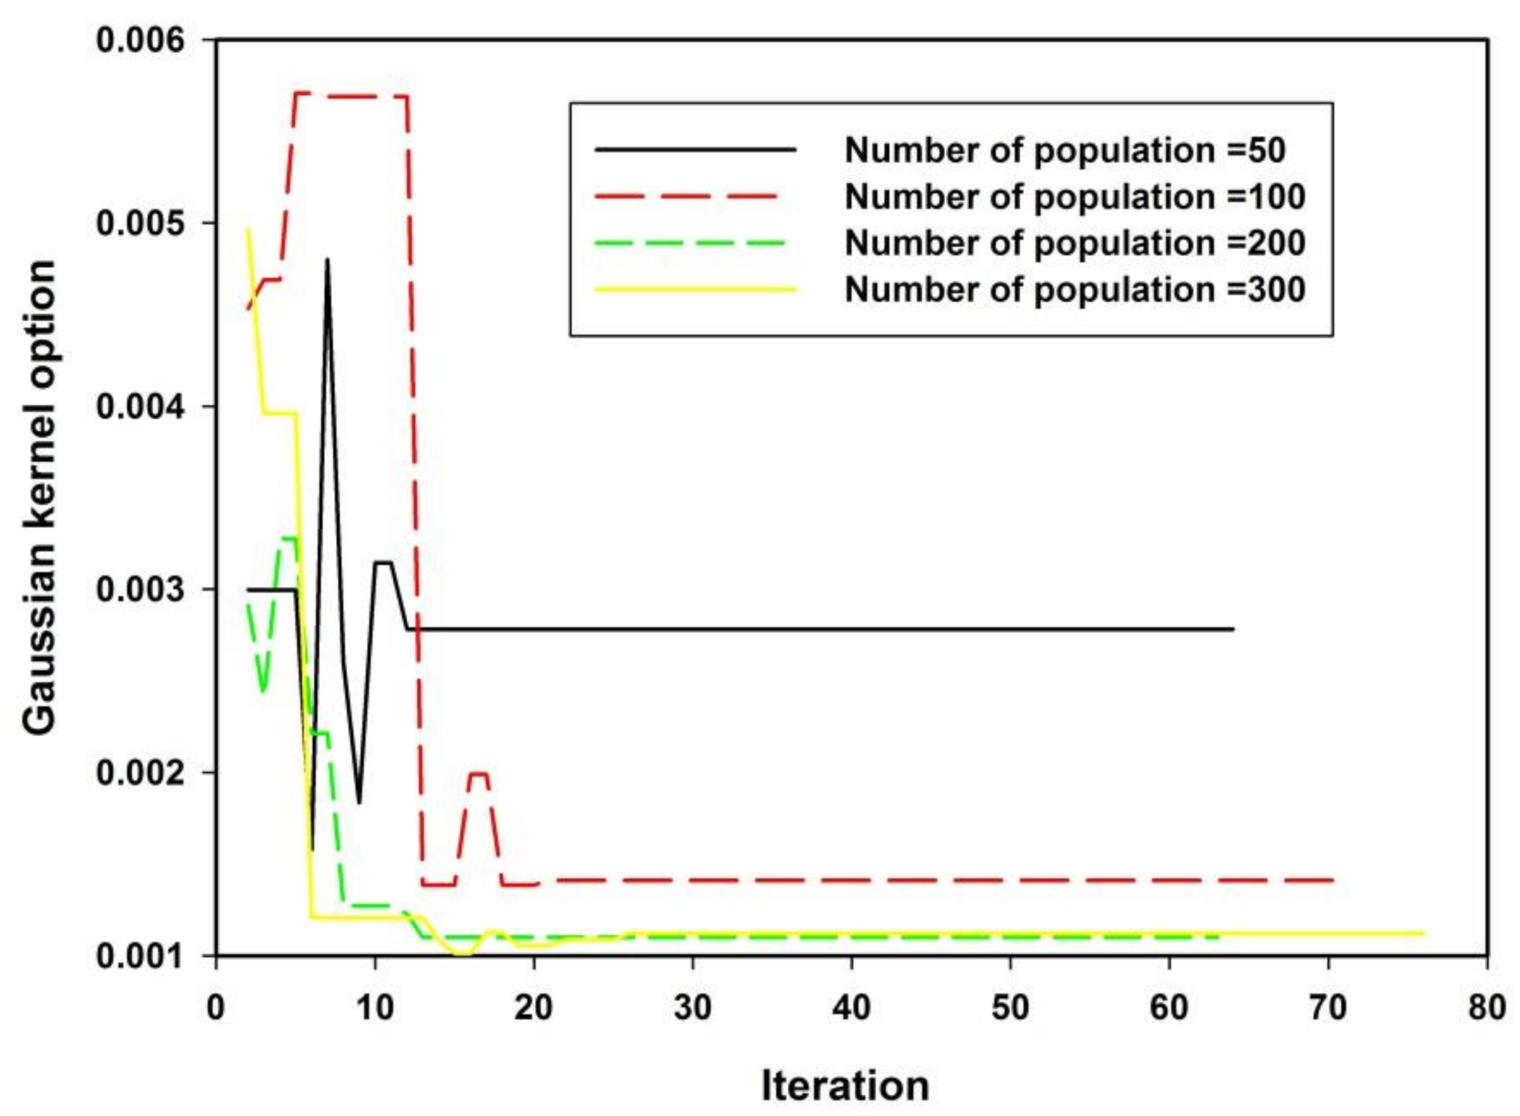
4.1. Number of Population in Genetic Algorithm and Model Convergence

The response of GSVR model convergence to the number of population is presented in Figure 2. The result presented in Figure 2 was normalized by subtracting the minimum fitness value at the maximum iteration from each of the fitness values at every point of the iteration for each number of agents exploiting the search space. The number of probable solutions was varied from 50 to 300 as shown in the figure.
The model displays a premature convergence when 50 as well as 100 probable solutions were initiated within the model search space while a global solution was attained as more populations were added. The developed GSVR model showed no further improvement in performance as the number of probable solutions was increased to 200. The corresponding variation in the values of the regularization factor and Gaussian kernel option are, respectively, presented in Figure 3 and Figure 4. The obtained optimum values of each of the hyperparameters are presented in Table 2.

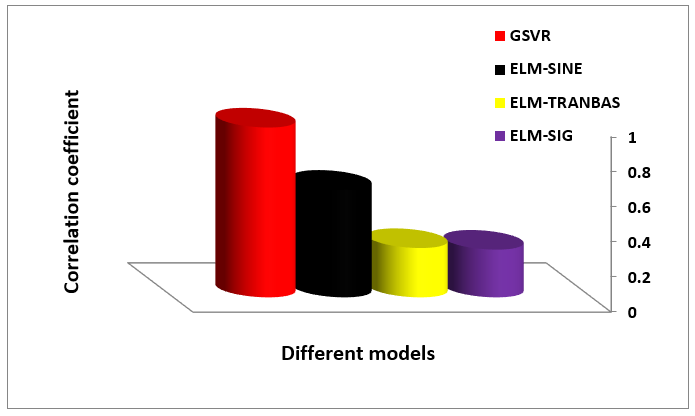
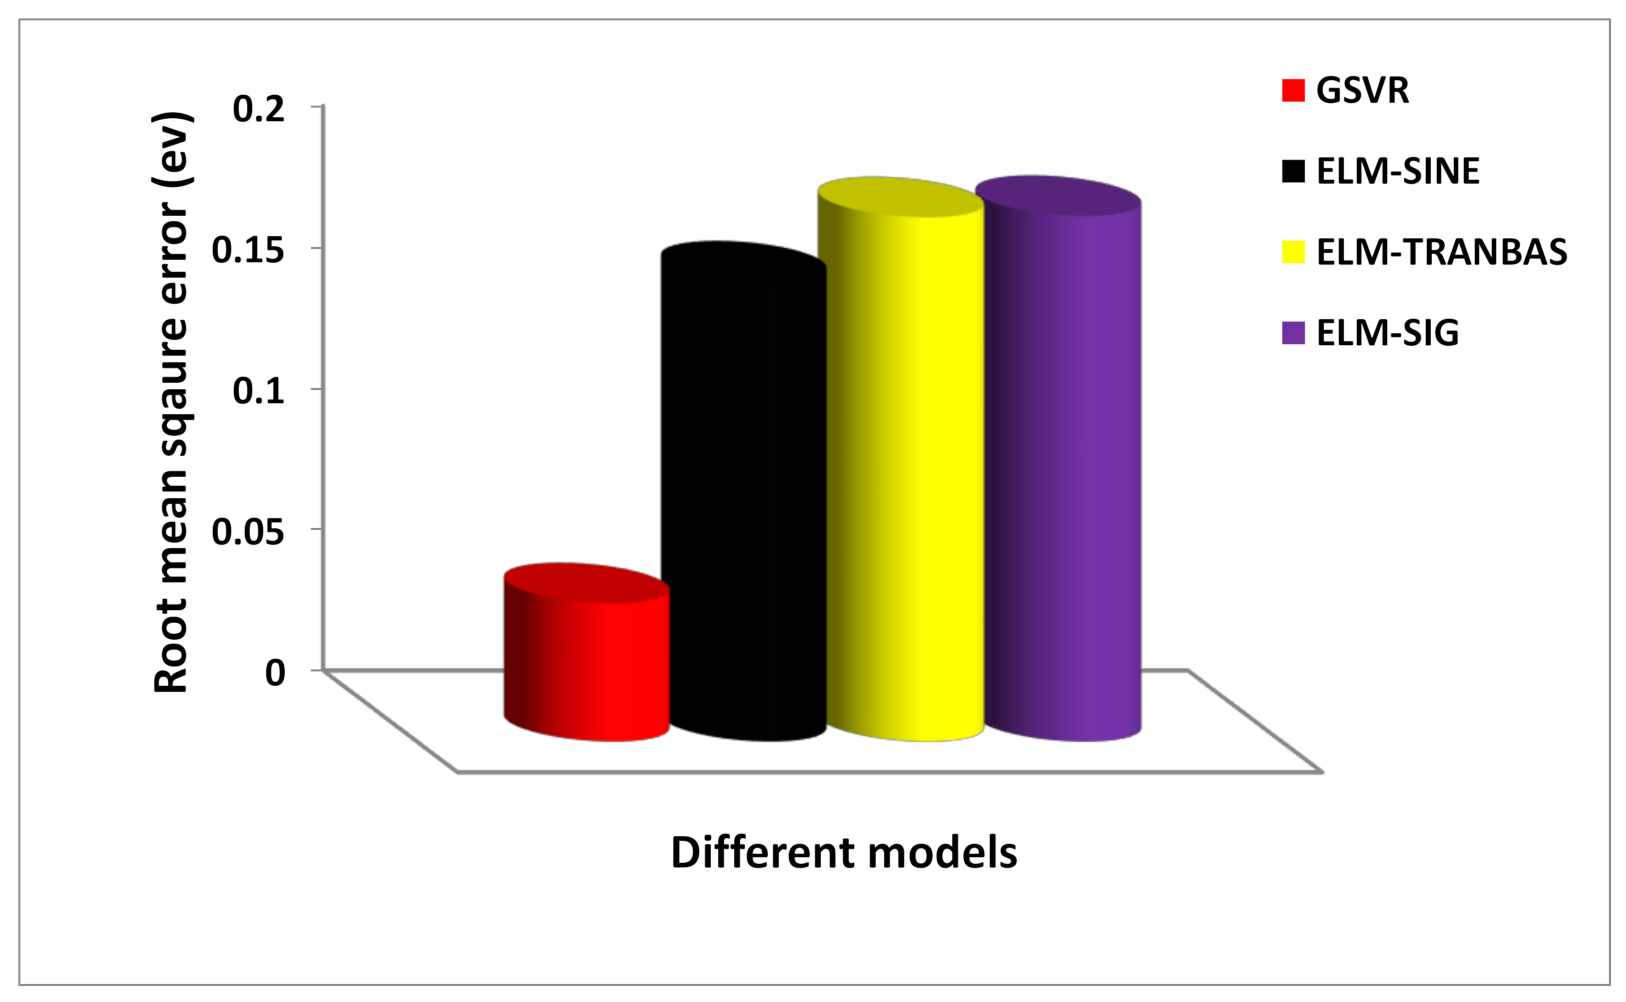
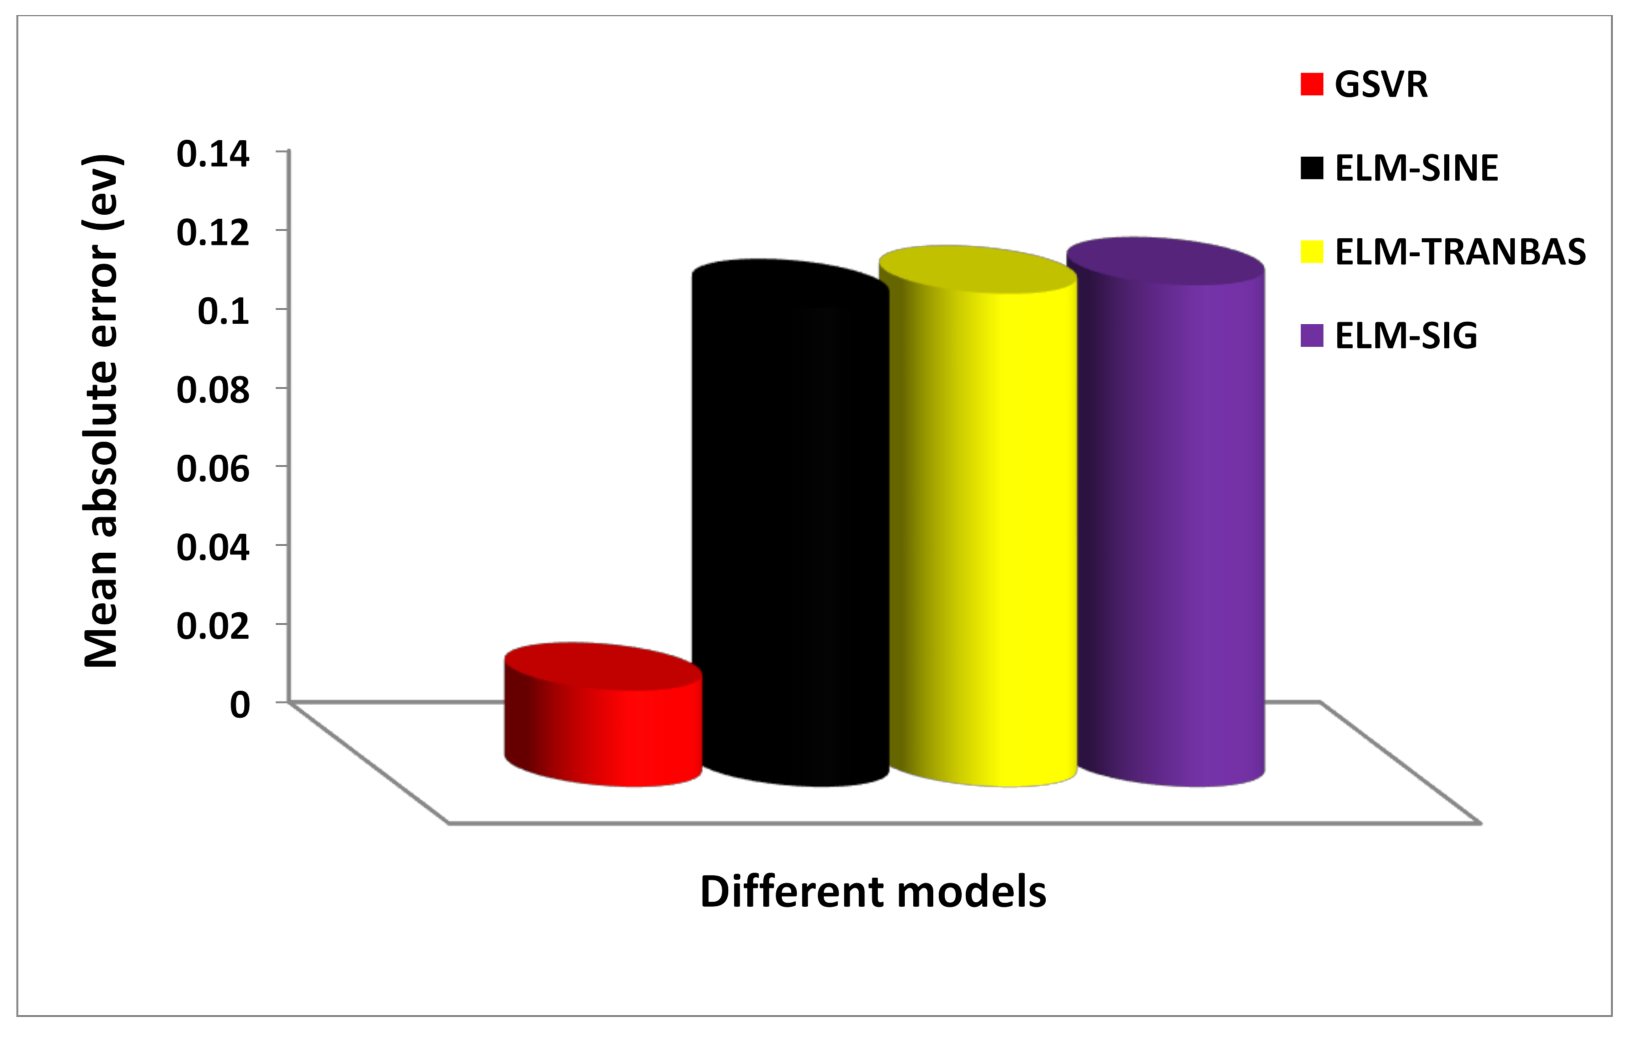
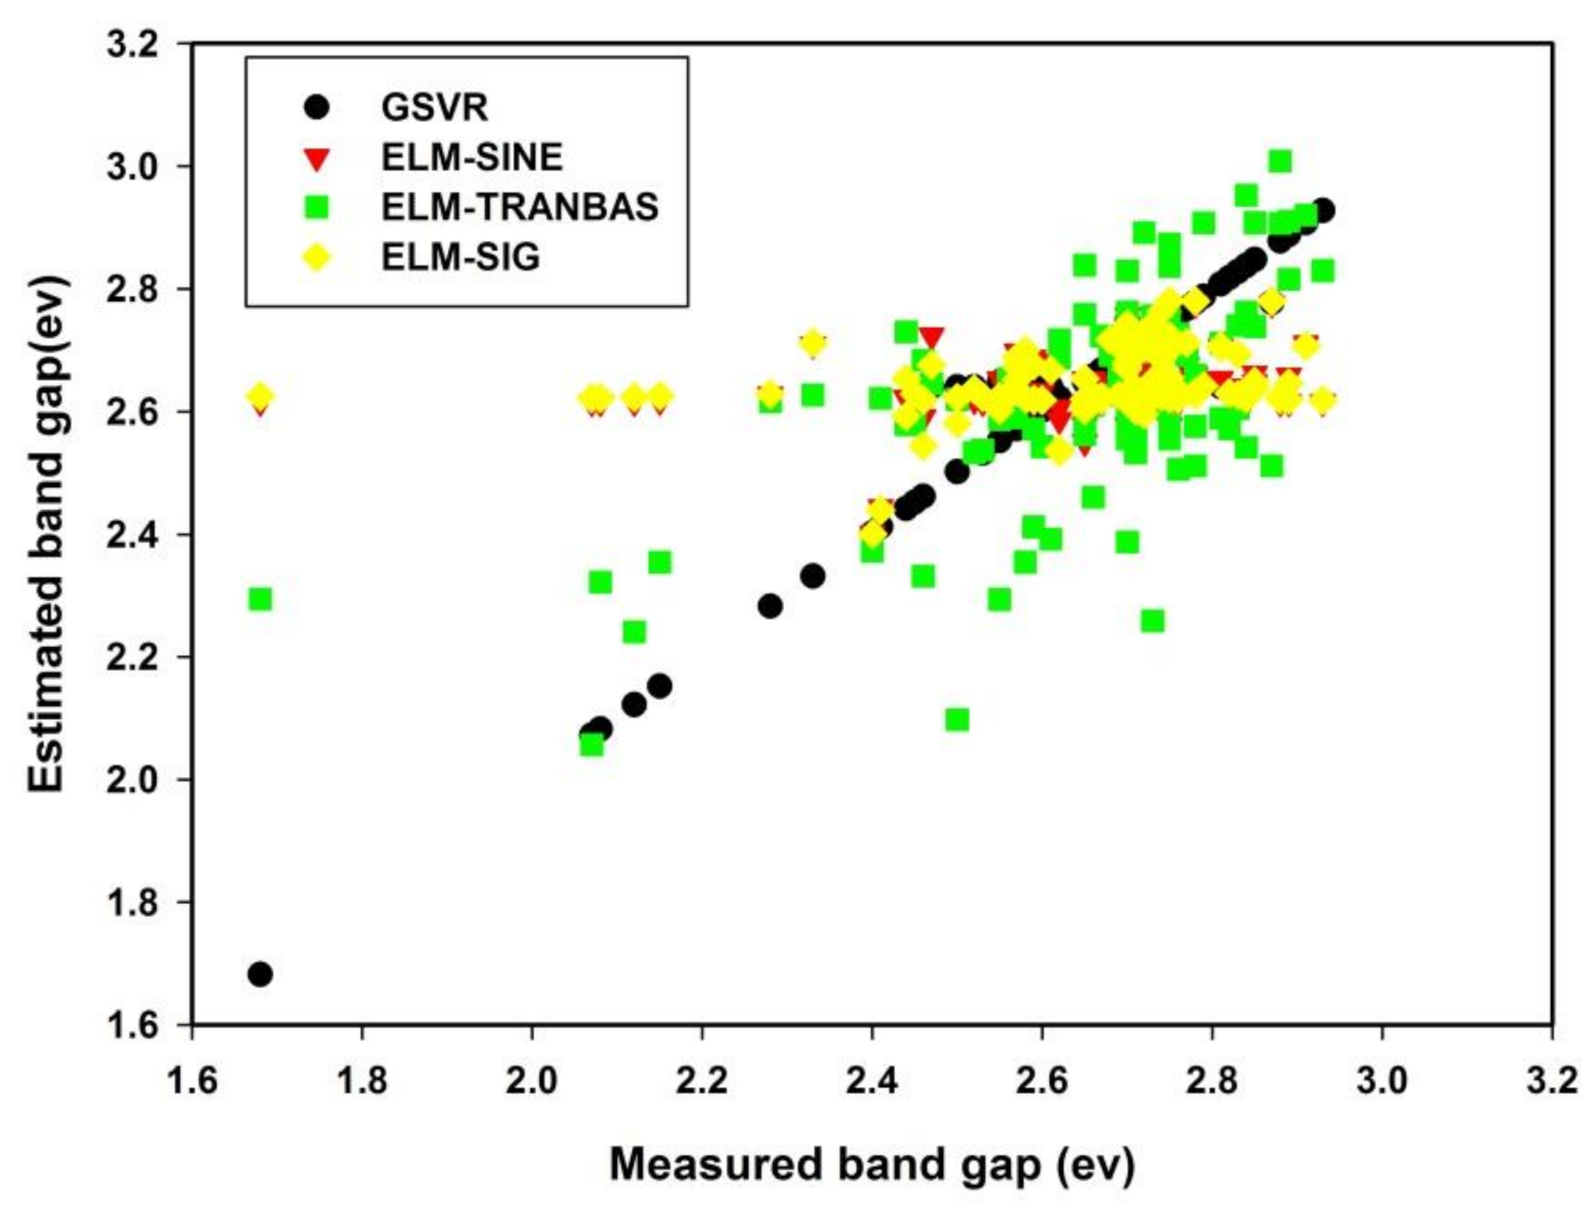
4.2. Performance Comparison and Evaluation of the Developed Models

The developed GSVR and ELM-based models are evaluated and compared on the basis of the correlation coefficient between the measured and predicted band gap of doped GCN, mean absolute error as well as root mean square error of the model estimates for the combined dataset. Comparison on the basis of coefficient of correlation is presented in Figure 5. The developed GSVR model shows outstanding performance as compared with other developed models.
The developed GSVR model performs better than ELM-SINE, ELM-TRANBAS and ELM-SIG model with performance improvement of 36.63%, 70.96% and 71.90%, respectively, on the basis of the correlation coefficient. Using the same yardstick, ELM-SINE outperforms ELM-TRANBAS and ELM-SIG model with performance improvement of 54.18% and 55.67%, respectively, while ELM-TRANBAS performs better than ELM-SIG with performance enhancement of 3.25%. The model performance measuring parameters are presented in Table 3.
Comparison of the performance of the developed GSVR and ELM-based models on the basis of root mean square error (RMSE) and mean absolute error (MAE) are presented in Figure 6 and Figure 7, respectively. On the basis of RMSE, the developed GSVR outperforms ELM-SINE, ELM-TRANBAS and ELM-SIG model with performance enhancement of 69.92%, 73.59% and 73.67%, respectively, while ELM-SINE performs better than ELM-TRANBAS and ELM-SIG model with improvement of 12.19% and 12.44%, respectively. Similarly, ELM-TRANBAS model performs better than ELM-SIG model with improvement of 0.27%. Using MAE as the yardstick for performance comparison, GSVR performs better than ELM-SINE, ELM-TRANBAS and ELM-SIG model with respective performance improvement of 79.93%, 80.48% and 80.81% while ELM-SINE outperforms ELM-TRANBAS and ELM-SIG model with performance improvement of 2.70% and 4.35%, respectively. ELM-TRANBAS model also outperforms ELM-SIG on the basis of MAE. Correlation cross plot between the estimated band gap and the measured values is presented in Figure 8. The plotted experimental band gap energy in the figure are extracted from the literature [1,3,4,5,6,7,31,32,33,34,35,36,37,38,39,40,41]. The band gap datapoints estimated by GSVR model show perfect alignment while datapoints from other developed models show deviations depending on the value of the coefficient of correlation. The outstanding performance of the developed GSVR model can be attributed to the hybridizing power of GA to effectively optimize SVR hyperparameters as well as unique features governing the operating principles of SVR algorithm such as structural risk minimization principle, the strong mathematical formulation upon which the algorithm was developed and nonconvergence to local solution.

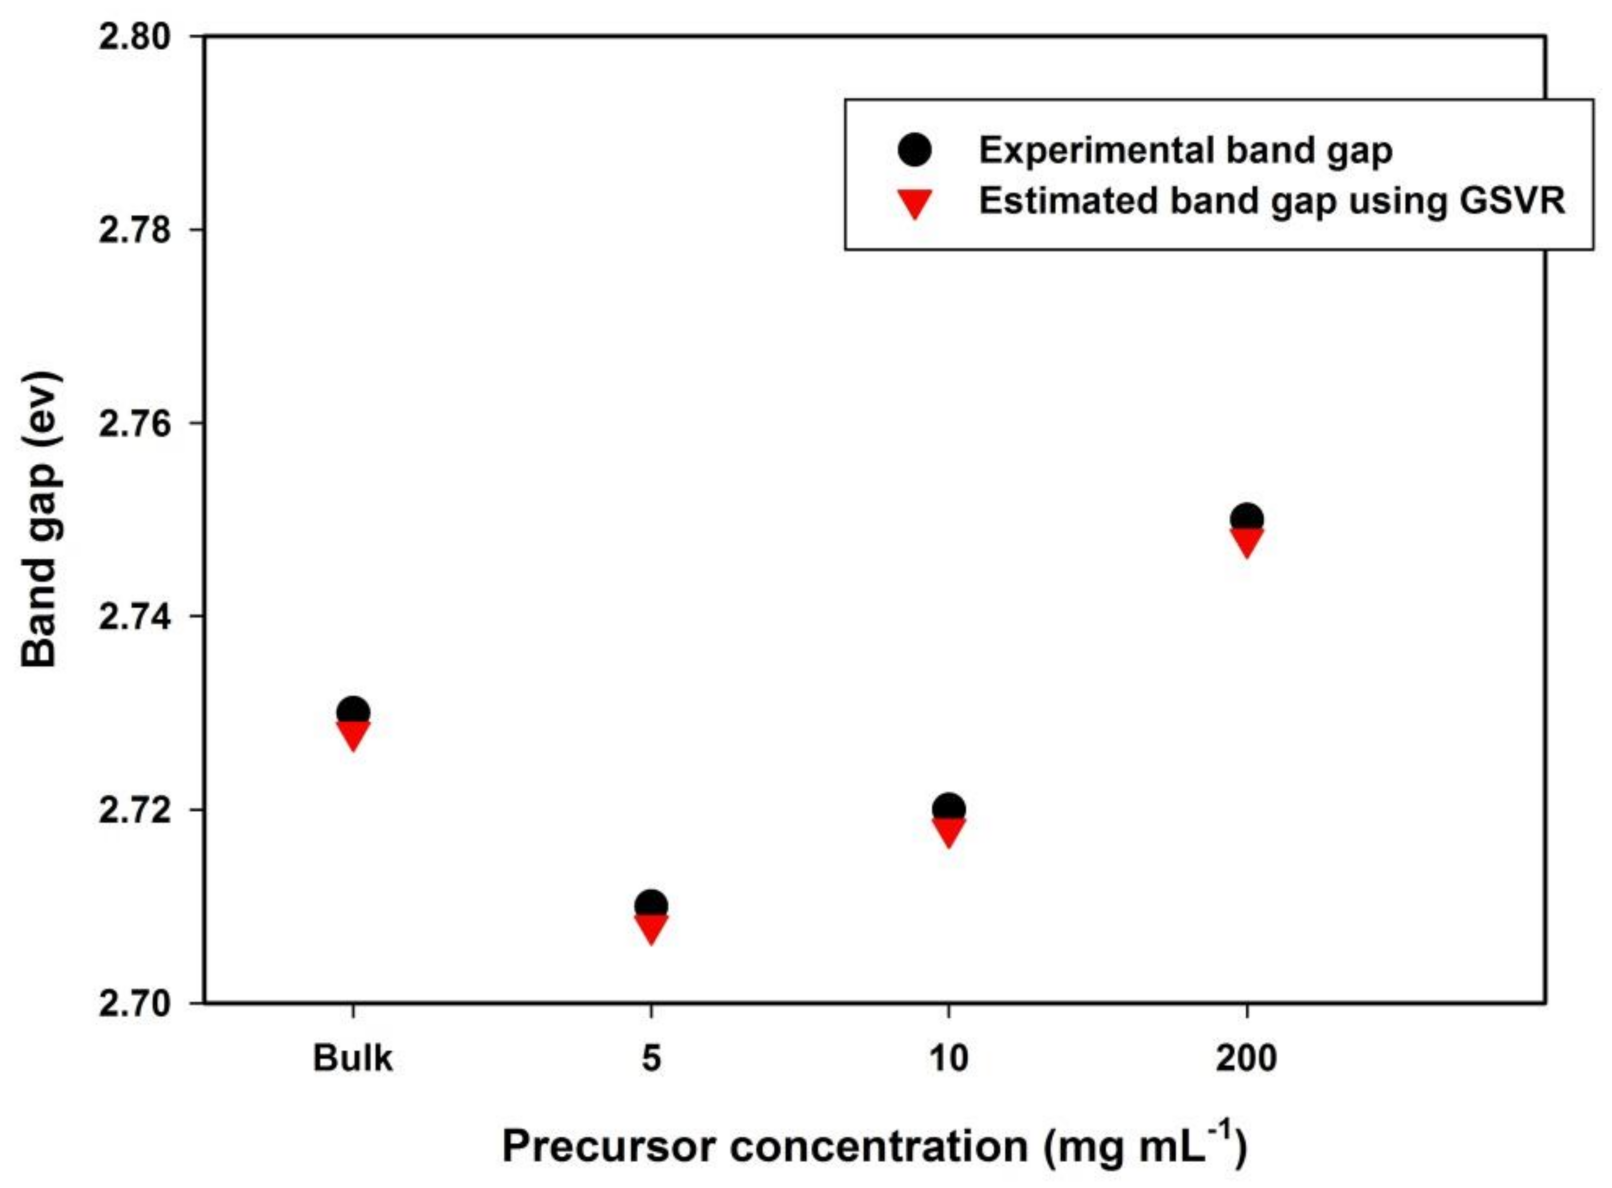
4.3. Effect of Experimental Preparation Conditions on the Band Gap of GCN Using the Developed GSVR Model

The effect of different precursor concentrations during the experimental preparation of GCN on the photocatalytic activities of the polymeric semiconductor using the best of the developed model (GSVR) is presented in Figure 9. The estimates of the GSVR model are also compared with the experimentally measured band gap [7]. The experimental condition alters the specific surface area of the samples and thereby tailors the band gap energy of the semiconductor as shown in the figure. The observed increase in pore sizes and surface area enhance the adsorbing capacity of the semiconductor and provide more active sites for photocatalytic processes [7].

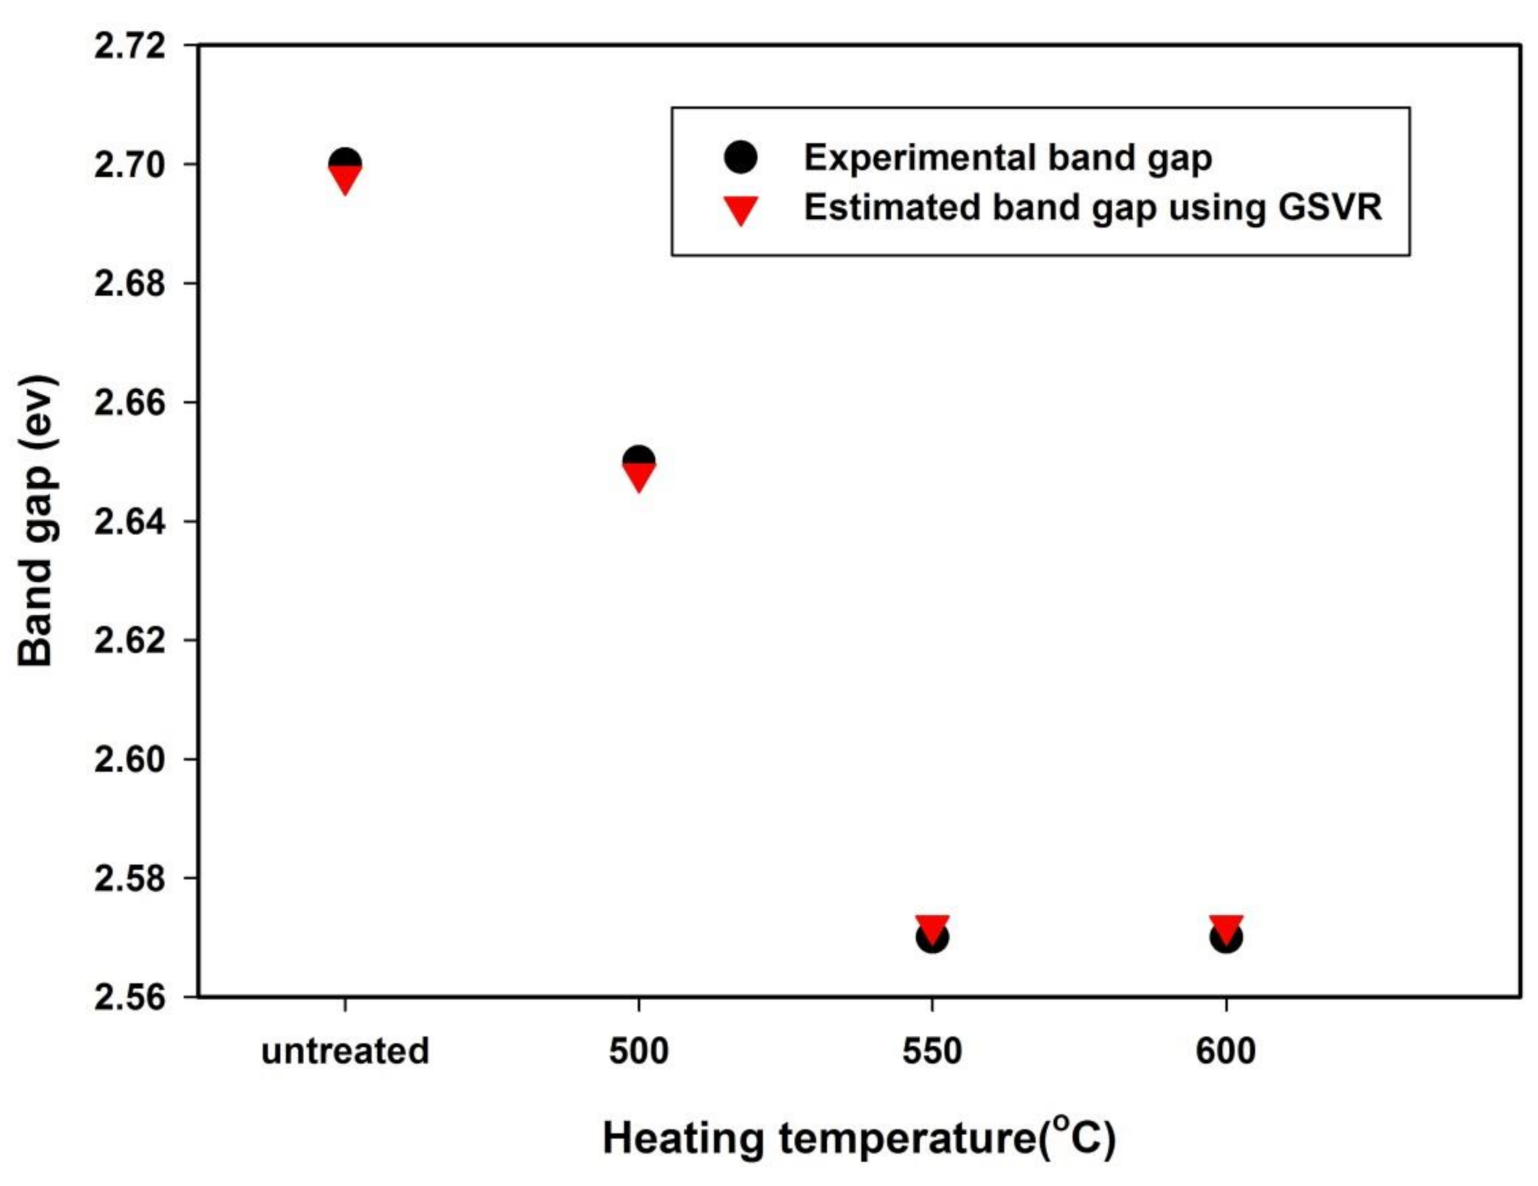
4.4. Photocatalytic Effect of Sulfur Dopant and Temperature Treatment on GCN

The incorporation of sulfur dopants in the lattice structure of GCN followed by variation in calcination temperature alters the photocatalytic activity of GCN as observed from the reduction in the energy band gap. Comparison between the estimated and measured band gap is presented in Figure 10. The predicted band gap using specific surface area of each of the treated samples as descriptor agree excellently with the measured values [5]. The pore volume and the specific surface area increase with increase in calcination temperature; hence, the band gap of the sample was tailored accordingly.

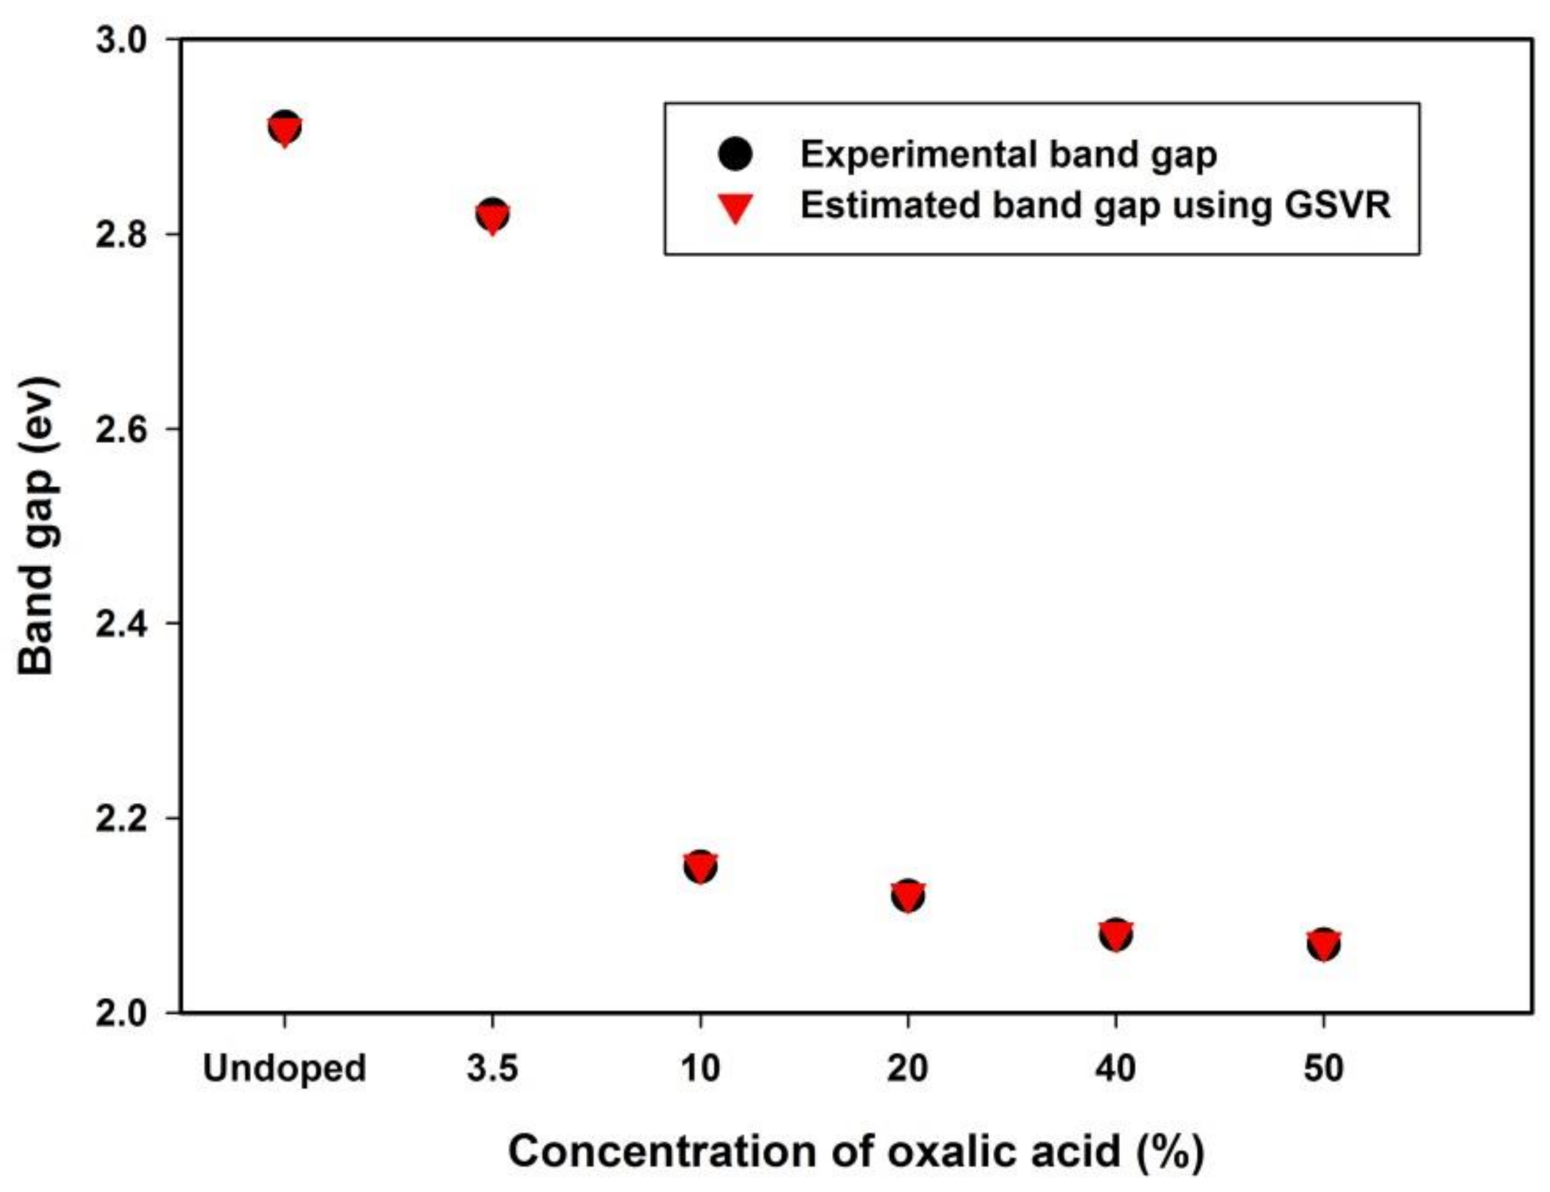
4.5. Significance of Oxygen Incorporation on the Band Gap of GCN

The photocatalytic activity of oxygen doped porous GCN using the developed GSVR model is presented in Figure 11. The figure also compares the measured values of the band gap with the estimated band gaps. The increase in the concentration of oxalic acid (which varies the concentration of oxygen in the samples) changes the surface area of the samples and correspondingly alters the band gap of the semiconductor. The estimated values agree excellently with the measured band gaps [35]. The active sites for photocatalytic reactions are enhanced due to the change in electronic structure of the samples consequent upon improvement in the surface area.

5. Conclusions

The band gap of graphitic carbon nitride (GCN) subjected to incorporation of external dopants and different experimental conditions are modeled using extreme learning machine (ELM)-based models and hybrid support vector regression and genetic algorithm. Since the specific surface area of two dimensional polymeric semiconductors enhances the number of active sites for photocatalytic reactions as well as electronic structure, while this surface area can be altered through experimental conditions coupled with the incorporation of dopants in the lattice structure of GCN, the developed models in this work utilize specific surface area as a descriptor for estimating band gap energy. The genetically optimized support vector regression (GSVR) outperforms ELM-based models with different activation functions such as sine (ELM-SINE), triangular basis function (ELM-TRANBAS) and sigmoid function (ELM-SIG) using three different parameters for model evaluation. From the outcomes of this work, the performance of the developed models can be ranked as GSVR > ELM-SINE > ELM-TRANBAS > ELM-SIG. The developed GSVR model investigates the influence of different experimental conditions and dopants on the band gap of GCN while the obtained band gaps agree excellently with the measured values. The reported precision of the developed models as observed from the closeness of the estimates of the models with the measured values and from the values of three different performance evaluation parameters, clearly signify that the developed models would provide a quick and accurate precision in estimating the band gap of doped GCN at relatively low cost with the circumvention of experimental stress.

Author Contributions

T.O.O. conceptualized and designed the experiment and drafted the manuscript while M.A.A.R. was involved in data collection, analysis and interpretation of results. All authors have read and agreed to the published version of the manuscript.

Funding

This research was funded by Universiti Putra Malaysia, grant number GP-IPM/2020/9694700” and “The APC was funded by Universiti Putra Malaysia.

Institutional Review Board Statement

Not applicable.

Informed Consent Statement

Not applicable.

Data Availability Statement

The required raw data to reproduce these findings are available in the references cited in Section 3.1 of the manuscript.

Acknowledgments

This project is funded by Universiti Putra Malaysia GP-IPM Funding Scheme with reference number of GP-IPM/2020/9694700.

Conflicts of Interest

The authors declare no competing financial or nonfinancial interests.

References

  1. Dongdong, X.U.; Xiaoni, L.I.; Juan, L.I.U.; Langhuan, H. Synthesis and photocatalytic performance of europium-doped graphitic carbon nitride. J. Rare Earths 2013, 31, 1085–1091. [Google Scholar]
  2. Raizada, P.; Sudhaik, A.; Singh, P.; Shandilya, P.; Kumar, V.; Hosseini-Bandegharaei, A.; Agrawal, S. Ag3PO4 modified phosphorus and sulphur co-doped graphitic carbon nitride as a direct Z-scheme photocatalyst for 2,4-dimethylphenol degradation. J. Photochem. Photobiol. A Chem. 2019, 374, 22–35. [Google Scholar] [CrossRef]
  3. Irfan, M.; Sevim, M.; Koçak, Y.; Balci, M.; Metin, Ö. Enhanced photocatalytic NOx oxidation and storage under visible-light irradiation by anchoring Fe3O4 nanoparticles on mesoporous graphitic carbon nitride (mpg-C3N4). Appl. Catal. B Environ. 2019, 249, 126–137. [Google Scholar] [CrossRef]
  4. Azuwa, M.; Zain, M.F.M.; Jeffery, L. Enhancement of visible light photocatalytic hydrogen evolution by bio-mimetic C-doped graphitic carbon nitride. Int. J. Hydrog. Energy 2019, 44, 13098–13105. [Google Scholar]
  5. Fan, Q.; Liu, J.; Yu, Y.; Zuo, S.; Li, B. A simple fabrication for sulfur doped graphitic carbon nitride porous rods with excellent photocatalytic activity degrading RhB dye. Appl. Surf. Sci. 2017, 391, 360–368. [Google Scholar] [CrossRef]
  6. Wang, Y.; Li, Y.; Bai, X.; Cai, Q.; Liu, C.; Zuo, Y.; Kang, S.; Cui, L. Facile synthesis of Y-doped graphitic carbon nitride with enhanced photocatalytic performance. CATCOM 2016, 84, 179–182. [Google Scholar] [CrossRef]
  7. Xu, G.; Xu, Y.; Zhou, Z.; Bai, Y. Facile hydrothermal preparation of graphitic carbon nitride supercell structures with enhanced photodegradation activity. Diam. Related Mater. 2019, 97, 107461. [Google Scholar] [CrossRef]
  8. Gu, J.; Chen, H.; Jiang, F.; Wang, X. Visible light photocatalytic mineralization of bisphenol A by carbon and oxygen dual-doped graphitic carbon nitride. J. Colloid Interface Sci. 2019, 540, 97–106. [Google Scholar] [CrossRef]
  9. Yang, Z.; Hu, K.; Meng, X.; Tao, Q.; Dong, J.; Liu, B.; Lu, Q.; Zhang, H.; Sundqvist, B.; Zhu, P.; et al. Tuning the band gap and the nitrogen content in carbon nitride materials by high temperature treatment at high pressure. Carbon 2018, 130, 170–177. [Google Scholar] [CrossRef]
  10. Basharnavaz, H.; Habibi-yangjeh, A.; Kamali, S.H. Fe, Ru, and Os‒embedded graphitic carbon nitride as a promising candidate for NO gas sensor: A first-principles investigation. Mater. Chem. Phys. 2019, 231, 264–271. [Google Scholar] [CrossRef]
  11. Shi, H.; He, R.; Sun, L.; Cao, G.; Yuan, X.; Xia, D. Band gap tuning of g-C 3 N 4 via decoration with AgCl to expedite the photocatalytic degradation and mineralization of oxalic acid. J. Environ. Sci. 2019, 84, 1–12. [Google Scholar] [CrossRef] [PubMed]
  12. Jiang, L.; Yuan, X.; Pan, Y.; Liang, J.; Zeng, G. Doping of graphitic carbon nitride for photocatalysis: A reveiw. Appl. Catal. B Environ. 2017, 217, 388–406. [Google Scholar] [CrossRef]
  13. Vapnik, V. The Nature of Statistical Learning Theory; Springer: New York, NY, USA, 1995. [Google Scholar]
  14. Holland, J.H. Genetic Algorithms. Sci. Am. 1992, 267, 66–73. [Google Scholar] [CrossRef]
  15. Ma, Y.; Wu, L.; Guan, Y.; Peng, Z. The capacity estimation and cycle life prediction of lithium-ion batteries using a new broad extreme learning machine approach. J. Power Sources 2020, 476, 228581. [Google Scholar] [CrossRef]
  16. Owolabi, T.O.; Gondal, M.A. Development of hybrid extreme learning machine based chemo-metrics for precise quantitative analysis of LIBS spectra using internal reference pre-processing method. Anal. Chim. Acta 2018. [Google Scholar] [CrossRef]
  17. Owolabi, T.O.; Gondal, M.A. Quantitative analysis of LIBS spectra using hybrid chemometric models through fusion of extreme learning machines and support vector regression. J. Intell. Fuzzy Syst. 2018, 1–10. [Google Scholar] [CrossRef]
  18. Huang, Y.; Yang, D.; Wang, K.; Wang, L.; Fan, J. A quality diagnosis method of GMAW based on improved empirical mode decomposition and extreme learning machine. J. Manuf. Process. 2020, 54, 120–128. [Google Scholar] [CrossRef]
  19. Owolabi, T.O. Extreme learning machine and swarm-based support vector regression methods for predicting crystal lattice parameters of pseudo-cubic/cubic perovskites Extreme learning machine and swarm-based support vector regression methods for predicting crystal lat. J. Appl. Phys. 2020, 127, 245107. [Google Scholar] [CrossRef]
  20. Smola, A.J.; Schölkopf, B. A Tutorial on Support Vector Regression. Stat. Comput. 2004, 14, 199–222. [Google Scholar] [CrossRef] [Green Version]
  21. Shamsah, S.M.I.; Owolabi, T.O. Newtonian mechanics based hybrid machine learning method of characterizing energy band gap of doped zno semiconductor. Chin. J. Phys. 2020, 68, 493–506. [Google Scholar] [CrossRef]
  22. Majid, A.; Khan, A.; Javed, G.; Mirza, A.M. Lattice constant prediction of cubic and monoclinic perovskites using neural networks and support vector regression. Comput. Mater. Sci. 2010, 50, 363–372. [Google Scholar] [CrossRef]
  23. Zhang, X.; Liang, D.; Zeng, J.; Asundi, A. Genetic algorithm-support vector regression for high reliability SHM system based on FBG sensor network. Opt. Lasers Eng. 2012, 50, 148–153. [Google Scholar] [CrossRef]
  24. Owolabi, T.O.; Akande, K.O.; Olatunji, S.O. Estimation of surface energies of hexagonal close packed metals using computational intelligence technique. Appl. Soft Comput. J. 2015, 31, 360–368. [Google Scholar] [CrossRef]
  25. Bian, X.Q.; Han, B.; Du, Z.M.; Jaubert, J.N.; Li, M.J. Integrating support vector regression with genetic algorithm for CO2-oil minimum miscibility pressure (MMP) in pure and impure CO2 streams. Fuel 2016, 182, 550–557. [Google Scholar] [CrossRef]
  26. Ghorbani, M.; Zargar, G.; Jazayeri-Rad, H. Prediction of asphaltene precipitation using support vector regression tuned with genetic algorithms. Petroleum 2016, 2, 301–306. [Google Scholar] [CrossRef] [Green Version]
  27. Owolabi, T.O. Modeling the magnetocaloric effect of manganite using hybrid genetic and support vector regression algorithms. Phys. Lett. A 2019, 383, 1782–1790. [Google Scholar] [CrossRef]
  28. Ahmed, W.; Ma, H.; Ouyang, X.; Mo, D.Y. Prediction of aircraft trajectory and the associated fuel consumption using covariance bidirectional extreme learning machines. Transp. Res. Part E 2021, 145, 102189. [Google Scholar]
  29. Pang, S.; Hou, X.; Xia, L. Borrowers’ credit quality scoring model and applications, with default discriminant analysis based on the extreme learning machine. Technol. Forecast. Soc. Chang. 2020, 165, 120462. [Google Scholar]
  30. Huang, G.B.; Zhu, Q.Y.; Siew, C.K. Extreme learning machine: Theory and applications. Neurocomputing 2006, 70, 489–501. [Google Scholar] [CrossRef]
  31. Feng, X.; Chen, H.; Jiang, F.; Wang, X. Enhanced visible-light photocatalytic nitrogen fixation over semicrystalline graphitic carbon nitride: Oxygen and sulfur co-doping for crystal and electronic structure modulation. J. Colloid Interface Sci. 2018, 509, 298–306. [Google Scholar] [CrossRef]
  32. Hu, F.; Luo, W.; Hu, Y.; Dai, H.; Peng, X. Insight into the kinetics and mechanism of visible-light photocatalytic degradation of dyes onto the P doped mesoporous graphitic carbon nitride. J. Alloys Compd. 2019, 794, 594–605. [Google Scholar] [CrossRef]
  33. Li, F.; Han, M.; Jin, Y.; Zhang, L.; Li, T.; Gao, Y.; Hu, C. Internal electric fi eld construction on dual oxygen group-doped carbon nitride for enhanced photodegradation of pollutants under visible light irradiation. Appl. Catal. B Environ. 2019, 256, 117705. [Google Scholar] [CrossRef]
  34. Wang, K.; Gu, G.; Hu, S.; Zhang, J.; Sun, X.; Wang, F.; Li, P.; Zhao, Y.; Fan, Z.; Zou, X. Molten salt assistant synthesis of three-dimensional cobalt doped graphitic carbon nitride for photocatalytic N 2 fi xation: Experiment and DFT simulation analysis. Chem. Eng. J. 2019, 368, 896–904. [Google Scholar] [CrossRef]
  35. Qiu, P.; Xu, C.; Chen, H.; Jiang, F.; Wang, X.; Lu, R. One step synthesis of oxygen doped porous graphitic carbon nitride with remarkable improvement of photo-oxidation activity: Role of oxygen on visible light photocatalytic activity. Applied Catal. B Environ. 2017, 206, 319–327. [Google Scholar] [CrossRef]
  36. Cao, J.; Nie, W.; Huang, L.; Ding, Y.; Lv, K.; Tang, H. Photocatalytic activation of sul fi te by nitrogen vacancy modi fi ed graphitic carbon nitride for e ffi cient degradation of carbamazepine. Appl. Catal. B Environ. 2019, 241, 18–27. [Google Scholar] [CrossRef]
  37. Zhang, X.; Song, H.; Sun, C.; Chen, C.; Han, F.; Li, X. Photocatalytic oxidative desulfurization and denitrogenation of fuels over sodium doped graphitic carbon nitride nanosheets under visible light irradiation. Mater. Chem. Phys. 2019, 226, 34–43. [Google Scholar] [CrossRef]
  38. Tripathi, A.; Narayanan, S. Potassium doped graphitic carbon nitride with extended optical absorbance for solar light driven photocatalysis. Appl. Surf. Sci. 2019, 479, 1–11. [Google Scholar] [CrossRef]
  39. Ding, R.; Cao, S.; Chen, H.; Jiang, F.; Wang, X. Preparation of tellurium doped graphitic carbon nitride and its visible-light photocatalytic performance on nitrogen fixation. Colloids Surfaces A 2019, 563, 263–270. [Google Scholar] [CrossRef]
  40. Sudhaik, A.; Raizada, P.; Shandilya, P.; Jeong, D.; Lim, J. Review on fabrication of graphitic carbon nitride based ef fi cient nanocomposites for photodegradation of aqueous phase organic pollutants. J. Ind. Eng. Chem. 2018, 67, 28–51. [Google Scholar] [CrossRef]
  41. Liu, Z.; Jiang, Y.; Liu, X.; Zeng, G.; Shao, B.; Liu, Y. Silver chromate modified sulfur doped graphitic carbon nitride microrod composites with enhanced visible-light photoactivity towards organic pollutants degradation. Compos. Part B 2019, 173, 106918. [Google Scholar] [CrossRef]
Figure 1. Flow chart of the computational strategies employed for extreme learning machine (ELM)-based model development.
Symmetry 13 00411 g001
Figure 2. Model (genetic algorithm-based support vector regression; GSVR) convergence with the number of population.
Symmetry 13 00411 g002
Figure 3. Convergence of the regularization factor of developed GSVR model.
Symmetry 13 00411 g003
Figure 4. Convergence of kernel option of the developed GSVR model.
Symmetry 13 00411 g004
Figure 5. Comparing GSVR and ELM-based models using coefficient of correlation.
Symmetry 13 00411 g005
Figure 6. Comparing GSVR and ELM-based models using root mean square error (RMSE).
Symmetry 13 00411 g006
Figure 7. Comparing GSVR and ELM-based models using mean absolute error (MAE).
Symmetry 13 00411 g007
Figure 8. Correlation cross-plot between the estimated and measured band gaps using the developed models.
Symmetry 13 00411 g008
Figure 9. Influence of the preparation condition on band gap of graphitic carbon nitride (GCN).
Symmetry 13 00411 g009
Figure 10. Significance of heating temperature and sulfur dopants on the band gap of GCN.
Symmetry 13 00411 g010
Figure 11. Effect of oxygen incorporation in GCN crystal structure on the energy band gap.
Symmetry 13 00411 g011
Table 1. Preliminary statistical analysis performed on the dataset.
MeanMaximumMinimum Correlation Coefficient
Surface area49.36926210.15.6−0.03
Band gap2.6509522.931.68
Table 2. Optimum obtained values of support vector regression (SVR) parameters using genetic algorithm (GA).
HyperParameters (GSVR)Optimum Value
C1
N200
Gaussian kernel option 0.001099
Epsilon0.002
Hyperparameter lambda10−7
Table 3. Model performance evaluation parameters.
Coefficient of CorrelationRMSE (ev)MAE (ev)
GSVR0.96800.04900.0245
ELM-SINE0.61340.16310.1219
ELM-TRANBAS0.28110.18570.1252
ELM-SIG0.27200.18630.1274
Publisher’s Note: MDPI stays neutral with regard to jurisdictional claims in published maps and institutional affiliations.

