Article

Microsatellites as Agents of Adaptive Change: An RNA-Seq-Based Comparative Study of Transcriptomes from Five Helianthus Species

by
Chathurani Ranathunge
1,2,*,†,
Sreepriya Pramod
1,3,*,†,
Sébastien Renaut
4,5,
Gregory L. Wheeler
1,6,
Andy D. Perkins
7,
Loren H. Rieseberg
4 and
Mark E. Welch
1
1
Department of Biological Sciences, Mississippi State University, Starkville, MS 39762, USA
2
Department of Biology, University of Florida, Gainesville, FL 32611, USA
3
Altria Client Services LLC, Richmond, VA 23219, USA
4
Department of Botany and Biodiversity Research Centre, University of British Columbia, Vancouver, BC V6T 1Z4, Canada
5
My Intelligent Machines, Montreal, QC H2W 2R2, Canada
6
Nationwide Children’s Hospital, Columbus, OH 43205, USA
7
Department of Computer Science and Engineering, Mississippi State University, Starkville, MS 39762, USA
*
Authors to whom correspondence should be addressed.
Both authors contributed equally to this work.
Submission received: 19 April 2021 / Revised: 16 May 2021 / Accepted: 20 May 2021 / Published: 24 May 2021
(This article belongs to the Special Issue Molecular Biology and Genome Analysis)

Abstract

:
Mutations that provide environment-dependent selective advantages drive adaptive divergence among species. Many phenotypic differences among related species are more likely to result from gene expression divergence rather than from non-synonymous mutations. In this regard, cis-regulatory mutations play an important part in generating functionally significant variation. Some proposed mechanisms that explore the role of cis-regulatory mutations in gene expression divergence involve microsatellites. Microsatellites exhibit high mutation rates achieved through symmetric or asymmetric mutation processes and are abundant in both coding and non-coding regions in positions that could influence gene function and products. Here we tested the hypothesis that microsatellites contribute to gene expression divergence among species with 50 individuals from five closely related Helianthus species using an RNA-seq approach. Differential expression analyses of the transcriptomes revealed that genes containing microsatellites in non-coding regions (UTRs and introns) are more likely to be differentially expressed among species when compared to genes with microsatellites in the coding regions and transcripts lacking microsatellites. We detected a greater proportion of shared microsatellites in 5′UTRs and coding regions compared to 3′UTRs and non-coding transcripts among Helianthus spp. Furthermore, allele frequency differences measured by pairwise FST at single nucleotide polymorphisms (SNPs), indicate greater genetic divergence in transcripts containing microsatellites compared to those lacking microsatellites. A gene ontology (GO) analysis revealed that microsatellite-containing differentially expressed genes are significantly enriched for GO terms associated with regulation of transcription and transcription factor activity. Collectively, our study provides compelling evidence to support the role of microsatellites in gene expression divergence.

1. Introduction

Understanding the genomic basis of adaptive divergence among species remains a central theme in evolutionary biology. A major contributor to species divergence is variation in gene expression regulation [1]. Mutations within the cis-regulatory regions appear to be especially important in generating evolutionarily significant variations among species [2]. Indeed, studies analyzing the relative contribution of cis-regulatory mechanisms and protein coding changes in species divergence suggest that ontogenetic change among species is frequently cued by cis regulatory elements [3,4,5]. Some of the most frequently found cis-regulatory elements are highly mutable microsatellites or short tandem repeats [6]. A growing body of research now suggests that microsatellites in cis-regulatory regions can play a major role in gene expression variation [7,8].
Microsatellites consist of short tandem repeats, typically with 2- to 6-base-pair-long motifs, repeated several to dozens of times [9,10]. Microsatellite evolution is often explained using the Stepwise Mutation Model (SMM) [11], in which mutation is achieved through addition or loss of a single repeat unit resulting in microsatellite length variation according to a symmetric random walk [12]. Significant deviations from this symmetry (skewness or asymmetry) in the distribution of microsatellite repeat numbers have been at times interpreted as evidence for selection [13]. Long considered non-functional and evolutionarily neutral, microsatellites are frequently used in genetic studies due to their high polymorphism [14]. Despite the high mutation rates associated with microsatellites, they are an integral part of all eukaryotic genomes and transcriptomes [15]. Initially, microsatellites were viewed as sequences that could be detrimental if present in the transcribed regions of the genome. For example, uncontrolled expansion of microsatellites in genic regions is known to cause nearly 30 human neurodegenerative diseases [16], including Huntington’s disease and fragile X syndrome. Yet, over the years, several studies have shown that microsatellites could be functionally beneficial and could facilitate rapid adaptation [17,18].
Microsatellites have recently been implicated in morphogenesis and reproductive phenology in plants [19,20,21], neuronal and craniofacial development in primates [22,23], limb and skull morphology in domesticated dogs [24], circadian clock cycles in fungi [25], and courtship behaviors in mammals [26], among other traits. Several mechanisms have been proposed to explain how the presence of microsatellites in different regions of the genome can affect gene function and products. Microsatellites may alter transcription rates by serving as alternative transcription start sites [27], provide additional transcription factor binding sites [28], and variation in some coding region microsatellites may affect the structure of proteins, including that of transcription factors [24]. With the advent of high-throughput sequencing, microsatellites and their functional role in gene regulation are now being studied at the genome level. Several such large-scale genome-wide and transcriptome-wide studies indicate that microsatellite-linked variations in gene expression are neither isolated nor sporadic, but widespread across genomes [29,30,31,32].
In this study, we investigate the role of microsatellites in gene expression divergence among species by comparing transcriptomes of several individuals belonging to the genus of North American annual wild sunflowers (Helianthus). Helianthus has a well-characterized ecological and evolutionary history [33], and the genomic basis of local adaptation, ecotype formation, and speciation is well-documented in several species [34,35,36]. This makes them a good system for studying adaptive processes such as those that can result from microsatellite polymorphisms in genes.
Recent transcriptome-based studies of the common sunflower (Helianthus annuus L.) revealed that a substantial number of transcribed microsatellites in sunflower can be functional. Over 400 transcribed microsatellites have been linked to gene expression variation in common sunflower populations across a latitudinal gradient in North America [32]. Furthermore, microsatellites of A and AG motif types have been linked to gene expression divergence among populations of common sunflower [37]. These previous studies on functional microsatellites in common sunflower provide impetus to explore the potential evolutionary role of transcribed microsatellites in gene expression divergence among closely related Helianthus species.
We designed the current study to answer the following questions:
(1)
Are microsatellite-containing genes more likely to show evidence of expression divergence among species, as compared to genes lacking microsatellites?
(2)
Do microsatellites-containing genes exhibit greater levels of genetic divergence compared to genes lacking microsatellites?

2. Materials and Methods

2.1. Plant Sampling and Sequencing

Seeds were collected from plants belonging to six Helianthus species—H. annuus, H. bolanderi, H. debilis, H. exilis, H. petiolaris, and H. argophyllus—growing in their natural ranges. These seeds were grown in greenhouses at University of British Columbia. Further protocols for plant sample preparation, RNA extraction, and Illumina GAII 2x100 paired end sequencing for 50 individuals belonging to five major Helianthus species (H. annuus, H. bolanderi, H. debilis, H. exilis, and H. petiolaris) are described in detail elsewhere [38,39].

2.2. Post Sequencing Data Collection

A reference transcriptome was constructed from one H. annuus individual (“Canal2”) using the de novo transcriptome assembly software Trinity [40]. The reference assembly consists of 51,468 transcripts as is available here: https://0-doi-org.brum.beds.ac.uk/10.5061/dryad.9q1n4 (accessed on 15 March 2021) [41]. Each fastq file containing the raw reads for an individual was aligned to the reference transcriptome using BWA [42]. The resulting aligned files in BAM format were indexed and reads mapped to each transcript were measured as counts using SAMTools v.0.1.17 [43].

2.3. Functional Annotation

A standalone BLASTX [44] search of the reference transcriptome was performed against a publicly available H. annuus protein sequence database. First, we built a local protein sequence database with common sunflower protein sequences, available at https://www.heliagene.org/ (version HanXRQr2.0-SUNRISE. accessed on 15 March 2021). Using the reference transcriptome as the query, we performed a BLASTX search against the sunflower protein sequence database with an E-value cutoff set at 0.0001, gap open penalty score set at 11, gap extension penalty score of one, and minimum word size of three. We used BLOSUM62 as the matrix of choice for the search. To minimize the number of hits for each query sequence, we set the best hit overhang at 0.25 and the maximum target sequence value at one. The output of best hits produced by the BLASTX search was further filtered based on E-value and bit score to retain the hit with the lowest E-value and the highest bit score for each query sequence.

2.4. Mining and Genotyping SNPs and Microsatellites

To identify and genotype SNPs present in all individuals, we used the “bcftools” and “mpileup” option in SAMTools v.0.1.17 [43]. SNP genotypes with Phred-scaled genotype likelihoods below 30 were excluded from analyses, and hence, only high-quality SNPs were used in further analyses. The methodology was previously detailed in [41].
Microsatellites were identified using SciRoKo v 3.4 [45]. The parameters in SciRoKo were set to mine microsatellites of repeat sizes 1 to 6 bp, a minimum total length of 15 bp, and to find impure microsatellites, i.e., microsatellites that are interrupted by few substitutions or indels, using the “mismatch variable penalty” option, which allows for selection of impure microsatellites adjusted with respect to the total length of the tract.
Microsatellite alleles at a locus can be genotyped using RepeatSeq v 0.8.2 [46]. RepeatSeq works in conjunction with Tandem Repeats Finder (TRF) v. 4.07b [47]. Hence, microsatellites were mined from the reference transcriptome using TRF. This list of microsatellites generated by TRF is not as exhaustive as the list provided by SciRoKo, due to the more stringent criterion used by TRF that prevents mining shorter microsatellites. TRF was run using default settings, except for the parameter, raw score adjusted from the default 50 to 35, and the maximum repeat size adjusted to 6. All individuals were genotyped at the TRF-generated list of microsatellites using RepeatSeq. RepeatSeq was run with default settings along with parameters set to output “calls” and “repeatseq” files, which contain a list of all microsatellite genotype assignments and alignments at each microsatellite region, respectively.

2.5. Differential Expression

We performed differential gene expression analysis in OmicsBox version 1.4 (BioBam Bioinformatics S.L., Valencia, Spain) with the edgeR package [48]. False discovery rate (FDR) was set to 0.05 with a log fold change of ≤2 or ≥2, and read counts were normalized for relative expression and effective library size with the TMM (Trimmed Mean of M-values) method implemented in edgeR. The minimum number of samples reaching more than zero counts per million reads (CPM filter) was set to three to match the number of samples in the smallest group (H. bolanderi) in the data set. We performed differential expression analyses for each pair of species (10 comparisons), and genes with log fold change of ≤2 or ≥2 at FDR < 0.05 for each comparison were identified as significantly differentially expressed (DE) genes for each pairwise species comparison and used in downstream analyses.

2.6. Gene Ontology (GO) Enrichment Analysis

A complete list of gene ontology (GO) terms associated with all annotated H. annuus genes available as part of the reference genome [49], was downloaded from https://www.heliagene.org/HanXRQr2.0-SUNRISE/downloads/2.1/HanXRQr2.0-SUNRISE-2.1.Blast2GO-20181213.zip (accessed on 16 March 2021). We extracted GO terms associated with the transcripts in the reference transcriptome from the downloaded complete list of GO terms and created a background list for GO enrichment analysis with OmicsBox version 1.4 (BioBam Bioinformatics S.L., Valencia, Spain).
Microsatellite-containing differentially expressed genes for each pairwise species comparison were extracted from the list of microsatellite-containing genes identified by SciRoKo that were successfully mapped to the reference genome. Helianthus annuus gene IDs (HanXRQr2.0 IDs) associated with microsatellite-containing differentially expressed genes were used as the “Test-set”, and the background list of all H. annuus gene IDs associated with the reference transcriptome was used as the “Reference-set” in the GO enrichment analysis for each pairwise species comparison. Additionally, we conducted a GO enrichment analysis of all microsatellite-containing genes that were differentially expressed in at least one pairwise species comparison against the background list of all expressed genes in the reference transcriptome. All GO enrichment analyses were conducted in OmicsBox version 1.4 by performing Fisher’s Exact Test with FDR set to 0.05.

2.7. Relative Importance of Microsatellites in Species Divergence

We are interested in understanding the role of microsatellites in species divergence via gene expression changes. To test this hypothesis, Chi-squared tests were performed to detect if microsatellite-containing genes were more likely to be differentially expressed than genes lacking microsatellites. We performed Chi-squared tests for each pairwise species comparison, and across all comparisons with microsatellites that were identified in DE genes in at least one pairwise species comparison. If microsatellites are important for bringing about species level divergence, then an elevated proportion of microsatellite-containing genes would show differential expression as opposed to genes lacking microsatellites.
Furthere, using the alignment start and end sites from the BLASTX output of the reference transcriptome and the microsatellite start and end sites from the SciRoKo output of the microsatellite search, we identified the location of the microsatellites (non-coding versus coding) within the transcripts. Previous large-scale studies on humans and plants have shown that in transcribed regions, more microsatellites are located within non-coding regions than in coding regions [50,51,52]. We observed similar patterns of microsatellite distribution in the reference transcriptome used in this study. Given the abundance of microsatellites within non-coding regions, which includes UTRs, and their implicated role in gene expression regulation [53,54,55], we tested with Chi-squared tests whether genes containing microsatellites within non-coding regions were more likely to be differentially expressed compared to genes that contained microsatellites in coding regions and genes lacking microsatellites.

2.8. Population Genetic Analyses

Individual genotypes for SNPs for four species (H. annuus, H. debilis, H. petiolaris, and H. argophyllus) were used to conduct population genetic analyses. H. bolanderi and H. exilis were excluded from the population genetic analyses due to low sample size. PGDSpider v. 2.0.4 [56] was used to convert the SNP genotypes files into formats suitable for further population genetic analyses. To assess the level of genetic divergence among species, FST values [57] were estimated in R v.2.15.3 [58] using the package Hierfstat v. 0.04-10 [59] for SNPs in both microsatellite-containing transcripts and those lacking microsatellites.
Microsatellites on average tend to have higher mutation rates when compared to the rest of the genome [60], hence, to obtain a neutral estimate of genetic divergence between genes harboring microsatellites and gene lacking microsatellites, FST values at SNPs were estimated separately for each category. With respect to microsatellites’ role in species divergence, we assume that microsatellite alleles of different lengths could aid in differential response to the environment; hence, different microsatellite alleles are likely to be positively selected in different species. As such, if variation in microsatellite lengths is contributing to differences among species, then allele frequency differences at microsatellite-containing genes are likely to be elevated among species when compared to the background rate of divergence. Hence, to ascertain if genetic divergence observed in microsatellite-containing genes is likely to be higher or lower than the background rate of divergence, we compared FST values from SNPs at microsatellite-containing genes versus those lacking microsatellites. Wilcoxon Rank Sum tests were carried out in R v.15.2.0 [58] to evaluate significance.

2.9. Shared Microsatellites

To estimate the proportion of microsatellite tracts identified in H. annuus that are shared across other Helianthus species, a subset of 1129 microsatellite loci with sufficient genotype data across 48 out of the 50 individuals was extracted from microsatellites detected by TRF. Coverage was determined based on SAMtools idxstats gene-by-gene expression data, with >0 reads found at a gene considered to indicate coverage. This set of 1129 was then analyzed by RepeatSeq, with successful genotyping of a locus in an individual considered as evidence for that locus being shared with that individual. Motif size and gene region information obtained via ESTscan v. 3.0.2 [61,62] data were then used to test whether the location of the microsatellite within a gene determined the likelihood of that microsatellite being shared among the five Helianthus species. Values were normalized relative to the average detection rate of loci in H. annuus.

3. Results

3.1. SNPs and Microsatellites Mined

Approximately 200,000 high-quality SNPs, corresponding to 99.9% genotyping accuracy, were mined from the data using parameters previously described in [41]. All individuals were genotyped at these high-quality SNPs.
A total of 11,166 putative microsatellites were identified in the reference transcriptome by SciRoKo and of those, 9479 microsatellites located in 7247 transcripts were successfully mapped onto genes in the reference genome (Supplementary Table S1). A fraction (3786/11,166) was identified using TRF and used for further genotyping with RepeatSeq to assess the proportion of microsatellites shared among species. High-quality microsatellite loci were genotyped at 1129 of the original list of 3786 microsatellite loci in 48 individuals with RepeatSeq, and that information was used to identify the proportion of microsatellites that each species shared with H. annuus.

3.2. Differential Expression Analysis

Significantly differentially expressed (DE) genes were identified for each pairwise species comparison with edgeR. The highest number of DE transcripts was identified between H. exilis and H. petiolaris (20,851), of which 14,756 were mapped to annotated genes in the H. annuus genome (Supplementary Table S2). This estimate was closely followed by 20,476 (13,789 mapped to the H. annuus genome) DE transcripts identified between H. annuus and H. exilis (Supplementary Table S2). The lowest number of DE transcripts was observed between H. annuus and H. debilis (601), and 433 of those transcripts were successfully mapped to annotated genes in the H. annuus genome (Supplementary Table S2). No transcript was identified as significantly differentially expressed across all 10 pairwise species comparisons.

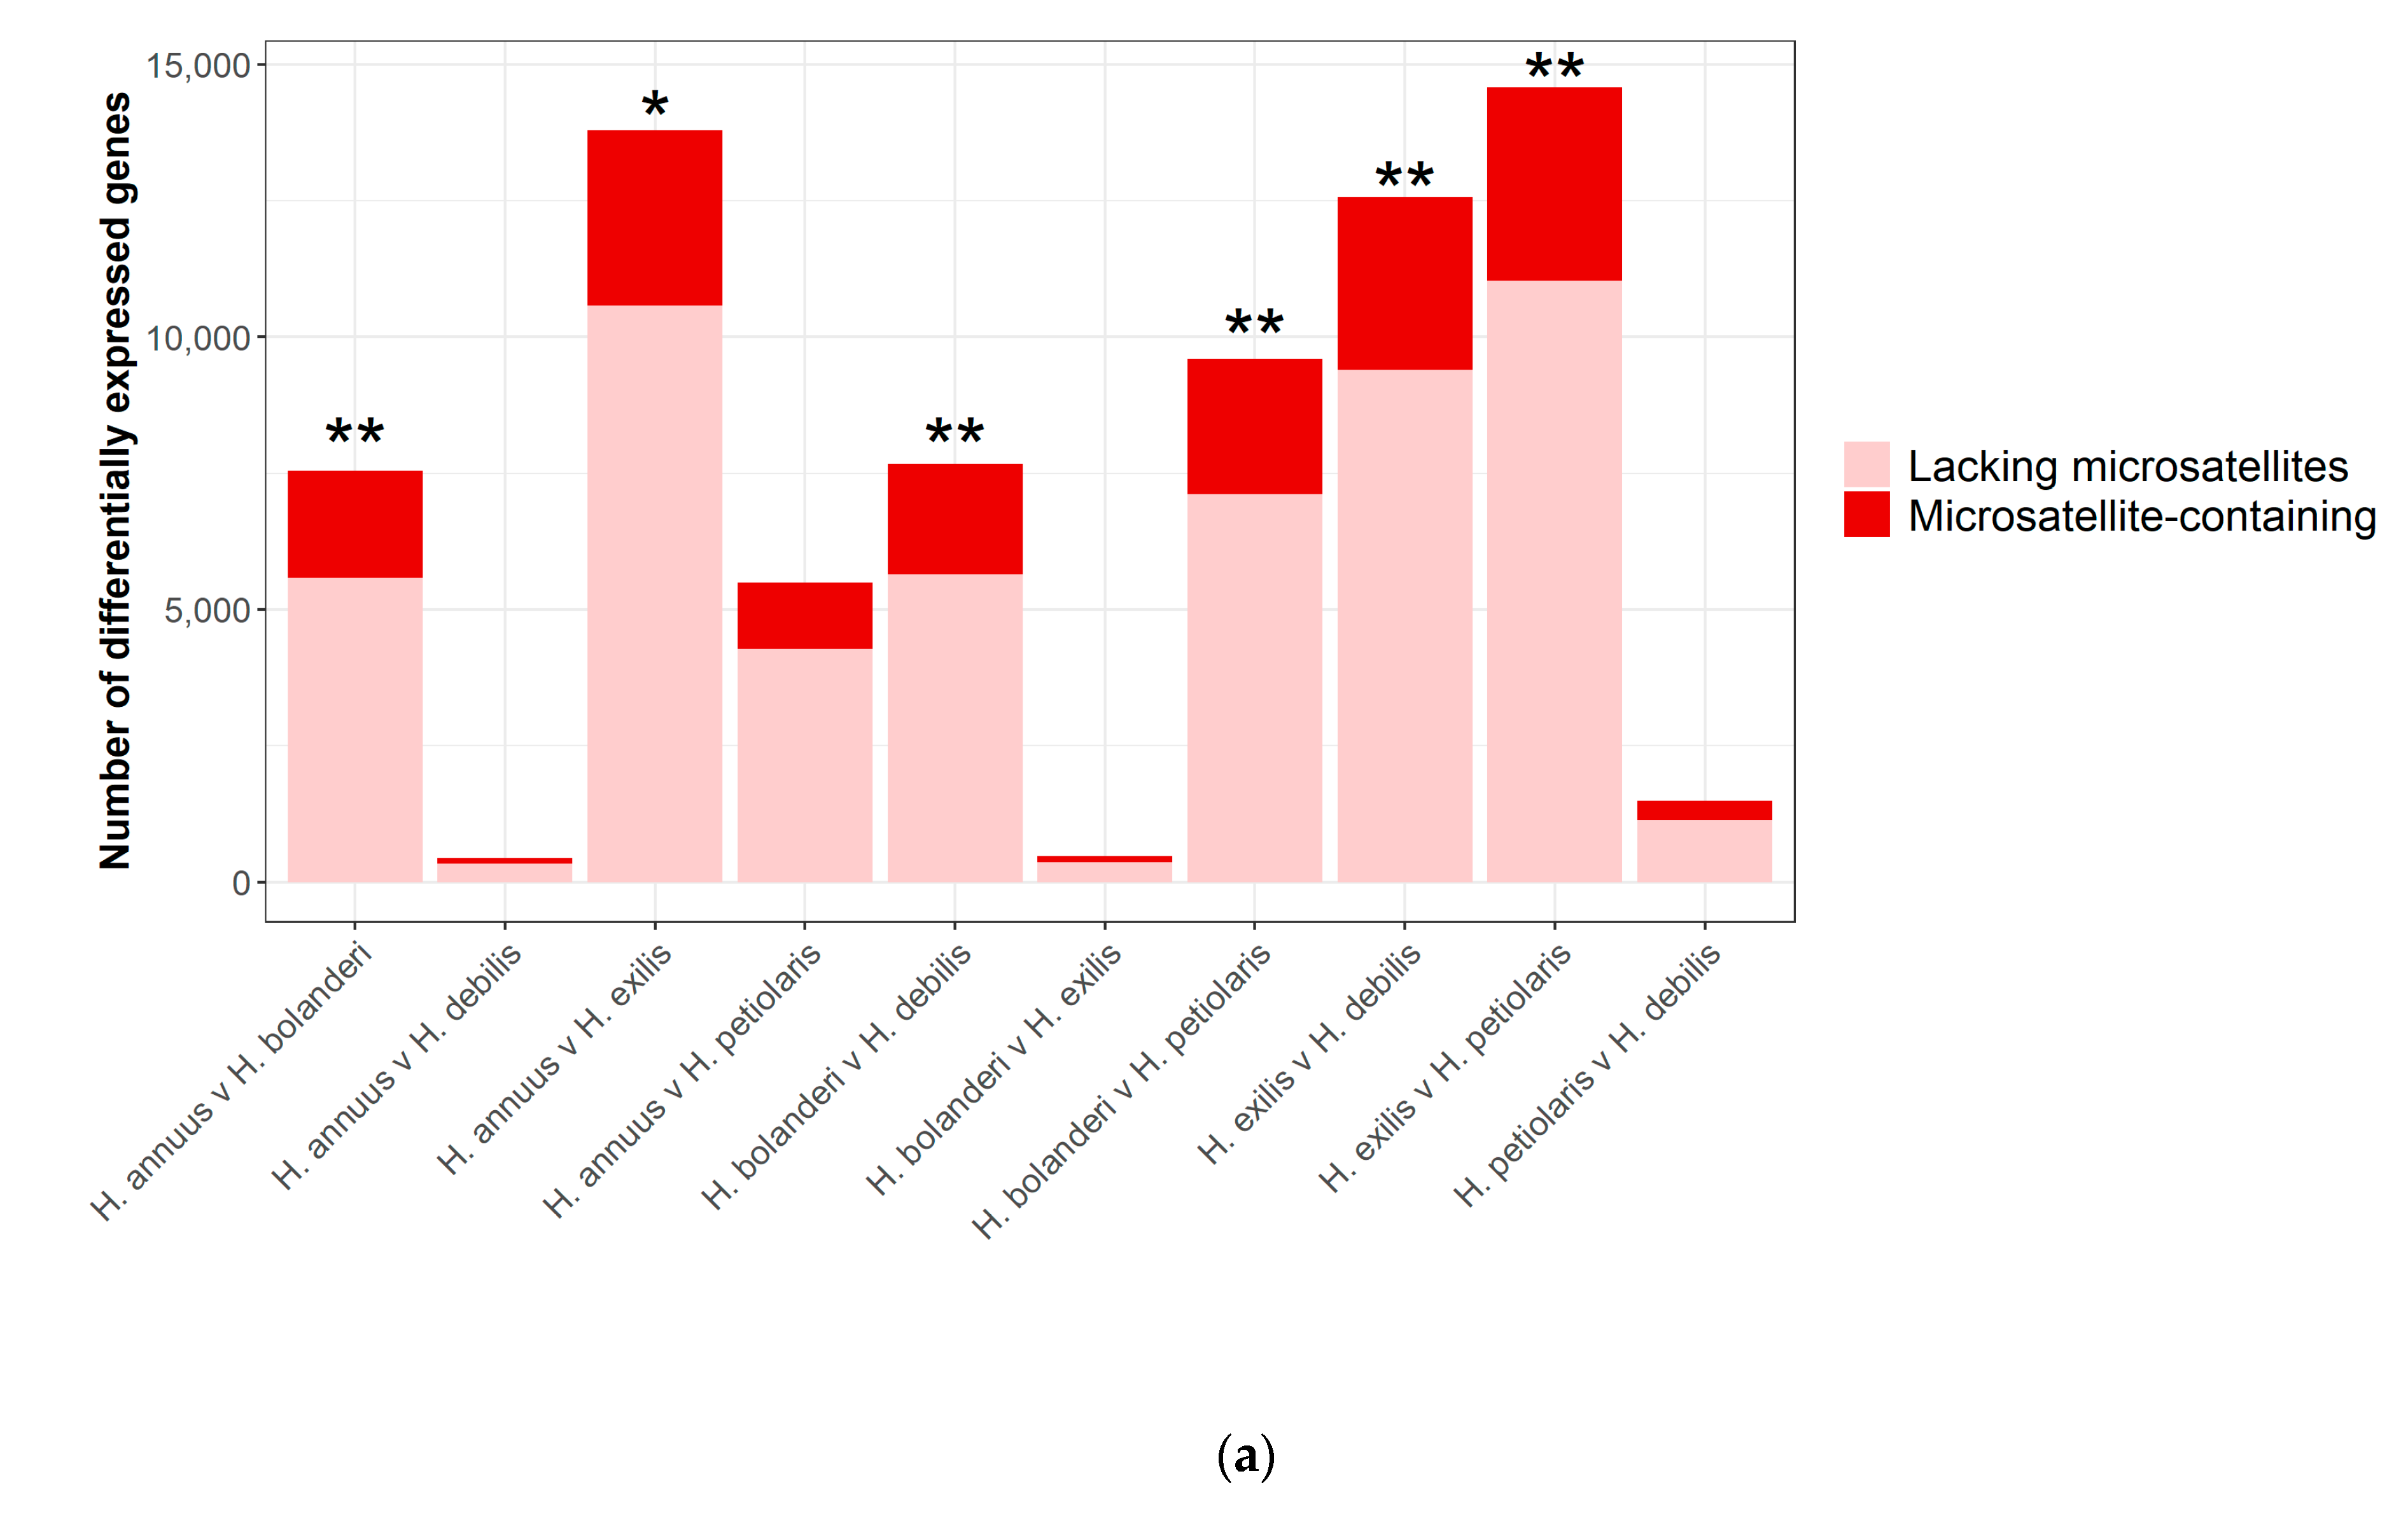
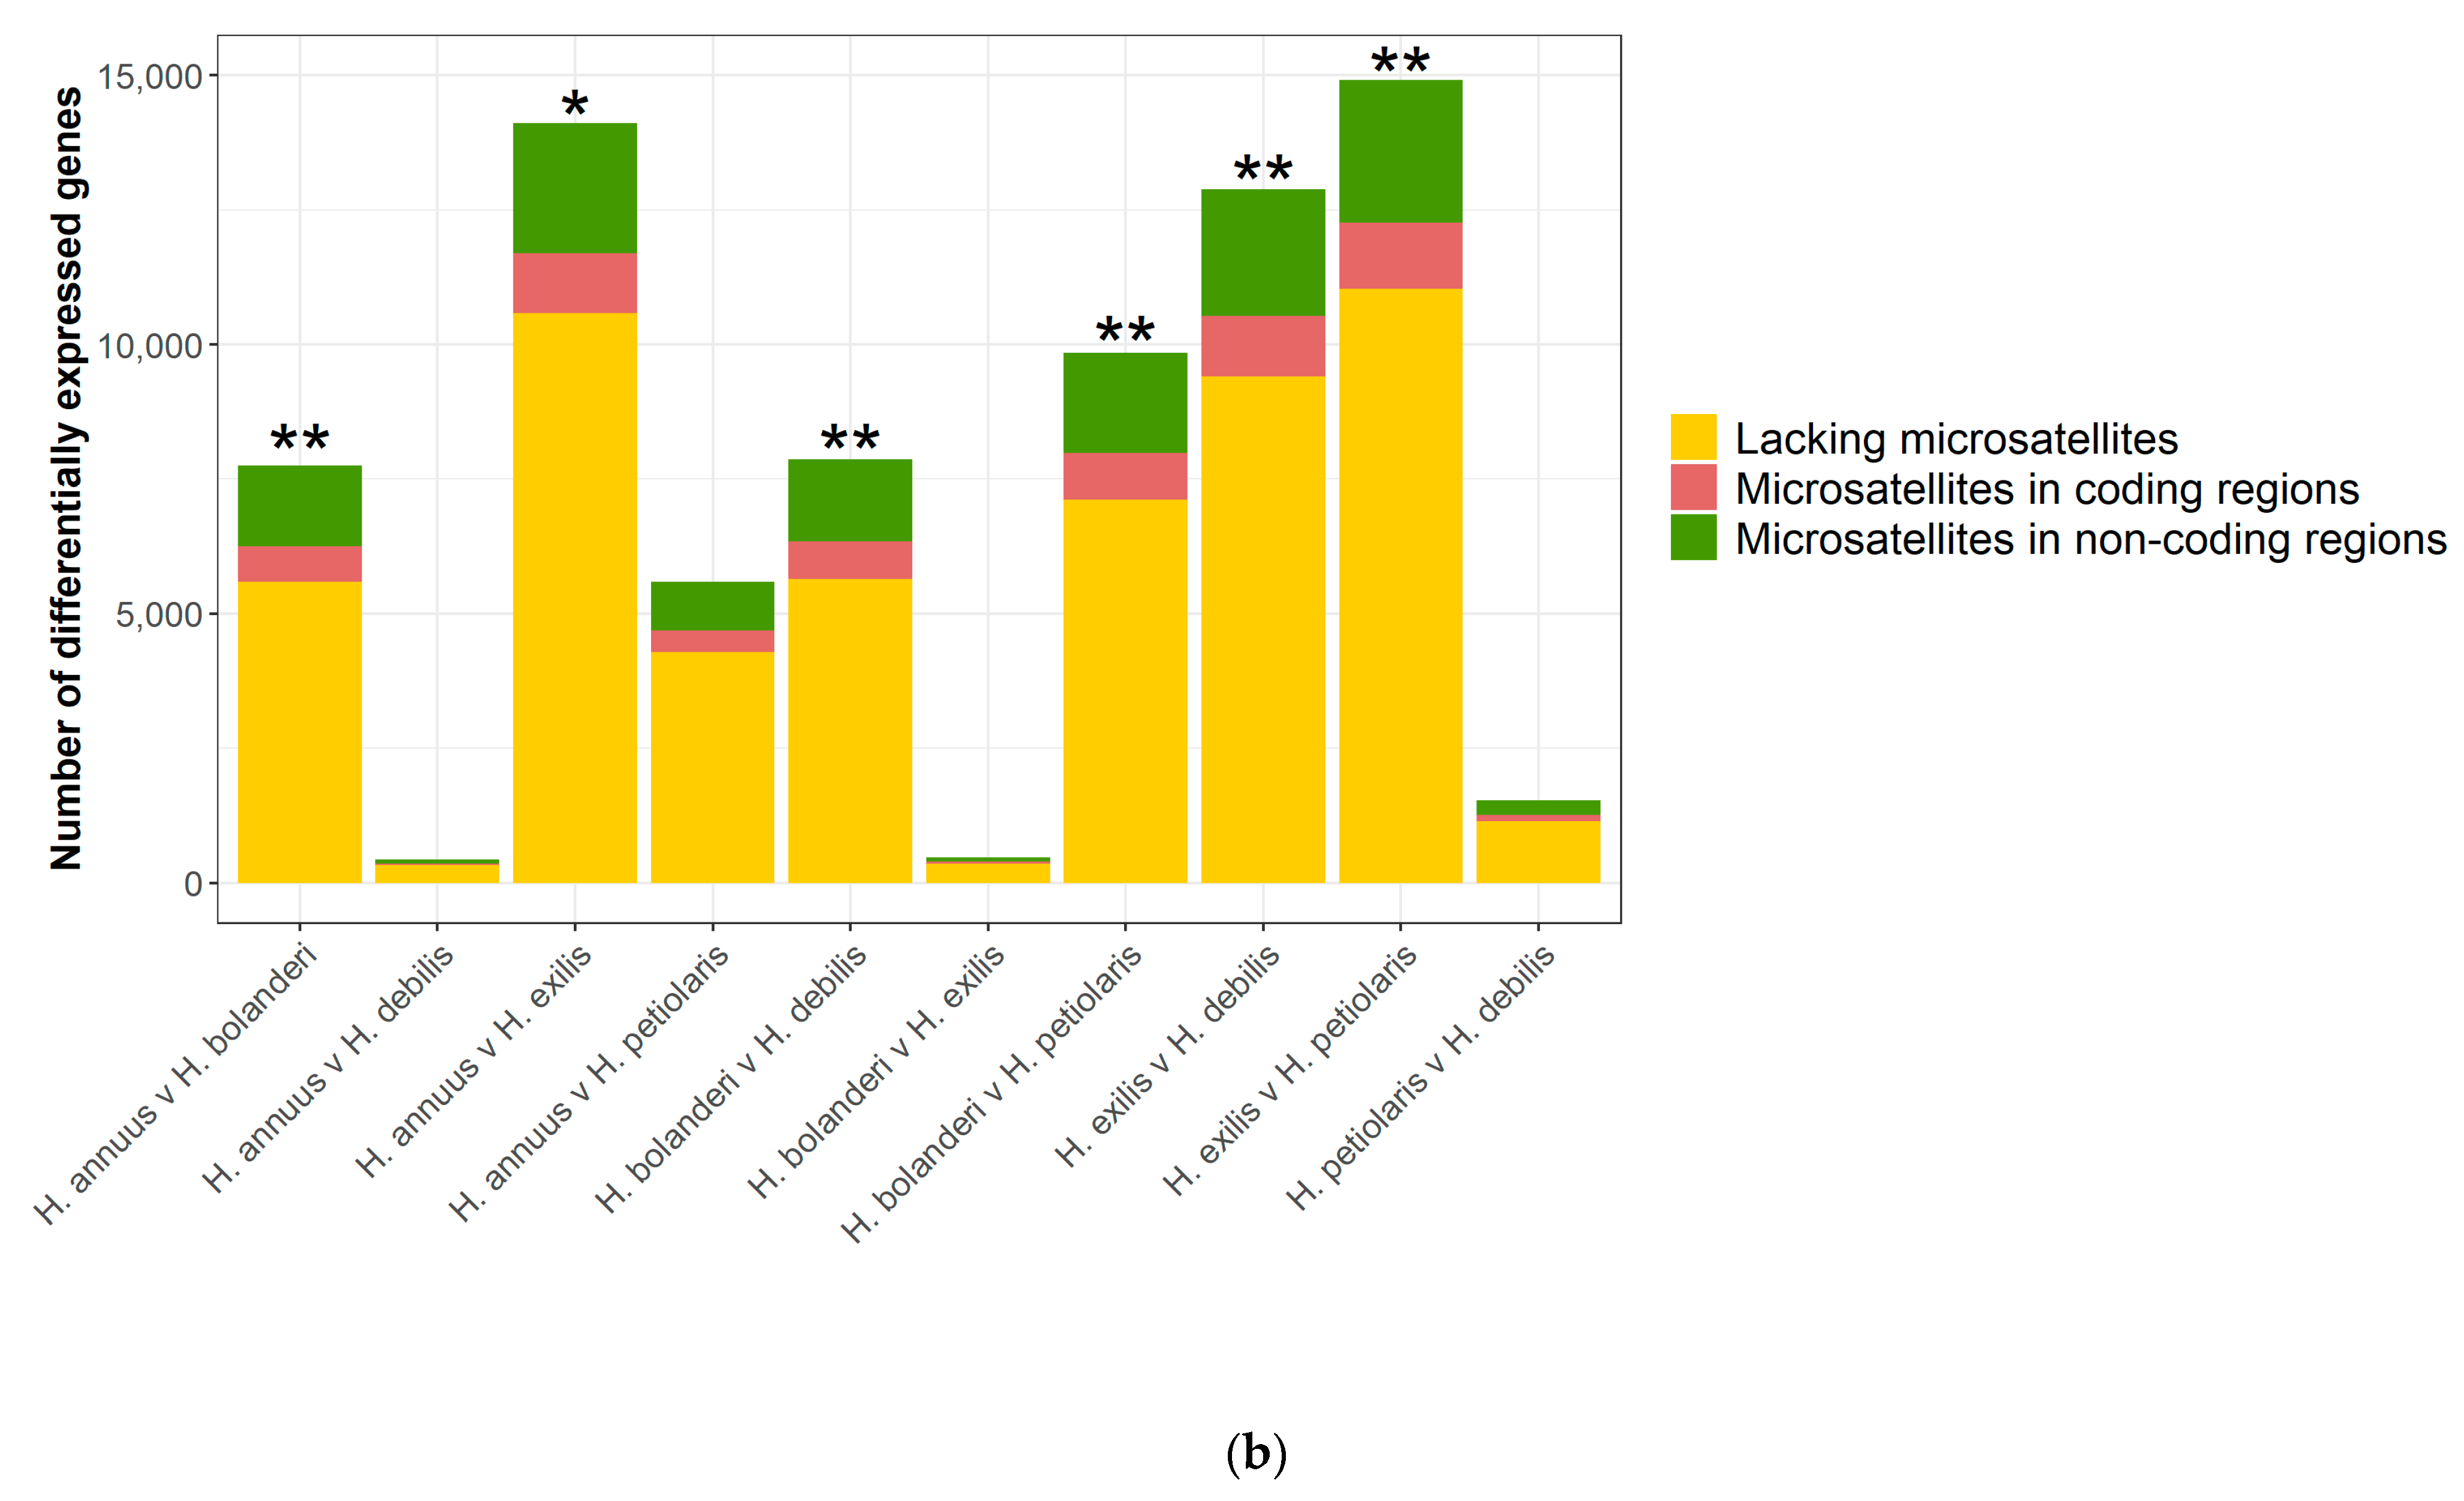
3.3. Microsatellite-Containing Differentially Expressed Genes

Using the list of 7247 microsatellite-containing genes in the reference transcriptome, we identified microsatellite-containing DE genes in all pairwise species comparisons (Supplementary Table S3). The highest percentage of microsatellite-containing DE genes was identified between H. bolanderi and H. debilis (26.4% of the 7671 DE genes) (Figure 1a). This was followed by 1952 (25.9% of the 7539 DE genes) microsatellite-containing DE genes identified in the H. annuus and H. bolanderi comparison (Figure 1a). The lowest percentage of microsatellite-containing DE genes was observed between H. annuus and H. petiolaris at 22% (1208 of 4282 DE genes) (Figure 1a). Across all 10 pairwise species comparisons, we identified 4978 microsatellite-containing DE genes (23.8% of 20,886 DE genes). In these microsatellite-containing genes that were identified as differentially expressed in at least one pairwise species comparison, the highest percentage of microsatellites was located in non-coding regions (68.4% of 5451 microsatellites). We observed similar patterns of microsatellite distribution in DE genes identified in pairwise species comparisons, and the greatest percentage of non-coding microsatellites were identified in the DE genes between H. annuus and H. debilis (74.5% of 106 microsatellites) (Table 1).
In general, when genes that were identified as differentially expressed in at least one pairwise species comparison (20,886) were considered, microsatellite-containing genes were more likely to be differentially expressed than genes lacking microsatellites (Chi-squared test, p-value < 0.00001, Figure 1a). Similarly, in 6 of the 10 pairwise species comparisons, we found that microsatellite-containing genes were more likely to show expression divergence compared to genes lacking microsatellites (Figure 1a). In four pairwise species comparisons (H. petiolaris v. H. debilis, H. bolanderi v. H. exilis, H. annuus v. H. petiolaris, and H. annuus v. H. debilis), presence of microsatellites did not affect the likelihood of differential expression in genes (Chi-squared test, p-value > 0.05) (Figure 1a).
We further tested whether genes containing microsatellites within non-coding regions (UTRs and introns) are more likely to be differentially expressed compared to genes with microsatellites in the coding regions and genes lacking microsatellites. Generally, across genes that were identified as differentially expressed in at least one pairwise species comparison (20,886), a gene with a microsatellite in non-coding regions was more likely to be differentially expressed compared to genes with microsatellites in the coding regions and genes lacking microsatellites (Chi-squared test, p-value < 0.0001) (Figure 1b). We observed similar associations of non-coding microsatellites and differential expression in six of the 10 pairwise species comparisons, except in H. petiolaris v. H. debilis, H. bolanderi v. H. exilis, H. annuus v. H. petiolaris, and H. annuus v. H. debilis (Chi-squared test, p-value > 0.05) (Figure 1b). However, trends were consistent with an elevated rate of differential expression between most species comparisons, and the relatively low numbers of DE genes identified in some of these pairwise comparisons may have likely reduced the power to detect significant associations.

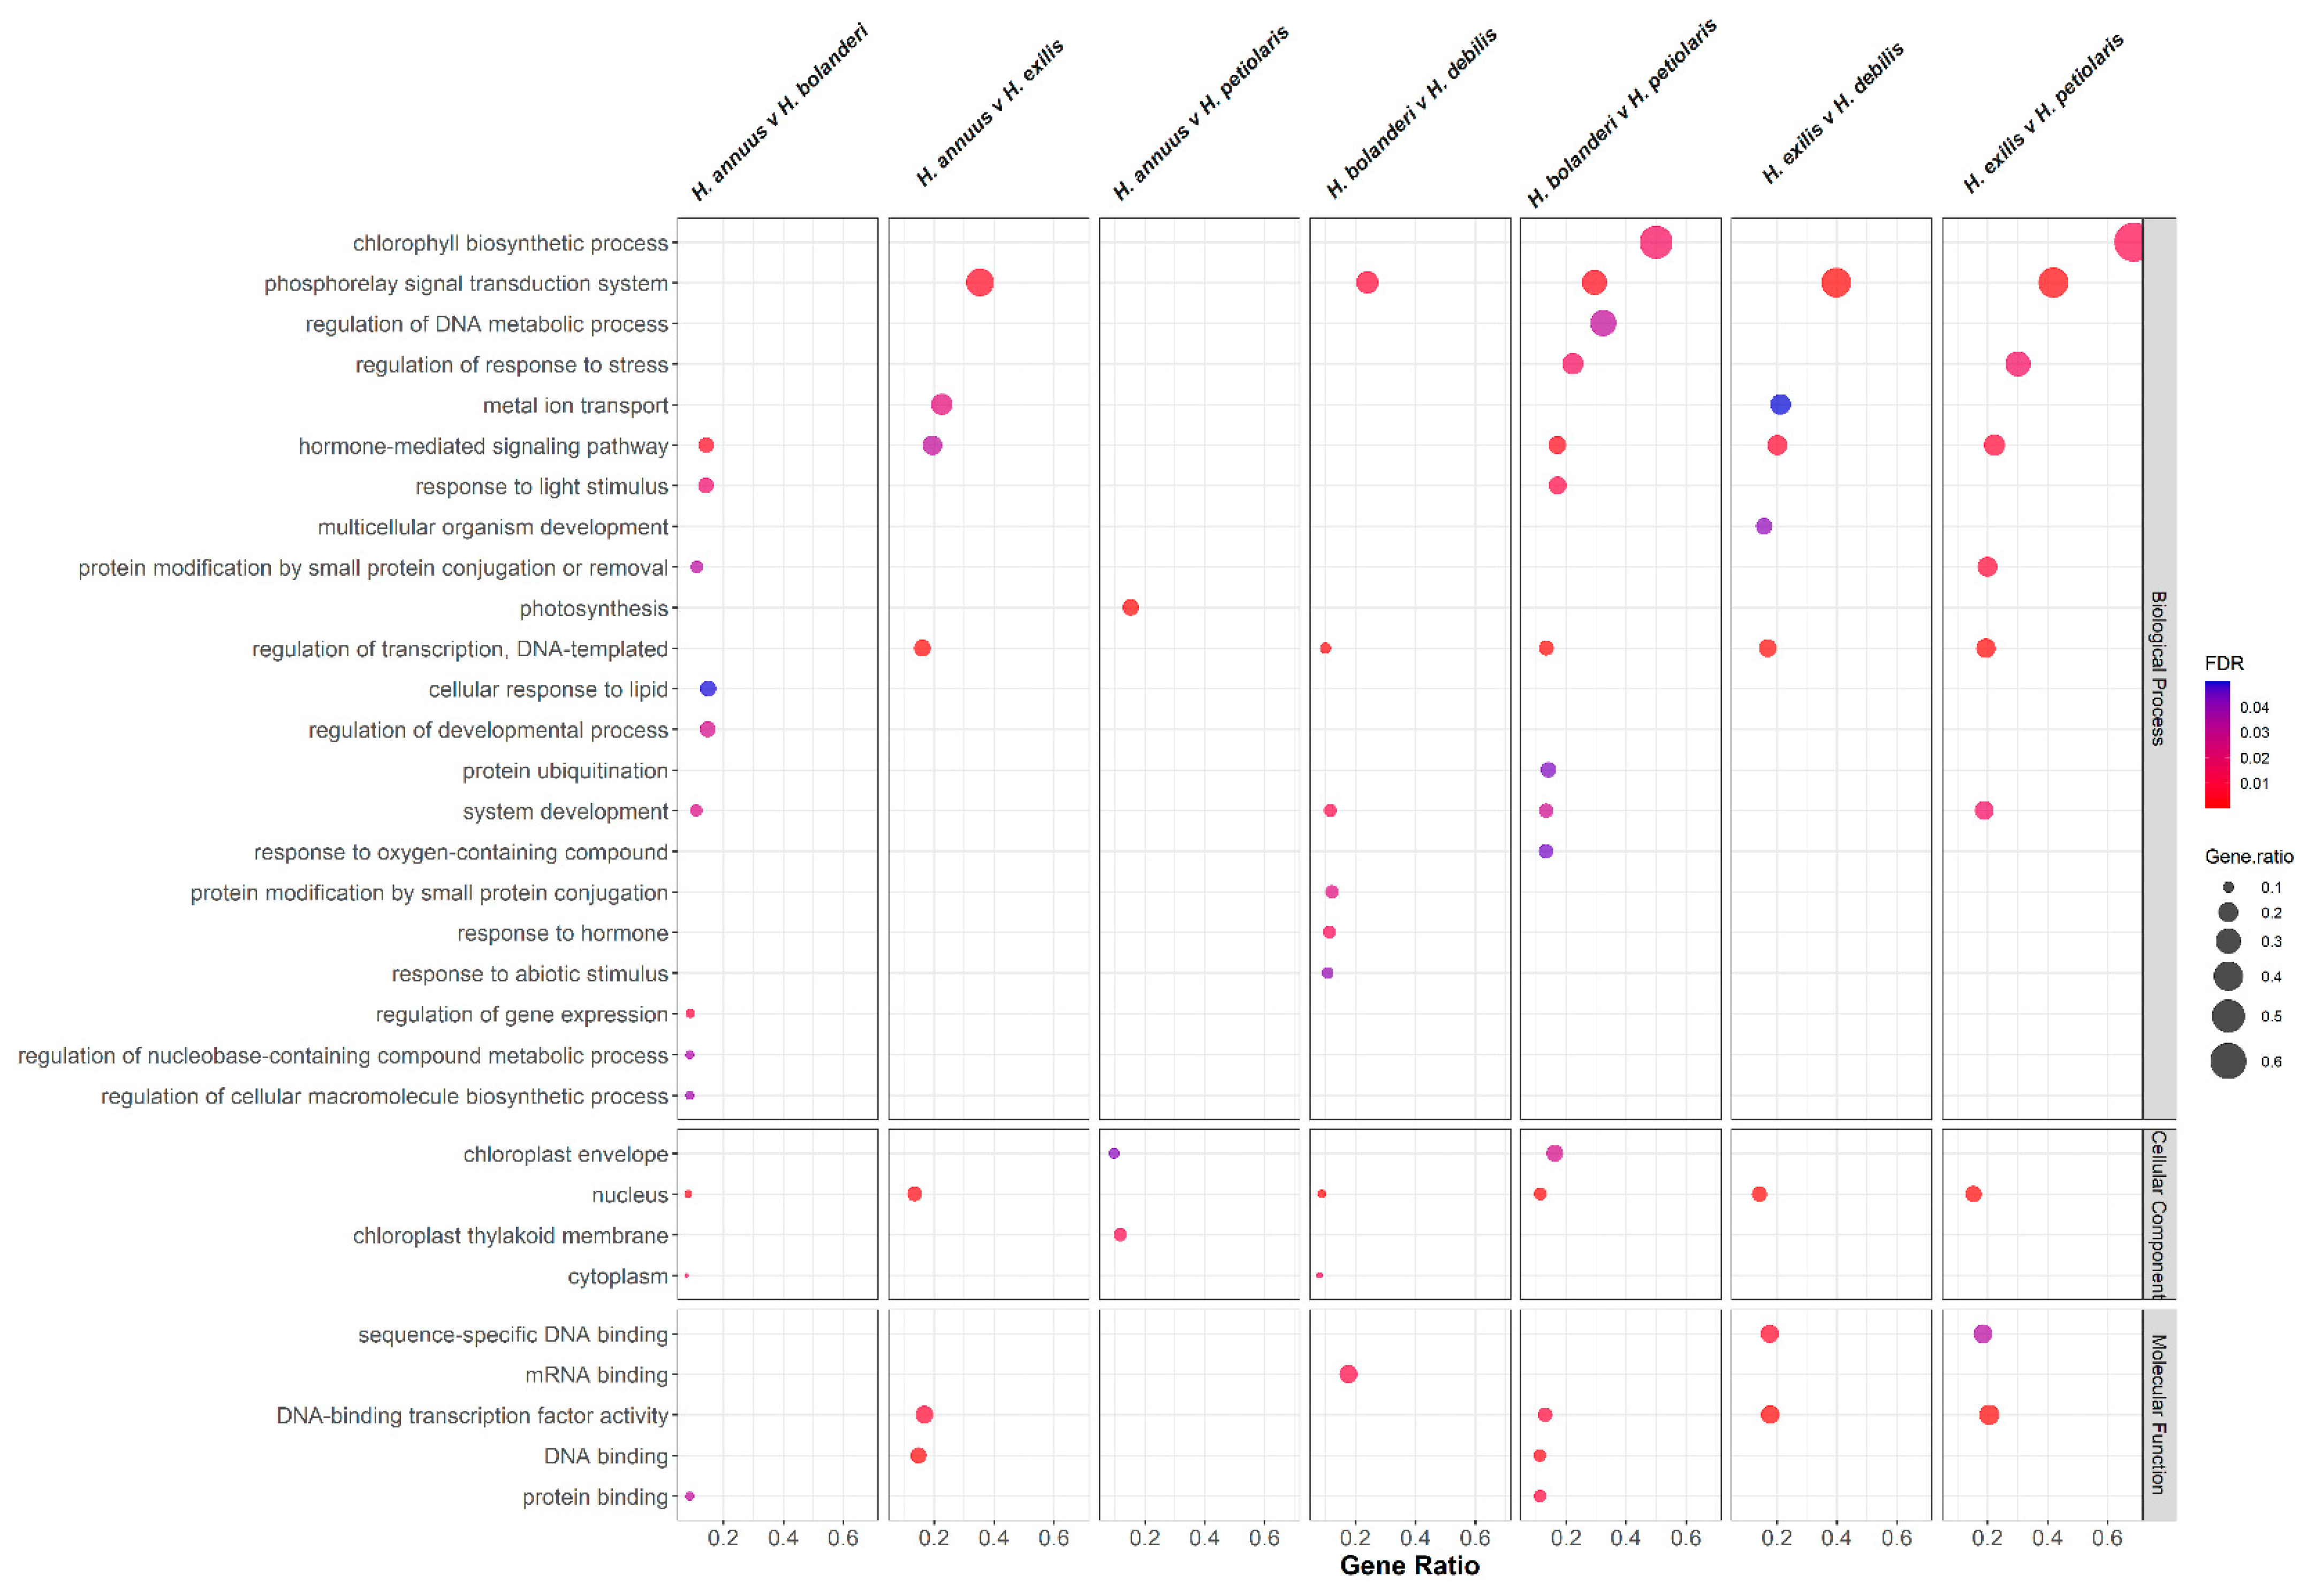
3.4. Functional Annotation and Gene Ontology Enrichment Analysis

The BLASTX search of the reference transcriptome against the annotated H. annuus genome produced best hits for 32,425 out of 51,468 transcripts (Supplementary Table S4). Using the output of SciRoKo we identified 7247 microsatellite-containing genes from the list of best hits (Supplementary Table S1).
GO enrichment analysis of microsatellite-containing DE genes compared to genes in the reference transcriptome identified enriched GO terms in seven out of the 10 pairwise species comparisons (Supplementary Table S5). The number of GO terms enriched in pairwise species comparisons ranged from 12 to 73 with most GO terms identified in the H. bolanderi v. H. petiolaris comparison (Supplementary Table S5). These enriched GO terms were further reduced to the most specific GO terms with OmicsBox (v 1.4) (Supplementary Table S6, Figure 2). The enriched GO terms represented the three GO categories, namely, biological process, molecular function, and cellular component. Some noteworthy enriched GO terms in microsatellite-containing DE genes across multiple pairwise species comparisons included “regulation of transcription, DNA-templated” (GO:0006355, in five comparisons), “DNA-binding transcription factor activity” (GO:0003700 in four comparisons), and “hormone-mediated signaling pathway” (GO:0009755 in five comparisons) (Figure 2).
When microsatellite-containing genes that were identified as DE in at least one pairwise species comparison was used as the ‘test-set’, we identified 48 enriched GO terms across all three GO categories Supplementary Table S7. These 48 GO terms were further reduced to 10 specific GO terms that included some of the GO terms associated with transcription regulation identified in pairwise species comparisons Supplementary Table S8.

3.5. Population Genetic Estimates

To infer the relative divergence of microsatellite-containing genes to those lacking microsatellites, FST values at SNPs in these two sets of genes were compared. Mean pairwise FST at microsatellite-containing genes were significantly greater than those of genes lacking microsatellites (Table 2).

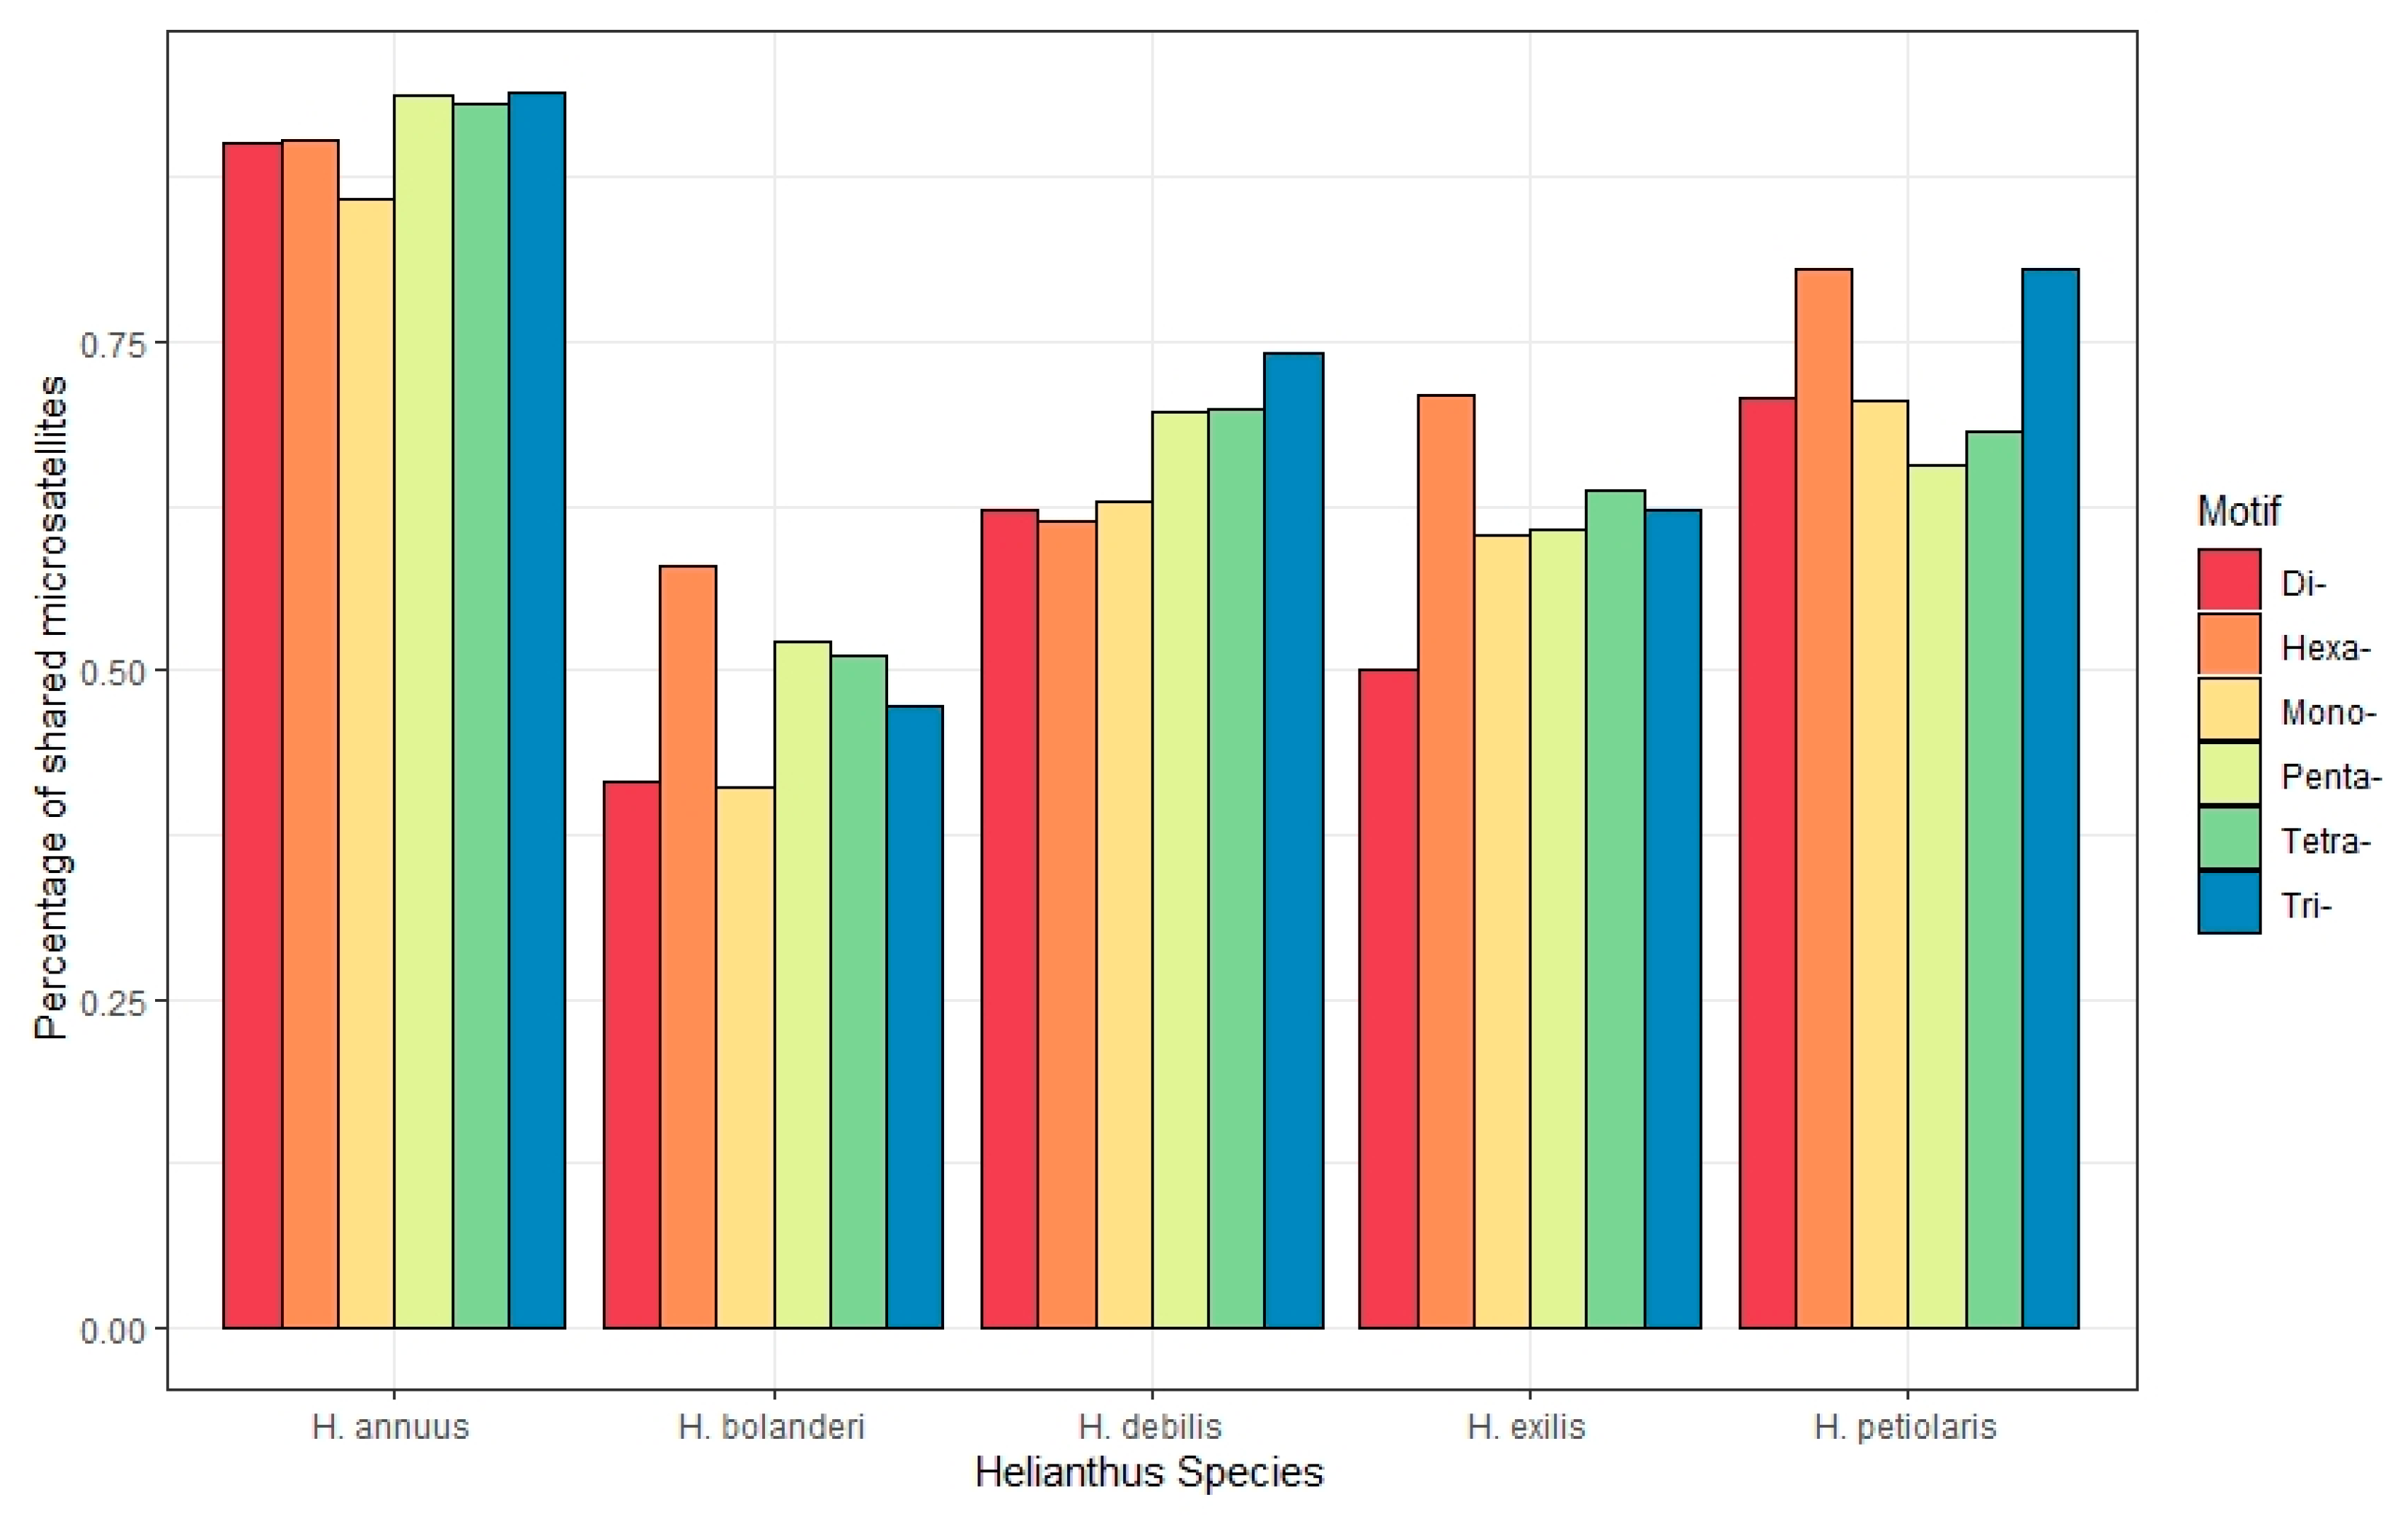
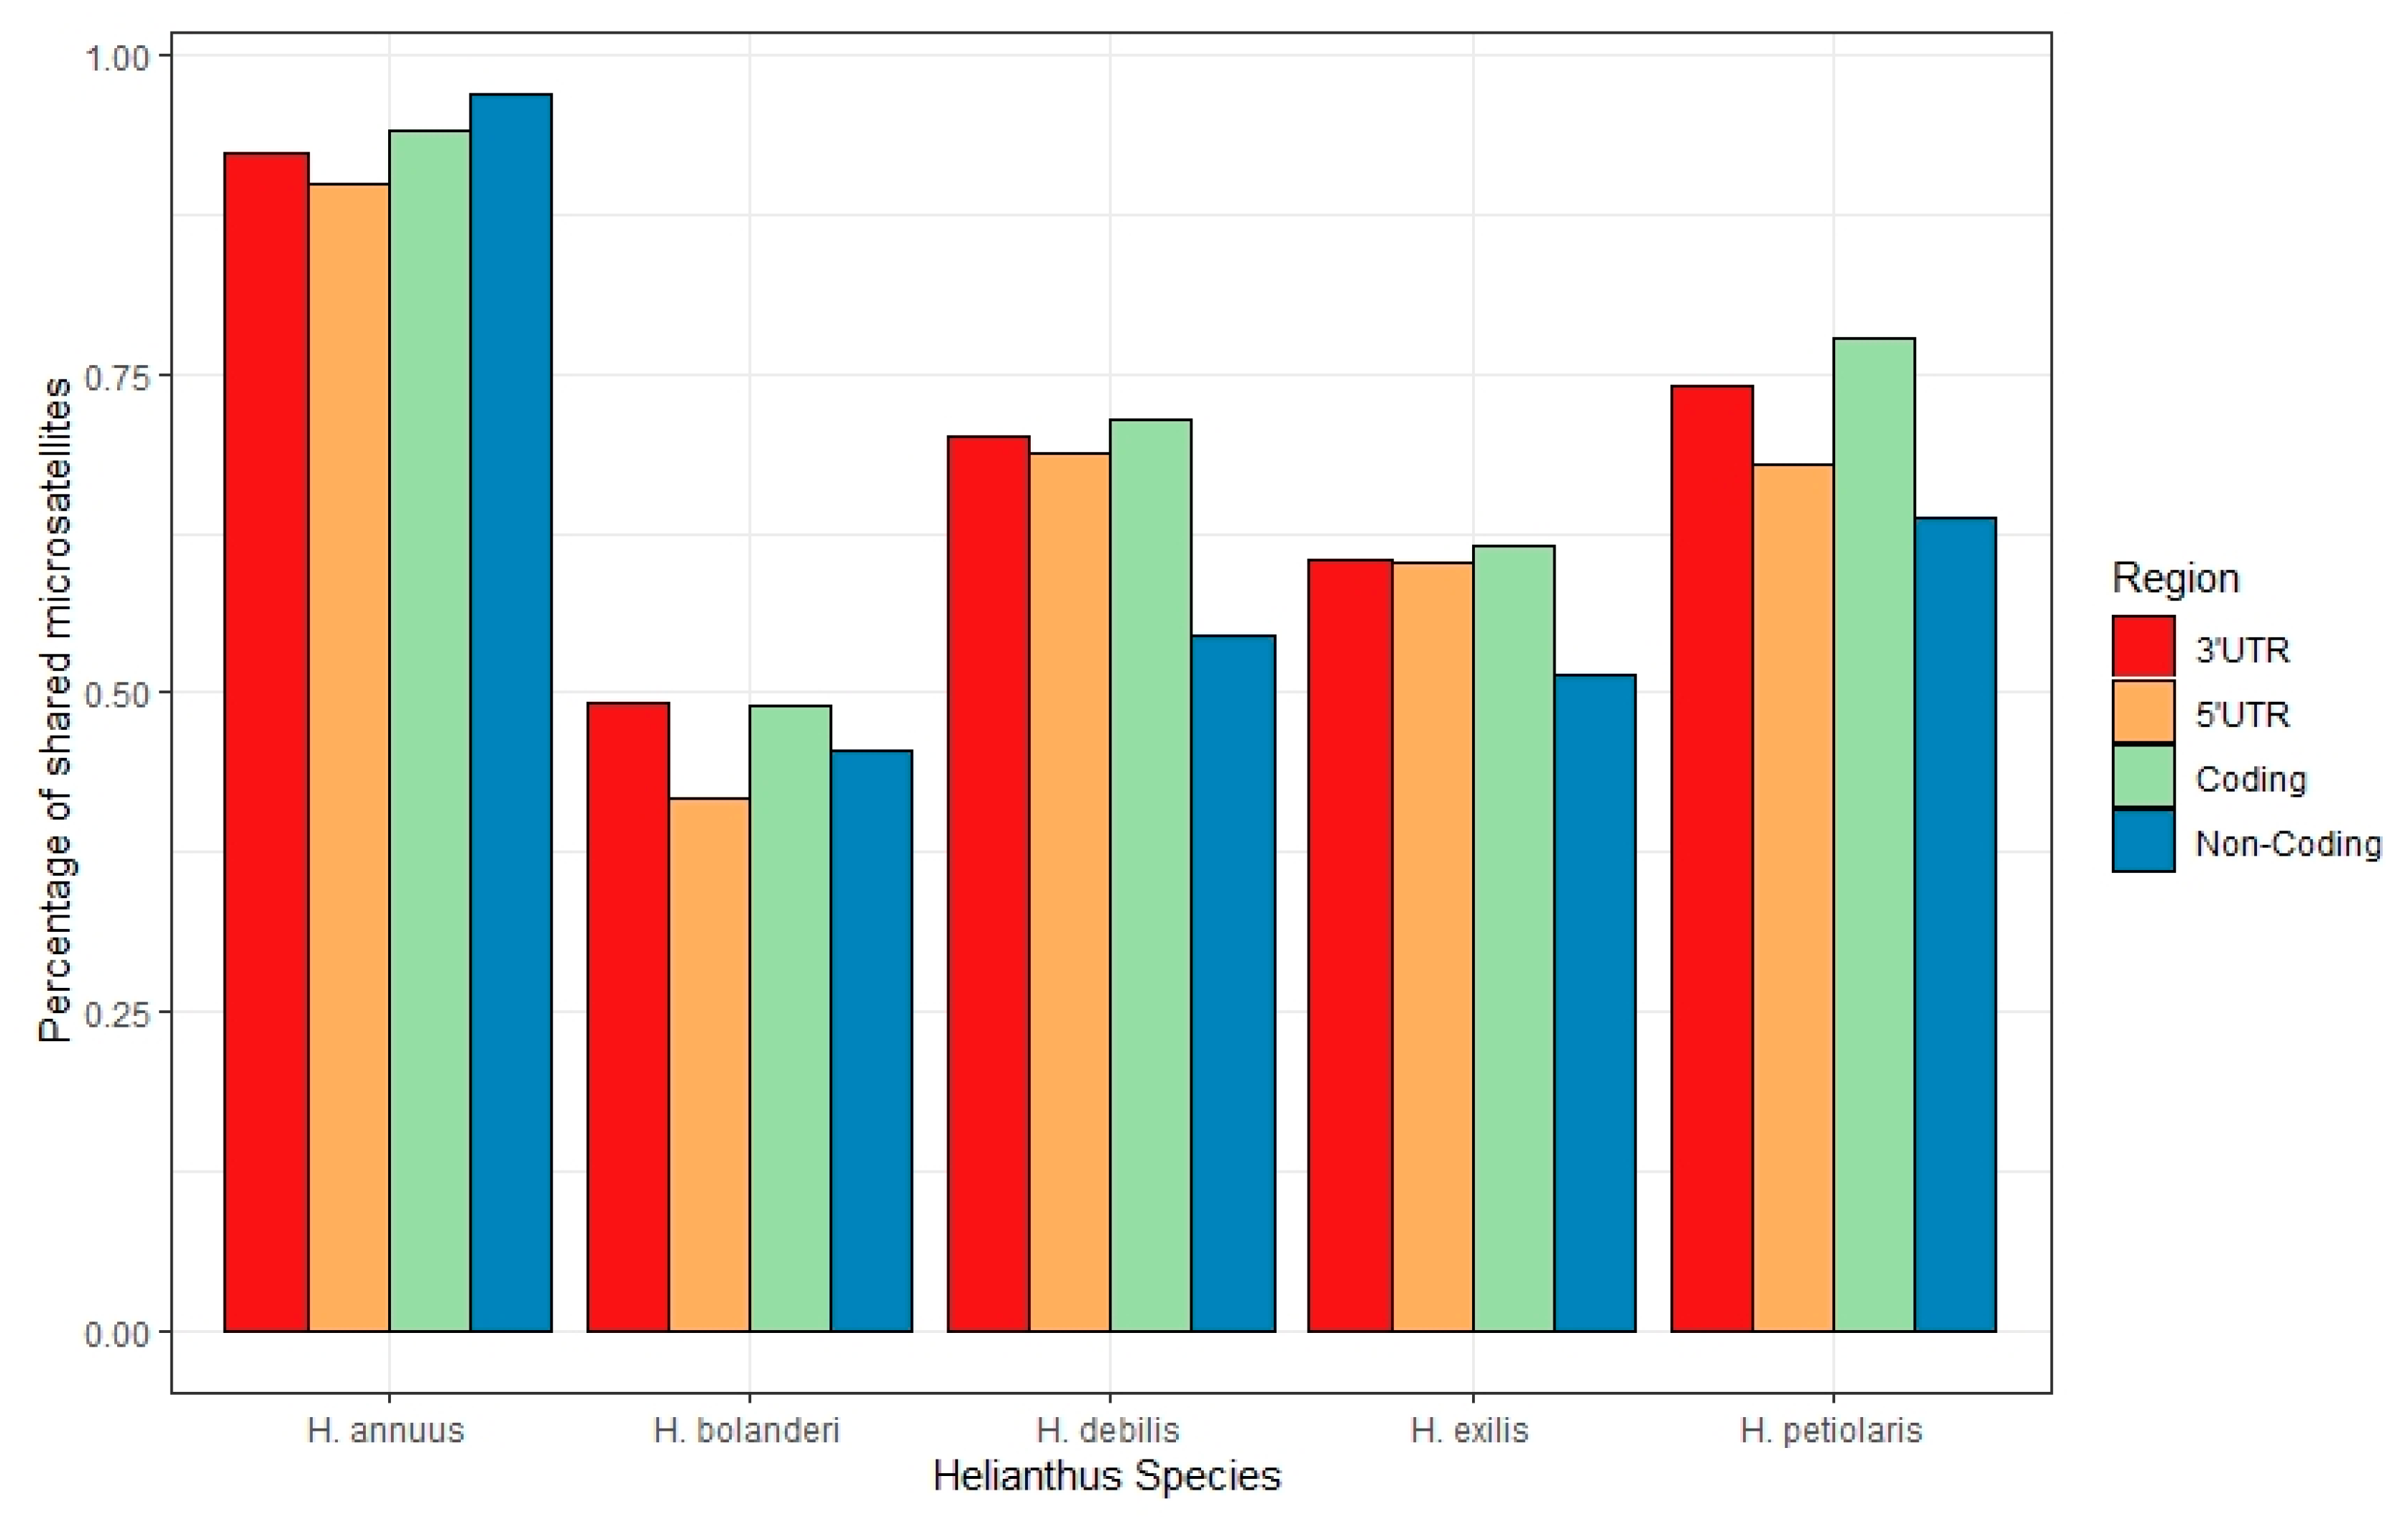
3.6. Shared Microsatellites

Across species, we found that H. bolanderi shared the largest portion of H. annuus microsatellite loci (94.2%); H. debilis, H. exilis, and H. petiolaris showed considerably lower percentages of shared microsatellites (79.1%, 72.7%, and 70.7%, respectively). Of repeat motifs, mono- and dinucleotide repeat tracts were less shared across all species (Figure 3). Trinucleotide tracts were much more likely to be shared than other repeat sizes in H. debilis (0.971; average 0.791) and H. petiolaris (0.858; average 0.707) (Figure 3). H. annuus hexanucleotides were preferentially shared with H. exilis (0.893; average 0.727) (Figure 3). The position of microsatellite tracts within a gene was also seen to influence the proportion of shared microsatellites. In all species, the percentage of shared microsatellites found in the 3′UTR and in transcripts that did not detectably code for proteins was lower than the percentage of shared microsatellites found in the 5′UTR and in the coding region (Figure 4).

4. Discussion

Microsatellites are an integral part of eukaryotic genomes and are abundant in both functional and non-functional regions. Frequently found in cis-regulatory regions of genes, microsatellites have been implicated in gene function and products linked to several traits. Here we tested the prediction that microsatellites in transcribed regions of the genome are involved in gene expression divergence among species with 50 individuals from nine closely related Helianthus species using an RNA-seq approach. Our results show that microsatellite-containing genes in general are more likely to be differentially expressed among species. Furthermore, compared to genes with microsatellites in coding regions and genes lacking microsatellites, genes that harbor microsatellites in non-coding regions are more likely to be differentially expressed among species. We found that microsatellite-containing differentially expressed genes were significantly enriched for GO terms such as “regulation of transcription, DNA-templated” (GO:0006355) and “DNA-binding transcription factor activity” (GO:0003700), among others. Population genetic analyses indicate greater levels of divergence in genes that contained microsatellites compared to those lacking microsatellites.
In most pairwise species comparisons and overall, we observe that microsatellite-containing genes are more likely to show gene expression divergence compared to those lacking microsatellites (Figure 1a), which highlights the potential contribution of microsatellites to Helianthus species adaptation through gene expression regulation. Similar patterns linking microsatellites to gene expression divergence have been reported in studies on primates. With a large panel of microsatellites from humans and other primates, Ref. [63] reported that genes harboring microsatellites in promoters, introns, UTRs, and coding regions showed greater levels of gene expression divergence among species when compared to genes lacking microsatellites. This study further revealed that genes with microsatellites in transcribed regions consistently show elevated inter-species gene expression levels across different tissue types [63]. At the intra-species level, microsatellites of short motif types, specifically A and AG repeats, have been implicated in gene expression divergence among common sunflower populations, which suggests that specific microsatellite motif types may be more likely to influence gene expression divergence [37]. In addition, a recent study on common sunflower populations across a narrow latitudinal range detected hundreds of transcribed microsatellites linked to gene expression variation among and within populations, which provides further evidence of the regulatory role of microsatellites at an even finer scale [32].
The location of microsatellites within transcripts could be crucial in determining their regulatory role. Our results indicate that a gene containing a microsatellite in non-coding regions that may include UTRs are more likely to show gene expression divergence among sunflower species. Previous reports on UTR microsatellites have linked them to gene expression variation in several species [55,64]. Some of the proposed mechanisms by which UTR microsatellites can regulate gene expression involve altering transcription start and end sites [64,65] and influencing mRNA stability [66]. Microsatellites linked to gene expression variation (eSTRs) in the human genome have been found to significantly overlap transcription factor binding sites [29]. Several experimental studies have demonstrated that gain or loss of repeat units in microsatellites can impact binding of transcription factors causing changes in transcription rates [67,68,69]. Certainly, our results from the GO enrichment analysis of microsatellite-containing differentially expressed genes appear to suggest that microsatellite-mediated gene expression regulation could be linked to transcription factor binding in Helianthus.
Population genetic analysis indicates that microsatellite-containing genes could be under stronger selective pressures than those lacking microsatellites. These patterns are significant and consistent across all pairwise species comparisons. Previously, a study on wild emmer wheat reported asymmetric or non-random distribution of microsatellite repeat numbers among microclimatic niches as evidence for selection on microsatellites [13]. Collectively, our estimates provide compelling evidence to support the potential contribution of microsatellites to species divergence in Helianthus. However, we acknowledge that our use of a single Helianthus annuus individual transcriptome as the reference could have introduced some bias when mapping and mining SNPs. Furthermore, short-read technology and RNA-seq data come with their own set of limitations and challenges. Short reads could have limited access to some longer microsatellite alleles in some species, which could have affected RepeatSeq-based estimates of shared microsatellites. RNA-seq only provides access to the transcribed regions of the genomes; therefore, microsatellites upstream of 5′UTRs that could potentially influence gene expression divergence are beyond our reach. Given these limitations, we believe that the evidence that this study provides supporting a potential causal relationship between the presence of microsatellites and gene expression divergence is consistent across multiple species comparisons and is substantial. However, the specific mechanisms by which microsatellites may influence gene expression divergence among species remain largely unknown. Therefore, in future, studies targeting specific microsatellite-containing differentially expressed genes may be necessary to further explore mechanisms underlying the potential causal relationship between microsatellites and gene expression divergence among species. Collectively, our study shows that transcribed microsatellites could potentially contribute to species divergence; therefore, we expect that integrating analysis of these highly mutable repetitive elements in gene expression studies could greatly enhance our understanding of the genomic basis of species divergence.

Supplementary Materials

The following are available online at https://0-www-mdpi-com.brum.beds.ac.uk/article/10.3390/sym13060933/s1, Table S1: List of microsatellite-containing transcripts in the reference transcriptome mapped to the Helianthus annuus reference genome, Table S2: Differentially expressed transcripts identified in the ten pairwise species comparisons, Table S3: List of microsatellite-containing transcripts differentially expressed in each pairwise Helianthus species comparison, Table S4: BLASTX results from mapping the reference transcriptome to the annotated Helianthus annuus reference genome, Table S5: Gene Ontology (GO) terms enriched within microsatellite-containing differentially expressed genes identified in pairwise Helianthus species comparisons compared to the reference transcriptome, Table S6: Gene Ontology (GO) terms enriched (reduced to most specific) within microsatellite-containing differentially expressed genes identified in pairwise Helianthus species comparisons compared to the, Table S7: Gene Ontology (GO) terms enriched within microsatellite-containing genes differentially expressed in at least one pairwise species comparison compared to the reference transcriptome, Table S8: Gene Ontology (GO) terms enriched (reduced to most specific) within microsatellite-containing genes differentially expressed in at least one pairwise species comparison compared to the reference.

Author Contributions

Conceptualization, M.E.W., L.H.R., S.R. and S.P.; data analysis, C.R., S.P., S.R. and G.L.W.; writing—review and editing, C.R., S.P., S.R., A.D.P., G.L.W., L.H.R. and M.E.W.; supervision, M.E.W., L.H.R. and A.D.P. All authors have read and agreed to the published version of the manuscript.

Funding

This research was funded by National Science Foundation grants, MCB-1158521 to M.E.W. and EPS-0903787 to A.D.P. and the Natural Sciences and Engineering Research Council of Canada grant number 327475 to L.H.R.

Institutional Review Board Statement

Not applicable.

Informed Consent Statement

Not applicable.

Data Availability Statement

Reference transcriptome used in this study has been deposited in the Dryad Digital Repository (http://datadryad.org/resource/doi:10.5061/dryad.9q1n4 (accessed on 15 March 2021). All sequence data have been deposited at the National Center for Biotechnology Information (NCBI) under project PRJNA193050.

Conflicts of Interest

The authors declare no conflict of interest.

References

  1. Wray, G.A.; Hahn, M.W.; Abouheif, E.; Balhoff, J.P.; Pizer, M.; Rockman, M.V.; Romano, L.A. The Evolution of Transcriptional Regulation in Eukaryotes. Mol. Biol. Evol. 2003, 20, 1377–1419. [Google Scholar] [CrossRef] [PubMed] [Green Version]
  2. King, M.C.; Wilson, A.C. Evolution at Two Levels in Humans and Chimpanzees. Science 1975, 188, 107–116. [Google Scholar] [CrossRef] [PubMed] [Green Version]
  3. Wittkopp, P.J.; Haerum, B.K.; Clark, A.G. Regulatory Changes Underlying Expression Differences within and between Drosophila Species. Nat. Genet. 2008, 40, 346–350. [Google Scholar] [CrossRef] [PubMed]
  4. Bedford, T.; Hartl, D.L. Optimization of Gene Expression by Natural Selection. Proc. Natl. Acad. Sci. USA 2009, 106, 1133–1138. [Google Scholar] [CrossRef] [PubMed] [Green Version]
  5. Stern, D.L.; Orgogozo, V. The Loci of Evolution: How Predictable Is Genetic Evolution? Evol. Int. J. Org. Evol. 2008, 62, 2155–2177. [Google Scholar] [CrossRef] [Green Version]
  6. Gemayel, R.; Vinces, M.D.; Legendre, M.; Verstrepen, K.J. Variable Tandem Repeats Accelerate Evolution of Coding and Regulatory Sequences. Annu. Rev. Genet. 2010, 44, 445–477. [Google Scholar] [CrossRef] [Green Version]
  7. Rockman, M.V.; Wray, G.A. Abundant Raw Material for Cis-Regulatory Evolution in Humans. Mol. Biol. Evol. 2002, 19, 1991–2004. [Google Scholar] [CrossRef] [Green Version]
  8. Bagshaw, A.T.M. Functional Mechanisms of Microsatellite DNA in Eukaryotic Genomes. Genome Biol. Evol. 2017, 9, 2428–2443. [Google Scholar] [CrossRef] [Green Version]
  9. Tautz, D.; Renz, M. Simple Sequences Are Ubiquitous Repetitive Components of Eukaryotic Genomes. Nucleic Acids Res. 1984, 12, 4127–4138. [Google Scholar] [CrossRef] [Green Version]
  10. Li, Y.C.; Korol, A.B.; Fahima, T.; Beiles, A.; Nevo, E. Microsatellites: Genomic Distribution, Putative Functions and Mutational Mechanisms: A Review. Mol. Ecol. 2002, 11, 2453–2465. [Google Scholar] [CrossRef]
  11. Ohta, T.; Kimura, M. A Model of Mutation Appropriate to Estimate the Number of Electrophoretically Detectable Alleles in a Finite Population. Genet. Res. 1973, 22, 201–204. [Google Scholar] [CrossRef] [PubMed]
  12. Kruglyak, S.; Durrett, R.T.; Schug, M.D.; Aquadro, C.F. Equilibrium Distributions of Microsatellite Repeat Length Resulting from a Balance between Slippage Events and Point Mutations. Proc. Natl. Acad. Sci. USA 1998, 95, 10774–10778. [Google Scholar] [CrossRef] [PubMed] [Green Version]
  13. Li, Y.C.; Röder, M.S.; Fahima, T.; Kirzhner, V.M.; Beiles, A.; Korol, A.B.; Nevo, E. Climatic Effects on Microsatellite Diversity in Wild Emmer Wheat (Triticum dicoccoides) at the Yehudiyya Microsite, Israel. Heredity 2002, 89, 127–132. [Google Scholar] [CrossRef] [PubMed] [Green Version]
  14. Hodel, R.G.J.; Segovia-Salcedo, M.C.; Landis, J.B.; Crowl, A.A.; Sun, M.; Liu, X.; Gitzendanner, M.A.; Douglas, N.A.; Germain-Aubrey, C.C.; Chen, S.; et al. The Report of My Death Was an Exaggeration: A Review for Researchers Using Microsatellites in the 21st Century. Appl. Plant Sci. 2016, 4, 1600025. [Google Scholar] [CrossRef]
  15. Tóth, G.; Gáspári, Z.; Jurka, J. Microsatellites in Different Eukaryotic Genomes: Surveys and Analysis. Genome Res. 2000, 10, 967–981. [Google Scholar] [CrossRef] [Green Version]
  16. Mirkin, S.M. Expandable DNA Repeats and Human Disease. Nature 2007, 447, 932–940. [Google Scholar] [CrossRef]
  17. Moxon, E.R.; Rainey, P.B.; Nowak, M.A.; Lenski, R.E. Adaptive Evolution of Highly Mutable Loci in Pathogenic Bacteria. Curr. Biol. 1994, 4, 24–33. [Google Scholar] [CrossRef]
  18. Kashi, Y.; King, D.G. Simple Sequence Repeats as Advantageous Mutators in Evolution. Trends Genet. 2006, 22, 253–259. [Google Scholar] [CrossRef] [PubMed] [Green Version]
  19. Undurraga, S.F.; Press, M.O.; Legendre, M.; Bujdoso, N.; Bale, J.; Wang, H.; Davis, S.J.; Verstrepen, K.J.; Queitsch, C. Background-Dependent Effects of Polyglutamine Variation in the Arabidopsis thaliana Gene ELF3. Proc. Natl. Acad. Sci. USA 2012, 109, 19363–19367. [Google Scholar] [CrossRef] [Green Version]
  20. Rival, P.; Press, M.O.; Bale, J.; Grancharova, T.; Undurraga, S.F.; Queitsch, C. The Conserved PFT1 Tandem Repeat Is Crucial for Proper Flowering in Arabidopsis thaliana. Genetics 2014, 198, 747–754. [Google Scholar] [CrossRef] [Green Version]
  21. Press, M.O.; Queitsch, C. Variability in a Short Tandem Repeat Mediates Complex Epistatic Interactions in Arabidopsis thaliana. Genetics 2017, 205, 455–464. [Google Scholar] [CrossRef] [PubMed]
  22. Namdar-Aligoodarzi, P.; Mohammadparast, S.; Zaker-Kandjani, B.; Kakroodi, S.T.; Vesiehsari, M.J.; Ohadi, M. Exceptionally Long 5′ UTR Short Tandem Repeats Specifically Linked to Primates. Gene 2015, 569, 88–94. [Google Scholar] [CrossRef] [PubMed]
  23. Ohadi, M.; Valipour, E.; Ghadimi-Haddadan, S.; Namdar-Aligoodarzi, P.; Bagheri, A.; Kowsari, A.; Rezazadeh, M.; Darvish, H.; Kazeminasab, S. Core Promoter Short Tandem Repeats as Evolutionary Switch Codes for Primate Speciation. Am. J. Primatol. 2015, 77, 34–43. [Google Scholar] [CrossRef]
  24. Fondon, J.W.; Garner, H.R. Molecular Origins of Rapid and Continuous Morphological Evolution. Proc. Natl. Acad. Sci. USA 2004, 101, 18058–18063. [Google Scholar] [CrossRef] [PubMed] [Green Version]
  25. Michael, T.P.; Park, S.; Kim, T.S.; Booth, J.; Byer, A.; Sun, Q.; Chory, J.; Lee, K. Simple Sequence Repeats Provide a Substrate for Phenotypic Variation in the Neurospora crassa Circadian Clock. PLoS ONE 2007, 2, e795. [Google Scholar] [CrossRef] [Green Version]
  26. Wang, J.; Qin, W.; Liu, F.; Liu, B.; Zhou, Y.; Jiang, T.; Yu, C. Sex-specific Mediation Effect of the Right Fusiform Face Area Volume on the Association between Variants in Repeat Length of AVPR 1 A RS 3 and Altruistic Behavior in Healthy Adults. Hum. Brain Mapp. 2016, 37, 2700–2709. [Google Scholar] [CrossRef]
  27. Xu, G.; Goodridge, A.G. Act Repeat in the Promoter of the Chicken Malic Enzyme Gene is Essential for Function at an Alternative Transcription Start Site. Arch. Biochem. Biophys. 1998, 358, 83–91. [Google Scholar] [CrossRef]
  28. Ng, T.K.; Lam, C.Y.; Lam, D.S.; Chiang, S.W.; Tam, P.O.; Wang, D.Y.; Fan, B.J.; Yam, G.H.; Fan, D.S.; Pang, C.P. AC and AG Dinucleotide Repeats in the PAX6 P1 Promoter are Associated with High Myopia. Mol. Vis. 2009, 15, 2239–2248. [Google Scholar]
  29. Quilez, J.; Guilmatre, A.; Garg, P.; Highnam, G.; Gymrek, M.; Erlich, Y.; Joshi, R.S.; Mittelman, D.; Sharp, A.J. Polymorphic Tandem Repeats within Gene Promoters Act as Modifiers of Gene Expression and DNA Methylation in Humans. Nucleic Acids Res. 2016, 44, 3750–3762. [Google Scholar] [CrossRef] [Green Version]
  30. Gymrek, M.; Willems, T.; Guilmatre, A.; Zeng, H.; Markus, B.; Georgiev, S.; Daly, M.J.; Price, A.L.; Pritchard, J.K.; Sharp, A.J.; et al. Abundant Contribution of Short Tandem Repeats to Gene Expression Variation in Humans. Nat. Genet. 2015, 48, 22–29. [Google Scholar] [CrossRef] [Green Version]
  31. Fotsing, S.F.; Margoliash, J.; Wang, C.; Saini, S.; Yanicky, R.; Shleizer-Burko, S.; Goren, A.; Gymrek, M. The Impact of Short Tandem Repeat Variation on Gene Expression. Nat. Genet. 2019, 51, 1652–1659. [Google Scholar] [CrossRef] [PubMed]
  32. Ranathunge, C.; Wheeler, G.L.; Chimahusky, M.E.; Perkins, A.D.; Pramod, S.; Welch, M.E. Transcribed Microsatellite Allele Lengths Are Often Correlated with Gene Expression in Natural Sunflower Populations. Mol. Ecol. 2020, 29, 1704–1716. [Google Scholar] [CrossRef] [PubMed]
  33. Stephens, J.D.; Rogers, W.L.; Mason, C.M.; Donovan, L.A.; Malmberg, R.L. Species Tree Estimation of Diploid Helianthus (Asteraceae) Using Target Enrichment. Am. J. Bot. 2015, 102, 910–920. [Google Scholar] [CrossRef] [PubMed] [Green Version]
  34. Andrew, R.L.; Rieseberg, L.H. Divergence Is Focused on Few Genomic Regions Early in Speciation: Incipient Speciation of Sunflower Ecotypes. Evolution 2013, 67, 2468–2482. [Google Scholar] [CrossRef] [PubMed]
  35. Huang, K.; Andrew, R.L.; Owens, G.L.; Ostevik, K.L.; Rieseberg, L.H. Multiple Chromosomal Inversions Contribute to Adaptive Divergence of a Dune Sunflower Ecotype. Mol. Ecol. 2020, 29, 2535–2549. [Google Scholar] [CrossRef]
  36. Todesco, M.; Owens, G.L.; Bercovich, N.; Légaré, J.-S.; Soudi, S.; Burge, D.O.; Huang, K.; Ostevik, K.L.; Drummond, E.B.M.; Imerovski, I. Massive Haplotypes Underlie Ecotypic Differentiation in Sunflowers. Nature 2020, 584, 602–607. [Google Scholar] [CrossRef]
  37. Ranathunge, C.; Wheeler, G.L.; Chimahusky, M.E.; Kennedy, M.M.; Morrison, J.I.; Baldwin, B.S.; Perkins, A.D.; Welch, M.E. Transcriptome Profiles of Sunflower Reveal the Potential Role of Microsatellites in Gene Expression Divergence. Mol. Ecol. 2018, 27, 1188–1199. [Google Scholar] [CrossRef]
  38. Renaut, S.; Owens, G.L.; Rieseberg, L.H. Shared Selective Pressure and Local Genomic Landscape Lead to Repeatable Patterns of Genomic Divergence in Sunflowers. Mol. Ecol. 2014, 23, 311–324. [Google Scholar] [CrossRef]
  39. Renaut, S.; Grassa, C.J.; Moyers, B.T.; Kane, N.C.; Rieseberg, L.H. The Population Genomics of Sunflowers and Genomic Determinants of Protein Evolution Revealed by RNAseq. Biology 2012, 1, 575–596. [Google Scholar] [CrossRef] [Green Version]
  40. Grabherr, M.G.; Haas, B.J.; Yassour, M.; Levin, J.Z.; Thompson, D.A.; Amit, I.; Adiconis, X.; Fan, L.; Raychowdhury, R.; Zeng, Q.; et al. Full-Length Transcriptome Assembly from RNA-Seq Data without a Reference Genome. Nat. Biotechnol. 2011, 29, 644–652. [Google Scholar] [CrossRef] [Green Version]
  41. Renaut, S.; Grassa, C.J.; Yeaman, S.; Moyers, B.T.; Lai, Z.; Kane, N.C.; Bowers, J.E.; Burke, J.M.; Rieseberg, L.H. Genomic Islands of Divergence Are Not Affected by Geography of Speciation in Sunflowers. Nat. Commun. 2013, 4, 1–8. [Google Scholar] [CrossRef] [PubMed] [Green Version]
  42. Li, H.; Durbin, R. Fast and Accurate Short Read Alignment with Burrows–Wheeler Transform. Bioinformatics 2009, 25, 1754–1760. [Google Scholar] [CrossRef] [PubMed] [Green Version]
  43. Li, H.; Handsaker, B.; Wysoker, A.; Fennell, T.; Ruan, J.; Homer, N.; Marth, G.; Abecasis, G.; Durbin, R. The Sequence Alignment/Map Format and SAMtools. Bioinformatics 2009, 25, 2078–2079. [Google Scholar] [CrossRef] [PubMed] [Green Version]
  44. Altschul, S.F.; Madden, T.L.; Schäffer, A.A.; Zhang, J.; Zhang, Z.; Miller, W.; Lipman, D.J. Gapped BLAST and PSI-BLAST: A New Generation of Protein Database Search Programs. Nucleic Acids Res. 1997, 25, 3389–3402. [Google Scholar] [CrossRef] [PubMed] [Green Version]
  45. Kofler, R.; Schlötterer, C.; Lelley, T. SciRoKo: A New Tool for Whole Genome Microsatellite Search and Investigation. Bioinformatics 2007, 23, 1683–1685. [Google Scholar] [CrossRef] [Green Version]
  46. Highnam, G.; Franck, C.; Martin, A.; Stephens, C.; Puthige, A.; Mittelman, D. Accurate Human Microsatellite Genotypes from High-Throughput Resequencing Data Using Informed Error Profiles. Nucleic Acids Res. 2013, 41, e32. [Google Scholar] [CrossRef] [Green Version]
  47. Benson, G. Tandem Repeats Finder: A Program to Analyze DNA Sequences. Nucleic Acids Res. 1999, 27, 573–580. [Google Scholar] [CrossRef] [Green Version]
  48. Robinson, M.D.; McCarthy, D.J.; Smyth, G.K. EdgeR: A Bioconductor Package for Differential Expression Analysis of Digital Gene Expression Data. Bioinformatics 2010, 26, 139–140. [Google Scholar] [CrossRef] [PubMed] [Green Version]
  49. Badouin, H.; Gouzy, J.; Grassa, C.J.; Murat, F.; Staton, S.E.; Cottret, L.; Lelandais-Brière, C.; Owens, G.L.; Carrère, S.; Mayjonade, B. The Sunflower Genome Provides Insights into Oil Metabolism, Flowering and Asterid Evolution. Nature 2017, 546, 148–152. [Google Scholar] [CrossRef]
  50. Wren, J.D.; Forgacs, E.; Fondon, J.W.; Pertsemlidis, A.; Cheng, S.Y.; Gallardo, T.; Williams, R.S.; Shohet, R.V.; Minna, J.D.; Garner, H.R. Repeat Polymorphisms within Gene Regions: Phenotypic and Evolutionary Implications. Am. J. Hum. Genet. 2000, 67, 345–356. [Google Scholar] [CrossRef] [Green Version]
  51. Morgante, M.; Hanafey, M.; Powell, W. Microsatellites Are Preferentially Associated with Nonrepetitive DNA in Plant Genomes. Nat. Genet. 2002, 30, 194–200. [Google Scholar] [CrossRef] [PubMed]
  52. Qu, J.; Liu, J. A Genome-Wide Analysis of Simple Sequence Repeats in Maize and the Development of Polymorphism Markers from next-Generation Sequence Data. BMC Res. Notes 2013, 6, 403. [Google Scholar] [CrossRef] [PubMed] [Green Version]
  53. Tassone, F.; Beilina, A.; Carosi, C.; Albertosi, S.; Bagni, C.; Li, L.; Glover, K.; Bentley, D.; Hagerman, P.J. Elevated FMR1 MRNA in Premutation Carriers Is Due to Increased Transcription. RNA 2007, 13, 555–562. [Google Scholar] [CrossRef] [Green Version]
  54. Joshi-Saha, A.; Reddy, K.S. Repeat Length Variation in the 5ʹUTR of Myo-Inositol Monophosphatase Gene Is Related to Phytic Acid Content and Contributes to Drought Tolerance in Chickpea (Cicer arietinum L.). J. Exp. Bot. 2015, 66, 5683–5690. [Google Scholar] [CrossRef] [Green Version]
  55. Chen, T.; Kuo, P.; Hsu, C.; Tsai, S.; Chen, M.; Lin, C.; Sun, H.S. Microsatellite in the 3′ Untranslated Region of Human Fibroblast Growth Factor 9 (FGF9) Gene Exhibits Pleiotropic Effect on Modulating FGF9 Protein Expression. Hum. Mutat. 2007, 28, 98. [Google Scholar] [CrossRef] [PubMed]
  56. Lischer, H.E.L.; Excoffier, L. PGDSpider: An Automated Data Conversion Tool for Connecting Population Genetics and Genomics Programs. Bioinformatics 2012, 28, 298–299. [Google Scholar] [CrossRef] [PubMed] [Green Version]
  57. Weir, B.S.; Cockerham, C.C. Estimating F-Statistics for the Analysis of Population Structure. Evolution 1984, 38, 1358–1370. [Google Scholar]
  58. R Core Team. A Language and Environment for Statistical Computing; R Core Team: Vienna, Austria, 2012. [Google Scholar]
  59. Goudet, J. Hierfstat, a Package for R to Compute and Test Hierarchical F-statistics. Mol. Ecol. Notes 2005, 5, 184–186. [Google Scholar] [CrossRef] [Green Version]
  60. Jarne, P.; Lagoda, P.J.L. Microsatellites, from Molecules to Populations and Back. Trends Ecol. Evol. 1996, 11, 424–429. [Google Scholar] [CrossRef]
  61. Iseli, C.; Jongeneel, C.V.; Bucher, P. ESTScan: A Program for Detecting, Evaluating, and Reconstructing Potential Coding Regions in EST Sequences. Proc. ISMB 1999, 99, 138–148. [Google Scholar]
  62. Lottaz, C.; Iseli, C.; Jongeneel, C.V.; Bucher, P. Modeling Sequencing Errors by Combining Hidden Markov Models. Bioinformatics 2003, 19, ii103–ii112. [Google Scholar] [CrossRef] [Green Version]
  63. Sonay, T.B.; Carvalho, T.; Robinson, M.D.; Greminger, M.P.; Krützen, M.; Comas, D.; Highnam, G.; Mittelman, D.; Sharp, A.; Marques-Bonet, T.; et al. Tandem Repeat Variation in Human and Great Ape Populations and Its Impact on Gene Expression Divergence. Genome Res. 2015, 25, 1591–1599. [Google Scholar] [CrossRef] [Green Version]
  64. Kumar, S.; Bhatia, S. A Polymorphic (GA/CT) n-SSR Influences Promoter Activity of Tryptophan Decarboxylase Gene in Catharanthus roseus L. Don. Sci. Rep. 2016, 6, 33280. [Google Scholar] [CrossRef] [Green Version]
  65. Kramer, M.; Sponholz, C.; Slaba, M.; Wissuwa, B.; Claus, R.A.; Menzel, U.; Huse, K.; Platzer, M.; Bauer, M. Alternative 5′untranslated Regions Are Involved in Expression Regulation of Human Heme Oxygenase-1. PLoS ONE 2013, 8, e77224. [Google Scholar] [CrossRef] [PubMed]
  66. Mignone, F.; Gissi, C.; Liuni, S.; Pesole, G. Untranslated Regions of MRNAs. Genome Biol. 2002, 3, 0004.1–0004.10. [Google Scholar] [CrossRef]
  67. Searle, S.; Blackwell, J.M. Evidence for a Functional Repeat Polymorphism in the Promoter of the Human NRAMP1 Gene that Correlates with Autoimmune versus Infectious Disease Susceptibility. J. Med. Genet. 1999, 36, 295–299. [Google Scholar] [PubMed]
  68. Bayele, H.K.; Peyssonnaux, C.; Giatromanolaki, A.; Arrais-Silva, W.W.; Mohamed, H.S.; Collins, H.; Giorgio, S.; Koukourakis, M.; Johnson, R.S.; Blackwell, J.M. HIF-1 Regulates Heritable Variation and Allele Expression Phenotypes of the Macrophage Immune Response Gene SLC11A1 from a Z-DNA–Forming Microsatellite. Blood 2007, 110, 3039–3048. [Google Scholar] [CrossRef] [Green Version]
  69. Taka, S.; Gazouli, M.; Politis, P.K.; Pappa, K.I.; Anagnou, N.P. Transcription Factor ATF-3 Regulates Allele Variation Phenotypes of the Human SLC11A1 Gene. Mol. Biol. Rep. 2013, 40, 2263–2271. [Google Scholar] [CrossRef]
Figure 1. (a) Distribution of microsatellite-containing differentially expressed genes in pairwise Helianthus spp. comparisons. Chi-squared tests were performed to test whether microsatellite-containing genes were more likely to be differentially expressed between species pairs (* p-value < 0.0001, ** p-value < 0.00001). (b) Distribution of microsatellites in different transcript regions within differentially expressed genes in pairwise Helianthus spp. comparisons. Chi-squared tests were performed to test whether genes with microsatellites in non-coding regions were more likely to be differentially expressed compared to genes with microsatellites in coding regions and genes lacking microsatellites (* p-value < 0.01, ** p-value < 0.00001).
Symmetry 13 00933 g001aSymmetry 13 00933 g001b
Figure 2. Gene Ontology (GO) terms enriched within microsatellite-containing differentially expressed genes in each pairwise Helianthus spp. comparison. The identified GO terms represent the three GO categories, biological process, molecular function, and cellular component. False Discovery Rate (FDR) associated with each comparison is represented by the color of dots for each GO term, and the size of each dot represents Gene Ratio (number of genes associated with the GO term in the test set/number of genes associated with the GO term in the reference transcriptome).
Symmetry 13 00933 g002
Figure 3. Estimated shared proportion of microsatellite loci of different motif sizes across five Helianthus species. Values shown are averages for all individuals of a species, relative to overall shared proportion in H. annuus.
Symmetry 13 00933 g003
Figure 4. Estimated shared proportion of microsatellite loci in different transcript regions across five Helianthus species. “Non-coding” indicates microsatellites found in transcripts which were not predicted to encode protein sequence. Values shown are averages for all individuals of a species, relative to overall shared proportion in H. annuus.
Symmetry 13 00933 g004
Table 1. Distribution of microsatellites in differentially expressed genes between different Helianthus spp. pairs.
Pairwise Species ComparisonNumber of Differentially Expressed (DE) GenesMicrosatellites in DE Genes
In Non-Coding RegionsIn Coding Regions
H. annuus v. H. bolanderi75391490669
H. annuus v. H. debilis4337927
H. annuus v. H. exilis13,78924161120
H. annuus v. H. petiolaris5490910401
H. bolanderi v. H. debilis76711526701
H. bolanderi v. H. exilis4707637
H. bolanderi v. H. petiolaris95931865865
H. exilis v. H. debilis12,56723501132
H. exilis v. H. petiolaris14,57626531233
H. petiolaris v. H. debilis1492266122
Table 2. Pairwise species differences as measured by FST at SNPs in microsatellite-containing and microsatellite lacking genes are shown in this table.
Pairwise ComparisonMean FST for Genes Lacking MicrosatellitesMean FST for Microsatellite-Containing GenesWilcoxon Rank Sum Test p-Value
H. annuus v. H. argophyllus0.4130.4492.95 × 10−10
H. annuus v. H. debilis0.3850.4268.04 × 10−13
H. annuus v. H. petiolaris0.3260.3572.17 × 10−10
H. debilis v. H. argophyllus0.5450.5864.16 × 10−10
H. petiolaris v. H. argophyllus0.5060.5384.50 × 10−9
H. petiolaris v. H. debilis0.2810.3092.82 × 10−12
Publisher’s Note: MDPI stays neutral with regard to jurisdictional claims in published maps and institutional affiliations.

