
Thermal Noise Decoupling of Micro-Newton Thrust Measured in a Torsion Balance
by
 ,
,
Linxiao Cong
1,2 ,
,
Jianchao Mu
1,2,
Qian Liu
3,
Hao Wang
2,
Linlin Wang
3,
Yonggui Li
2 and
Congfeng Qiao
1,2,* 1
School of Physical Sciences, University of Chinese Academy of Sciences, Beijing 100049, China
2
Key Laboratory of Vacuum Physics, University of Chinese Academy of Sciences, Beijing 100049, China
3
National Space Science Center, The Chinese Academy of Sciences, Beijing 100190, China
*
Author to whom correspondence should be addressed.
Symmetry 2021, 13(8), 1357; https://0-doi-org.brum.beds.ac.uk/10.3390/sym13081357
Submission received: 30 May 2021
/
Revised: 1 July 2021
/
Accepted: 6 July 2021
/
Published: 27 July 2021
(This article belongs to the Special Issue Symmetry in Dynamic Systems)
Abstract
:The space gravitational wave detection and drag free control requires the micro-thruster to have ultra-low thrust noise within 0.1 mHz–0.1 Hz, which brings a great challenge to calibration on the ground because it is impossible to shield any spurious couplings due to the asymmetry of torsion balance. Most thrusters dissipate heat during the test, making the rotation axis tilt and components undergo thermal drift, which is hysteretic and asymmetric for micro-Newton thrust measurement. With reference to LISA’s research and coming up with ideas inspired from proportional-integral-derivative (PID) control and multi-timescale (MTS), this paper proposes to expand the state space of temperature to be applied on the thrust prediction based on fine tree regression (FTR) and to subtract the thermal noise filtered by transfer function fitted with z-domain vector fitting (ZDVF). The results show that thrust variation of diurnal asymmetry in temperature is decoupled from 24 μN/Hz1/2 to 4.9 μN/Hz1/2 at 0.11 mHz. Additionally, 1 μN square wave modulation of electrostatic force is extracted from the ambiguous thermal drift background of positive temperature coefficient (PTC) heater. The PID-FTR validation is performed with experimental data in thermal noise decoupling, which can guide the design of thermal control and be extended to other physical quantities for noise decoupling.
1. Introduction
Missions for micro-Newton thruster applications have become prosperous in recent years, and one of the greatest challenges comes from searching for gravitational waves in space [1,2]. To cancel the non-gravitational effects and compensate for the non-symmetric disturbance on the spacecraft, micro thrusters used for the attitude and orbit control are required to achieve high precision of 0.1 μN resolution and wide dynamic range between 1 μN–50 μN, and low thrust amplitude spectral density (ASD) down to 0.1 μN/Hz1/2 within 0.1 mHz–1 Hz [3,4]. Accordingly, a more accurate thrust measurement system is in need to measure the variance of the micro-Newton thrusters on the ground, which is hard for the case of an ultra-low thrust-to-weight ratio (TWR) less than 10−9. Torsion balances have been widely used in exploring the behavior of gravity for their rotational symmetry across the x-y plane, which is suited for measuring torques while minimizing the impact of gravitational weight. At the University of Washington, a low-frequency torsion pendulum whose angle is measured using a Michelson interferometer was designed, which can be applied to tests of gravity and gravitational wave observation [5]. At the RMC Advanced Propulsion and Plasma Exploration Laboratory, a torsional thrust balance has been developed to measure thrust of 1–15 mN levels with high accuracy via the calibration of electrostatic force [6]. In the Institute of Mechanics, Chinese Academy of Sciences, a set of sub-micro-scale thrust measurement systems using a torsion pendulum was designed and successfully applied in the radiofrequency ion thruster test for “Taiji-1”, the first experiment satellite for space detection of gravitational waves in China [7]. The Airbus has adopted a double hanging pendulum balance to characterize the LISA dedicated micro-Newton thrusters based on the principle of differential measurement [8].
While various micro-Newton thrust measurement schemes are proposed and validated, few reports exist about thrust’s thermal noise decoupling in a torsion balance, which could be a potential problem when the electric thrusters are firing. In theory, the torsion balance has a predetermined center of mass (CM) which rotates around the z axis, whereas the torsion balance becomes asymmetric when the CM is offset to the rotation axis and brings in low frequency tilt noise arising from several major factors including thermal effect. Due to the asymmetric response of torsion’s displacement to rising and decreasing temperature, and hysteretic and nonlinear cross-coupling with multi-fields, the low-frequency thrust noise characteristics of the torsion balance cannot be completely restored by fitting the transfer function and signal subtraction after filtering. In fact, temperature variation leads to the deformation of mechanical structure and output drift of electronic components, which are key factors affecting thrust accuracy and low frequency noise [9]. The paper proposes to expand the state space of temperature to be applied on thrust prediction based on tree regression model [10], to subtract the thermal noise filtered by transfer function fitted with ZDVF, which alleviates the drift and expands the deductible bandwidth to restore the potential signal buried under the noisy background.
2. Setups and Methods
2.1. Thrust Balance Setup
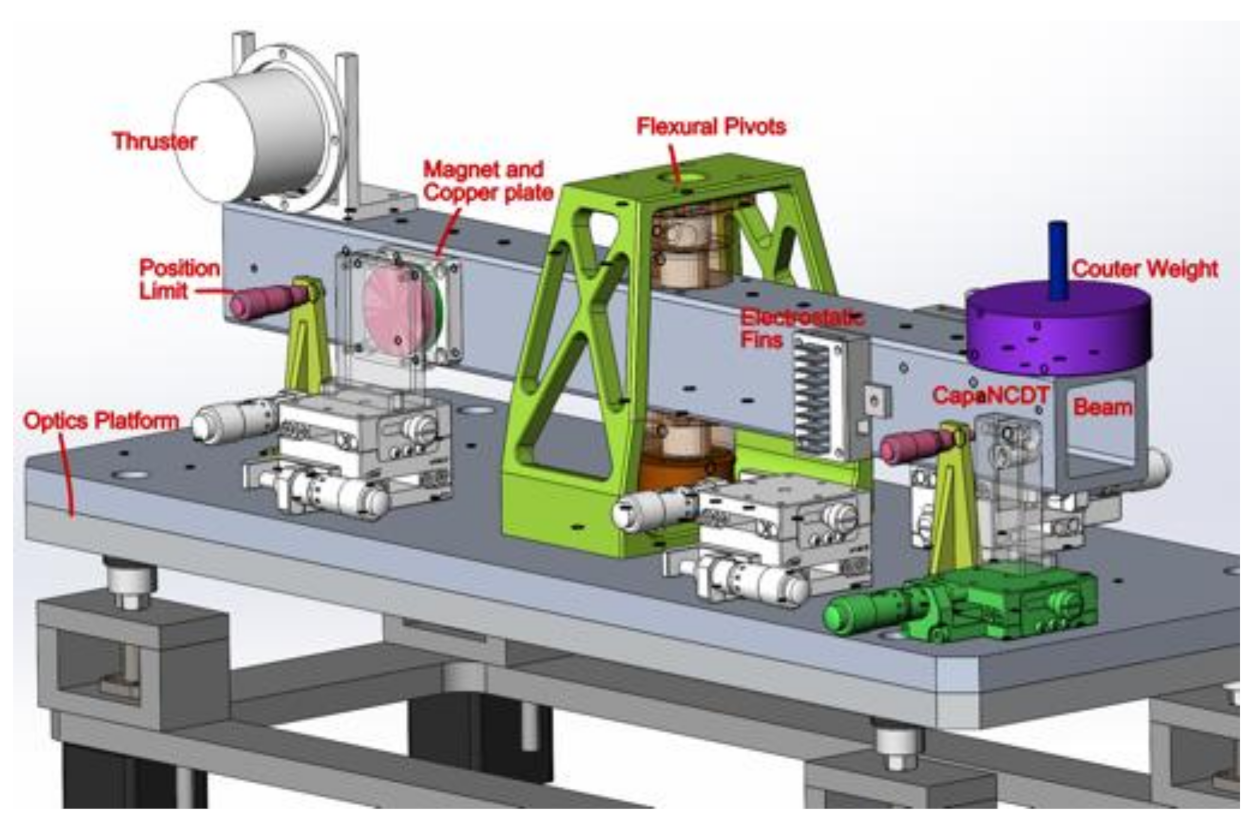
Considering the TWR of the micro-thrust to be measured, the horizontal motion of the torsion balance can effectively isolate the impact of the thruster’s gravitational weight on the measurement [11]. According to the objects of thrust balance, the balance can be divided into two modes: steady state measurement and dynamic measurement [12]. The former is to measure the displacement when the thrust is balanced with the deformation restoring force, and the latter is to calculate the closed-loop feedback force that nulls the torsion balance’s deformation. In this paper, a torsion balance based on the deformation of the flexural pivot is discussed, which is more suitable for high-precision thrust calibration and low-frequency steady state measurement. As shown in Figure 1, the deformation is observed by the capacitive displacement sensor, damped by eddy current from a copper plate and permanent magnet, and driven by the electrostatic force provided by a pair of electrostatic fins (ESF) [13,14]. During the test, the torsion balance is placed on an optical platform to isolate vibration and sealed under a windshield to isolate turbulent air flow. PT1000 sensors of 0.01 °C resolution are equipped to measure the thermal variation.
2.2. Mathematical Model
The static measuring model of torsion balance is derived from the dynamic measuring model. As a response to thrust excitation, the position of torsional balance satisfies the second-order ordinary differential equation of deformation angle :
where is the rotational inertia of torsional pendulum, is the damping coefficient of the system, is the torsional stiffness coefficient, and are the thrust to be measured and its acting moment arm length, respectively. Take as the differential operator, then the above can be resolved as:
When measuring the angular frequency , it can be obtained that the torsion balance satisfies the balance relation at rest:
where is the torsion balance displacement measured by a capacitive sensor, is the radius of arc angle corresponds to displacement, and then the final thrust is:
Base on traceable force measured by a Sartorius CPA225D scale with a resolution of 0.01 mg, the ESF is calibrated via the relationship between voltage and electrostatic force. A set of known calibration forces are repeatedly applied and withdrawn at a point from the pivot, while the deflections are measured a Micro-Epsilon capaNCDT CS-05 capacitive displacement sensor. Thus, the coefficient can be determined via the leverage between the moment arm of thruster and that of the ESF when the torsion is null balanced. In view of the above, the thrust stiffness of torsional balance is estimated to be 7.56 μN/μm at the displacement sensor. However, the actual thrust response of torsion balance is not linear for reasons, such as the hysteresis of pivot torsion, typically simulated by sophisticated models [15,16], the approximation of small angle, the non-parallel detection of capacitor, the coupling of ground vibration and noise, etc., which can cause the deviation of results. In particular, hot expansion and cold contraction of the structure caused by temperature variation will change the elastic coefficients of each component more or less, and the response curve calibrated by the electromagnetic sensor will drift, resulting in changes in the static balance position of the system as a result.
2.3. Decoupling Method
Whether signal and noise can be decoupled depends on the correlation between them and the understanding of the input and output of the system. Knowledge of the excitation changes or measurement of the response helps to control signal uncertainty. An intuitive way to evaluate the influence of unknown factors is to establish a function between independent and dependent variables based on the mechanism of action of physical factors. For example, by using ANSYS or COMSOL to study thermal influence on elastic elements with different properties, accurate and reliable mathematical models of temperature and physical characteristics of elastic elements are derived to provide theoretical guidance for compensating the thermal noise caused by temperature fluctuations. However, the above method relies on analytical calculation, which may be difficult to implement in reality due to the instability and non-linearity of some physical processes. Instead, it is universal to study the transfer function between excitation and response. Even when the numerical relationship is complex and it is difficult to establish a model, it can also analyze the data of the main interference factors and thrust in the environment, estimate the transfer function and deduct it quantitatively from the spectrum. A famous and widely used operation in LISA Pathfinder (LPF) is to subtract the effect of temperature noise from laser interferometer signals. Specifically, the procedures are as follows:
- Transfer function;
- Z-domain fit;
- Signal subtraction.
For a discrete time system, the transfer function is defined by
where and are the z-transforms of the input x[n] and output y[n], respectively. The z-transform of a sequence x[n] is defined as
where . For any pair of variables, their transfer function of time-series signals can be estimated by selecting region of interest (ROI) as analysis object. The concept of vector fitting (VF) and its algorithm was proposed to make rational approximation of frequency domain responses [17]. ZDVF is a formulation of vector-fitting method in z-domain [18], whose approximated output can be expanded in partial fractions:
where and are residues and poles, respectively. Each element of the partial fraction expansion can be seen as an IIR filter. This operation describes a recursive system that depends on current and past of the input x[n], but also on the output y[n]. The fitted filter is applied on the input to predict its output contribution, which will be subtracted from the original measured data.
However, complex heating process of the object and nonlinear temperature change reduce the degree of correlation with thrust, so it is necessary to first fit the dependent variable through regression learning in order to get better transfer characteristics. Thus, it is very important to find an optimal and reasonable regression algorithm in establishing the projection relationship between temperature and thrust.
2.4. Algorithm Optimization
The ZDVF can fit the equivalent filter of transfer function and reconstruct the thrust as response of the temperature excitation, then deduct the relevant thermal noise from the frequency domain. The hysteresis and nonlinearity of temperature cannot be well treated by using temperature directly to estimate the thrust transfer function. By using regression learning to reduce the nonlinearity in latent space, better temperature to thrust correlation can be established numerically. For example, the least square regression method based on singular value decomposition (SVD) can modify the covariance, which has been proven to be valid in the data analysis of LISA Pathfinder’s in-orbit experiments. Still, the model is limited by the uncertainty of physics boundary in the test process, including thermal response delay, temperature rebalance and hysteresis, so that the thrust’s noise cannot be effectively deducted in a usual way. Multi-sensor fusion, variables’ extension, MTS and FTR are introduced in the paper, and thermal noise is finally better fitted and subtracted. Specifically, modifications were made in the following aspects:
2.4.1. Extended State
The response of torsion balance to temperature is not real time output, and thermal modulation and response time change in different positions. In order to build an effective transfer function, the paper inherits the ideas of MTS and PID control, set different phase delays on the original temperature time series, combined with convolution, difference and other operations, so that temperature states on MTS (corresponding to frequency) can be extended. Then, based on multivariate statistical regression, the thrust fitted with PT1000 temperature was obtained, and the transfer function between the ‘thrust’ and the original thrust was built. Therefore, thermal noise can be better evaluated and deducted in the thrust.
MTS [19] is short for multiple time scales and refers in particular to hierarchy of time steps corresponding to the hierarchy of frequencies in the system. The PT1000 time series are delay by full, half, 1/4 and 1/8 cycles of full time to cover different frequency variations. In addition, multi-sensor fusion, which means a polynomial combination of temperature at different locations, can improve the accuracy of transfer function. In theory, PT1000 can be distributed in all the locations that may be affected by the heat source. In consideration of the operation feasibility and the calculated quantity, 3 feature points near the torsion balance were selected during the experiment. Traditionally, PID control means feedback of proportional, integral and derivative of the process variable, which act on the deviation between set point and process variable. The thermal effect on the system is cumulative and the displacement at present is correlated with the displacement at the previous time; the integral can effectively eliminate static error. Here, we make the window function of four delay lengths, convolve the original data to carry out integration operation and calculate the difference between original data and delay data to extract trend variables. In this way, the PT1000 temperature data of the 3 points can be extended to proportional, integral and differential, and a richer data set with time and space universality can be constructed.
2.4.2. Regression Learning
The regression-based method is a powerful technique for solving high-dimensional problems with statistical opportunities. After data preprocessing, the focus of work is to choose a well-fitting model function and to optimize the prediction model. There are a lot of regression algorithms such as least square (LS) [20], neural network (NN) [21], principal component (PCA) [21], support vector machine (SVM) [22], decision tree [23], etc., whose root difference is between supervised and unsupervised learning. Based on the criteria of residual prediction errors for fitting thrust data, the effect of training of different models can be evaluated. For comparison of fitting algorithms results with reference to what was introduced as unsupervised learning method, i.e., SVD-LS regression (SVD-LSR) in LPF’s data analysis [24], PID fine tree regression (PID-FTR) is chosen as a supervised learning method for this article from the perspective of application, though other fitting algorithms may be effective as well. In addition, the two methods represent the idea of clustering or classifying the data, which essentially copes with the symmetry of data distributions, not only about skewed left or right, but also about unimodal or multimodal.
In detail, we selected the temperature extended time series in the training datasets, and PCA dimension reduction to overcome the collinear effect. Using thrust predicted by different models and the transfer function fit by ZDVF, thermal effect in the measured thrust output is estimated and decoupled by different filtering, and the expected thrust signal can be restored. LSR is a global model based on a single predictive formula holding over the entire data-space. When the data has lots of features interacting in complicated, nonlinear ways, a single global model can be very difficult and confusing when you do succeed, while FTR uses an alternative way to nonlinear regression is to sub-divide, or partition, the space into smaller regions, where the interactions are more controlled. Tame chunks of the space can be fitted with simple models after recursive partitioning. The global model thus has two parts: the recursive partition and a simple model for each cell of the partition. FTR use the trees to represent the recursive partition. Each of the terminal nodes, or leaves, of the tree represents a cell of the partition, and has attached to it a simple model which applies in that cell only. A point x belongs to a leaf if x falls in the corresponding cell of the partition. The article will not expand FTR but try to test its use in thermal noise decoupling.
3. Results and Discussion
3.1. Diurnal Temperature Fluctuation
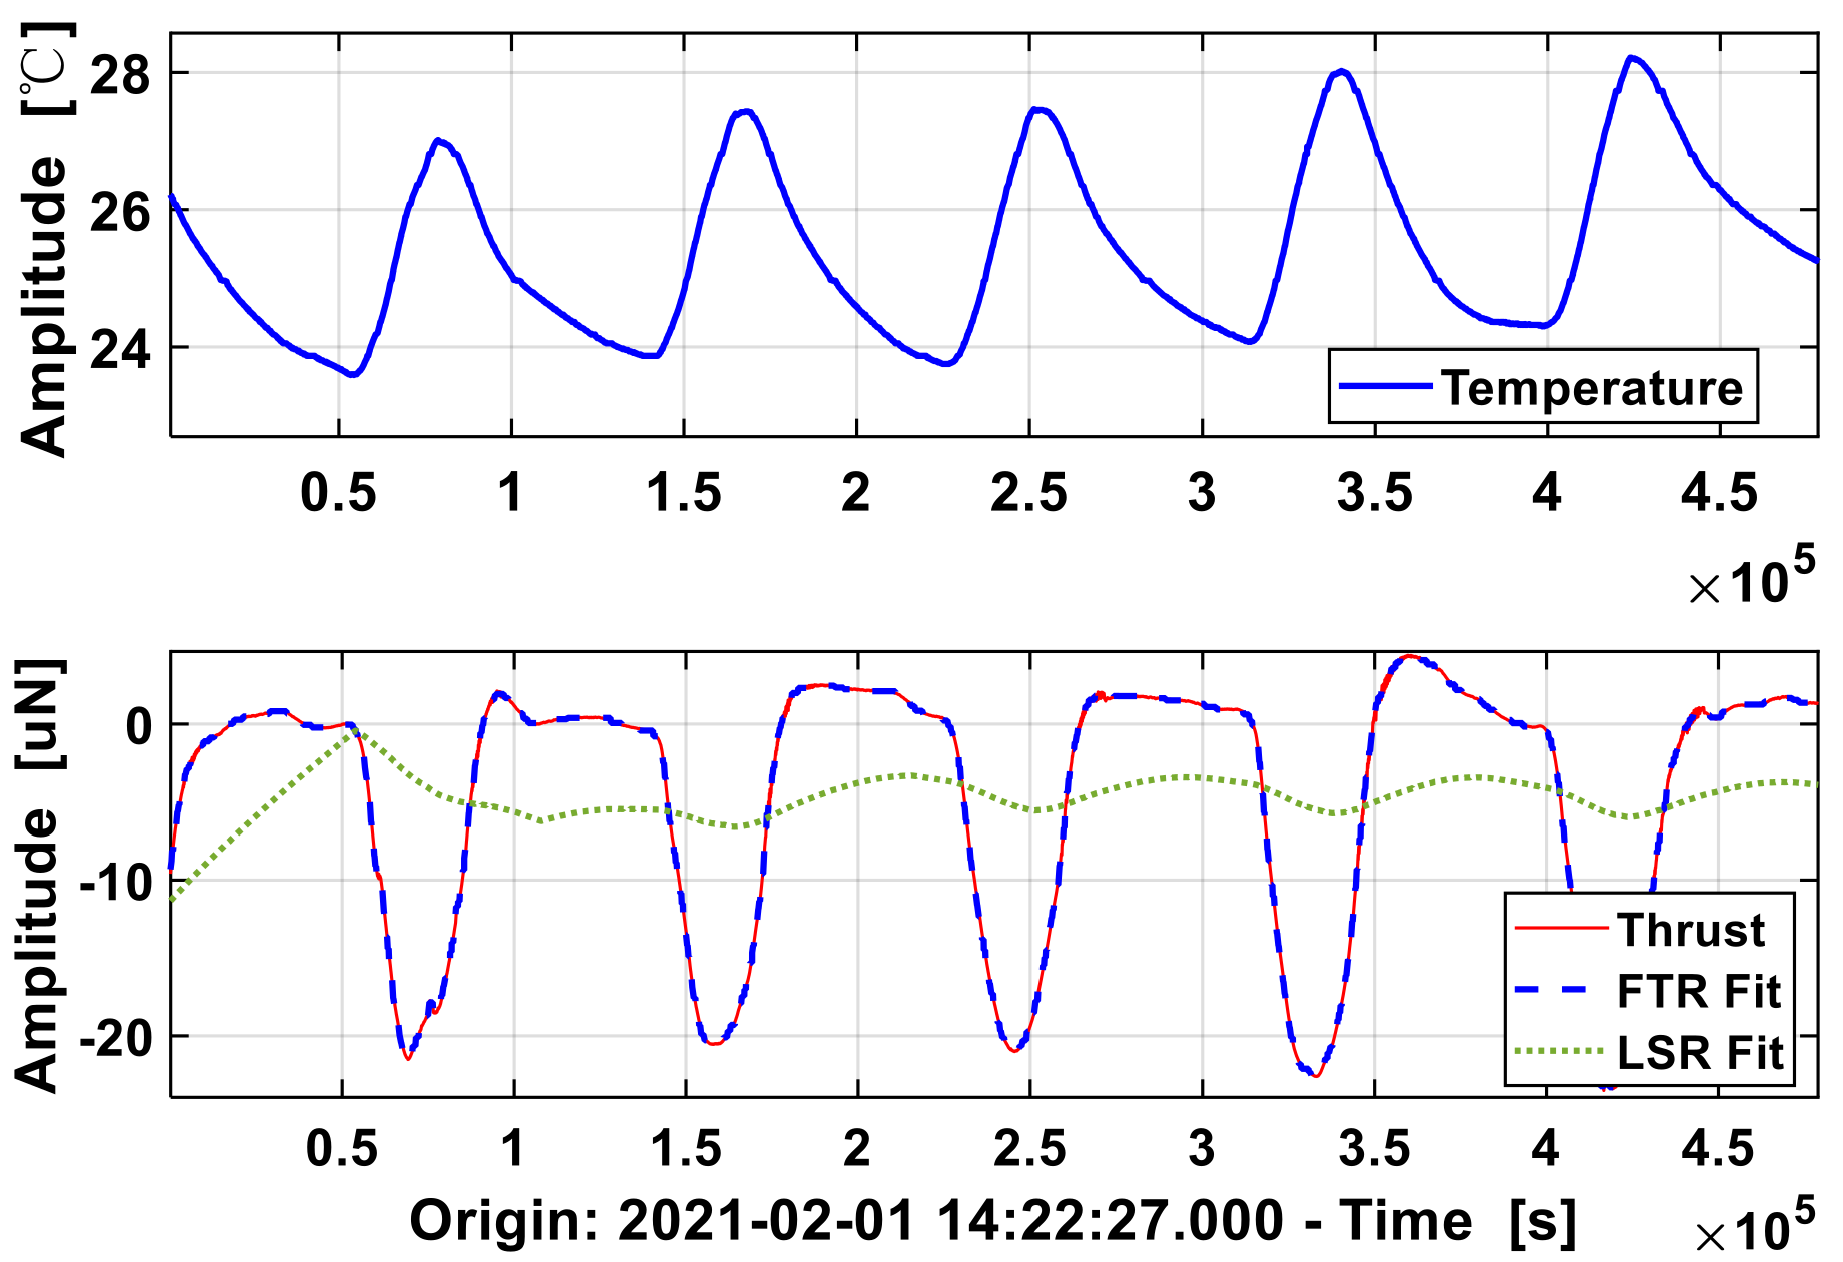
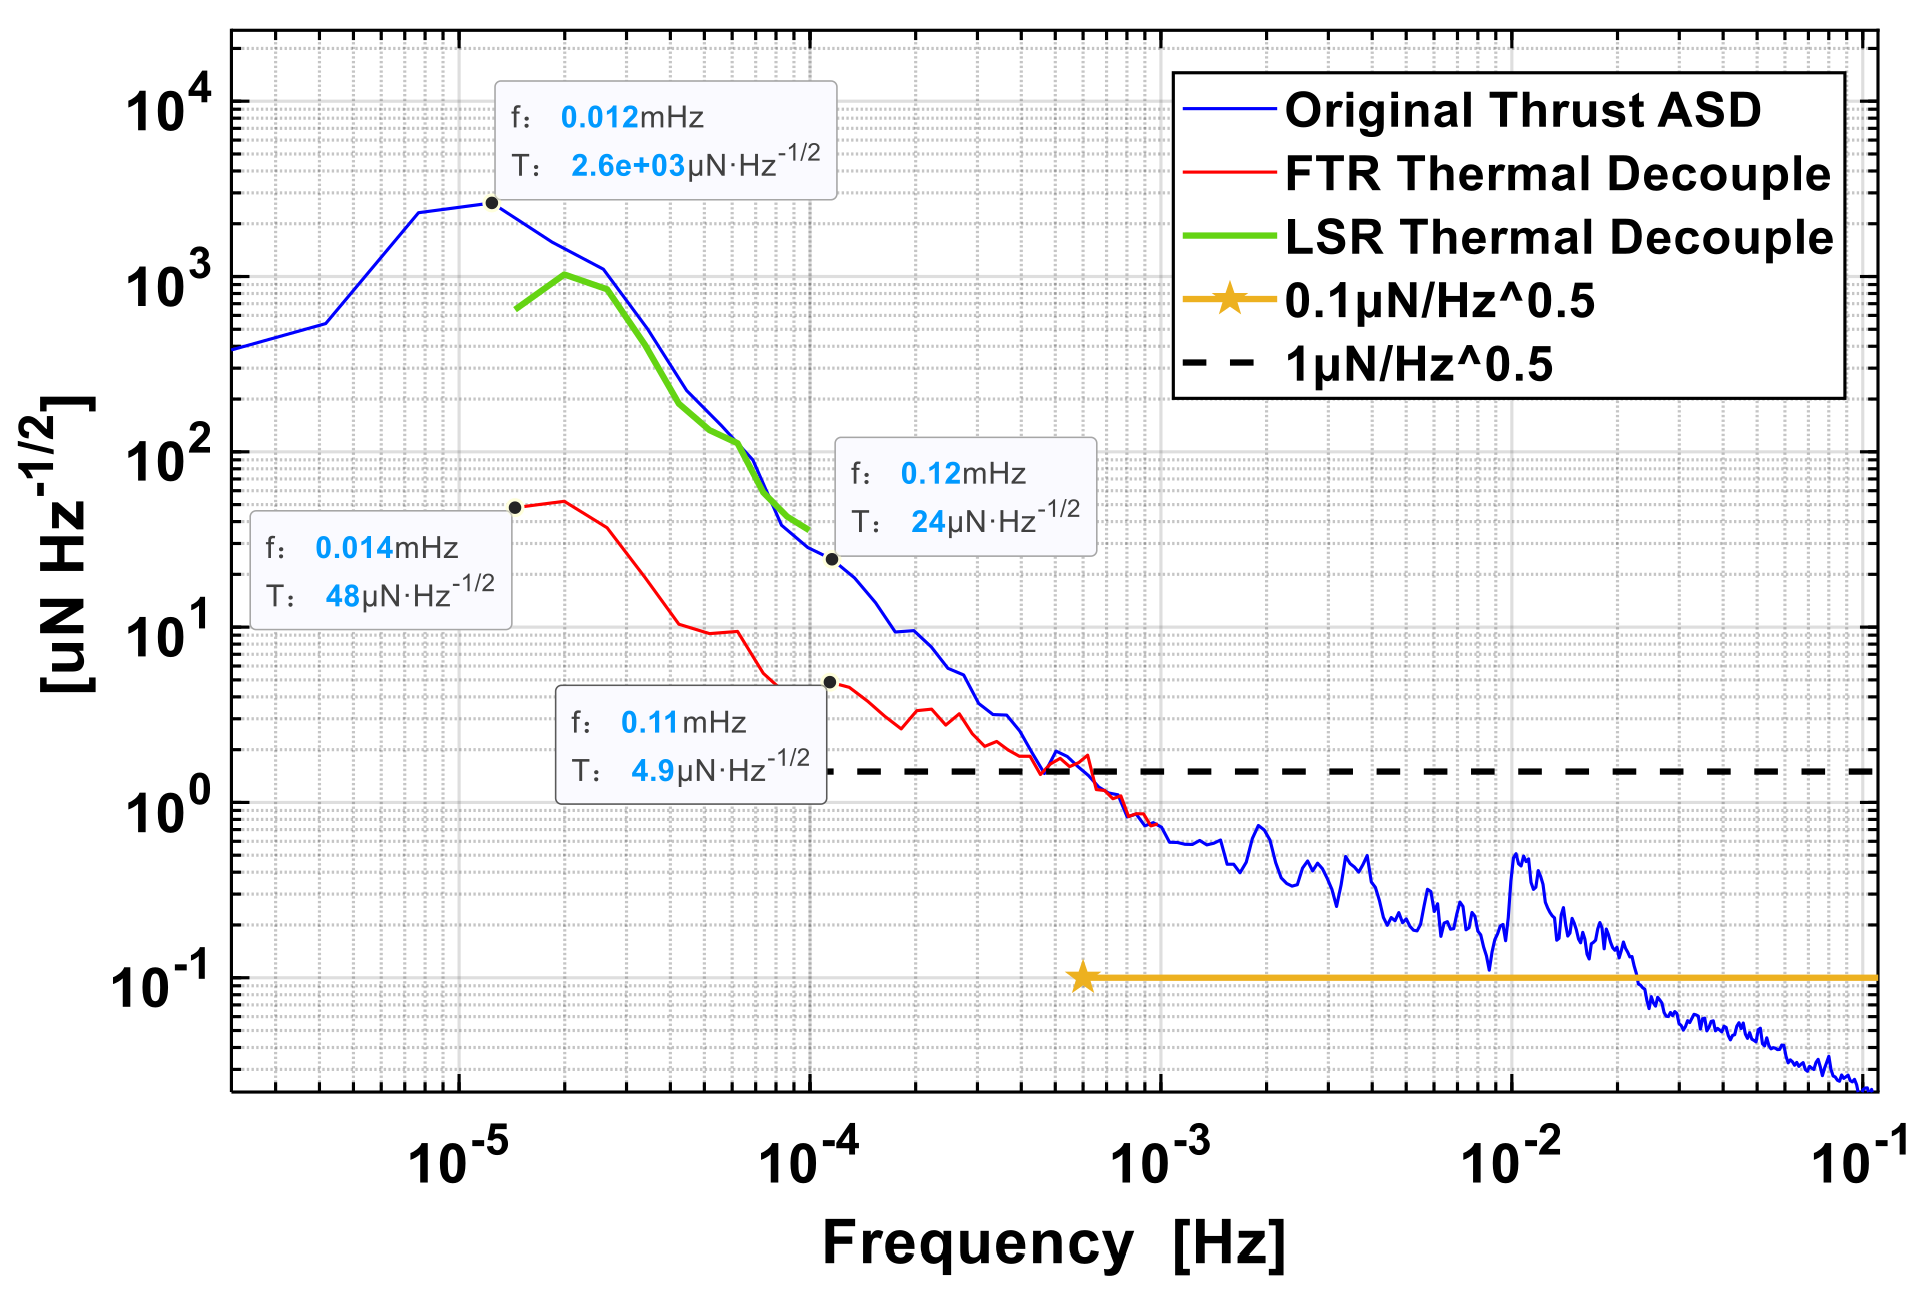
In order to provide a stable environment, the setup is placed on a passive vibration isolation optical platform and a windshield is used to prevent turbulence. The torsional stiffness coefficient of the flexural point is 0.245 , and the measuring moment arm was 0.18 m, so as to record the displacement by a capacitive sensor with a resolution lower than 1 nm at a sampling frequency of 5.21 Hz. As shown in Figure 2, the temperature fluctuated between 24–28 °C, and the thrust of the torsion balance fluctuated between 0–20 μN after debias, showing a strong correlation with the diurnal alternation. As shown in Figure 3, the thrust noise amplitude spectral density is less than 1 μN/Hz1/2 at 1 mHz, but up to 24 μN/Hz at 0.12 mHz1/2. The temperature change caused by thermal radiation of the sun amplifies the low frequency noise of the torsion balance below 1 mHz.
As the steps described earlier for thermal decoupling, displacement and temperature data are down-sampled to 0.1 Hz before regression learning. As shown in Figure 2 below, the FTR fitted thrust (red dash line) is more accurate than that of LSR (green dot line), to predict the original the thrust and estimate transfer function. As shown in Figure 3, thrust ASD (T-ASD) decreased from 0.11 mHz to 4.9 μN/Hz1/2 after temperature drift correction, reduced to 48 μN/Hz1/2 at 0.012 mHz (24-h), only 1/5th of the original. In addition, FTR has not only a larger amplitude decoupled than LSR does in fitting thermal thrust noise, but also a wider decoupled noise band of 1 mHz larger than 0.1 mHz of LSR. However, for the limitation of the temperature sampling frequency and the modulation transfer amplitude of the position PT1000 located, the noise reduction effect in this experiment is not obvious above 1 mHz, so shorter period temperature fluctuation is needed to testify.
3.2. Space-Time Variation of Temperature
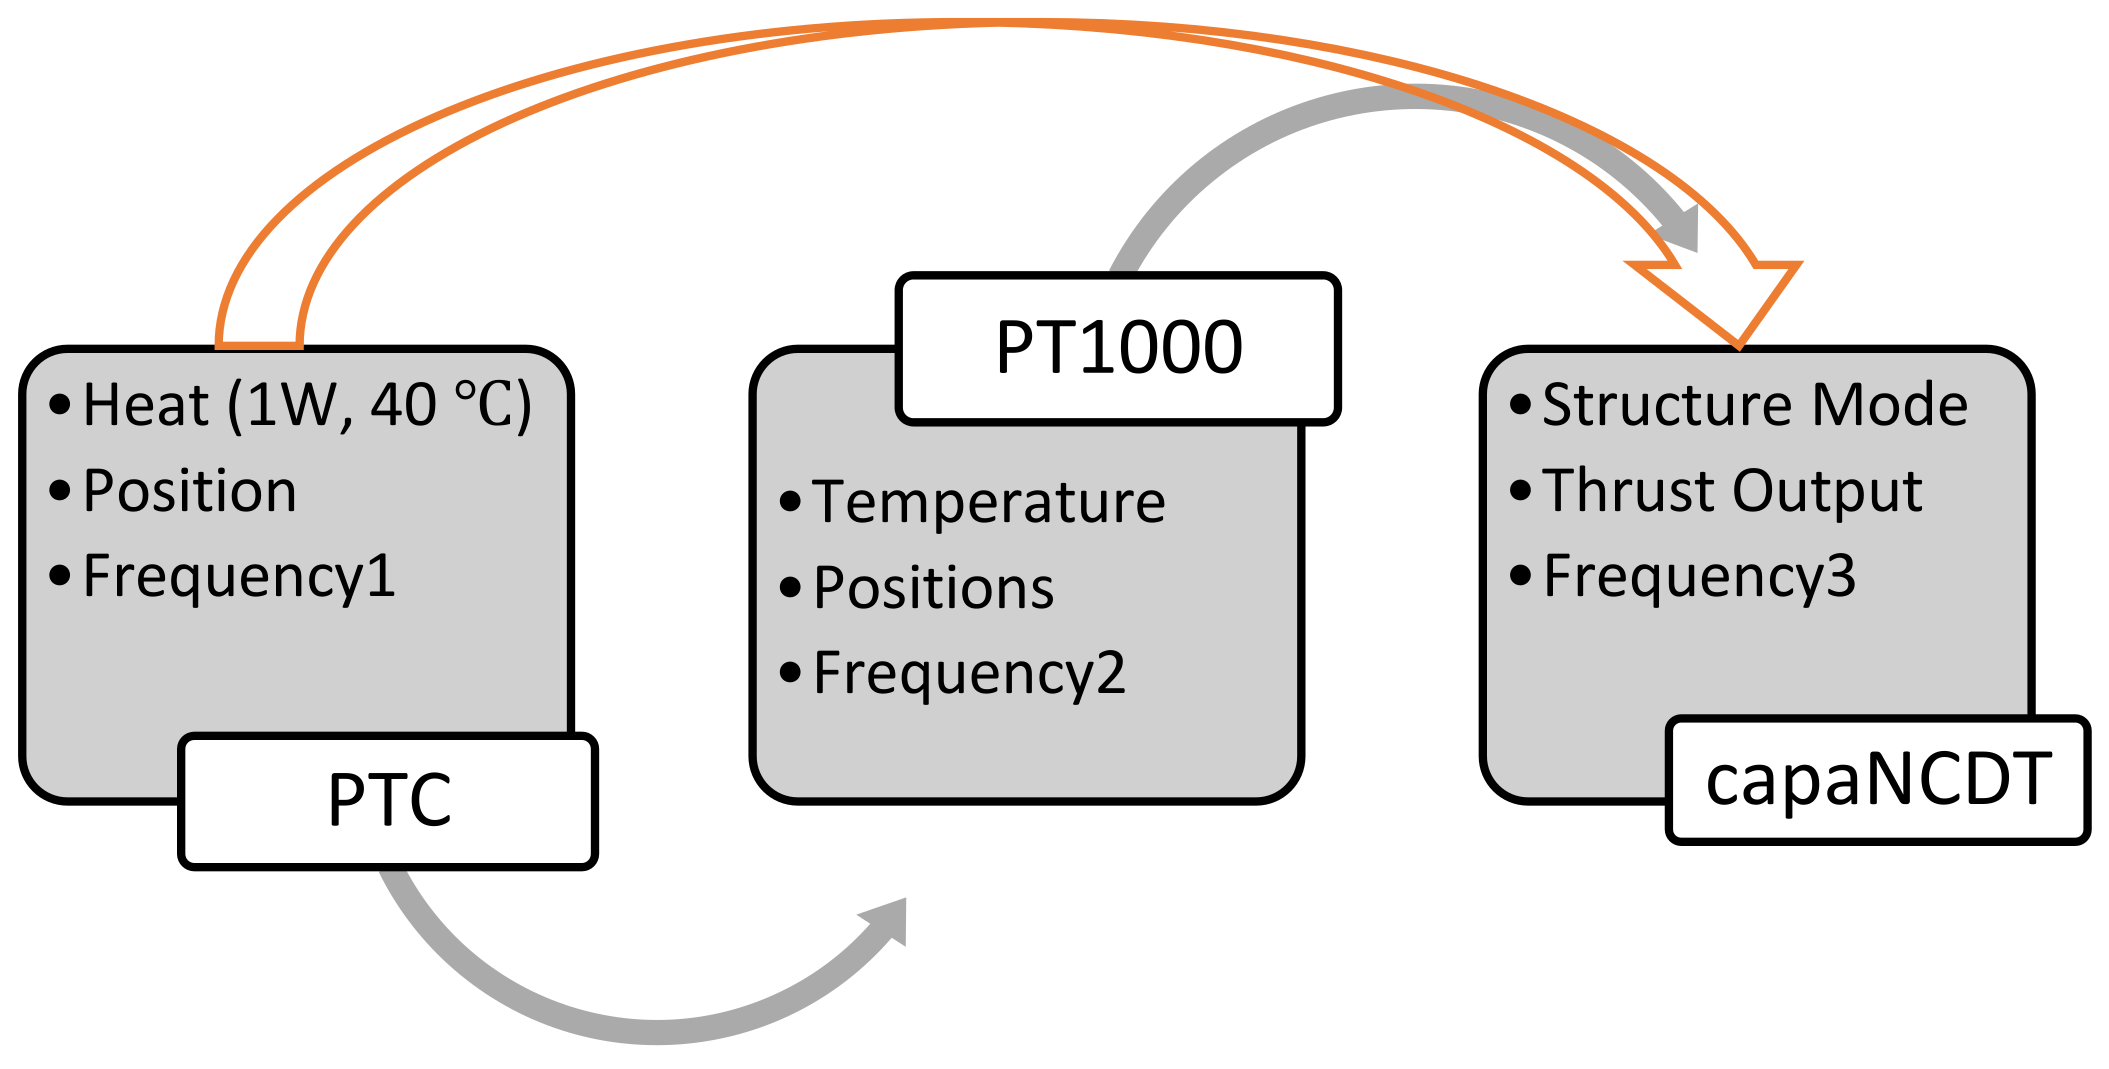
The thermal decoupling of thrust is to subtract thermal effect from the displacement, and the perturbation is propagated from heat source (PTC) to PT1000 and torsion balance. Neither a strong temperature correlation between a PTC heater and a PT1000 sensor, nor a strong position correlation between the PT1000 and thrust response of torsion balance, means the correlation between thermal variation and thrust response of torsion balance. As shown in Figure 4, one must first determine which point affects the deformation of torsion balance most, which means a location optimization of PTC heater or PT1000 sensor based on the covariance between their positions and thermal vibration of torsion balance. Meanwhile, thermal conduction is taken into consideration to magnify the temperature correlation between PTC heater and PT1000. Thus, an ideal temperature measuring point not only depends on the structure change of the torsion balance of PT1000 position, but also is closely related to the temperature changed by the heat source, for a good correlation with both sides is helpful to find the covariance and reduce thermal thrust noise.
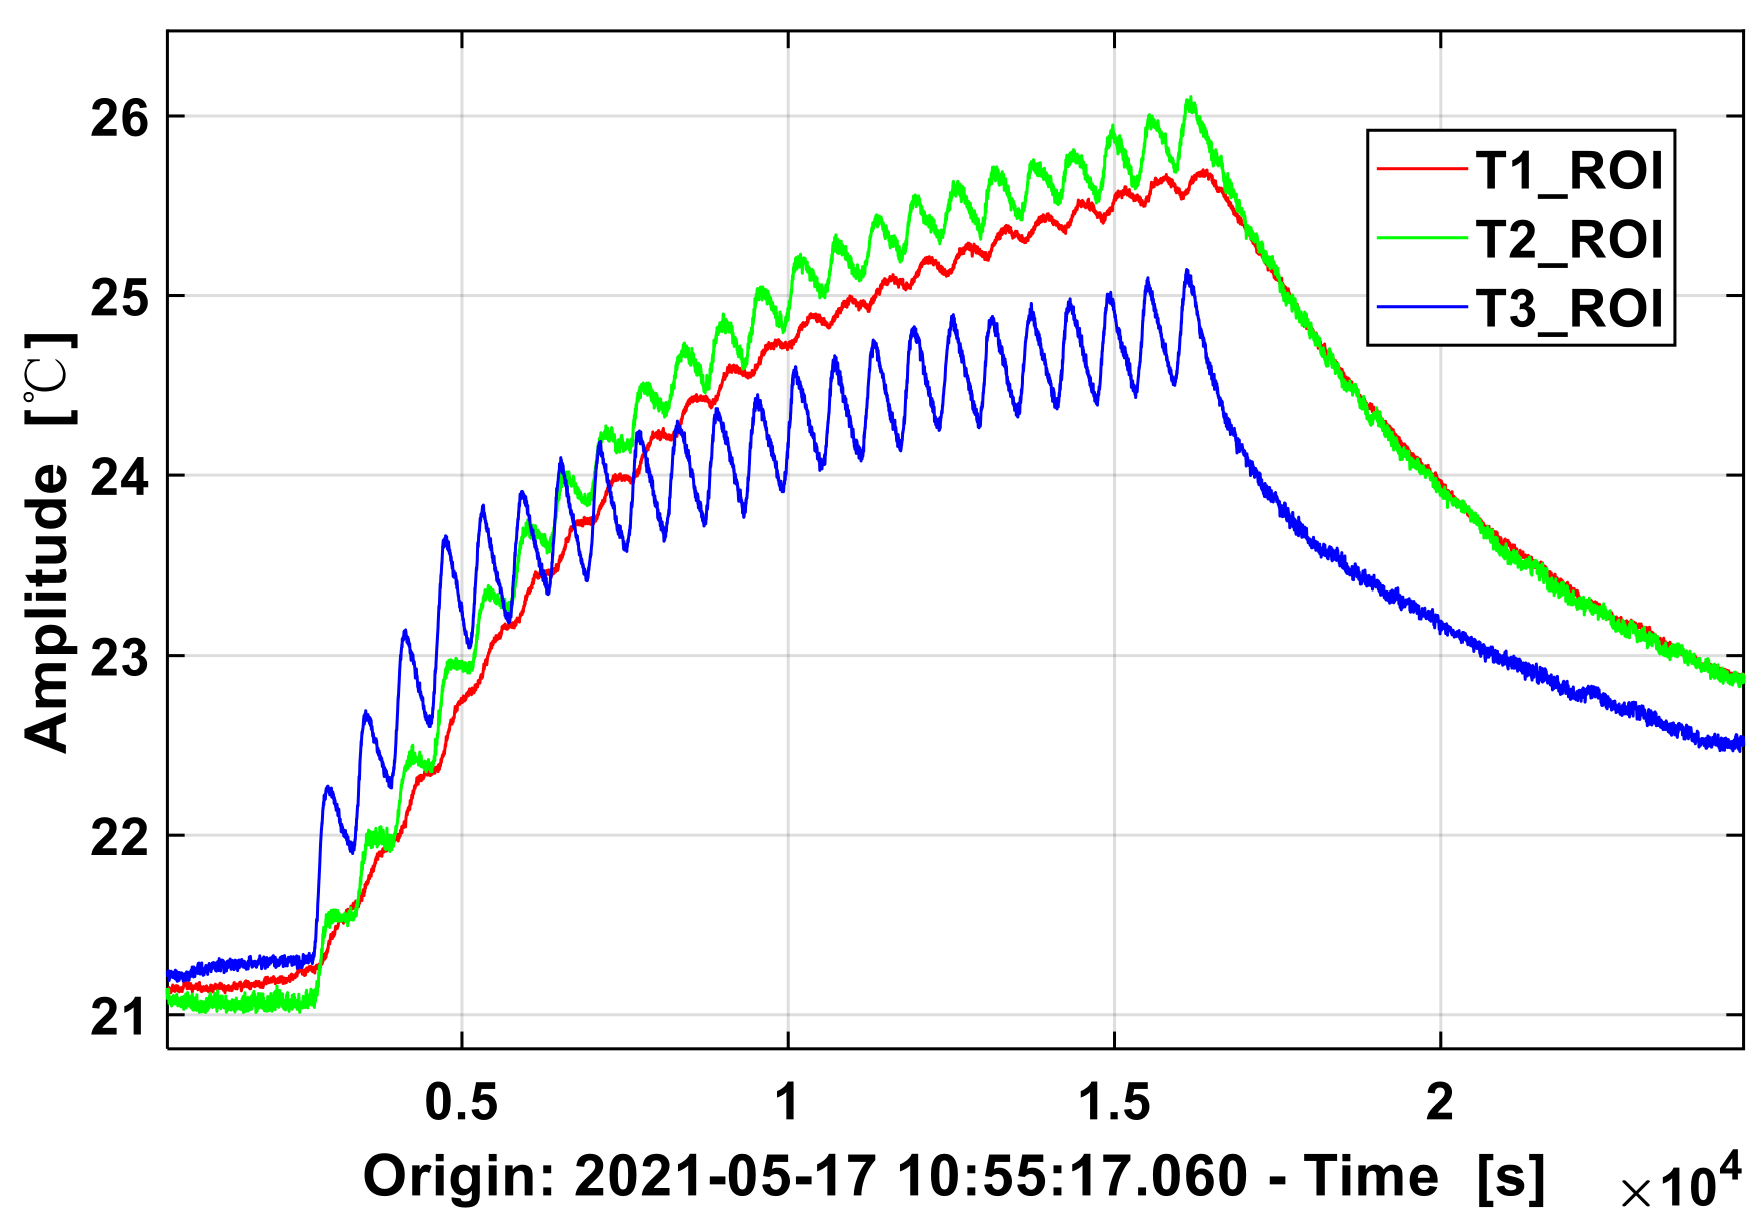
The relationship between the heat source and the temperature of the PT1000 sensor is discussed first. In order to shorten the experiment time compared with diurnal exposure, a heating pad was laid on the bottom of the base of torsion balance, and the relay switch was triggered regularly. The temperature at the flexible pivot (T1), the base of the torsion balance (T2) and the glass plate of the torsion balance (T3) were recorded at the sampling frequency of 0.1 Hz by heating for 2 min and turning off for 8 min. As shown in Figure 5, under the action of heat source, T3 is the first place to receive the heat and starts to rise periodically from 2 °C and gradually converges to around 25 °C. The rise at T2 is delayed for the heat conduction is slower. However, after being heated up, the temperature converges to 26 °C, which is higher than T3 and close to the heat source. T1 is furthest away from the heat source and has the smallest heat exchange area, thus the fluctuation during heating is the least. Due to the delay of heat, when one point is in a heating period, the other point may be in a cooling period. The heat dissipation rates at different locations of the system reflects the eigen frequency. Rising fast and falling slow, the temperature showed hysteresis characteristics when the structure is repeatedly heated, which also aggravates the deformation, stiffness degradation and energy consumption of the torsional balance structure in the process of thermodynamic equilibrium.
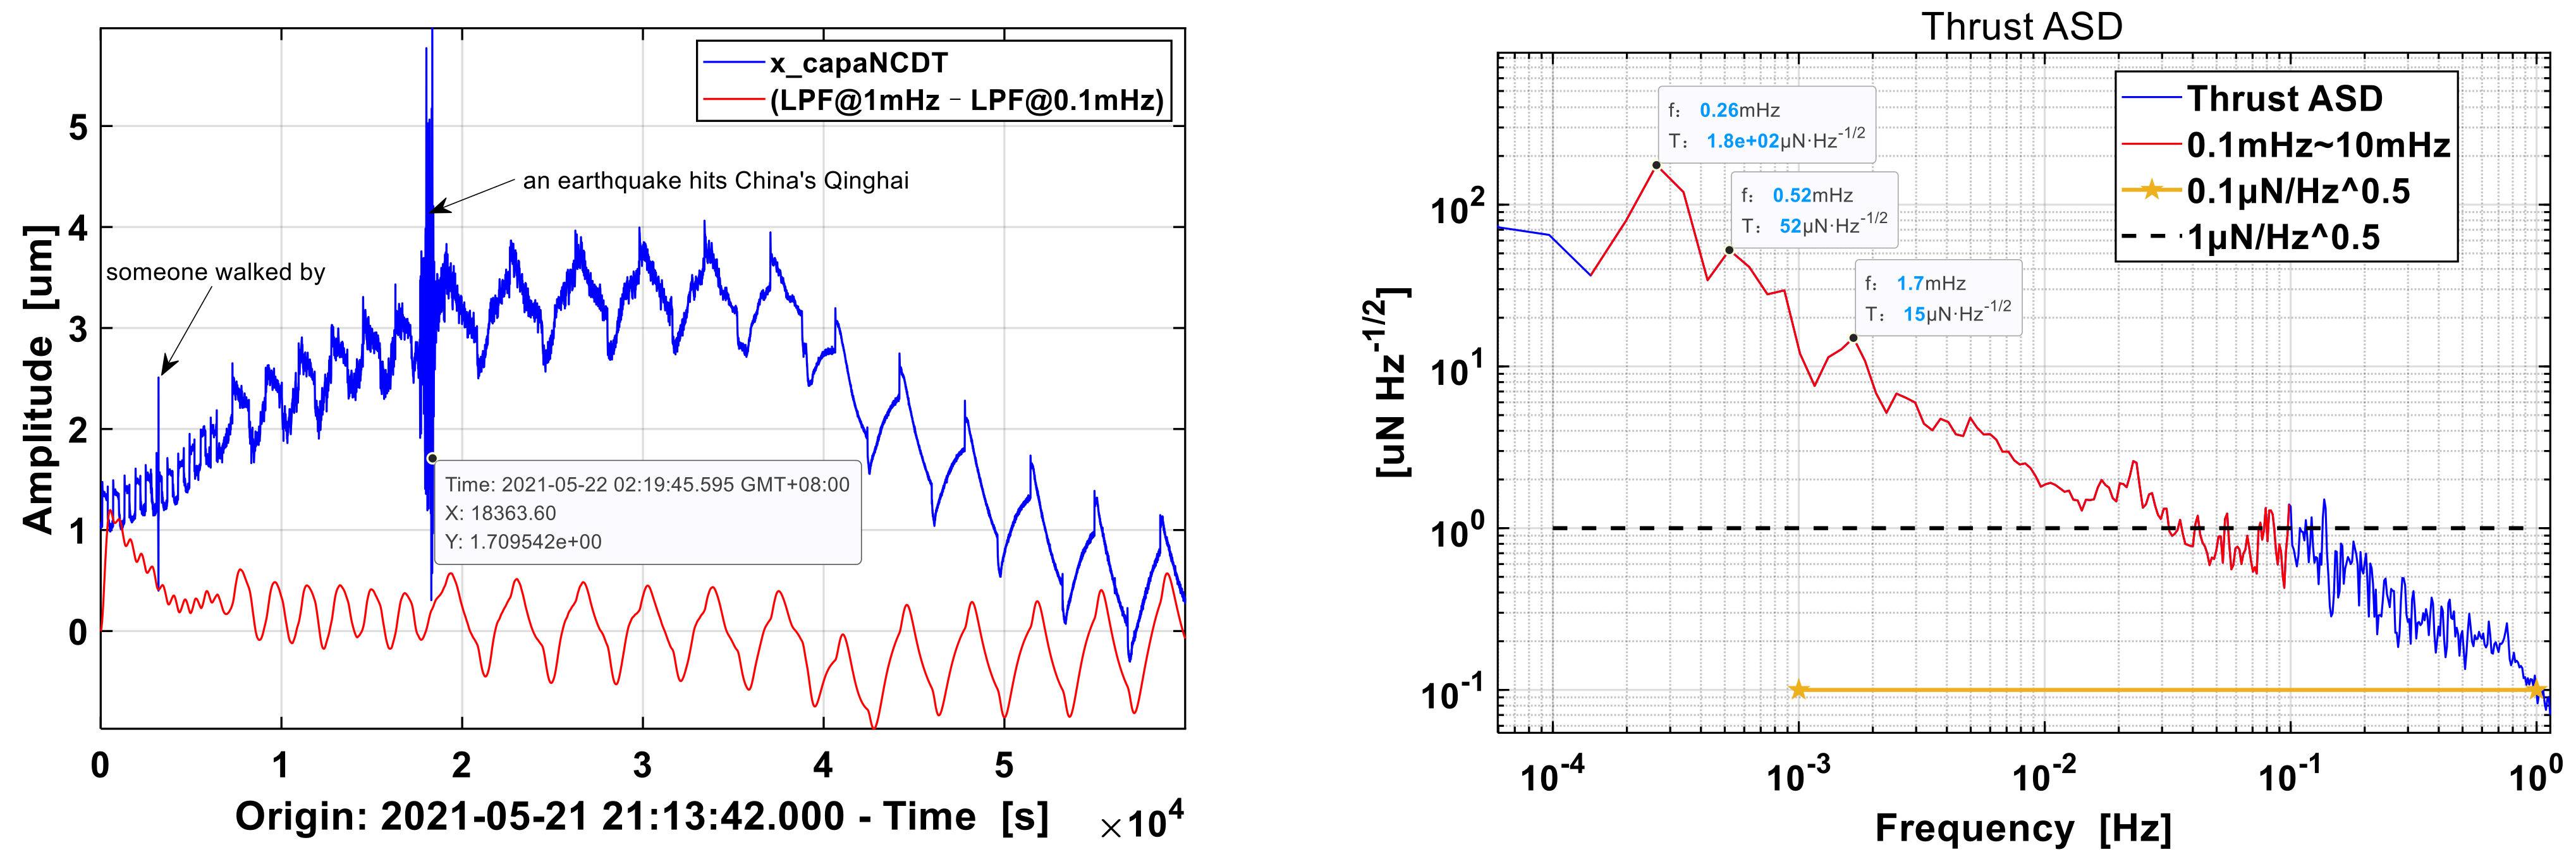
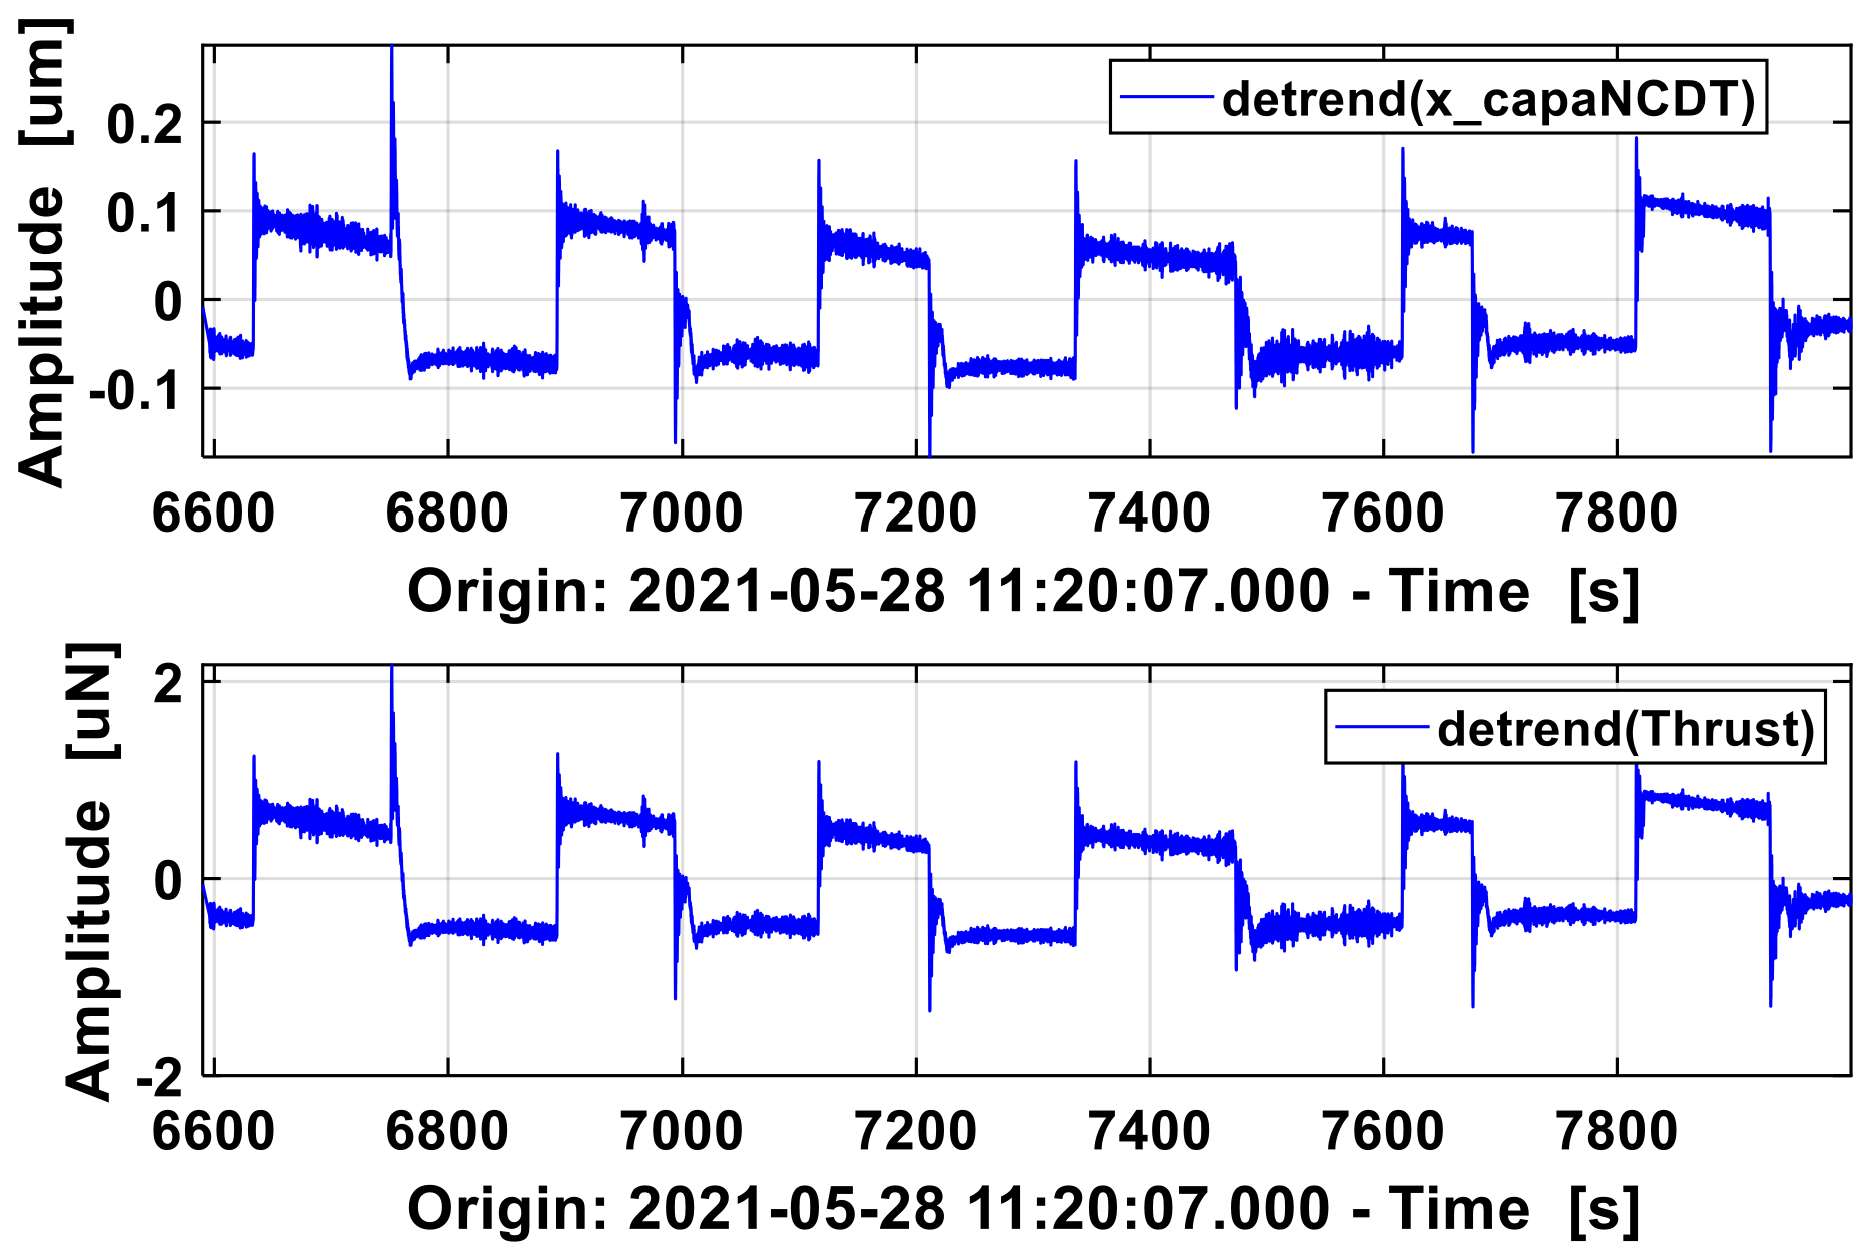
In the experiment above, a heating pad was used to heat the base of torsion balance, and the fluctuation of thrust balance was not obvious. In the next experiment, PTC heating was installed in the corner of the base below to lock the position that caused instability of the torsion balance. Regardless of the temperature of PT1000, to change the frequency of temperature fluctuations, PTC starts from turning on/off every 5 min at the beginning to turning on/off every 15 min and then to turning on/off every 30 min. The heat source square wave cycles range from 600 s, 1800 s and 3600 s, corresponding to frequencies of 1.7 mHz, 0.56 mHz and 0.27 mHz, respectively. As shown in Figure 6, the displacement data x_capaNCDT at 0.1 mHz and 1 mHz were subtracted to get a relative periodic result (red line): as the PTC work, the displacement modulation amplitude of the torsion balance increases gradually. There were two transient, high-frequency impulses during the experiment, one caused by passing people, the second by accidentally caught earthquake shock. In addition, it is found that the vibration mode of the optical platform switched in a period of 24 h. During the rise from the evening to the next morning, the vibration of displacement at 0.02 Hz is larger, which becomes weaker during the fall from the morning of the next day to the evening. The change is not related to PTC heating, but to the background noise of larger system and longer period.
In the frequency domain, the thrust ASD resolves peak signals at 0.26 mHz, 0.52 mHz and 1.7 mHz, close to the PTC’s modulated frequencies at 0.27 mHz, 0.56 mHz and 1.7 mHz. The thermal noise at 0.26 mHz is the largest, and noise at 1.7 mHz is the smallest, and the frequency deviation of 0.52 mHz is large due to the fewer sampling cycles. The modulation transfer function of temperature to displacement resembles a low-pass filter, and the ASD above 50 mHz is less than 1 μN/Hz1/2, which provides a reference for the PT1000 sampling frequency. In addition, the heating position during the whole experiment is also a variable. The deformation of torsion balance is the direct cause of the fluctuation of thrust position, and the influence of the heat source is the indirect factor of thrust drift.
3.3. Square Wave Modulations of ESF and PTC
3.3.1. Temperature and Displacement
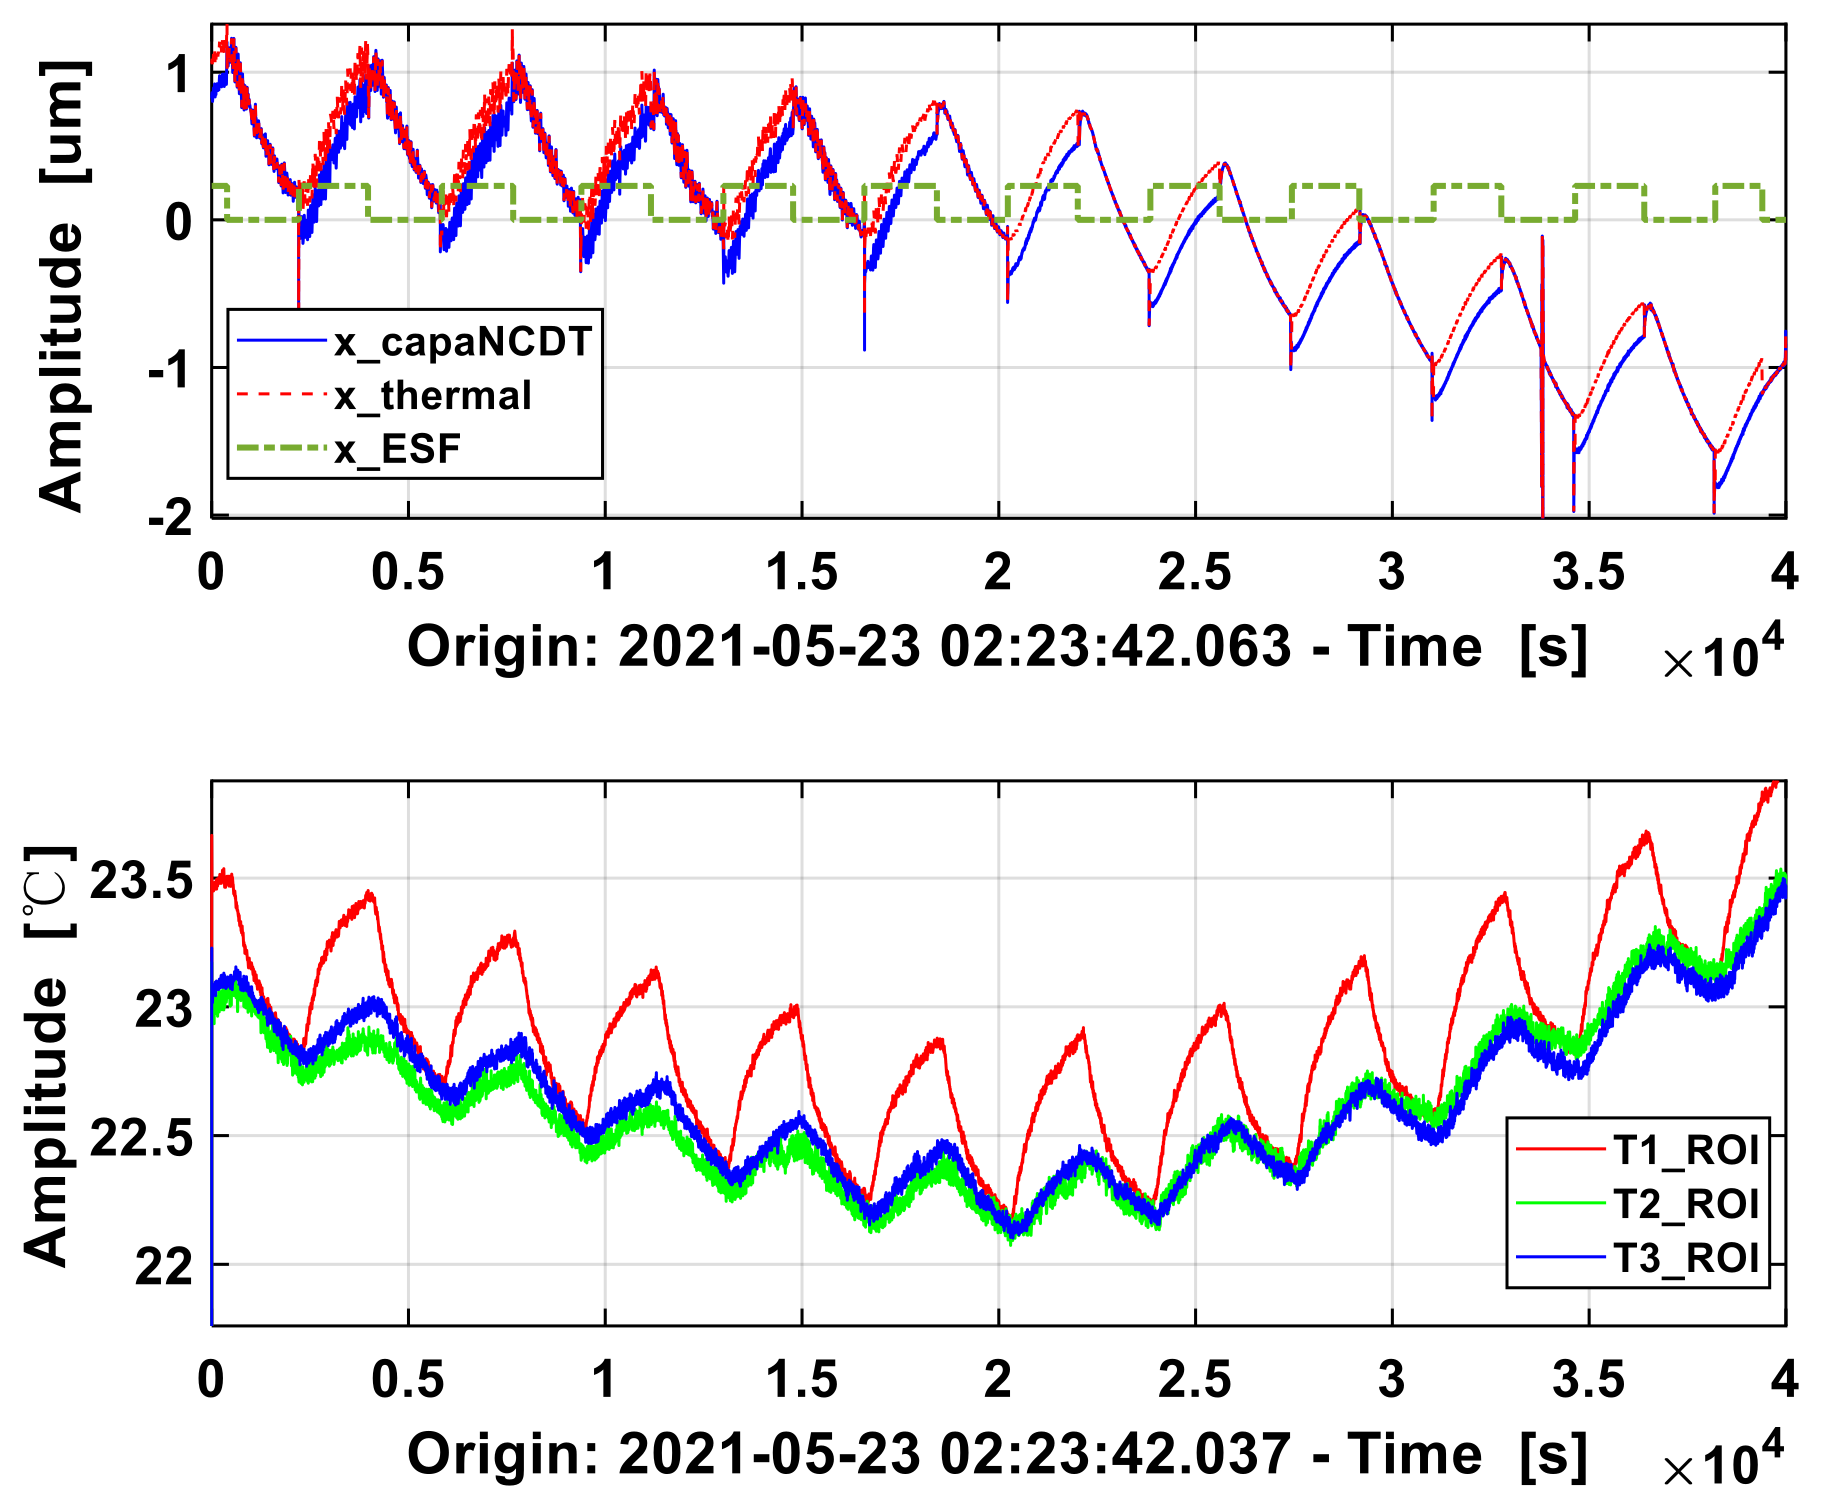
The test of the micro thruster on the torsion balance is accompanied by the load heating, which makes the zero level of the force measured by the torsion balance drift as the time changes. In order to test this situation, the ESF (almost zero heat consumption) and PTC heating plate were used to synchronize the switch every half an hour to realize the temperature rise and fall, and thrust square wave with a period of one hour. At the same time, three sets of PT1000 were arranged to record temperature changes, and capacitive sensor was used to record the displacement of torsion balance.
As shown in Figure 7, there seems a covariation between displacement (thrust) and temperature, but it is not a simple correlation. Before 3 × 10⁴ s: thrust and temperature move in accordance with each other in the modulated frequency, but also in the larger low-frequency trend; however, after 3 × 10⁴ s, although the temperature thrust is still correlated at the modulated frequency, the trend at lower frequencies is reversed. This is attributed to the fact that the heat balance of the system is determined not only by the modulated frequency of PTC heating, but also by the larger system environment (including the platform) and the external temperature exchange. For example, PTC heating can cause the torsion balance to fluctuate briefly with the modulation period, but a longer-term trend is determined by the heating and deformation of basement platform. The height of the four corners of the base varies relative to each other because of thermal expansion and cold contraction. Usually, the gravitational weight of torsion pendulum will not produce a displacement, but when the platform tilts 1 μrad, even a torsion bar of 0.1 kg will produce 1 μN as thrust increment, which needs to seek a new balance with flexible axis deformation. Additionally, 0.1 μm difference between the ends of length 0.1 m is enough to cause a horizontal change of 1 μrad. The thermal deformation of the material is extremely difficult to control, and the problem is worse when the heat power of the thruster and other loads is added.
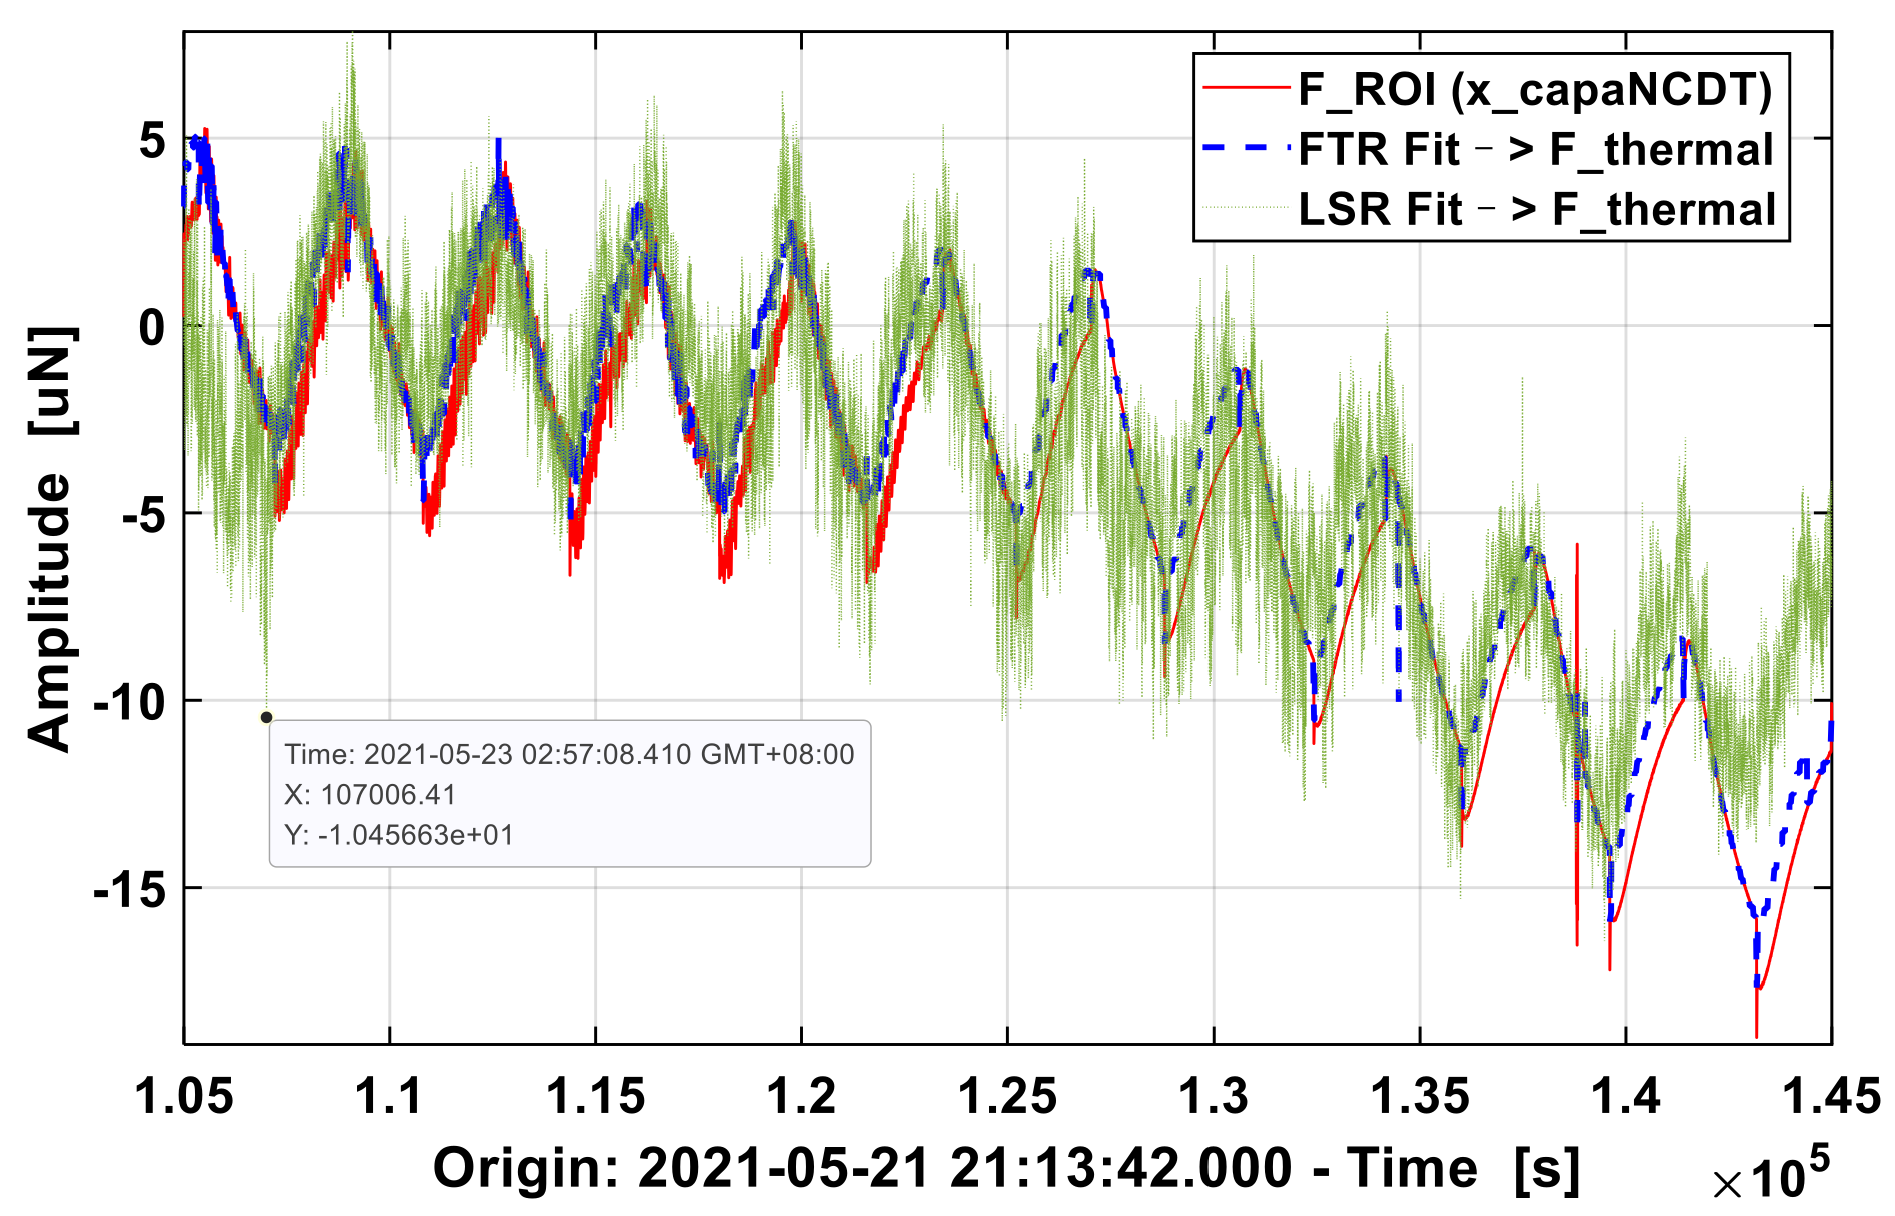
In addition, the square wave electrostatic thrust of ESF drift due to the temperature effect. According to the differential signal, the original displacement data (solid blue line in Figure 7 above) at the input square wave switch has a jump of about 0.23 μm, which corresponds to a thrust step of 1.7 μN. As the PT1000 at different locations are turned up or down due to the heat source, the temperatures all rise or fall in varying ranges (below Figure 7). When the electrostatic thrust is constant, the displacement has a trend to change synchronously with the temperature. By completing the displacement data at the step, a relatively continuous thermal drift (red dashed line in Figure 7) can be approximated. To extract on the square wave signal in the huge background of thermal drift, assuming the electrostatic force be constant during the square wave, the temperature (T1_ROI, T2_ROI, T3_ROI) are first used to fit the displacement data x_thermal without electrostatic force. Then, based on the thrust predicted by regression learning, the transfer function from the fitted thrust to the thrust calculted by the displacement data x_capaNCDT is estimated via ZDVF, and the thermal drift in the electrostatic force measured by torsion balance is filtered out to restore the static force. The difference between the thermal thrust predicted by PID-FTR and SVD-LSR were compared. As shown in Figure 8, when fitting the thrust without ESF’s electrostatic force, the PID-FTR algorithm learned the drift perfectly, while the SVD-LSR algorithm had high-frequency residuals and ultra-low frequency deviations. Compared to the thrust F_ROI calculated from the original displacement data, the fitted drift thrust based on FTR regression was clearly separated in time, while the thermal drift thrust based on LSR regression is now and then too close or too far.
3.3.2. Thermal Noise Decoupling
After fitting the thermal thrust caused by temperature, the following work returns to the normal procedure: transfer function, z-domain fit, and signal subtraction. It should be noted that meaningful frequencies should be selected when fitting the transfer function of the system in z-domain. For the frequency of thermal thrust is low, the period interval of 20–2000 s can be selected.
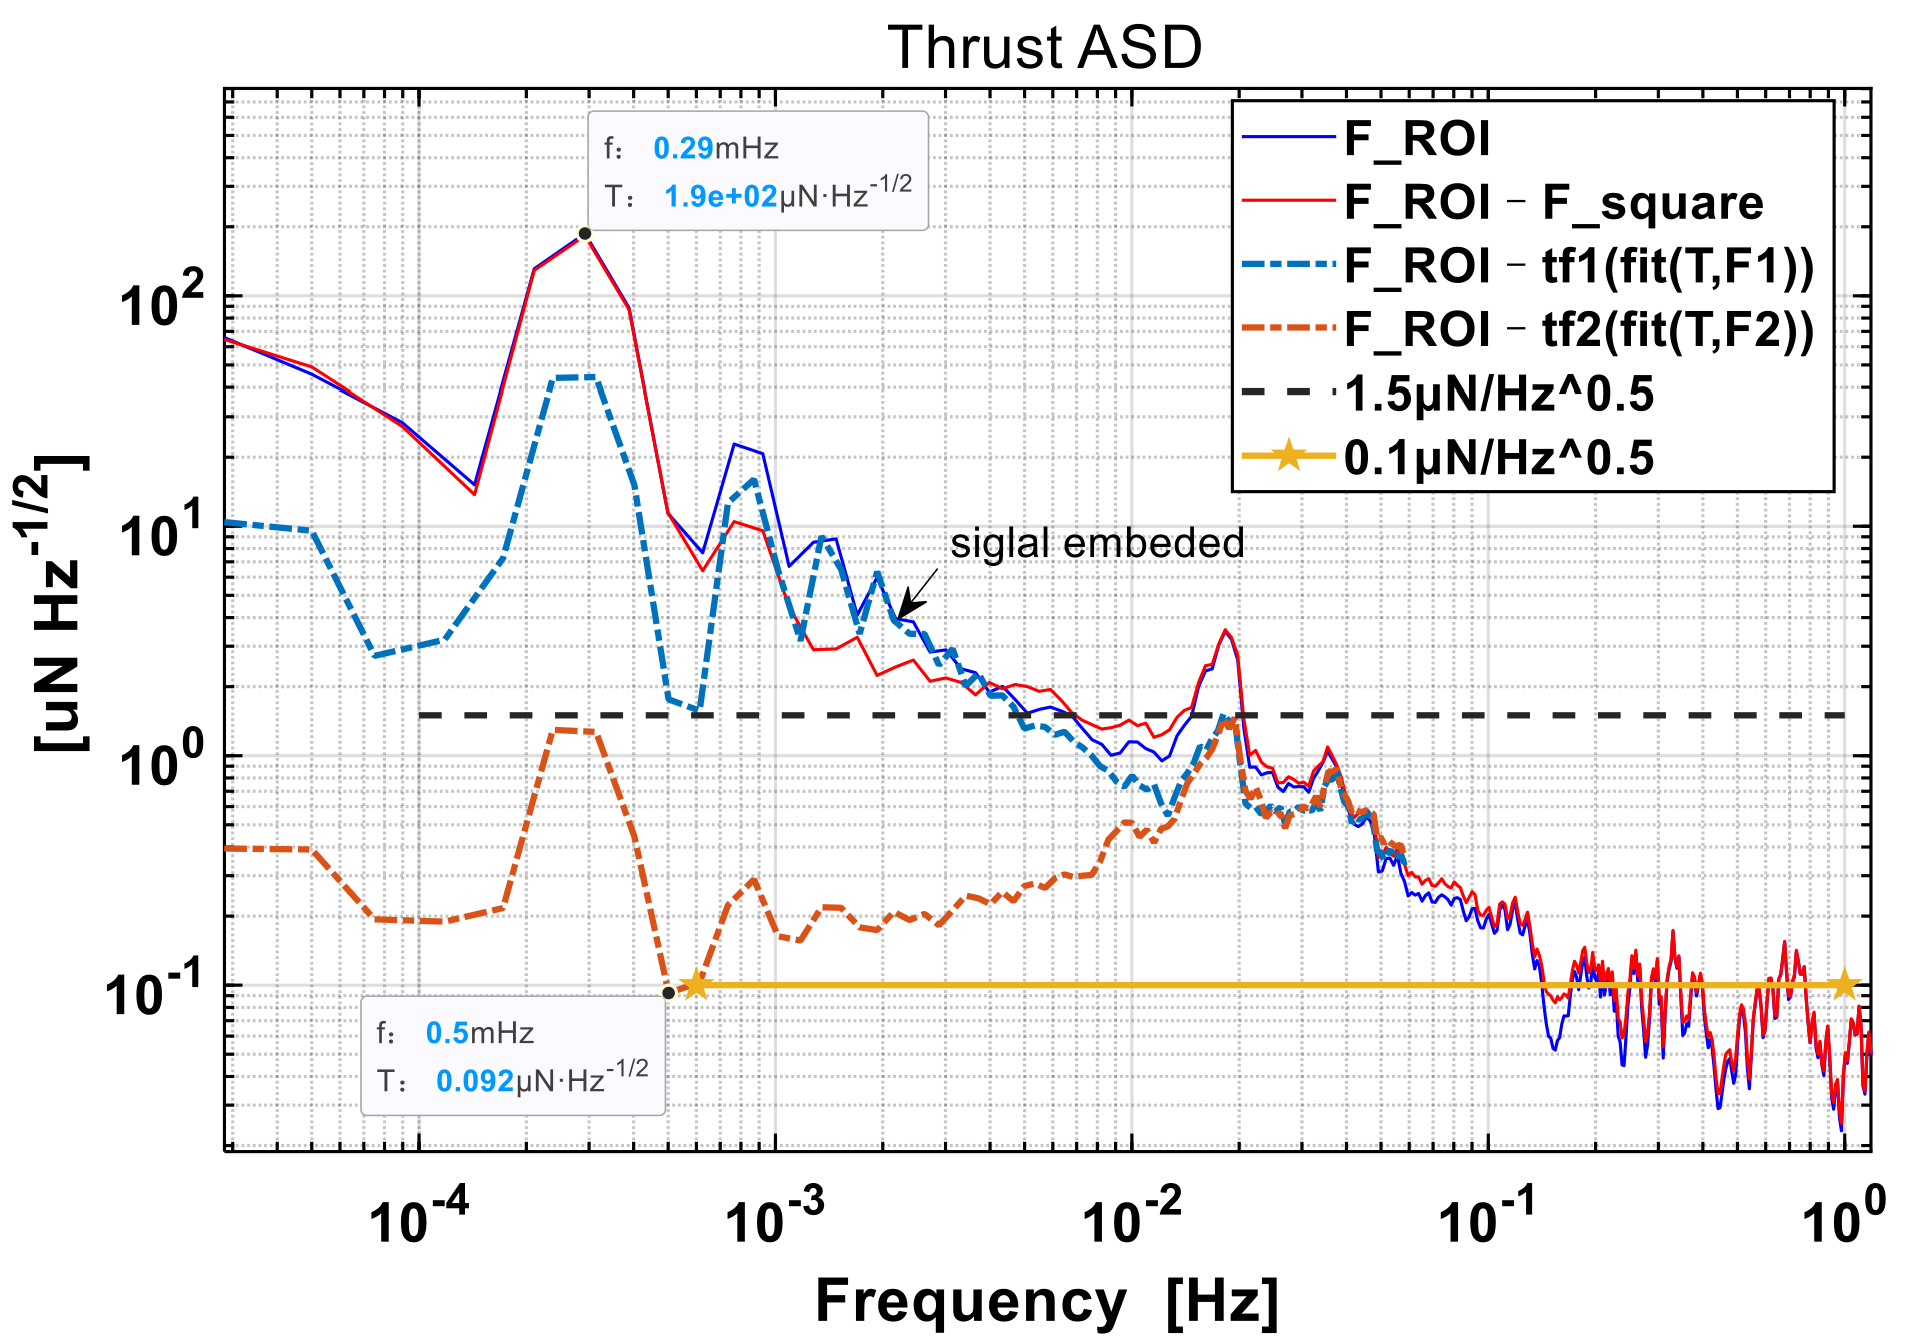
As shown in Figure 9, the solid blue line (F_ROI) represents the original thrust ASD, and the solid red line (F_ROI–F_SQUARE) represents the ASD after the electrostatic force deducted. It can be seen that they are basically close to each other, but the difference lies in the square wave, where the potential signal is embedded in the area between the envelope of 1 mHz–10 mHz. The blue and red dashed dotted line represent the thrust ASD results after FTR thermal thrust filtering, compared to the blue and red solid line, respectively. When the electrostatic force is absent, the thrust ASD is decoupled and reduced below 1.5 μN/Hz1/2 in the full frequency band; even if the square wave is restored, it can be still locally reduced to 1.5 μN/Hz1/2 at 0.5 mHz. What is different from the diurnal temperature variation, the thermal noise removal effect is more obvious near 10 mHz except at the modulation frequency of 0.29 mHz, while higher frequencies at 50 mHz still have no thermal noise removed. It indicates that the temperature acquisition frequency about 0.1 Hz is appropriate, and that the selection of temperature measurement points plays an important role in establishing the correlation between temperature and thrust drift of the torsion balance. Still, the results need to be verified by the restoration of electrostatic force in time domain again.
3.3.3. Restoration of Electrostatic Force
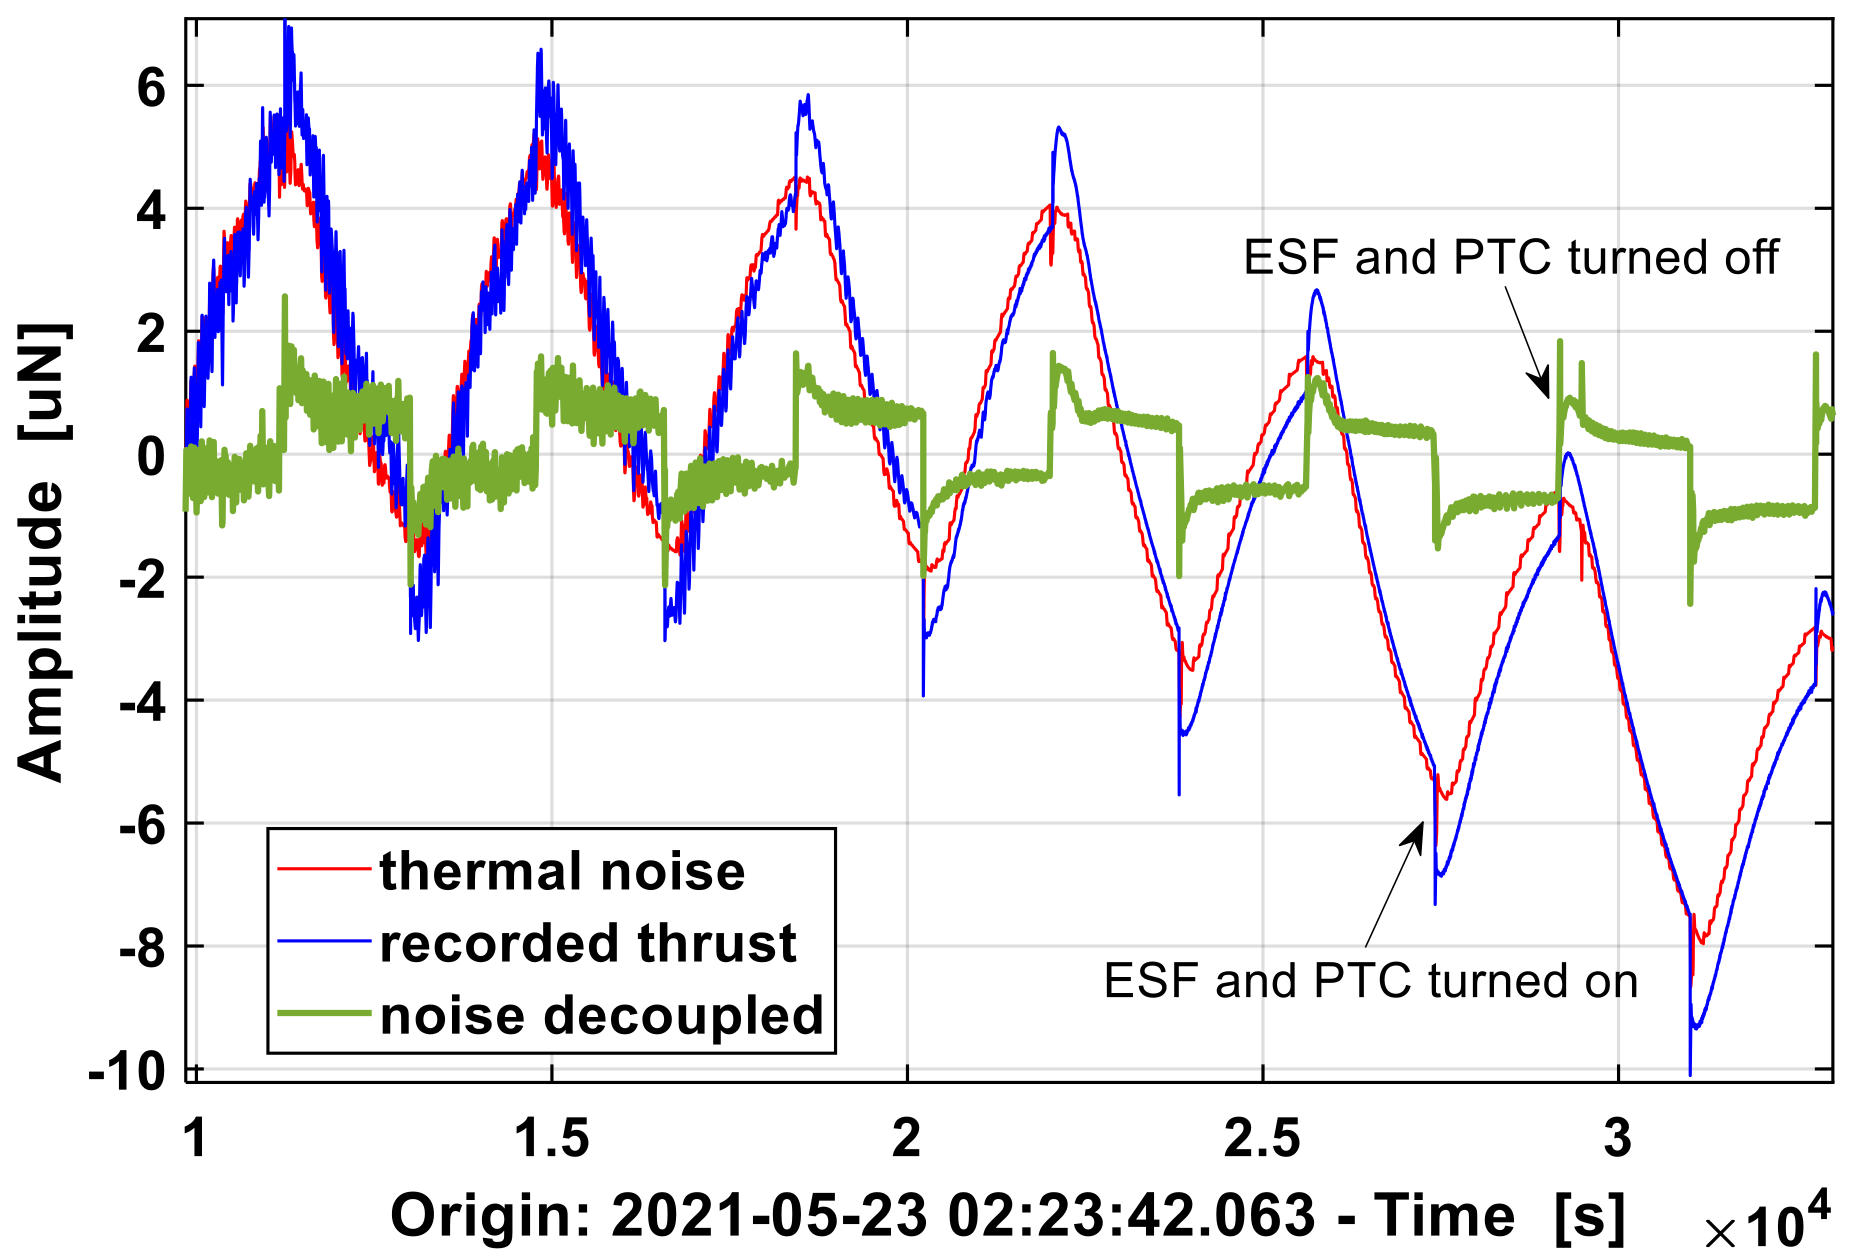
As mentioned above, PTC and ESF (10 V voltage loaded) will be turned on and off at the same time every half an hour during the experiment. The ESF step output electrostatic force is 0.23 μm × 7.56 μN/μm ≈ 1.7 μN. PTC heating makes the thrust characterized by the displacement of torsion balance drift gradually. As shown in Figure 10, after dealing with the PID-FTR and ZDVF series of algorithm, the thrust measurement result with thermal noise removed from the time domain can be seen clearly: ESF’s real electrostatic force of 1.7 μN square wave is extracted from the oscillations of 7 μN affected by the temperature, along with the rising and falling template trigger position exactly. In addition to the electrostatic force, the recovered square wave retains vibrations other than thermal noise, such as the obvious 0.02 Hz vibration associated with the optical platform before 2 × 10⁴ s, which disappear again as expected after 2 × 10⁴ s. Therefore, the proposed process of thermal noise decoupling does not shave all the noise, but only removes the interference in the 0.5 mHz–50 mHz related to temperature fluctuation, which is more real and more effective than the direct low-pass or band-pass filtering of displacement data.
It is a little confusing that the electrostatic force restoration result after thermal noise removal is accompanied by overshoot in each step response. To determine whether it is the residual error processed by the algorithm, the PTC was turned off in contrast for pure electrostatic square wave of 1 μN turned on by ESF alone, and the existence of “burr” can still be observed as shown in Figure 11. Burrs of micro size and unpredictable location are found to be a sign of parasitic capacitance in electrical circuits, which is the extra effect of ESF and other conductors that serve as plates between a dielectric when capacitive charge and discharge aroused by crosstalk when circuit switched. Since the burrs occur simultaneously with a square wave, their spectrum contains the character of the square wave, such as a series of odd number of harmonics ranging from low to high frequencies. The FTR thermal noise decoupling algorithm not only distinguishes the burrs’ variation below 50 mHz from the thermal variations finely, but also reserves partial high frequency (below 1 Hz) original information, which further demonstrates the effectiveness and pertinence of the algorithm.
In addition, both the time scale of FTR and the frequency range of ZDVF have the risk of underfitting or overfitting. As for the tuning of relevant parameters, on the one hand, the range of frequency coverage should be considered, and the adjustment should be made according to mean square error to obtain better fitting results. On the other hand, the spectral response of the actual physical quantity should also be used to iterate according to the thermal noise subtraction effect, and cross validated through a priori template (such as square wave). In general, datasets of different variation modes can be added to train the temperature’s prediction ability of the FTR model. The noise decoupling precision of ZDVF can be refined and enhanced by using different frequency modulation of temperature and different location acquisition temperature.
4. Conclusions
For in the residual tilt coupling due to the asymmetry of the torsion balance, thermal variation converts ground tilt into rotation and causes drift to the electronic components. Thermal noise removal of micro-Newton thrust measurement in the torsion balance is a tricky problem, where the nonlinearity and hysteresis of temperature in the thrust output is hard to cope with. In addition to the analytical method to explore the mechanism of temperature action, it is easier to understand the thermal noise in terms of data stream of the system, such as ZDVF used to fit the thrust transfer function and filter the thermal noise in the original results. To enhance the correlation between thrust and temperature, a new fitting method based PID states extension and fine tree regression was proposed in the paper. The new algorithm showed a great potential in thermal noise decoupling, such as decreasing the peak thrust ASD of temperature variation or extracting the ESF’s 1.7 μN square wave from a thermal drift up to 7 μN. In essence, the projection to latent structure help find the linear thrust response of the temperature, and PID-FTR regression learning contributed to that. In the future, the focus of thermal noise decoupling is to enrich the diversity of training datasets, to enhance the transportability and computation efficiency of prediction models, and to guide the thermal control design based on low noise modes. The final goal is to keep the thrust ASD lower than 0.1 μN/Hz1/2 at 0.1 mHz, which may be retrieved via temperature-displacement two-stage control, including both in situ thermal stabilization with millikelvin precision and active control of residual thermal thrust noise decoupled by regression learning with sub-micro-Newton precision.
Author Contributions
Conceptualization, L.C. and C.Q.; methodology, L.C. and Y.L.; software, L.W.; investigation, H.W.; resources, C.Q.; data curation, L.C. and Q.L.; writing—original draft preparation, L.C.; supervision, C.Q.; project administration, J.M.; funding acquisition, Y.L. All authors have read and agreed to the published version of the manuscript.
Funding
This work was supported in part by the Strategic Priority Research Program of Chinese Academy of Sciences (CAS) under Contracts Nos. XDA1502070504, and the Major Scientific Instrument and Equipment Development Project of CAS under the Grants E0EK0201.
Institutional Review Board Statement
Not applicable.
Informed Consent Statement
Not applicable.
Data Availability Statement
Data will be available on request.
Conflicts of Interest
The authors declare no conflict of interest.
References
- Racca, G.D.; McNamara, P.W. The LISA Pathfinder Mission. Space Sci. Rev. 2010, 151, 159–181. [Google Scholar] [CrossRef]
- Hu, W.-R.; Wu, Y.-L. The Taiji Program in Space for gravitational wave physics and the nature of gravity. Natl. Sci. Rev. 2017, 4, 685. [Google Scholar] [CrossRef]
- Luo, Z.; Wang, Y.; Wu, Y.; Hu, W.; Jin, G. The Taiji program: A concise overview. Prog. Theor. Exp. Phys. 2020. [Google Scholar] [CrossRef]
- Xu, S.-Y.; Xu, L.-X.; Cong, L.-X.; Li, Y.-G.; Qiao, C.-F. First result of orbit verification of Taiji-1 hall micro thruster. Int. J. Mod. Phys. A 2021, 36, 2140013. [Google Scholar] [CrossRef]
- Ross, M.; Venkateswara, K.; Hagedorn, C.; Leupold, C.; Forsyth, P.; Wegner, J.; Shaw, E.; Lee, J.; Adelberger, E.; Gundlach, J. A Low-Frequency Torsion Pendulum with Interferometric Readout. Rev. Sci. Instrum. 2021. [Google Scholar] [CrossRef]
- Little, B.; Jugroot, M. Development of a microthrust balance and ion beam measurement system: Characterizing a dual-mode thruster for spacecraft. Vacuum 2019, 164, 367–380. [Google Scholar] [CrossRef]
- Wu, Y.-L.; Luo, Z.-R.; Wang, J.-Y.; Wang, J.; Bai, M.; Bian, W.; Cai, R.; Cai, Z.; Cao, J.; Chen, D.; et al. China’s first step towards probing the expanding universe and the nature of gravity using a space borne gravitational wave antenna. Commun. Phys. 2021, 4, 34. [Google Scholar] [CrossRef]
- Hey, F.G.; Keller, A.; Braxmaier, C.; Tajmar, M.; Johann, U.; Weise, D. Development of a Highly Precise Micronewton Thrust Balance. IEEE Trans. Plasma Sci. 2015, 43, 234–239. [Google Scholar] [CrossRef]
- Ryzhkov, S.V.; Kuzenov, V.V. New realization method for calculating convective heat transfer near the hypersonic aircraft surface. J. Appl. Math. Phys. 2019, 70, 46. [Google Scholar] [CrossRef]
- Huang, M.L.; Lin, Y.J. Regression Tree Model for Predicting Game Scores for the Golden State Warriors in the National Basketball Association. Symmetry 2020, 12, 835. [Google Scholar] [CrossRef]
- Kolbeck, J.; Porter, T.E.; Keidar, M. High Precision Thrust Balance Development at The George Washington. In Proceedings of the 35th International Electric Propulsion Conference, Atlanta, Georgia, 8–12 October 2017. IEPC-2017-405. [Google Scholar]
- Yang, C.; He, J.-W.; Duan, L.; Kang, Q. A torsional thrust stand for measuring the thrust response time of micro-Newton thrusters. J. Mod. Phys. A 2021, 36, 2140015. [Google Scholar] [CrossRef]
- Johnson, W.A.; Warne, L.K. Electrophysics of micromechanical comb actuators. J. Microelectromec. Syst. 1995, 4, 49–59. [Google Scholar] [CrossRef]
- Cheah, K.; Low, K.; Tran, Q. Measurement. Development of an Electrostatic Calibration System for a Torsional Micronewton Thrust Stand. IEEE Trans. Instrum. Meas. 2015, 64, 3467–3475. [Google Scholar] [CrossRef]
- Vaiana, N.; Losanno, D.; Ravichandran, N. A novel family of multiple springs models suitable for biaxial rate-independent hysteretic behavior. Comput. Struct. 2021, 244, 106403. [Google Scholar] [CrossRef]
- Harvey, P.S., Jr.; Gavin, H.P. Truly isotropic biaxial hysteresis with arbitrary knee sharpness. Earthq. Eng. Struct. Dyn. 2014, 43, 2051–2057. [Google Scholar] [CrossRef]
- Shah, N.A.; Dassios, I.; Chung, J.D. A Decomposition Method for a Fractional-Order Multi-Dimensional Telegraph Equation via the Elzaki Transform. Symmetry 2021, 13, 8. [Google Scholar] [CrossRef]
- Mekonnen, Y.S.; Schutt-Aine, J.E. Fast broadband macro modeling technique of sampled time/frequency data using z-domain vector-fitting method. In Proceedings of the 2008 58th Electronic Components and Technology Conference, Lake Buena Vista, FL, USA, 27–30 May 2008; pp. 1231–1235. [Google Scholar]
- Iacobelli, S.; Carstensen, B. Multiple time scales in multi-state models. Stat. Med. 2013, 32, 5315–5327. [Google Scholar] [CrossRef] [PubMed]
- Least Squares. The Concise Encyclopedia of Statistics; Springer: New York, NY, USA, 2008; p. 304. [Google Scholar]
- Neural Networks. Encyclopedia of Machine Learning and Data Mining; Sammut, C., Webb, G.I., Eds.; Springer: Boston, MA, USA, 2017; pp. 898–899, 974. [Google Scholar] [CrossRef]
- Haifeng, W.; Dejin, H. Comparison of SVM and LS-SVM for Regression. In Proceedings of the 2005 International Conference on Neural Networks and Brain, Beijing, China, 13–15 October 2005; pp. 279–283. [Google Scholar]
- Decision Tree. Encyclopedia of Database Systems; Liu, L., ÖZsu, M.T., Eds.; Springer: Boston, MA, USA, 2009; p. 765. [Google Scholar]
- Armano, M.; Audley, H.; Auger, G.; Baird, J.; Binetruy, P.; Born, M.; Bortoluzzi, D.; Brandt, N.; Bursi, A.; Caleno, M.; et al. In-flight thermal experiments for LISA Pathfinder: Simulating temperature noise at the Inertial Sensors. J. Phys. Conf. Ser. 2015, 610, 012023. [Google Scholar] [CrossRef] [Green Version]
Figure 1.
Overall structure design of torsion balance showing the flexural pivots, magnetic damper, capacitive sensor and ESF. Not shown is the windshield and PT1000 sensor.
Figure 1.
Overall structure design of torsion balance showing the flexural pivots, magnetic damper, capacitive sensor and ESF. Not shown is the windshield and PT1000 sensor.

Figure 2.
Synchronously collected temperature and displacement data.

Figure 3.
Spectral density of no-load thrust noise of torsion balance.

Figure 4.
Transfer and measurement logic of thermal disturbance.

Figure 5.
The 10-min cycle heating data recorded by different temperature sensors.

Figure 6.
Displacement output of torsion balance at different heating frequencies of PTC.

Figure 7.
Displacement and temperature variation by square wave modulations of ESF and PTC.

Figure 8.
Comparison of fitting results between SVD-LSR and PID-FTR.

Figure 9.
Thrust thermal noise decoupling with/without ESF.

Figure 10.
Thermal noise decoupled to find square wave signal.

Figure 11.
Open the ESF separately to output 1 μN square wave of electrostatic force.

Publisher’s Note: MDPI stays neutral with regard to jurisdictional claims in published maps and institutional affiliations. |
© 2021 by the authors. Licensee MDPI, Basel, Switzerland. This article is an open access article distributed under the terms and conditions of the Creative Commons Attribution (CC BY) license (https://creativecommons.org/licenses/by/4.0/).
Share and Cite
MDPI and ACS Style
Cong, L.; Mu, J.; Liu, Q.; Wang, H.; Wang, L.; Li, Y.; Qiao, C. Thermal Noise Decoupling of Micro-Newton Thrust Measured in a Torsion Balance. Symmetry 2021, 13, 1357. https://0-doi-org.brum.beds.ac.uk/10.3390/sym13081357
AMA Style
Cong L, Mu J, Liu Q, Wang H, Wang L, Li Y, Qiao C. Thermal Noise Decoupling of Micro-Newton Thrust Measured in a Torsion Balance. Symmetry. 2021; 13(8):1357. https://0-doi-org.brum.beds.ac.uk/10.3390/sym13081357
Chicago/Turabian StyleCong, Linxiao, Jianchao Mu, Qian Liu, Hao Wang, Linlin Wang, Yonggui Li, and Congfeng Qiao. 2021. "Thermal Noise Decoupling of Micro-Newton Thrust Measured in a Torsion Balance" Symmetry 13, no. 8: 1357. https://0-doi-org.brum.beds.ac.uk/10.3390/sym13081357
Note that from the first issue of 2016, this journal uses article numbers instead of page numbers. See further details here.