
Predicting the Intention to Donate Blood among Blood Donors Using a Decision Tree Algorithm


1
Administration Institute, Faculty of Economic and Administrative Sciences, Universidad Austral de Chile, Independencia 631, Valdivia 5110566, Chile
2
School of Engineering, Universidad Católica del Norte, Larrondo, Coquimbo 1781421, Chile
*
Author to whom correspondence should be addressed.
Symmetry 2021, 13(8), 1460; https://0-doi-org.brum.beds.ac.uk/10.3390/sym13081460
Submission received: 9 July 2021
/
Revised: 31 July 2021
/
Accepted: 8 August 2021
/
Published: 10 August 2021
(This article belongs to the Section Computer)
Abstract
:The blood donation process is essential for health systems. Therefore, the ability to predict donor flow has become relevant for hospitals. Although it is possible to predict this behaviour intention from donor questionnaires, the need to reduce social contact in pandemic settings leads to decreasing the extension of these surveys with the minimum loss of predictivity. In this context, this study aims to predict the intention to give blood again, among donors, based on a limited number of attributes. This research uses data science and learning concepts based on symmetry in a particular classification to predict blood donation intent. We carried out a face-to-face survey of Chilean donors based on the Theory of Planned Behaviour. These data, including control variables, were analysed using the decision tree technique. The results indicate that it is possible to predict the intention to donate blood again with an accuracy of 84.17% and minimal variables. The added scientific value of this article is to propose a more simplified way of measuring a multi-determined social phenomenon, such as the intention to donate blood again and the application of the decision tree technique to achieve this simplification, thereby contributing to the field of data science.
1. Introduction
Since the COVID-19 pandemic outbreak, tens of thousands of scientific papers have researched the associations with it, many of which use artificial intelligence and data science. For some authors, data science will be a crucial element in the global response to the pandemic [1]. According to Van der Aalst [2], data science is a cross-disciplinary field of transforming data into absolute values. Data can be structured or unstructured, large or small, static or dynamic. The value is provided in predictions, automated decisions, data models, or any data visualisation that gives information. This field can be considered a mix of classic disciplines such as statistics, data mining, databases, and distributed systems.
Data science techniques have been widely applied in past epidemics to help health professionals and authorities take better measures against the disease [3]. Today, data science applications tackle COVID-19 in three main phases: screening, tracking and forecasting, and medical aid [4]. In particular, the different use cases can be arranged in eight lines of application: assessing risk and prioritising patients; testing and diagnostics; simulating and modelling; contact tracing; comprehending social interventions; logistic planning and economic action; automated patient services; and supporting the development of vaccines and new therapies [1]
As part of the data science’s applications to support a pandemic response, prediction systems to improve the healthcare supply chain appear necessary. Furthermore, the changing and uncertain COVID-19 environment, and the need to maintain social distancing, are barriers to effective supply chain systems. In that context, data science-based cutting-edge technology plays a critical role in supply chain operations [5].
Managing the supply and demand for blood is central to the health care supply chain, as blood plays an essential role in saving lives. Blood supply forecasting is critical for making supply chain decisions, such as scheduling donation units, transportation policies and inventory management in transfusion centres and hospitals. For example, accurate forecasts of the timing and number of upcoming blood requests have been considered essential for donor recruitment decisions and inventory control [6]. Likewise, in the case of blood components with a short shelf-life, the importance of correctly predicting the demand enables minimising the loss of blood material, as in the case of platelets [7,8]. This example is part of optimising the blood supply control strategy and minimising the risk of over-supply in hospitals [9].
Recently a blood bank management system based on three integral aspects has been developed: (i) an accurate forecast of future blood unit needs and reducing the imbalance of supply and demand in the health sector; (ii) planning blood donation campaigns in an effective and timely manner; and (iii) ensuring a safe blood supply chain [10]. The blood supply chain involves three main sectors: hospitals, where doctors order blood transfusions for patients; the blood centre, a centralised location that receives requests from hospitals; and providers (blood donation sites), an entity that participates in donor management. Uncertainties related to blood donation and demand, the perishability of blood products, and different levels of blood supply chains are the attributes and factors that significantly impact blood management [11].
Predicting the need for blood material has become more difficult recently, due to the effect of the COVID-19 pandemic, because of the drastic changes in the health situation and behaviour of donors [12,13]. Overall, since the outbreak of COVID-19, the number of blood donors has declined. For instance, in Iran, the decline was 23% to 27%; this reduction was more significant for regular donors and male donors aged 25 to 34 [14]. In Washington State (USA), the blood donor decline was between 10 and 30%, in Canada it was 30% [15], and in Italy 10% [16]. At the beginning of COVID-19, blood demand decreased due to reduced surgeries and medical treatments offset this trend. However, the health services cannot maintain this reduction for long.
The top donation factors for maintaining an adequate blood supply during the COVID-19 pandemic, According to Stanworth et al. [15], can be highlighted: (i) donor recruitment; (ii) donor eligibility; (iii) blood drive planning; (iv) inventory management; (v) protection of staff and donors; (vi) availability of personnel; (vi) plasma for fractionation; and (vii) product safety. While the number of factors to consider when organising an effective donation has increased during the pandemic, donor recruitment and inviting regular donors and the general public to donate blood has proven to be an effective mechanism for replenishing the blood supply in this period [16,17]. Therefore, in parallel with the prediction of the demand for blood materials, the importance of predicting donor behaviour arises in order to know if a person is interested in donating again or not. This prediction may help personalise and optimise the appeal process for potential repeatable donors.
Decision trees have been used in studies related to the prediction of human blood donation [18,19,20,21,22]. A decision tree is a non-parametric technique that identifies a model that most closely corresponds to the relationship between the attribute set and the class label of the input data. Algorithm C4.5 is a particular case of this technique [23]. It is a popularly used data mining algorithm for classification purposes [24]. The algorithm builds the decision tree with a divide-and-conquer strategy [18]. C4.5 takes the training data and generates a single tree, optimising the use of energy and processing [25]. Although the decision tree technique based on C4.5 has been utilised in some studies related to human blood donation [18,21,22], no evidence has been found in the publications that analysed the prediction of blood donation in repeat donors.
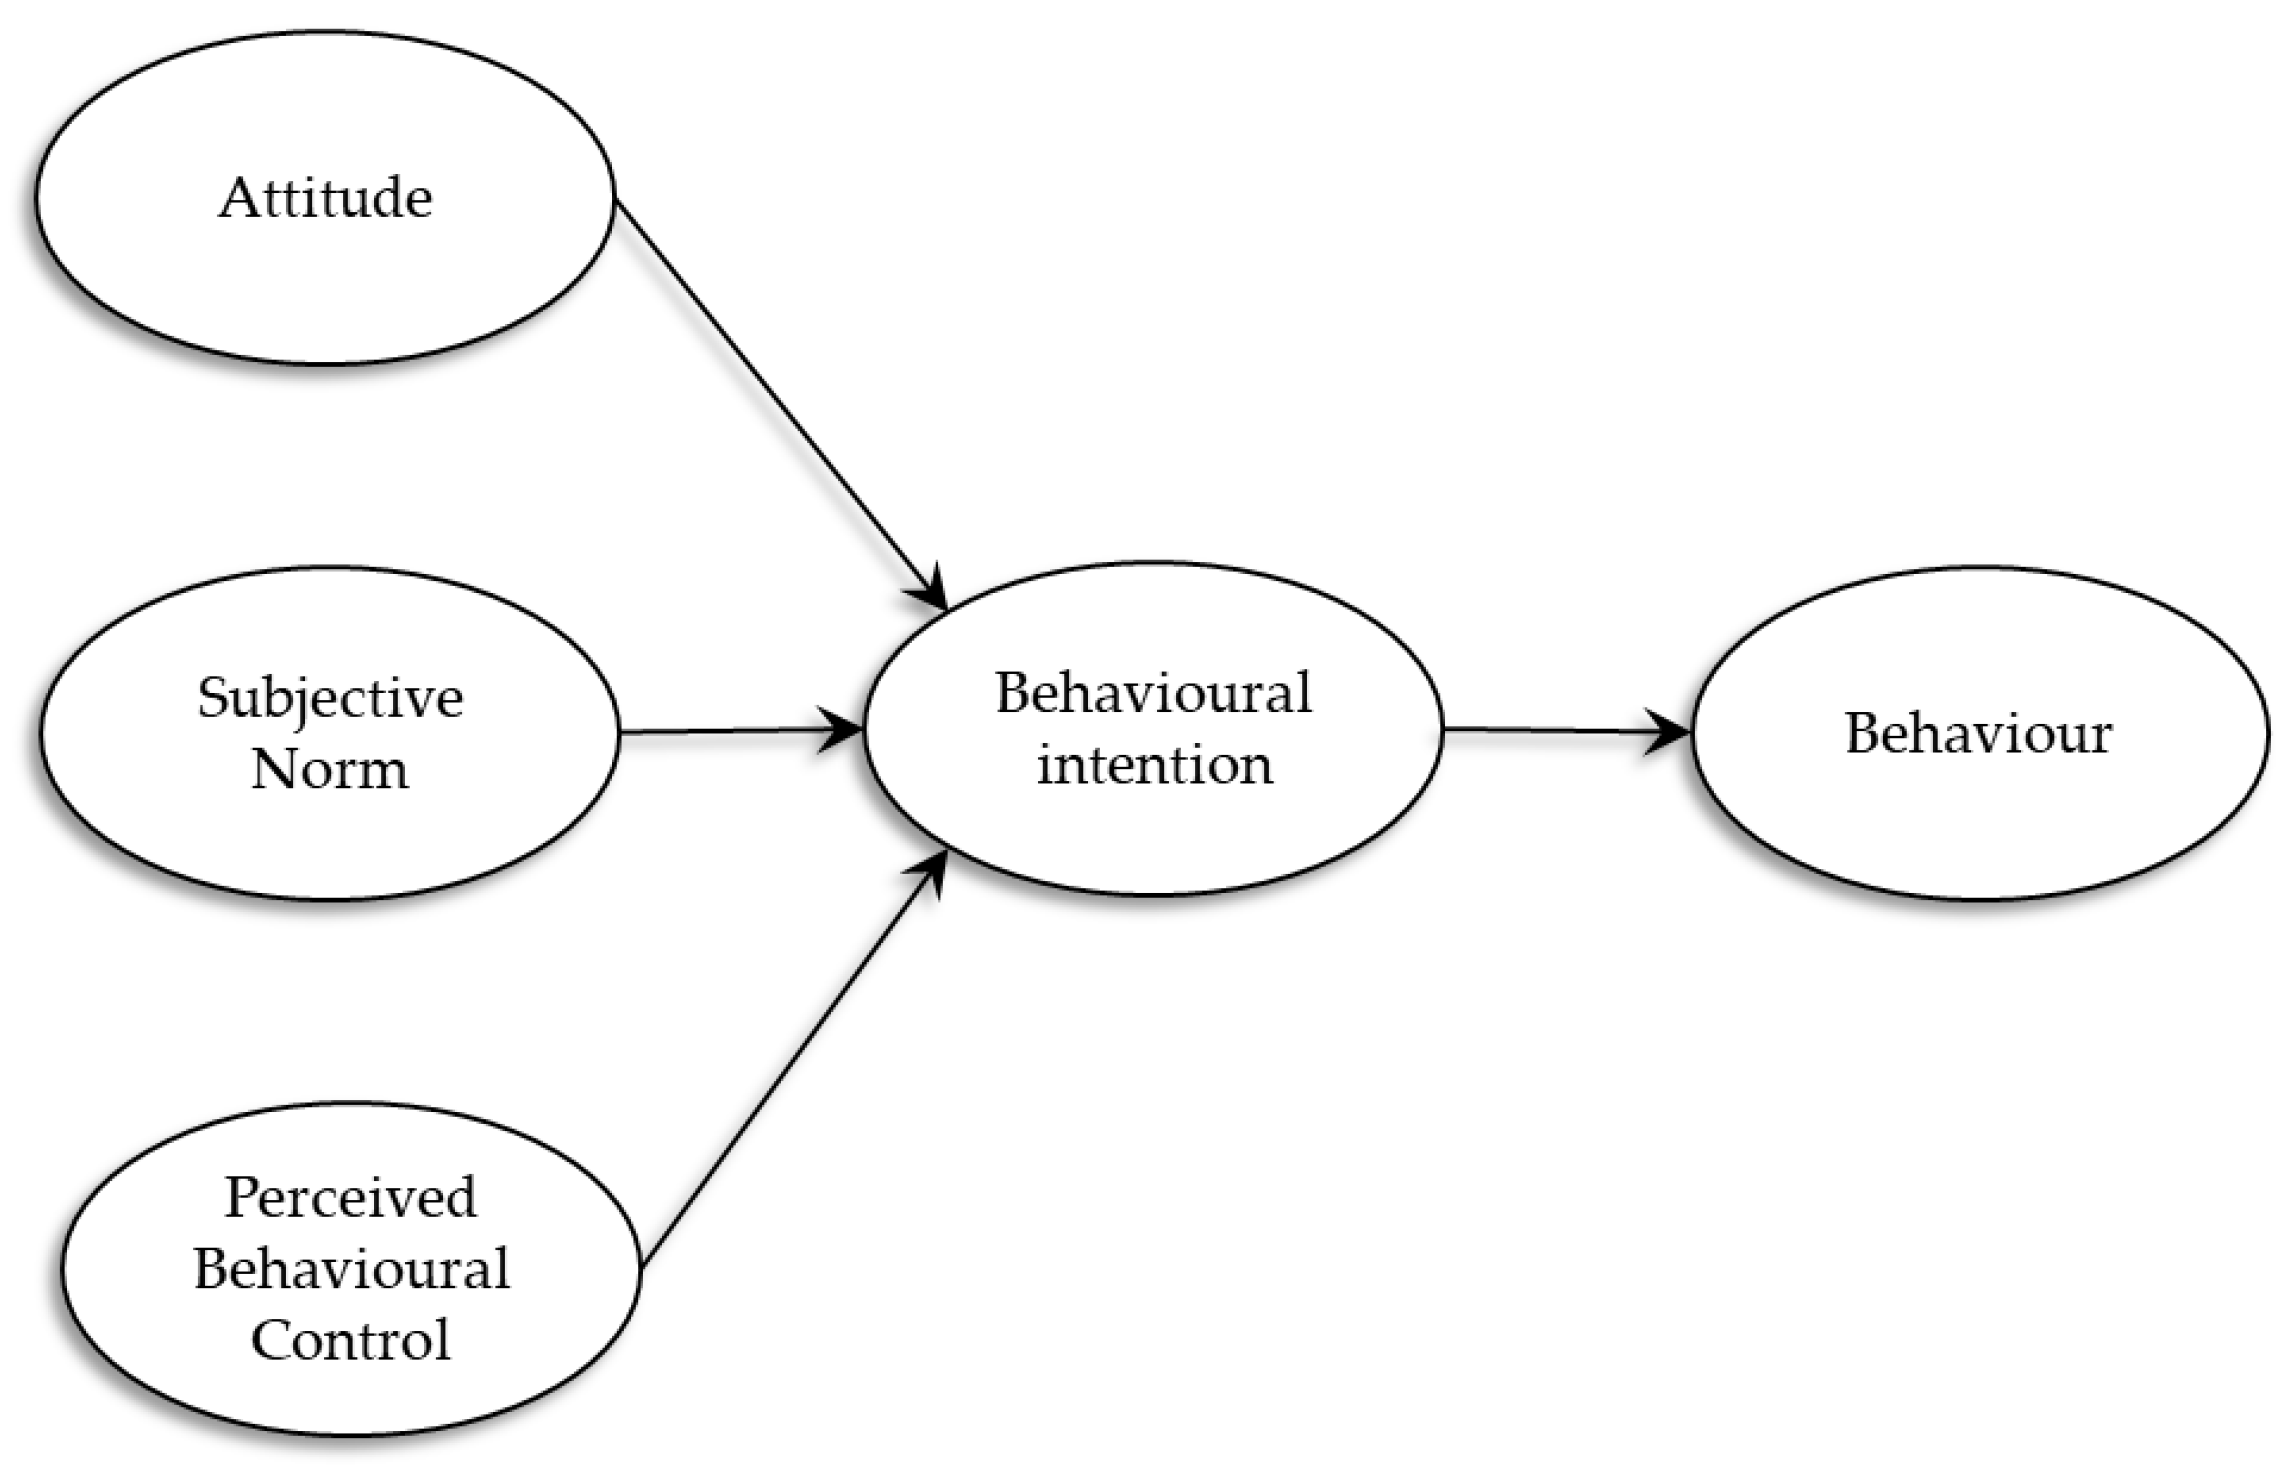
The theory of planned behaviour (TPB) was suggested by [26], in which there was an additional factor to the theory of reasoned action [27], and that factor was perceived behavioural control. As exhibited in Figure 1, TBP has three factors in the model that lead to intention and form the behaviour. Attitude (ATT, positive or negative assessments of a behaviour), subjective norm (SN, general perception of social pressure to adopt or not adopt a behaviour), and perceived behavioural control (PBC, perceived control over or a capacity to perform a behaviour). TPB has been widely used in several research topics. Recently, TPB has been used as a basis in studies on social phenomena in Latin America as examples to explain the intention to adopt electronic commerce by SMEs [28], to predict the purchase of products [29], and in the modelling of behaviours associated with public health, such as condom use [30] and telemedicine [31,32]. In these TPB applications, the behavioural intention is explained in a range from 35 to 85%, depending on the phenomenon studied. Regarding the three determinants of behavioural intention, all studies supported the effect of ATT. However, in some studies, the impacts of the SN or PBC are not supported.
In general, TPB has been used to model blood donation intent and behaviour [33]. For example, to determine the return behaviour of blood donors [34,35] and understand different underlying motives that influence the intention to perform voluntary blood donation [36,37,38,39,40]. Regarding re-donation behaviour, Wevers et al. [34] reported that the act of donating blood stimulates re-donation behaviour. However, the pressure exerted by the blood bank can affect this behaviour, so interventions that promote donor retention should be carried out to avoid forcing the behaviour of the individuals. In this vein, M’Sallem [35] indicates that internal motivation to re-donate prevails over external reasons and considers that blood donation centres can believe in their retention programmes, showing that both the ATT and the PBC affect the re-donate blood intention.
Giles and Cairns [41] first applied TBP in blood donation to examine the perceived behavioural control factor. They [41] demonstrated that the perception of control has an important impact on behavioural motivation. The subsequent research by [42] supported the results of [41]. It showed evidence for the inclusion of self-efficacy, moral norms and self-identity as other influential predictors. Self-efficacy comes from social cognitive theory; although it is conceptually similar to PBC [43], the main difference is operational. PBC is often evaluated by the ease or difficulty of the behaviour, whereas the individual’s confidence performs self-efficacy. Armitage and Conner [42] showed in an empirical study that self-efficacy is a significant predictor and has the highest impact on blood donation. Moreover, in another study [44], self-efficacy was the most significant predictor for blood donation. Moral norms consider “personal feelings of … responsibility to perform, or refuse to perform a certain behaviour” [42]. Furthermore, self-identity was proposed from identity theory by [42] as the extension of social norms while having a different interpretation. Social norms are supposed to be what we believe others want us to do, but self-identity reflects the individual’s perception of a particular social role. The more an individual perceives a role, the more impact their self-identity will have on intention [42]. When it comes to moral norms, it should be considered that they have a different concept from religious beliefs. Another study by [45] showed that religious beliefs among young donors significantly impact their intention to donate blood. An empirical study was conducted by [44] to study blood donation in young people. It turned out that self-efficacy, attitude and moral norms were the most influential correlates in producing an intention to become a blood donor. Contrary to previous studies, Robinson et al. [46] studied blood donation among nondonors. They proposed descriptive norms, donation anxiety and anticipated regret in addition to the previous predictors. Moral norms explain perceived moral duty; subjective norms describe perceived pressure from others. However, descriptive norms show the same as others [46]. Donation anxiety is defined as concern about needles, exposure to blood or pain [46]. Meanwhile, in another study by [47], donation anxiety focused more on fear, which plays a crucial role in anticipating donation intentions. Additionally, anticipated regret is an expectation of predicted future experience of regret considering anticipated future action. The result of [46] illustrated that all predictors were directly correlated with blood donation for nondonors except the subjective norm. In their research, Masser et al. [48] proposed a new framework to divide predictors in blood donors into direct and indirect factors. They introduced donation anxiety, moral norms and self-identity as indirect predictors for intention directly related to attitude. On the other hand, they presented attitude, subjective norms, self-efficacy and anticipated regret as direct predictors in their framework. Bednall et al. [28] reviewed 61 studies associated with blood donations from a broader perspective. They concluded that PBC, attitude, self-efficacy, role identity and anticipated regret are the strongest positive predictors. At the same time, moral norms, satisfaction and service quality have a medium impact on donor’s intentions. In 2011, Masser et al. [49] studied the donor’s behaviour in the emergence of an outbreak due to influenza in Australia. Based on their research, the impact of the outbreak on blood donation was scarce. However, in two low-risk and high-risk scenarios, attitude and subjective norm were influential. In low-risk scenarios, gender was an additional significant predictor, but in high-risk circumstances, this was PBC. With the advent of Covid-19, another article by [50] conducted an empirical investigation to find the most critical predictor concerning blood donors based on TPB and its extension. It turned out that trust in blood collection agencies anticipated a higher evaluation and, therefore, a more vital subjective norm. Thus, self-efficacy and subjective norms play a crucial role in predicting donors’ intention in the Covid-19 era. When it comes to trust, the feelings of trust were shown as attitudes to assess blood donation by using digital platforms [37].
In this context, this study aims to predict the intention of donors to give blood again based on a limited number of attributes. Given a set of variables used to predict behaviour based on a social science theory, the problem to be solved is to determine a smaller number of variables that can predict this behaviour. In general, this research process is an example of using data science and learning concepts based on symmetry for a particular classification and subsequent forecasting. The added scientific value of this article is to propose a more simplified way of measuring a multi-determined social phenomenon, such as the intention to donate blood again; the application of the decision tree technique to achieve this is a significant contribution to the field of data science.
We want to emphasise this study’s contributions. From the practical point of view, the contributions are related to improving information capture for predicting future blood donations, an event of fundamental importance given the context where this activity is carried out, and the current global health emergency. From the academic point of view, the main contribution of this work is associated with the application of a known data science technique in a novel way in social sciences, specifically, to determine a smaller number of attributes that predict behaviour based on a social theory that initially requires a larger number of attributes.
This paper is organised as follows. In Section 2, we describe the data collection procedure and techniques used to examine the data. We present the results of this data analysis in Section 3. Section 4 offers a discussion of these findings. Lastly, the final section gives a brief summary of the outcome of this paper.
2. Methods
2.1. Data
For the empirical study, a convenience sampling technique was used to gather the data of Chilean blood donors. The data were obtained through an in-person questionnaire for adult users in two health centres in Valdivia (Chile). In particular, a cross-section survey was conducted between March and April 2020. All surveys were conducted as a final action in the blood donation process. The respondents were maintained anonymous during the data collection process. According to standard socio-economic studies, there are no other ethical concerns than to preserve the participants’ anonymity. The scales were adapted from Jen and Hung. A 7-point Likert scale was used. Table 1 shows the items used to measure the study’s variables.
Using TPB modelling, the questionnaire was developed to obtain primary microdata. The research model has been tested using this data. This study meets the ethical standards of social research established by Universidad Austral de Chile (UACh, Valdivia, Chile) for its researchers. The health centres where the data were collected are associated with that institution. Moreover, as in other eHealth studies carried out by the leader of this research team [37], the study followed the Checklist for Reporting Results of Internet E-Surveys (CHERRIES) guidelines [51].
A total of 197 surveys were completed for this study. Most of the completed surveys were females (52%), and the average age was 32.1 years old. See Table 2 for more details of the distribution of the variables of interest.
2.2. Decision Tree Algorithm
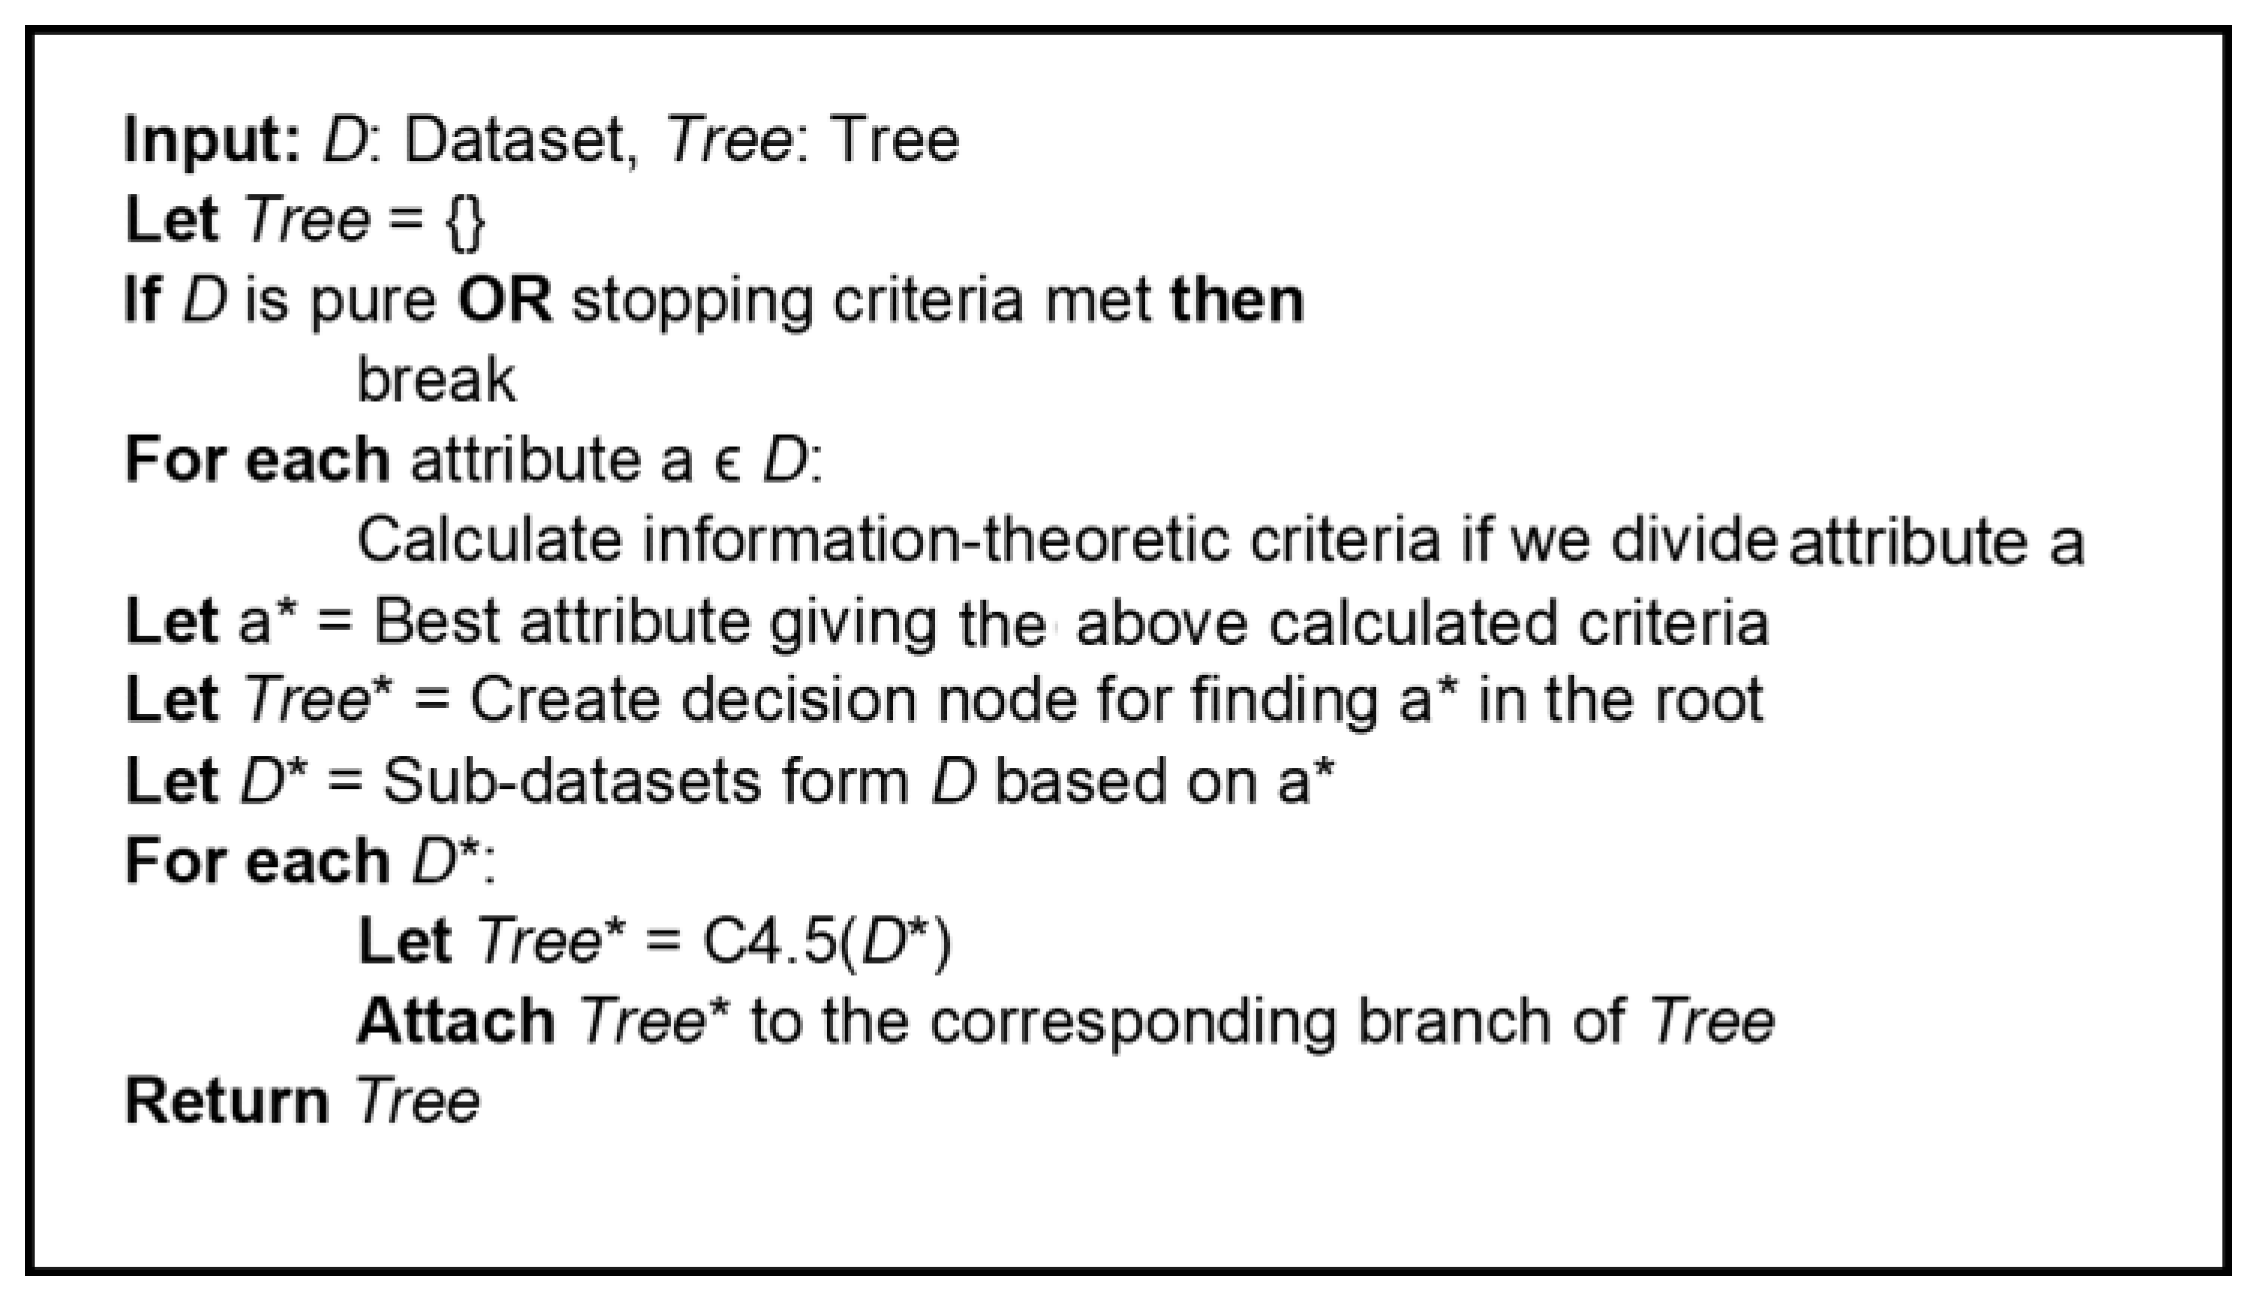
We used a decision tree algorithm to predict intended blood donation. A decision tree algorithm is a nonparametric technique that identifies a pattern that best matches the relationship between the attributes set and the class label of the input data. In this context, a decision tree refers to a reverse tree scheme consisting of nodes intended to decide the values affiliated to the class. According to [52], there are six reasons for using this method: (1) a decision tree does not require prior assumptions on the type of probabilistic distributions met by the class and other attributes; (2) regarding computational time, a decision tree is inexpensive and fast, even when the size of the training package is significant; (3) an interpreting decision tree, in particular smaller trees, requires less effort; (4) decision tree algorithms are quite robust to the presence of noise, particularly when methods to prevent overtaking are used; (5) the accuracy of a decision tree is not affected by highly correlated and irrelevant attributes during pretreatment, and; (6) the technique is useful for predictive modelling. Algorithm C4.5 is a particular case of this technique [23]. In accordance with [24] and [53], we detail C4.5 below. Given a dataset D, C4.5 initially grows a tree using the divide-to-conquer strategy as follows. If all cases in D belong to the same class, or D is small, the tree is a leaf tagged with the most common class in D. If not, a test is selected based on one attribute having two or more results. This test is made the root of the tree with a branch for each outcome of the test, then D is divided into corresponding subsets, depending on the result of each case, and the same procedure is applied recursively to each subset. C4.5 uses two heuristic criteria for classifying potential tests: information gain and gain ratio. The former criteria minimise the total entropy of the subsets, and the latter criteria divide the information gain by the information provided by the results test. Both criteria are based on an impurity function that is defined as symmetric with respect to the discrete probability vectors associated with each subset [54]. The attributes may be numeric or nominal, and this determines the format of the test results. For a numerical attribute a, they are {a ≤ l, a > l}. The level l is found by sorting D from the values of a and choosing the distribution among successive values that maximise the above criterion. An attribute with discrete values has a result for each value or the values to be grouped into two or multiple subsets with a result for each subset. To avoid overfitting, the original tree is then pruned. This procedure is based on a pessimistic estimation of the error rate associated with a set of M cases, of which E does not belong to the most common category. C4.5 determines the upper limit of binomial likelihood when E events have been observed in M tests, using a specified confidence. Figure 2 shows the pseudocode of the C4.5 algorithm.
3. Results
The intention to donate blood in the next six months was calculated as follows. First, we determined the average of the items associated with the donation intention variable. Then this average was classified into three levels, the “no” level being a value between one and two, the “maybe” level being a value greater than two but less than five, and the “yes” level being a value greater than five. The attributes used to generate the prediction model were the items associated with the latent variables of the TPB model that explain the behavioural intention. Additionally, the control variables that were considered are: age, education, reason for donation and number of previous donations.
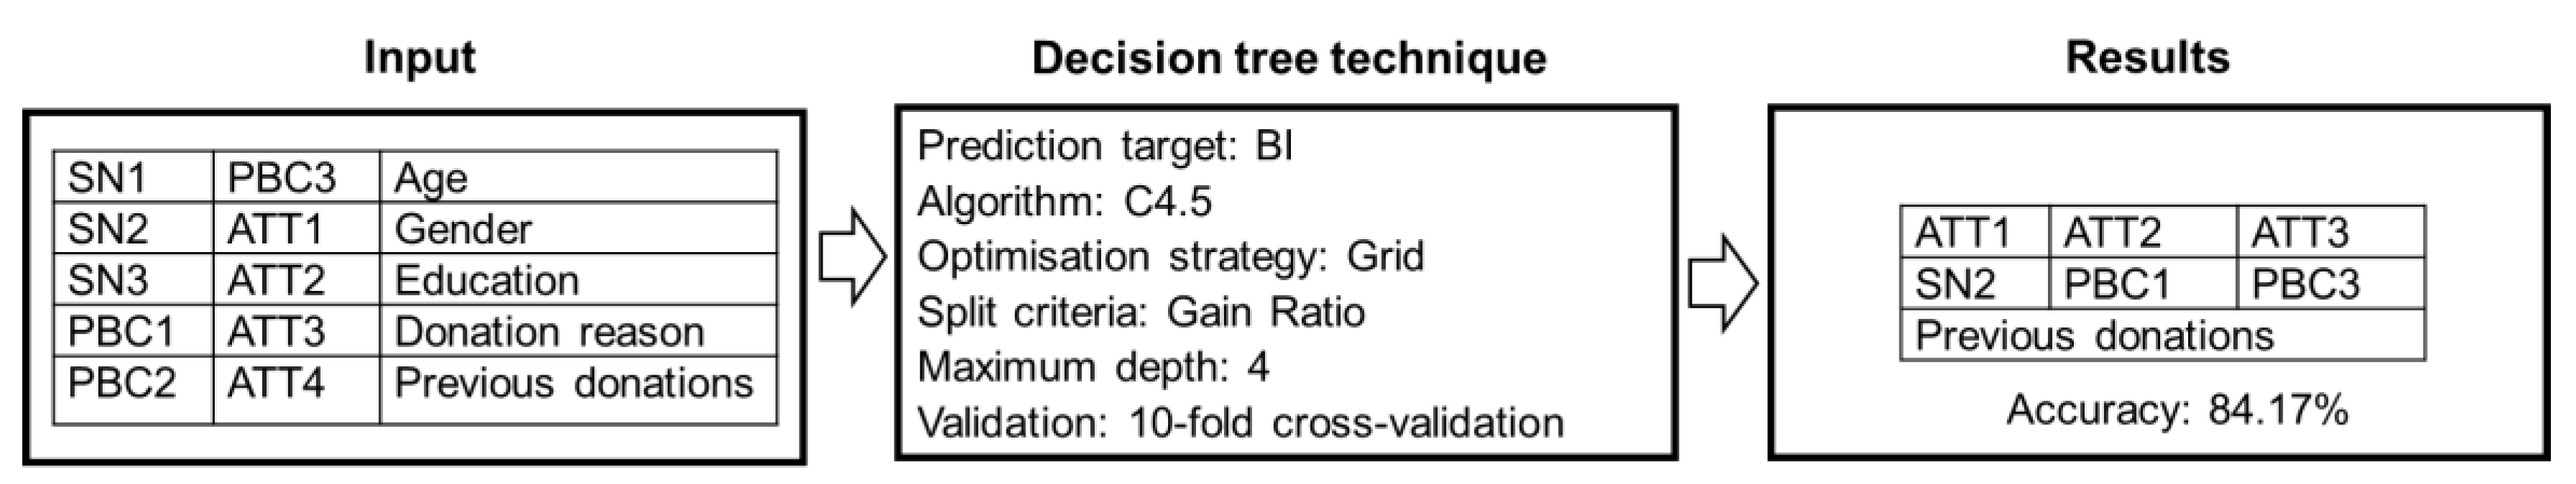
To implement the decision tree algorithm, we used the C4.5 algorithm, which builds decision trees based on a collection of training data using information entropy [55]. A grid optimisation strategy was used as a procedure to adjust parameters related to division and shutdown criteria. The split criteria assessed were information gain, gain ratio, the Gini index and accuracy. The method specifies the gain ratio as the dividing criterion and value four as the maximum depth. The analyses were performed using 10-fold cross-validation to prevent overfitting. The cross-validation process involves two stages. The first stage produces a model, and after that, the second stage applies the former model and measures its performance. For cross-validation by 10, the procedure splits the data sample into ten subsets of equal size. Out of the ten subsets, the method preserves a single subset as test data, and the other nine subsets are used as instruction data. This process is repeated ten times, and each of the ten subassemblies are used once as test data. Finally, the process averages the results of the ten iterations to produce an estimation. Table 3 details a description of the procedure parameters.
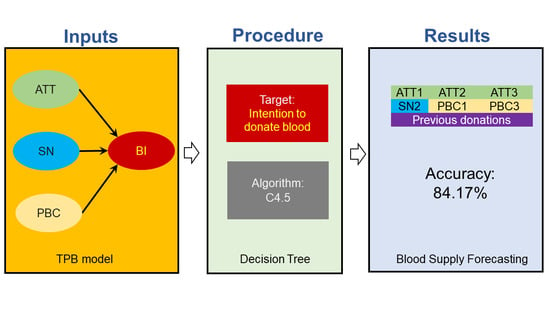
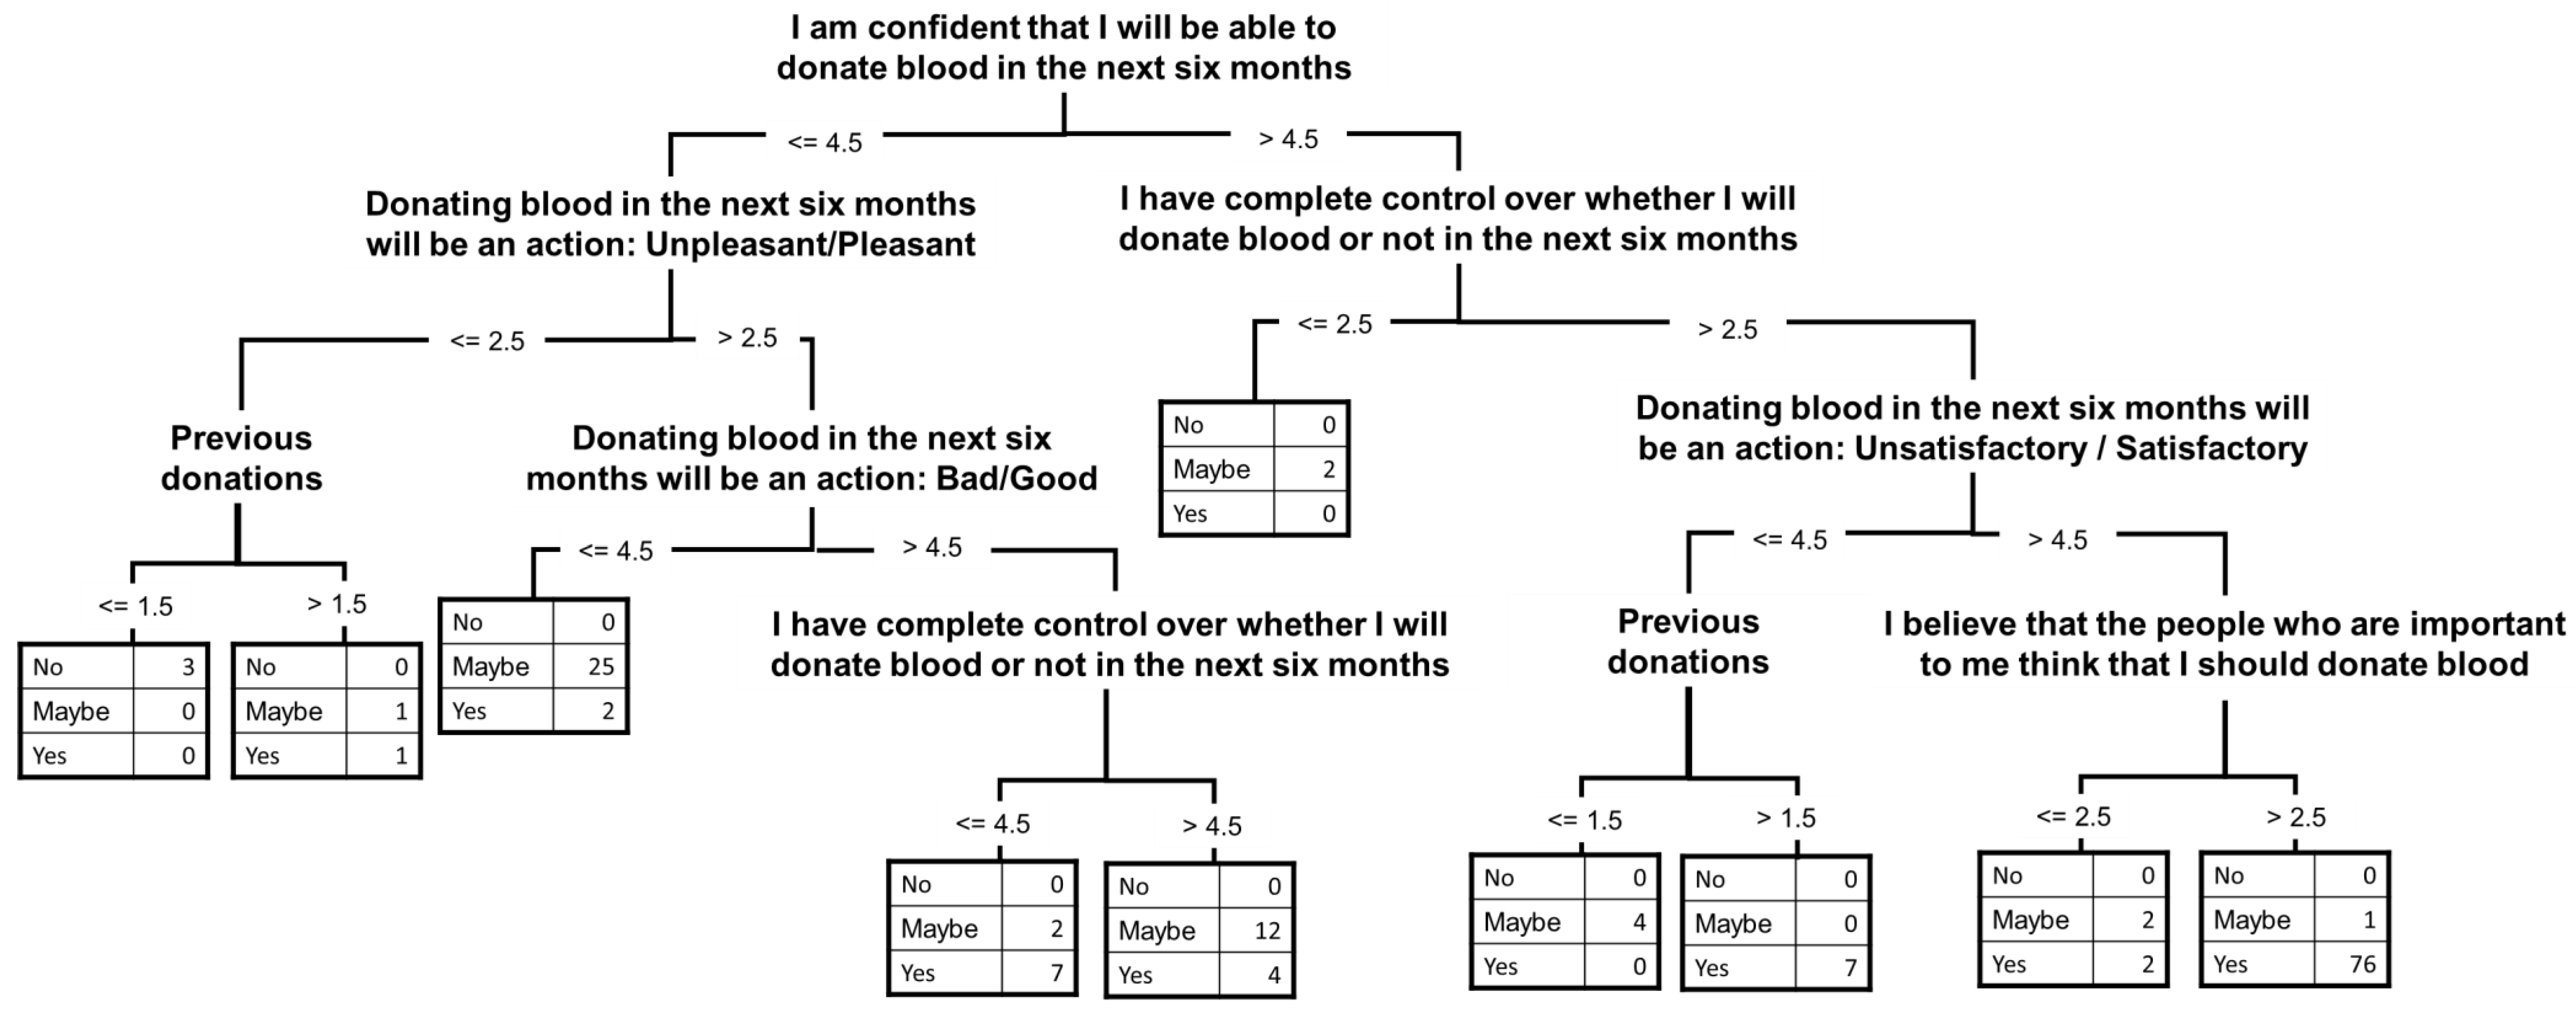
Figure 3 shows the results for blood donation intention. The attributes required for the prediction model are PBC1, PBC3, ATT1, ATT2, ATT3, SN2, and previous donations.
4. Discussion
As far as we know, there are no studies in the literature that predict the intention to re-donate among blood donors. Nevertheless, using data science, a recent study explores intending to donate or non-donate among nondonors from India [56]. The present study’s accuracy of 84.17% can be positively compared with the 70.37% of the previous one. We believe that using a theoretical model as a basis generates this improvement in prediction.
The attributes that the prediction model uses are associated with the three antecedents of the TPB. According to these findings, items of the PBC and ATT variables emerge as stronger predictors, consistent with other studies among blood donors [48,57]. These results suggest that for experienced donors, blood donation remains a behaviour that is, at least in part, a rational decision. On the other hand, the item associated with SN shows that this variable has some importance in determining the intention to donate in experienced donors, which is in line with previous studies [58].
Of the control variables used as predictors, only previous donations were helpful. Education level, age, gender or the primary reason for donating do not predict the intention for experienced donors to repeat donate. However, previous donations emerge in the model as an essential attribute in the prediction. Blood donors who previously have donated blood are more likely to donate blood in the future. In line with Guglielmetti Mugion et al. [57], this variable may represent the lower presence of inhibitors such as fear or lack of information on the transparency of the process.
Although the literature indicates that artificial intelligence-based systems have achieved significant success in healthcare since 2016 [59], the prediction associated with blood donation has not been an area with significant development. We believe that this study provides a significant advance. In particular, this study has three practical implications. First, the result of this study implies a minimisation of the number of questions and, therefore, the response time for people who donate. Clearly, this will cause a higher percentage of survey completion and the possibility of improving blood management planning. Second, the registry of donation intentions will allow customisation, targeting and the development of attractive and appealing practices. So, there will be an increase of the people who intend to repeat blood donation, voluntarily and altruistically, thereby raising the availability of blood. Finally, a reduction in costs derived from contacting people who wish to donate blood, and in general from the blood management system, is expected, thanks to the two previous implications.
5. Conclusions
Prediction systems to improve the healthcare supply chain are necessary for the changing and uncertain environment of COVID-19. In that sense, blood supply forecasting is critical to making supply chain decisions and can help personalise and optimise the process for potential donors. In the past, the TPB has been used to predict blood donations, but the data collection time is currently critical. Therefore, the decrease in these times permits data capture and enables donation prediction. Thus, the research objective of this study was to predict the intention to repeat blood donations amongst donors based on a limited number of attributes. These data were analysed using the decision tree technique.
The experiment results indicate that it is possible to predict the intention to repeat blood donations with an accuracy of 84.17%, using only seven variables. Furthermore, the findings reveal that the attributes used by the prediction model are associated with the three antecedents of the TPB. According to these findings, items of the PBC and ATT variables emerge as the strongest predictors.
Some limitations that must be taken into account in the present study are related to the sample size and the donors’ culture. The sample size limitation does not allow generalising this result to the whole population. Furthermore, the sample donors’ culture does not apply these findings to a country with a different culture. In future studies, it will be helpful to carry out a replication of the procedure in a bigger sample and study different cultures (for example, with other religious beliefs). Additionally, future research should apply the decision tree technique in other areas of social sciences to determine a smaller number of attributes that predict behaviour based on an established theory, such as predicting learning styles based on the Felder-Silverman learning style model [60] or predicting the purchase of products or services based on the reasoned action theory [27].
Author Contributions
Conceptualisation, C.S.-C. and P.R.-C.; methodology, P.R.-C.; software, C.S.-C. and P.R.-C.; validation, P.R.-C. and C.S.-C.; formal analysis, P.R.-C. and C.S.-C.; investigation, P.R.-C. and C.S.-C.; resources, P.R.-C. and C.S.-C.; data curation, C.S.-C. and P.R.-C.; writing—original draft preparation, C.S.-C. and P.R.-C.; writing—review and editing, P.R.-C.; visualisation, P.R.-C. and P.R.-C.; supervision, P.R.-C.; project administration, P.R.-C.; funding acquisition, C.S.-C. and P.R.-C. All authors have read and agreed to the published version of the manuscript.
Funding
This research was partially funded by Universidad Austral de Chile (CHILE) and Universidad Católica del Norte (CHILE) and supported by ANID-Chile, through the FONDECYT program, grant no. 1210130.
Institutional Review Board Statement
Ethical review and approval were waived for this study because all the data used involving research on human subjects have been published before.
Informed Consent Statement
Informed consent was obtained from all subjects involved in the study.
Data Availability Statement
The data presented in this study are available on request from the corresponding author.
Conflicts of Interest
The authors declare no conflict of interest.
References
- Latif, S.; Usman, M.; Manzoor, S.; Iqbal, W.; Qadir, J.; Tyson, G.; Castro, I.; Razi, A.; Kamel Boulos, M.N.; Weller, A.; et al. Leveraging Data Science to Combat COVID-19: A Comprehensive Review. IEEE Trans. Artif. Intell. 2020, 1, 85–103. [Google Scholar] [CrossRef]
- Van der Aalst, W. Process mining: Data science in action. In Process Mining: Data Science in Action; Springer: Berlin/Heidelberg, Germany, 2016; pp. 1–467. ISBN 9783662498514. [Google Scholar]
- Adar, E.; Adamic, L.A. Tracking information epidemics in blogspace. In Proceedings of the IEEE Proceedings—2005 IEEE/WIC/ACM International Conference on Web Intelligence, WI 2005, Compiegne, France, 19–22 September 2005; Volume 2005, pp. 207–214. [Google Scholar]
- Shahid, O.; Nasajpour, M.; Pouriyeh, S.; Parizi, R.M.; Han, M.; Valero, M.; Li, F.; Aledhari, M.; Sheng, Q.Z. Machine learning research towards combating COVID-19: Virus detection, spread prevention, and medical assistance. J. Biomed. Inform. 2021, 117, 103751. [Google Scholar] [CrossRef]
- Schatteman, O.; Woodhouse, D.; Terino, J. Supply Chain Lessons from Covid-19: Time to Refocus on Resilience. Bain Co. 2020, 1–8. Available online: https://supplychainasia.org/wp-content/uploads/2016/03/bain-brief-supply-chain-lessons-from-covid-19.pdf?__cf_chl_jschl_tk__=pmd_431801601e87c861e8107856a41518f84524b4ad-1628560194-0-gqNtZGzNAjijcnBszQX6 (accessed on 7 July 2021).
- Shih, H.; Rajendran, S. Comparison of Time Series Methods and Machine Learning Algorithms for Forecasting Taiwan Blood Services Foundation’s Blood Supply. J. Healthc. Eng. 2019, 2019, 6123745. [Google Scholar] [CrossRef]
- Rajendran, S.; Ravindran, A.R. Platelet ordering policies at hospitals using stochastic integer programming model and heuristic approaches to reduce wastage. Comput. Ind. Eng. 2017, 110, 151–164. [Google Scholar] [CrossRef]
- Rajendran, S.; Ravi Ravindran, A. Inventory management of platelets along blood supply chain to minimize wastage and shortage. Comput. Ind. Eng. 2019, 130, 714–730. [Google Scholar] [CrossRef]
- Li, N.; Chiang, F.; Down, D.G.; Heddle, N.M. A decision integration strategy for short-term demand forecasting and ordering for red blood cell components. Oper. Res. Health Care 2021, 29, 100290. [Google Scholar] [CrossRef]
- Sandaruwan, P.A.J.; Dolapihilla, U.D.L.; Karunathilaka, D.W.N.R.; Wijayaweera, W.A.D.T.L.; Rankothge, W.H.; Gamage, N.D.U. Towards an Efficient and Secure Blood Bank Management System. In Proceedings of the 2020 IEEE 8th R10 Humanitarian Technology Conference (R10-HTC), Kuching, Malaysia, 1–3 December 2020; pp. 1–6. [Google Scholar]
- Shih, H.; Rajendran, S. Stochastic Inventory Model for Minimizing Blood Shortage and Outdating in a Blood Supply Chain under Supply and Demand Uncertainty. J. Healthc. Eng. 2020, 2020, 8881751. [Google Scholar] [CrossRef]
- Haw, J.; Holloway, K.; Masser, B.M.; Merz, E.-M.; Thorpe, R. Blood donation and the global COVID-19 pandemic: Areas for social science research. Vox Sang. 2021, 116, 363–365. [Google Scholar] [CrossRef] [PubMed]
- Gupta, A.M.; Ojha, S.; Nagaraju, P.; Poojary, M.; SH, S.; Sathyan, V.; Ansari, A. Impact of the novel coronavirus disease and lockdown on the packed red blood cells inventory management: An experience from a tertiary care oncology center in Western India. Hematol. Transfus. Cell Ther. 2021, 43, 126–132. [Google Scholar] [CrossRef] [PubMed]
- Rafiee, M.H.; Kafiabad, S.A.; Maghsudlu, M. Analysis of blood donors’ characteristics and deferrals related to COVID-19 in Iran. Transfus. Apher. Sci. 2021, 60, 103049. [Google Scholar] [CrossRef]
- Stanworth, S.J.; New, H.V.; Apelseth, T.O.; Brunskill, S.; Cardigan, R.; Doree, C.; Germain, M.; Goldman, M.; Massey, E.; Prati, D.; et al. Effects of the COVID-19 pandemic on supply and use of blood for transfusion. Lancet Haematol. 2020, 7, e756–e764. [Google Scholar] [CrossRef]
- Franchini, M.; Farrugia, A.; Velati, C.; Zanetti, A.; Romanò, L.; Grazzini, G.; Lopez, N.; Pati, I.; Marano, G.; Pupella, S.; et al. The impact of the SARS-CoV-2 outbreak on the safety and availability of blood transfusions in Italy. Vox Sang. 2020, 115, 603–605. [Google Scholar] [CrossRef] [PubMed] [Green Version]
- Leung, J.N.S.; Lee, C.-K. Impact of the COVID-19—A regional blood centre’s perspective. ISBT Sci. Ser. 2020, 15, 362–364. [Google Scholar] [CrossRef]
- Khalilinezhad, M.; Minaei, B.; Vernazza, G.; Dellepiane, S. Prediction of healthy blood with data mining classification by using Decision Tree, Naive Baysian and SVM approaches. In Proceedings of the Sixth International Conference on Graphic and Image Processing, Beijing, China, 24–26 October 2015; Volume 9443, pp. 1–10. [Google Scholar]
- Boonyanusith, W.; Jittamai, P. Blood Donor Classification Using Neural Network and Decision Tree Techniques. In Proceedings of the World Congress on Engineering and Computer Science, San Francisco, CA, USA, 24–26 October 2012; pp. 1–5. [Google Scholar]
- Khalid, N.S.C.; Burhanuddin, M.A.; Asmala, A.; Ghani, M. Classification Techniques in Blood Donors Sector—A Survey. In Proceedings of the e-Proceeding of Software Engineering Postgraduates Workshop (SEPoW) 2013, Melaka, Malaysia, 19 November 2013; pp. 114–118. [Google Scholar]
- Alajrami, E.; Abu-Nasser, B.S.; Khalil, A.; Musleh, M.M.; Barhoom, A.M.; Naser, S.A. Blood Donation Prediction using Artificial Neural Network. Int. J. Acad. Eng. Res. 2019, 3, 1–7. [Google Scholar]
- Wahono, H.; Riana, D. Prediksi Calon Pendonor Darah Potensial Dengan Algoritma Naïve Bayes, K-Nearest Neighbors dan Decision Tree C4.5. J. Ris. Komput. 2020, 7, 7–14. [Google Scholar] [CrossRef]
- Singer, G.; Ratnovsky, A.; Naftali, S. Classification of severity of trachea stenosis from EEG signals using ordinal decision-tree based algorithms and ensemble-based ordinal and non-ordinal algorithms. Expert Syst. Appl. 2021, 173, 114707. [Google Scholar] [CrossRef]
- Wu, X.; Kumar, V.; Ross, Q.J.; Ghosh, J.; Yang, Q.; Motoda, H.; McLachlan, G.J.; Ng, A.; Liu, B.; Yu, P.S.; et al. Top 10 algorithms in data mining. Knowl. Inf. Syst. 2008, 14, 1–37. [Google Scholar] [CrossRef] [Green Version]
- Tanyu, B.F.; Abbaspour, A.; Alimohammadlou, Y.; Tecuci, G. Landslide susceptibility analyses using Random Forest, C4.5, and C5.0 with balanced and unbalanced datasets. CATENA 2021, 203, 105355. [Google Scholar] [CrossRef]
- Ajzen, I. The theory of planned behavior. Organ. Behav. Hum. Decis. Process. 1991, 50, 179–211. [Google Scholar] [CrossRef]
- Fishbein, M. A theory of reasoned action: Some applications and implications. Neb. Symp. Motiv. 1980, 27, 65–116. [Google Scholar]
- Grandón, E.; Ramirez-Correa, P.E. Managers/Owners’ Innovativeness and Electronic Commerce Acceptance in Chilean SMEs: A Multi-Group Analysis Based on a Structural Equation Model. J. Theor. Appl. Electron. Commer. Res. 2018, 13, 1–16. [Google Scholar] [CrossRef] [Green Version]
- Ramírez-Correa, P.; Rondán-Cataluña, F.J.; Moulaz, M.T.; Arenas-Gaitán, J. Purchase intention of specialty coffee. Sustainability 2020, 12, 1329. [Google Scholar] [CrossRef] [Green Version]
- Ramírez-Correa, P.; Ramírez-Santana, M. Predicting condom use among undergraduate students based on the theory of planned behaviour, Coquimbo, Chile, 2016. Int. J. Environ. Res. Public Health 2018, 15, 1689. [Google Scholar] [CrossRef] [Green Version]
- Ramírez-Rivas, C.; Alfaro-Pérez, J.; Ramírez-Correa, P.; Mariano-Melo, A. Predicting Telemedicine Adoption: An Empirical Study on the Moderating Effect of Plasticity in Brazilian Patients. J. Inf. Syst. Eng. Manag. 2021, 6, em0135. [Google Scholar]
- Ramírez-Correa, P.; Ramírez-Rivas, C.; Alfaro-Pérez, J.; Melo-Mariano, A. Telemedicine acceptance during the COVID-19 pandemic: An empirical example of robust consistent partial least squares path modeling. Symmetry 2020, 12, 1593. [Google Scholar] [CrossRef]
- France, J.L.; Kowalsky, J.M.; France, C.R.; McGlone, S.T.; Himawan, L.K.; Kessler, D.A.; Shaz, B.H. Development of common metrics for donation attitude, subjective norm, perceived behavioral control, and intention for the blood donation context. Transfusion 2014, 54, 839–847. [Google Scholar] [CrossRef]
- Wevers, A.; Wigboldus, D.H.J.; van Baaren, R.; Veldhuizen, I.J.T. Return behavior of occasional and multigallon blood donors: The role of theory of planned behavior, self-identity, and organizational variables. Transfusion 2014, 54, 805–813. [Google Scholar] [CrossRef] [PubMed]
- M’Sallem, W. Role of motivation in the return of blood donors: Mediating roles of the socio-cognitive variables of the theory of planned behavior. Int. Rev. Public Nonprofit Mark. 2021. [Google Scholar] [CrossRef]
- Saha, S.; Chandra, B. Understanding the underlying motives and intention among Indian blood donors towards voluntary blood donation: A cross-sectional study. Transfus. Clin. Biol. 2018, 25, 109–117. [Google Scholar] [CrossRef]
- Torrent-Sellens, J.; Salazar-Concha, C.; Ficapal-Cusí, P.; Saigí-Rubió, F. Using digital platforms to promote blood donation: Motivational and preliminary evidence from Latin America and Spain. Int. J. Environ. Res. Public Health 2021, 18, 4270. [Google Scholar] [CrossRef]
- Jouybari, T.A.; Jalilian, F.; Mirzaei-Alavijeh, M.; Karami-Matin, B.; Mahboubi, M.; Aghaei, A. Prevalence, Socio-Cognitive and Demographic Determinants of Blood Donation. Int. J. Adv. Biotechnol. Res. 2016, 7, 1534–1539. [Google Scholar]
- Aschale, A.; Fufa, D.; Kekeba, T.; Birhanu, Z. Intention to voluntary blood donation among private higher education students, Jimma town, Oromia, Ethiopia: Application of the theory of planned behaviour. PLoS ONE 2021, 16, e0247040. [Google Scholar] [CrossRef]
- Lim, B.C.; Chew, K.Y.; Tay, S.L. Understanding healthcare worker’s intention to donate blood: An application of the theory of planned behaviour. Psychol. Health Med. 2021. [Google Scholar] [CrossRef]
- Giles, M.; Cairns, E. Blood donation and Ajzen’s theory of planned behaviour: An examination of perceived behavioural control. Br. J. Soc. Psychol. 1995, 34, 173–188. [Google Scholar] [CrossRef]
- Armitage, C.J.; Conner, M. Social cognitive determinants of blood donation. J. Appl. Soc. Psychol. 2001, 31, 1431–1457. [Google Scholar] [CrossRef]
- Giles, M.; McClenahan, C.; Cairns, E.; Mallet, J. An application of the Theory of Planned Behaviour to blood donation: The importance of self-efficacy. Health Educ. Res. 2004, 19, 380–391. [Google Scholar] [CrossRef] [Green Version]
- Lemmens, K.P.H.; Abraham, C.; Hoekstra, T.; Ruiter, R.A.C.; De Kort, W.L.A.M.; Brug, J.; Schaalma, H.P. Why don’t young people volunteer to give blood? An investigation of the correlates of donation intentions among young nondonors. Transfusion 2005, 45, 945–955. [Google Scholar] [CrossRef] [PubMed]
- Charseatd, P. Role of religious beliefs in blood donation behavior among the youngster in Iran: A theory of planned behavior perspective. J. Islam. Mark. 2016, 7, 250–263. [Google Scholar] [CrossRef]
- Robinson, N.G.; Masser, B.M.; White, K.M.; Hyde, M.K.; Terry, D.J. Predicting intentions to donate blood among nondonors in Australia: An extended theory of planned behavior. Transfusion 2008, 48, 2559–2567. [Google Scholar] [CrossRef] [Green Version]
- Gilchrist, P.T.; Masser, B.M.; Horsley, K.; Ditto, B. Predicting blood donation intention: The importance of fear. Transfusion 2019, 59, 3666–3673. [Google Scholar] [CrossRef]
- Masser, B.M.; White, K.M.; Hyde, M.K.; Terry, D.J.; Robinson, N.G. Predicting blood donation intentions and behavior among Australian blood donors: Testing an extended theory of planned behavior model. Transfusion 2009, 49, 320–329. [Google Scholar] [CrossRef] [Green Version]
- Masser, B.M.; White, K.M.; Hamilton, K.; McKimmie, B.M. An examination of the predictors of blood donors’ intentions to donate during two phases of an avian influenza outbreak. Transfusion 2011, 51, 548–557. [Google Scholar] [CrossRef] [PubMed] [Green Version]
- Masser, B.M.; Hyde, M.K.; Ferguson, E. Exploring predictors of Australian community members’ blood donation intentions and blood donation–related behavior during the COVID-19 pandemic. Transfusion 2020, 60, 2907–2917. [Google Scholar] [CrossRef] [PubMed]
- Eysenbach, G. Improving the quality of web surveys: The Checklist for Reporting Results of Internet E-Surveys (CHERRIES). J. Med. Internet Res. 2004, 6, e132. [Google Scholar] [CrossRef] [PubMed]
- Tan, P.N.; Steinbach, M.; Kumar, M. Introduction to Data Mining; Pearson Education: London, UK, 2016. [Google Scholar]
- Rojas-Córdova, C.; Heredia-Rojas, B.; Ramírez-Correa, P. Predicting Business Innovation Intention Based on Perceived Barriers: A Machine Learning Approach. Symmetry 2020, 12, 1381. [Google Scholar] [CrossRef]
- Lee, V.E.; Liu, L.; Jin, R. Decision trees: Theory and algorithms. In Data Classification; Chapman and Hall/CRC: Boca Raton, FL, USA, 2014; pp. 115–148. ISBN 0429102631. [Google Scholar]
- Salzberg, S.L. C4.5: Programs for Machine Learning by J. Ross Quinlan. Morgan Kaufmann Publishers, Inc., 1993. Mach. Learn. 1994, 16, 235–240. [Google Scholar] [CrossRef] [Green Version]
- Pabreja, K.; Bhasin, A. A Predictive Analytics Framework for Blood Donor Classification. Int. J. Big Data Anal. Healthc. 2021, 6, 1–14. [Google Scholar] [CrossRef]
- Guglielmetti Mugion, R.; Pasca, M.G.; Di Di Pietro, L.; Renzi, M.F. Promoting the propensity for blood donation through the understanding of its determinants. BMC Health Serv. Res. 2021, 21, 1–20. [Google Scholar] [CrossRef]
- Bednall, T.C.; Bove, L.L.; Cheetham, A.; Murray, A.L. A systematic review and meta-analysis of antecedents of blood donation behavior and intentions. Soc. Sci. Med. 2013, 96, 86–94. [Google Scholar] [CrossRef]
- Davahli, M.R.; Karwowski, W.; Fiok, K.; Wan, T.; Parsaei, H.R. Controlling safety of artificial intelligence-based systems in healthcare. Symmetry 2021, 13, 102. [Google Scholar] [CrossRef]
- Felder, R.; Silverman, L. Learning and teaching styles in engineering education. Eng. Educ. 1988, 78, 674–681. [Google Scholar] [CrossRef]
Figure 1.
The TPB model.

Figure 2.
Pseudocode of the C4.5 algorithm.

Figure 3.
Decision tree graph results for blood donation intention.

Figure 4.
Explanation of the application of the decision tree technique.


Table 1.
Items used to measure the latent variables.
| Latent Variable | Item | Description | Average | SD | Asymmetry | Kurtosis |
|---|---|---|---|---|---|---|
| Subjective Norms | SN1 | People who are important to me would recommend that I donate blood | 4.61 | 0.719 | −2.059 | 4.598 |
| SN2 | I believe that the people who are important to me think that I should donate blood | 4.26 | 0.953 | −1.015 | 0.012 | |
| SN3 | If I donated blood, the people who are important to me would approve | 4.57 | 0.730 | −1.627 | 1.822 | |
| Perceived Behavioural Control | PBC1 | I have complete control over whether I will donate blood or not in the next six months | 4.55 | 0.875 | −2.181 | 4.557 |
| PBC2 | How much control do you have over whether you donate blood or not in the next six months? (No control/complete control) | 4.48 | 0.834 | −1.798 | 3.275 | |
| PBC3 | I am confident that I will be able to donate blood in the next six months | 4.32 | 1.060 | −1.670 | 2.134 | |
| Attitude | ATT1 | Donating blood in the next six months will be an action: Unpleasant/Pleasant | 4.48 | 0.873 | −2.088 | 4.722 |
| ATT2 | Donating blood in the next six months will be an action: Bad/Good | 4.66 | 0.648 | −2.178 | 5.913 | |
| ATT3 | Donating blood in the next six months will be an action: Unsatisfactory/Satisfactory | 4.54 | 0.810 | −1.933 | 3.812 | |
| ATT4 | Donating blood in the next six months will be an action: Pointless/Worthwhile | 4.64 | 0.685 | −2.197 | 5.507 | |
| Behavioural Intention | BI1 | I would like to donate blood in the next six months | 4.55 | 0.854 | −2.361 | 5.946 |
| BI2 | I intend to donate blood in the next six months | 4.31 | 1.054 | −1.669 | 2.322 | |
| BI3 | I will donate blood in the next six months | 4.19 | 1.014 | −1.243 | 1.119 |
Table 2.
Distribution of the variables of interest.
| Variable | N | % | |
|---|---|---|---|
| Education | |||
| Primary | 22 | 11 | |
| Secondary | 74 | 38 | |
| Tertiary | 101 | 51 | |
| Previous donations | |||
| Never | 73 | 37 | |
| 1 to 3 | 77 | 39 | |
| 4 or more | 47 | 24 | |
| Donation reason | |||
| Knowing someone | 72 | 37 | |
| Another reason | 125 | 63 | |
| Gender | |||
| Male | 95 | 48 | |
| Female | 102 | 52 | |
| Total | 197 | 100 | |
| Age | Mean 32.1 ± 11.00 | ||
| Range 18–60 years | |||
Table 3.
Description of the procedure parameters.
| Parameter | Value | Description |
|---|---|---|
| Algorithm | C4.5 | C4.5 sets up decision tree models based on a training dataset using the concept of information entropy. |
| Split criteria | Gain Ratio | Gain Ratio normalises the information gain of an attribute against the amount of entropy that attribute has. First, the information gain of all features is determined, and then the average information gain is calculated. Second, the gain ratio is calculated for all attributes whose calculated information gain is greater than or equal to the average information gain. Finally, the feature with the highest gain ratio is chosen to divide the data. |
| Maximum depth | 4 | Maximum depth refers to the maximum distance between the root of the tree and any leaf. |
| Optimisation strategy | Grid | This strategy runs the process for all combinations of selected parameter values and then determines the optimal values. |
| Validation | 10-fold cross-validation | Of the ten sub-samples, only one subsample is preserved as validation data for model testing, and the remaining nine subsamples are used as training data. Thus, the process is repeated repeatedly, with each of the ten subsamples used exactly once as validation data. Finally, the results ten are averaged to generate one estimate. |
Table 4.
Confusion matrix.
| Accuracy: 84.17% | No (True) | Maybe (True) | Yes (True) | Class Precision |
|---|---|---|---|---|
| No (pred.) | 2 | 2 | 1 | 40.00% |
| Maybe (pred.) | 1 | 38 | 11 | 76.00% |
| Yes (pred.) | 0 | 9 | 87 | 90.62% |
| Class recall | 66.67% | 77.55% | 87.88% |
Publisher’s Note: MDPI stays neutral with regard to jurisdictional claims in published maps and institutional affiliations. |
© 2021 by the authors. Licensee MDPI, Basel, Switzerland. This article is an open access article distributed under the terms and conditions of the Creative Commons Attribution (CC BY) license (https://creativecommons.org/licenses/by/4.0/).
Share and Cite
MDPI and ACS Style
Salazar-Concha, C.; Ramírez-Correa, P. Predicting the Intention to Donate Blood among Blood Donors Using a Decision Tree Algorithm. Symmetry 2021, 13, 1460. https://0-doi-org.brum.beds.ac.uk/10.3390/sym13081460
AMA Style
Salazar-Concha C, Ramírez-Correa P. Predicting the Intention to Donate Blood among Blood Donors Using a Decision Tree Algorithm. Symmetry. 2021; 13(8):1460. https://0-doi-org.brum.beds.ac.uk/10.3390/sym13081460
Chicago/Turabian StyleSalazar-Concha, Cristian, and Patricio Ramírez-Correa. 2021. "Predicting the Intention to Donate Blood among Blood Donors Using a Decision Tree Algorithm" Symmetry 13, no. 8: 1460. https://0-doi-org.brum.beds.ac.uk/10.3390/sym13081460
Note that from the first issue of 2016, this journal uses article numbers instead of page numbers. See further details here.