
A Technology Acceptance Model-Based Analytics for Online Mobile Games Using Machine Learning Techniques

 , ,
, , 
Abstract
:1. Introduction
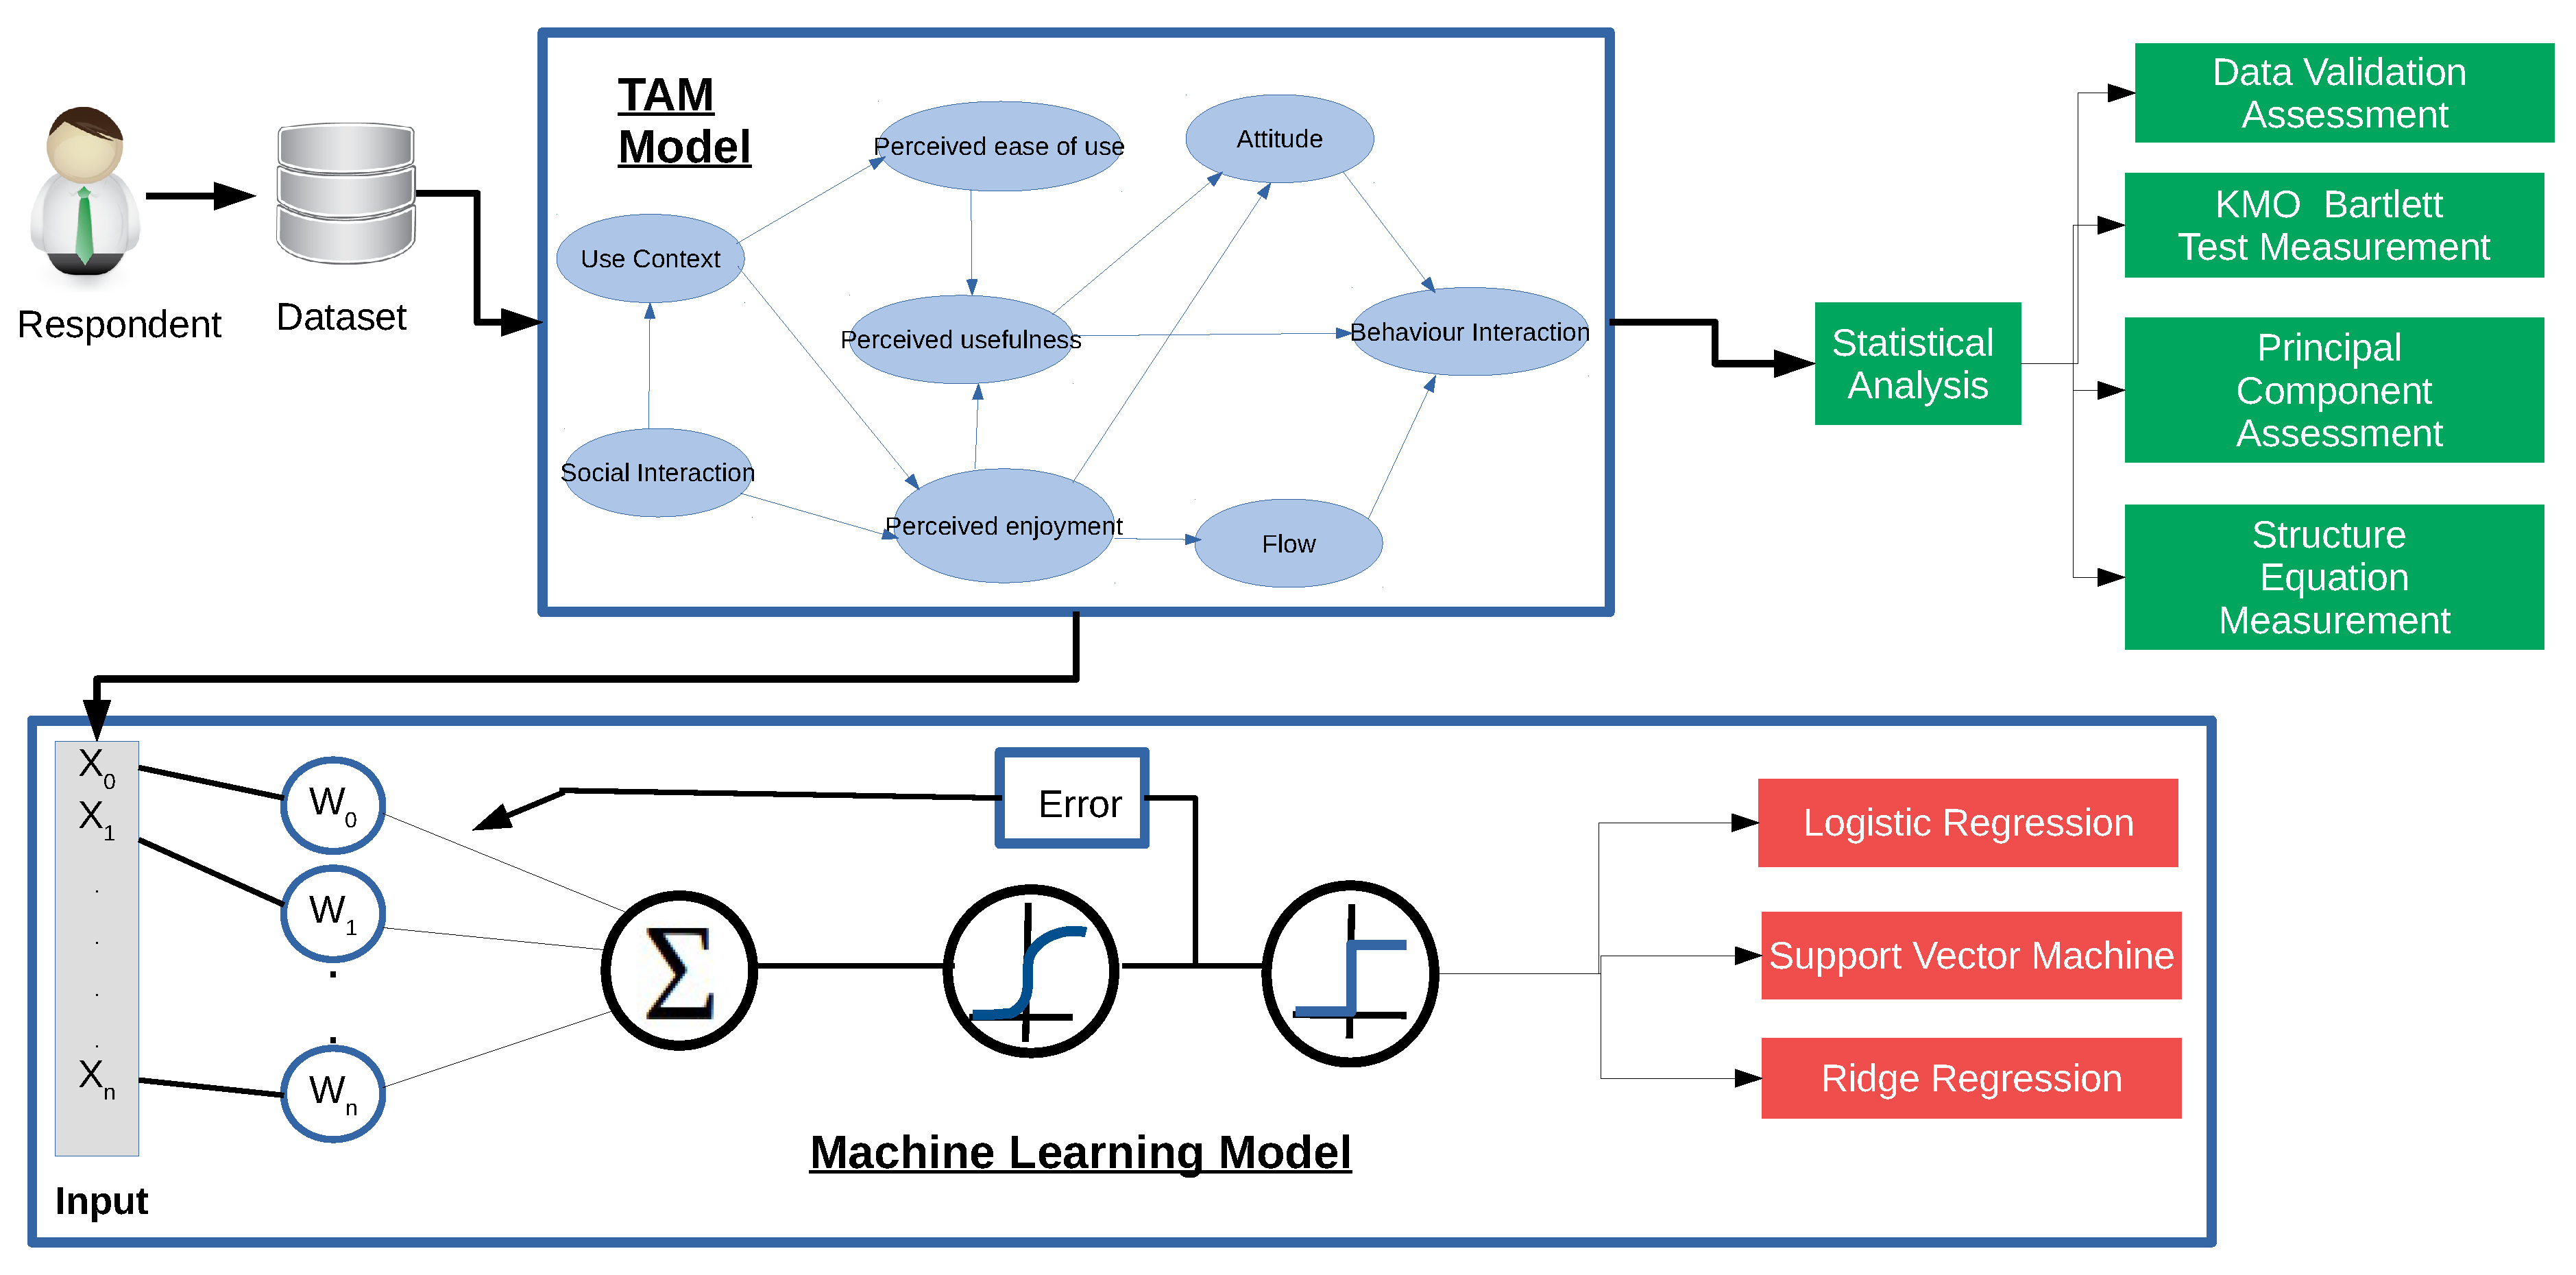
Contribution
- First, symmetric data is collected based on the questionnaire from a specified locality of India.
- After the collection of data, based on hypothesis, the TAM model is implemented with the help of AMOS.
- With the help of AMOS, it identifies the significant symmetric path coefficients between the primary factors.
- A detailed result analysis of the TAM model is performed, giving insight to justification of the hypothesis proposed.
- For further analysis, various symmetric ML techniques, such as logistic regression, SVM, etc., are applied on the same dataset to analyze the proposed hypothesis for encouraging predictive analysis.
- The results for the main factor’s predictions are compared with various implemented techniques. Last, we conclude our paper based on the objective.
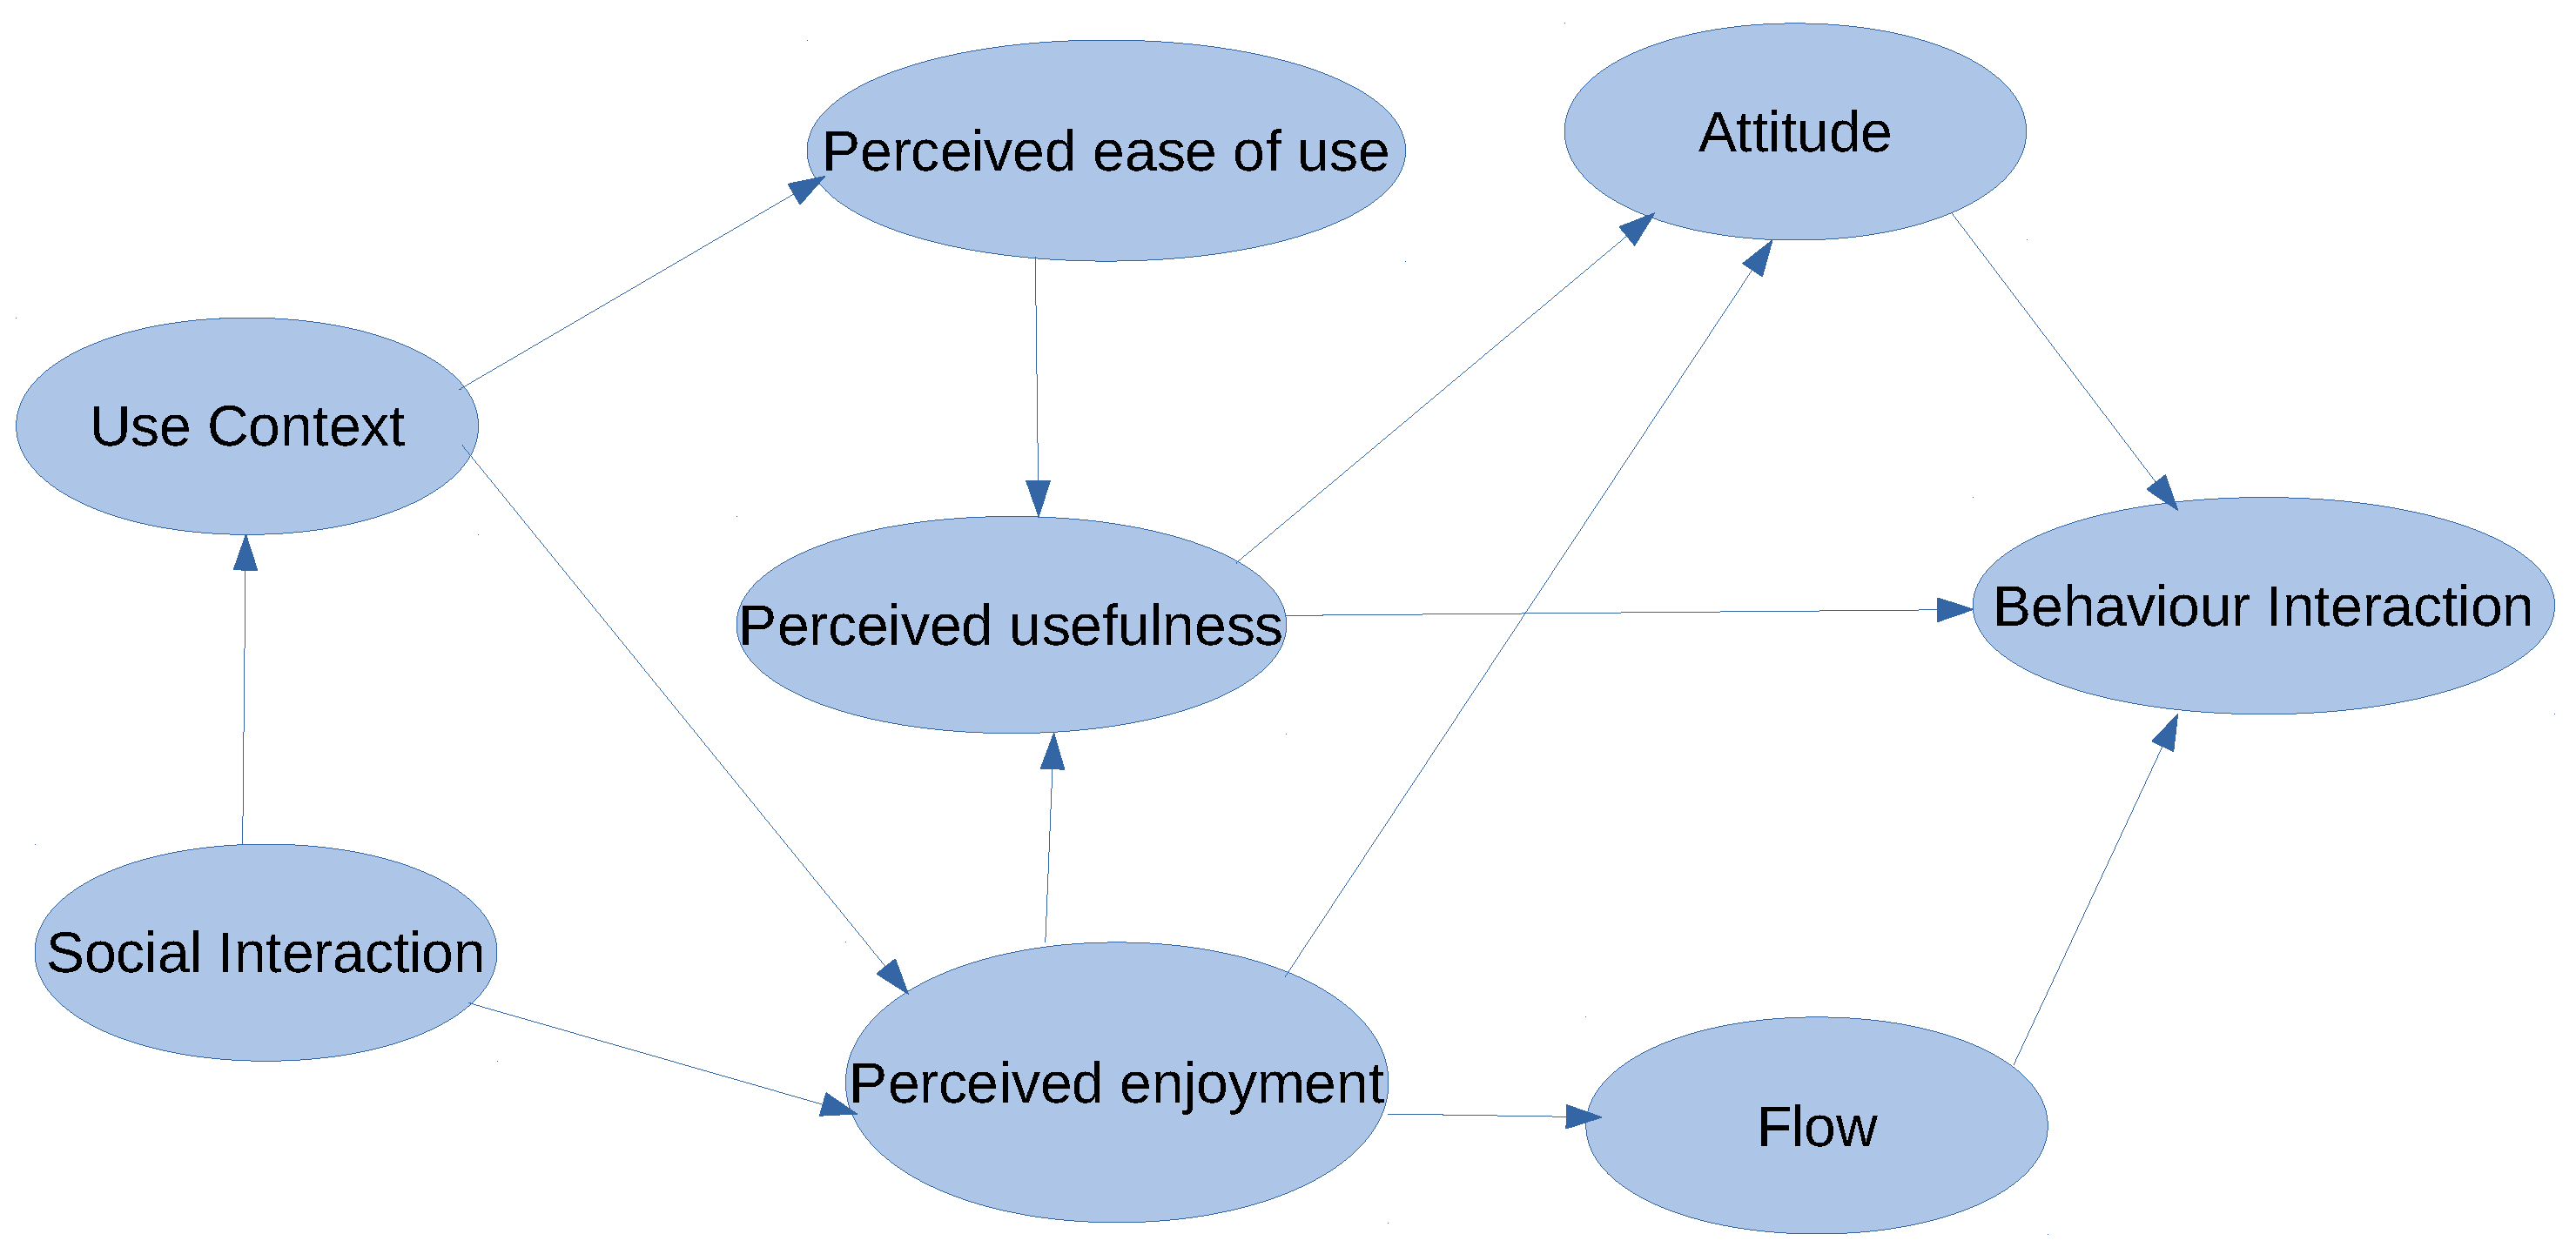
2. Brief Introduction to TAM Model
3. Literature Review
3.1. Social Interaction
3.2. Use Context
3.3. Technology Acceptance Model
4. Research Methodology
4.1. Data Analysis
4.2. Principal Component Assessment
4.3. Structure Equation Measurement
5. Machine Learning Techniques
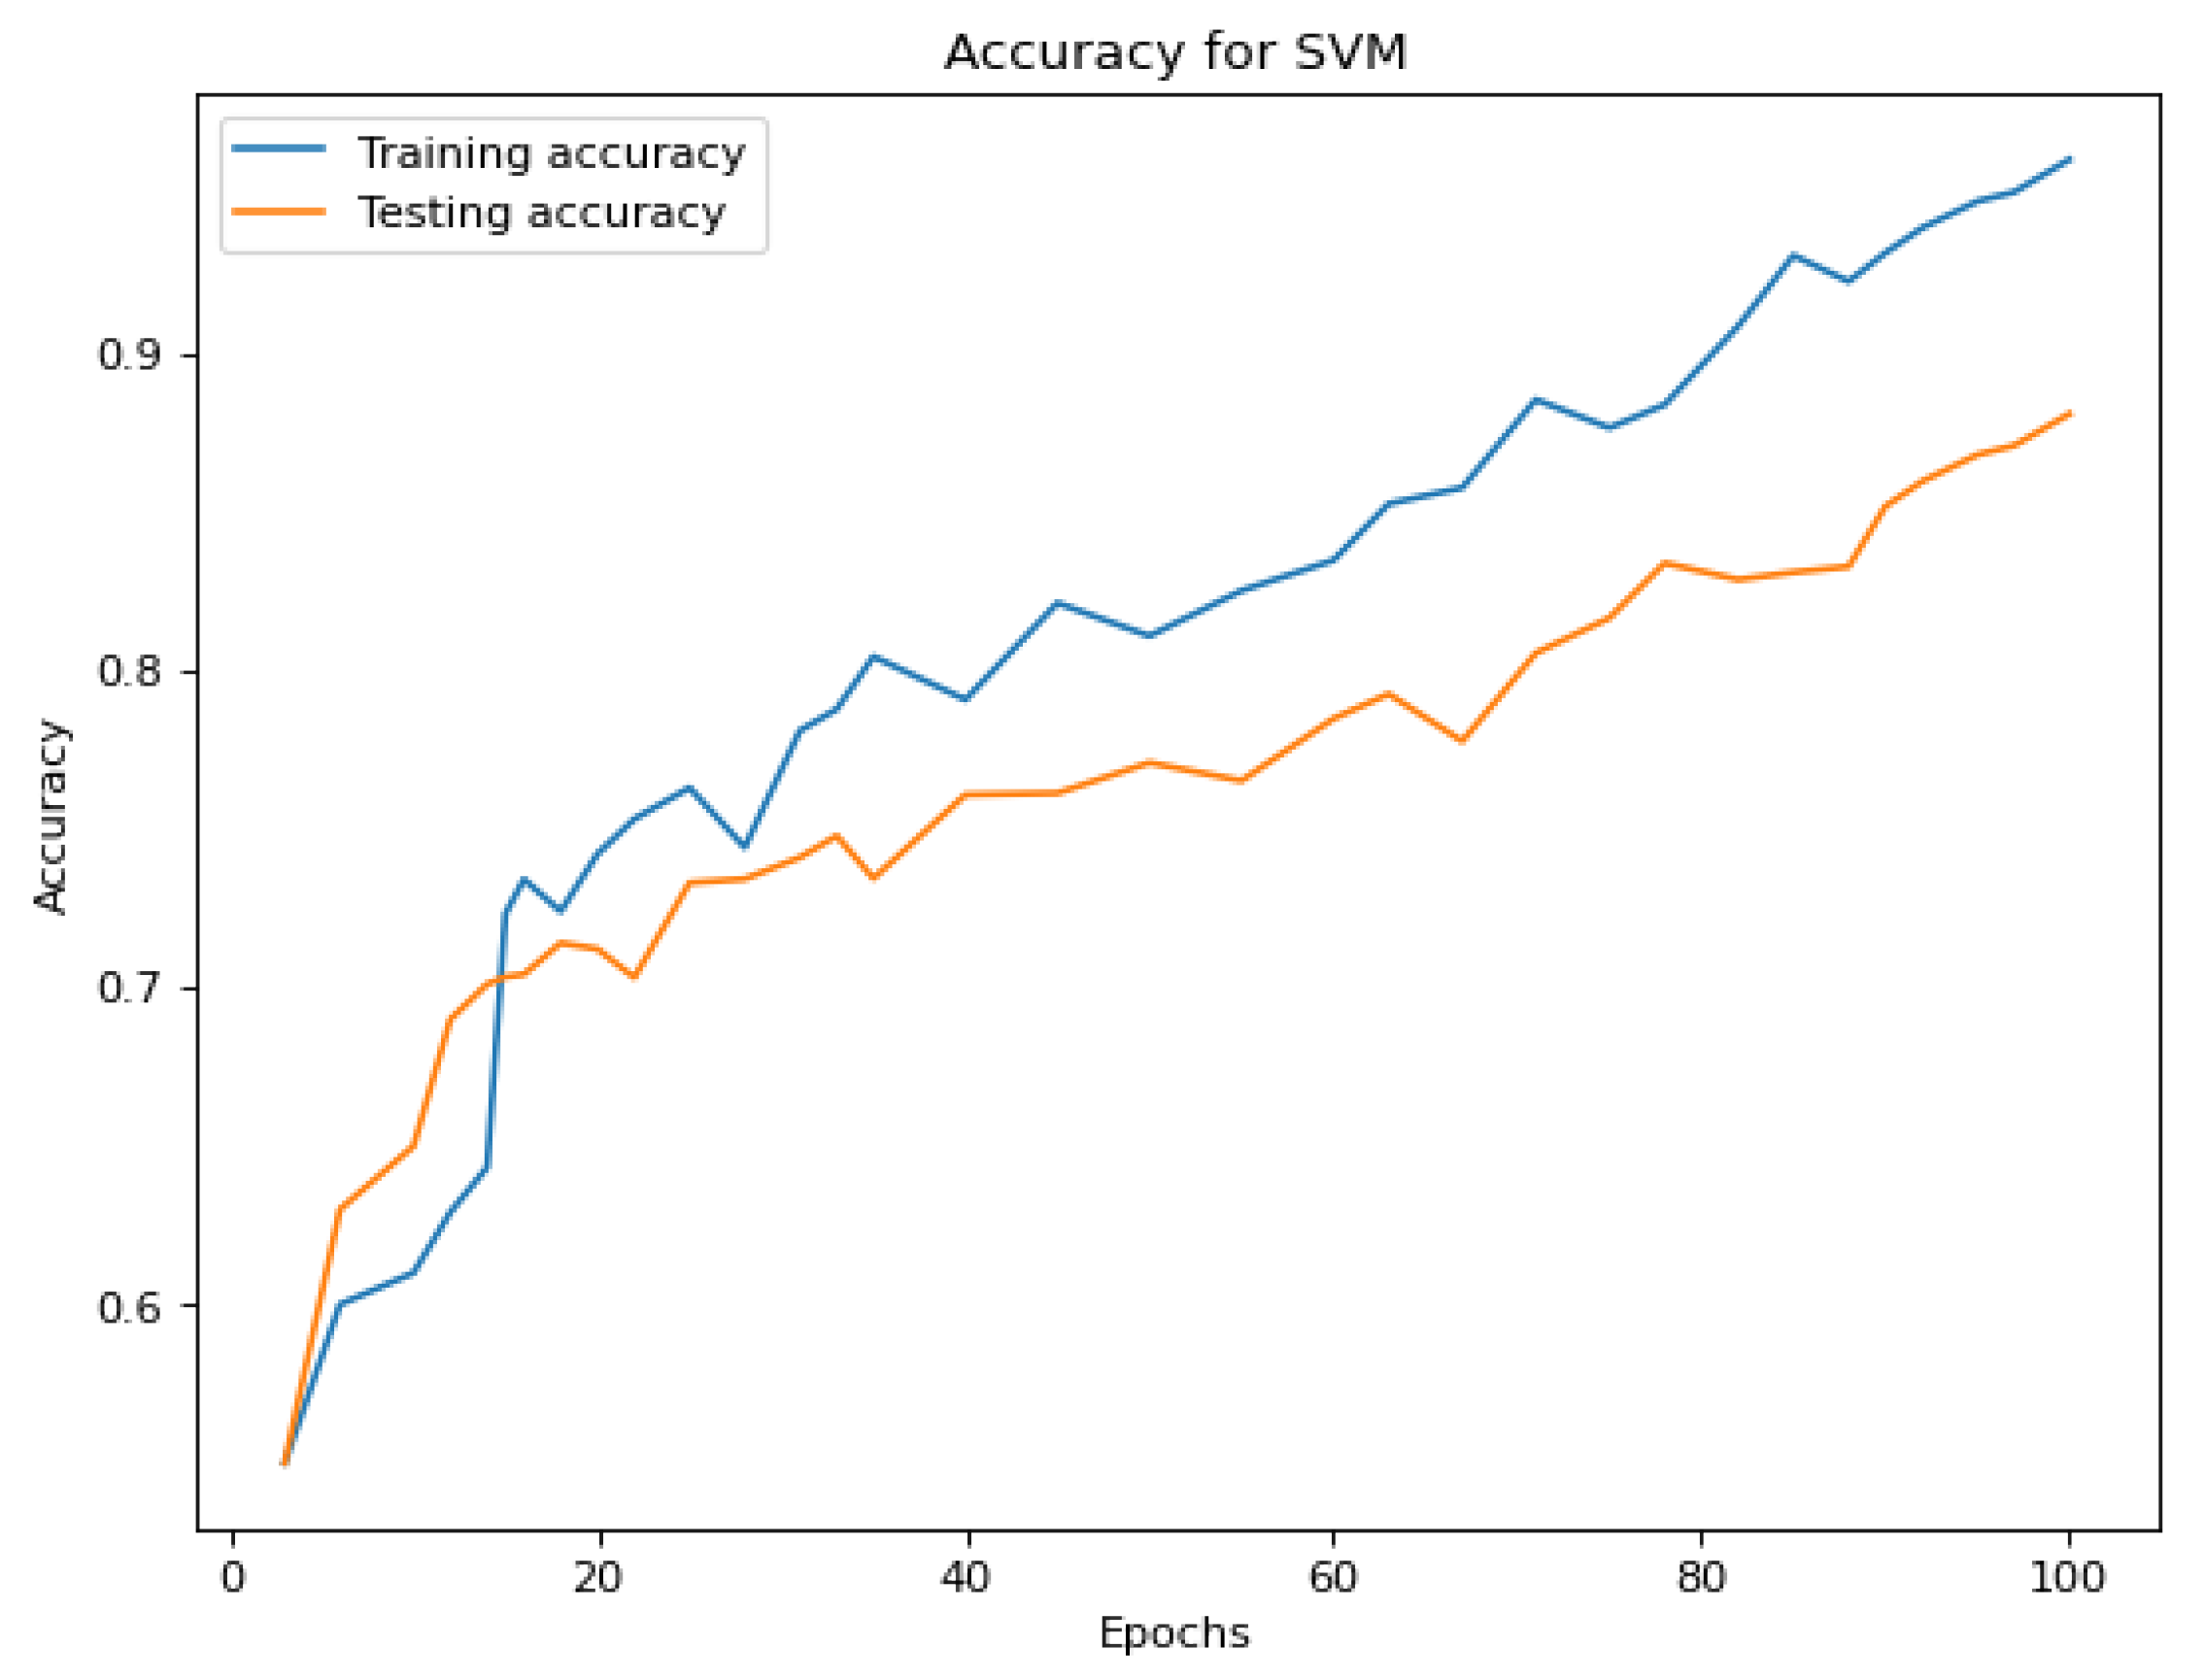
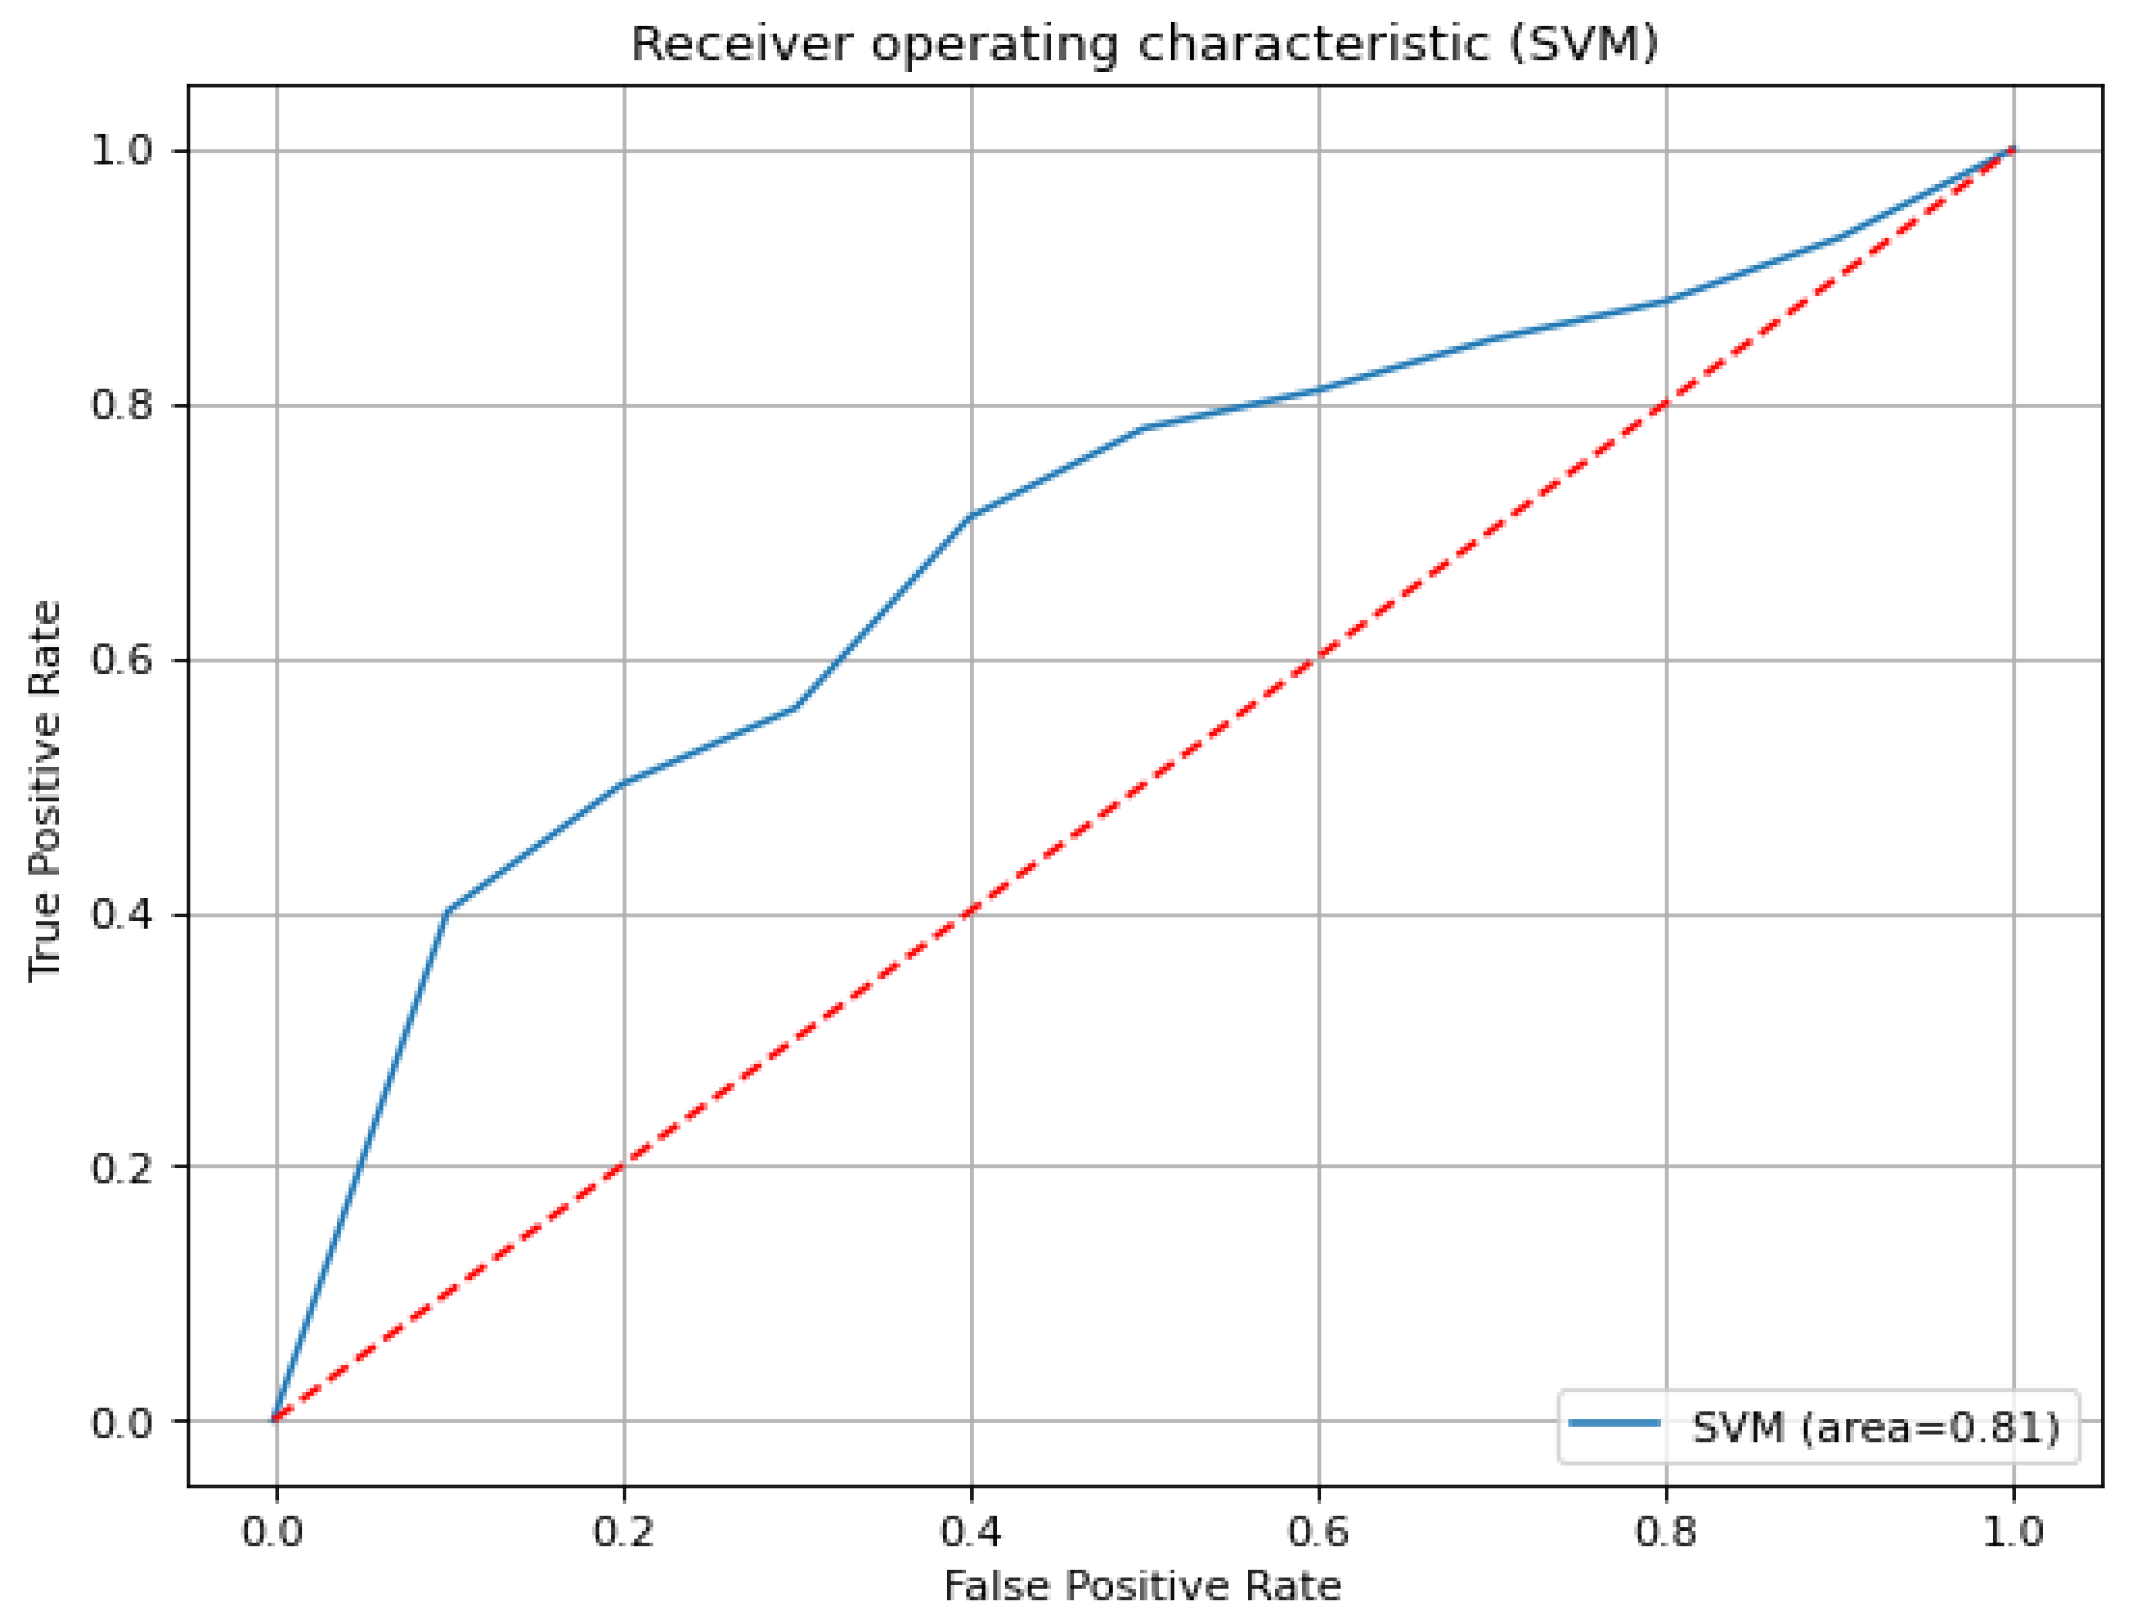
5.1. Support Vector Machine
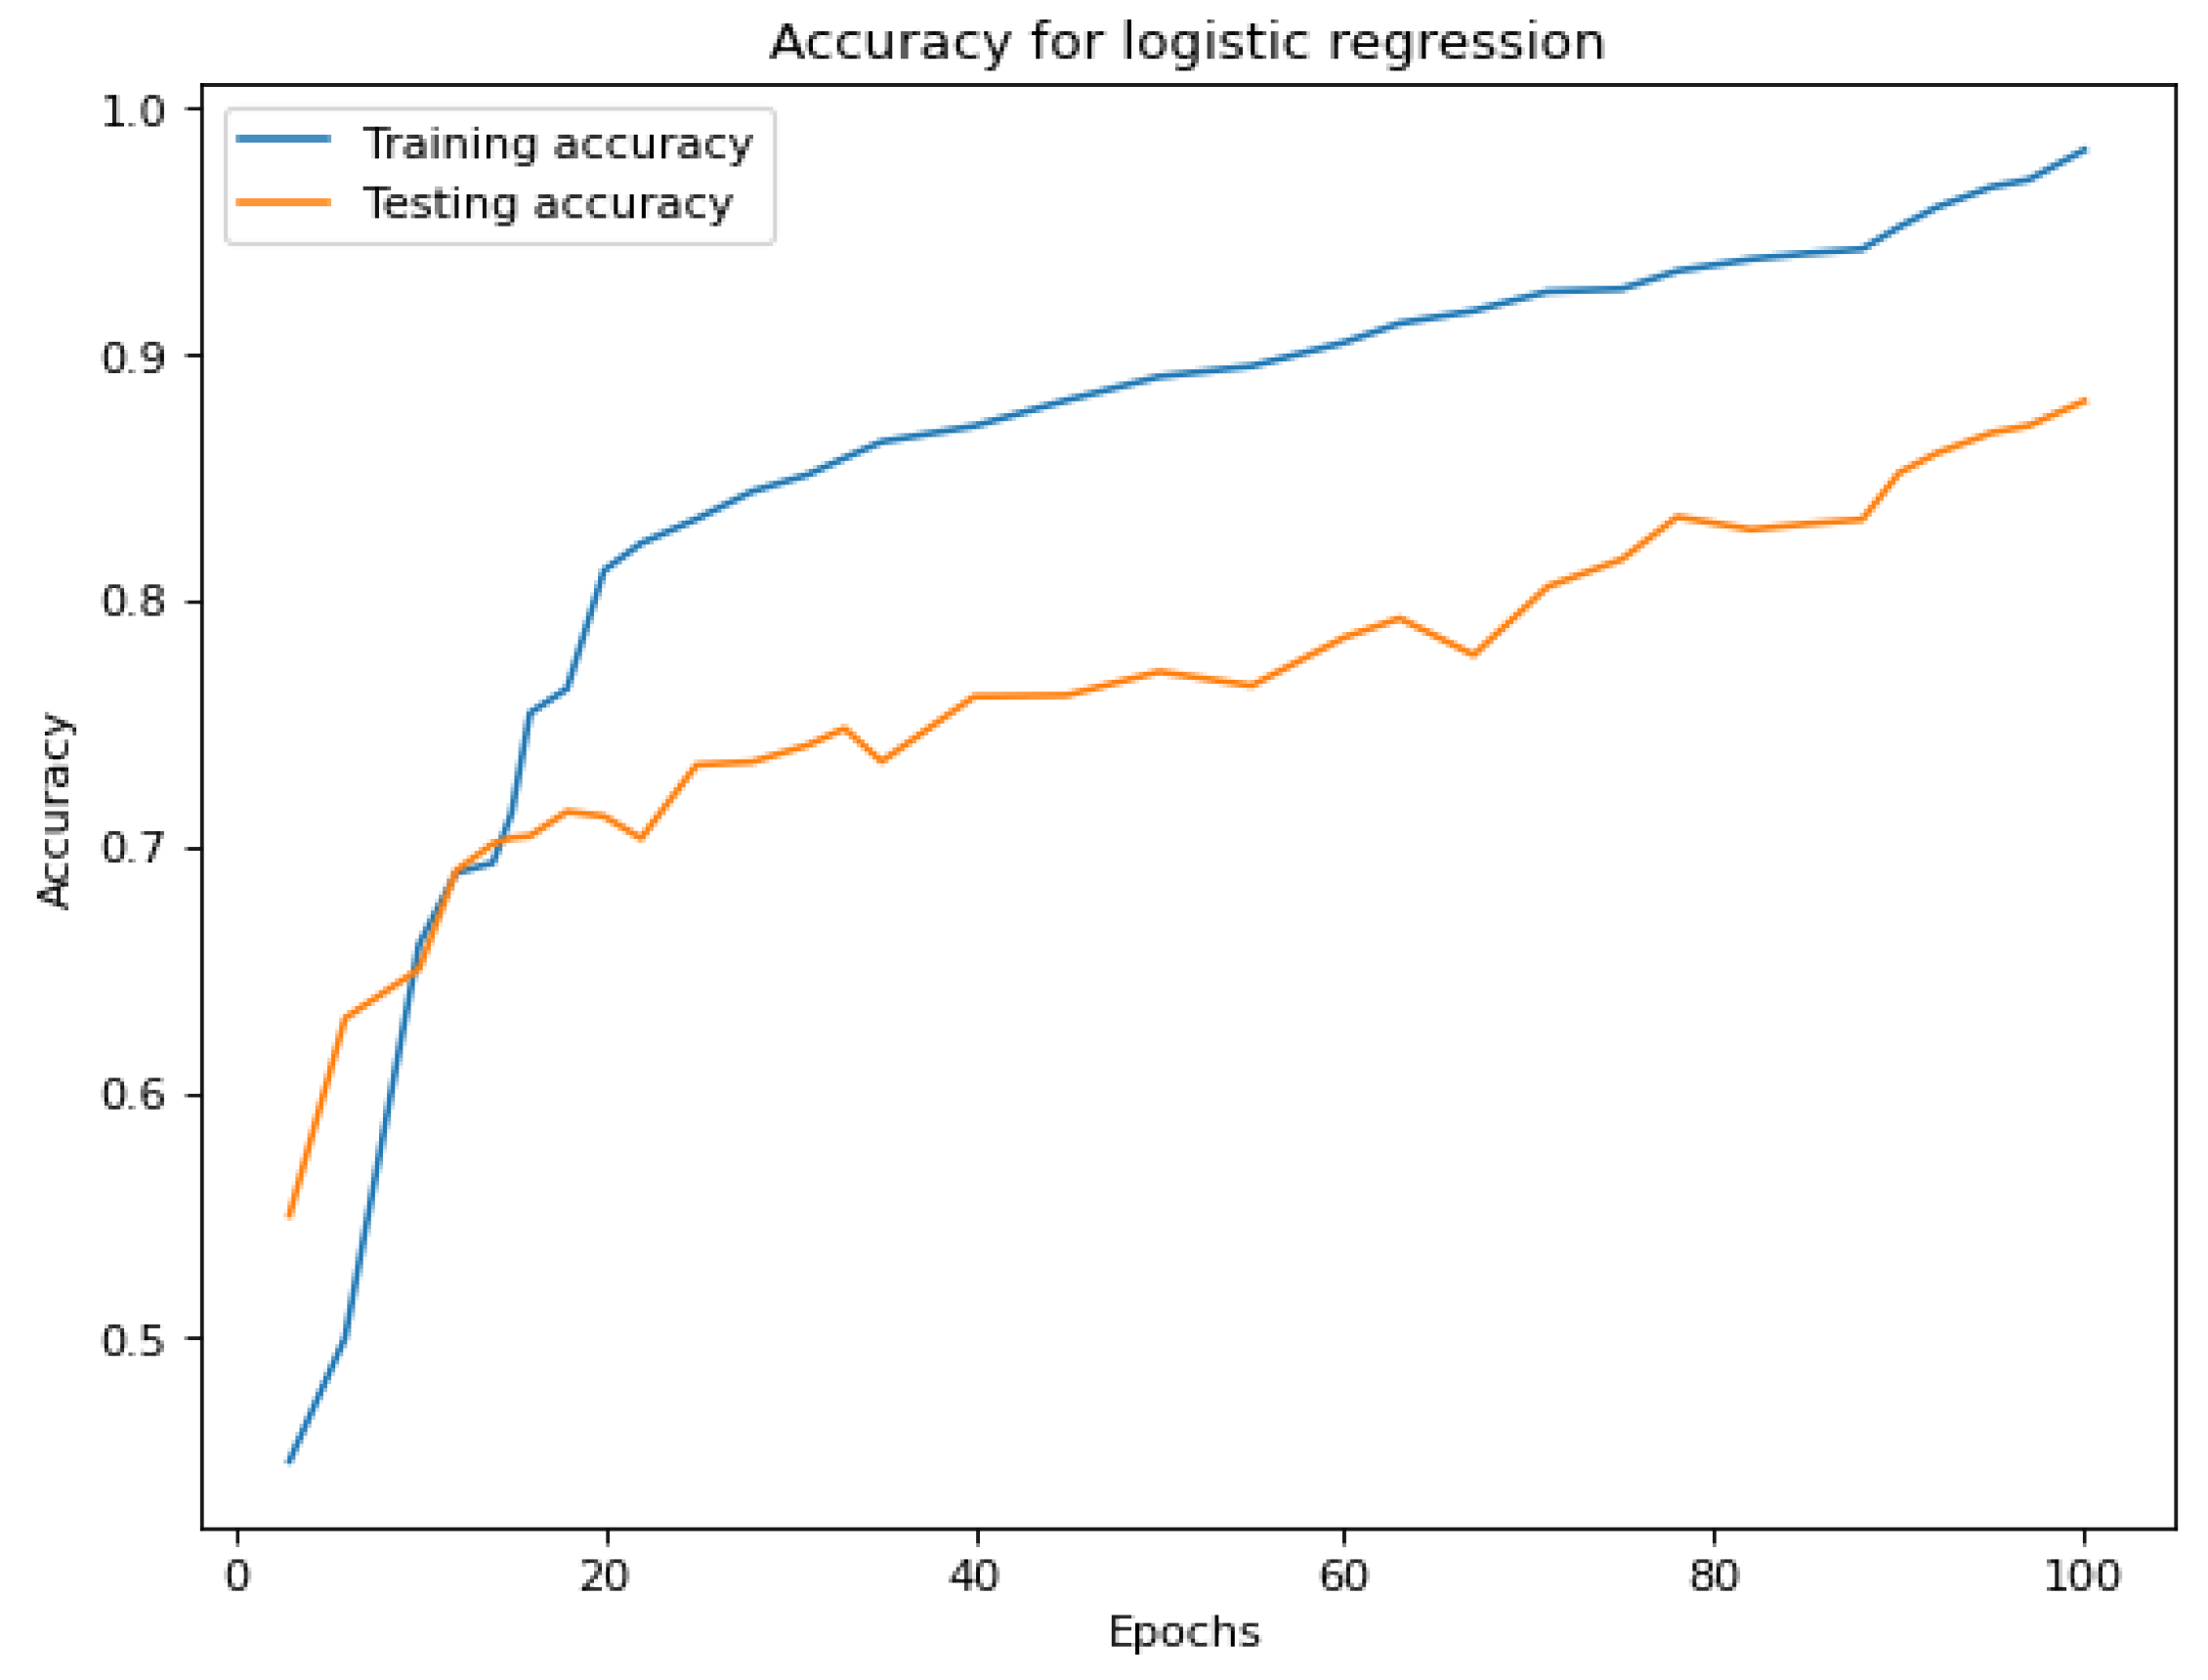
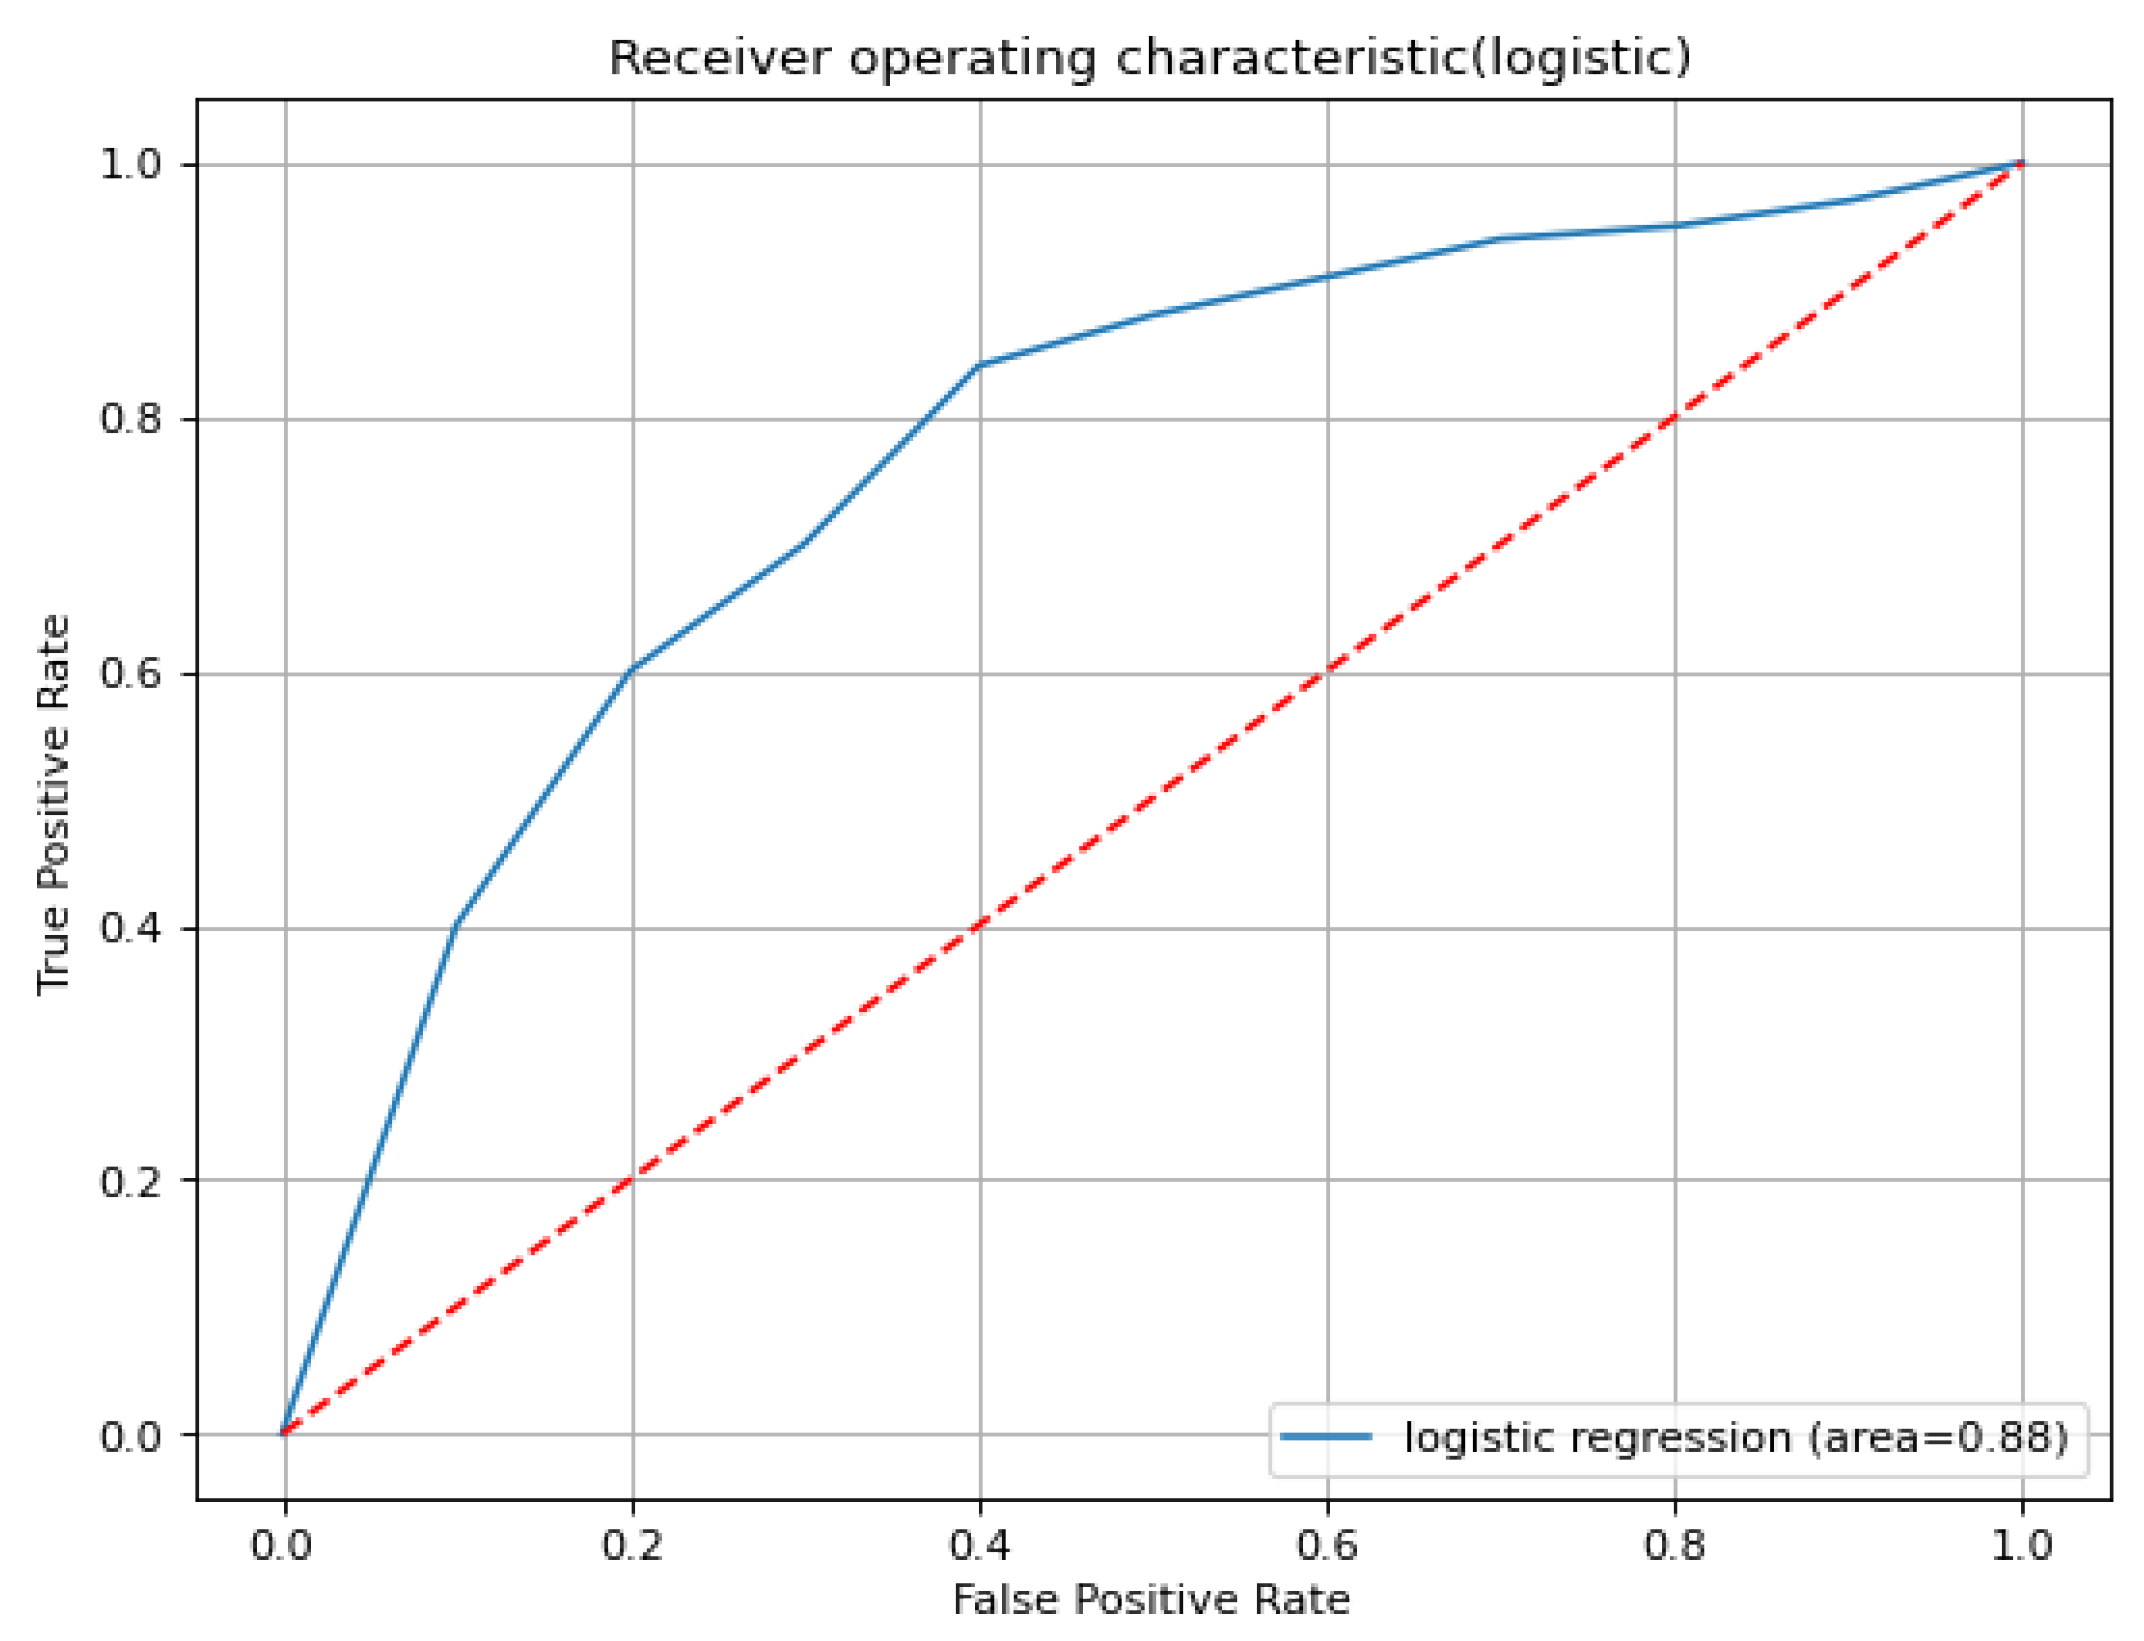
5.2. Logistic Regression
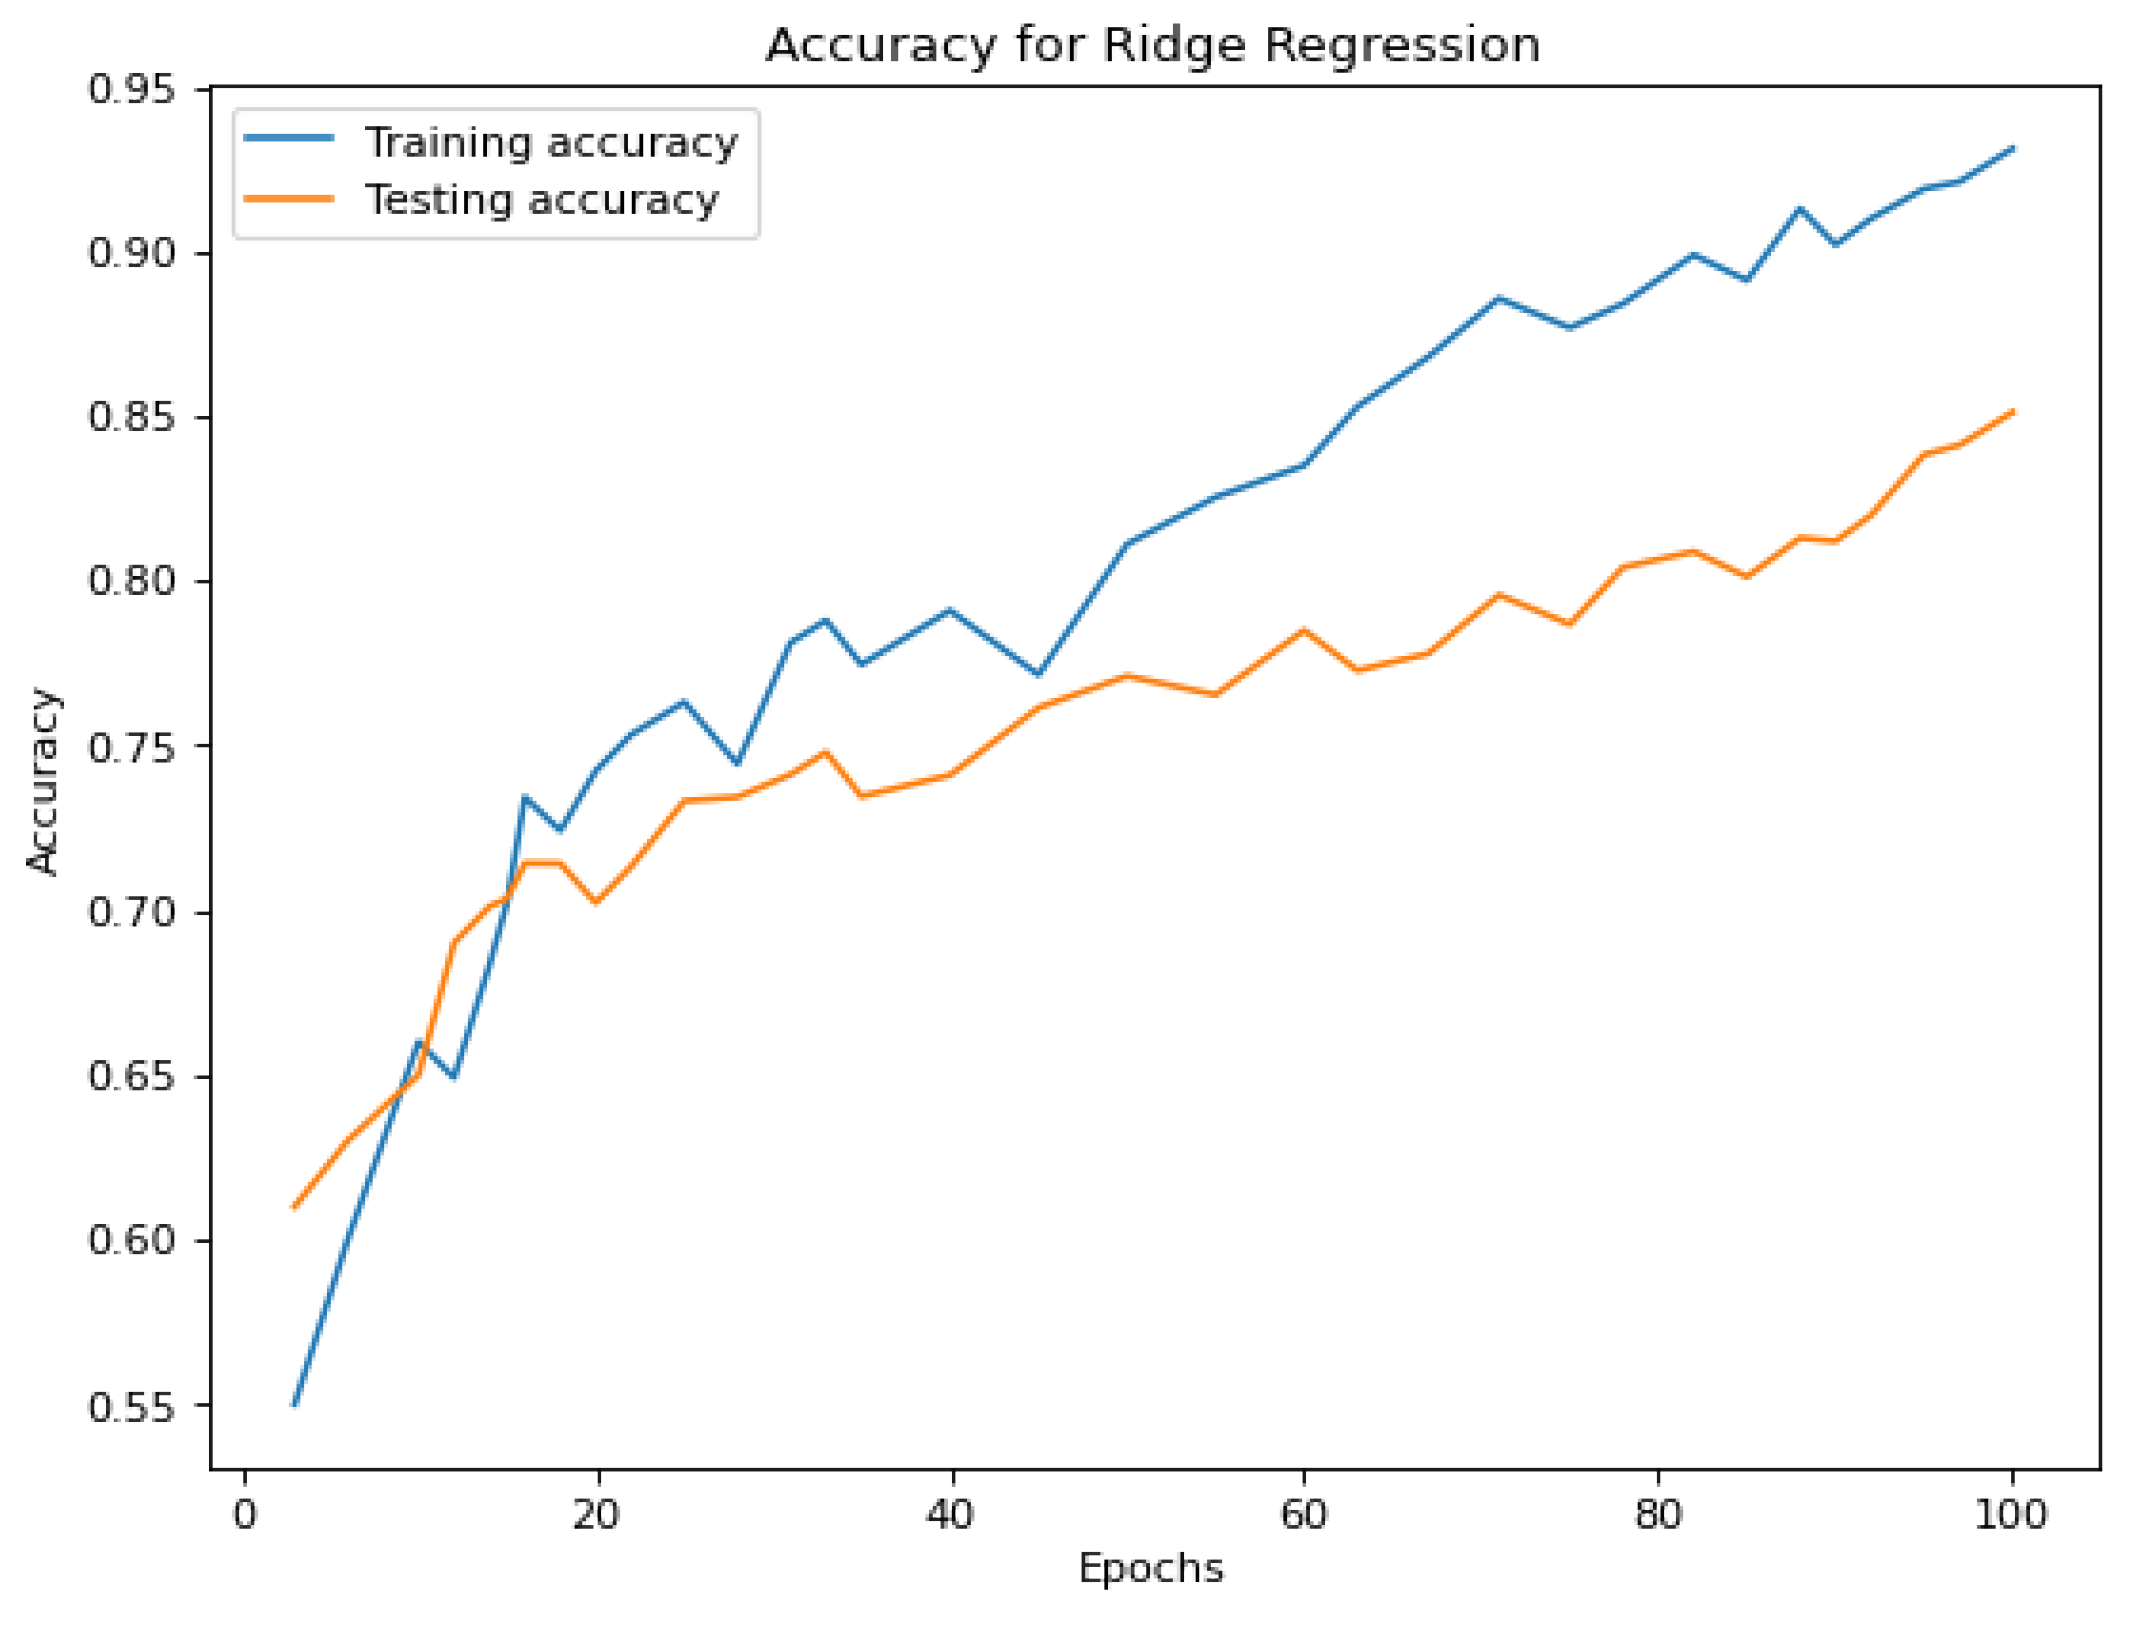
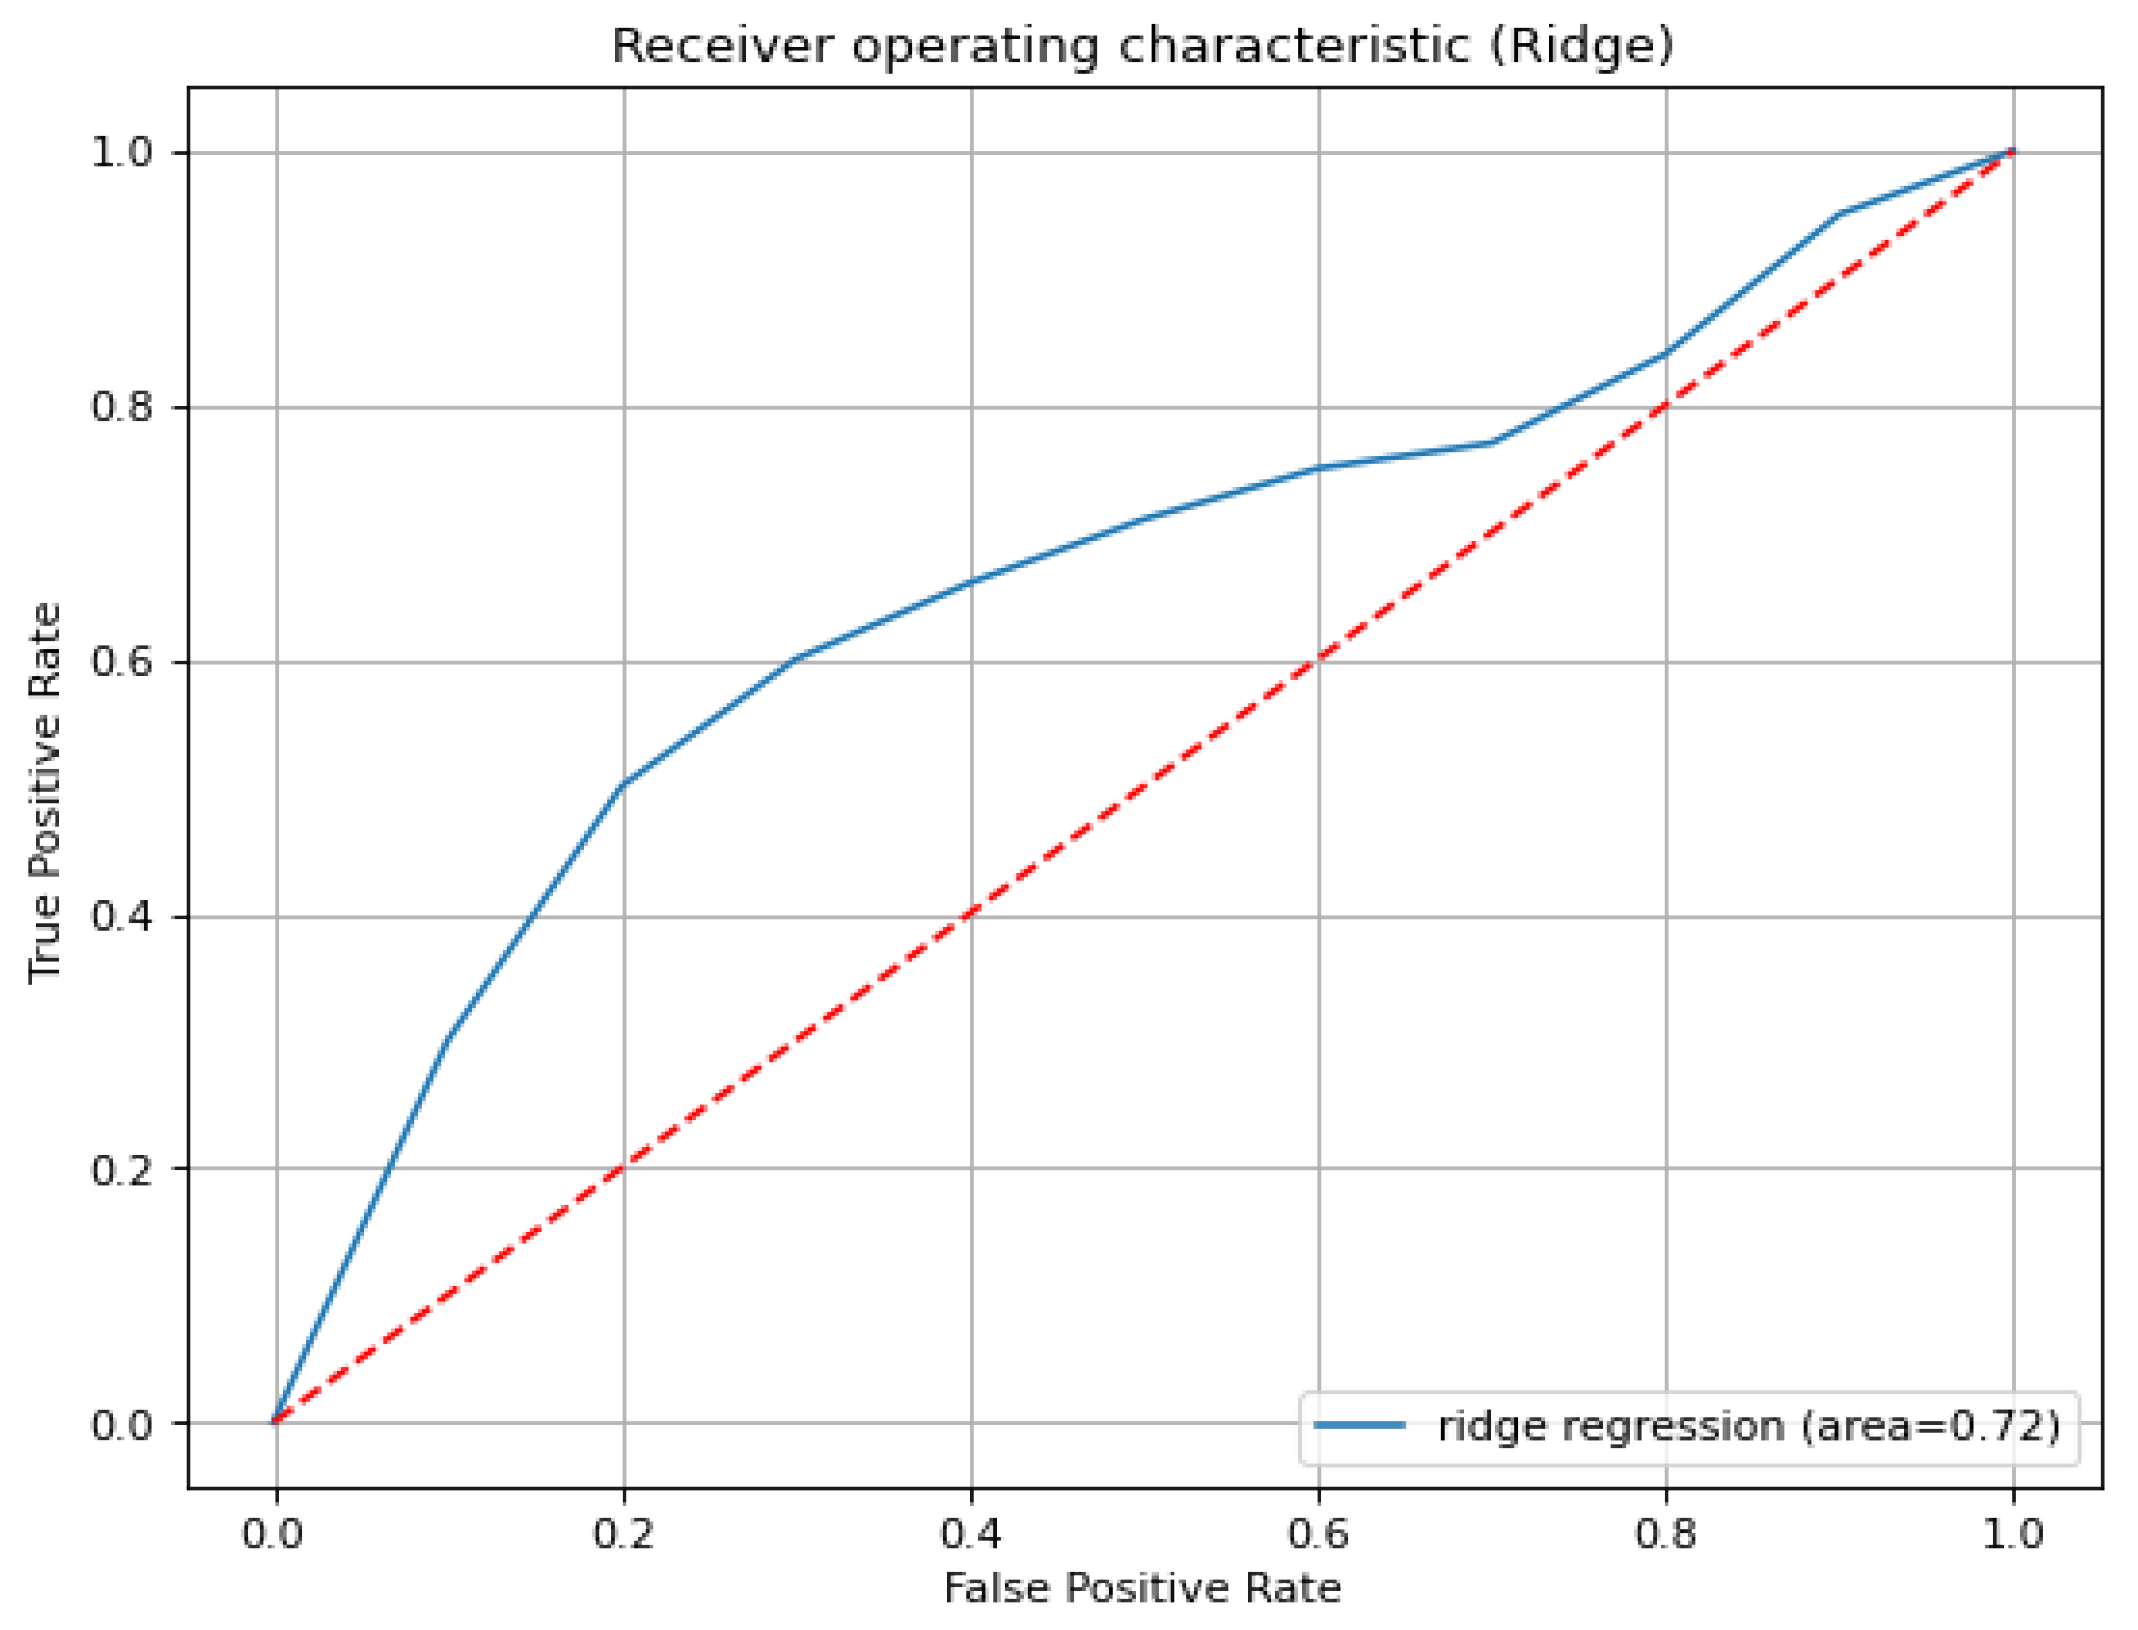
5.3. Ridge Regression
6. Machine Learning Result Analysis
- -
- Accuracy
- -
- Precision
- -
- Recall
- -
- F1 Score
6.1. Data
6.2. Evaluation
7. Discussion and Limitation
7.1. Discussion
7.2. Limitations
8. Conclusions
Author Contributions
Funding
Institutional Review Board Statement
Informed Consent Statement
Conflicts of Interest
References
- Mittal, M.; Kumar, K. Network Lifetime Enhancement of Homogeneous Sensor Network Using ART1 Neural Network. In Proceedings of the International Conference on Computational Intelligence and Communication Networks, Bhopal, India, 14–16 November 2014; pp. 472–475. [Google Scholar]
- Chauhan, S.; Banerjee, R.; Mittal, M. An Analytical Study On Impluse Buying For Online Shopping during COVID-19. J. Content Community Commun. 2020, 12, 198–209. [Google Scholar] [CrossRef]
- Mittal, M. Performance Evaluation of Cryptographic Algorithms. Int. J. Comput. Appl. 2012, 41, 1–6. [Google Scholar] [CrossRef]
- Mittal, M.; Iwendi, C. A Survey on Energy-Aware Wireless Sensor Routing Protocols. Eai Endorsed Trans. Energy Web 2019, 6, 1–16. [Google Scholar] [CrossRef]
- Mittal, M.; Siriaraya, P.; Lee, C.; Kawai, Y.; Yoshikawa, T.; Shimojo, S. Accurate Spatial Mapping of Social Media with Physical Locations. IEEE BSD Big Data 2019. [Google Scholar] [CrossRef]
- Aljumaili, M.R.M.; Friesen, M. Serious Games and ML for Detecting MCI. In Proceedings of the IEEE Global Conference on Signal and Information Processing (GlobalSIP), Ottawa, ON, Canada, 11–14 November 2019; pp. 1–5. [Google Scholar]
- Mittal, M.; Iwendi, C.; Khan, S.; Rehman, J.A. Analysis of security and energy efficiency for shortest route discovery in low-energy adaptive clustering hierarchy protocol using Levenberg-Marquardt neural network and gated recurrent unit for intrusion detection system. Trans. Emerg. Telecommun. Technol. 2020, 32, e3997. [Google Scholar] [CrossRef]
- Mittal, M.S.; Srinivasan, M.R.; Vyas, O.P. Type-2 fuzzy ontology-based multi-agents system for wireless sensor network. In Proceedings of the TENCON 2017—2017 IEEE Region 10 Conference, Penang, Malaysia, 5–8 November 2017; pp. 2864–2869. [Google Scholar] [CrossRef]
- Wang, Y.; Siriaraya, P.; Mittal, M.; Xie, H.; Kawai, Y. Understanding Multilingual Correlation of Geo-Tagged Tweets for POI Recommendation. In Proceedings of the International Symposium on Web and Wireless Geographical Information Systems, Wuhan, China, 13–14 November 2020; Volume 12473, pp. 2864–2869. [Google Scholar]
- Mittal, M.L.K.; Saraswat, C.I.; Anajemba, J.H. A Neuro-Fuzzy Approach for Intrusion Detection in Energy Efficient Sensor Routing. In Proceedings of the 4th International Conference on Internet of Things: Smart Innovation and Usages (IoT-SIU), Ghaziabad, India, 18–19 April 2019; pp. 1–5. [Google Scholar]
- Mittal, M.K.S. Performance Evaluation of LEACH Protocol Based on Data Clustering Algorithms. In Proceedings of the Proceedings of 2nd International Conference on Communication, Computing and Networking, Chandigarh, India, 29–30 March 2019. [Google Scholar]
- Gupta, S.M.M.; Padha, A. Predictive Analytics of Sensor Data Based on Supervised Machine Learning Algorithms. In Proceedings of the 2017 International Conference on Next Generation Computing and Information Systems (ICNGCIS), Jammu, India, 11–12 December 2017; pp. 171–176. [Google Scholar]
- Mittal, M.; Vijayal, S. Detection of attacks in IoT based on ontology using SPARQL. In Proceedings of the 7th International Conference on Communication Systems and Network Technologies (CSNT), Nagpur, India, 11–13 November 2017; pp. 206–211. [Google Scholar]
- Brown, J.A.; Cuzzocrea, A.; Kresta, M.; Kristjanson, K.D.; Leung, C.K.; Tebinka, T.W. A Machine Learning Tool for Supporting Advanced Knowledge Discovery from Chess Game Data. In Proceedings of the IEEE International Conference on Machine Learning and Applications (ICMLA), Cancun, Mexico, 18–21 December 2017; pp. 649–654. [Google Scholar]
- Cardamone, L.D.L.; Lanzi, P.L. Learning to Drive in the Open Racing Car Simulator Using Online Neuroevolution. IEEE Trans. Comput. Intell. Games 2010, 2, 176–190. [Google Scholar] [CrossRef]
- Tavakoli, S.; Yooseph, S. Learning a mixture of microbial networks using minorization–maximization. Bioinformatics 2019, 35, 123–130. [Google Scholar] [CrossRef]
- Jahanshahi, A. TinyCNN: A Tiny Modular CNN Accelerator for Embedded FPGA. arXiv 2019, arXiv:1911.06777. [Google Scholar]
- Roshani, M. Evaluation of flow pattern recognition and void fraction measurement in two phase flow independent of oil pipeline’s scale layer thickness. Alex. Eng. J. 2021, 60, 1955–1966. [Google Scholar] [CrossRef]
- Voghoei, S.; Tonekaboni, N.H.; Yazdansepas, D.; Arabnia, H.R. University Online Courses: Correlation between Students’ Participation Rate and Academic Performance. In Proceedings of the International Conference on Computational Science and Computational Intelligence, Las Vegas, NV, USA, 5–7 December 2019; pp. 772–777. [Google Scholar]
- Roshani, M.; Phan, G.; Faraj, R.H.; Phan, N.H.; Roshani, G.H.; Nazemi, B.; Corniani, E.; Nazemi, E. Proposing a gamma radiation based intelligent system for simultaneous analyzing and detecting type and amount of petroleum by-products. Nucl. Eng. Technol. 2021, 53, 1277–1283. [Google Scholar] [CrossRef]
- Chauhan, S.; Banerjee, R.; Chakraborty, C.; Mittal, M.; Shiva, A.; Ravi, V. A self-congruence and impulse buying effect on user’s shopping behaviour over social networking sites: An empirical study. Int. J. Pervasive Comput. Commun. 2021. [Google Scholar] [CrossRef]
- Baykal, O.; Alpaslan, F.N. Supervised Learning in Football Game Environments Using Artificial Neural Networks. In Proceedings of the International Conference on Computer Science and Engineering (UBMK), Chiang Mai, Thailand, 21–24 November 2018; pp. 110–115. [Google Scholar]
- Persio, L.; Garbelli, M. Deep Learning and Mean-Field Games: A Stochastic Optimal Control Perspective. Symmetry 2021, 13, 14. [Google Scholar] [CrossRef]
- Cornel, J.A.; Pablo, C.C.; Marzan, J.A.; Mercado, V.J.; Fabito, B.; Rodriguez, R.; Octaviano, M.; Oco, N.; De La Cruz, A. Cyberbullying Detection for Online Games Chat Logs using Deep Learning. In Proceedings of the 11th International Conference on Humanoid, Nanotechnology, Information Technology, Communication and Control, Environment, and Management (HNICEM), Laoag, Philippines, 29 November–1 December 2019; pp. 1–5. [Google Scholar]
- Bălan, O.; Moise, G.; Petrescu, L.; Moldoveanu, A.; Leordeanu, M.; Moldoveanu, F. Emotion Classification Based on Biophysical Signals and Machine Learning Techniques. Symmetry 2020, 12, 21. [Google Scholar] [CrossRef] [Green Version]
- Ren, X.; Li, L.; Yu, Y.; Xiong, Z.; Yang, S.; Du, W.; Ren, M. A Simplified Climate Change Model and Extreme Weather Model Based on a Machine Learning Method. Symmetry 2020, 12, 139. [Google Scholar] [CrossRef] [Green Version]
- Cheong, Y.G.; Jensen, A.K.; Guðnadóttir, E.R.; Bae, B.C.; Togelius, J. Detecting Predatory Behavior in Game Chats. IEEE Trans. Comput. Intell. Games 2015, 7, 220–232. [Google Scholar] [CrossRef]
- Shin, D.H.; Shin, Y.J. Why do people play social network games? Comput. Hum. Behav. 2011, 27, 852–861. [Google Scholar] [CrossRef]
- Lin, T.H.; Lu, H.P.; Hsu, H.H.; Hsing, S.S.; Ho, T.L. Why do people continue to play social network game (SNG)? An empirical study by social and emotional perspectives. Int. J. E-Adopt. 2013, 5, 22–35. [Google Scholar] [CrossRef]
- Davis, F. Perceived usefulness, perceived ease of use, and user acceptance of information technology. MIS Q. 1989, 13, 319–340. [Google Scholar] [CrossRef] [Green Version]
- Davis, F.D.; Bagozzi, R.P.; Warshaw, P.R. Extrinsic and intrinsic motivation to use computers in the workplace. J. Appl. Soc. Psychol. 1992, 22, 1111–11323. [Google Scholar] [CrossRef]
- Fishbein, M.; Ajzen, I. Belief, Attitude, Intention, and Behavior: An Introduction to Theory and Research; Addison-Wesley: New York, NY, USA, 1975. [Google Scholar] [CrossRef]
- Thompson, R.L.; Higgins, C.A.; Howell, J.M. Personal computing: Toward a conceptual model of utilization. MIS Q. 1991, 15, 125–143. [Google Scholar] [CrossRef]
- Ajzen, I. The theory of planned behavior. Organ. Behav. Hum. Decis. Process. 1991, 50, 179–211. [Google Scholar] [CrossRef]
- Venkatesh, V.M.G.; Morris, G.B.D.; Davis, F.D. User acceptance of information technology: Toward a unified view. MIS Q. 2003, 27, 425–478. [Google Scholar] [CrossRef] [Green Version]
- Davis, F.D.; Bagozzi, R.P.; Warshaw, P.R. User acceptance of computer technology: A comparison of two theoretical models. Manag. Sci. 1989, 35, 982–1003. [Google Scholar] [CrossRef] [Green Version]
- Connolly, T.M.; Boyle, E.A.; MacArthur, E.; Hainey, T.; Boyle, J.M. A systematic literature review of empirical evidence on computer games and serious games. Comput. Educ. 2012, 59, 661–686. [Google Scholar] [CrossRef]
- Wang, Q.; Sun, X. Investigating gameplay intention of the elderly using an extended technology acceptance model (ETAM). Technol. Forecast. Soc. Chang. 2016, 107, 59–68. [Google Scholar] [CrossRef]
- Hsu, C.L.; Lu, H.P. Why do people play on-line games? An extended TAM with social influences and flow experience. Inf. Manag. 2004, 41, 853–868. [Google Scholar] [CrossRef]
- Lee, M.C. Understanding the behavioural intention to play online games: An extension of the theory of planned behaviour. Online Inf. Rev. 2009, 33, 849–872. [Google Scholar] [CrossRef]
- Wu, J.; Liu, D. The effects of trust and enjoyment on intention to play online games. J. Electron. Commer. Res. 2007, 8, 128–140. [Google Scholar]
- Choi, D.; Kim, J. Why people continue to play online games: In search of critical design factors to increase customer loyalty to online contents. Cyberpsychol. Behav. 2004, 7, 11–24. [Google Scholar] [CrossRef] [Green Version]
- van de Wijngaert, L.; Bouwman, H. Would you share? Predicting the potential use of a new technology. Telemat. Inform. 2009, 26, 85–102. [Google Scholar] [CrossRef]
- Mallat, N. Exploring consumer adoption of mobile payments—A qualitative study. J. Strateg. Inf. Syst. 2007, 16, 413–432. [Google Scholar] [CrossRef]
- Legris, P.J.I.; Collerette, P. Why do people use information technology? A critical review of the technology acceptance model. Inf. Manag. 2003, 40, 191–204. [Google Scholar] [CrossRef]
- Doll, J.; Ajzen, I. Accessibility and stability of predictors in the theory of planned behavior. J. Personal. Soc. Psychol. 1992, 63, 754–765. [Google Scholar] [CrossRef]
- van der Heijden, H. Factors influencing the usage of websites: The case of a generic portal in The Netherlands. Inf. Manag. 2003, 40, 541–549. [Google Scholar] [CrossRef] [Green Version]
- Ha, I.; Yoon, Y.; Choi, M. Determinants of adoption of mobile games under mobile broadband wireless access environment. Inf. Manag. 2007, 44, 276–286. [Google Scholar] [CrossRef]
- Csikszentmihalyi, M.; Csikszentmihalyi, I. Optimal Experience: Psychological Studies of Flow in Consciousness; Cambridge University Press: Cambridge, UK, 2000. [Google Scholar]
- Lu, Y.T.Z.; Wang, B. Exploring Chinese users’ acceptance of instant messaging using the theory of planned behavior, the technology acceptance model, and the flow theory. Comput. Hum. Behav. 2009, 25, 29–39. [Google Scholar] [CrossRef]
- Csikszentmihalyi, M.; LeFevre, J. Optimal experience in work and leisure. J. Personal. Soc. Psychol. 1989, 56, 815–822. [Google Scholar] [CrossRef]
- Ghani, J.A. Human factors in information systems. In Flow in Human-Computer Interactions: Test of a Model; Carey, J.M., Ed.; Ablex Publishing Corp.: Norwood, NJ, USA, 1995; pp. 291–311. [Google Scholar]
- Li, D.; Browne, G.J. The role of need for cognition and mood in online flow experience. J. Comput. Inf. Syst. 2006, 46, 11–17. [Google Scholar]
- Moon, J.W.; Kim, Y.G. Extending the TAM for a worldwide- web context. Inf. Manag. 2001, 38, 217–230. [Google Scholar] [CrossRef]
- Liu, Y.; Li, H. Exploring the impact of use context on mobile hedonic services adoption: An empirical study on mobile gaming in China. Comput. Hum. Behav. 2011, 27, 890–898. [Google Scholar] [CrossRef]
- Trepte, S.L.R.; Juechems, K. The social side of gaming: How playing online computer games creates online and offline social support. Comput. Hum. Behav. 2012, 28, 832–839. [Google Scholar] [CrossRef]
- Rauniar, R.; Rawski, G.; Yang, J.; Johnson, B. Technology acceptance model (TAM) and social media usage: An empirical study on Facebook. J. Enterp. Inf. Manag. 2014, 27, 6–30. [Google Scholar] [CrossRef]
- Sharma, S.; Mukherjee, S.; Kumar, A.; Dillon, W.R. A simulation study to investigate the use of cutoff values for assessing model fit in covariance structure models. J. Bus. Res. 2005, 58, 935–943. [Google Scholar] [CrossRef]
- MacCallum, R.C.; Browne, M.W.; Sugawara, H.M. Power Analysis and Determination of Sample Size for Covariance Structure Modeling. Psychol. Methods 1996, 1, 130–149. [Google Scholar] [CrossRef]
- Hu, L.; Bentler, P. Cutoff Criteria for Fit Indexes in Covariance Structure Analysis: Conventional Criteria Versus New Alternatives. Struct. Equ. Model. 1999, 6, 1–55. [Google Scholar] [CrossRef]
- Klem, L. Structural equation modeling. In Using Multivariate Statistics, 5th ed.; Tabachnick, B.G., Fidell, L.S., Eds.; Pearson Education Inc.: Boston, MA, USA, 1996; pp. 676–780. [Google Scholar]
- Miles, J.; Shevlin, M. A time and a place for incremental fit indices. Personal. Individ. Differ. 2007, 42, 869–874. [Google Scholar] [CrossRef]
- McDonald, R.; Ho, M.H. Principles and Practice in Reporting Statistical Equation Analyses. Psychol. Methods 2002, 7, 64–82. [Google Scholar] [CrossRef] [PubMed]
- Park, E.; Baek, S.; Ohm, J.; Chang, H.J. Determinants of player acceptance of mobile social network games: An application of extended technology acceptance model. Telemat. Inform. 2014, 31, 3–15. [Google Scholar] [CrossRef]
- Jiang, Y.J.J.; Palmer, I.J. Computerized Interactive Gaming via Supporting Vector Machines. Int. J. Comput. Games Technol. 2008, 2008, 186941. [Google Scholar] [CrossRef] [Green Version]
- Yun, H. Using Logistic Regression to Analyze the Balance of a Game: The Case of StarCraft II. arXiv 2011, arXiv:1105.0755. [Google Scholar]
- Zekić-Sušac, M.; Nataša Šarlija, A.H.; Bilandžić, A. Predicting company growth using logistic regression and neural networks. Croat. Oper. Res. Rev. 2016, 7, 229–248. [Google Scholar] [CrossRef] [Green Version]
- Lipovetsky, S.; Conklin, M. Analysis of regression in game theory approach. Appl. Stochastic Models Bus. Ind. 2001, 17, 319–330. [Google Scholar] [CrossRef]
- Ding, Y.Y.Z.; Kankanhalli, A. Why do I invite friends to join: An empirical study of mobile social network game. In Proceedings of the 18th Pacific Asia Conference on Information Systems, Chengdu, China, 24–28 June 2014. [Google Scholar]
- Raman, P. Examining the importance of gamification, social interaction and perceived enjoyment among young female online buyers in India. Young Consum. 2020, 22, 387–412. [Google Scholar] [CrossRef]


| S.No | Construct | Questionnaire Source |
|---|---|---|
| 1 | Use Context | [55] |
| 2 | Social Interaction | [56] |
| 3 | Perceived ease of use | [45] |
| 4 | Perceived usefulness | [57] |
| 5 | Perceived enjoyment | [57] |
| 6 | Attitude | [48] |
| 7 | Flow | [48] |
| 8 | Behavior intention | [46] |
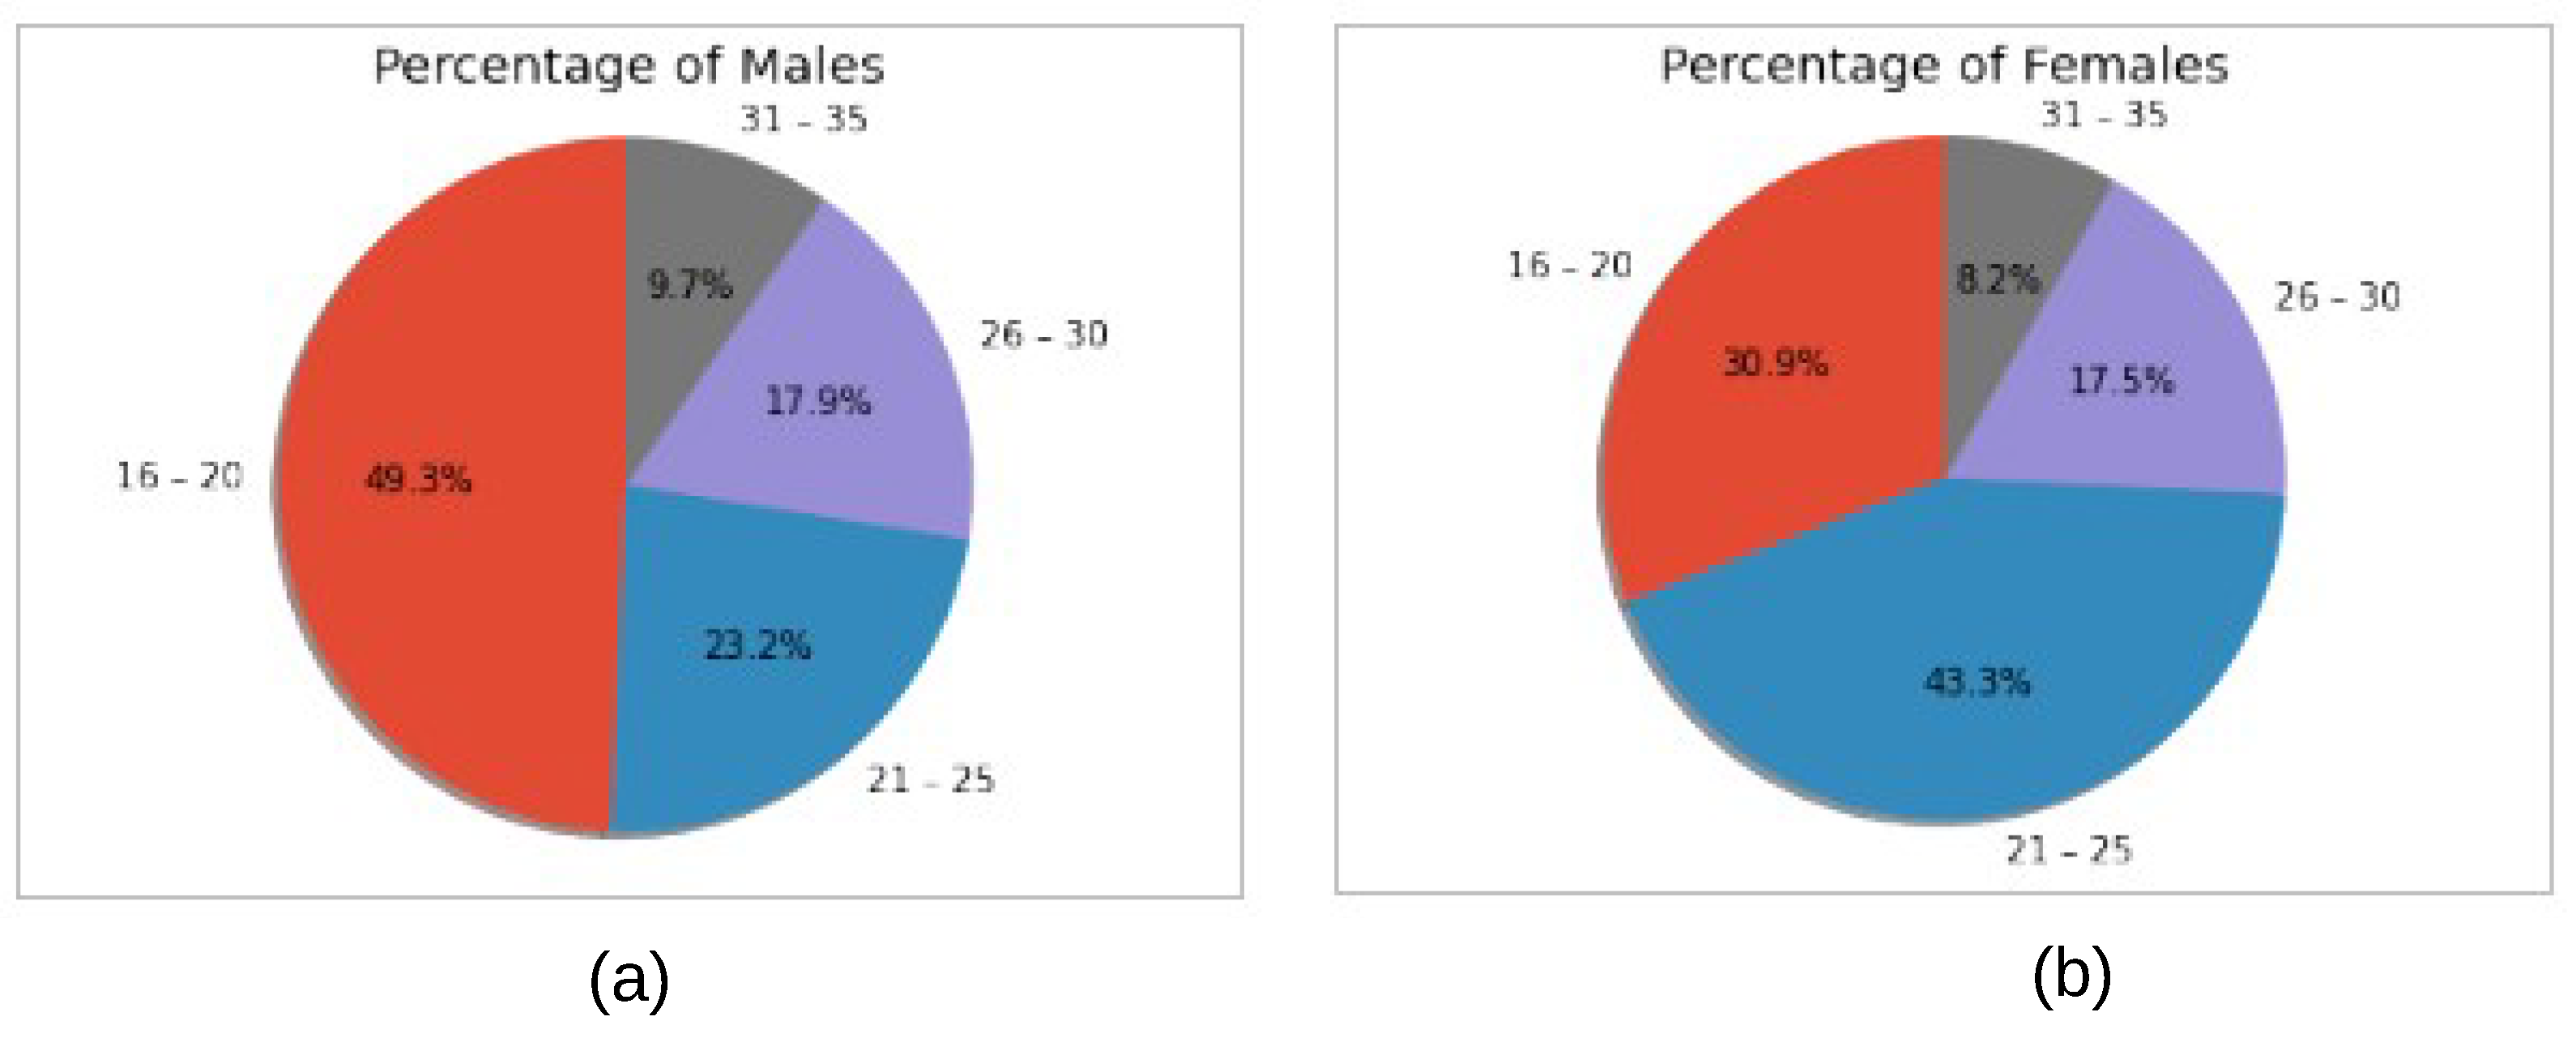
| Age Group | Male | Female | Total |
|---|---|---|---|
| 16–20 | 102 | 30 | 132 |
| 21–25 | 48 | 42 | 90 |
| 26–30 | 37 | 17 | 54 |
| 31–35 | 20 | 8 | 28 |
| Total | 207 | 97 | 304 |
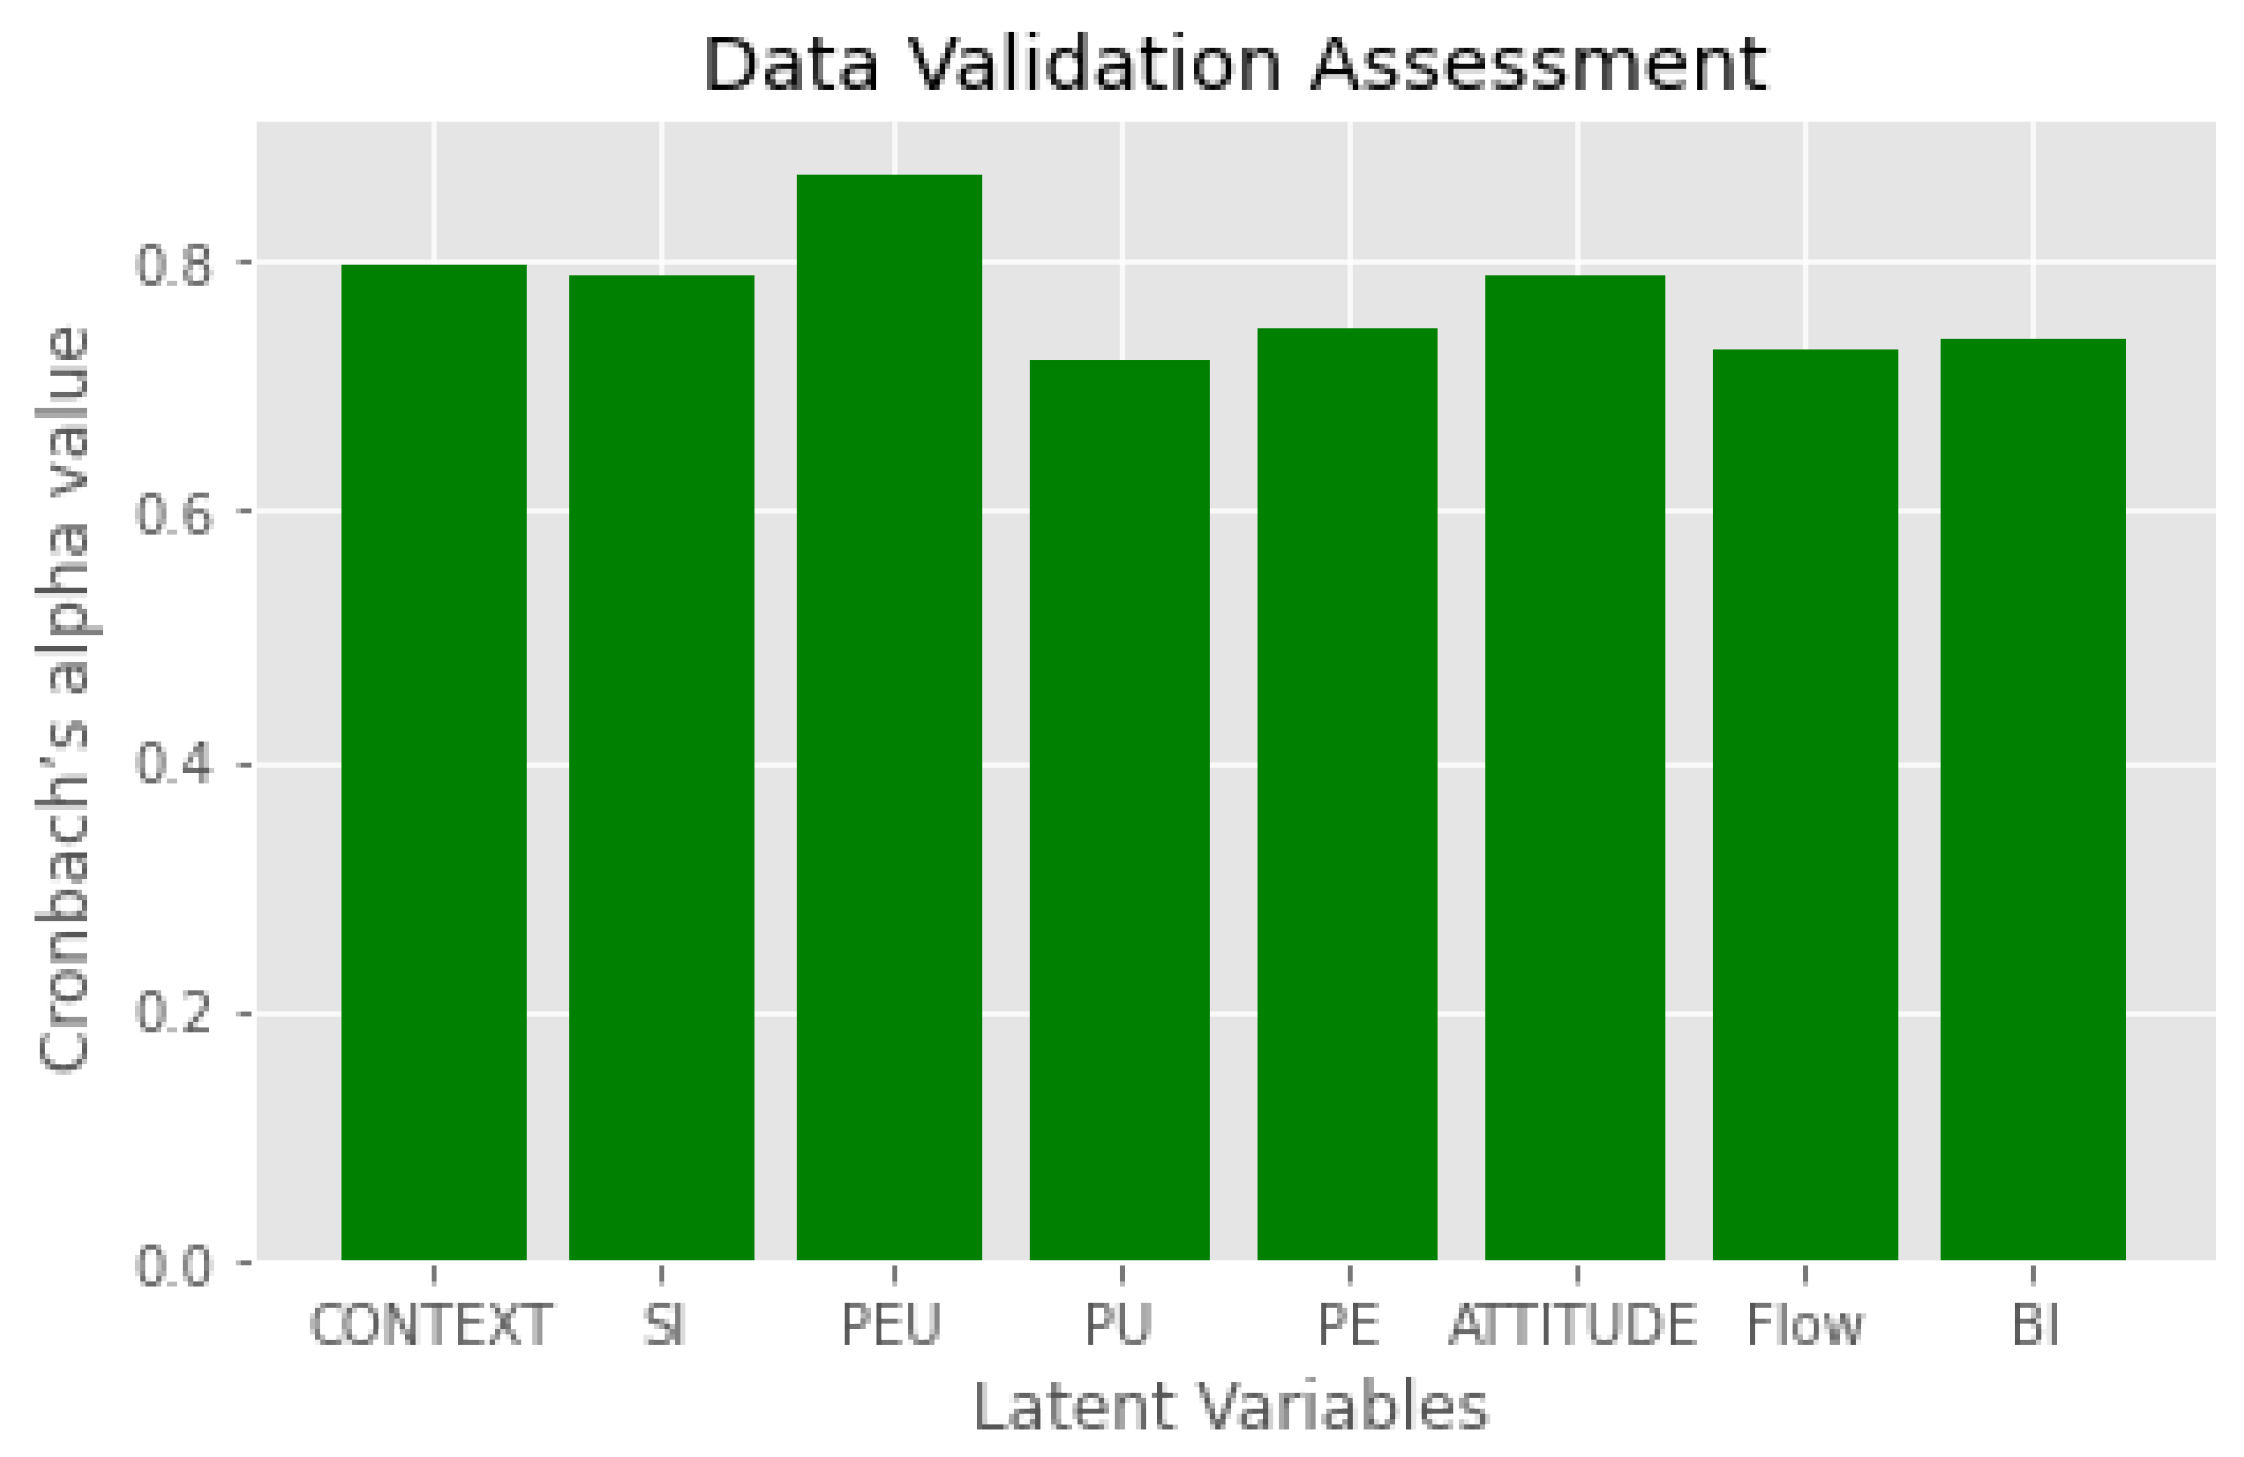
| S.No | Latent Variables | Items | Avg | SD | Avg | Cronbach |
|---|---|---|---|---|---|---|
| UC1 | 6.13 | 0.844 | ||||
| 1 | Use Context | UC2 | 6.05 | 0.951 | 5.73 | 0.798 |
| UC3 | 5.01 | 0.956 | ||||
| SI1 | 5.89 | 0.934 | ||||
| 2 | Social Interaction | SI2 | 5.68 | 1.08 | 5.76 | 0.788 |
| SI3 | 5.72 | 1.076 | ||||
| PEU1 | 5.83 | 0.766 | ||||
| 3 | Perceived ease of use | PEU2 | 6.06 | 0.778 | 5.94 | 0.871 |
| PU1 | 5.37 | 1.32 | ||||
| 4 | Perceived usefulness | PU2 | 5.42 | 1.143 | 5.35 | 0.719 |
| PU3 | 5.27 | 1.312 | ||||
| PE1 | 5.77 | 0.988 | ||||
| 5 | Perceived enjoyment | PE2 | 5.87 | 0.910 | 5.87 | 0.748 |
| PE3 | 5.90 | 0.967 | ||||
| ATT1 | 5.88 | 0.957 | ||||
| 6 | Attitude | ATT2 | 5.86 | 0.928 | 5.87 | 0.787 |
| ATT3 | 5.87 | 0.938 | ||||
| FL1 | 5.31 | 1.256 | ||||
| 7 | Flow | FL2 | 5.6 | 1.045 | 5.47 | 0.729 |
| FL3 | 5.52 | 1.158 | ||||
| BI1 | 5.89 | 0.96 | ||||
| 8 | Behavior intention | BI2 | 6.13 | 0.96 | 5.97 | 0.737 |
| BI3 | 5.90 | 1.10 |
| Latent Variable | UC | SI | PEU | PU | PE | ATT | FL | BI |
|---|---|---|---|---|---|---|---|---|
| UC | 1 | |||||||
| SI | 0.622 | 1 | ||||||
| PEU | 0.646 | 0.493 | 1 | |||||
| PU | 0.526 | 0.48 | 0.416 | 1 | ||||
| PE | 0.54 | 0.488 | 0.563 | 0.293 | 1 | |||
| ATT | 0.652 | 0.518 | 0.632 | 0.623 | 0.483 | 1 | ||
| FL | 0.562 | 0.453 | 0.476 | 0.612 | 0.373 | 0.596 | 1 | |
| BI | 0.656 | 0.518 | 0.617 | 0.563 | 0.512 | 0.688 | 0.637 | 1 |
| KMO and Bartlett | ||
|---|---|---|
| Kaiser-Meyer-Olkin (KMO) | 0.934 | |
| Chi-square test | 4519.32 | |
| Bartlett Testing | df | 324 |
| Sig. | 0.000 |
| Constructs | 1 | 2 | 3 | 4 | 5 | 6 | 7 | 8 |
|---|---|---|---|---|---|---|---|---|
| UC1 | 0.09 | 0.261 | 0.273 | 0.355 | 0.515 | 0133 | 0.032 | 0.237 |
| UC2 | 0.084 | 0.127 | 0.023 | 0.123 | 0.712 | 0.211 | 0.133 | 0.141 |
| UC3 | 0.157 | 0.117 | 0.378 | 0.125 | 0.665 | −0.011 | 0.112 | 0.17 |
| SI1 | 0.110 | 0.329 | 0.587 | 0.143 | 0.342 | 0.089 | 0.048 | 0.158 |
| SI2 | 0.236 | 0.146 | 0.724 | 0.269 | 0.08 | 0.159 | 0.198 | 0.076 |
| SI3 | 0.18 | 0.176 | 0.776 | 0.189 | 0.145 | 0.10 | 0.074 | 0.09 |
| PEU1 | 0.109 | 0.039 | 0.078 | 0.235 | 0.233 | 0.139 | 0.049 | 0.87 |
| PEU2 | −0.043 | 0.421 | 0.18 | 0.08 | 0.178 | −0.033 | 0.224 | 0.643 |
| PU1 | 0.776 | 0.138 | 0.232 | 0.098 | −0.009 | 0.244 | 0.312 | −0.011 |
| PU2 | 0.787 | 0.236 | 0.128 | 0.310 | 0.154 | 0.53 | −0.010 | −0.009 |
| PU3 | 0.837 | 0.119 | 0.187 | 0.156 | 0.183 | 0.112 | 0.0037 | 0.176 |
| PE1 | 0.297 | 0.343 | 0.37 | 0.584 | 0.109 | 0.218 | 0.8 | −0.006 |
| PE2 | 0.265 | 0.176 | 0.238 | 0.718 | 0.8 | 0.192 | 0.024 | 0.18 |
| PE3 | 0.245 | 0.164 | 0.228 | 0.589 | 0.086 | 0.079 | 0.184 | 0.265 |
| ATT1 | 0.15 | 0.616 | 0.131 | 0.381 | 0.157 | 0.188 | 0.475 | 0.152 |
| ATT2 | 0.210 | 0.658 | 0.217 | 0.277 | 0.019 | 0.248 | 0.097 | 0.065 |
| ATT3 | 0.179 | 0.567 | 0.159 | 0.341 | 0.225 | 0.009 | 0.164 | 0.146 |
| FL1 | 0.175 | 0.127 | 0.145 | 0.117 | 0.029 | 0.852 | 0.56 | 0.026 |
| FL2 | 0.235 | 0.291 | 0.183 | 0.156 | 0.231 | 0.78 | −0.134 | 0.176 |
| FL3 | 0.374 | 0.273 | 0.182 | −0.087 | 0.133 | 0.670 | 0.039 | 0.126 |
| BI1 | 0.234 | 0.365 | 0.227 | 0.318 | 0.342 | 0.62 | 0.512 | 0.110 |
| BI2 | 0.112 | 0.065 | 0.157 | 0.076 | 0.475 | 0.067 | 0.645 | 0.184 |
| BI3 | 0.359 | 0.072 | 0.243 | 0.303 | 0.224 | 0.19 | 0.547 | 0.085 |
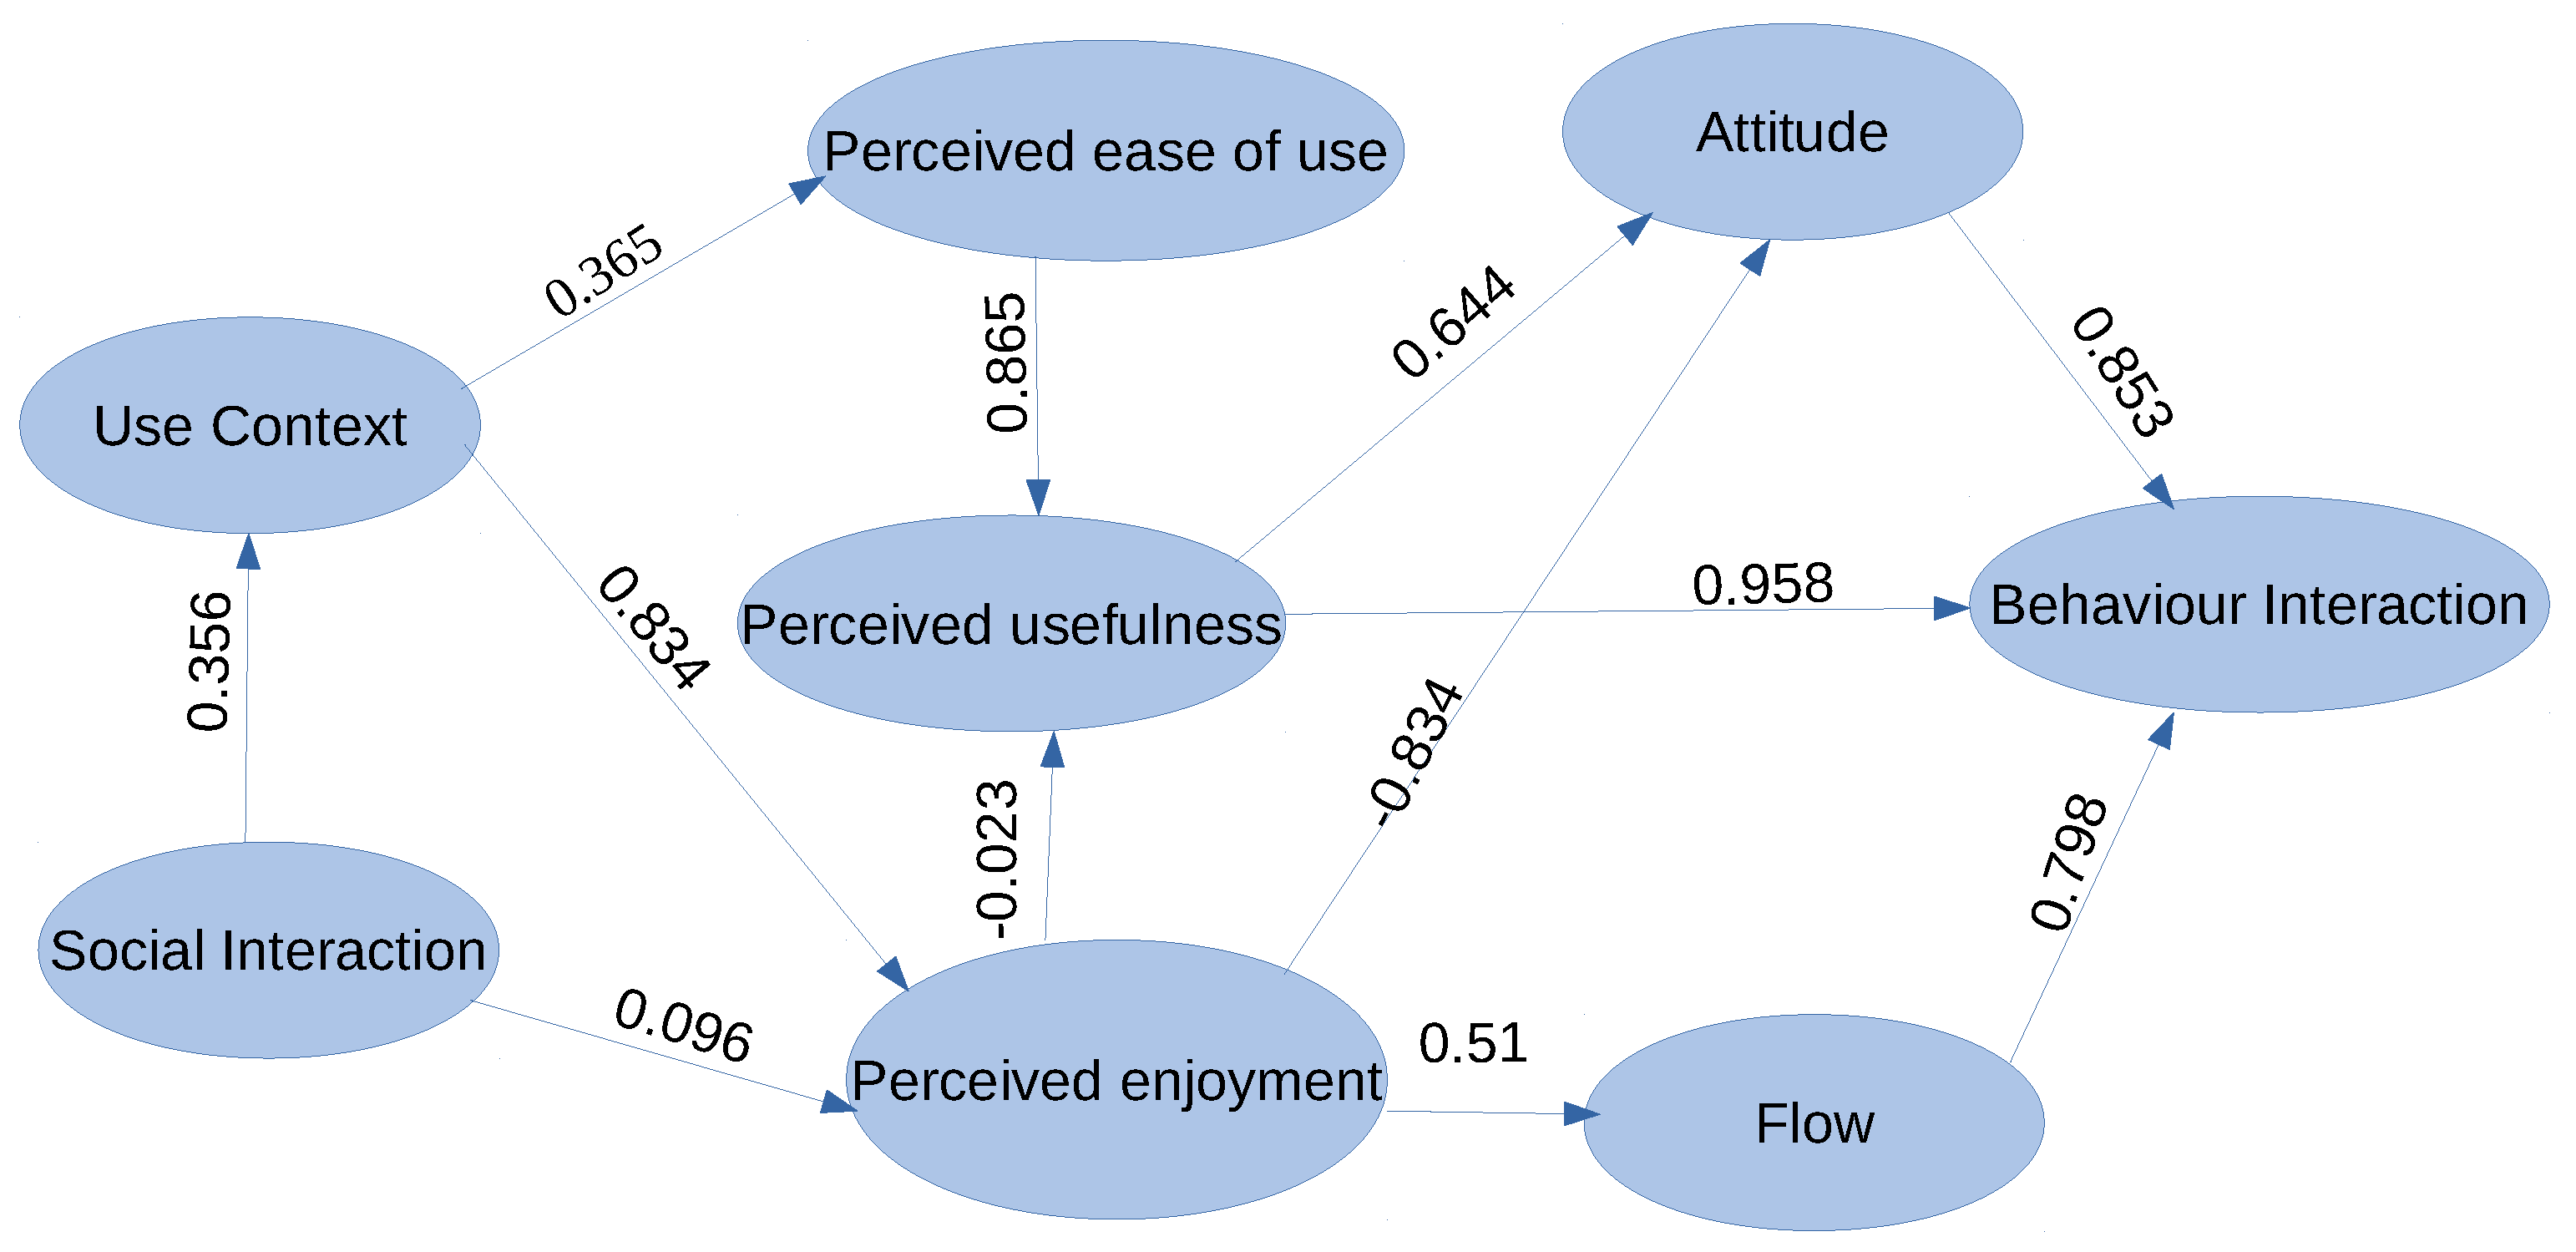
| Hypothesis | Construct Relationship | Estimate | Decision |
|---|---|---|---|
| H1 | SI ⟶ UC | 0.356 ** | Supported |
| H2 | SI ⟶ PE | 0.096 * | Supported |
| H3 | UC ⟶ PE | 0.0843 *** | Supported |
| H4 | UC ⟶ PEU | 0.365 ** | Supported |
| H5 | PEU ⟶ PU | 0.0865 *** | Supported |
| H6 | PE ⟶ PU | −0.023 | Not Supported |
| H7 | PE ⟶ FL | 0.51 * | Supported |
| H8 | PU ⟶ ATT | 0.644 *** | Supported |
| H9 | PE ⟶ ATT | −0.834 | Not Supported |
| H10 | ATT ⟶ BI | 0.853 *** | Supported |
| H11 | FL ⟶ BI | 0.798 *** | Supported |
| H12 | PU ⟶ BI | 0.958 *** | Supported |
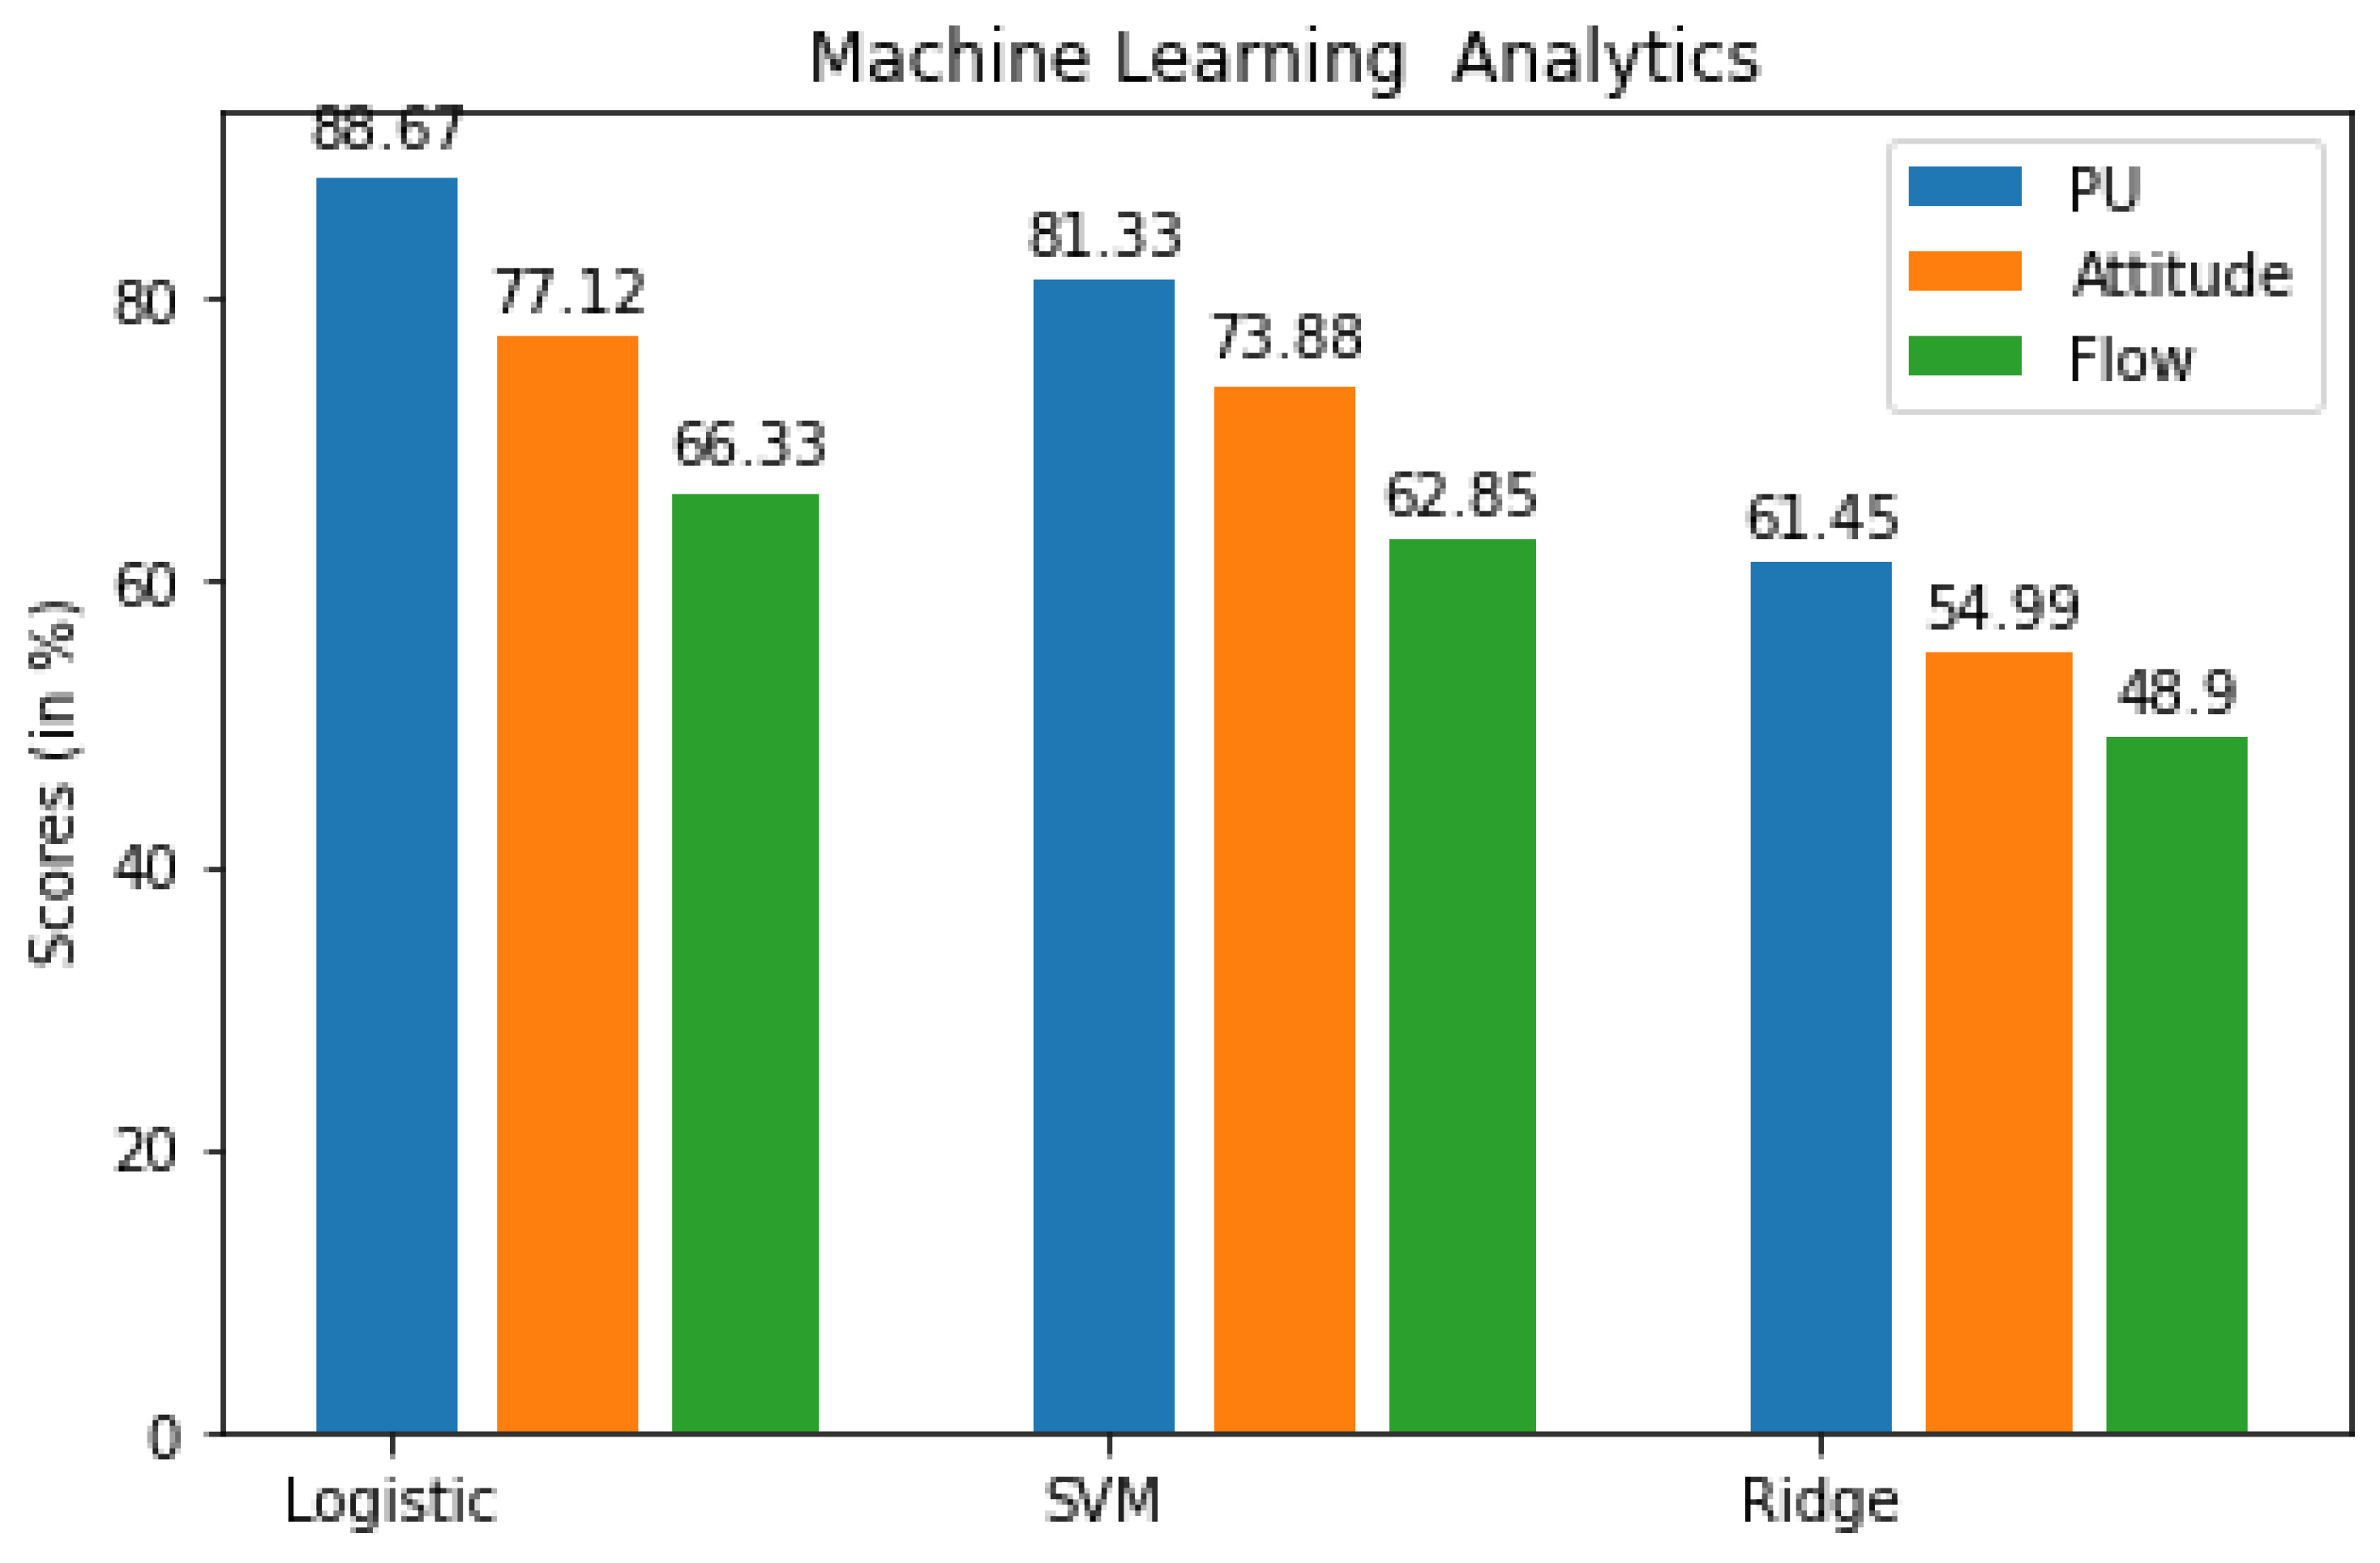
| PU (%) | Attitude (%) | Flow (%) | |
|---|---|---|---|
| Logistic | 88.67 | 77.12 | 66.33 |
| SVM | 81.33 | 73.88 | 62.85 |
| Ridge | 61.45 | 54.99 | 48.90 |
| Precision | Recall | F1 | Accuracy | |
|---|---|---|---|---|
| Logistic | 83.41 | 88.72 | 86.17 | 89.0 |
| SVM | 80.48 | 87.11 | 82.66 | 87.34 |
| Ridge | 60.55 | 62.05 | 61.13 | 62.12 |
Publisher’s Note: MDPI stays neutral with regard to jurisdictional claims in published maps and institutional affiliations. |
© 2021 by the authors. Licensee MDPI, Basel, Switzerland. This article is an open access article distributed under the terms and conditions of the Creative Commons Attribution (CC BY) license (https://creativecommons.org/licenses/by/4.0/).
Share and Cite
Chauhan, S.; Mittal, M.; Woźniak, M.; Gupta, S.; Pérez de Prado, R. A Technology Acceptance Model-Based Analytics for Online Mobile Games Using Machine Learning Techniques. Symmetry 2021, 13, 1545. https://0-doi-org.brum.beds.ac.uk/10.3390/sym13081545
Chauhan S, Mittal M, Woźniak M, Gupta S, Pérez de Prado R. A Technology Acceptance Model-Based Analytics for Online Mobile Games Using Machine Learning Techniques. Symmetry. 2021; 13(8):1545. https://0-doi-org.brum.beds.ac.uk/10.3390/sym13081545
Chicago/Turabian StyleChauhan, Shaifali, Mohit Mittal, Marcin Woźniak, Swadha Gupta, and Rocío Pérez de Prado. 2021. "A Technology Acceptance Model-Based Analytics for Online Mobile Games Using Machine Learning Techniques" Symmetry 13, no. 8: 1545. https://0-doi-org.brum.beds.ac.uk/10.3390/sym13081545