
An Anomaly-Based IDS Framework Using Centroid-Based Classification


1
Department of Management Information Systems, National Chung Hsing University, Taichung 402, Taiwan
2
Department of Computer Science, University of Warwick, Coventry CV4 7AL, UK
*
Author to whom correspondence should be addressed.
Symmetry 2022, 14(1), 105; https://0-doi-org.brum.beds.ac.uk/10.3390/sym14010105
Submission received: 30 November 2021
/
Revised: 20 December 2021
/
Accepted: 4 January 2022
/
Published: 8 January 2022
(This article belongs to the Special Issue Information Security and Cryptology: Advanced Technologies in Symmetry/Asymmetry)
Abstract
:Botnet is an urgent problem that will reduce the security and availability of the network. When the bot master launches attacks to certain victims, the infected users are awakened, and attacks start according to the commands from the bot master. Via Botnet, DDoS is an attack whose purpose is to paralyze the victim’s service. In all kinds of DDoS, SYN flood is still a problem that reduces security and availability. To enhance the security of the Internet, IDS is proposed to detect attacks and protect the server. In this paper, the concept of centroid-based classification is used to enhance performance of the framework. An anomaly-based IDS framework which combines K-means and KNN is proposed to detect SYN flood. Dimension reduction is designed to achieve visualization, and weights can adjust the occupancy ratio of each sub-feature. Therefore, this framework is also suitable for use on the modern symmetry or asymmetry architecture of information systems. With the detection by the framework proposed in this paper, the detection rate is 96.8 percent, the accuracy rate is 97.3 percent, and the false alarm rate is 1.37 percent.
1. Introduction
Botnet is an urgent problem that will reduce the security of the network [1,2]. The users are infected by their bad habits when using Internet, such as surfing unknown websites that have attractive information or downloading illegal software. Malware usually hides behind the malicious websites and the illegal software. For example, if someone downloads a cracked software, for which it is not needed to pay any money, hackers usually inject some malicious codes in it and do not allow users to see the malicious codes. Then hackers can use the malicious software to control infected users to do anything that they want. Botnet, a concept of collecting infected users controlled by hackers, is called bot master. The infected users are all implanted in malware, and in the worst case, they have no way of knowing they are the members of Botnet. When the bot master launches attacks to certain victims, the infected users are awakened and implement attacks according to the commands from the bot master [3,4]. The members of Botnet are the bot master, the control and command server, the bot, and the victims. The bot master is the one who controls Botnet and launches attacks. The control and command server is the communication station between the bot master and bots. Bots are the infected users that are totally controlled by the bot master, and the victim is the attacked target, which usually has some interests that can attract attackers. The infrastructure of Botnet can be also categorized into different types, such as centralized or decentralized Botnet [5,6,7]. Centralized Botnet is the traditional botnet, which has the control and command server (C&C server). If a researcher or detection system can find out the IP address of C&C server, it is easy to take down the Botnet. Compared to centralized Botnet, decentralized Botnet is also called P2P Botnet, which has no control and command server, or the control and command server changes quickly. Most researchers are concentrated on the issue about decentralized Botnet because it is harder to take it down.
Denial of service (DoS) is one of common attacks from the Internet [8,9,10]. The goal of this attack is to interrupt the victim’s service. By sending a large number of packets, DoS makes the victim overwhelmed so that the service will break off. DoS can be categorized into two types: bandwidth consumption and computation resource consumption [11]. Bandwidth consumption paralyzes the victim’s network by occupying all the bandwidth of the server or personal computer. Due to the decrease of bandwidth which can be used, the victim cannot connect to the Internet. For bandwidth consumption, there are three kinds of DoS attacks: User Datagram Protocol (UDP) flood, ping of death, and ICMP flood [12]. Computation resource consumption paralyzes the victim’s computing capacity by depleting all the computing resource of the server or personal computer. Due to the decrease of computing resource which can be used, the victim cannot perform data analysis. For computation resource consumption, there are four kinds of DoS attacks: SYN flood, land attack, CC attack, and application-level flood. No matter which kind of DoS attack, the purpose is to paralyze the victims and obtain benefits from them. Distributed denial of service (DDoS) is an improved DoS attack. DoS attack is one point to one point, but DDoS attack is multiple points to one point. It is clear that DDoS has a larger scale of attack. The DDoS originated from Botnet is more destructive when there is a number of bots. In several kinds of DDoS attacks, SYN flood is still a serious problem [13]. SYN flood is one of the computing resource consumption attacks that exploits the vulnerability of protocol TCP [14,15]. In protocol TCP, a three-way handshake is needed when a connection is established. In the process of this three-way handshake, if a user wants to connect to a server, the user sends the connection request by sending one SYN (Synchronize Sequence Number) packet to the server. Then the server agrees the connection request by replying one SYN/ACK packet back. At last, the user sends the ACK (Acknowledgement) packet to acknowledge that the notification is received, and the connection will begin. Three-way handshake is the protocol that ensures the security and stability of the connection, but the attacker uses the vulnerability of this protocol by sending a larger number of SYN packets to the server, making the server full of connection requests without connections existing so the legal user cannot connect to the server or the Internet due to low computation resource.
To enhance the security of the Internet, Intrusion Detection System (IDS) and Intrusion Protection System (IPS) are proposed [16,17]. The purpose of installing IDS or IPS is to detect attacks from the Internet by analyzing their behavior models. For instance, if the behavior model of distributed denial of service is that the same type of packet accounts for eighty percent of all packets in a time period, then this behavior model will be set in the IDS or IPS. When IDS or IPS discovers the status of packets obeying certain rules, then the IDS or IPS will give an alarm to the user. Several researchers are concentrated on the issue of the methodology that can effectively detect the attacks. An IDS can be separated into three parts: packet sniffing, data analysis, and result output. The key part in IDS is the data analysis phase, which can determine the effectiveness of the overall system. The data analysis phase can be separated into two steps: feature selection and classification or prediction. These two steps have a great deal of influence on the detection result. Feature selection is the step that selects out the better combination of features that can be used to detect certain attack from the Internet, and classification is the step that classifies normal packet data and attacked data. The concept of machine learning is used in data analysis, and the common machine learning algorithms, which are used in IDS, are K-nearest neighbor, naive bayes, neural network, support vector machine, and so on [18,19,20,21]. In addition to machine learning, statistics are also a common way used to detect attacks. According to the type of detecting, IDS can be categorized into two types: anomaly-based IDS and signature-based IDS. Anomaly-based IDS just classifies data into normal data or attacked data. Compared to anomaly-based IDS, signature-based IDS can classify packet data into the categories that are set previously. Two kinds of IDS have different advantages. Anomaly-based IDS can detect unknown attacks, but the accuracy is worse than signature-based IDS. In a different network environment, a different IDS is used to detect attacks.
The goal of this paper is to propose a framework of an intrusion detection system to be used to detect SYN flood attack. This framework is also suitable for use on the modern symmetry or asymmetry architecture of information systems. To raise up the accuracy, several experiments are designed to find out the optimal combination of parameters. In the remainder of this paper, Section 2 is the related works about the detection, Section 3 is the framework designed to detect SYN flood attack, Section 4 is the experiment results, and Section 5 is the conclusion.
2. Related Works
In this section, two algorithms and one concept of combining two algorithms are described. The main classification algorithms in this paper are K-means and K-nearest neighbors algorithm, where K-means is used to classify data in data pre-processing phase, and K-nearest neighbors algorithm is used in the analysis phase. The methodology with two times of classification is that centroids of data are calculated first, called centroid-based classification, that has data classified into certain categories before the analysis phase [22,23,24,25,26,27,28]. This kind of classification is used to solve some problems, and then enhance overall performance. In this paper, centroid-based classification is used to solve the concentration of the dataset which is not suitable for the normalization, as shown in Equation (2).
2.1. K-Means
K-means is a common classification algorithm used to achieve data compression and classification [29]. Through modifying cluster centers continuously, the result can represent the centroid of the data set. The centroid means the point that most of the data are around. Instead of a large number of data, one centroid can represent a large number of data, so it achieves the purpose of compression. The input data will be classified into certain categories according to the final centroids. The process of K-means is shown in Figure 1. First, the cluster center number has to be set. If the cluster center is set at ten, then ten random cluster centers will be set, and the mean of the cluster center number is calculated. In the initial phase, the mean of all centroids will be the same as the centroid because there is only one member in each group. After the initial phase, new training data will be input to train the K-means model. The new data has to calculate Euclidean distance to each centroid, as shown in Equation (1). in Equation (1) is the new data, and is the value of the cluster center.
After Euclidean distances are calculated, it is necessary to find a minimum value from them, and the smaller value means the new input data is nearer to the cluster center. Then the new node will be added to the centroid which has the minimum distances, and the next step is to update the mean of the cluster center because there is a new node being added which will cause a change of overall mean. Finally, if the terminal condition is achieved, the training phase of K-means will be over and the final centroids output. Otherwise, the K-means model will keep training with new training data.
2.2. K-Nearest Neighbor
The concept and purpose of K-nearest neighbor are similar to K-means. They are two common algorithms used to classify data [30], but the process of classification has some difference between them. First, an important parameter K has to be set, and it means the number of majority votes in the classification phase. Data type can be separated into three types: training data, sample data, and testing data. Training data is used to train the KNN model, sample data is used to be the default standard, and testing data is used to test the KNN model. After K is set, each training data will calculate Euclidean distances with all the sample nodes. Then the distances are ordered in descendant order, and the top K nodes are taken out. The majority voting will be held on these K nodes, which have been known as normal data or attacked data. As shown in Figure 2, if K is equal to three, the top three nodes are one normal data and two attacked data. Then the training node will be categorized into attacked data because the number of attacked data is greater than that of normal data. The training data will become another new sample data after majority voting. When the next training data inputs, the process, which is described above, will repeat again and again and the number of sample data becomes larger. If the terminal condition is achieved, the KNN model stops training, and testing data will be input to test the trained KNN model.
3. Proposed Framework
In this section, a framework shown in Figure 3 is proposed to detect SYN flood attack using centroid-based classification. This framework is designed as an intrusion detection system and has better performance on detecting SYN flood attack caused by Botnet. It can be separated into seven phases: packet sniffing phase, feature extraction phase, data preprocessing phase, cluster center calculating phase, weight calculating phase, dimension reduction phase, and classification phase. Different phases have different goals, and the last four phases are the core phases of the framework proposed in this paper. The packet sniffing phase collects packet data, which is called raw data in our framework, from the campus network and stores it in a database. The feature extraction phase extracts useful features, and in the data preprocessing phase, raw data will be calculated into a particular form designed in this paper. In the cluster center calculating phase, common normalization is not used due to the distribution of data collected in the first phase. Instead of normalization, as shown in Equation (2), cluster center is a better choice that can represent the data belonging to which group. In Equation (1), Xi is the raw data of the sub-features which are not normalized, Xmax is the maximum value of feature i, Xmin is the minimum value of feature i, and Xnew is the new value that has been normalized. In order to increase the performance of the framework, the weight of all features is calculated. Before classifying data into normal or attacked data, dimension reduction is needed to merge features and weight into three features. With only three features, it can be visualized and easier to find out the difference among normal data and attacked data. Finally, K-nearest neighbor is applied to classify the data. Detailed information of the framework is described as follows.
3.1. Packet Sniffing Phase
To analyze the difference between normal data and attacked data from Botnet, an environment that includes attackers and victims is needed. All activities will leave records when they involve the transmission of data via Internet. To the victims, they use the Internet to complete work tasks or watch videos to relax, and to the attackers, they attack the victims by applying DDoS attacks. No matter what they do and who they are, packet data will be recorded. Some issues, like the victim’s behavior or the attacker’s attack mode, can be easily analyzed so to enhance the security of personal computers or servers.
In this paper, Wireshark is used to be the packet sniffer to capture packet data from the Internet. From several kinds of sniffer, Wireshark was selected because of its usability, and it can sniff all kinds of protocols. In order to detect a SYN flood attack, a filter is used to filter packets whose protocol is TCP (SYN flood attack used the vulnerability of three-way handshake in protocol TCP). There is another advantage about using a packet filter, and that is the memory saving of database. If all kinds of protocols, such as TCP, UDP, ICMP are used, the size of database will be huge, and it will spend more time extracting features. In this phase, packet data for which protocol is TCP will be stored in database as raw data.
3.2. Feature Extraction Phase
The raw data is the SYN packet, which is normally generated when a client attempts to start a TCP connection to a server, and the client and server exchange a series of messages. The three-way handshake normally runs like this: (1) The client requests a connection by sending a SYN message to the server; (2) The server acknowledges this request by sending SYN-ACK back to the client; and (3) The client responds with an ACK, and the connection is established.
After analyzing the DOS attack behavior, we found the changes in packet characteristics include the number of packet (NP), the percentage of SYN packet (SYN), the percentage of ACK packet (ACK), the standard deviation of packet length (PLDEV), the different country of packet (NCON), and the different IP of packet (NIP). Figure 4 shows the statistic of normal data and attacked data, where the bold line presents normal data and the dotted line presents attacked data. When SYN flood attack happened, the value of four features increased (NP, SYN, NCON, and NIP). The reason for the raises is the characteristic of DDoS attack. No matter which kind of DDoS attacks, such as SYN flood, PING flood or UDP flood, the attacker usually controls a large number of bots and sends packets to the victim via bots. Whenever the victim encounters a DDoS attack, the packets received will increase largely, and with the increase of the number of packets, the number of different IP addresses and the number of different countries also increases due to spoofing attack. When a SYN flood happens, it comes with numerous packets with the flags (SYN) to deny the victim’s connection to the Internet. The percentage of SYN packets will increase and be the main part of the captured packets. The value of two features decreases (ACK and PLDEV). When the packets captured are full with SYN packets caused by SYN flood attack, the percentage of ACK packets will decrease. With the increase of SYN packets and the decrease of ACK packets, it is possible that the victim encounters SYN flood attacks. The standard deviation of packet length is also decreased because attackers usually send the same packets which have the same packet length. If too many packets of the same size exist, the standard deviation of packet length will be reduced.
Therefore, these features, as shown in Table 1, are designed for detecting SYN flood attack, and it can be visualized. With the concept of visualization, features can be put on a three-dimension space, and three axes are defined as follows. Axis X is the characteristic of packet, axis Y is the characteristic of flag, and axis Z is the source of the packet. Each feature is composed by two sub-features, and two sub-features will be combined with a weight value, which will be described in the following section. For the characteristic of packet, X is composed by the number of packets and the deviation of packet length, for the characteristic of flag, Y is composed by the percentage of SYN packet and the percentage of ACK packet, and for the source of the packet, Z can be separated into the number of different countries and the number of different IP addresses. Three features are shown in Table 1.
Three features are designed for many reasons according to the behavior of SYN flood. When the victims encounter a SYN flood attack, some value will change, such as the number of packets, the number of SYN packet and so on, and it means that some information in the packet may change. The purpose of the feature extraction phase is to find out the feature set and extract them from the raw data, and some value should be calculated in the next phase. In the feature set, Axis X is responsible for detecting whether the number of packets has significant incensement or a large number of the same types of packets, axis Y is responsible for detecting whether the flag in the packet has altered, and for axis Z, it can detect whether there exists a large number of packets that belong to the same host or country. Different features are designed to detect different kinds of SYN flood attacks, which can be categorized into four types: high rate and spoofed attack, high rate and unspoofed attack, low rate and spoofed attack, and low rate and unspoofed attack. Spoofed attack, where the attack forges their source IP address, is one of the common attacks from the Internet, and it means that the detection system or expert cannot find out the real IP address that the attacker owns. Three features are used to detect different kinds of attacks. For example, axis X and axis Y are used to detect whether the number of packets belongs to attacked data or not, and axis Z is used to detect whether this attacked data belongs to spoofed attack or unspoofed attack.
3.3. Data Pre-Processing Phase
Three features are designed in the feature extraction phase, and each feature can be separated into two sub-features. All of the sub-features should be calculated using statistical methods. Based on a flow analysis, packet data is captured and separated into six parts according to its timestamp. While four hours is set as a zone, it will separate one day into six parts, and it means six records with six features are collected in one day. The number of packets, the deviation of packet length, the percentage of SYN packet, and the percentage of ACK packet can be easily calculated in statistical ways. The number of different countries and number of different IP addresses should be compared with the database that contains the association of IP addresses and countries. This step will take more time because of the large size of data, but it will be useful to detect whether the test data has an unusual number of connections.
3.4. Cluster Center Calculating Phase
After the pre-processing phase, raw data was transmitted into different forms including six sub-features and its category (normal data or attacked data). Most of the research will do a normalization phase to limit value into the scope from zero to one, but it is not suitable in this paper because the distribution of the data is not evenly distributed. As shown in Figure 5, it is the distribution of the pre-processed data, and it has an important characteristic: the value gathers in some groups instead of distributing averagely. For instance, the sub-feature NCON (number of different country) has three groups visually, and they are around 6150 and 180. If Equation (2) is used to normalize, some values which have meaning will be missed. For example, there are five groups in Figure 6, where there are three groups gathered around from 10 to 100. These three groups may have their unique meanings, such as low usage of Internet, medium usage of Internet, and high usage of Internet. If Equation (1) is used, these three groups will be the same group, and it will reduce the quality of detection.
To solve this problem, the concept of a cluster center is a better choice than Equation (2). K-Means is used to find out the cluster centers by adjusting the average of each group continually, and it is suitable for the data in this paper. According to Figure 6, there is an example that can explain the difference between Equation (2) and K-Means in Table 2. Assuming there are 100 points around 10, 300 points around 20, 200 points around 100, 50 points around 15,000, and 100 points around 100,000, the standard deviation is 38,920.5, and it means there is a large gap between values. If Equation (2) is used to normalize, 10, 20, and 100 will be the same group, and the detection system cannot analyze more accurately.
Figure 7 is the excepted result of using K-Means to find cluster centers instead of using Equation (2). While there are five groups around 10, 20, 100, 15,000 and 100,000, the number of cluster centers is set at five. In order to find a suitable number of cluster centers, there is an experiment in Section 4. There is an example of data which was processed after the cluster center calculating phase, as shown in Table 3. In Table 3, all raw data are transferred into an integer where the maximum is the number of clusters in K-Means, 0 in category means normal data, and 1 in category means attacked data.
3.5. Weight Calculating Phase
To increase the performance of the detection result, weight is designed for six sub-features. The concept of weight is that every feature has its own influence on the result, for example, assuming sub-feature NCON is a key feature that has more influence, and it can detect almost 40% of attacks, then the weight of NCON will be higher. If weight is designed for sub-features, and every sub-feature has its own weight, it will be helpful for the next phase. Some features may have an influence on the category, and some may not. If the feature has little influence or has nothing to do with the category, it is suggested that the feature is not suitable, and it should be deleted. The issue about selecting features is called feature selection, which is a methodology that uses machine learning or statistical ways. Much research has discussed how to enhance the performance or the efficiency. Some algorithms, like SVM, sequential forward selection and etc., are proposed to compare their performance, and some researchers have combined two algorithms to improve the weakness of algorithms.
In this paper, a statistic method is used to calculate weights in this phase, and the weight is calculated in correlation coefficient, as shown in Equation (3). In Equation (3), rab is the correlation coefficient of the selected feature and the category (normal data or attacked data); and are the averages of a and b, respectively; S is the standard deviation; a and b are the percentage of two categories. In all kinds of correlation coefficients, point-biserial correlation is used. Point-biserial correlation can be used to analyze which type of data is binary. In this paper, the category is 0 or 1, which presents normal data or attacked data. If correlation coefficient is used to calculate the weight of six sub-features, point-biserial correlation is the better choice. Finally, the weights of six features with values between 0 and 1 are calculated, and the result of this phase will be the input to the dimension reduction phase, which is used when two sub-features are combined into a feature (axis X, axis Y and axis Z) in the next phase. If the weight is near 1, it means that the feature has more influence, and the value of the axis which includes that feature will be larger.
3.6. Dimension Reduction Phase
In this phase, six sub-features will be sorted into three features. According to Table 1, axis X has NP (number of packet) and PLDEV (deviation of packet length), axis Y has SYN (percentage of SYN packet) and ACK (percentage of ACK packet), and axis Z has NCON (number of different country) and NIP (number of different IP address). One feature is composed of two sub-features, and sub-features will be merged in this phase. How to merge two sub-features is an important issue, and the method of this phase will influence the detection rate. Equation (4) is the proposed method to achieve dimension reduction, where W is the weight. Basically, the method of dimension reduction phase is to calculate the sum of two sub-features and merge them into one feature. While every sub-feature has its influence, weight is used to adjust the original value. For example, if WNP is near 1, then will keep its original value, but if WNP is near 0, which means it has very low correlation with the category, will be near 0, and axis X only has the sub-feature PLDEV. Through the adjustment of the weights, the values of the sub-features may be larger or smaller. There is an example describing the data after dimension reduction phase in Table 4.
With the processing of dimension reduction, there are two advantages. First, one axis has two sub-features, and it is combined by two sub-features with their weights. Since axis X, Y, and Z represents different meanings, which are the characteristic of packet, characteristic of SYN and the source of the packet, each axis should be subdivided and data for each packet should be collected in detail. Take axis X as an example. X is the feature that is used to detect whether the number of packets has a large increase. Axis X is combined by two sub-features, and it is more reliable because the characteristic of the packet is not only determined by one sub-feature. Two sub-features, which are helpful for detecting and increasing performance, are combined into one feature with their weights. Dimension reduction also has another advantage and that is the visualization because of the number of features. With only three features, it can be put on a 3-d space and the distribution of normal data and attacked data is very clear. If the difference of the distribution can be easily found, the classification phase will have better performance.
3.7. Classification Phase
The above six phases are the preparation of classification, including packet sniffing, data pre-processing, cluster center calculating, weight calculating, and dimension deduction. The key phase in this paper is how to classify normal data and attacked data, and it is described in this section. In the classification phase, K-nearest neighbor is used to classify normal data and attacked data. The pre-processed data in Table 4 will be separated into two categories: training data and testing data. Training data is used to construct the model that contains normal data and attacked data, and it is also called normal traffic model. Testing data is the data that tests the normal traffic model, and the detection rate, accuracy rate, and false alarm rate are calculated according to the result. The reason that K-nearest neighbor has been chosen as the classification algorithm is that it is easy to implement and does not need complicated computation. In most papers, the research domain is intrusion detection system, and reaction time is one of the most important targets. Although detection rate is important, many researchers concentrate on the real time intrusion detection system, and it means the reaction time is one of the key factors. With less reaction time, attacks can be detected and solved, and therefore cause less damage to the servers or personal computers.
4. Experiment
In order to evaluate the performance of the framework proposed in this paper, five experiments are designed. The goal of the five experiments is to find out the best combination of parameters in the classification and the number of the cluster centers. The first experiment is to find out and calculate the weight of the six sub-features; the second one is to find out the optimal number of cluster centers; the third one is to find out the optimal percentage of training data and testing data; the fourth one is to find the optimal K in K-nearest neighbor, and the last one is to determine whether the weight is useful or not. Finally, the best combination of parameters will be obtained, and the experimental results including numerical and graphical data will be shown.
4.1. Data Set
The packet data is collected in the campus network for about two months. As mentioned in the feature extraction phase, four-hour is a unit that separates a day into six parts. In order to promote the reliability of the dataset, some raw data is deleted due to the disconnection of network or the outage of electric power. Raw data contains two kinds of data: normal and attacked data. Normal data is the packet that shows the user utilizing the Internet as usual, doing things such as surfing social websites, watching videos, or chatting via communication software. Because of the same behavioral model of certain users, the usage of Internet will be similar, and the packet flow caused by the behavioral model can be taken as the normal data that is not under attack. Every personal computer or server may have different usage, so it is needed to construct a normal traffic model for each computer. In this paper, the packet data is collected on a user that uses the Internet to work and entertain for nearly eight hours in a day. The activity of this user contains video watching and information searching mostly. Attacked data is gotten by the attack generator, and TFN2K is used to launch SYN flood attack [30]. TFN2K can launch several kinds of DDoS attacks, like SYN flood, UDP flood, ICMP flood, etc. Because the goal of this paper is to propose a framework to detect SYN flood attack, TFN2K is used to generate only a SYN flood to the victim.
After sniffing for around two months, the statistical data is shown in Table 5. There are 208 normal data (the percentage is 51.23%) and 198 attacked data (the percentage is 48.77%). In the attacked data, four kinds of SYN flood attacks are simulated, which includes high rate and spoofed attack, high rate and unspoofed attack, low rate and spoofed attack, and low rate and unspoofed attack. High rate or low rate attack depends on the length of the attack time, and spoofed or unspoofed attack depends on whether the source of the attacker is fake or not.
4.2. Evaluation Standard
In most papers corresponding to intrusion detection systems, some evaluation standards are used to prove the performance of the proposed framework or algorithms. In this paper, the standards used to evaluate the framework are confusion matrix, accuracy rate, detection rate, and false alarm rate. In experiments for finding the best combination of parameters, only accuracy is used. As a result, the best parameter combination is found, and all criteria will be used to demonstrate the performance of the proposed framework.
Confusion matrix is one of the common methods widely used in intrusion detection systems and other issues. It consists of four parts: true positive (TP), true negative (TN), false positive (FP), and false negative (FN), as shown in Table 6.
Each of them represents the result of whether the type of data is the same or different after the classification or prediction. According to the confusion matrix, accuracy rate, detection rate, and false alarm can be calculated. Accuracy rate is the condition that normal data is classified into normal data, and the attacked data is classified into attacked data, as shown in Equation (5). Detection rate is the condition that to certain types of data, the correctness of the classification is calculated, as shown in Equation (6). False alarm rate is the situation that the result of classification is wrong, as shown in Equation (7). To any kinds of intrusion detection system, it is better to have a higher accuracy rate, higher detection rate, and lower false alarm rate, which means the intrusion detection system proposed has good performance.
4.3. Weight
After packet data is collected, the weights of six sub-features are calculated, as shown in Table 7. The weights can be explained as the influence of six sub-features to the classification result. In the features designed in this paper, SYN and ACK have more influence in the category, but PLDEV and NIP have less. In correlation analysis, it has significant influence if the correlation coefficient is greater than 0.4. Five sub-features have significant influence among them, and the correlation coefficient of SYN is 0.90. It is reasonable because the detection model is designed for detecting SYN flood attack, and the characteristic has a large number of SYN packets. According to the result of weights, the influence of six sub-features can be ordered, and the order is SYN, ACK, NP, NCON, NIP, and PLDEV. It can be used to provide the recommendation of detecting SYN flood attack. The weight will be used in the dimension reduction phase to combine two sub-features, as shown in Equation (8).
4.4. Optimal Number of Cluster Center
Because of the distribution of the dataset, the concept of centroid-based classification is used. Centroid-based classification classifies data two times: the first time is in the data preprocessing, and the second time is in the analysis phase. Since K-Means is used to classify the dataset first, there exists an issue around how many cluster centers should be used. It is hard to figure out the problem of the number of the cluster centers used unless measuring by experiments. An experiment is designed to find out the optimal number of cluster centers, and in this experiment, a cluster center is set from two to fifteen. After the pre-processing by different numbers of cluster centers, accuracy is calculated. Finally, the optimal number of cluster centers is found. The result of this experiment is shown in Table 8, which includes fourteen accuracies. Each accuracy is the average of ten accuracies of the data being pre-processed by different cluster centers. From two to fifteen cluster centers, when the number of cluster centers is nine, it shows the best accuracy, 97.7%, and when the number of cluster centers is two, it shows the worst accuracy, 94.0%. The graph which represents the alertness of accuracy is shown in Figure 8, Y-axis means the accuracy of detection, and the unit is percent. According to Figure 8, it is clear that the accuracy has significantly increased after the number of cluster centers is higher than four. When the number of cluster centers is nine, it has the highest value, and when there are more than nine cluster centers, the accuracy begins to decrease. The accuracy starts increasing again after the number of cluster centers is twelve. It can be said that the number of cluster centers should not be small because it cannot represent all kinds of data collected in the experiment, and too many cluster centers do not help because they classify data too meticulously. With too meticulous a dataset, it is possible to have some influence on the classification phase, just as overtraining may decrease overall accuracy.
4.5. Optimal Percentage of Training Data and Testing Data
In machine learning, the percentage of training data and testing data is important. If training data is much more than testing data, over-training could happen, and if testing data is much more than training data, the trained model could not be trusted due to the incomplete training. The goal of this experiment is to find out the optimal combination of training data and testing data. Training data will be set from thirty percent to seventy percent, and testing data will be set from seventy percent to thirty percent. The accuracy is also the standard to evaluate which combination is the best. The result is shown in Table 9. According to the result, the combination of training data and testing data does not have much influence on the data set, but it can still select the best combination. When the percentage of training data is sixty percent and testing data is forty percent, the accuracy has the best value, which is 97.4 percent. The graph of this experiment is shown in Figure 9.
4.6. Optimal K in K-Nearest Neighbor
The classification phase in this paper uses K-nearest neighbor to classify normal data and attacked data. There is a key parameter in K-nearest neighbor, which is the parameter K. K is used to implement majority vote, and with more votes, the testing data will be classified into a certain category. With the larger K, it is reasonable that the correctness is higher, but there is also a problem.
If K is too large, the testing data will compare with too much sample data, and it will decrease accuracy, too. The experiment is shown in Table 10, and the graph is shown in Figure 10. Each accuracy is also obtained by calculating the average of ten accuracies. According to Table 10 and Figure 10, it is clear that the accuracy is better when K is smaller than fifteen, and if K is greater than fifteen, the accuracy will decrease gradually. Although K in this experiment ends at twenty, fifty is also tried. The accuracy when K is fifty is less than sixty percent. Through this experiment, an optimal K is found when K is five, and accuracy is 97.3 percent. When K is greater than five, the overall accuracy will decrease. It can be said that the accuracy has a peak when K in K-nearest neighbor is five.
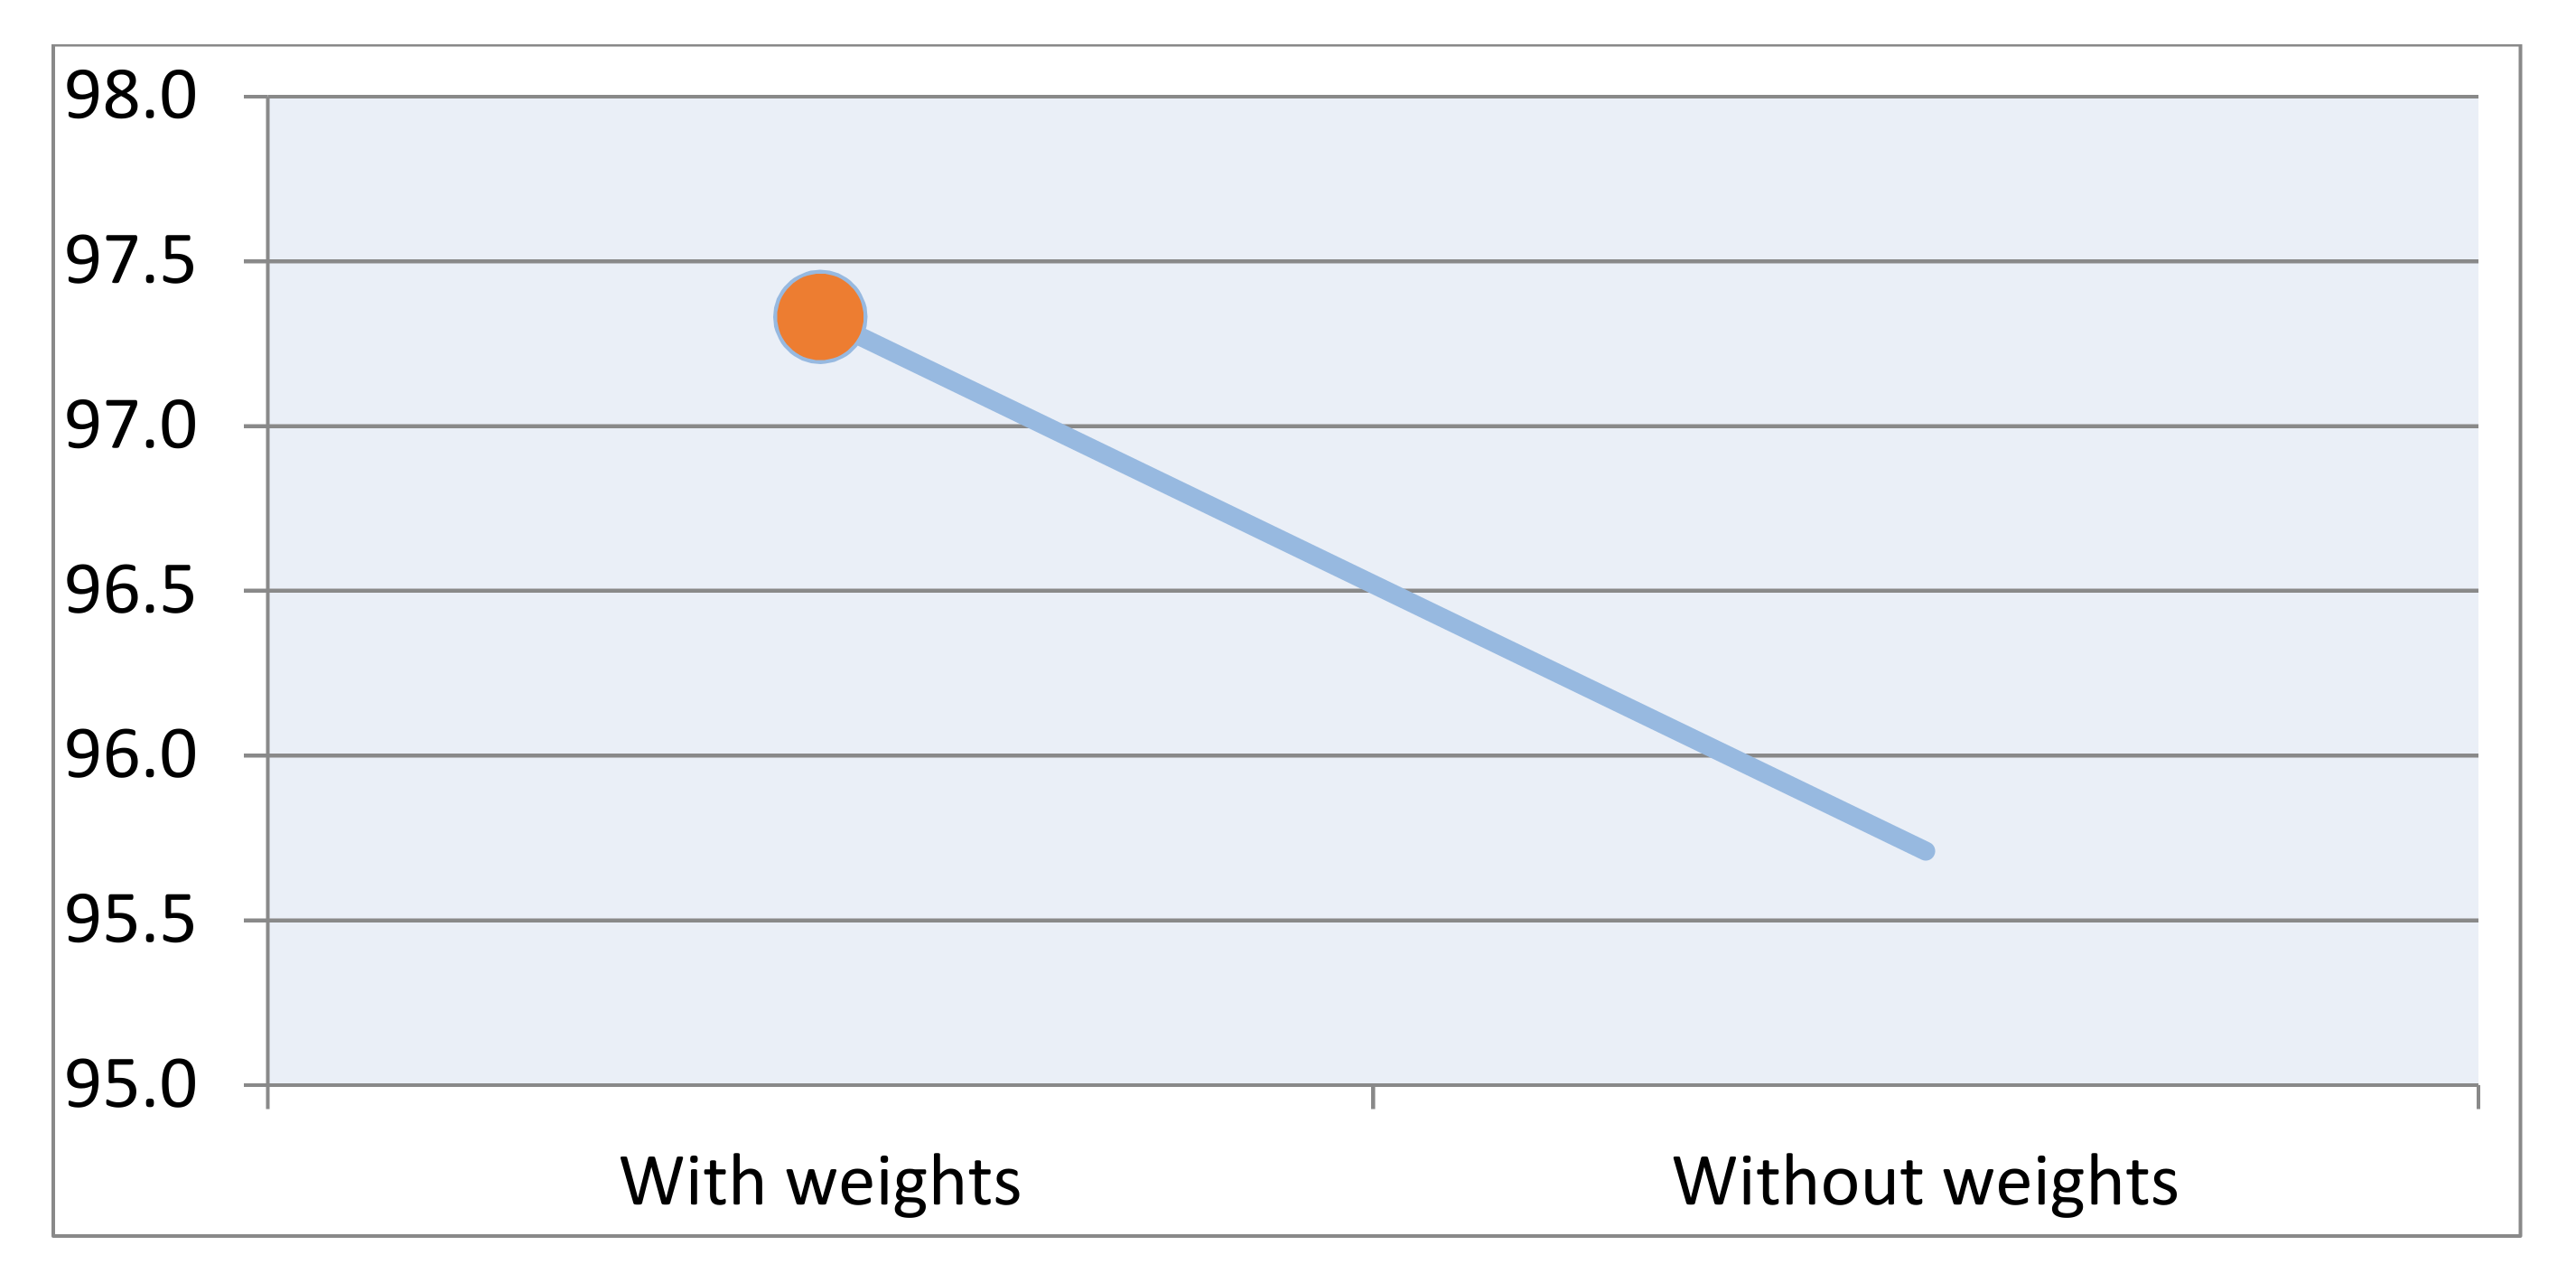
4.7. The Usage of Weight
In the dimension reduction phase, weights are used to combine two sub-features into one feature. If the weight is large, the feature will be large, too. If the weight is small, or equal to zero, then this sub-feature will have no influence. The weight is designed to enhance the performance of the detection framework. The goal of this experiment is to figure out whether weights can enhance the performance of the framework proposed in this paper or not. If the usage of weights can increase the accuracy, how much percent can be enhanced is another issue. The result of this experiment is shown in Table 11. Each accuracy is the average of ten accuracies which are pre-processed with weights or without weights. According to Table 11, if the data set is pre-processed with the weights which are calculated via correlation analysis, the overall accuracy is much higher. With weights, the accuracy is 97.3 percent, and the accuracy is 95.7 percent without weights. There is a 1.6 percent gap between them, and it is clear that with the pre-processing, which has weights to combine two sub-features, it has higher accuracy. In other words, the detection framework with weights will have better performance. The graph of this experiment is shown in Figure 11.
4.8. Integration of the Results of Experiments
After the above experiments, the parameters that will influence the performance of the framework are found. The first parameter is the weights of six sub-features; the second one is the number of cluster centers; the third one is the percentage of training data; the fourth one is the percentage of the testing data; the fifth one is the K in K-nearest neighbor, and the last one is the usage of weights. The integration of the results of the experiments is shown in Table 12.
With the optimal parameters, the accuracy is 97.3 percent, and the confusion matrix is shown in Table 13. According to the confusion matrix, accuracy rate, detection rate, and false alarm rate can be calculated to evaluate the performance of the IDS framework proposed in this paper. True positive is 148; true negative is 212; false negative is 3, and false positive is 7. According to the standard mentioned in Section 3.2, four values are calculated to evaluate the framework in this paper, and the final result is shown in Table 14. The detection rate is 96.80 percent, the accuracy rate is 97.30 percent, and false alarm rate is 1.37 percent. The trained KNN model is shown in Figure 12, where the white nodes represent normal data, and blue nodes represent attacked data. Because of low NIP and NCON, normal data has aggregation on plane z in Figure 12, and attacked data is evenly distributed on the space due to the simulation of several types of attacks generated by packet generator.
5. Conclusions
The environment of the Internet is now full of attacks that will reduce security and cost some losses. To detect all kinds of attacks, many researchers are concentrated on the issue of detecting methodology. In this paper, an anomaly-based IDS framework using centroid-based classification is proposed. In order to detect SYN flood attack, one of the common DDoS, a framework which combines K-means and K-nearest neighbor is designed. A concept of centroid-based classification is used to increase performance of the framework. Because of the distribution of the data set, K-means is used to classify packet data first and find out the representative gathering point. In order to achieve visualization, dimension reduction is used to combine six sub-features into three features; three features are used to be axis X, Y and Z, as shown in Figure 12.
In the dimension reduction phase, the weights, which are calculated via point-biserial correlation, are used to adjust the occupancy ratio. In the analysis phase, K-nearest neighbor is used to construct the model that can classify normal data and attacked data. Several experiments are designed to find out the optimal parameters in the pre-processing phase and analysis phase. The result of experiments shows that the optimal number of cluster centers is nine; the number of majority votes in K-nearest neighbor is five; the percentage of training data is sixty percent; the percentage of testing data is forty percent, and the usage of weights to adjust each sub-feature is needed. With the trained model proposed in this paper, the detection rate is 96.8 percent, the accuracy rate is 97.3 percent, and the false alarm rate is 1.37 percent.
In this paper, the concept of centroid-based classification is used to enhance the performance of the framework. With different combinations of algorithms, the performance is different. There are many possibilities about how to select proper algorithms and many ways of combining them. In machine learning, no matter supervised learning or unsupervised learning algorithms, there are still many algorithms that can improve the performance of the IDS framework. For example, if a genetic algorithm is used to replace K-means in this paper, the performance must have some changes. In the future, how to combine two or more algorithms to increase the efficiency will be an important issue for designing a good intrusion detection system.
Furthermore, SYN flood is set as the detection target. There still exists numerous threats on the Internet, and they need to be detected. For instance, distributed denial of service has more than four kinds of attack model. Via designing different frameworks, the methodology is similar, and it can be modified from the framework proposed in this study. If the target is set as spam which is also another existing problem, the feature set should be decided again because the attack model is not the same. In the detection phase, the algorithm should also be modified due to the status of the data. Once the framework is completed, the attack can be detected easily.
Author Contributions
Conceptualization, I.-C.L. and C.-C.C.; methodology, I.-C.L.; software, C.-H.P.; validation, I.-C.L. and C.-C.C.; formal analysis, C.-C.C.; investigation, C.-H.P.; resources, C.-H.P.; data curation, I.-C.L.; writing—original draft preparation, C.-H.P.; writing—review and editing, C.-C.C.; visualization, C.-H.P.; supervision, C.-C.C.; project administration, I.-C.L.; funding acquisition, I.-C.L. All authors have read and agreed to the published version of the manuscript.
Funding
This research was funded by Ministry of Science and Technology, grant number 110-2218-E-005-008-MBK and 110-2218-E-005-018.
Institutional Review Board Statement
Not applicable.
Informed Consent Statement
Not applicable.
Conflicts of Interest
The authors declare no conflict of interest.
Abbreviations
| ACK | Acknowledgement |
| DoS | Denial of Service |
| DDoS | Distributed Denial of Service |
| FP | False Positive |
| FN | False Negative |
| ICMP | Internet Control Message Protocol |
| IDS | Intrusion Detection System |
| IPS | Intrusion Protection System |
| KNN | K Nearest Neighbor |
| NCON | Number of Different Country |
| NIP | Number of Different IP Address |
| NP | Number of Packet |
| PLDEV | Standard Deviation of Packet Length |
| SYN | Synchronize Sequence Number |
| TCP | Transmission Control Protocol |
| TN | True Negative |
| TP | True Positive |
| UDP | User Datagram Protocol |
References
- Strayer, W.T.; Lapsely, D.; Walsh, R.; Livadas, C. Botnet detection based on network behavior. Adv. Inf. Secur. 2008, 36, 1–24. [Google Scholar]
- Zhu, Z.; Lu, G.; Chen, Y.; Fu, Z.J.; Roberts, P.; Han, K. Botnet research survey. In Proceedings of the 32nd Annual IEEE International Computer Software and Applications Conference, Turku, Finland, 28 July–1 August 2008; pp. 967–972. [Google Scholar]
- Stonegross, B.; Cova, M.; Cavllaro, L.; Gilbert, B.; Szydlowski, M.; Kemmerer, R.; Kruegel, C.; Vigna, G. Your botnet is my botnet: Analysis of a botnet takeover. In Proceedings of the 16th ACM Conference on Computer and communications security, Chicago, IL, USA, 9–13 November 2009; pp. 635–647. [Google Scholar]
- Liu, J.; Xiao, Y.; Ghaboosi, K.; Deng, H.; Zhang, J. Botnet: Classification, attacks, detection, tracing, and preventive measures. EURASIP J. Wirel. Commun. Netw. 2009, 9, 1184–1187. [Google Scholar] [CrossRef] [Green Version]
- Li, C.; Jiang, W.; Zou, X. Botnet: Survey and case study. In Proceedings of the 2009 Fourth International Conference on Innovative Computing, Information and Control, Kaohsiung, Taiwan, 7–9 December 2009; pp. 268–273. [Google Scholar]
- Banday, M.T.; Qadri, J.; Shah, N. Study of Botnets and their threats to internet security. In Working Papers on Information Security; Association for Information Systems: Atlanta, GA, USA, 2009; Volume 9. [Google Scholar]
- Lashkari, A.H.; Ghalebandi, S.G.; Moradhaseli, M.R. A wide survey on botnet. Commun. Comput. Inf. Sci. 2011, 166, 445–454. [Google Scholar]
- Zhang, L.; Yu, S.; Wu, D.; Watters, P. A Survey on latest botnet attack and defense. In Proceedings of the 2011 IEEE 10th International Conference on Trust, Security and Privacy in Computing and Communications (TrustCom), Changsha, China, 16–18 November 2011; pp. 53–60. [Google Scholar]
- John, A.; Sivakumar, T. DDoS: Survey of traceback methods. Int. J. Recent Trends Eng. 2009, 1, 241–245. [Google Scholar]
- Peng, T.; Leckie, C.; Ramamohanarao, K. Survey of network-based defense mechanisms countering the DoS and DDoS problems. ACM Comput. Surv. 2007, 39, 3. [Google Scholar] [CrossRef]
- Douligeris, C.; Mitrokotsa, A. DDoS attacks and defense mechanisms: Classification and state-of-the-art. Comput. Netw. 2004, 44, 643–666. [Google Scholar] [CrossRef]
- Srivastava, A.; Gupta, B.B.; Tyagi, A.; Sharma, A.; Mishra, A. A recent survey on DDoS attacks and defense mechanisms. Commun. Comput. Inf. Sci. 2011, 203, 570–580. [Google Scholar]
- Ohsita, Y.; Ata, S.; Murata, M. Deployable overlay network for defense against distributed SYN flood attacks. In Proceedings of the 14th International Conference on Computer Communications and Networks, San Diego, CA, USA, 17–19 October 2005; pp. 407–412. [Google Scholar]
- Lee, K.; Kim, J.; Kwon, K.H.; Han, Y.; Kim, S. DDoS attack detection method using cluster analysis. Expert Syst. Appl. 2008, 34, 1659–1665. [Google Scholar] [CrossRef]
- Xiao, B. An active detecting method against SYN flooding attack. In Proceedings of the 11th International Conference on Parallel and Distributed Systems, Fukuoka, Japan, 20–22 July 2005; Volume 5, pp. 709–715. [Google Scholar]
- Modi, C.; Patel, D.; Borisaniya, B.; Patel, A.; Rajarajan, M. A survey of intrusion detection techniques in cloud. J. Netw. Comput. Appl. 2013, 36, 42–57. [Google Scholar] [CrossRef]
- Liao, H.-J.; Lin, C.-H.R.; Lin, Y.-C.; Tung, K.-Y. Intrusion detection system: A comprehensive review. J. Netw. Comput. Appl. 2013, 36, 16–24. [Google Scholar] [CrossRef]
- Koc, L.; Mazzuchi, T.A.; Sarkani, S. A network intrusion detection system based on a hidden naive bayes multiclass classifier. Expert Syst. Appl. 2012, 39, 13492–13500. [Google Scholar] [CrossRef]
- Choi, K.; Chen, X.; Li, S.; Kim, M.; Chae, K.; Na, J. Intrusion detection of NSM based DoS attacks using data mining in smart grid. Energies 2012, 5, 4091–4109. [Google Scholar] [CrossRef] [Green Version]
- Sheikhan, M.; Jadidi, Z.; Farrokhi, A. Intrusion detection using reduced-size RNN based on feature grouping. Neural Comput. Appl. 2012, 21, 1185–1190. [Google Scholar] [CrossRef]
- Ou, C. Host-based intrusion detection systems adapted from agent-based artificial immune systems. Neurocomputing 2012, 88, 78–86. [Google Scholar] [CrossRef]
- Tsai, C.-F.; Lin, C.-Y. A triangle area based nearest neighbors approach to intrusion detection. Pattern Recognit. 2009, 43, 222–229. [Google Scholar] [CrossRef]
- Li, Y.; Guo, L.; Tian, Z.-H.; Lu, T.-B. A Lightweight web server anomaly detection method based on transductive scheme and genetic algorithms. Comput. Commun. 2008, 31, 4018–4025. [Google Scholar] [CrossRef]
- Sangve, S.M.; Kulkarni, U.V. Anomaly based improved network intrusion detection system using clustering techniques. Int. J. Adv. Res. Comput. Sci. 2017, 8, 808–815. [Google Scholar] [CrossRef]
- Setiawan, B.; Djanali, S.; Ahmad, T. A study on intrusion detection using centroid-based classification. Procedia Comput. Sci. 2017, 124, 672–681. [Google Scholar] [CrossRef]
- Singh, P.; Venkatesan, M. Hybrid approach for intrusion detection system. In Proceedings of the 2018 International Conference on Current Trends towards Converging Technologies (ICCTCT), Coimbatore, India, 1–3 March 2018. [Google Scholar]
- Tahir, H.M.; Said, A.M.; Osman, N.H.; Zakaria, N.H.; Sabri, P.N.A.M.; Katuk, N. Oving K-means clustering using discretization technique in network intrusion detection system. In Proceedings of the 2016 3rd International Conference on Computer and Information Sciences (ICCOINS), Kuala Lumpur, Malaysia, 15–17 August 2016; pp. 248–252. [Google Scholar]
- Tjhai, G.C.; Furnell, S.M.; Papadaki, M.; Clarke, N.L. A preliminary two-stage alarm correlation and filtering system using SOM neural network and K-means algorithm. Comput. Secur. 2010, 29, 712–723. [Google Scholar] [CrossRef]
- Law, K.H.; Kwok, L.F. IDS false alarm filtering using KNN classifier. Inf. Secur. Appl. 2005, 3325, 114–121. [Google Scholar]
- Kim, M.; Na, H.; Chae, K.; Bang, H.; Na, J. A Combined Data Mining Approach for DDoS Attack Detection. Inf. Netw. Technol. Broadband Mob. Netw. 2004, 3090, 943–950. [Google Scholar]
Figure 1.
The process of K-means.

Figure 2.
If K equals to three, the top three nodes are one normal data and two attacked data.

Figure 3.
A framework proposed to detect SYN flood attack using centroid-based classification.

Figure 4.
Normal data (bold line) vs. attacked data (dot line).

Figure 5.
The distribution of the pre-processed data, and their important characteristics.

Figure 6.
Three groups gathering from 10 to 100.

Figure 7.
The excepted result of using K-Means to find cluster centers instead of using Equation (2).
Figure 7.
The excepted result of using K-Means to find cluster centers instead of using Equation (2).

| Value | Normalized by Equation (2) | Cluster Center Calculating by K-Means Phase |
|---|---|---|
| 10 | 0 | 1 |
| 20 | 0.0001 | 2 |
| 100 | 0.0005 | 3 |
| 15,000 | 0.1499 | 4 |
| 100,000 | 1 | 5 |
Figure 8.
The accuracy rate vs. cluster centers.

Figure 9.
The accuracy of training and test data.

Figure 10.
The accuracy vs. cluster centers.

Figure 11.
The accuracy vs. weights.

Figure 12.
Dimension reduction used to combine six sub-features into three features.


Table 1.
List of features.
| Axis | Feature | Sub-Feature | Data Type | Notation |
|---|---|---|---|---|
| X | Characteristic of packet | number of packet | Int | NP |
| deviation of packet length | float | PLDEV | ||
| Y | Characteristic of flag | percentage of SYN packet | float | SYN |
| percentage of ACK packet | float | ACK | ||
| Z | Source of the packet | number of different country | Int | NCON |
| number of different IP address | Int | NIP |
Table 2.
Difference between Equation (2) and K-Means.
| Value | Normalized by Equation (2) | Cluster Center Calculating by K-Means Phase |
|---|---|---|
| 10 | 0 | 1 |
| 20 | 0.0001 | 2 |
| 100 | 0.0005 | 3 |
| 15,000 | 0.1499 | 4 |
| 100,000 | 1 | 5 |
Table 3.
Data which is processed after cluster center calculating phase.
| NP | PLDEV | SYN | ACK | NCON | NIP | Category |
|---|---|---|---|---|---|---|
| 1 | 1 | 2 | 2 | 1 | 1 | 0 |
| 3 | 1 | 2 | 3 | 1 | 1 | 0 |
| 3 | 2 | 1 | 3 | 3 | 2 | 1 |
| 3 | 2 | 1 | 3 | 1 | 1 | 1 |
Table 4.
Data after dimension reduction phase.
| X | Y | Z | Category |
|---|---|---|---|
| 2.40 | 5.00 | 1.37 | 0 |
| 2.86 | 4.18 | 2.11 | 0 |
| 4.08 | 8.02 | 8.44 | 1 |
| 7.37 | 6.14 | 9.81 | 1 |
Table 5.
Data set.
| Data Type | Quantity | Percentage |
|---|---|---|
| Normal | 208 | 51.23% |
| Attacked | 198 | 48.77% |
Table 6.
Confusion matrix.
| Data Type | Predicted | |
|---|---|---|
| Normal | Attacked | |
| Normal data | TP | FN |
| Attacked data | FP | TN |
Table 7.
Weights of six sub-features.
| NP | PLDEV | SYN | ACK | NCON | NIP |
|---|---|---|---|---|---|
| 0.79 | 0.23 | 0.90 | 0.82 | 0.74 | 0.63 |
Table 8.
Accuracy of using different numbers of cluster centers.
| Cluster Center | 2 | 3 | 4 | 5 | 6 | 7 | 8 |
|---|---|---|---|---|---|---|---|
| Accuracy | 94.0% | 95.1% | 94.2% | 97.1% | 96.6% | 96.6% | 96.3% |
| Cluster center | 9 | 10 | 11 | 12 | 13 | 14 | 15 |
| Accuracy | 97.7% | 97.5% | 95.0% | 95.1% | 96.2% | 96.5% | 96.9% |
Table 9.
Accuracy of using different combination of training data and testing data.
| Training data | 30 | 40 | 50 | 60 | 70 |
| Testing data | 70 | 60 | 50 | 40 | 30 |
| Accuracy | 96.6% | 97.2% | 97.3% | 97.4% | 97.1% |
Table 10.
Accuracy of using different K in K-nearest neighbor.
| K | 1 | 2 | 5 | 10 | 15 | 20 |
| Accuracy | 97.2% | 96.9% | 97.3% | 97.2% | 97.1% | 96.5% |
Table 11.
Accuracy of using weights or not.
| With Weights | Without Weights | |
|---|---|---|
| Accuracy | 97.3% | 95.7% |
Table 12.
Integration of the results of experiments.
| Weight | [0.79, 0.23, 0.90, 0.82, 0.74, 0.63] |
|---|---|
| The number of cluster center | 9 |
| Majority votes in KNN | 5 |
| Training data | 60% |
| Testing data | 40% |
| Usage of weights | Y |
Table 13.
Confusion matrix of results.
| Data Type | Predicted | |
|---|---|---|
| Normal | Attacked | |
| Normal data | 148 | 3 |
| Attacked data | 7 | 212 |
Table 14.
Final results.
| Detection rate | 96.8% |
| Accuracy rate | 97.3% |
| False alarm rate | 1.37% |
Publisher’s Note: MDPI stays neutral with regard to jurisdictional claims in published maps and institutional affiliations. |
© 2022 by the authors. Licensee MDPI, Basel, Switzerland. This article is an open access article distributed under the terms and conditions of the Creative Commons Attribution (CC BY) license (https://creativecommons.org/licenses/by/4.0/).
Share and Cite
MDPI and ACS Style
Lin, I.-C.; Chang, C.-C.; Peng, C.-H. An Anomaly-Based IDS Framework Using Centroid-Based Classification. Symmetry 2022, 14, 105. https://0-doi-org.brum.beds.ac.uk/10.3390/sym14010105
AMA Style
Lin I-C, Chang C-C, Peng C-H. An Anomaly-Based IDS Framework Using Centroid-Based Classification. Symmetry. 2022; 14(1):105. https://0-doi-org.brum.beds.ac.uk/10.3390/sym14010105
Chicago/Turabian StyleLin, Iuon-Chang, Ching-Chun Chang, and Chih-Hsiang Peng. 2022. "An Anomaly-Based IDS Framework Using Centroid-Based Classification" Symmetry 14, no. 1: 105. https://0-doi-org.brum.beds.ac.uk/10.3390/sym14010105
Note that from the first issue of 2016, this journal uses article numbers instead of page numbers. See further details here.