Article

Study on the Preparation and Performance of a Prefabricated Pervious-Cement-Based Concrete Pavement Slab

1
School of Materials and Chemical Engineering, Anhui Jianzhu University, Hefei 230601, China
2
Prefabricated Building Research Institute of Anhui Province, Anhui Jianzhu University, Hefei 230601, China
3
Department of Civil and Mineral Engineering, University of Toronto, Toronto, ON M5S 2E8, Canada
*
Author to whom correspondence should be addressed.
Submission received: 29 May 2022 / Revised: 16 June 2022 / Accepted: 18 June 2022 / Published: 22 June 2022
(This article belongs to the Special Issue Symmetry in Applied Mechanics Analysis on Smart Optical Fiber Sensors)

Abstract

:
Based on the design of a prefabricated pervious composite cement concrete pavement slab, the interface properties and bending deformation properties of basalt pervious concrete (BPC) and PVA fiber base impervious concrete (PFBIC) composite specimens were studied. The effects of the different interfacial agents on the interfacial bonding performance were compared using a splitting tensile strength test and interfacial shear test. The deformation capacity of the composite specimens under bending load was tested using a three-point bending test, with the symmetry of the model considered and compared with the deformation capacity of the BPC specimen and PFBIC specimen. The results showed that the compressive strength of the BPC prepared using an orthogonal test reached 40.30 MPa, while the permeability coefficient was 2.41 mm/s. Different interface treatment processes determine the interface bonding properties. The best interface treatment method can induce the interface bonding strength to be higher than the strength of the BPC matrix itself, while the interface transition zone matrix will be denser without obvious microscopic defects. Under the bending tensile load, the ultimate bending stress reached 6.58 MPa and the maximum deflection in the midspan was 0.81 mm. As a protective layer, the PFBIC can alleviate the disadvantage of the insufficient strength of the BPC and can improve the bending ultimate bearing capacity of the BPC-PFBIC through its own stiffness.

1. Introduction

With the proposal of the concept of the “sponge city”, the pavement coverage rate of pervious concrete pavement is required to be higher than ever [1]. Pervious concrete (PC) is a porous structure, with the porosity generally being between 15% and 35%. As a result, the strength and durability of PC are worse than those of other concrete pavements. The high maintenance difficulty also means the use of PC is rather limited on roads with heavy traffic [2,3]. Meanwhile, PC itself is relatively dry and hard and requires an extended construction time. The pavement is often mixed and layered, which is inclined to cause the cavitation of the contact surface between the PC surface layer and the ordinary concrete base. On the other hand, PC is more susceptible to sulfate attack than ordinary concrete, which may cause cracking on the base concrete and damage the entire pavement system [4]. The prefabricated pavement can shorten the construction and maintenance times, while the standardized production of prefabricated concrete pavement in a factory is not affected by the natural environment [5]. Therefore, the study of a prefabricated pervious concrete pavement slab could suggest a promising solution to the above problems.
Scholars have performed extensive research on the performance of PC. Such studies usually use a single-particle aggregate to form a skeleton structure [6,7]. The aggregate performance, grading of aggregates, water/cement ratio, and bonding strength between aggregates have critical effects on the mechanical properties of PC [8,9,10,11]. In addition, Rangelov et al.’s research [12] demonstrated that adding solidified carbon fiber composites improved the permeability and mechanical properties (i.e., elastic modulus, compressive and tensile strengths) of the pervious concrete. However, the performance of pervious concrete pavement depends not only on the PC, but also on the overall performance of the composite pavement. Zhang et al. [13] conducted an experimental study on low drying shrinkage engineered cementitious composites (LSECCs). It was found that due to the high strain capacity of LSECCs, the overall strain capacity and integrity of the composite plate were significantly improved. Tensile cracks developed in the LSECC, but not in the adjacent concrete slabs. Vaitkus et al. [14] compared the mechanical properties of concrete with 20 mixtures designed for precast pavement slabs under static and cyclic bending moments, as well as static compression and tension forces. It was found that the addition of fiber and silica fume to the concrete mixture facilitated better mechanical performance.
In addition, due to the modulus difference between the PC and base concrete, there will be a large shear stress between the surface and the base. If the interfacial bonding layer has poor bonding performance, it will be prone to fatigue cracking, slipping, and delamination [15]. Many scholars have studied different interface treatment techniques, such as shallow drilling, deep drilling, interface adhesion, slotting, drilling, and sand blasting [16,17,18,19,20,21], and have tested the bonding performance between layers. Tarr et al. [22] studied the stress responses of road surface concrete and base concrete under different interface treatment methods, and they found that different interface treatment methods can cause large pavement stress differences. Lu et al. [23] studied the effects of different surface treatment techniques on the bonding performance between concrete and asphalt pavement. The results showed that the bond strength could be affected by the amount of gravel. In order to study the interface interactions and mechanical properties of steel–concrete composite structures, Wang [24] carried out theoretical research on the shear stress, strain, and deformation properties caused by the interface slippage of composite materials. The validity of the theoretical model was verified via a comparison with the experimental and numerical results. The parametric sensitivity of the composite structures to interface bond states was discussed, and the analytical solutions for interface slippage and deformation were proposed to guide the optimal design.
According to the literature reviewed above, a number of studies are available concerning the properties of pervious concrete. However, the current knowledge about the performance of the pervious and base concrete structures is very limited. In view of this research gap, the bonding properties between the pervious and base concretes with different interface agents were examined via interfacial oblique shear tests and splitting tensile tests. Then, the resultant mechanical behaviors of the composite structures were examined through the three-point bending test. In addition, the basalt pervious concrete (BPC) and PVA-fiber-reinforced impermeable concrete (PFBIC) were specifically designed to form the surface and base layers, respectively.

2. Materials and Methods

2.1. Materials

The cementitious materials used in this experiment were P·II 52.5 Portland cement and P·O 42.5 ordinary portland cement from Tongling Conch Co., Ltd., SLT92U silica fume from Sichuan Longtian Resources Comprehensive Utilization Co., Ltd., and Grade I fly ash produced by Nansitong Chemical Construction Co., Ltd. The chemical composition analysis of cementitious materials is shown in Table 1. The coarse aggregate used in BPC was basalt rubble, having good abrasion resistance, strong compressive ability, a low crushing value and strong corrosion resistance. The fibers used were basalt fibers, with their properties shown in Table 2. In order to achieve a uniform dispersion of the fibers, a dispersant agent was added. In addition, the defoaming agent and early strength agent were added to enhance the density and early age strength of the concrete, respectively. The PFBIC contained limestone gravel with a particle size range of 5–20 mm and ordinary river sand with a fineness modulus of 2.5 as the aggregate. The properties of the PVA fibers used here are shown in Table 2. The curing agent, which can produce calcium silicate by reacting with free Ca+ to fill the internal pores of the PFBIC, was added to increase the impermeability of the base concrete. In addition, the polycarboxylate superplasticizer was added to reduce the water/binder ratio and improve the strength of the base concrete. In the experiment, a variety of additives were used to adjust the working performance of the two cement-based materials. Table 3 summarizes the list of additives.

2.2. Mixing Ratio and Stirring Process

For the BPC, an orthogonal test was adopted to study the influence of the aggregate gradation, early strength agent content, fiber content, and silica fume content on the compressive strength and permeability coefficient. The water binder ratio of the BPC with the two aggregate gradations was set to 0.3. Three levels were set for each factor, and an orthogonal test was carried out with an L9 orthogonal table. The factor level is shown in Table 4, with the material content expressed by the quality ratios against the cementitious materials.
According to the tests on C40 fly ash pavement concrete conducted previously by [25], the optimal mixture design of the PFBIC is listed as follows: water/binder ratio of 0.35, sand content of 38%, fly ash content of 20%, silica fume content of 8%, water reducer content of 1.0%, curing agent content of 0.6%, and PVA fiber content of 0.5%. The content of each material formed a quality ratio against the cementitious materials. The impermeability and crack resistance of the base concrete were further improved by adding a curing agent and PVA fibers.
An epoxy resin binder is commonly used for concrete interface bonding nowadays [26]. In this test, the self-proportioning cement-based interface agents JA and JB were compared with the epoxy-based concrete interface agent JC, and the state without an interface agent was used as the reference group for comparison. This was done to find the most suitable concrete interface agent for the pavement composite structure in this study. The types of interface agents used in the test are shown in Figure 1.
  • Surface BPC
In this experiment, the BPC was prepared using the cement-wrapped stone method. If there was no fiber, cement and silica fume were dry mixed for 30 s, poured into the enhancer and water mixture for 60 s, and then added to the aggregate and stirred for 90 s. In the cases with fiber, the well-proportioned mixed water was heated to 90 °C and the HPMC dispersant was added. The mixture was then stirred at a constant speed until the dispersing agent completely dissolved. After cooling to about 40 °C, the defoamer was added. When the bubbles disappeared, the early strength agent was added, then the fiber was added at last. The mixture was stirred for 120 s with a glass rod and the above cement-wrapped stone method was repeated afterwards. The cementitious material was dry mixed for 30 s and the pre-dispersed fiber mixed solution was added and stirred for 60 s. Finally, the mixture was poured into the aggregate and stirred for 90 s.
  • Base PFBIC
The weighed PVA fiber and river sand were poured into a mixer for dry mixing for 5 min to ensure that the fiber was evenly dispersed. Then, the cement, silica fume, fly ash, and curing agent were added for dry mixing for 60 s, followed by the addition of a previously mixed water reducer. The mixture was stirred for 60 s, then finally the aggregate was added to the solution and stirred for 90 s.

2.3. Specimen Shaping

The specimen forming process is demonstrated in Figure 2. Two concrete molds with dimensions of 100 mm × 100 mm × 100 mm and 100 mm × 100 mm × 400 mm were selected. The PFBIC was poured into the molds first according to the 1:1 composite ratio. The molds were then vibrated to form the basic shape. When the PFBIC reached the initial setting time, a layer of 2-mm-thick interface agent was coated on the interface. When the interface agent settled, the surface BPC was poured into the molds. Manual tamping and top vibration were both used for forming. After molding, the mold was placed at a temperature of 20 ± 5 °C for 48 h before removal, so that the upper and lower concretes would bond more closely. Then, it was put into a standard curing room with a temperature of 20 ± 2 °C and relative humidity of more than 90% to be cured until reaching the age for strength testing.

2.4. Test Methods

2.4.1. Basic Mechanical Property Testing

The compressive and flexural strengths of the BPC and PFBIC were tested according to the Physical and Mechanical Properties Test Method of Concrete (GB/T50081-2019). The compressive strength specimens were 100 mm × 100 mm × 100 mm cube specimens. The flexural strength test used 100 mm × 100 mm × 400 mm cuboid specimens, and the test instrument was the WE-1000B hydraulic universal testing machine. The loading speed range was controlled at 0.02 MPa/s~0.05 MPa/s. Three duplicates were tested for each group of specimens.

2.4.2. Permeability Coefficient

The permeability coefficient of the BPC was tested according to the specified device described in the Technical Specification for Pervious Cement Concrete Pavement (CJJ/T 135). Three φ100 mm × 50 mm cylinder specimens were used for this test.

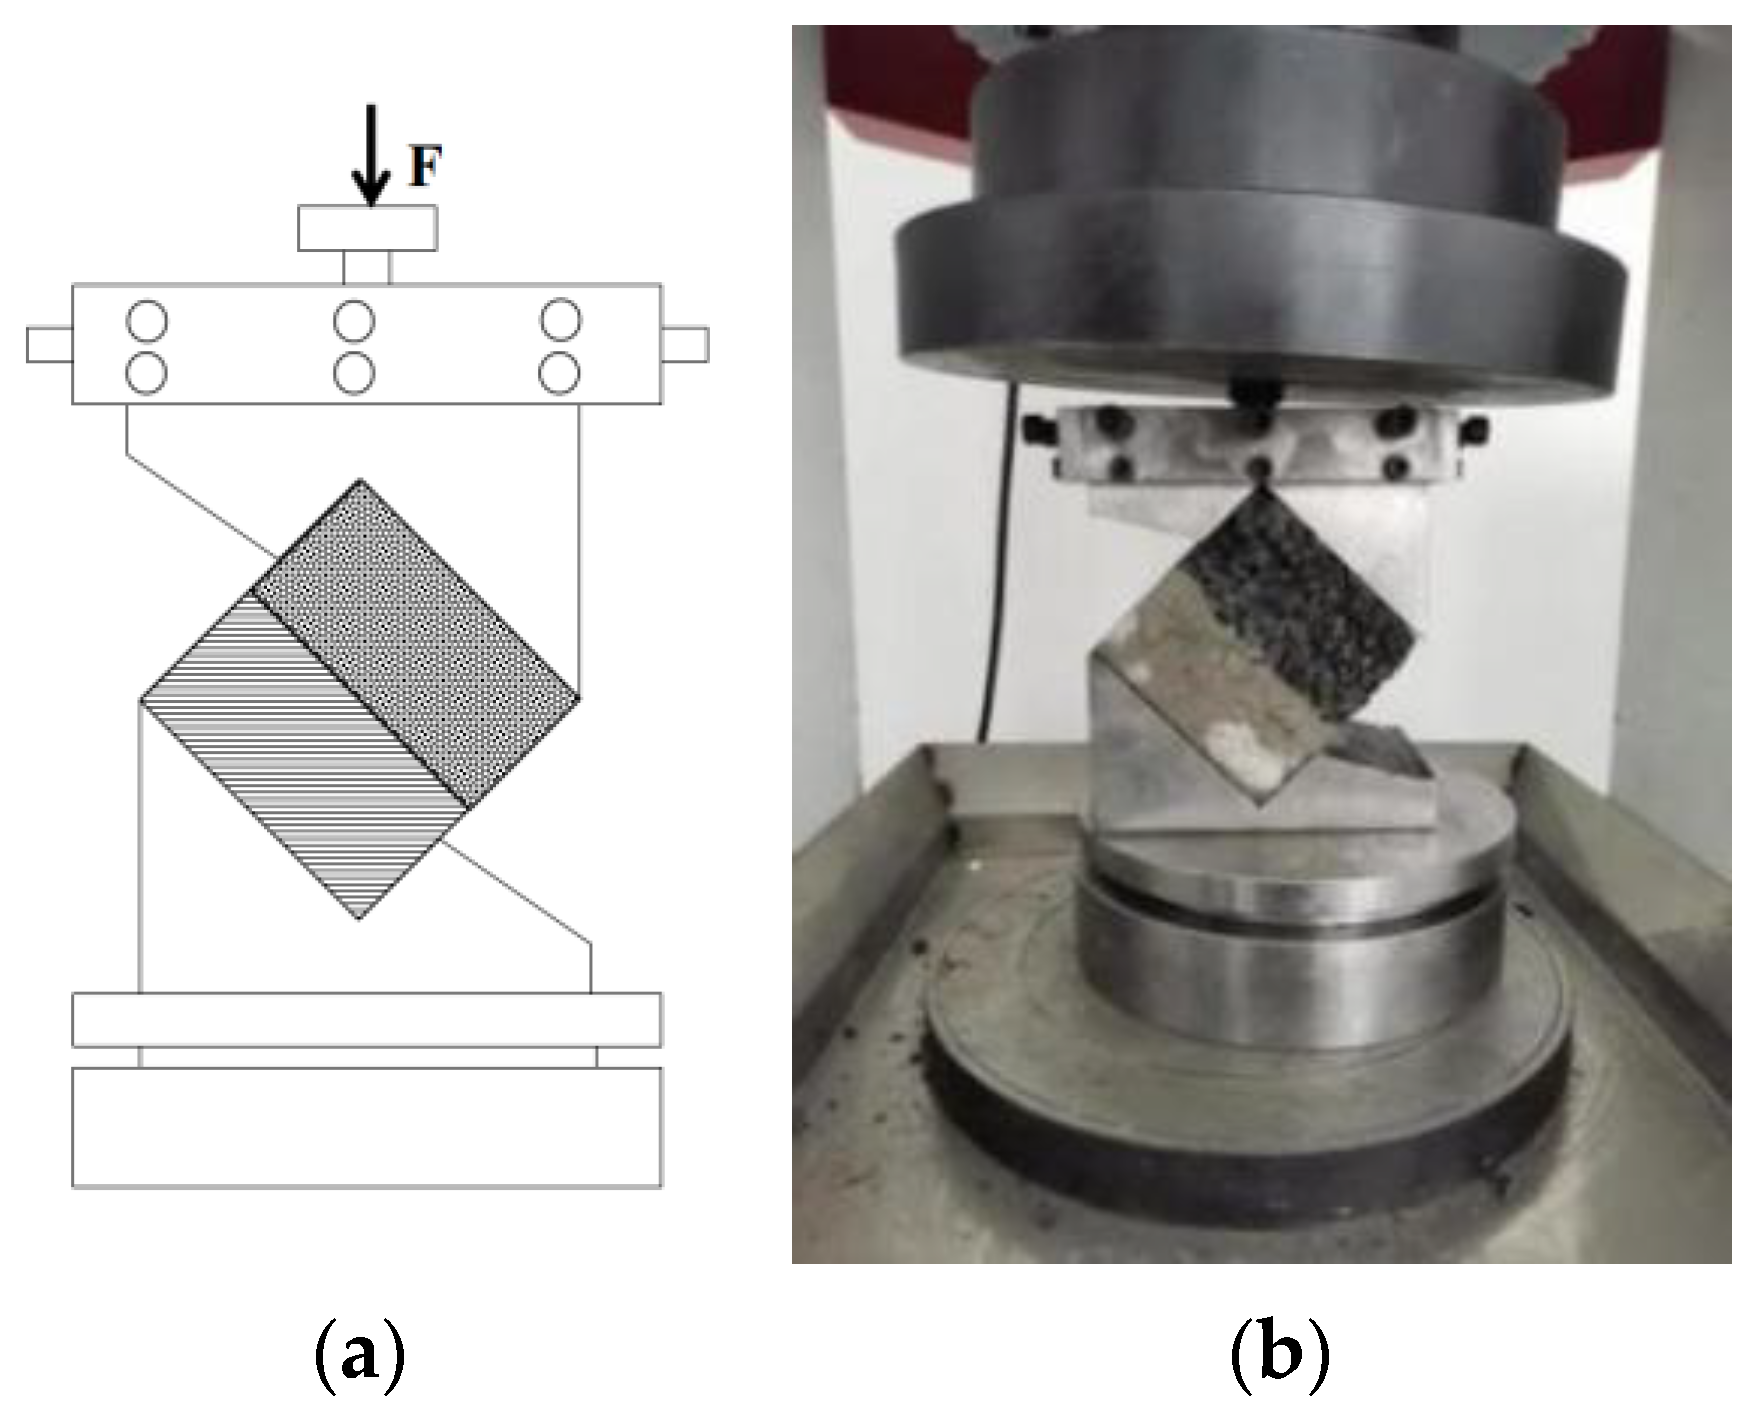
2.4.3. Composite Specimen Interface Shear

The interfacial bond strength between the PBC and PFBIC layers in the shear direction was tested via 45° oblique shear tests. The test instrument was the shear-resistant die produced by Cangzhou Chenluqiao Instrument Co., Ltd., with reference to the schematic diagram in JT/T983-2015, as shown in Figure 3a. For the test, the bonding surface areas of three 100 mm × 100 mm × 100 mm composite specimens were measured in square millimeters. The test blocks were put into the fixture of a universal testing machine as in Figure 3b. The loading rate was modulated to 0.03–0.05 MPa/s, and the pressure stopped when the composite interface slipped. The interfacial shear strength was then calculated as:
P s r = F S s i n 45 °
where P s r is the interface shear strength (MPa), F is the maximum compressive force (N), and S is the specimen bonding area (mm2).

2.4.4. Composite Specimens Interface Splitting Strength

As per the Standard Test Method for the Mechanical Properties of Ordinary Concrete (GB/T 50081—2019), this test utilized the PL-07 splitting tensile test fixture produced by Cangzhou Changlong Instrument Co., Ltd., as shown in Figure 4. The specimens were retrieved from the curing room after 28 days of curing, and three specimens were tested in each group. With the surfaces wiped clean using a wet towel, the test blocks were placed in a splitting tensile test fixture. Gaskets were fixated to the upper and lower arc pads and aligned with the composite interface position of the specimens. The test machine was then started. When the upper plate was close to the gasket, the ball seat was adjusted to ensure so that the interface and the gasket contacted steadily. Continuous loading was applied at a constant speed of 0.05 MPa/s until the interface failure appeared. The failure load was then recorded and the splitting tensile strength was obtained from:
f t s = 2 F A = 0.637 F A
In the above equation, f t s is the splitting tensile strength (MPa), F is the specimen failure load (N), and A is the specimen splitting surface area (mm2).

2.4.5. Three-Point Bending Test

The experimental specimens were 100 mm × 100 mm × 400 mm cubes, and the test equipment was the MTS-810 hydraulic servo fatigue testing machine. Using the three-point bending test method, the span distance was 150 mm, and the three-point loading device was set as shown in Figure 5. The displacement-controlled loading method was chosen for this experiment, and the loading rate was 0.5 mm/min. The specimens were divided into groups of three to test the bending properties of the BPC specimens and BPC and PCBIC composite specimens.

2.4.6. Micro Structure

Scanning electron microscopy (SEM) was used to observe the microscopic morphology of the interface bonding part of the JB interfacial agent. The equipment used for this observation was the FEI3D field emission scanning electron microscope.

3. Results and Discussion

3.1. Analysis of the Influencing Factors of Compressive Strength

An orthogonal experimental design was used in this study of multiple factors, with the level of design method used for part of the test to find out the optimal level combination. Following the proportions in Table 4, the orthogonal test results for the BPC are summarized in Table 5.

3.1.1. 28 d Compressive Strength Range Analysis

The 28 d compressive strengths of BPC concrete samples were studied using a range analysis, and the results are shown in Table 6 and Figure 6. The value of Kx in Table 6 is the cumulative value of the compressive strengths obtained at each factor (i.e., represented by 1, 2, and 3). For example, K1 is the sum of the compressive strengths of concrete samples obtained at different factors under level 1. The aggregate gradation (A) corresponds to 123 groups, the early strength agent content (B) corresponds to 147 groups, the fiber content (C) corresponds to 168 groups, the silica fume content (D) corresponds to 159 groups, and k1 is the average value of K1. The larger the range, the greater the influence of this factor on the compressive strength. The order of 28 d compressive strength values of BPC specimens was D > B > C > A. This implies that the contents of the silica fume and early strength agent have great influence, and that the impact of the contents of fiber and aggregate gradation was minimal.
As illustrated in Figure 6, with the decrease in the proportion of fine aggregate, the cementation points between the internal aggregate and aggregate of pervious concrete become less and less, and the compressive strength is also reduced. Since the early strength agent has some water-reducing effect, with the increase in the content of the early strength agent, the excessive grout inside the pervious concrete increases, the internal structure becomes more compact, and the compressive strength increases. The effect of the basalt fiber on the compressive strength is obscure, and the compressive strength is the largest when the content is 0.3%. Silica fume is a powder material with a large specific surface area and strong volcanic ash activity. When added as a mineral admixture, it reacts with the cement hydration products Ca(OH)2 to form a C-S-H gel, which improves the compactness of the interfacial transition zone and the strength of the cement paste, thereby improving the compressive strength [27]. However, with the gradual increase in content, the workability of the cement paste diminishes and the bonding force between the aggregates declines, resulting in the decrease in compressive strength. In this experiment, the highest compressive strength was obtained when the silica fume content was 7%.

3.1.2. Compressive Strength Variance Analysis

The range analysis directly reflects the primary and secondary influences of various factors on the BPC, but it cannot effectively reflect the error range of the orthogonal test, so the variance analysis of the test results was carried out. Three α levels of 0.01, 0.05, and 0.1 were taken. When the p value is less than 0.01 in the variance analysis, this indicates that the influencing factor is particularly significant; when the p value is less than 0.05, the influencing factor is considered significant. If the p value is less than 0.1, although it is not considered significant, it causes a certain degree of influence on the performance index. Table 7 shows the 28 d compressive strength variance analysis results, which reveals that the p values of the silica fume content and the early strength agent content in this experiment are all less than 0.01, meaning the two factors are both considered particularly significant. The p value of the fiber content is less than 0.05, so the fiber content is significant. The three levels of the aggregate gradation selected in this experiment have no significant influence on the compressive strength. In addition, the deviation square sum of the other three factors is greater than the error square sum, indicating that the test results are accurate.

3.2. Analysis of Influencing Factors of Permeability Coefficient

3.2.1. Permeability Coefficient Range Analysis

For the orthogonal test range analysis, the results are shown in Table 8. The order of the degrees of influence on the 28 d permeability coefficient of BPC is A > B > D > C; that is, the aggregate gradation and early strength agent content have great influence, while fiber content and silica fume content have little influence. In terms of the permeability, the best test combination is an aggregate gradation ratio of 3:7, early strength agent content of 3.0%, fiber content of 0.1%, and silica fume content of 9%.
Based on the average value of each factor level assessment index of the range analysis results, the influence trend diagram of the four factors on the permeability coefficient was produced as in Figure 7. With the increase in the coarse aggregate proportion in the aggregate gradation, the connected pores in the PC multiply and the permeability increases. However, with the increase in the content of the early strength agent, the permeability coefficient first increases and then decreases. This is mainly because the incorporation of the early strength agent enhances the fluidity of the PC slurry and the internal pore structure becomes more uniform. On the other hand, when the early strength agent encounters the cement, the AFt and C-S-H gels are generated by a hydration reaction to boost the strength of the cement paste and optimize the pore structure. However, with the increase in the content of the reinforcing agent, the generated hydration products increase and accumulate on the internal pore surfaces, which leads to the blockage of some connected pores and a decrease in the permeability coefficient [28].

3.2.2. Variance Analysis

The results of the variance analysis of the permeability coefficient are listed in Table 9. The p values for the aggregate gradation and early strength agent content are less than 0.01, indicating that they are particularly significant, while the fiber content and silica fume content have little effect on the permeability coefficient and are not considered significant. The sum of the deviation square of the aggregate gradation and early strength agent content is less than the sum of the error square, so the experimental analysis results are deemed accurate.

3.3. Basic Performance

Through the range analysis and variance analysis, the influences of the aggregate gradation, reinforcing dosage, silica fume dosage, and fiber dosage on PC index had been studied to some degree, but the comprehensive effect had not been reflected. Therefore, with the efficacy coefficient analysis method, the compressive strength and permeability coefficient were comprehensively analyzed to obtain the optimal ratio. It can be concluded from Table 10 that the total efficacy coefficient of the fifth group is the largest, and the corresponding orthogonal test combination is A2B2C3D1, from which the optimal ratio for the test is determined. The optimal ratio for the BPC is a 3–5 mm content basalt aggregate of 775.5 kg/m3, 5–10 mm content of 757 kg/m3, reinforcing content of 13.9 kg/m3, basalt fiber content of 7.95 kg/m3, and silica fume content of 32.6 kg/m3.
According to the optimal ratio of the orthogonal test, the flexural and compressive strengths of BPC and PFBIC are shown in Table 11. The compressive strength of BPC reaches 40.30 MPa and the permeability coefficient reaches 2.41 mm/s. With the addition of the early strength agent, the early growth of the cement paste C3S and the late growth of C2S are promoted, and the workability of the pervious concrete is also improved. The internal pore structure is more uniform, the cementation point between the aggregates is increased, and the overall strength is also increased. At the same time, the basalt aggregate with different gradations can ensure the compressive strength of the BPC. The concrete skeleton accumulated by a single coarse aggregate has a high enough porosity to satisfy the permeability requirement of pervious concrete but also causes decreases in some mechanical properties. The continuous gradation has a favorable strength profile but the internal skeleton may impact the permeability of the pervious concrete to some extent due to the large amount of fine aggregate filling. With the incorporation of an anti-cracking waterproofing admixture and PVA fiber, the mechanical properties and durability of the base concrete are significantly improved. The compressive strength reaches 50.80 MPa, and the internal fibers are dispersed to form a network structure, which limits the expansion of cracks when the concrete is damaged [29].

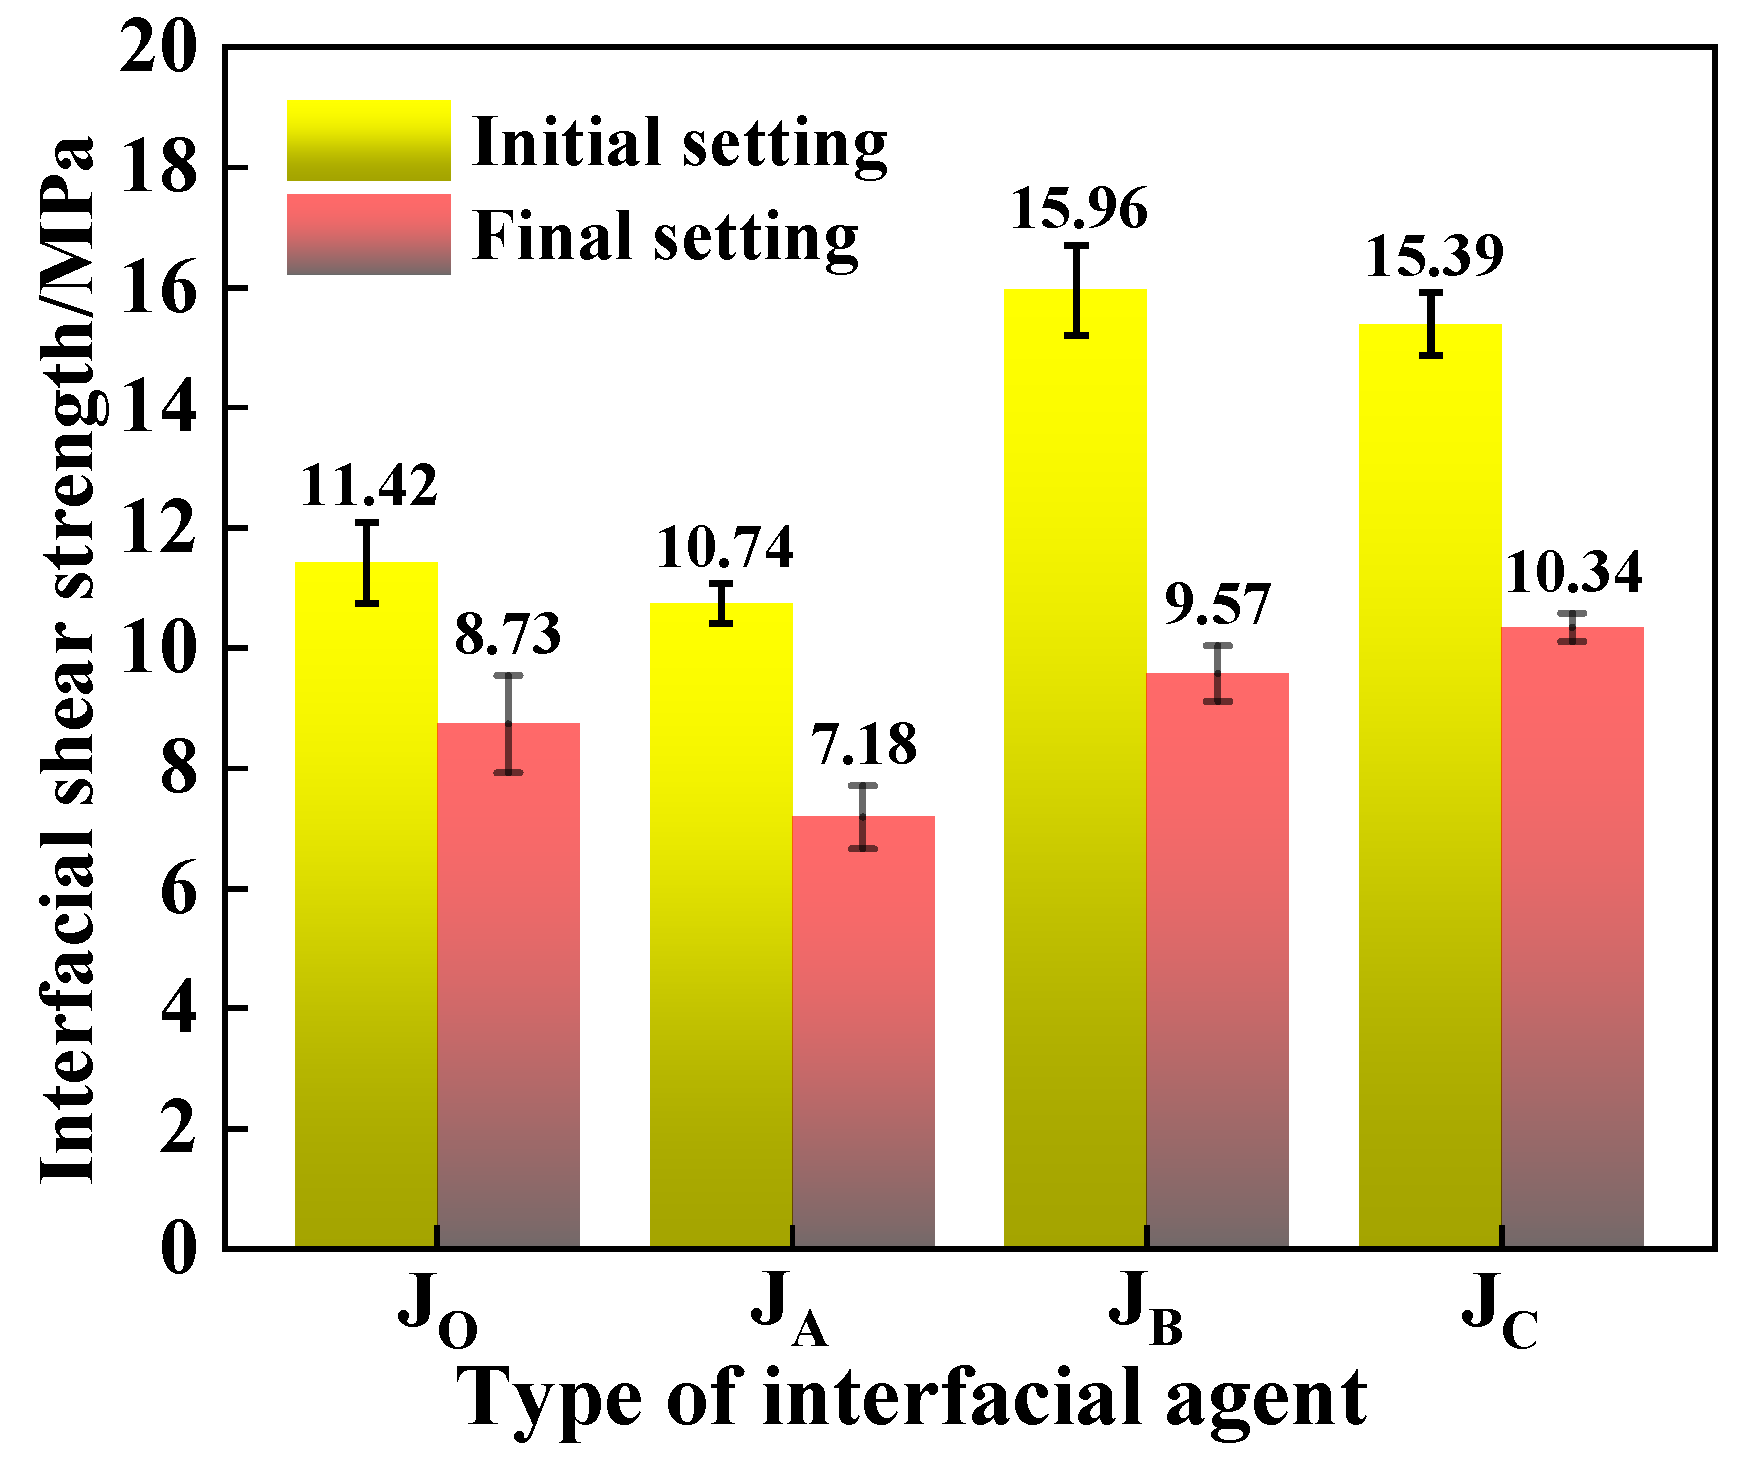
3.4. Interface Shear Performance of Composite Specimens

From Figure 8, when the age of the base concrete is the initial setting, the shear strength of the bonding layer is about 30–60% higher than that of the final setting stage. The order of performance of the interface agent from high to low is from the JB cement-based fiber silica fume mortar to the JC epoxy emulsion, JO no interface agent, and JA cement paste. This is mainly because for the JA cement paste interface agent, the bonding force in the interface area comes from the van der Waals force formed by the hydration products of the interface agent penetrating the surface voids of the base concrete, as well as the mechanical bite force between the cement paste and the porous structure of the surface pervious concrete. However, the shrinkage of the interface area increases gradually as the curing age increases, while the bonding strength also decreases. The silica fume in the JB cement-based interfacial agent possesses strong pozzolanic activity, and a pozzolanic reaction occurs at the interface, which alters the pore size structure of the interfacial cement paste and thickens the paste [30]. In addition, the polypropylene fiber in the JB interfacial agent can not only limit the micro-crack expansion caused by the load stress concentration on the bonding surface, but can also compensate for the shrinkage of the interfacial cement paste when combined with the anti-cracking waterproofing agent to reduce the bonding strength loss caused by the shrinkage. The bonding strength of the epoxy-based interfacial agent mostly comes from the bonding strength provided by the epoxy emulsion applied to the interface penetrating and solidifying in the pores of the concrete slurry in the interface area. However, due to the porous structure on the surface of the PC, the epoxy emulsion forms a “point contact” with the surface of the PC, resulting in the loss of bonding strength. Therefore, when subjected to loading, the interfacial bonding force provided by the epoxy emulsion is slightly smaller than that provided by the silica fume, polypropylene fiber and anti-cracking waterproofing agent. In addition, it can be found that the shear strength of the cement paste and interfacial agent is lower than that without the interfacial agent, mainly because the stress direction and stress point of the diagonal shear failure and splitting tensile failure are different. The diagonal shear failure is subjected to force along the 45° direction of the composite interface, and the action point is completely in the bond layer. The splitting tensile strength is subjected to force in the vertical direction. The failure strength is not only determined by the bond layer, but also partly determined by the concrete strength on both sides of the bond layer. Due to the use of a cement paste and interfacial agent for the composite, the shrinkage of the bond layer is large at the later stage. Without the interfacial agent, the concrete on both sides is modified by admixtures and mineral admixtures, and the shrinkage of the interface area formed by the composite of the two concrete pastes is effectively controlled. Therefore, when subjected to oblique shear failure, the cement paste is damaged prematurely due to the cracks generated by the interfacial shrinkage.

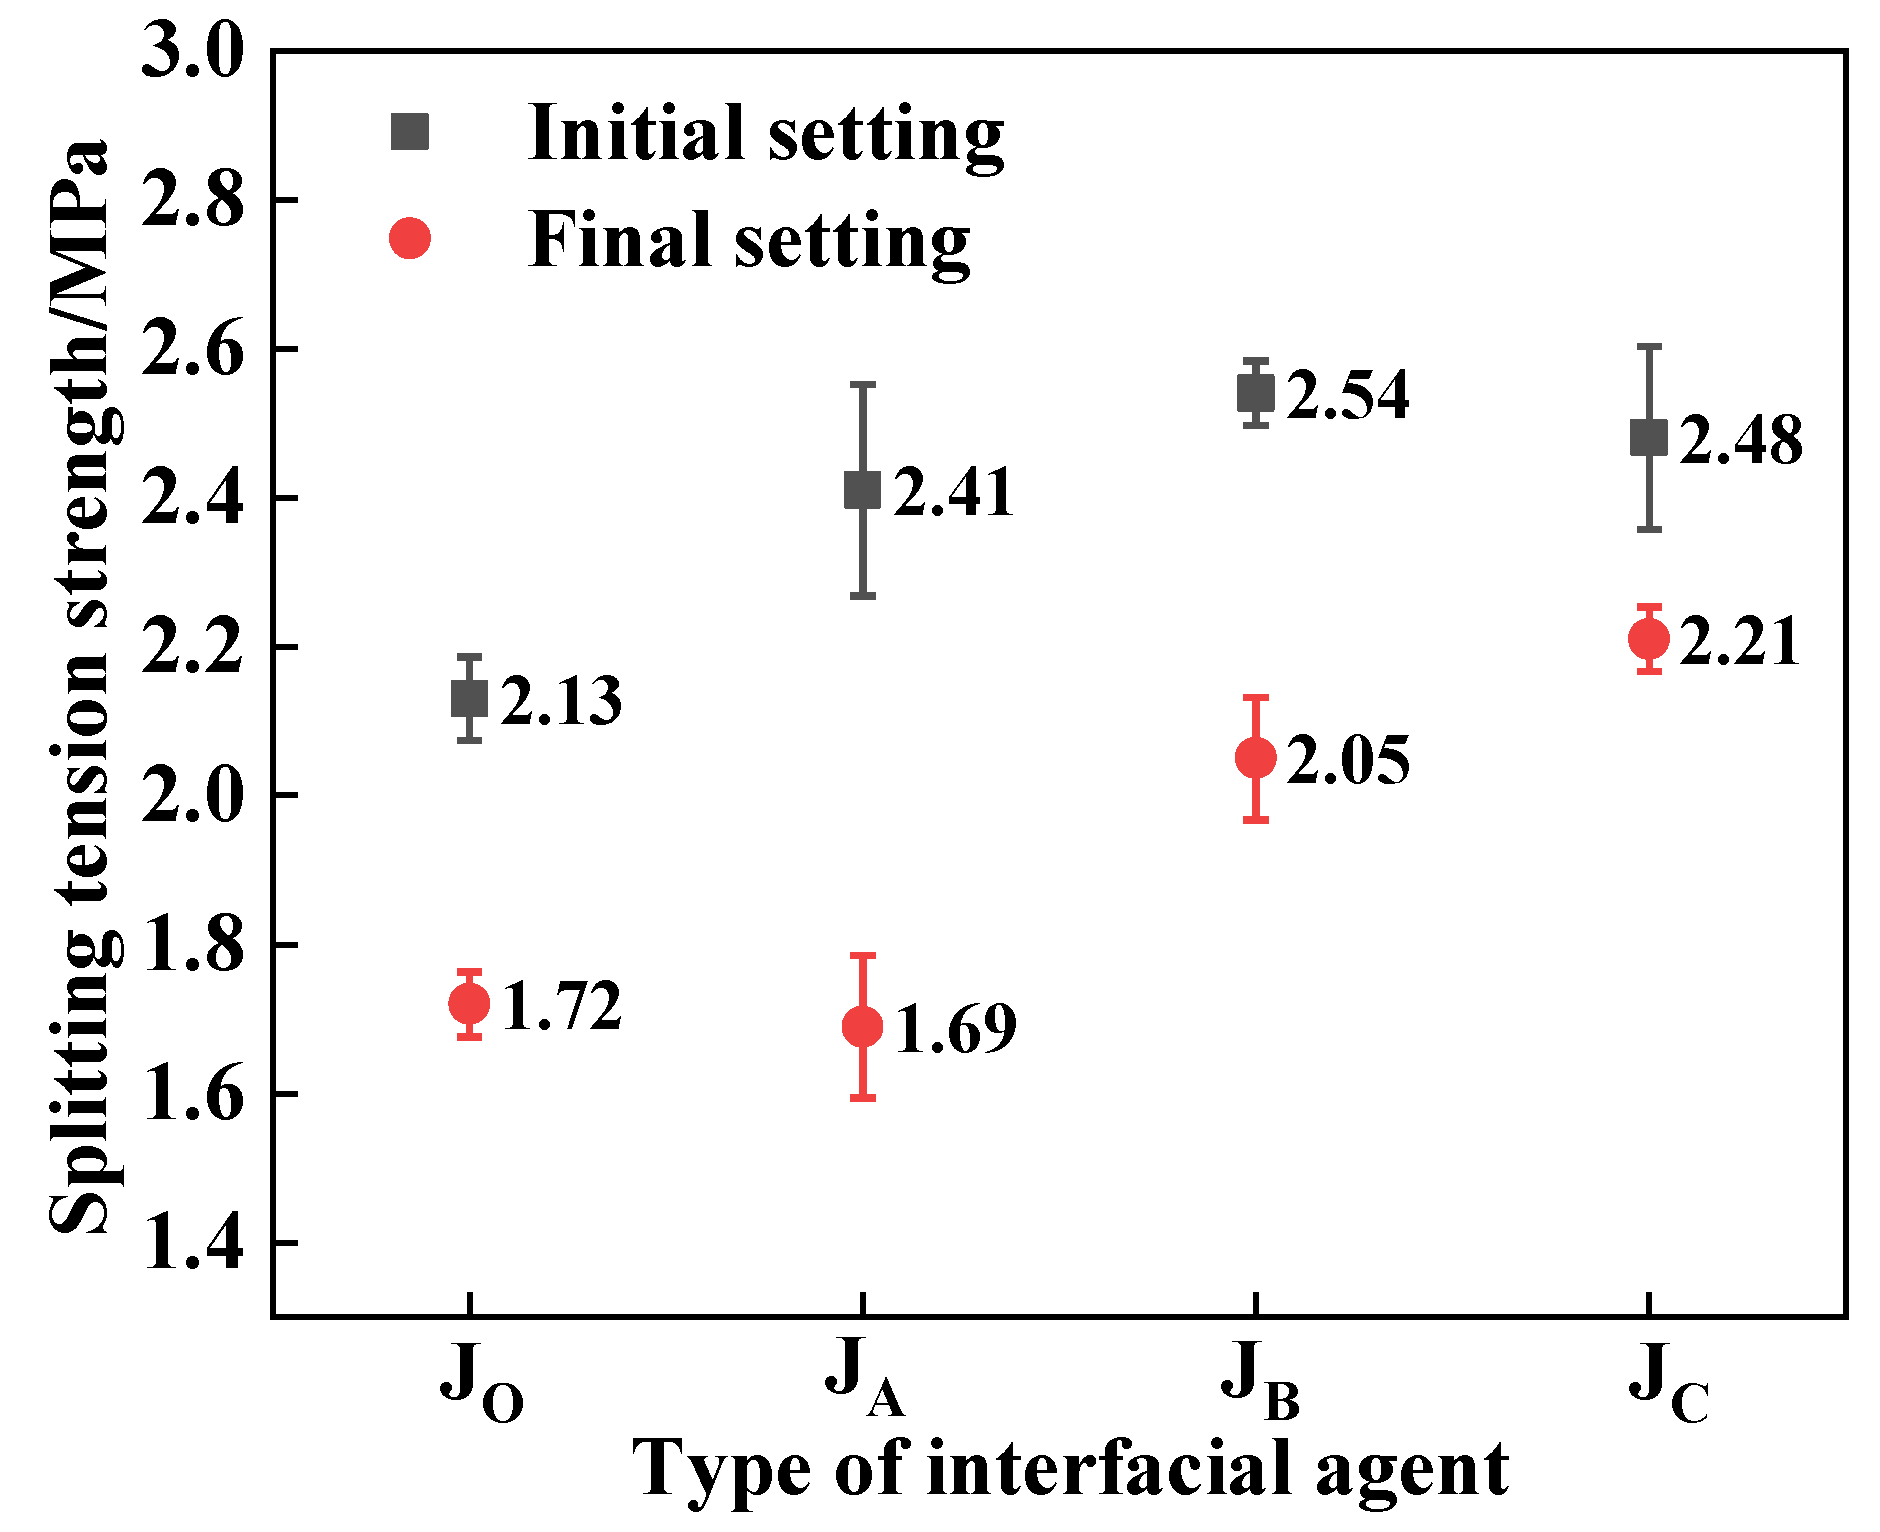
3.5. Splitting Performance of Composite Specimens

From Figure 9, for the JO without interface agent, JA agent, JB cement-based interface agent and JC epoxy-based interface agent, compared with the composite pouring of the base concrete in the final setting state, the splitting tensile strength of the base concrete in the initial setting state is higher. When the age of the base concrete is at the initial setting and final setting points, respectively, from the plastic state to the hard state, the common hydration of the interface is weakened and the bonding force of the cement-based interface agent is reduced. The splitting tensile strength obtained from the interfacial treatment with the interfacial agent in the initial setting state is about 20% higher than that without the interfacial agent. Among them, the splitting tensile strength obtained by using the JB cement-based interfacial agent is the highest, higher even than that of the JC epoxy-based interfacial agent, with excellent adhesion in the traditional sense.
Figure 10 shows the interface condition of the JB interface agent composite specimen after splitting failure. For the splitting tensile failure mode of the composite specimens, due to the internal fiber effect after the splitting tensile failure, most of the body specimens were not completely separated, and there was a penetrating crack on the failure surface. After the splitting of pervious composite concrete specimens using the cement-based interfacial agent, most of the composite specimens were completely separated, with several exceptions. On one hand, this is due to the connection effect of the polypropylene fiber in JB interfacial agent on the concrete on both sides; on the other hand, during the pouring process of the surface PC when the base concrete is at the initial setting, some aggregates are embedded in the base due to the gravity effect, making the interface bond more closely. According to the observation of the bonding surface, there was no aggregate shedding after the failure of the bonding layer, and only concrete on both sides was attached to the surface. The higher the splitting tensile strength, the more cement paste on the base side of the bond surface. The specimens with the epoxy-based interfacial agent were completely separated after failure, and the amount of cement paste attached to the interface was sparse.

3.6. Composite Specimens’ Bending and Tensile Properties

In the design of the composite specimens, the BPC is the main load-bearing carrier, while the PCBIC is mainly used as a protective layer to improve the bending performance of the entire composite specimen. The test results in Section 3.3 show that the bending deformation ability of the PCBIC material is better than that of the BPC material. When designing the composite ratio of the surface layer and the base concrete of the composite specimen, it is necessary to consider situations where multiple cracks occur when the bending deformation of the composite specimen occurs under the bending tensile load and the bending load of the BPC does not reach the ultimate bearing capacity of the PCBIC. In this experiment, the volume ratio of the BPC to PCBIC was 1:1. The test results for the interfacial shear strength show that the interface treatment process for the BPC-PCBIC composite specimen prepared using the JB type interface agent at the initial setting is the most ideal. The stress–deflection curves of the BPC specimen, PCBIC specimen, and BPC-PCBIC composite specimen from the flexural–tensile test are presented in Figure 11.
From Figure 11, the bearing capacity of the PFBIC base increases rapidly during the three-point bending and tension loading process. The curve is approximately a straight line, and the corresponding plastic deformation is small. When reaching the ultimate bending stress at about 8.15 MPa, the corresponding bending deflection is about 0.58 mm. The load–deflection curve has no obvious jitter during this rise, indicating that there is no more cracking during the loading process. After the ultimate bending load, the decline of the curve is relatively flat. During the three-point bending and tensile loading process of the BPC-PFBIC composite pavement, the load rise rate is relatively low, and the curve shows the first jitter at the stress level of 5.88 MPa with the initial crack point. Subsequently, the load rise rate of the bearing capacity gradually decreases and evident plastic deformation occurs, accompanied by the generation of multiple cracks. When reaching the ultimate bending stress at about 6.58 MPa, the bending deflection is about 0.81 mm.
During the experiment on the composite specimens, when the stress reached 5.88 MPa, the initial crack appeared near the middle span of the PFBIC. With the continuous increase in load, the PFBIC entered the multi-fracture stage until the main crack spread throughout the PFBIC layer. Subsequently, the cracks generated by the BPC gradually extended along the direction of the main crack generated in the PFBIC. The test specimen is shown in Figure 12. Near the mid-span, there were two small but obvious cracks in the PFBIC layer, which converged into a main crack. The direction of the crack in the BPC layer also developed along the main fracture direction. The PFBIC material can form multiple micro-cracks to disperse the stress caused by the deformation and avoid the rapid aggregation of main cracks. If the load disappears during these multiple cracks, the tiny cracks can be repaired via the hydration of anhydrous cement particles in the matrix.

3.7. Microscopic Analysis

In order to further characterize the microstructure of the interface, the different matrix and interface transition zones of the JB-type interface agent were observed via SEM, and the results are shown in Figure 13. The zone outlined with the dashed line in Figure 13a is the interface position, where the left side is the PFBIC material, the right side is the BPC material and the middle is JB the interface agent. The interface between the JB-type interfacial agent and the PFBIC is dense, and not many pores or cracks can be observed. The JB interface agent and BPC had point-to-surface contact, and a small portion of the BPC particles penetrated the interface layer and bonded closely to it. As shown in Figure 13b,c, the C-S-H gel product with an interlaced network structure, a small amount of plate-like calcium hydroxide (CH) crystal and needle-rod ettringite (AFt) were formed after adding 8% silica fume, and the structure was relatively dense. The reasons for this micro-morphology are the high hydration activity of the silica fume and high degree of hydration. At the same time, the “micro-aggregate effect” of the silica fume can better fill the pores between the cement stones [31].

4. Conclusions

In this paper, a pervious cement-based concrete pavement structure, in which the surface layer is formed from BPC and the base layer formed from PFBIC, was proposed. The optimal mixing ratio of the BPC was achieved using an orthogonal test. The bonding properties between the surface layer and base layer based on the different surface process techniques were examined using an interfacial shear test and splitting tensile strength test. In addition, the overall mechanical properties of the composite structure were tested using a three-point bending test. Based on the experimental results, the following conclusions can be drawn:
(1)
The early strength agent content and silica fume content exhibited the most significant influence on the compressive strength of the BPC. The aggregate gradation and early strength agent content had the most significant influence on the permeability coefficient. The highest compressive strength and permeability coefficient of the BPC were 40.30 MPa and 2.41 mm/s, respectively;
(2)
Better interfacial bonding performance within the composite structures can be achieved by casting the surface layer before the full curing of the base layer. In addition, the interfacial bonding strength can be further enhanced in most cases by using the interface agents. The cement-based fiber silica fume slurry interface agent led to a higher bond strength as compared to the epoxy resin binder and cement-based interface agent. The highest interfacial shear strength and splitting tensile strength achieved were 15.96 MPa and 2.20 MPa, respectively;
(3)
The ultimate bending stress of the BPC-PFBIC composite specimen was 6.58 MPa and the maximum mid-span deflection was 0.81 mm, which were higher than the BPC specimens and higher than the PFBIC specimens, respectively.

Author Contributions

Theoretical analysis, validation, writing, H.-X.Z., C.-F.L., Y.-Z.T., Y.-L.L. and J.-Y.Z.; suggestions, Y.Z. and H.-B.L. All authors have read and agreed to the published version of the manuscript.

Funding

The work described in this paper was supported by Anhui Provincial Universities Natural Science Research Project (Grant No. KJ2020ZD43) and Anhui Provincial Natural Science Foundation Project (Grant No. 1908085ME144).

Institutional Review Board Statement

Not applicable.

Informed Consent Statement

Not applicable.

Data Availability Statement

The raw data supporting the conclusions of this article will be made available by the authors, without undue reservation.

Acknowledgments

Special thanks is due to Dong GUO of Hong Kong Polytechnic University. The findings and opinions expressed in this article are only those of the authors and do not necessarily reflect the views of the sponsors.

Conflicts of Interest

The authors declare no conflict of interest.

References

  1. Ma, Y.; Jiang, Y.; Swallow, S. China’s sponge city development for urban water resilience and sustainability: A policy discussion. Sci. Total Environ. 2020, 729, 139078. [Google Scholar] [CrossRef]
  2. Akkaya, A.; Çağatay, İ.H. Experimental investigation of the use of pervious concrete on high volume roads. Constr. Build. Mater. 2021, 279, 122430. [Google Scholar] [CrossRef]
  3. Vu, V.-H.; Tran, B.-V.; Le, B.-A.; Nguyen, H.-Q. Prediction of the relationship between strength and porosity of pervious concrete: A micromechanical investigation. Mech. Res. Commun. 2021, 118, 103791. [Google Scholar] [CrossRef]
  4. Song, H.; Yao, J.; Luo, Y.; Gui, F. A chemical-mechanics model for the mechanics deterioration of pervious concrete subjected to sulfate attack. Constr. Build. Mater. 2021, 312, 125383. [Google Scholar] [CrossRef]
  5. Kim, K.; Chun, S.; Park, B.; Han, S. Precast prestressed concrete pavement (PPCP): Effect of thermal gradient on curling deflection and stress. Constr. Build. Mater. 2021, 274, 121966. [Google Scholar] [CrossRef]
  6. Xie, N.; Akin, M.; Shi, X. Permeable concrete pavements: A review of environmental benefits and durability. J. Clean. Prod. 2019, 210, 1605–1621. [Google Scholar] [CrossRef]
  7. Zhong, R.; Leng, Z.; Poon, C.-S. Research and application of pervious concrete as a sustainable pavement material: A state-of-the-art and state-of-the-practice review. Constr. Build. Mater. 2018, 183, 544–553. [Google Scholar] [CrossRef]
  8. Huang, J.; Luo, Z.; Khan, M.B.E. Impact of aggregate type and size and mineral admixtures on the properties of pervious concrete: An experimental investigation. Constr. Build. Mater. 2020, 265, 120759. [Google Scholar] [CrossRef]
  9. Li, L.; Feng, J.; Lu, Z.; Xie, H.; Xiao, B.; Kwan, A.; Jiao, C. Effects of aggregate bulking and film thicknesses on water permeability and strength of pervious concrete. Powder Technol. 2022, 396, 743–753. [Google Scholar] [CrossRef]
  10. Sahdeo, S.K.; Ransinchung, G.; Rahul, K.; Debbarma, S. Effect of mix proportion on the structural and functional properties of pervious concrete paving mixtures. Constr. Build. Mater. 2020, 255, 119260. [Google Scholar] [CrossRef]
  11. Shen, P.; Lu, J.-X.; Zheng, H.; Liu, S.; Poon, C.S. Conceptual design and performance evaluation of high strength pervious concrete. Constr. Build. Mater. 2021, 269, 121342. [Google Scholar] [CrossRef]
  12. Rangelov, M.; Nassiri, S.; Haselbach, L.; Englund, K. Using carbon fiber composites for reinforcing pervious concrete. Constr. Build. Mater. 2016, 126, 875–885. [Google Scholar] [CrossRef]
  13. Zhang, J.; Wang, Z.; Ju, X. Application of ductile fiber reinforced cementitious composite in jointless concrete pavements. Compos. Part B Eng. 2013, 50, 224–231. [Google Scholar] [CrossRef]
  14. Vaitkus, A.; Šernas, O.; Gražulytė, J. Modular pavements: Developing high performance concrete. Constr. Build. Mater. 2021, 292, 123362. [Google Scholar] [CrossRef]
  15. Li, J.; Dong, L.; Zhang, J. Experimental on Bonding Performances of UHPC-thin Asphalt Layer with Epoxy Adhesive Agents for Ultra-high Performance Composite Bridge Deck. J. Chang. Univ. Nat. Sci. Ed. 2020, 40, 49–57. [Google Scholar]
  16. Carbonell Muñoz, M.A.; Harris, D.K.; Ahlborn, T.M.; Froster, D.C. Bond performance between ultrahigh-performance concrete and normal-strength concrete. J. Mater. Civ. Eng. 2014, 26, 04014031. [Google Scholar] [CrossRef]
  17. Crane, C.K. Shear and Shear Friction of Ultra-High Performance Concrete Bridge Girders; Georgia Institute of Technology: Atlanta, GA, USA, 2010. [Google Scholar]
  18. Lee, M.-G.; Wang, Y.-C.; Chiu, C.-T. A preliminary study of reactive powder concrete as a new repair material. Constr. Build. Mater. 2007, 21, 182–189. [Google Scholar] [CrossRef]
  19. Li, Z.; Rangaraju, P.R. Effect of surface roughness on the bond between ultrahigh-performance and precast concrete in bridge deck connections. Transp. Res. Rec. 2016, 2577, 88–96. [Google Scholar] [CrossRef]
  20. Looney, T.; Coleman, R.; Funderburg, C.; Volz, J.; Floyd, R. Concrete bond and behavior of nonproprietary ultrahigh-performance concrete bridge slab joints. J. Bridge Eng. 2021, 26, 04020128. [Google Scholar] [CrossRef]
  21. Zhang, Y.; Zhu, P.; Wang, X.; Wu, J. Shear properties of the interface between ultra-high performance concrete and normal strength concrete. Constr. Build. Mater. 2020, 248, 118455. [Google Scholar] [CrossRef]
  22. Tarr, S.M.; Okamoto, P.A.; Sheehan, M.J.; Packard, R.G. Bond interaction between concrete pavement and lean concrete base. Transp. Res. Rec. 1999, 1668, 9–16. [Google Scholar] [CrossRef]
  23. Lu, Z.; Feng, Z.-G.; Yao, D.; Li, X.; Jiao, X.; Zheng, K. Bonding performance between ultra-high performance concrete and asphalt pavement layer. Constr. Build. Mater. 2021, 312, 125375. [Google Scholar] [CrossRef]
  24. Wang, H.-P.; Song, T.; Yan, J.-W.; Xiang, P.; Feng, S.-Y.; Hui, D. Improved Analytical Method for Interfacial-Slip Control Design of Steel–Concrete Composite Structures. Symmetry 2021, 13, 1225. [Google Scholar] [CrossRef]
  25. Zhai, H.-X.; Tang, Y.-Z.; Chen, S.-H.; Chen, H.-H.; Cheng, B.-Q.; Cai, X.; Wei, Y.-H. Experimental Research on Durability of Fly Ash Pavement Concrete and Mix Proportion Optimization. Adv. Mater. Sci. Eng. 2021, 2021, 8864706. [Google Scholar] [CrossRef]
  26. Sun, N.; Song, Y.; Hou, W.; Zhang, H.; Wu, D.; Li, Y.; Gong, Y. Interfacial Bond Properties between Normal Strength Concrete and Epoxy Resin Concrete. Adv. Mater. Sci. Eng. 2021, 2021, 5561097. [Google Scholar] [CrossRef]
  27. Xi, J.; Liu, J.; Yang, K.; Zhang, S.; Han, F.; Sha, J.; Zheng, X. Role of silica fume on hydration and strength development of ultra-high performance concrete. Constr. Build. Mater. 2022, 338, 127600. [Google Scholar] [CrossRef]
  28. Carballosa, P.; Calvo, J.G.; Revuelta, D. Influence of expansive calcium sulfoaluminate agent dosage on properties and microstructure of expansive self-compacting concretes. Cem. Concr. Compos. 2020, 107, 103464. [Google Scholar] [CrossRef]
  29. Ling, Y.; Zhang, P.; Wang, J.; Chen, Y. Effect of PVA fiber on mechanical properties of cementitious composite with and without nano-SiO2. Constr. Build. Mater. 2019, 229, 117068. [Google Scholar] [CrossRef]
  30. Nedunuri, S.S.S.A.; Sertse, S.G.; Muhammad, S. Microstructural study of Portland cement partially replaced with fly ash, ground granulated blast furnace slag and silica fume as determined by pozzolanic activity. Constr. Build. Mater. 2020, 238, 117561. [Google Scholar] [CrossRef]
  31. Vu, M.-H.; Sulem, J.; Laudet, J.-B. Effect of the curing temperature on the creep of a hardened cement paste. Cem. Concr. Res. 2012, 42, 1233–1241. [Google Scholar] [CrossRef]
Figure 1. Types of interface agents used in the test.
Symmetry 14 01295 g001
Figure 2. Specimen forming process.
Symmetry 14 01295 g002
Figure 3. Composite specimen interfacial oblique shear test: (a) design drawing; (b) real-shot picture.
Symmetry 14 01295 g003
Figure 4. Composite specimen splitting tensile test.
Symmetry 14 01295 g004
Figure 5. Three-point bending test specimens and experimental method.
Symmetry 14 01295 g005
Figure 6. Compressive strength influence trend.
Symmetry 14 01295 g006
Figure 7. Permeability coefficient change trend.
Symmetry 14 01295 g007
Figure 8. Surface shear strengths of the composite specimens.
Symmetry 14 01295 g008
Figure 9. Splitting tensile strengths of composite specimens.
Symmetry 14 01295 g009
Figure 10. JB interface agent composite specimen after the splitting failure interface condition.
Symmetry 14 01295 g010
Figure 11. Three-point bending load–deflection curves.
Symmetry 14 01295 g011
Figure 12. Three-point flexural experiment after fracture existence conditions and a cross-section of the specimens.
Symmetry 14 01295 g012
Figure 13. SEM image of the bonding interface.
Symmetry 14 01295 g013
Table 1. Chemical composition analysis of cementitious materials.
Cementitious Materialsw (CaO)w (SiO2)w (Al2O3)w (Fe2O3)w (MgO)w (SO3)w (K2O)w (Na2O)Other
P·II 52.564.7020.404.703.380.871.884.06
P·O 42.560.6021.847.323.701.772.242.53
Fly ash6.0949.9633.024.521.170.620.980.66
Silica fume0.5293.130.370.921.030.81 3.22
Table 2. Major technical properties of basalt fiber and PVA fiber.
Diameter/μmAspect RatioTensile Strength/MPaElastic Modulus/GPaBreaking Elongation%Density g/cm3
Basalt fiber188334100–4800893.12.7
PVA fiber154001400–160035–3914.0–17.00.91
Table 3. Admixtures and models.
ApplicationNameManufacturer
Surface BPCHPMC Dispersant agentJinzhou Fuqiang Fine Chemical Co., Ltd.
HB-03 Defoaming agentShandong Yantai Hongfu Additive Co., Ltd.
Early strength agentWuxi Jide Sponge Company
Base PFBICWHDF Curing agentWuhan Tianyi Chemical Co., Ltd.
Polycarboxylate superplasticizerAnhui China Railway Engineering Materials Technology Co., Ltd.
Table 4. The orthogonal test factor levels.
LevelA (Grading of Aggregates)B (Early Strength Agent Content/%)C (Basalt Fiber Content/%)D (Silica Fume Content/%)
3–5 mm5–10 mm
17:32.50.17
25:53.00.29
33:73.50.311
Table 5. The orthogonal test factor levels.
NumberAB/%C/%D/%28 d Compressive Strength/MPaPermeability Coefficient/mm/s
3–5 mm5–10 mm
17:32.50.1731.52.74
27:33.00.2933.92.48
37:33.50.31135.71.63
45:52.50.21126.93.51
55:53.00.3740.32.40
65:53.50.1932.52.65
73:72.50.3928.73.77
83:73.00.11128.63.17
93:73.50.2739.22.91
Table 6. Orthogonal test factor level table.
NumberABCD
K1101.189.6103.2111.0
K299.7102.8100.097.6
K399.0107.4107.291.2
k133.729.934.437.0
k233.234.333.332.5
k333.035.835.730.4
Range0.75.92.46.6
IntensityD > B > C > A
Table 7. The 28 d compressive strengths from the BPC variance analysis.
FactorQuadratic SumFreedom DegreeMean SquareF RatioP RatioSignificance
A0.7410.740.430.5484not significant
B52.81152.8130.790.0052particularly significant
C35.53135.5320.710.0104significant
D65.34165.3438.100.0035particularly significant
Error6.8641.72
Summation161.278
Table 8. Permeability coefficient range analysis results.
NumberABCD
K16.878.068.588.06
K28.678.368.388.9
K39.536.878.118.11
k12.292.692.862.69
k22.892.792.792.97
k33.182.292.702.70
Range0.890.50.160.28
IntensityA > B > D > C
Table 9. Permeability coefficient variance analysis.
FactorQuadratic SumFreedom DegreeMean SquareF RatioP RatioSignificance
A1.1811.1823.950.0081particularly significant
B1.4711.4729.850.0055particularly significant
C0.03710.0370.750.4360not significant
D0.0004110.000410.008460.9311not significant
Error0.24
Summation2.888
Table 10. Orthogonal test efficacy coefficient analysis.
ABCDPerformance IndexEfficiency CoefficientOverall Efficacy Coefficient
d = d 1 d 2
28 d Compressive Strength/MPaPermeability Coefficient/mm/s28 d Compressive StrengthPermeability Coefficient
111131.52.740.7820.7320.757
122233.92.480.8410.6580.743
133335.71.630.8860.4320.619
212326.93.510.6670.8780.765
223140.32.401.0000.7190.847
231232.52.650.8290.7030.763
313228.73.770.7121.0000.843
321328.63.170.7300.8410.784
332139.22.910.9730.6870.817
Table 11. The 28 d basic performance of the BPC and PFBIC.
MaterialFlexural Strength/MPa Compressive Strength/MPa Permeability Coefficient/mm/s
BPC5.0240.302.41
PFBIC8.2050.80
Publisher’s Note: MDPI stays neutral with regard to jurisdictional claims in published maps and institutional affiliations.

