
Dynamic Behaviors of Optimized K12 Anti-Ram Bollards

1
Institute of Defense Engineering, AMS, PLA, Beijing 100850, China
2
School of Civil Engineering and Architecture, Xi’an University of Technology, Xi’an 710048, China
3
College of Civil Engineering, Tongji University, Shanghai 200092, China
*
Authors to whom correspondence should be addressed.
Symmetry 2022, 14(8), 1703; https://0-doi-org.brum.beds.ac.uk/10.3390/sym14081703
Submission received: 28 July 2022
/
Revised: 9 August 2022
/
Accepted: 10 August 2022
/
Published: 16 August 2022
(This article belongs to the Special Issue Numerical Simulation and Control of Mechanical and Mechatronic Systems)
Abstract
:Since terrorist attacks pose a great threat, protective structures need to be applied in terms of the safety of buildings and personnel. The installation of anti-ram bollards around buildings and infrastructures could block potential hazards, including the damage caused by car bombs and vehicular impacts on the buildings. In order to provide effective protection for buildings, the dynamic behaviors of anti-ram bollards should be examined, which is under insufficient research. In this paper, by adopting the FE program LS-DYNA, the FE models of corresponding anti-ram bollards are established, and the FEMs are validated by comparison with the experimental results of five existing vehicle crash tests. On this basis, the dynamic response of the optimized K12 anti-ram bollards under vehicular impact is numerically analyzed, and the influences of various parameters on the deformation of anti-ram bollards, as well as the displacement of the vehicle is studied.
1. Introduction
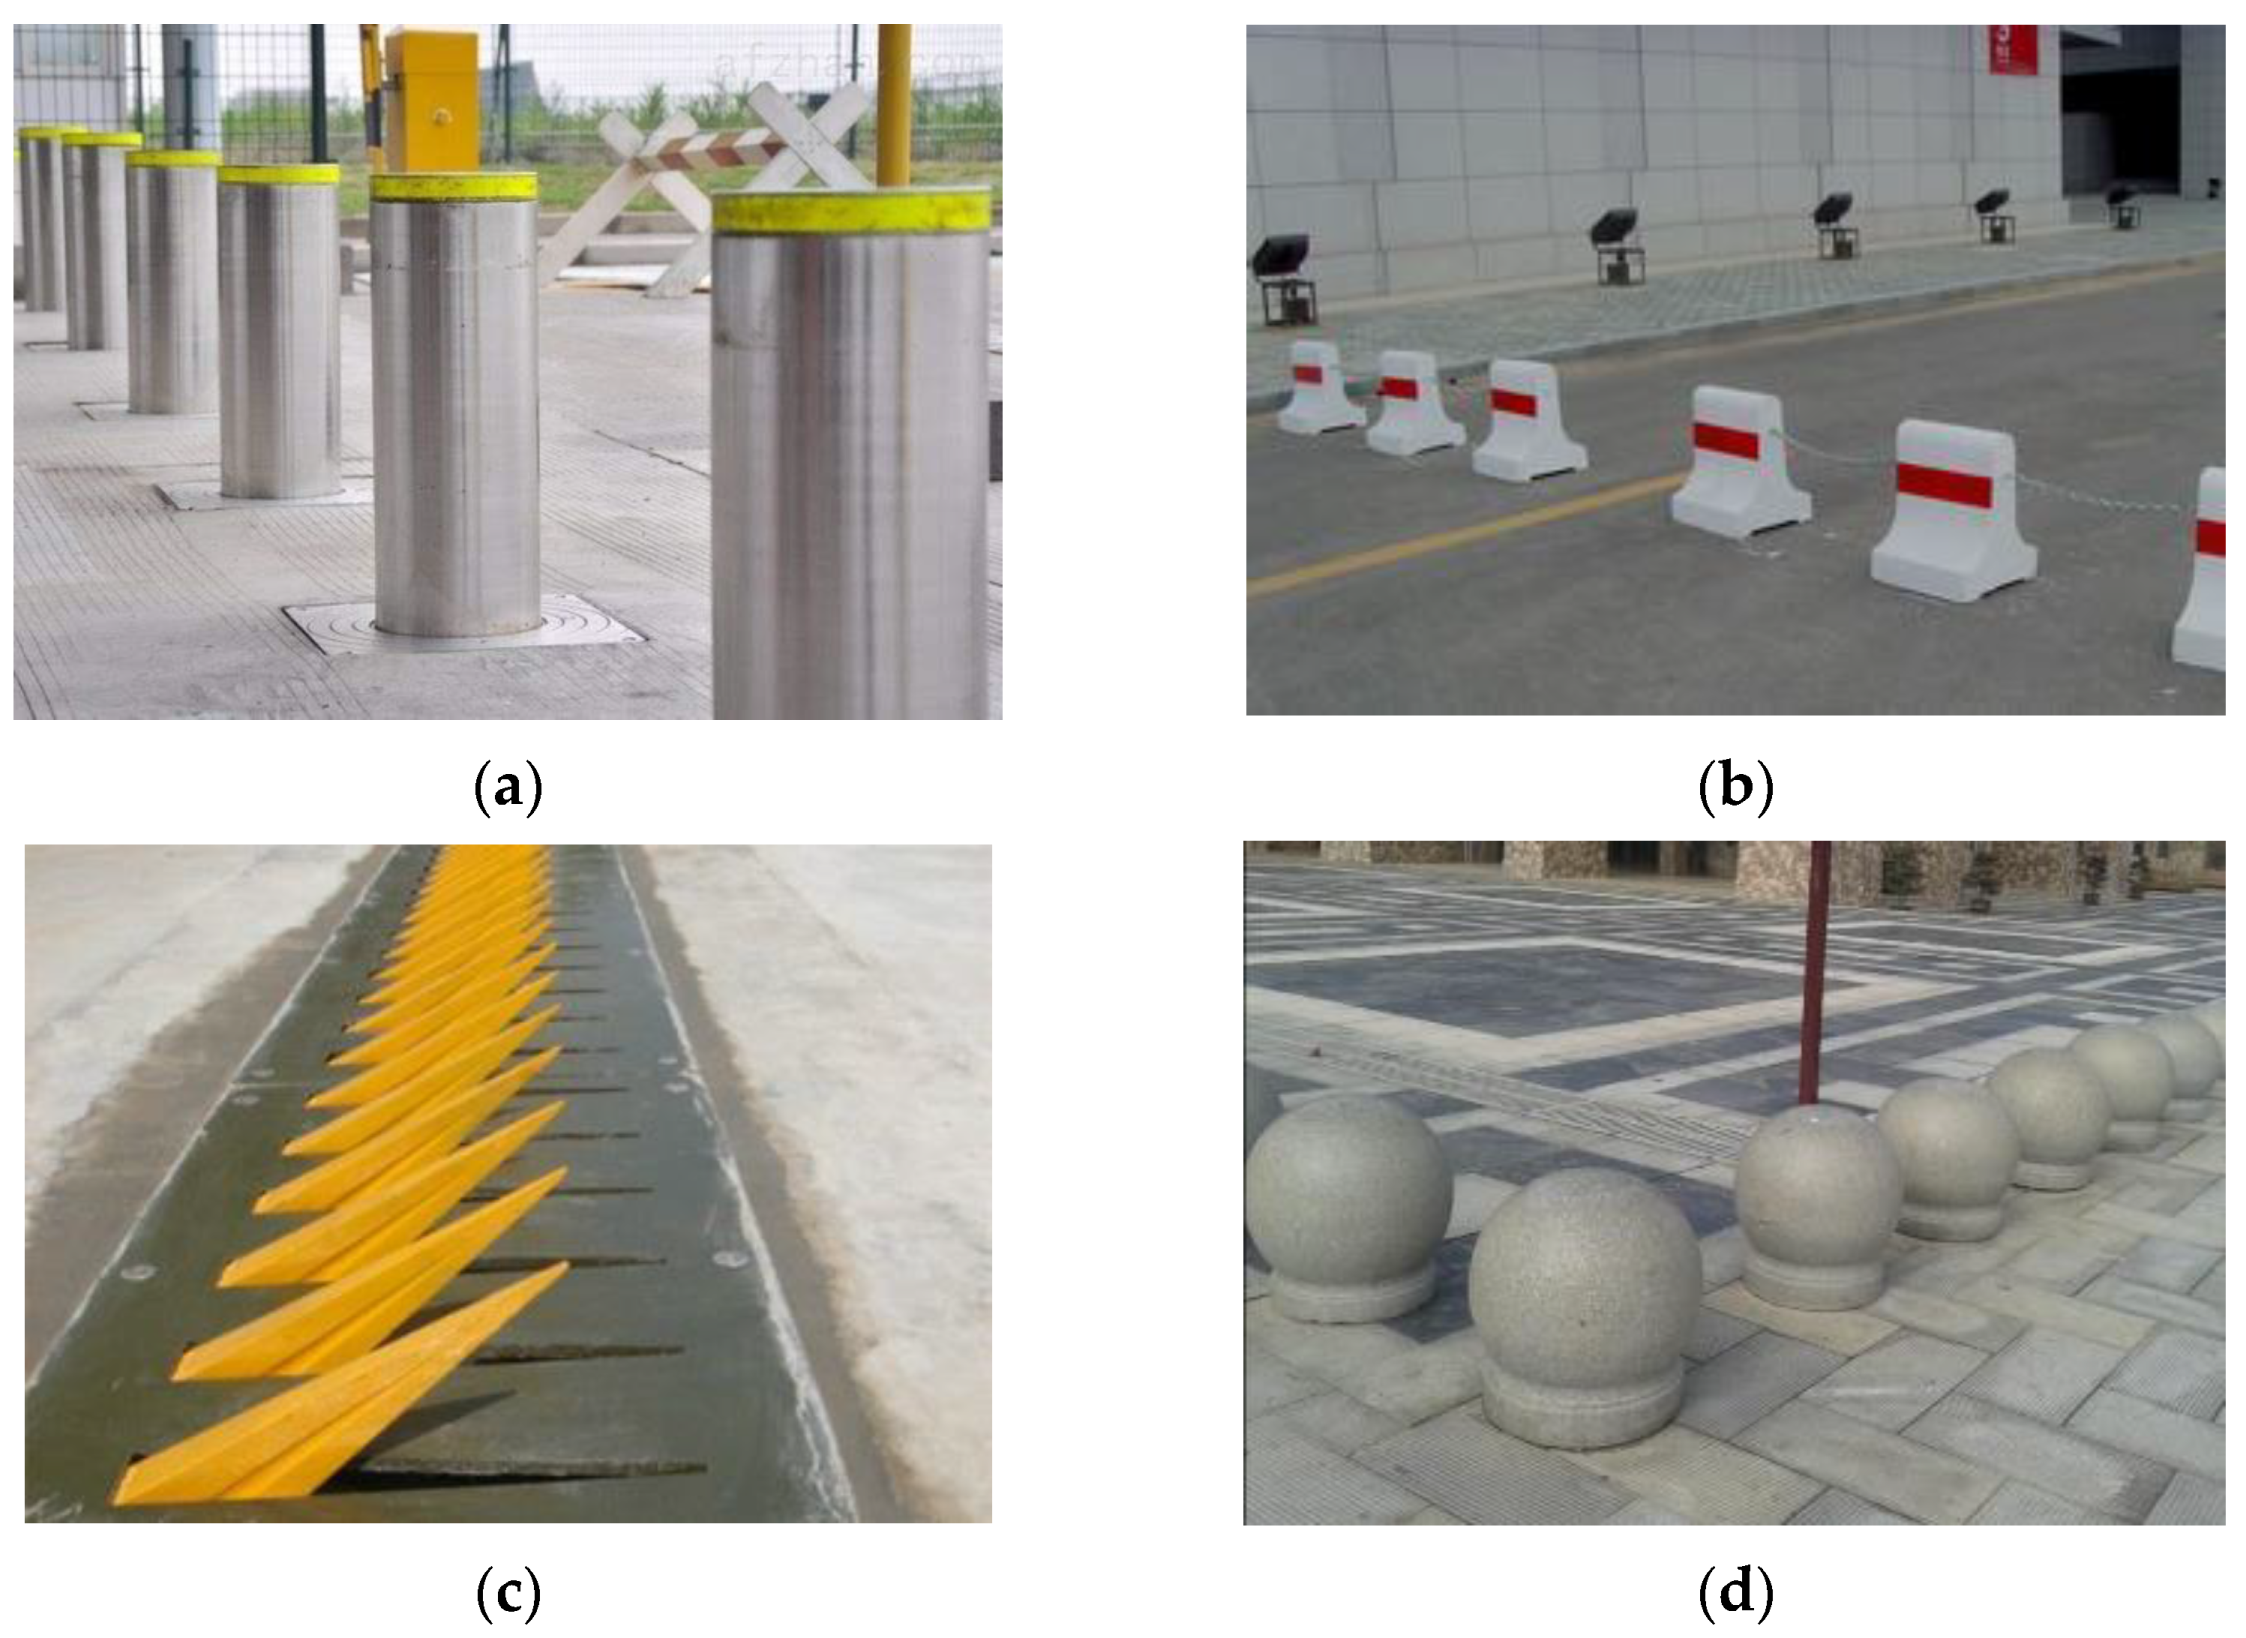
Terrorist activities have become an important threat to the security of the international community, which can cause severe damage and even a progressive collapse of buildings [1,2,3]. A vehicle bomb, which is known as a vehicle-borne improvised explosive device, has been commonly used as a weapon of terrorism to attack buildings and infrastructures. For instance, on 19 April 1995, the Alfred P. Murrah Federal Building in downtown Oklahoma City, Oklahoma, United States, was attacked by a vehicle bomb, killing 169 people and leaving over 500 people injured. On 7 August 1998, U.S. embassies in Kenya and Tanzania were bombed almost simultaneously. The bombings killed 243 people, and 5000 people were injured. The targets of such deliberate crimes are often the buildings with high economic and political value or areas with high population density, and the vehicles are likely to carry dangerous goods such as gasoline and bombs. In such cases, it is difficult to withstand the destructive power by relying only on the resistance of the structure itself. However, since the overpressure resulting from the explosion will decrease sharply with the increase in the propagation distance, maintaining a sufficient standoff is an effective and economical way to reduce blast and debris threats. The common types of perimeter protection, which are widely used to control vehicle access to protected areas and ensure an established distance between the possible point of explosion and crucial buildings, include anti-ram bollards, road barriers, tire breakers, and car stones. As shown in Figure 1, the foundation of the anti-ram bollard is buried underground; therefore its resistance is higher than other types of perimeter protection.
However, the research on engineering structure response under vehicle impact is mainly focused on the bridge, especially on the pier. Moreover, there have been many achievements in this field. Heng et al. [4,5] experimentally and numerically studied the dynamic properties of simply-supported double-pier bent highway bridges under heavy truck collisions. Do et al. [6] proposed the design method for RC bridge columns under vehicle impact through analytical investigation and numerical simulations and gave two design examples of RCBC under medium truck impact and heavy truck impact. Auyeung et al. [7] also investigated the design method for bridge piers based on performance and introduced the damage ratio index to predict the damage of bridge piers subjected to vehicle collisions according to impact scenarios.
As for the barriers, the U.S. Department of State (DoS) established the test method for vehicle crash testing of perimeter barriers and gates (SD-STD-02.01 Revision A) [8] in 2003 to make performance requirements for anti-ram bollards. The standard established a K-rating criterion based on the kinetic energy of a 6800 (±90) kg vehicle. As shown in Table 1, three ratings, e.g., K4, K8, and K12, are defined for barrier impact performance, which represents a vehicle frontal impacting a barrier at a velocity of 50 (45.0–60.0), 65 (60.1–75.0), and 80 (75.1–above) km/h, respectively. The prevention is deemed successful when the vehicle penetration is less than +1 m. As shown in Figure 2, vehicle penetration is the distance measured from the inside of the barrier after a collision to the leading edge of the cargo bed before the collision.
According to SD-STD-02.01 Revision A, the Pennsylvania Transportation Institute [9] and the KARCO Engineering, LLC [10,11,12,13] conducted vehicle crash tests of anti-ram bollards to evaluate their performance, which are named Test I–V herein. As shown in Figure 3, the vehicle penetrations of Test I–IV are less than 0 m, while that of Test V exceeds +1 m.
Chen et al. [14] conducted another vehicle crash test by following the requirements of SD-STD-02.01 Revision A [8]. As shown in Figure 4, the 6.8-ton truck collided with the bollard at a speed of 43.2 km/h, and the vehicle penetration after the collision was less than 0 m.
Cao et al. [15,16,17] experimentally and numerically studied the behavior of trucks colliding with concrete barriers, especially for MASH TL-4 and TL-5, and proposed a design approach for barriers against truck collisions by quantifying flexural rotation and demand/capacity (D/C) ratios.
Among the existing numerical simulations, in order to provide suggestions for the urban construction in Istanbul, Apak et al. [18] created FE models of a fixed bollard system, along with the vehicle models specified in PAS 68: 2013 standard, to numerically study the dynamic behaviors of the bollards under the impact of vehicle collisions. Crawford et al. [19] established an FE model of an anti-ram bollard system, including the foundation, surrounding soil, and bollards. The model can meet the requirements of K4, K8, and K12, but the error is larger than that of full-scale vehicle crash test data. Bangalore et al. [20] carried out numerical simulations to discuss the influences of different materials and impact velocity on the deformation and impact force of the steel anti-ram bollard. Dawson et al. [21] designed a “π” type anti-ram bollard foundation considering the existence of public facilities such as pipelines and lines under the subgrade. The finite element analysis proves that it can effectively protect underground pipelines and other structures while resisting vehicle impact. Noveral et al. [22] developed an FE model of a hollow square steel tube anti-ram bollard to study its deformation characteristics under vehicle collision. Hu et al. [23] established a FE model including the anti-ram bollard, concrete, subgrade soil, and road surface, and the model was verified by comparing with the results of Test I–IV. The orthogonal analysis was carried out on the K4 anti-ram bollard, and the influence degree of each parameter on the deformation of the vehicle and the anti-ram bollard was obtained. Then they evaluated the simplified calculation formula of the impact force peak generated by the simulation and proposed a new formula for predicting the peak impact force based on the evaluation result and the principle of energy conservation [24]. In 2017, Hu et al. [25] revised the calculation method of peak impact force of the Campbell model [26] based on vehicle deformation characteristics, which is more conservative than the formula of peak impact force based on energy conservation in Ref. [24]. Therefore, the modified Campbell model is more recommended in the design of anti-ram bollards.
The above studies indicate that only one K12 vehicle crash test did not meet the requirements specified by SD-STD-02.01 Revision A [8], and few numerical studies have been carried out on the protection performance of anti-ram bollards under the collision of higher-speed vehicles. This paper developed five FE models according to Test I–V and verified them through comparison with the test results. On this basis, the influences of various parameters of the anti-ram bollard on the deformation of the bollard and the displacement of the vehicle are studied under the impact velocity of 100 km/h, and the optimal design of the K12 anti-ram bollard is proposed.
2. FE Model
In this section, the FE models of anti-ram bollards and trucks are developed according to Test I–V and validated through comparison with the test results. In the simulation scenarios, the impact point of the truck and the bollard is on the longitudinal symmetry plane of the truck, i.e., the midspan of the truck front is facing the bollard. This arrangement mainly considers that the truck is an axisymmetric structure; its weak point lies on the axis of symmetry, where the damage caused by impact is the most serious. Therefore, the dynamic response analysis under these scenarios is conservative for the relevant design, which can ensure safety to the greatest extent.
2.1. FE Model of Truck
The explicit FE model of the Ford F800, which was developed by the Federal Highway Administration (FHWA) in the National Crash Analysis Center (NCAC), is downloaded from the NCAC website [27]. Mohan et al. [28] updated and validated the Ford F800 FE model through comparisons with an oblique crash test with respect to a concrete barrier. Miele et al. [29] further upgraded the model to a significantly higher degree of fidelity and validated it by comparing it with a full-scale crash test with respect to a single-slope bridge rail [30]. The F800 model used in this article is version 0.2, which is shown in Figure 5. It is 8.5 m in length, 8 t in gross weight, and 5.3 m in wheelbase and consists of 886 solid elements, 33,863 shell elements, and 548 beam elements. The cargo, engine, and transmission are simulated using elastic materials with densities of 313.6 kg/m3, 4120 kg/m3, and 2200 kg/m3, respectively, and elastic modulus of 2000 MPa, 110 Gpa, and 200 Gpa, respectively. The chassis frame is made of steel and is simulated by shell elements, whose elastic modulus and yield stress are 205 GPa and 385 MPa, respectively. Specific settings for material parameters and the contact algorithm of the model can be found in the literature [23,24].
Considering the differences between the F800 model and the test trucks in carriage, weight, and wheelbase, the carriage model of the F800 is deleted, and a new cargo bed made of steel plate is placed on the truck frame, as shown in Figure 6. The cargo is modeled by sand which is filled in Φ 580 × 930 (mm) steel drums, and the truck weights are adjusted to be the same as those of the test trucks by changing the volume of the sand. Another difference between the five test trucks lies in the wheelbase. Therefore, as shown in Figure 7, the five FE truck models are the same in dimensions except for D, E, F, and H. the dimensions of the five test trucks and the FE models are given in detail in Section 2.2 (the dimensions D, E, F and H of each truck are listed in the parentheses separately).
2.2. FE Model of Anti-Ram Bollard
The FE models of the fixed anti-ram bollards (FABSs) are developed according to the information given in Table 2 and Table 3 with the dimension listed Table 4, and the comparisons between the test FABSs and corresponding FE models are shown in Figure 8. The range of the surrounding concrete and bottom soil is restricted in simulations for computational efficiency. Therefore, the widths of the two components in front of and behind the foundation are set to 600 mm and those on both sides of the foundation are determined as 300 mm, and the depth of the bottom soil is set to 600 mm. The concrete and bottom soil are modeled by an 8-noded constant stress solid element. The MAT_CONCRETE_ DAMAGE_REL3 (MAT#72R3) model involves damage and strain-rate effects and is adopted to describe the concrete in steel tubes and foundations. In MAT#72R3, there is only the need to input the unconfined compressive strength and density of the concrete (34.5 MPa), while the corresponding constitutive parameters can be automatically generated by the embedded algorithm. The bottom soil is described by the MAT_DRUCKER_PRAGER (MAT#193), and the parameters are shown in Table 5.
Steel tubes and shaped steel frames are modeled by 4-noded Belytschko-Tsay shell elements, and 2-noded Hughes-Liu beam elements are adopted to model the reinforcements. The MAT_PIECEWISE_LINEAR_ PLASTICITY (MAT#24) model is adopted to describe the above three components: density, Young’s modulus, and Poisson’s ratio are 7850 kg/m3, 205 GPa, and 0.3, respectively. The effective plastic strain and the static yield stress of the material model are true strain and true stress obtained from existing material test results [20], which are shown in Table 5. The strain rate effects are accounted for using Cowper and Symonds model, and the dynamic yield stress is given by
where is the dynamic yield stress, is the static yield stress, is the strain rate, and C and p are the strain-rate parameters, which are 40 s−1 and 5 in the simulations, respectively.
The steel buckets are modeled by 2-mm-thick Belytschko-Tsay shell elements, and the MAT_PLASTIC_KINEMATIC (MAT#3) model is adopted to describe it. The sand inside the buckets is modeled by an 8-noded constant stress solid element and described by the MAT_SOIL_AND_FOAM (MAT#5) model. The related parameters are shown in Table 5, in which A0, A1, and A2 indicate the yield function constants. The steel drums and the cargo bed are connected through Hughes-Liu beam elements with a diameter of 10 mm, which is described by MAT_ELASTIC (MAT#1). The ropes used in the tests are made of nylon, and the corresponding density, Young’s modulus, and Poisson’s ratio of MAT#1 are 1150 kg/m3, 3800 MPa, and 0.28, respectively.
2.3. Contact Algorithm and Boundary Condition
The concrete road surface is simplified into a rigid surface, and RIGIDWALL_PLANAR_ORTHO_FINITE is used to define it, where the length of the road surface is set to 8000 mm. The translation and rotation of nodes on the outside surfaces of surrounding concrete and bottom soil below the road surface, which are treated as rigid bodies, are all constrained through the Boundary_SPC command. Gravity with a gravitational acceleration of 9.8 m/s2 is applied to the entire model through the keyword LOAD_BODY. Furthermore, CONTROL_DYNAMIC_RELAXATION is used to achieve a preloaded state of the model under gravity.
The interactions between sand and bucket, truck and foundation, truck and bollards, foundation and surrounding concrete, foundation and bottom soil are defined by the CONTACT_AUTOMATIC_SURFACE_TO_SURFACE option, where the static and dynamic friction coefficients are both 0.6. For the contact between the majority of parts within the truck body, the CONTACT_AUTOMATIC_SINGLE_SURFACE contact algorithm is used. The concrete and the steel reinforcements are modeled separately, and the CONSTRAINED_LAGRANGE_IN_SOLID command is used to describe the coupling effect between them.
2.4. Model Validation
Figure 9, Figure 10, Figure 11, Figure 12 and Figure 13 show the comparisons between the simulation and test results of the vehicle deformation, bollard deflection, and the time histories of displacement, velocity, and acceleration. The simulated vehicle deformation is in good agreement with the tests. Tests I~IV meet the corresponding K-rating criterion requirements, while test V fails to meet the requirements of test designation K12. As shown in Figure 10, the bollard deflection in the crash tests is measured at the nearest point to the vehicle on the circumference of the top of the central bollard. The X direction in the time histories, which is shown in Figure 9, indicates the direction of vehicle impact. The relevant sensors in the tests are located on the rear frame of the frame, and the specific position is not clearly indicated. Therefore, in the simulation, a small part is taken from the end of the secondary beam of the truck, which is marked blue in Figure 9, and the time histories of this part are used to compare with the test results.
It can be seen from the time histories that the simulation results of Test II–V agree well with the corresponding experimental results on the bollard deflection and velocity-time histories. The acceleration-time histories obtained by the tests are not smooth because of the complicated force and the drastic change in acceleration. Therefore, the acceleration-time histories of the simulation and the tests are difficult to coincide well, and the simulation results are only consistent with the tests in terms of magnitude and variation trend. The rising step of the displacement-time histories obtained by simulation agrees well with the experimental results, while the final displacement is smaller. This may be due to the difference in the connection strength between the main frame and the sub-frame in the FE model and the actual truck, resulting in a relatively small displacement between the main frame and the sub-frame in the simulation. As shown in Figure 12, the rear of the truck moves upward during the collision, resulting in more severe damage to the cab. Therefore, the displacement-time history of Test IV is quite different from the corresponding simulation result.
The vehicle penetration and bollard deflection of the tests and simulations are shown in Table 6. The deviation between the simulated vehicle penetration and the results of Tests I and II is large. However, compared with the deformation process of the truck shown in Figure 9 and Figure 10, it can be considered that the deviation is within a reasonable range. In summary, by qualitative and quantitative comparison with the test results, it can be considered that the numerical simulation accurately reproduces the collision process and structural response of the anti-ram bollard and the truck, and the accuracy of the established FE model is validated.
3. Parametric Study
Among Tests, I–V, only the test designation of Test V is designed as K12, but its final vehicle penetration is +2.82 m, which fails to meet the requirements of K12. Although the K12 rating requires a minimum impact velocity of 75 km/h, the impact velocity may reach 100 km/h or higher in actual situations. Based on the FE model verified in Section 2.4, the influence of various parameters of the anti-ram bollard on the deformation of the bollards and the displacement of the vehicle is studied under the impact velocity of 100 km/h in this section. Then, according to the influence degree of each parameter, the optimal design of the anti-ram bollard is proposed.
The FE model of the anti-ram bollard in Test IV is selected for parametric study, and the corresponding geometric parameters are shown in Figure 14. The main dimensions include foundation width (W1), steel tube thickness (T1), structural steel thickness (T2), bollard height (H1), foundation depth (H2), structural steel height (H3), bollard diameter (D1), and bollard spacing (D2). The other parameters studied are concrete strength (S1), steel tube strength (S2), and structural steel strength (S3). The values of each parameter are selected within a reasonable range according to the actual situation.
The bollard deflection and vehicle penetration (i.e., D and P) of the parametric study are shown in Table 7. As can be seen from the table, the FE model of the anti-ram bollard in Test IV is able to meet the K12 protection requirement at an impact velocity of 100 km/h. However, among the conditions in Table 7, only the vehicle penetration in two conditions is less than 0 m, and that in 10 conditions is greater than +1 m, which fails to meet the requirement of K12.
3.1. Material Strength
It can be seen from Table 7 that the increase in concrete strength (S1), steel tube strength (S2), and structural steel strength (S3) can effectively reduce the values of D and P and improve the crashworthiness of the anti-ram bollard. When the concrete strength is 30 MPa, the truck directly moves forward past the central bollard. When the concrete strength increases to 34.5 MPa, the vehicle penetration is substantially reduced, while the improvement of protection ability is limited by increasing the concrete strength continuously. Due to a large amount of steel used in the structure, directly increasing the strength of the steel tube or the structural steel will lead to a substantial increase in the construction cost. Therefore, the strength grade of the steel tube and the structural steel should be considered in combination with the actual situation.
3.2. Size of the Anti-Ram Bollard
The increase in steel tube thickness (T1), structural steel thickness (T2), structural steel height (H3), and bollard diameter (D1) can effectively reduce the values of bollard deflection and vehicle penetration. Among them, the structural steel height (H3) has the most significant effect on reducing vehicle penetration, and the added cost is less.
When the bollard height (H1) is small (e.g., 900 mm), the truck can easily cross over the post and continue to move forward. Increasing the height of the bollard can effectively withstand the impact of vehicles, but it should also take into account the normal use and the influence on the surrounding traffic. When the bollard spacing is less than half of the width of the vehicle, the left and right bollards of the central bollard will also dissipate part of the impact energy, which helps block the vehicle more effectively but may affect the daily traffic of pedestrians at the same time. When the bollard spacing is greater than half of the width of the vehicle and continues to increase, the influence of the bollards and the structural steel beside the central bollard on the deformation of the central bollard is reduced, resulting in an increase in vehicle penetration.
3.3. Size of the Foundation
The increase in the foundation width (W1) can reduce the vehicle penetration, but the extent is limited, and the construction cost is increased at the same time. Increasing the foundation depth (H2) can increase the restraint effect of the foundation on bollards, which can be deepened properly without affecting public facilities such as underground pipelines.
3.4. Optimization Design
In summary, the increase in material strength and size of the anti-ram bollard can reduce the vehicle penetration, but it will be limited by the construction cost and site. A more effective and economical way to improve the protection ability of the anti-ram bollard is to increase the foundation depth (H2) and the structural steel height (H3). For example, suppose the foundation depth and the structural steel height of the anti-ram bollard model corresponding to the Test IV are increased to 350 mm and 250 mm, respectively, and other parameters remain unchanged. In that case, the bollard deflection and vehicle penetration are 280 mm and −153 mm, respectively. As shown in Figure 15 and Figure 16, the front edge of the carriage does not exceed the bollard and the final bollard deflection is 280 mm, which meets the K12 requirement.
4. Conclusions
In this paper, an FE model of a vehicle-anti-ram bollard collision is established and verified by comparing the vehicle penetration, bollard deflection, vehicle damage, and time histories of displacement, velocity, and acceleration. On this basis, the influence of various parameters of the anti-ram bollard on its protection ability at an impact velocity of 100 km/h is analyzed. The main conclusions are as follows:
- (1)
- The improvement of steel tube stress and concrete compressive strength can enhance the protection capacity of the anti-ram bollard, including the damage tolerance and deformation ability. For example, when the strength of concrete reaches 40 MPa, the protection capacity of the anti-ram bollard increases to the maximum when the concrete compressive strength reaches 40 MPa from 30 MPa.
- (2)
- Increasing the bollard height and diameter can effectively reduce vehicle penetration. Moreover, When the bollard spacing is less than half of the width of the vehicle, the left and right bollards beside the central bollard will also dissipate part of the impact energy, which is better for protection.
- (3)
- In order to effectively improve the protection capability of the anti-ram bollard, the foundation depth should be increased as well as the bollard height to restrain the deformation of the impacted bollard.
Author Contributions
Conceptualization, Y.Z. and R.L.; methodology, Y.Z.; software, R.L.; validation, R.L., K.H. and F.H. formal analysis, R.L.; investigation, Y.Z.; resources, F.H.; data curation, F.H.; writing—original draft preparation, R.L.; writing—review and editing, F.H.; visualization, R.L.; supervision, K.H.; project administration, Y.Z.; funding acquisition, Y.Z. All authors have read and agreed to the published version of the manuscript.
Funding
This research received no external funding.
Data Availability Statement
Data availability is allowed with reference.
Conflicts of Interest
The authors declare no conflict of interest.
References
- Kiakojouri, F.; De Biagi, V.; Chiaia, B.; Sheidaii, M.R. Strengthening and retrofitting techniques to mitigate progressive collapse: A critical review and future research agenda. Eng. Struct. 2022, 262, 114274. [Google Scholar] [CrossRef]
- Kiakojouri, F.; Sheidaii, M.R.; De Biagi, V.; Chiaia, B. Progressive collapse of structures: A discussion on annotated nomenclature. Structures 2021, 29, 1417–1423. [Google Scholar] [CrossRef]
- Russell, J.; Sagaseta, J.; Cormie, D.; Jones, A. Historical review of prescriptive design rules for robustness after the collapse of Ronan Point. Structures 2019, 20, 365–373. [Google Scholar] [CrossRef]
- Heng, K.; Li, R.W.; Li, Z.R.; Wu, H. Dynamic responses of highway bridge subjected to heavy truck impact. Eng. Struct. 2021, 232, 111828. [Google Scholar] [CrossRef]
- Heng, K.; Li, R.; Wu, H. Damage assessment of simply-supported double-pier bent bridge under heavy truck collision. J. Bridge Eng. 2022, 27, 04022021. [Google Scholar] [CrossRef]
- Do, T.V.; Pham, T.M.; Hao, H. Proposed design procedure for reinforced concrete bridge columns subjected to vehicle collisions. Structures 2019, 22, 213–229. [Google Scholar] [CrossRef]
- Steven, A.; Alice, A.; Dikshant, S. Performance-based design of bridge piers under vehicle collision. Eng. Struct. 2019, 191, 752–765. [Google Scholar]
- US Department of State. Test Method for Vehicle Crash Testing of Perimeter Barriers and Gates, SD-STD-02.01, Revision A; US Department of State: Washington, DC, USA, 2003.
- Rado, Z.; Tallon, R. Crash Testing of RSA/KC Anti-Ram Foundation Bollard Pad in Accordance with US Department of State Diplomatic Security SD-STD-02.01, Revision A; Test Report; Pennsylvania Transportation Institute: Pennsylvania, PA, USA, 2005. [Google Scholar]
- Ivory, M.A. Crash TEST Report for Perimeter Barriers and Gates Tested to SD-STD-02.01, Revision A; Test Report No. TR-P25039-02-NC; KARCO Engineering, LLC.: Adelanto, CA, USA, 2005. [Google Scholar]
- Ivory, M.A. Crash Test Report for Perimeter Barriers and Gates Tested to SD-STD-02.01, Revision A; Test Report No. TR-P25076-01-NC; KARCO Engineering, LLC.: Adelanto, CA, USA, 2005. [Google Scholar]
- Ivory, M.A. Crash Test Report for Perimeter Barriers and Gates Tested to SD-STD-02.01, Revision A; Test Report No. TR-P25039-01-NC; KARCO Engineering, LLC.: Adelanto, CA, USA, 2005. [Google Scholar]
- Ivory, M.A. Crash Test Report for Perimeter Barriers and Gates Tested to SD-STD-02.01, Revision A; Test Report No. TR-P26212-01-NC; KARCO Engineering, LLC.: Adelanto, CA, USA, 2006. [Google Scholar]
- Chen, L.; Xiao, Y.; Xiao, G.; Liu, C.; Agrawal, A.K. Test and numerical simulation of truck collision with anti-ram bollards. Int. J. Impact Eng. 2015, 75, 30–39. [Google Scholar] [CrossRef]
- Cao, R.; Agrawal, A.K.; El-Tawil, S.; Wong, W. Numerical Studies on Concrete Barriers Subject to MASH Truck Impact. J. Bridge Eng. 2020, 25, 04020035. [Google Scholar] [CrossRef]
- Cao, R.; Agrawal, A.K.; El-Tawil, S.; Wong, W. Performance-Based Design Framework for Concrete Barriers Subjected to Truck Collision. J. Bridge Eng. 2021, 26, 04021047. [Google Scholar] [CrossRef]
- Cao, R.; El-Tawil, S.; Agrawal, A.K.; Wong, W. Performance and Capacity Assessment of Concrete Barriers Subject to Lateral Loading. J. Bridge Eng. 2021, 26, 04021090. [Google Scholar] [CrossRef]
- Mustafa, Y.A.; Murat, E.; Halit, O. Finite element simulation and failure analysis of fixed bollard system according to the PAS 68: 2013 standard. Eng. Fail. Anal. 2022, 135, 106151. [Google Scholar]
- Crawford, J.E. Development of shallow footing anti-ram bollard system through modeling and testing. In Proceedings of the 1st International Conference on Analysis and Design of Structures against Explosive and Impact Loads, Tianjin, China, 15–17 September 2006. [Google Scholar]
- Bangalore, K.P. Protective Bollard Design for High Speed Impact Energy Absorption. Ph.D. Thesis, Bangalore University, Bengaluru, India, 2006. [Google Scholar]
- Dawson, H.; Tennant, D. Inelastic dynamic finite-element design of bollard systems to impact loading. In Proceedings of the Structures Congress 2008: Crossing Borders, Vancouver, BC, Canada, 24–26 April 2008; pp. 1–10. [Google Scholar]
- Noveral, C.J. Investigation of a Hollow Structural Section Connection and Transfer Member for Load Sharing in Anti-Ram Vehicle Barriers. Master’s Thesis, Penn State University, Pennsylvania, PA, USA, 2013. [Google Scholar]
- Hu, B.; Li, G.Q.; Sun, J.Y. Numerical investigation of K4-rating shallow footing fixed anti-ram bollard system subjected to vehicle impact. Int. J. Impact Eng. 2014, 63, 72–87. [Google Scholar] [CrossRef]
- Hu, B.; Li, G.Q. Maximum impact force of truck frontal crashing into anti-ram bollard systems. J. Struct. Eng. 2016, 142, 04016125. [Google Scholar] [CrossRef]
- Hu, B.; Li, G.Q. Modified calculation method for maximum impact force between truck and anti-ram bollard based on Campbell’s model. Eng. Mech. 2017, 34, 79–88. (In Chinese) [Google Scholar]
- Campbell, K.L. Energy basis for collision severity. SAE Trans. 1974, 83, 2114–2126. [Google Scholar]
- National Crash Analysis Center (NCAC). Available online: http://www.ncac.gwu.edu/vml/models.html (accessed on 20 May 2011).
- Mohan, P.; Marzougui, D.; Kan, C.D. Validation of a single unit truck model for roadside hardware impact. Int. J. Veh. Syst. Model. Test. 2006, 2, 1–15. [Google Scholar] [CrossRef]
- Miele, C.R.; Plaxico, C.A.; Kennedy, J.C.; Simunovic, S.; Zis, N. Heavy Vehicle Infrastructure Asset Interaction and Collision; National Transportation Research Center: Knoxville, TN, USA, 2005.
- Mak, K.K.; Menges, W. Testing of State Roadside Safety Systems, Volume VIII: Appendix G–Crash Test and Evaluation of the Single Sloped Bride Rail; Texas Transportation Institute, Texas A&M University, College Station: Canyon, TX, USA, 1996. [Google Scholar]
Figure 1.
Four types of perimeter protection: (a) Anti-ram bollard; (b) Road barrier; (c) Tire breakers; (d) Car stones.
Figure 1.
Four types of perimeter protection: (a) Anti-ram bollard; (b) Road barrier; (c) Tire breakers; (d) Car stones.

Figure 2.
Vehicle penetration.

Figure 3.
Post-test side views: (a) Test I; (b) Test II; (c) Test III; (d) Test IV; (e) Test V [9,10,11,12].

Figure 4.
Full-scale truck crash test: (a) before and (b) after the collision [14]. (Reprinted with permission from Ref. [14]. 2015, Elsevier.)

Figure 5.
FE model of Ford F800 (version 0.2, 2008) [27].
Figure 5.
FE model of Ford F800 (version 0.2, 2008) [27].

Figure 6.
Truck FE models: (a) Ford F800; (b) modified model corresponding to Test II.

Figure 7.
Vehicle dimension measurement.

Figure 8.
Test FABSs and corresponding FE models: (a) Test I; (b) Test II; (c) Test III; (d) Test IV; (e) Test V.
Figure 8.
Test FABSs and corresponding FE models: (a) Test I; (b) Test II; (c) Test III; (d) Test IV; (e) Test V.


Figure 9.
Comparison of the collision process between Test I and the simulation.

Figure 10.
Comparisons between Test II and the simulation: (a) collision process; (b) bollard deflection-time histories; (c) X displacement-time histories; (d) X velocity-time histories; (e) acceleration-time histories.
Figure 10.
Comparisons between Test II and the simulation: (a) collision process; (b) bollard deflection-time histories; (c) X displacement-time histories; (d) X velocity-time histories; (e) acceleration-time histories.


Figure 11.
Comparisons between Test III and the simulation: (a) collision process; (b) bollard deflection-time histories; (c) X displacement-time histories; (d) X velocity-time histories; (e) acceleration-time histories.
Figure 11.
Comparisons between Test III and the simulation: (a) collision process; (b) bollard deflection-time histories; (c) X displacement-time histories; (d) X velocity-time histories; (e) acceleration-time histories.


Figure 12.
Comparisons between Test IV and the simulation: (a) collision process; (b) bollard deflection-time histories; (c) X displacement-time histories; (d) X velocity-time histories; (e) acceleration-time histories.
Figure 12.
Comparisons between Test IV and the simulation: (a) collision process; (b) bollard deflection-time histories; (c) X displacement-time histories; (d) X velocity-time histories; (e) acceleration-time histories.


Figure 13.
Comparisons between Test V and the simulation: (a) collision process; (b) bollard deflection-time histories; (c) X displacement-time histories; (d) X velocity-time histories; (e) acceleration-time histories.
Figure 13.
Comparisons between Test V and the simulation: (a) collision process; (b) bollard deflection-time histories; (c) X displacement-time histories; (d) X velocity-time histories; (e) acceleration-time histories.


Figure 14.
Geometric parameters of anti-ram bollard.

Figure 15.
Simulated impact process: (a) 0.01 s; (b) 0.12 s; (c) 0.40 s; (d) 1.00 s.

Figure 16.
Bollard deflection-time history.


Table 1.
K-rating criterion specified in SD-STD-02.01 Revision A [8].
Table 1.
K-rating criterion specified in SD-STD-02.01 Revision A [8].
| Designation | K4 | K8 | K12 |
|---|---|---|---|
| Vehicle weight (kg) | 6800 ± 90 | 6800 ± 90 | 6800 ± 90 |
| Impact angle (°) | 90 ± 3 | 90 ± 3 | 90 ± 3 |
| Nominal impact velocity (km/h) | 50 | 65 | 80 |
| Allowable impact velocity range (km/h) | 45~60 | 60.1~75 | 75~∞ |
| Test I [6] | Test II [7] | Test III [8] | Test IV [9] | Test V [10] | ||
|---|---|---|---|---|---|---|
| Organization Department | Pennsylvania Transportation Institute | KARCO Engineering, LLC | KARCO Engineering, LLC | KARCO Engineering, LLC | KARCO Engineering, LLC | |
| Test Designation | K4 | K4 | K8 | K8 | K12 | |
| Truck | Vehicle type | Ford F700 | International S1900 | Chevrolet Diesel | Ford F700 | Ford F700 |
| Weight (kg) | 6849.0 | 6868.3 | 6731.3 | 6806.6 | 6861.0 | |
| Impact velocity (km/h) | 47.6 | 52.0 | 62.1 | 69.3 | 79.3 | |
| Bollard | Height (mm) | 1016 | 1016 | 1016 | 1016 | 762 |
| Diameter (mm) | 203 | 254 | 254 | 254 | 229 | |
| Spacing (mm) | 1164.0 1 | 1371.6 | 1371.6 | 1371.6 | 1473 | |
| Steel tube | Strength (MPa) | 345 | 345 | 345 | 345 | 345 |
| Thickness (mm) | 16 | 25.4 | 25.4 | 25.4 | N/A 2 | |
| Reinforcement | Diameter (mm) | 16 | 16 | 16 | 16 | 16 |
| Spacing (mm) | 320 | 300 | 300 | 250 | 250 | |
| Distance between bollard center and foundation front edge (mm) | 390 | 430 | 430 | 330 | 320 | |
| Foundation | Width (mm) | 1371.6 | 1800.0 | 1800.0 | 1800.0 | 1800.0 |
| Depth (mm) | 355.6 | 165 | 165 | 305 | 305 | |
| Length (mm) | 6706 | 6858 | 6858 | 6858 | 7366 | |
| Footing height (mm) | 250.0 | 127.0 | 127.0 | 203.2 | 101.6 | |
| Bollard deflection (mm) | 137 | 83 | 77 | 184 | - | |
| Vehicle penetration (m) | −2.76 | −1.60 | <0 | −1.40 | +2.82 | |
1 The data in bold in the table are parameters that are not explicitly given in the test reports and related literature, and their values are estimated by the author based on the pictures in the test reports; 2 Solid steel bollards are used in Test V.
Table 3.
Constitutive model parameters.
| Concrete | Steel Tube [20] | Merchant Steel [20] | Reinforcement [20] | |||||
|---|---|---|---|---|---|---|---|---|
| Strain Rate (1/s) | Dynamic Increase Factor | Effective Plastic Strain | Static Yield Stress (MPa) | Effective Plastic Strain | Static Yield Stress (MPa) | Effective Plastic Strain | Static Yield Stress (MPa) | |
| Concrete in Foundation and Steel Tube | Surrounding Concrete | |||||||
| −3.0 × 10⁴ | 10.8517 | 12.9247 | 0.000 | 345 | 0.000 | 235 | 0.000 | 400 |
| −3.0 × 10² | 10.8517 | 12.9247 | 0.020 | 430 | 0.022 | 254 | 0.025 | 452 |
| −1.0 × 10² | 7.5241 | 8.9615 | 0.040 | 464 | 0.048 | 268 | 0.049 | 498 |
| −3.0 × 101 | 5.0369 | 5.9991 | 0.060 | 484 | 0.078 | 284 | 0.072 | 525 |
| −1.0 × 101 | 3.4924 | 4.1596 | 0.080 | 498 | 0.150 | 304 | 0.095 | 545 |
| −3.0 | 2.3379 | 2.7845 | 0.100 | 510 | 0.224 | 323 | 0.140 | 572 |
| −1.0 | 1.621 | 1.9307 | 0.200 | 550 | 0.320 | 337 | 0.182 | 594 |
| −1.0 × 10⁻¹ | 1.4956 | 1.7302 | 0.300 | 570 | 0.374 | 346 | 0.750 | 747 |
| −1.0 × 10⁻² | 1.3799 | 1.5505 | 0.400 | 572 | ||||
| −1.0 × 10⁻³ | 1.2732 | 1.3895 | ||||||
| −1.0 × 10⁻⁴ | 1.1747 | 1.2452 | ||||||
| −1.0 × 10⁻⁵ | 1.0838 | 1.1159 | ||||||
| 0.0 | 1.0000 | 1.0000 | ||||||
| 3.0 × 10⁻⁵ | 1.0000 | 1.0000 | ||||||
| 1.0 × 10⁻⁴ | 1.0408 | 1.0534 | ||||||
| 1.0 × 10⁻³ | 1.1236 | 1.1636 | ||||||
| 1.0 × 10⁻² | 1.2129 | 1.2853 | ||||||
| 1.0 × 10⁻¹ | 1.3094 | 1.4197 | ||||||
| 1.0 | 1.4135 | 1.5682 | ||||||
| 3.0 | 1.4661 | 1.6444 | ||||||
| 1.0 × 101 | 1.5259 | 1.7322 | ||||||
| 3.0 × 101 | 1.5826 | 1.8164 | ||||||
| 1.0 × 10² | 2.3771 | 2.7281 | ||||||
| 3.0 × 10² | 3.4284 | 3.9347 | ||||||
| 3.0 × 10⁴ | 3.4284 | 3.9347 | ||||||
Table 4.
Dimensions of Tests I–V and FE models.
| Dimension | Test I | Test II | Test III | Test IV | Test V | FE Model |
|---|---|---|---|---|---|---|
| A | 800 | 780 | 825 | 795 | 720 | 822 |
| B | 495 | 500 | 500 | 535 | 445 | 500 |
| C | 838 | 800 | 745 | 897 | 854 | 800 |
| D | 1803 | 3503 | 2392 | 2450 | 2729 | - |
| (2481) | (2552) | (2141) | (2432) | (2478) | ||
| E | 2070 | 2927 | 2808 | 2010 | 2391 | - |
| (1392) | (3878) | (3059) | (2028) | (2642) | ||
| F | 1054 | 1878 | 2630 | 2464 | 1190 | - |
| (1054) | (1878) | (2630) | (2464) | (1190) | ||
| G | 781 | 650 | 815 | 840 | 1060 | 687 |
| H | 1702 | N/A | N/A | N/A | N/A | - |
| (1619) | (1527) | (1617) | (1507) | (1469) | ||
| I | 584 | 590 | 585 | 585 | 590 | 543 |
| J | 1029 | 1050 | 1005 | 1000 | 1010 | 1045 |
| K | 2337 | 2250 | 2460 | 2445 | 2425 | 2250 |
| L | 2007 | 2050 | 2065 | 2035 | 2000 | 2050 |
| N | 1816 | 1830 | 1890 | 1855 | 1885 | 1830 |
Table 5.
Material parameters of MAT#3, MAT#5, and MAT#193.
| Material | Constitutive Model | Parameter | Value |
|---|---|---|---|
| Sand | MAT_SOIL_AND_FOAM | Density (kg/m3) | 1800 |
| Shear modulus (MPa) | 63.85 | ||
| Bulk modulus (GPa) | 30 | ||
| A0 (Pa2) | 3.4 × 10⁹ | ||
| A1 (Pa) | 7.03 × 10⁴ | ||
| A2 | 0.3 | ||
| Steel bucket | MAT_PLASTIC_KINEMATIC | Density (kg/m3) | 7850 |
| Young’s modulus (GPa) | 200 | ||
| Poisson’s ratio | 0.3 | ||
| Yield stress (MPa) | 245 | ||
| Bottom soil | MAT_DRUCKER_PRAGER | Density (kg/m3) | 2047 |
| Elastic shear modulus (MPa) | 34.48 | ||
| Poisson’s ratio | 0.3 | ||
| Dilation angle (rad) | 0.581 | ||
| Cohesion value (MPa) | 0.069 |
Table 6.
Comparisons of vehicle penetration and bollard deflection.
| No. | Vehicle Penetration (m) | Bollard Deflection (mm) | ||||
|---|---|---|---|---|---|---|
| Test | Simulation | Deviation (%) | Test | Simulation | Deviation (%) | |
| Test I | −2.76 | −1.97 | 29.7 | 137 | 136 | 0.7 |
| Test II | −1.60 | −1.94 | 21.3 | 83 | 86 | 3.6 |
| Test III | - | −1.71 | - | 77 | 78 | 1.3 |
| Test IV | −1.40 | −1.35 | 3.6 | 184 | 188 | 2.2 |
| Test V | 2.82 | 2.56 | 9.2 | - | 454 | - |
Table 7.
Results of parametric study.
| Factor | D (mm) | P (mm) | Factor | D (mm) | P (mm) | ||
|---|---|---|---|---|---|---|---|
| T1 (mm) | 19 | 880 | >+3083 | W1 (mm) | 1500 | 605 | +854 |
| 22 | 650 | +814 | 1800 | 625 | +620 | ||
| 25.4 | 625 | +620 | 2100 | 617 | +543 | ||
| T2 (mm) | 10 | 981 | >+7333 | D1 (mm) | 200 | 890 | >+5030 |
| 13 | 625 | +620 | 254 | 625 | +620 | ||
| 16 | 355 | +328 | 300 | 581 | +512 | ||
| H1 (mm) | 900 | 699 | >+4083 | D2 (mm) | 1000 | 348 | +243 |
| 1016 | 625 | +620 | 1371.6 | 625 | +620 | ||
| 1100 | 691 | +554 | 1500 | 634 | +901 | ||
| H2 (mm) | 250 | 658 | +1002 | S1 (mm) | 30 | 710 | >+4117 |
| 305 | 625 | +620 | 34.5 | 625 | +620 | ||
| 350 | 594 | +377 | 40 | 612 | +559 | ||
| H3 (mm) | 150 | 1256 | >+1136 | S2 (mm) | 235 | 888 | >+3897 |
| 203 | 625 | +620 | 345 | 625 | +620 | ||
| 250 | 277 | −80 | S3 (mm) | 235 | 625 | +620 | |
| 345 | 279 | −215 | |||||
Publisher’s Note: MDPI stays neutral with regard to jurisdictional claims in published maps and institutional affiliations. |
© 2022 by the authors. Licensee MDPI, Basel, Switzerland. This article is an open access article distributed under the terms and conditions of the Creative Commons Attribution (CC BY) license (https://creativecommons.org/licenses/by/4.0/).
Share and Cite
MDPI and ACS Style
Zhang, Y.; Li, R.; Heng, K.; Hu, F. Dynamic Behaviors of Optimized K12 Anti-Ram Bollards. Symmetry 2022, 14, 1703. https://0-doi-org.brum.beds.ac.uk/10.3390/sym14081703
AMA Style
Zhang Y, Li R, Heng K, Hu F. Dynamic Behaviors of Optimized K12 Anti-Ram Bollards. Symmetry. 2022; 14(8):1703. https://0-doi-org.brum.beds.ac.uk/10.3390/sym14081703
Chicago/Turabian StyleZhang, Yi, Ruiwen Li, Kai Heng, and Feng Hu. 2022. "Dynamic Behaviors of Optimized K12 Anti-Ram Bollards" Symmetry 14, no. 8: 1703. https://0-doi-org.brum.beds.ac.uk/10.3390/sym14081703
Note that from the first issue of 2016, this journal uses article numbers instead of page numbers. See further details here.