
MSG-Point-GAN: Multi-Scale Gradient Point GAN for Point Cloud Generation

School of Automation, University of Science and Technology Beijing, 30 Xueyuan Road, Haidian District, Beijing 100083, China
*
Author to whom correspondence should be addressed.
†
These authors contributed to the work equllly and should be regarded as co-first authors.
Symmetry 2023, 15(3), 730; https://0-doi-org.brum.beds.ac.uk/10.3390/sym15030730
Submission received: 12 February 2023
/
Revised: 24 February 2023
/
Accepted: 2 March 2023
/
Published: 15 March 2023
(This article belongs to the Special Issue Advances in Computer Vision, Pattern Recognition, Machine Learning and Symmetry)
Abstract
:The generative adversarial network (GAN) has recently emerged as a promising generative model. Its application in the image field has been extensive, but there has been little research concerning point clouds.The combination of a GAN and a graph convolutional network has been the state-of-the-art method for generating point clouds. However, there is a significant gap between the generated point cloud and the point cloud used for training. In order to improve the quality of the generated point cloud, this study proposed multi-scale gradient point GAN (MSG-Point-GAN). The training of the GAN is a dynamic game process, and we expected the generation and discrimination capabilities to be symmetric, so that the network training would be more stable. Based on the concept of progressive growth, this method used the network structure of a multi-scale gradient GAN (MSG-GAN) to stabilize the training process. The discriminator of this method used part of the PointNet structure to resolve the problem of the disorder and rotation of the point cloud. The discriminator could effectively determine the authenticity of the generated point cloud. This study also analyzed the optimization process of the objective function of the MSG-Point-GAN. The experimental results showed that the training process of the MSG-Point-GAN was stable, and the point cloud quality was superior to other methods in subjective vision. From the perspective of performance metrics, the gap between the point cloud generated by the proposed method and the real point cloud was significantly smaller than that generated by other methods. Based on the practical analysis, the point cloud generated by the proposed method for training the point-cloud classification network was improved by about 0.2%, as compared to the original network. The proposed method provided a stable training framework for point cloud generation. It can effectively promote the development of point-cloud-generation technology.
1. Introduction
A generative adversarial network (GAN) [1] has been widely used in image generation, style conversion, super-resolution, and other fields [2,3]. The quality of samples generated by a GAN is significantly better than other methods. In essence, GAN optimizes the Jensen–-Shannon divergence (JSD). Therefore, the noise distribution is constantly close to the real sample distribution, and the generated samples are more realistic. In 2016, Wu et al. proposed a 3D GAN [4]. Since then, generating point clouds using GANs has attracted widespread attention [5,6]. The excellent results related to 3D generation by other means have already been published [7,8,9], and 3D generation technology has become a hotspot in the research, at present. Furthermore, 3D generation technology is of great significance. It is well known that generated point clouds can be used for 3D modeling, which has a wide range of applications in film production, video games, industrial design, and other fields. Another application is data augmentation for point-cloud classification. The generated point cloud retains the characteristics of the origin point cloud. By adding the generated point cloud to the training dataset, the classification network can learn more features of the point cloud, so the point-cloud classification accuracy can be improved.
A GAN is a neural network that takes random noise as input and outputs samples with a similar distribution to those from a training set. A GAN usually consists of a generator and a discriminator. The function of the generator is to convert input noise into samples through a series of up-sampling and convolutional operations. The function of the discriminator is to determine whether the input sample is real or generated. The generator and discriminator of the GAN are then trained alternately and iteratively. When training the discriminator, the discriminator determines that the expected results of the sample generated by the generator is fake and the expected results of the real sample is real. Then the generator is trained, and the discriminator determines that the samples generated by the generator are expected to be true.It is clear that this is an adversarial process, in which the quality of the generated samples is gradually improved. The generative and discriminative capabilities of a GAN tend to be symmetric, which stabilizes the training. The high-quality samples generated by the trained GAN are nearly identical to the genuine objects.
There are two main problems with GANs: One is model collapse, and the other is training instability. Model collapse refers to a large number of repetitions of samples being generated by the generator. This problem has been well resolved and is not be discussed in this study [10]. Training instability means that the loss value of the network fluctuates severely. The reason for training instability is that the training process of a GAN is a process of game learning between generator and discriminator. The ultimate goal of game learning is to achieve a dynamic balance. It is well known that the generator and discriminator networks of a DCGAN [11] are symmetric in their structure and, therefore, so are their generation and discrimination capabilities. The training process is stable, and the quality of generated samples is higher than that of a GAN. The network structure of the MSG-GAN also appears symmetric. There have been other methods designed with the expectation that the network would be symmetric, so that the generation and discrimination capabilities were symmetric, and they had good results. More methods have also achieved good results by designing special network structures where the generator and discriminator structures appeared asymmetric, but the generation and discrimination capabilities were actually symmetric. The direct manifestation of the symmetry between generative and discriminative abilities was that the training process was stable. In order to optimize this process, many researchers have focused on this issue.The Wasserstein GAN (WGAN) [12] made great contributions to solving this problem. In order to improve the stability of the training process, a progressive growing of a GAN (ProGAN) [13] was proposed. However, the network structure of ProGAN was complex, and it had too many hyper-parameters. Based on the concept of progressive growth, a multi-scale gradient GAN (MSG-GAN) [14] was proposed. The training process of the MSG-GAN was more stable, and this method generated high-resolution samples. This study also proposed an MSG-Point-GAN based on the concept of progressive growth.
A point cloud is a dataset of points in a certain coordinate system. It contains a wealth of information, including 3D coordinates, color, classification value, intensity value, time, and so on. An important step for a GAN to learn point cloud features is to accurately describe the features of point clouds and classify them. The point cloud has the following characteristics, which makes it difficult to process. The purpose of point cloud feature extraction is that the feature vector calculated under the following conditions is unchanged. In geometry, the order of points does not affect the shape representation in space. This is the disordered characteristic of point clouds. The point cloud rotates, and the coordinates change. This is the rotational characteristic of the point cloud. Therefore, the research progress of convolutional neural networks for point cloud generation has been slow. In order to solve these problems, Qi et al. proposed PointNet [15]. This method used a transformation matrix to process point clouds. The point cloud rotated, and the extracted features remain unchanged. This method solved the disorder problem of point clouds through up-sampling and max-pooling operations. PointNet could complete point-cloud classification tasks. The discriminator of the GAN was essentially a classifier. A generative PointNet used PointNet as a discriminator [16]. PointNet is not the state-of-the-art method of point-cloud classification. However, its principle is simple, easy to implement, and its classification ability is better. Therefore, this study used PointNet as the discriminator. The proposed method only used part of the structure of PointNet, however.
In summary, this study adopted a progressive growth concept and network structure of an MSG-GAN. At the same time, PointNet was used as the discriminator of the GAN. Combining the advantages of the two methods, the MSG-Point-GAN was proposed. The concept of progressive growth was used to stabilize the training process of the GAN. The PointNet-based discriminator solved the problem of the disorder and rotation of the point cloud, and the discriminator transmitted the gradient information to the generator. This study analyzed the optimization process of the objective function of the MSG-Point-GAN and conducted experiments to verify the effectiveness of the method. The contributions of this study were the following:
- This study proposes MSG-Point-GAN. The training process of the MSG-Point-GAN is stable and the generated point cloud is of good quality. At the same time, this study analyzes the optimization process of objective function of the MSG-GAN.
- The concept of progressive growth was first proposed [13] and applied to images, and then applied to point clouds in PcGAN [5]. MSG-GAN [14] based on the concept of progressive growth is also applied to images. The MSG-Point-GAN proposed in this study is applied to point clouds. Our experiments prove that the point cloud generated by the proposed method is better than other methods, the training process is stable, and the hyper-parameters are robust. This can prove the effectiveness of the multi-scale gradient method based on the concept of progressive growth.
- This study analyzed the complexity of the proposed network, and the result was that the amount of data of the network was huge. The proposed method used a large number of fully connected networks to improve the fitting ability of the algorithm. However, the proposed method could still be improved. If there were a better generator and discriminator, it could be used to replace the generator and discriminator of the proposed method. Despite this, our method provided a stable training framework for point cloud generation.
2. Related Work
2.1. Generative Adversarial Networks
In October 2014, Goodfellow et al. proposed a GAN. A GAN is a network framework for estimating generative models through an adversarial process. It is one of the most promising methods of unsupervised learning for complex distributions in recent years. A GAN usually consists of a generator and a discriminator. Deep convolutional generative adversarial networks (DCGAN) [11] combine a GAN and a convolutional network. This method has effectively improved the quality o generated samples.
A GAN uses the JSD to measure the distance between the real sample and the generated sample. A WGAN uses the Wasserstein distance (also known as the Earth-mover distance) instead of JSD to measure the distance between real and generated samples. This method mainly optimizes the loss function of the GAN. The improved training of Wasserstein GANs (WGAN-GP) applied Lipschitz continuity to the WGAN. The Lipschitz constraint improved the generalization performance of the model by adding a gradient penalty term to the discriminant function.
Self-attention GANs (SAGAN) [17] were significantly better than previous methods in terms of image generation. A SAGAN applied the self-attention mechanism to a GAN and discovered multi-level dependencies. This method significantly improved the inception score (IS) and Fréchet inception distance (FID) of the generated image.
A ProGAN increased the depth of the network, layer by layer, to generate high-quality samples. At the beginning of the training, the network was small and could only learn low-resolution samples. As the number of iterations increases, the number of layers of the network increased, and the network could learn high-resolution samples.
The ProGAN needed to adjust the parameters at different stages of training. Its robustness was poor. The MSG-GAN did not require extra hyper-parameters and performed better on most datasets under the same conditions. The discriminator of the MSG-GAN calculated the gradient of the output of each layer of the generator. Then, the discriminator transmitted the gradient to the middle layer of the generator. Therefore, the discriminator could provide gradients for the generator on multiple scales. The MSG-GAN provided a stable training method for the generation of high-resolution samples.
2.2. Point Cloud Generation
The research on point cloud generation using GANs has included the following. Xie et al. proposed a generative PointNet [16]. This method used PointNet as the discriminator. The model did not require any hand-crafted distance metric for the point cloud generation because it synthesized point clouds by matching observed examples in terms of statistical properties, as defined by the energy function. The method in this study used part of the structure of PointNet as the discriminator. As compared to the generative PointNet, the advantage of the method proposed in this study was that the network structure of this method was better. The training process of the network in this study was more stable. Shu et al. proposed a tree-structured graph convolution network (tree-GAN) [18]. This method used a tree-structured graph convolution network (Tree-GCN) as the tree-GAN generator for point cloud generation. Valsesia et al. proposed the graph-convolutional GAN [6]. This method could learn the generation of the local features of the point cloud. However, the graph convolution was too complicated. Ramasinghe et al. proposed the spectral-domain generative adversarial network [19]. The spectral representation was highly structured. It assisted in synthesizing and reconstructing high-quality point clouds. Li et al. proposed a point cloud GAN (PC-GAN) [20], which combined the concepts of hierarchical Bayesian modeling and implicit generative models. PC-GAN generated point clouds with any number of points. Achlioptas et al. proposed a deep AutoEncoder network [21]. The reconstruction quality and generalization ability of this network were excellent. This method could generate high-quality point clouds, but it did not study the same conditions as the Gaussian mixture models and the adversarially trained models. The above methods could generate point clouds, and each had its own characteristics. However, there was no literature available to study the stability of a point-cloud-generation network.
The following research on point cloud generation contributed little in terms of GAN research. Mo et al. proposed StructureNet [22]. This method considered the relationship between the parts of the point cloud and could generate new, diverse, and true 3D shapes. Gadelha et al. proposed multi-resolution tree-structured networks [23]. This method was used to generate high-quality point clouds and was also used for classification. Hertz et al. proposed PointGMM [24], a neural network that learned to generate hGMMs, which were characteristic of the shape class, and also coincided with the input point cloud. This method was unable to generate clear details of the point cloud. Sun et al. proposed PointGrow [25]. This was a novel autoregressive model. This model operated recurrently, with each point sampled according to a conditional distribution, given its previously generated points. This allowed inter-point correlations to be exploited and the 3D-shape generative processes to be better interpreted. This model performed better in conditional and unconditional point cloud generation tasks. Yang et al. proposed pointFlow [26]. The invertibility of the normalizing flows enabled the computation of the likelihood during training. The above methods contributed little in terms of GAN research but could generate high-quality point clouds. These methods were of great significance for our research.
3. MSG-Point-GAN
In this part, we analyze the optimization process of the objective function of the MSG-Point-GAN. Then, we introduce the overall network structure of the proposed method and then each part of the network, in turn.
3.1. Theoretical Support
According to [1], the objective function of the original GAN is:
The optimization process of the objective function of the GAN was the process of calculating the optimal generator and discriminator. First, we fixed the generator G and calculated the optimal discriminator D. The optimal discriminator is:
where is the real data distribution, and is the generated data distribution. The optimal discriminator D was substituted into the objective function. The maximum value of the objective function is:
where the JSD represents the difference between the two distributions. Its minimum value is and its maximum value is 0.
Then, we calculated the optimal generator G to minimize . When was similar to , the generator G was optimal. The minimum value of objective function of the GAN is .
In this study, the MSG-Point-GAN was composed of multiple sub-generators and sub-discriminators. As shown in Figure 1, each sub-generator of the MSG-Point-GAN was related to the others. The optimization process of the objective function of the MSG-Point-GAN was the process of multiple discriminators jointly optimizing multiple generators. Each sub-discriminator calculated the gradient value of its corresponding sub-generator. The objective function of the MSG-Point-GAN could be approximated as:
First, we fixed the generator G and calculated the optimal discriminator D. The above formula could then be expressed as:
We divided the objective function into n sub-items. Each sub-item was the objective function of an ordinary GAN:
In this way, each sub-item could be optimized using the optimization method of the objective function of the ordinary GAN. The derivative of the sub-term was:
The derivative was equal to 0, and the optimal sub-discriminator could be obtained. The optimal sub-discriminator was:
We substituted the optimal discriminator into Formula (5) to obtain the maximum value of the objective function:
After simplification, the results were as follows:
Assuming that approximated , each generator was close to optimal. The distribution difference was:
In summary, the objective function of the method proposed in this study could be effectively optimized. Furthermore, multiple generators were related to each other, which could further optimize the results. The method in this study stabilized the training process and improved the quality of the generated point cloud.
3.2. Network Structure
In this part, we introduce the proposed MSG-Point-GAN. The generator was based on an MSG-GAN. It consisted of multiple interconnected sub-generators. During the up-sampling process, the generator generated point clouds with different densities. The discriminator was based on PointNet. It could solve the problem of the disorder and rotation for the feature extraction of point clouds. The discriminator calculated the intermediate gradient and transmitted it to the generator.
The proposed method combined the advantages of the two methods. However, we did not copy it completely. An MSG-GAN has only one discriminator. The features extracted from each generated sample are successively transferred in the discriminator. This approach can be successful in the image, but not in the point cloud. This study designed multiple discriminators to calculate the intermediate gradient. At the same time, this study did not completely adopt the PointNet network but simplified the network. It fulfilled the requirements of accurately determining the authenticity of the point cloud.
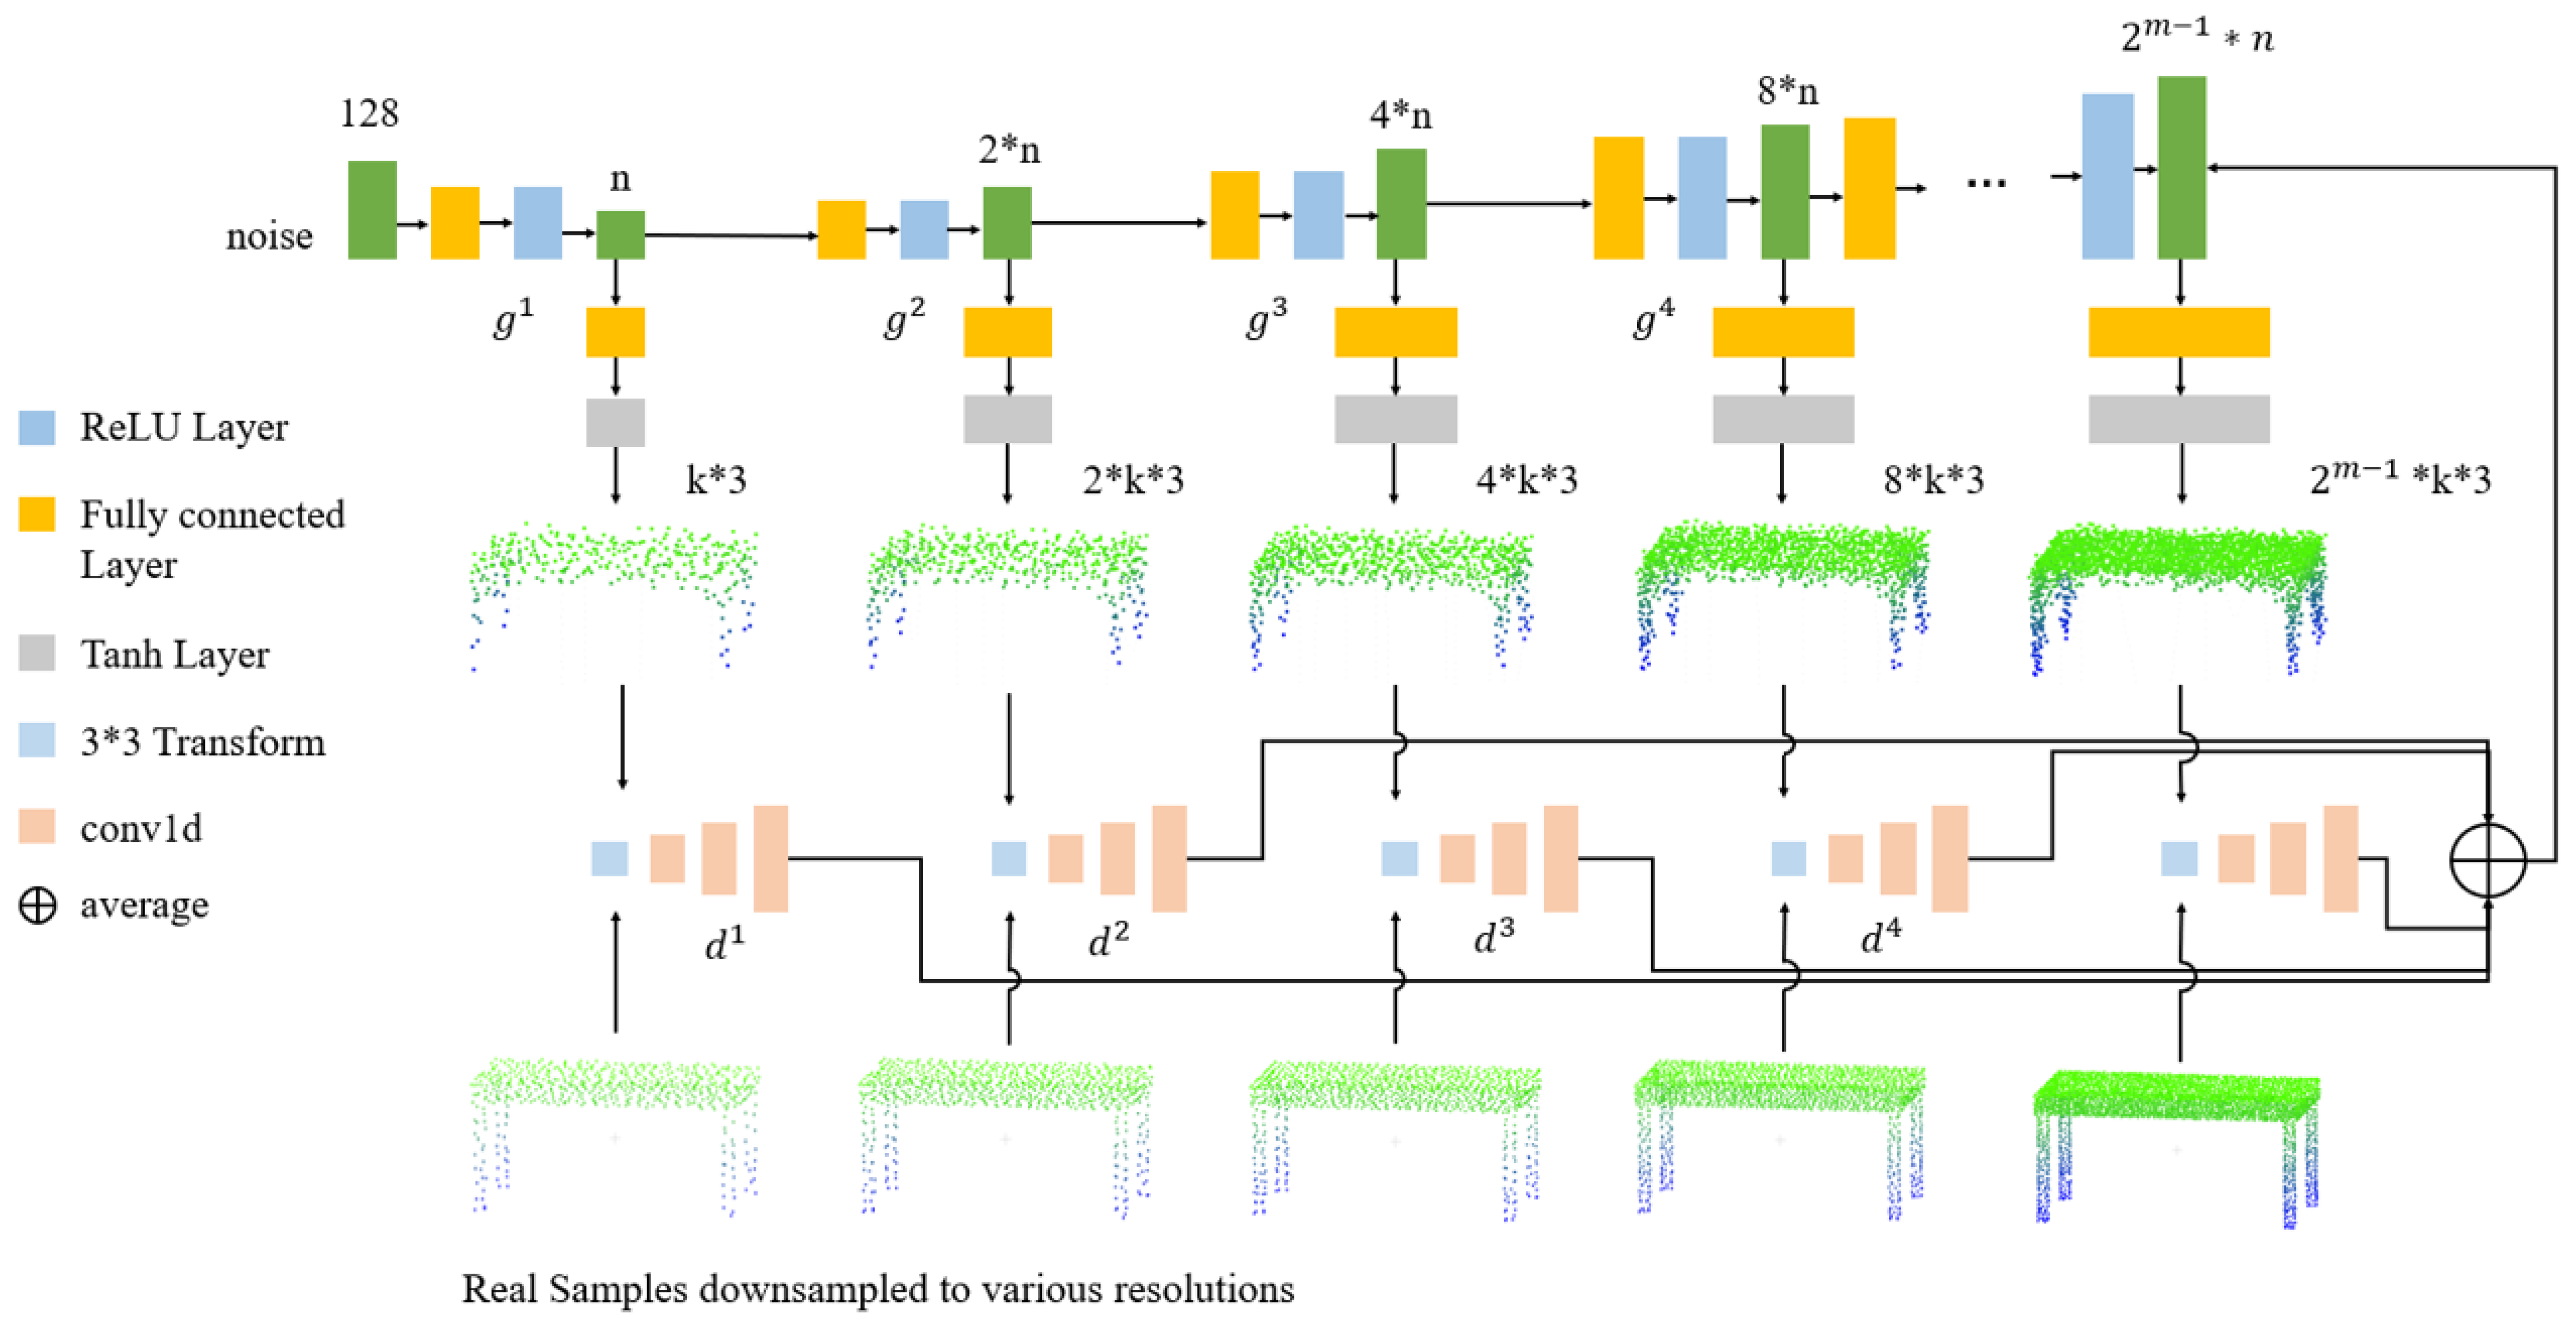
The network structure of the proposed method is shown in Figure 1. The generator was composed of multiple sub-generators, and each sub-generator was related to each other. The sub-generator included two non-linear fully connected layers, which could generate point clouds of different densities. The discriminator was composed of multiple sub-discriminators, and each sub-discriminator was independent of each other. The sub-discriminator consisted of a spatial transformer network and a 1D convolutional layer. Each sub-discriminator extracted the generated point cloud features and calculated the intermediate gradient.
3.3. Components of the Network Structure
3.3.1. The Generator
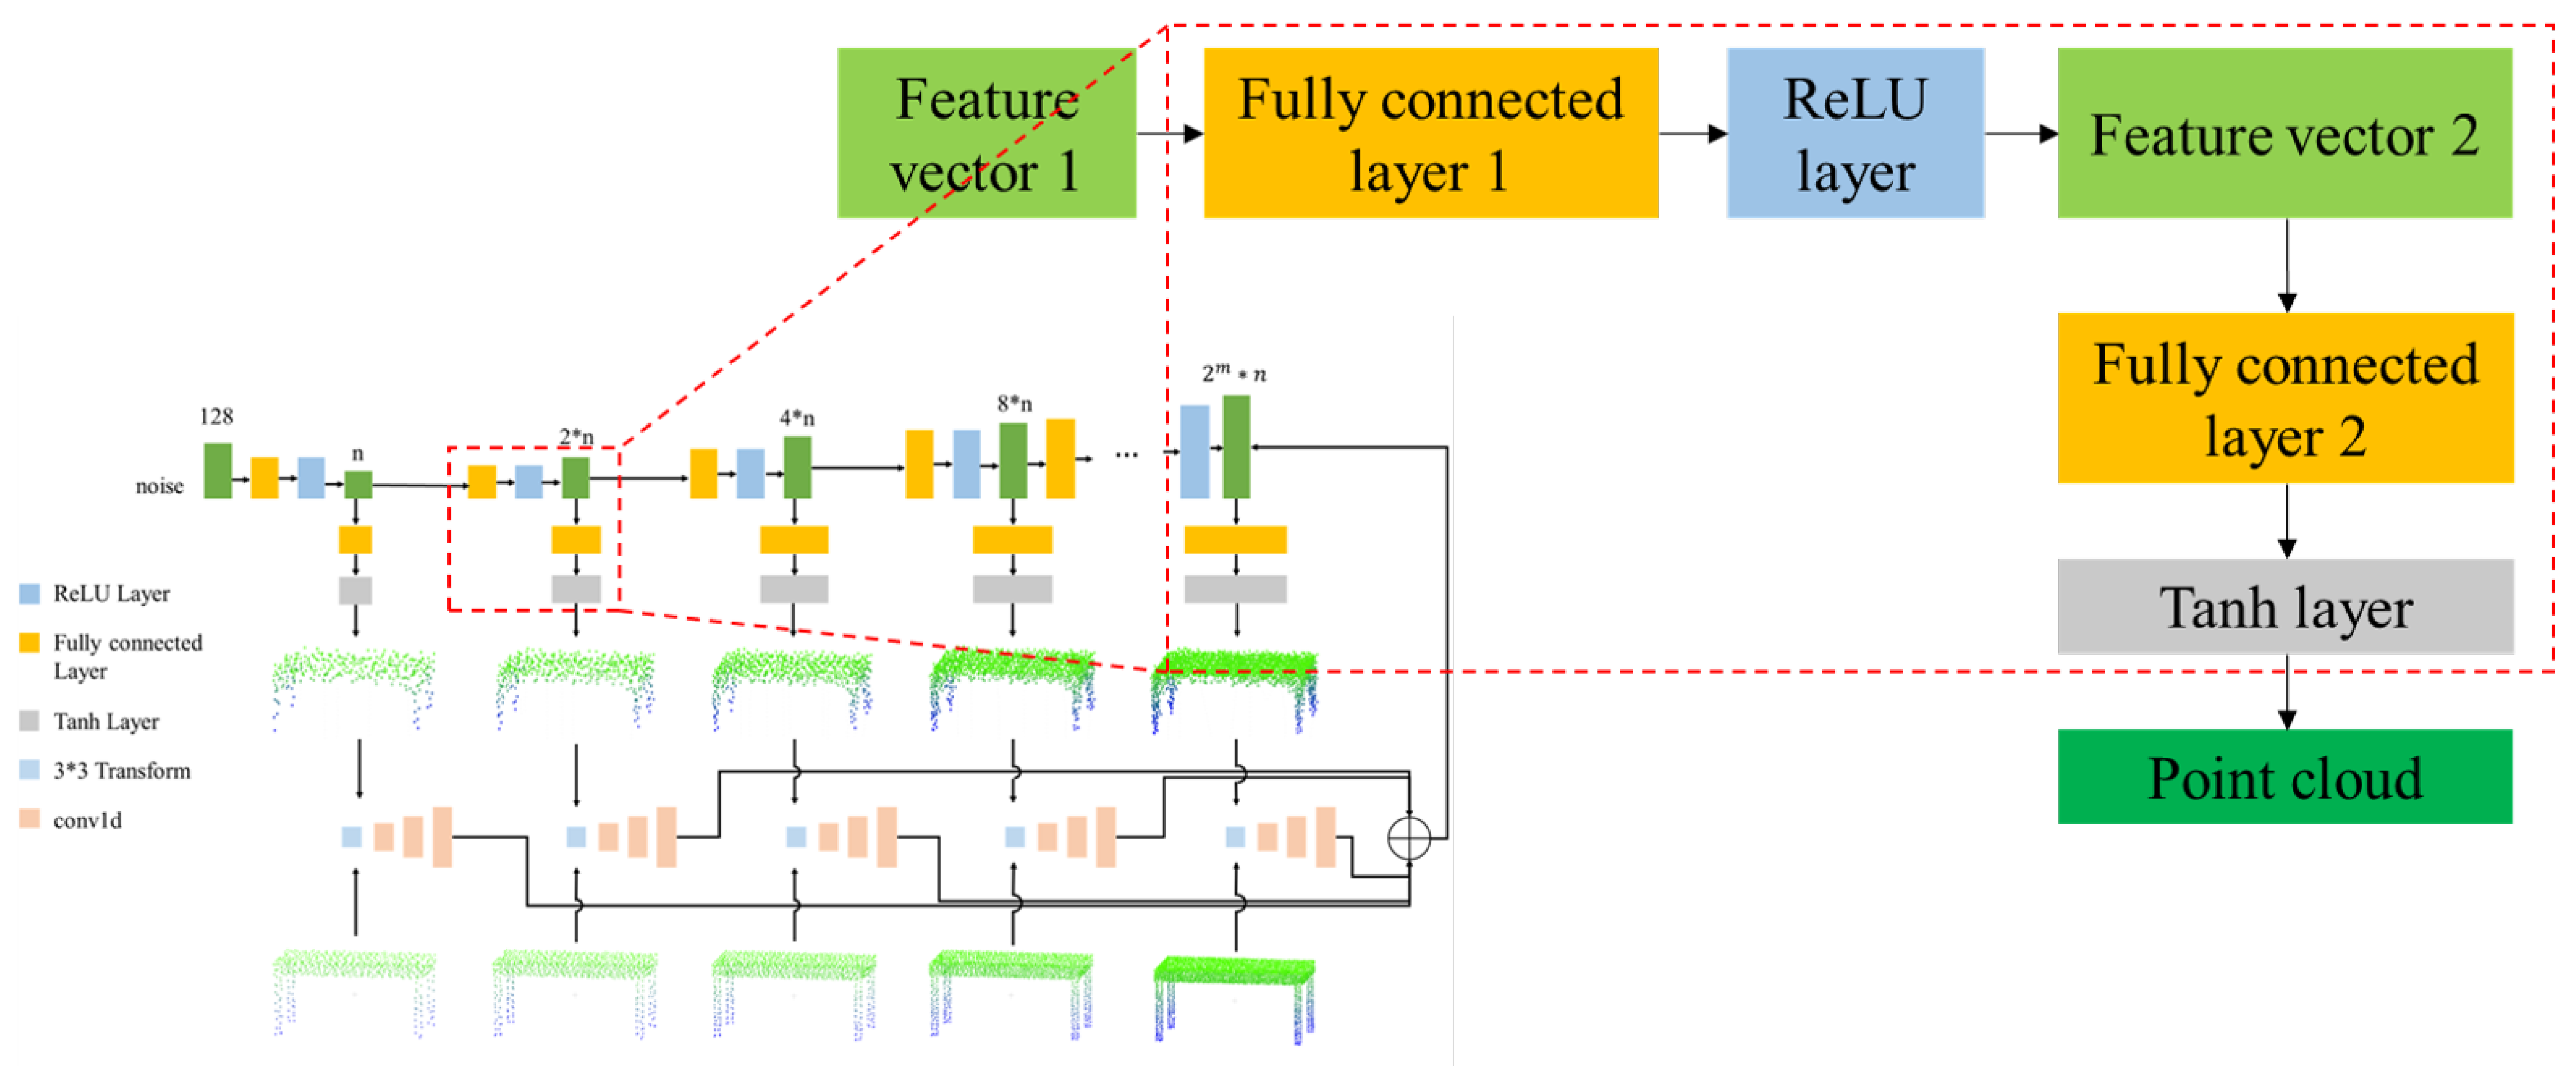
The structure of the sub-generator is shown in Figure 2. The generator was composed of multi-feature up-sampling layers and point-cloud-generation up-sampling layers. The feature up-sampling layer included a fully connected layer and a ReLU layer. The point-cloud-generation up-sampling layer included a fully connected layer and a Tanh layer. The design concept of the network was as follows:
- The MSG-GAN processed images using convolution layers with a convolution kernel size greater than 1. The convolution layer could process the neighborhood information of pixels. However, the structure of point clouds is different from that of images. A convolution layer could not be used, so the fully connected layer was used instead. The fully connected layer could exploit the overall characteristics of the point cloud. At the same time, the parameters of the fully connected layer were large, so the learning ability of the model was strong.
- Different scales of point clouds were obtained from the original point cloud down-sampling. It maintained the shape characteristics of the original point cloud. In the training process, different scales of point cloud generators learned the characteristics of different scales of point clouds. We used the fully connected layer to connect different scales of point cloud generators. The fully connected layer had an obvious advantage that it could learn the global information and the mutual location information shared with the global.
- The ReLU layer was used in the process of feature ascending because it eliminated gradient explosion and gradient disappearance and simplified the calculation process at the same time.
- The Tanh layer was used in the process of generating the point cloud because the coordinates of the point in the point cloud were normalized to (−1, 1), which was consistent with the value range of the Tanh layer. Furthermore, the Tanh layer provided non-linear factors.
The generator was defined as:
where ∘ is the symbol connecting two sub-generators and is the first sub-generator. It was composed of a feature up-sampling layer and a point-cloud-generation up-sampling layer. The first sub-generator was defined as:
where , is the Tanh operation, is the fully connected operation in the point cloud generation up-sampling layer, is the ReLU operation, and is the fully connected operation in the feature up-sampling layer.
The k-th sub-generator was defined as:
where . The definition of variables is consistent with the formula (13).
3.3.2. The Discriminator
The structure of the sub-discriminator is shown in Figure 3.
The discriminator consisted of two parts. One part was the spatial transformer network, which solved the problem of the rotation of the point cloud. The other part was the classification network, which solves the problem of the disorder of the point cloud. The classification network was composed of an up-sampling layer, a max-pooling layer, and a fully connected layer.
The same point cloud experienced a certain rigid change in space, and the coordinates changed. In the process of point-cloud classification, it was hoped that no matter how the point cloud coordinates changed, the network could correctly identify it. In this study, the problem of point cloud rotation was solved through a spatial transformer network. The core of the spatial transformer network was the localization net. The parameters in the localization net were the parts that needed to be trained in the spatial transformer network. The second was the spatial transformer. The local network was designed according to the requirements, and the corresponding spatial transformer coefficient was obtained. Then, we transformed the input of the previous layer and input the transformed result into the next layer.
Figure 4 shows the spatial transformer network. The variable U is the input point cloud, V is the transformed point cloud, and the network between U and V is the spatial transformer network. After localization net obtained the transform coefficient , we could transform the input U to obtain V. The formula was as follows:
where ∗ is the symbol of matrix multiplication and , C is the one-dimensional convolutional layer for up-sampling, M is the max-pooling layer, and F is the fully connected layer.
The point cloud was composed of a long series of points ( matrix, where n is the number of points). Geometrically, the order of the points did not affect its overall shape in space. For example, the same point cloud could be represented by two completely different matrices. In the process of point-cloud classification, it was hoped that the same results could be obtained, regardless of the order of the point clouds. This study used the following methods to solve the problem of the disorder of the point cloud.
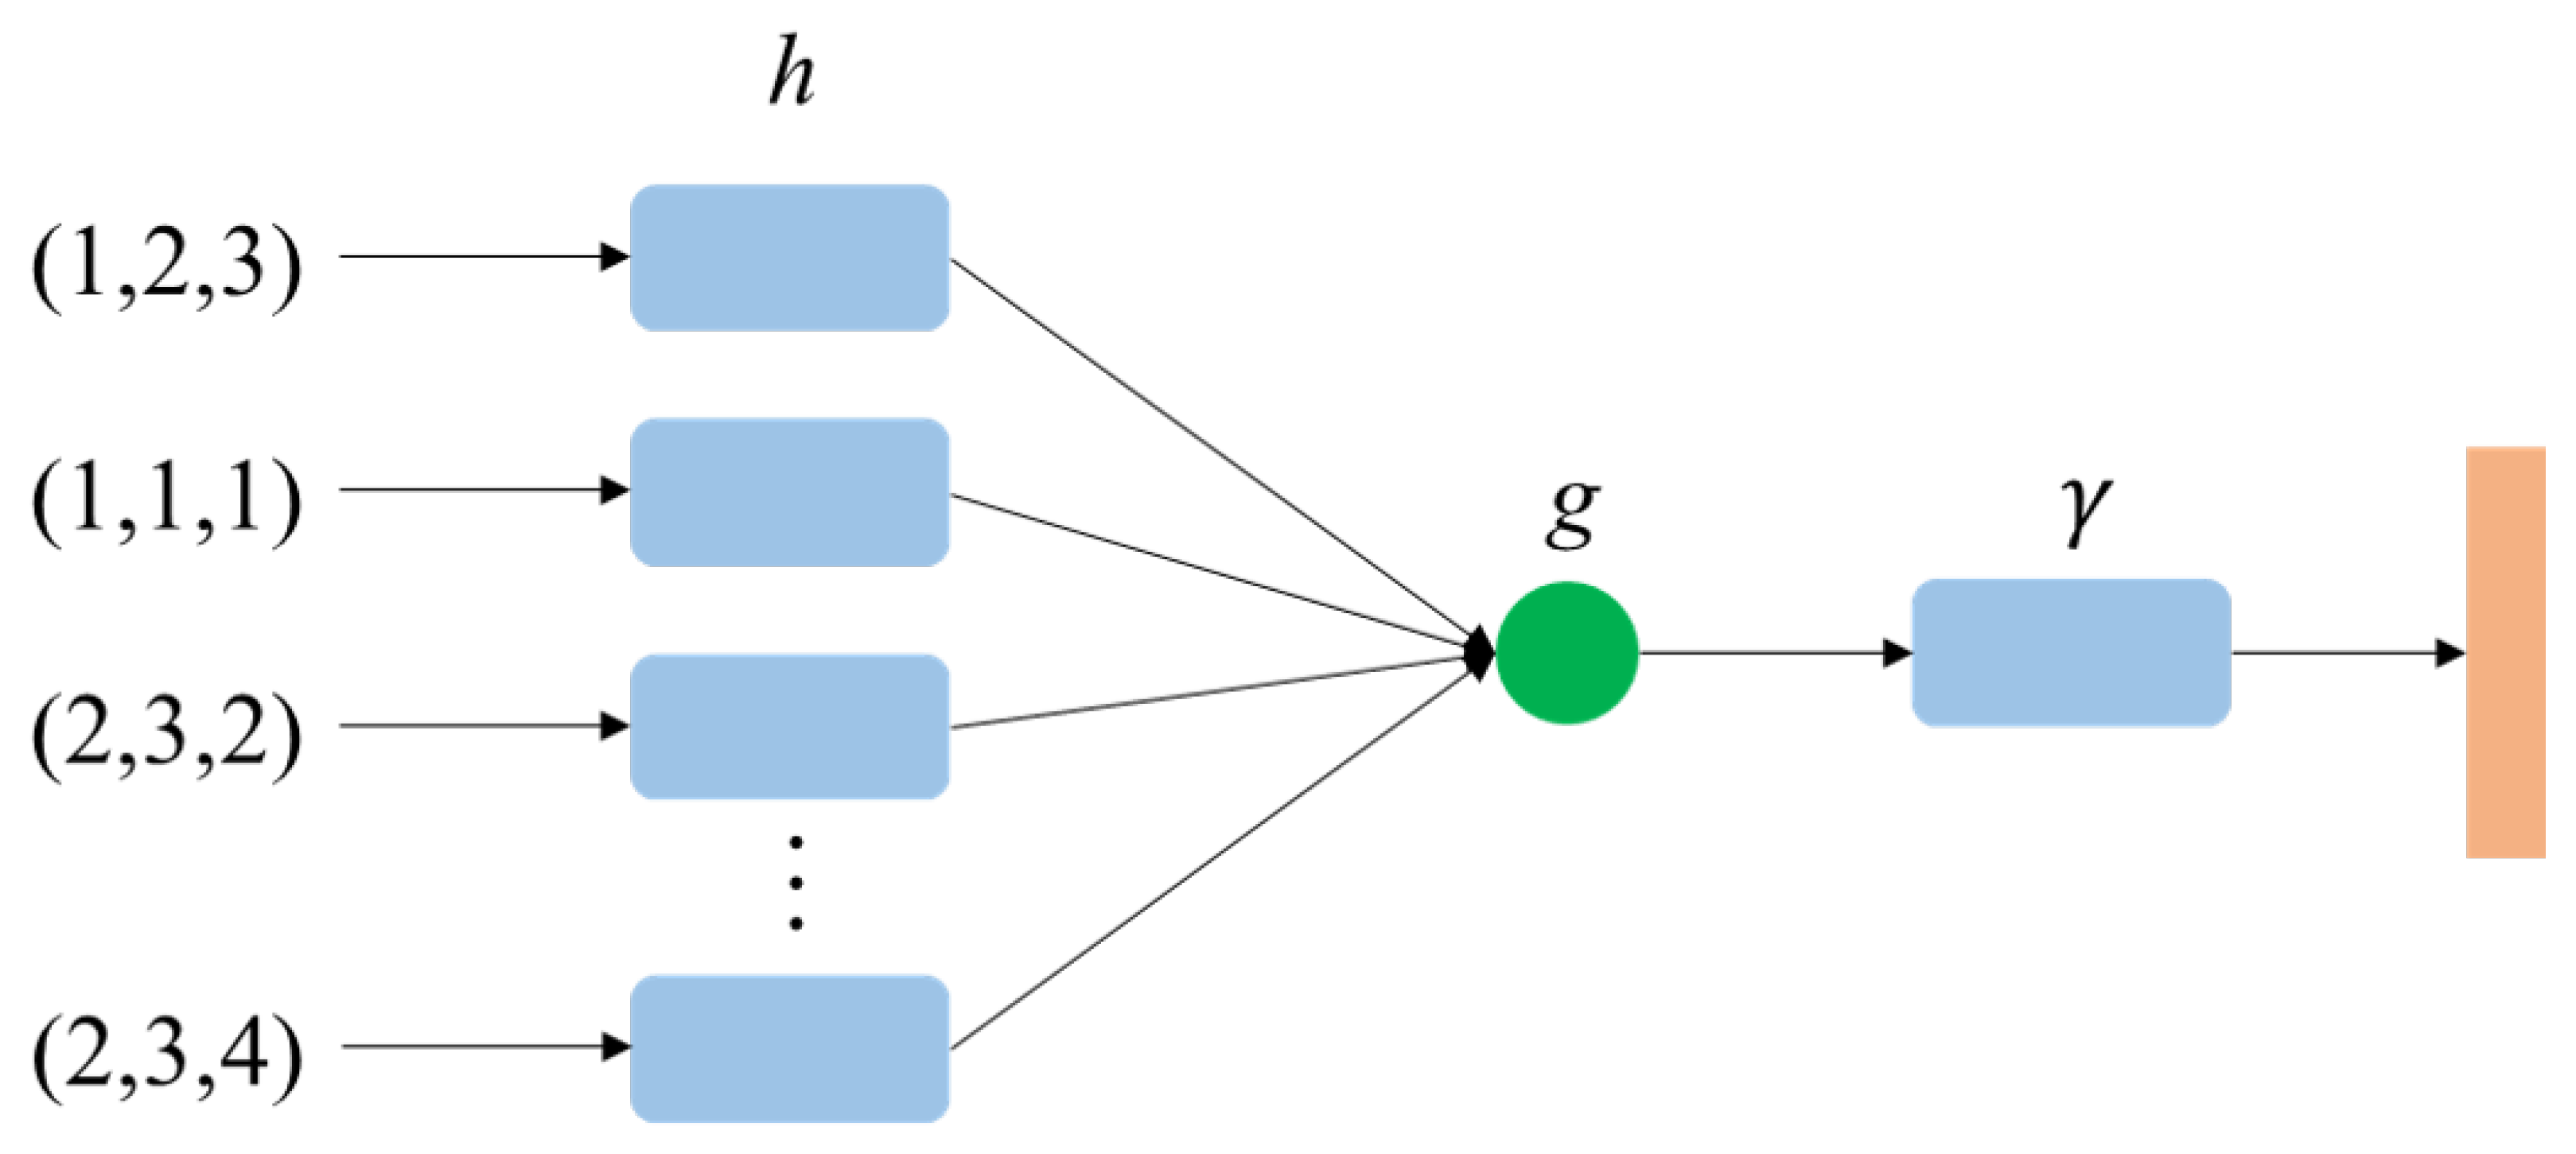
The network structure of point cloud feature extraction and classification is shown in Figure 5. The formula was as follows:
where represent the up-sampling layer, the max-pooling layer, and the fully connected layer, respectively. Inputs represent the coordinates of each point. The function of the up-sampling layer h was to distribute the point cloud features into higher dimensions. The function of the max-pooling layer g was to select the maximum value in each dimensional vector as the feature value of the point cloud. The fully connected layer was a classifier that classified the features of the point cloud. The discriminator determined whether the point cloud was real or generated and fed the results back to the generator.
3.4. Iterative Training
The discriminator and generator were optimized in turn. The discriminator was optimized first. The input point cloud was down-sampled to obtain real samples at different scales. These real samples were input into the discriminator to calculate the probability that they were real samples. The negative log likelihood loss function was used to calculate the loss value. Then, the samples at different scales were generated by the generator, and these samples were also input into the discriminator to obtain the loss value. The two loss values were jointly used for the optimization of the discriminator. Then, the generator was optimized. The generated samples were obtained by the generator, and these samples were input into the discriminator to obtain the loss value for optimization.
4. Experiments
This study used the Modelnet40 dataset for experiments. This dataset included 40 categories of objects, including airplanes, beds, bookshelves, tables, chairs, etc. In this experiment, we showed the point clouds generated by the proposed method, including chairs, tables, airplanes, and guitars, because these objects had distinct features. The points clouds in each class were split as 85% training data, 5% testing, and 10% validation. The computing platform had a 1080ti graphics card.
Except for the hyper-parameter robustness experiment, we set the generator for six levels with six sub-discriminators accordingly for the experiment. The maximum number of points in a single object point cloud generated was 2560. The hyper-parameter that had to be set was the learning rate of the generator and the discriminator, and the value of the learning rate was set to 0.001. In the hyper-parameter robustness experiment, we explained the adjustment of these parameters.
4.1. The Generated Point Cloud
We observed the point cloud generated by the proposed method and evaluated the quality of the point cloud subjectively. The most straightforward method to evaluate the effectiveness of the proposed method was to review the point clouds generated by the proposed method. It was easy to determine the quality of the generated point cloud according to whether the shape of the generated object was consistent with the shape of the cognitive object. Furthermore, we used chairs, tables, etc., as these objects have obvious features. It was easy to determine whether the positions of the table top, table legs, etc. generated by the proposed method had defects. Therefore, we chose these objects for display and then subjectively evaluate the point cloud quality. The proposed method was based on the concept of progressive growth. Therefore, it was necessary to show the point cloud generation process. We demonstrated chair point clouds with different densities at different training stages and the point clouds of four objects generated by the proposed method. Considering the limitations of the computing platform, this study did not generate high-density point clouds.
Figure 6 shows chair point clouds with different densities at different training stages. In the process of iteration, the quality of the generated point cloud was gradually improved. When the number of iterations reached 1000 epochs, the MSG-Point-GAN could generate high-quality point clouds.
Based on the leftmost column of the image, the optimization process of the point cloud with a density of 80, this was regarded as the process of an ordinary GAN generating point clouds. Because of the low density of the point cloud, it was a simple task that was easy to complete for any GAN. If a standard GAN was directly used to generate high-density point clouds, then it would be difficult for a standard GAN to complete the task. The MSG-Point-GAN gradually increased the density of the point cloud, which was equivalent to decomposing a difficult task into several simple tasks. Therefore, the MSG-Point-GAN could complete the difficult task. This was also consistent with our theoretical conclusions. The MSG-Point-GAN could effectively optimize the objective function, stabilize the training process, and generate high-quality point clouds.
Figure 7 shows the point cloud generated by the MSG-Point-GAN, including the table, the chair, the airplane, and the guitar. The details of the point cloud were slightly flawed, but the overall shape was similar to the real object. From a visual perspective, the result was convincing. The generated objects were diverse, indicating that there was no model collapse during the training process.
4.2. Training Stability and Network Robustness
The training process of a GAN is a dynamic game between the generator and the discriminator. The generator generates a point cloud, and the discriminator determines whether the point cloud is generated or real. The most ideal situation is when the training process reaches a balanced state, the objective function value steadily converges, and the generator generates high-quality samples. In this part, we showed the objective function value curve and the generated point clouds during the training process of the proposed method.
Figure 8 shows the curve of the objective function value during the training process. As shown in the figure, the curve oscillated severely at the beginning of the training. After that, the curve gradually stabilized. The stable training process indicated that the generative and discriminative capabilities of the proposed method were symmetric. Figure 9 shows the process from noise to object. Figure 9a corresponds to the initial stage in Figure 8, and the shape of the point cloud was irregular. Figure 9b,c corresponds to the oscillating and progressive convergence stage in Figure 8, and the shape gradually changed to a guitar. Figure 9d corresponds to the stable stage in Figure 8. The shape of the point cloud was a guitar.
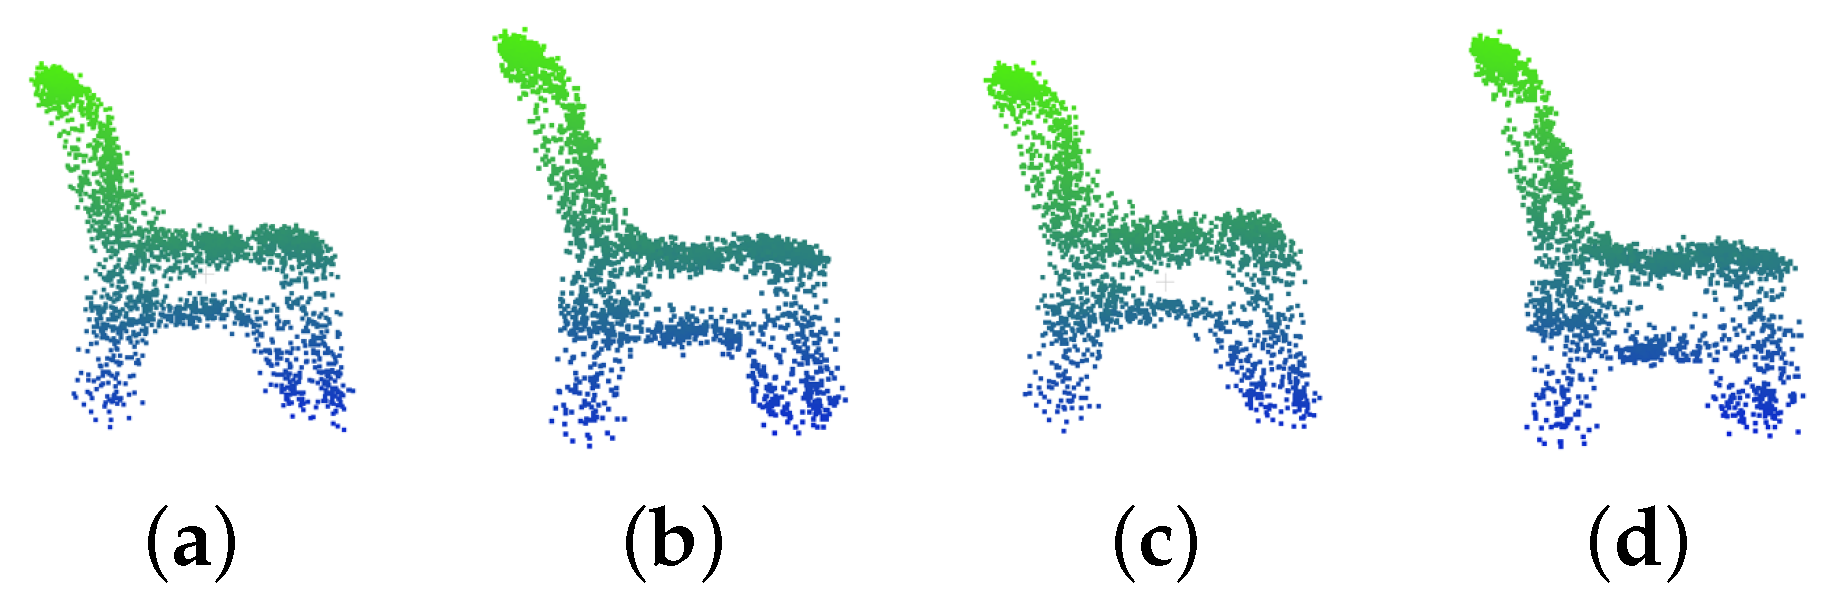
At the same time, we showed the point cloud generated when different noises were input. By adjusting the input and observing the changes of the output, the robustness of the network could be effectively tested. Using the weights obtained from the above experiments, we input the uniform distribution noise and the standard normal distribution noise to observe the generated point cloud. The point cloud generated by inputting different noises also had diversity. In this step, we selected four chair point clouds with similar shapes for display. The point cloud generated by the input uniform distribution noise is shown in Figure 10a,b. The point cloud generated by the input standard normal distribution noise is shown in Figure 10c,d. It was obvious from the picture that the shapes of the chairs did not differ significantly. This experiment proved that the network had good robustness, and the generated point cloud was less affected by the input noise.
4.3. Ablation Experiment
We tested the influence of two key factors in the network, which were the multi-scale gradient network structure and the spatial transformer network. We showed the training process curve and the generated point cloud after deleting these two factors.
In order to test the influence of the multi-scale gradient network based on the concept of the progressive growth of the stability of the training, we simplified the network and only retained the main structure of the network. The feature up-sampling layer, the last point cloud generation layer, and the last sub-discriminator were retained in the network, and the rest were deleted. In this way, a GAN without the multi-scale gradient network structure was formed, as shown in Figure 11a. Figure 12 and Figure 13 show the training process curves without multi-scale gradient network and spatial transformer network respectively. Figure 12 shows the objective function value curve without multi-scale gradient network. As shown in the figure, the curve was in an oscillating state, which was consistent with the training state of an ordinary GAN. Figure 14a,b shows the generated point clouds. Obviously, the quality of the generated point cloud was low. When the number of iterations reached about 1500, the curve tended to diverge. It was proved that when the value of the objective function was too large, the quality of the generated point cloud would be low. By comparing the training process curve and the generated point cloud in the experiment, we concluded that the progressive growth method had a positive effect on stabilizing the training process and improving the quality of the point cloud.
In order to test the impact of the spatial transformer network on the performance of the whole network, we deleted the spatial transformer network and observed the training process curve and the generated point cloud. The spatial transformer network adjusted to the attitude of the point cloud and did not change the dimension of the data, so the spatial transformer network could be deleted directly, as shown in Figure 11b. Figure 13 shows the training process without curve spatial transformer network. As shown in the figure, the curve was always in a state of oscillation. Figure 14c,d show the generated point cloud. The quality of the generated point cloud was obviously worse than that of the original network. We concluded that the spatial transformer network played an important role in the discriminator. The spatial transformer network could result in the discriminator determining the point cloud more accurately.
4.4. Comparison with Other Methods
This study selected the methods that had received widespread attention and performed well, for comparison. The most representative method was a progressive conditional GAN (PcGAN) [5], which could generate the color of the point cloud while generating the point cloud. Another method was the graph-convolutional GAN (GcGAN) [6], which used graph convolutional network to generate point clouds and achieved better results.
The point clouds generated by the three methods, PcGAN, GcGAN, and MSG-Point-GAN, are shown in Figure 15. The characteristics of the point cloud obtained by each method were different. For each method, we showed two tables and two chairs. Where (a) (e) (i) and (c) (g) (k) were chairs and tables with relatively consistent styles, respectively, and (b) (f) (J) and (d) (h) (l) were chairs and tables with relatively inconsistent styles, respectively. This comparison better reflected the characteristics of point cloud generated by each method. As shown in the figure, the defects of the point cloud generated by PcGAN were obvious, and the quality of the point cloud was obviously inferior to the other two methods. The shape of the point cloud generated by GcGAN and MSG-Point-GAN was similar. However, in the details, the shape of the point cloud generated by the MSG-Point-GAN was more standard.
Table 1 shows the comparison of objective evaluation indicators of the generated point cloud. The evaluation indicators were the Jensen-–Shannon divergence (JSD) and the minimum matching distance (MMD). MMD was used to obtain two different metrics, the Earth-mover’s distance (EMD) and the chamfer distance (CD) [6]. These indicators evaluated the gap between the generated point cloud and the real point cloud. The smaller the value, the higher the quality of the generated point cloud.
As shown in Table 1, the JSD and the MMD of the point cloud generated by PcGAN were significantly higher than the other two methods. This indicated that the quality of the point cloud generated by the PcGAN was worse. The evaluation index was consistent with the visual results. The JSD and the MMD of the point cloud generated by the GcGAN and the MSG-Point-GAN had a smaller difference, and the MSG-Point-GAN was lower. This indicated that the point cloud generated by the method in this study was of higher quality.
4.5. Analysis of the Proposed Method
4.5.1. Robustness of Hyper-Parameters
Robustness refers to the characteristic that the system could maintain good performance under the condition of disturbance or uncertainty. The hyper-parameters that needed to be adjusted were the learning rate of the generator and the discriminator, and the levels of the network. When we adjusted the learning rate, the levels of the network were set to 6, and when we adjusted the levels of the network, the learning rate was set to 0.001. We observed the objective function curve in the training process and recorded the number of iterations when the curve reached the steady state. We used table, chair, and guitar point clouds to conduct experiments, and the experimental results were averaged. The results are shown in the table.
As shown in Table 2, when the learning rate was adjusted within a certain range, it had little effect on the network convergence and the generated point cloud. The more levels of the MSG-Point-GAN, the slower the convergence. As the level of the MSG-Point-GAN increased, the density of the generated point cloud increased accordingly, and the number of iterations also increased.
The experimental results showed that the robustness of the hyper-parameters of the method in this study was good. When tested with different learning rates and different levels, the training could reach a steady state. Because of this feature, the method in this study was easy to implement and had good practicability.
4.5.2. Complexity Analysis
Since the network used in this study was a cascaded network, the analysis of the network complexity was critical. If the computing power of the computing platform was known, then the maximum number of stages of the network could be effectively determined through the complexity of the network, which could improve the utilization rate of the computing platform.
The generator network used in this study was mainly a non-linear fully connected layer, which could be regarded as a special convolutional layer. The size of the convolution kernel was the same as the size of the input matrix. The output feature map of each convolution kernel was a scalar point. The time and space complexity of convolutional networks were as follows:
where X is the size of the input matrix, and is the number of input and output channels, respectively. From the above formula, we obtained the complexity of the network by calculating the total number of parameters. Because the loss function did not affect the calculation of the complexity of the entire network, the complexity of the loss function was not considered here.
The generator in this study was a cascade structure, and the complexity of the generators at all levels needed to be calculated and then summed. The input dimension of the first-level generator was 128, the intermediate dimension was n, the output dimension was , and the number of parameters was . The variable k was the number of points of the generated point cloud. The input dimension of the level generator was 128, the intermediate dimension was , the output dimension was , and the number of parameters was . In summary, the total number of parameters of the generator was . The variable t was the level of the MSG-Point-GAN. The time complexity and the space complexity of the generator of the MSG-Point-GAN were both .
The discriminators in this study were independent, so the complexity of each discriminator needed to be calculated and then summed. The first half of the discriminator was the spatial transformer network. According to the structure of the network, the number of parameters was . The main component of the second half was a non-linear fully connected layer. The number of parameters was , where . In summary, the time complexity and the space complexity of the discriminator of the MSG-Point-GAN were both .
In summary, when the levels of the GAN increased, the complexity of the network also increased by multiples. Therefore, the levels of the network in this study could not be set too large, as otherwise, the calculation time would increase to a length the computing platform would not be able to support, given its high number of parameters.
From the analysis of complexity, the method in this study used a large number of non-linear fully connected layers, so the method in this study could still be improved. By improving the nonlinear fully connected layer, the space and time complexity was reduced.
4.5.3. Practical Analysis
The analysis of applications that generated point clouds was an important issue. The generated data had two main roles in the object classification task. The first was that the data generated were used to test the performance of the object classification algorithm. In this experiment, the performance of the classification algorithm was not tested, but the quality of the generated point cloud was evaluated by the performance of the test algorithm. Secondly, the generated data were used as training data for the training of the object classification algorithm.
The experimental procedure was as follows. PointNet++ was trained using the ModelNet40 dataset. The point cloud generated by the proposed method was used to test the classification accuracy. The generated point clouds were a table, a chair, an airplane and a guitar, each with 120 point clouds. Then we used the testing set of the ModelNet40 and 100 real point clouds from each of the above 4 categories to test the accuracy of the classification. The purpose was to compare with the classification model trained with the generated point cloud. A total of 120 point clouds in each of the 4 categories were added to the training data. The classification algorithm was trained under the same conditions as the hyper-parameters set in the first step. The same data tested the classification accuracy. The classification accuracy is shown in the table below.
As shown in Table 3, the classification accuracy of the generated data was good, and it could be proved that the characteristics of most of the point clouds generated by the proposed method conformed to the characteristics of the real point clouds and could be correctly classified. From the comparison of the classification accuracy of the generated point clouds before and after training, the classification accuracy of PointNet++ was improved by about 0.2%. PointNet++ achieved a decent performance on the ModelNet40 dataset. It was difficult to improve its performance through technical means. However, the point cloud generation technology is typically used for data augmentation, which could then improve the classification performance of PointNet++. The reason for this was easy to explain. Because we added more data for training, the classification network learned more features of the point cloud and thus performed better. Therefore, the point cloud generated by this method was practical.
5. Conclusions
This study proposed the MSG-Point-GAN. It used the progressive growth method to stabilize training, and its discriminator used PointNet to accurately determine the authenticity of the generated point cloud. This study analyzed the optimization process of the objective function of the MSG-Point-GAN. The experiments proved that the training of this method was stable, and the point cloud generated by the proposed method was better than the point cloud generated by the state-of-the-art methods. The multi-scale gradient method based on the concept of progressive growth was effective in the GAN. The ablation experiments showed that the proposed method needed both a multi-scale gradient network and a spatial transformation network; otherwise, the performance of the network was significantly degraded. In addition, different parameters were used to test the performance of the network, and the network could still converge quickly, indicating that the proposed method had good robustness. Finally, the point clouds generated by the proposed method could be used to train the classification network and improve its performance. This proved that the characteristics of the point clouds generated by the proposed method had the characteristics of real data. This further indicated that the point cloud generated by the proposed method was effective.
Author Contributions
Conceptualization, J.L. and B.W.; methodology, B.W.; software, J.G.; validation, B.W. and J.G.; formal analysis, J.L.; investigation, B.W.; resources, J.G.; data curation, J.G.; writing—original draft preparation, B.W.; writing—review and editing, J.L.; visualization, J.G.; supervision, J.L. All authors have read and agreed to the published version of the manuscript.
Funding
This research was funded by the 13th Five-Year Plan Funding of China, grant numbers 41419029102 and 41419020107, the Fundamental Research Program, the Funding 514010503-201.
Institutional Review Board Statement
Not applicable.
Informed Consent Statement
Not applicable.
Data Availability Statement
The ModelNet40 datasets were provided by Princeton University.
Conflicts of Interest
The authors declare no conflict of interest.
References
- Goodfellow, I. Generative adversarial nets. In Proceedings of the Neural Information Processing Systems Conference, Montreal, QC, Canada, 8–13 December 2014; pp. 2672–2680. [Google Scholar]
- Khan, S.U.U.; Al-Sabri, E.H.A.A.; Ismail, R.; Mohammed, M.M.S.; Hussain, S.; Mehmood, A. Prediction Model of a Generative Adversarial Network Using the Concept of Complex Picture Fuzzy Soft Information. Symmetry 2023, 15, 577. [Google Scholar] [CrossRef]
- Shao, C.; Li, X.; Li, F.; Zhou, Y. Large Mask Image Completion with Conditional GAN. Symmetry 2022, 14, 2148. [Google Scholar] [CrossRef]
- Wu, J.; Zhang, C.; Xue, T. Learning a Probabilistic Latent Space of Object Shapes via 3D Generative-Adversarial Modeling. arXiv 2017, arXiv:1610.07584. [Google Scholar] [CrossRef]
- Muzahid, A.; Wanggen, W.; Sohel, F. Progressive conditional GAN-based augmentation for 3D object recognition. Neurocomputing 2021, 460, 20–30. [Google Scholar] [CrossRef]
- Valsesia, D.; Fracastoro, G.; Magli, E. Learning Localized Representations of Point Clouds With Graph-Convolutional Generative Adversarial Networks. IEEE Trans. Multimed. 2021, 23, 402–414. [Google Scholar] [CrossRef]
- Chan, E.R.; Lin, C.Z.; Chan, M.A.; Nagano, K.; Pan, B.; De Mello, S.; Gallo, O.; Guibas, L.J.; Tremblay, J.; Khamis, S.; et al. Efficient Geometry-aware 3D Generative Adversarial Networks. arXiv 2022, arXiv:2112.07945v2. [Google Scholar] [CrossRef]
- Alex, N.; Heewoo, J.; Prafulla, D. Point-E: A System for Generating 3D Point Clouds from Complex Prompts. arXiv 2022, arXiv:2212.08751v1. [Google Scholar] [CrossRef]
- Ben, P.; Ajay, J.; Jonathan, T. DreamFusion: Text-to-3D using 2D Diffusion. arXiv 2022, arXiv:2209.14988. [Google Scholar] [CrossRef]
- Yu, S.; Zhang, K.; Xiao, C. HSGAN: Reducing mode collapse in GANs by the latent code distance of homogeneous samples. Comput. Vis. Image Underst. 2022, 214, 103314. [Google Scholar] [CrossRef]
- Radford, A.; Metz, L.; Chintala, S. Unsupervised Representation Learning with Deep Convolutional Generative Adversarial Networks. arXiv 2016, arXiv:1511.06434. [Google Scholar] [CrossRef]
- Arjovsky, M.; Chintala, S.; Bottou, L. Wasserstein GAN. arXiv 2017, arXiv:1701.07875. [Google Scholar] [CrossRef]
- Karras, T.; Aila, T.; Laine, S. Progressive growing of the GANs for improved quality, stability, and variation. arXiv 2018, arXiv:1710.10196. [Google Scholar] [CrossRef]
- Karnewar, A.; Wang, O. MSG-GAN: Multi-Scale Gradients for Generative Adversarial Networks. arXiv 2020, arXiv:1903.06048v3. [Google Scholar] [CrossRef]
- Qi, C.; Su, H.; Mo, K. PointNet: Deep Learning on Point Sets for 3D Classification and Segmentation. In Proceedings of the IEEE Conference on Computer Vision and Pattern Recognition, Honolulu, HI, USA, 21–26 July 2017; pp. 77–85. [Google Scholar]
- Xie, J.; Xu, Y.; Zheng, Z. Generative PointNet: Energy-Based Learning on Unordered Point Sets for 3D Generation, Reconstruction and Classification. arXiv 2021, arXiv:2004.01301. [Google Scholar] [CrossRef]
- Zhang, H.; Goodfellow, I.; Metaxas, D. Self attention generative adversarial networks. arXiv 2019, arXiv:1805.08318. [Google Scholar] [CrossRef]
- Shu, D.W.; Park, S.W.; Kwon, J. 3D Point Cloud Generative Adversarial Network Based on Tree Structured Graph Convolutions. arXiv 2019, arXiv:1905.06292. [Google Scholar] [CrossRef]
- Ramasinghe, S.; Khan, S.; Barnes, N. Spectral-GANs for High-Resolution 3D Point-cloud Generation. In Proceedings of the IEEE/RSJ International Conference on Intelligent Robots and Systems, Las Vegas, NV, USA, 24 October–24 January 2020; pp. 1–14. [Google Scholar]
- Li, C.L.; Zaheer, M.; Zhang, Y. Point Cloud GAN. arXiv 2018, arXiv:1810.05795. [Google Scholar] [CrossRef]
- Nash, C.; Williams, C. The shape variational autoencoder: A deep generative model of part-segmented 3D objects. Comput. Graph. Forum 2017, 36, 1–12. [Google Scholar] [CrossRef] [Green Version]
- Mo, K.; Guerrero, P.; Yi, L.; Su, H.; Wonka, P.; Mitra, N.; Guibas, L.J. StructureNet: Hierarchical graph networks for 3D shape generation. ACM Trans. Graph. 2019, 38, 1–19. [Google Scholar] [CrossRef] [Green Version]
- Gadelha, M.; Wang, R.; Maji, S. Multiresolution tree networks for 3d point cloud processing. In Proceedings of the European Conference on Computer Vision, Glasgow, UK, 8–14 September 2018; pp. 103–118. [Google Scholar]
- Hertz, A.; Hanocka, R.; Giryes, R. Pointgmm: A neural gmm network for point clouds. In Proceedings of the IEEE/CVF Conference on Computer Vision and Pattern Recognition, Seattle, WA, USA, 13–19 June 2020; pp. 12054–12063. [Google Scholar]
- Sun, Y.; Wang, Y.; Liu, Z. Pointgrow: Autoregressively learned point cloud generation with self-attention. In Proceedings of the IEEE/CVF Winter Conference on Applications of Computer Vision, Snowmass, CO, USA, 1–5 March 2020; pp. 61–70. [Google Scholar]
- Yang, G.; Huang, X.; Hao, Z. Pointflow: 3d point cloud generation with continuous normalizing flows. In Proceedings of the IEEE/CVF International Conference on Computer Vision, Seoul, Republic of Korea, 27 October 2019–2 November 2019; pp. 4541–4550. [Google Scholar]
Figure 1.
Network structure of the MSG-Point-GAN. The structure of the MSG-Point-GAN generator was a multi-level structure. The input of the first sub-generator was 128-dimensional noise. The input of the latter sub-generator was the middle feature vector of the previous sub-generator. In addition, were the dimensions of the middle feature vector. Each sub-generator g generated point clouds with different densities. Then, were the number of points of the generated point cloud. The sub-discriminator d was independent. The average of the output of each sub-discriminator was passed to the generator, and the generator was then optimized.

Figure 2.
Sub-generator. The sub-generator consisted of two parts. The functions of the two parts were calculating feature vectors and generating point clouds.
Figure 2.
Sub-generator. The sub-generator consisted of two parts. The functions of the two parts were calculating feature vectors and generating point clouds.

Figure 3.
Sub-discriminator. The sub-discriminator consisted of two parts. The two parts were the spatial transformer network and the feature extraction classification network.
Figure 3.
Sub-discriminator. The sub-discriminator consisted of two parts. The two parts were the spatial transformer network and the feature extraction classification network.

Figure 4.
Spatial transformer network.

Figure 5.
Feature extraction and classification network.

Figure 6.
Chair point clouds with different densities at different training stages.

Figure 7.
Generated point clouds. (a–d) are generated chair point clouds, (e–h) are generated guitar point clouds, (i–l) are generated table point clouds, (m–p) are generated airplane point clouds.
Figure 7.
Generated point clouds. (a–d) are generated chair point clouds, (e–h) are generated guitar point clouds, (i–l) are generated table point clouds, (m–p) are generated airplane point clouds.

Figure 8.
The curve of guitar training process using the proposed method.

Figure 9.
Generated guitar point clouds at different training stages. (a–d) are the point clouds generated by 100, 400, 700, and 1000 iterations, respectively.
Figure 9.
Generated guitar point clouds at different training stages. (a–d) are the point clouds generated by 100, 400, 700, and 1000 iterations, respectively.

Figure 10.
Point cloud generated by different noises. (a,b) are point clouds generated by input uniform distribution noise. (c,d) are point clouds generated by input standard normal distribution noise.
Figure 10.
Point cloud generated by different noises. (a,b) are point clouds generated by input uniform distribution noise. (c,d) are point clouds generated by input standard normal distribution noise.

Figure 11.
Ablation experiment. (a) without the multi-scale gradient network. (b) without the spatial transformer network.
Figure 11.
Ablation experiment. (a) without the multi-scale gradient network. (b) without the spatial transformer network.

Figure 12.
The curve of the chair training process without the multi-scale gradient network structure.
Figure 12.
The curve of the chair training process without the multi-scale gradient network structure.

Figure 13.
The curve of the chair training process without the spatial transformer network.

Figure 14.
Chair point clouds. (a,b) are the experimental results without the multi-scale gradient network structure. (c,d) are the experimental results without the spatial transformer network.
Figure 14.
Chair point clouds. (a,b) are the experimental results without the multi-scale gradient network structure. (c,d) are the experimental results without the spatial transformer network.

Figure 15.
Table and chair point clouds. (a–d) are point clouds generated by PcGAN. (e–h) are point clouds generated by GcGAN. (i–l) are point clouds generated by the MSG-Point-GAN.
Figure 15.
Table and chair point clouds. (a–d) are point clouds generated by PcGAN. (e–h) are point clouds generated by GcGAN. (i–l) are point clouds generated by the MSG-Point-GAN.


Table 1.
Quantitative comparison.
| Class | Model | JSD | MMD-CD | MMD-EMD |
|---|---|---|---|---|
| Chair | PcGAN | 0.227 | 0.0034 | 0.141 |
| GcGAN | 0.104 | 0.0030 | 0.113 | |
| Proposed | 0.112 | 0.0029 | 0.096 | |
| Table | PcGAN | 0.182 | 0.0042 | 0.134 |
| GcGAN | 0.135 | 0.0023 | 0.129 | |
| Proposed | 0.133 | 0.0025 | 0.122 | |
| Guitar | PcGAN | 0.174 | 0.0023 | 0.095 |
| GcGAN | 0.128 | 0.0022 | 0.075 | |
| Proposed | 0.113 | 0.0019 | 0.071 | |
| Airplane | PcGAN | 0.236 | 0.0045 | 0.126 |
| GcGAN | 0.142 | 0.0032 | 0.109 | |
| Proposed | 0.137 | 0.0035 | 0.113 |
The bold refers to the minimum value in each item, indicating that the indicator value is optimal.
Table 2.
Robustness analysis of hyper-parameters.
| Parameters | Learning Rate of the GAN | Level of the GAN | ||||
|---|---|---|---|---|---|---|
| 0.002 | 0.001 | 0.0005 | 5 | 6 | 7 | |
| Iterations | 800 | 600 | 900 | 600 | 800 | 1200 |
| JSD | 0.163 | 0.225 | 0.237 | 0.177 | 0.125 | 0.237 |
| EMD | 0.172 | 0.156 | 0.138 | 0.105 | 0.145 | 0.201 |
Table 3.
Object classification accuracy.
| First Weight | Second Weight | ||
|---|---|---|---|
| Generated Data | Real Data | Real Data | |
| chair | 69.17% | 97.00% | 96.00% |
| table | 61.00% | 91.00% | 93.00% |
| guitar | 67.50% | 98.00% | 99.00% |
| airplane | 79.17% | 100.00% | 100.00% |
| ModelNet40 testset | - | 92.28% | 92.45% |
Disclaimer/Publisher’s Note: The statements, opinions and data contained in all publications are solely those of the individual author(s) and contributor(s) and not of MDPI and/or the editor(s). MDPI and/or the editor(s) disclaim responsibility for any injury to people or property resulting from any ideas, methods, instructions or products referred to in the content. |
© 2023 by the authors. Licensee MDPI, Basel, Switzerland. This article is an open access article distributed under the terms and conditions of the Creative Commons Attribution (CC BY) license (https://creativecommons.org/licenses/by/4.0/).
Share and Cite
MDPI and ACS Style
Wang, B.; Lan, J.; Gao, J. MSG-Point-GAN: Multi-Scale Gradient Point GAN for Point Cloud Generation. Symmetry 2023, 15, 730. https://0-doi-org.brum.beds.ac.uk/10.3390/sym15030730
AMA Style
Wang B, Lan J, Gao J. MSG-Point-GAN: Multi-Scale Gradient Point GAN for Point Cloud Generation. Symmetry. 2023; 15(3):730. https://0-doi-org.brum.beds.ac.uk/10.3390/sym15030730
Chicago/Turabian StyleWang, Bingxu, Jinhui Lan, and Jiangjiang Gao. 2023. "MSG-Point-GAN: Multi-Scale Gradient Point GAN for Point Cloud Generation" Symmetry 15, no. 3: 730. https://0-doi-org.brum.beds.ac.uk/10.3390/sym15030730
Note that from the first issue of 2016, this journal uses article numbers instead of page numbers. See further details here.