Article

Petrogenetic Constraints of Early Cenozoic Mafic Rocks in the Southwest Songliao Basin, NE China: Implications for the Genesis of Sandstone-Hosted Qianjiadian Uranium Deposits

1
State Key Laboratory of Nuclear Resources and Environment, East China University of Technology, Nanchang 330013, China
2
College of Earth Science, East China University of Technology, Nanchang 330013, China
3
No. 243 Geological Party, The China National Nuclear Corporation, Chifeng 024006, China
*
Authors to whom correspondence should be addressed.
Submission received: 14 October 2020 / Revised: 9 November 2020 / Accepted: 12 November 2020 / Published: 14 November 2020

Abstract

:
The tectonic inversion of the Songliao Basin during the Cenozoic may have played an important role in controlling the development of sandstone-type uranium deposits. The widely distributed mafic intrusions in the host sandstones of the Qianjiadian U ore deposits provided new insights to constrain the regional tectonic evolution and the genesis of the U mineralization. In this study, zircon U-Pb dating, whole-rock geochemistry, Sr-Nd-Pb isotope analysis, and mineral chemical compositions were presented for the mafic rocks from the Qianjiadian area. The mafic rocks display low SiO2 (44.91–52.05 wt.%), high TFe2O3 contents (9.97–16.46 wt.%), variable MgO (4.59–15.87 wt.%), and moderate K2O + Na2O (3.19–6.52 wt.%), and can be subdivided into AB group (including basanites and alkali olivine basaltic rocks) and TB group (mainly tholeiitic basaltic rocks). They are characterized by homogenous isotopic compositions (εNd (t) = 3.47–5.89 and 87Sr/86Sr = 0.7032–0.7042) and relatively high radiogenic 206Pb/204Pb (18.13–18.34) and Nb/U ratios (23.0–45.6), similar to the nearby Shuangliao basalts, suggesting a common asthenospheric origin enriched with slab-derived components prior to melting. Zircon U-Pb and previous Ar-Ar dating show that the AB group formed earlier (51–47 Ma) than the TB group (42–40 Ma). Compared to the TB group, the AB group has higher TiO2, Na2O, K2O, P2O5, Ce, and HREE contents and Ta/Yb and Sr/Yb ratios, which may have resulted from variable depth of partial melting in association with lithospheric thinning. Combined with previous research, the Songliao Basin experienced: (1) Eocene (~50–40 Ma) lithospheric thinning and crustal extension during which mafic rocks intruded into the host sandstones of the Qianjiadian deposit, (2) a tectonic inversion from extension to tectonic uplift attributed to the subduction of the Pacific Plate occurring at ~40 Ma, and (3) Oligo–Miocene (~40–10 Ma) tectonic uplift, which is temporally associated with U mineralization. Finally, the close spatial relation between mafic intrusions and the U mineralization, dike-related secondary reduction, and secondary oxidation of the mafic rocks in the Qianjiadian area suggest that Eocene mafic rocks and their alteration halo in the Songliao Basin may have played a role as a reducing barrier for the U mineralization.

Graphical Abstract

1. Introduction

The tectonic evolution of sedimentary basins from extension to compression has been regarded as the key factor to the formation of sandstone-type uranium deposits [1,2,3,4,5,6]. For example, tectonic movements controlled the deposition of sediments, fluid flow, and climatic variations within the basin [7], and the timing of uranium mineralization is generally related to tectonic uplifts [5]. Moreover, the relationship between basic rocks emplaced during extension and uranium deposition has always attracted much attention. Previous studies mainly focused on the effects of mafic dikes on uranium mineralization in volcanic- and granite-related uranium deposits [8,9,10,11,12]. Except for U mineralization associated with mafic intrusions in Proterozoic sandstones [13], the roles of mafic dikes in the genesis of sandstone-hosted uranium deposits have been poorly constrained.
The Qianjiadian uranium deposit has been widely regarded as a typical interlaminar oxidation zone-type uranium deposit in the southern part of the Songliao Basin (Figure 1) [14,15,16]. Many publications have documented the sedimentary facies, depositional environment, sandstone petrography and geochemistry, mineral paragenesis and textures, mineralization geochronology, and ore genesis model for the deposit [17,18,19,20,21]. In the Qianjiadian area, uranium is mainly adsorbed or reduced on carbonaceous debris or migrated oil, and U minerals such as pitchblende and coffinite are intimately associated with iron disulphides [22,23,24,25,26,27]. Several studies were conducted on the micro-morphological observations, in situ sulfur isotope analysis of pyrites, and carbon isotope composition of calcite cement, emphasizing the role of bacterial sulphate reduction (BSR) in the genesis of the U mineralization in the Qianjiadian area [28,29,30,31,32,33]. Nevertheless, the tabular U ore bodies in the Qianjiadian deposit are spatially associated with secondary reduced gray sandstones or bleached white sandstones [34] (Figure 2) together with the widely distributed mafic rocks [17], which significantly differ from the two predominant models of redox front sandstone-hosted U deposits presented in [33]. In addition, detailed petrographic studies performed on carbonaceous debris from this deposit showed significant increase of the vitrinite reflectance, suggesting that the U mineralization is spatially associated with the alteration halo of the diabase dikes [20]. However, the emplacement age and geochemical signatures of these mafic rocks have not been carefully constrained, and their possible role in the genesis of the Qianjiadian deposit has to be clearly characterized.
Moreover, the apatite and zircon fission-track data of the Baixingtu ore deposits recorded two distinct stages of rapid cooling after the Late Cretaceous, with stage I at ~80–50 Ma and stage II at ~40–10 Ma, respectively [5]. Based on whole rock U-Pb isotopic dating and geochemical features of the Qianjiadian deposit, Luo et al. [18] proposed a multi-stage genetic model, with an early stage of synsedimentary U mineralization (96 ± 14 Ma), later overprinted by oil and gas migration (67 ± 5Ma) and hydrothermal fluids percolation (40 ± 3 Ma). Recently, U-Th-Pb chemical ages obtained by electron probe micro-analyzer (EPMA) revealed two younger and more dominant stages of mineralization at 43–28 Ma and 19–3 Ma, respectively [36]. Most of the uranium mineralization occurs around the tectonic uplifts with ages younger than 40 Ma [36], and these tectonic uplifts and sandstone-type uranium deposits show close spatial and temporal relationships [5].
Moreover, Cheng et al. [6] proposed that Miocene tectonic uplift (~40–10 Ma) of the basin caused large-scale uranium mineralization. Although the tectonic uplift events have been extensively studied, when and how the tectonic inversion from extension to uplift occurred has not been carefully constrained. Mafic rocks that generally occur in extension environment are widespread in the sandstone-hosted uranium ore deposits in the Qianjiadian area, Songliao Basin (Figure 1c), and have intruded into the sandstones of the Yaojia and Nenjiang formations (Figure 2). Based on whole-rock Ar–Ar dating, Xia et al. [15] proposed that the diabase dikes were emplaced at 49.5 ± 5 Ma. However, LA-ICP-MS analysis of zircons from mafic dike in Baixingtu ore deposit yielded an age of 70.0 ± 3.0 Ma [37]. Therefore, detailed geochronology and geochemistry of the mafic rocks could provide important information for regional tectonic evolution of the basin.
Here, zircon U-Pb ages, whole-rock geochemistry, Sr-Nd-Pb isotopic compositions, and mineral chemical compositions were presented for the mafic rocks in the Qianjiadian U deposit in the Songliao basin, Northeastern China. These new data combined with previous low-temperature thermochronologic data are then used to discuss regional uplift and extension events, and their geodynamic mechanism and implications for uranium mineralization.

2. Geological Setting

The Songliao Basin is a large oil, gas, and uranium producer and covers an area of 260,000 km2 in NE China [35,38]. It is bounded by the Zhangguangcai Range to the east, the Great Xing’an Range in the northwest, the Lesser Xing’an Range to the northeast, and the North China Craton in the south [39] (Figure 1b). This Mesozoic–Cenozoic sedimentary basin trends north-northeast to south-southwest and was formed on a folded basement. This basement is mainly composed of Paleozoic to Mesozoic metamorphic and igneous rocks [40]. This basin began with syn-rift volcanogenic successions during the period from 150 to 105 Ma, followed by post volcanic thermal sagging between 105 and 79.1 Ma, and ended with regional uplift and basin inversion from 79.1 to 40 Ma [41]. Sediments from the Upper Jurassic and Lower Cretaceous Huoshiling (J3h), Shahezi (K1s), and Yingcheng (K1y) formations were deposited in a syn-rifting tectonic setting. The Upper Cretaceous Quantou (K2q), Qingshankou (K2qn), Yaojia (K2y), and Nenjiang (K2n) formations developed during the post-rift thermal subsidence of the basin [35,38]. The Yaojia Formation is mainly constituted of fluvial and deltaic coarse-grained deposits, whereas the Nenjiang Formation is primarily composed of lacustrine fine-grained deposits (Figure 2).
The Qianjiadian uranium deposit is hosted within the Yaojia Formation in the southwestern part of the Songliao Basin and is located at a depth between 200 and 400 m below the surface. Uranium ore bodies with an average grade of 0.0104% to 0.0287% are mainly tabular or lenticular in shape [42]. The ore-hosting sediments are mainly composed of fine-grained sandstone, siltstone, and mudstone with pitchblende and coffinite as the predominant uranium minerals [15,16,17,18,19,20]. Intrusive mafic rocks are also widespread in sandstones of the Yaojia Formation in the Qianjiadian area (Figure 1c). They are crosscut by relatively abundant carbonate veins and their alteration halo displays a secondary reduced green-white zone characterized by a pervasive green alteration in reduced grey sandstones as described by Bonnetti et al. [27] and the bleaching of oxidized sandstones (Figure 3a). The mineral assemblage of the green alteration includes newly precipitated chlorite, epidote, and carbonate [27,28] that mainly occur as cement filling sandstone porosity. Based on grain sizes, these mafic rocks show fine-grained and medium- to coarse-grained textures. The fine-grained mafic rocks mainly consist of diabase (Figure 3b) and medium-coarse grained mafic rocks mainly composed of gabbro (Figure 3d). The diabase exhibits an ophitic texture and massive structure and is mainly composed of plagioclase (60–65 vol.%), clinopyroxene (30–35 vol.%), and small amounts of olivine (5–10 vol.%) and most grains have a maximum size less than 1 mm. The gabbro is massive and has a fine- to medium-grained granular texture, and consists of plagioclase (45–50 vol.%), clinopyroxene (40–45 vol.%), and small amounts of olivine (5–8 vol.%) and magnetite (3–5 vol.%).

3. Analytical Methods

3.1. U-Pb Zircon Dating

Zircon separation was undertaken using heavy liquid and magnetic techniques and was further purified by hand picking under a binocular microscope. Separated grains were cast into epoxy resin discs and polished approximately to expose the grain centers. Prior to isotopic analyses, the microstructures of zircon grains were performed using cathodoluminescence (CL) imaging. Zircon U–Pb isotopic analysis was conducted using an Agilent 7500a inductively coupled plasma-mass spectrometer (ICP-MS) instrument equipped with a ComPex102 193 nm ArF excimer laser ablation system at the Key Laboratory of Mineral Resources Evaluation in Northeast Asia, Ministry of Natural Resources of China, Jilin University, China. The detailed description of the analysis technique was described by Liu et al. [43]. Harvard zircon 91500 was used as an external standard to normalize isotopic fractionation, and a standard silicate glass (NIST SRM 610) was used as an external standard to calculate the U, Th, and Pb concentrations of unknowns.

3.2. Major and Trace Element Determinations

Bulk rock abundances of major and trace elements were conducted at the Beijing Createch Testing Technology Co. Ltd, Beijing, China. Major element compositions were analyzed by X-ray fluorescence spectrometer (XRF, Rigaku RIX 2100), with analytical uncertainties of 1%–5%. Trace elements were conducted using a Perkin-Elmer Elan 6000 ICP-MS after acid digestion of the samples in high-pressure Teflon bombs, with analytical uncertainties between 1% and 3%. The National standards GSR1, GSR3, BCR-2, and GSP-2 were chosen to calibrate element abundances of the analyzed samples.

3.3. Whole-Rock Sr–Nd–Pb Isotope Analysis

Whole-rock Sr–Nd–Pb isotopic analyses were undertaken using a high-resolution multiple-collector (MC)-ICP-MS (Thermo-Fisher Neptune Plus) at the Beijing Createch Testing Technology Co. Ltd., Beijing, China. Prior to the separation of Sr, Nd, and Pb by ion-exchange techniques, approximately 50~100 mg powder for each sample was dissolved in a PFA beaker with HF + HNO3 at 100 °C for 6 days. Repeated standard analyses yielded 87Sr/86Sr of 0.710247 ± 13 (NBS-987) and 143Nd/144Nd of 0.512192 ± 15 (GSB Nd), respectively. For Pb isotope analyses, the CAGS Pb was used as the standard yielded average for 206Pb/204Pb = 17.9698 ± 0.0090 (2 SD, n = 11), 207Pb/204Pb = 15.5616 ± 0.0008 (2S D, n = 11), and 208Pb/204Pb = 38.4036 ± 0.0019 (2 SD, n = 11), respectively.

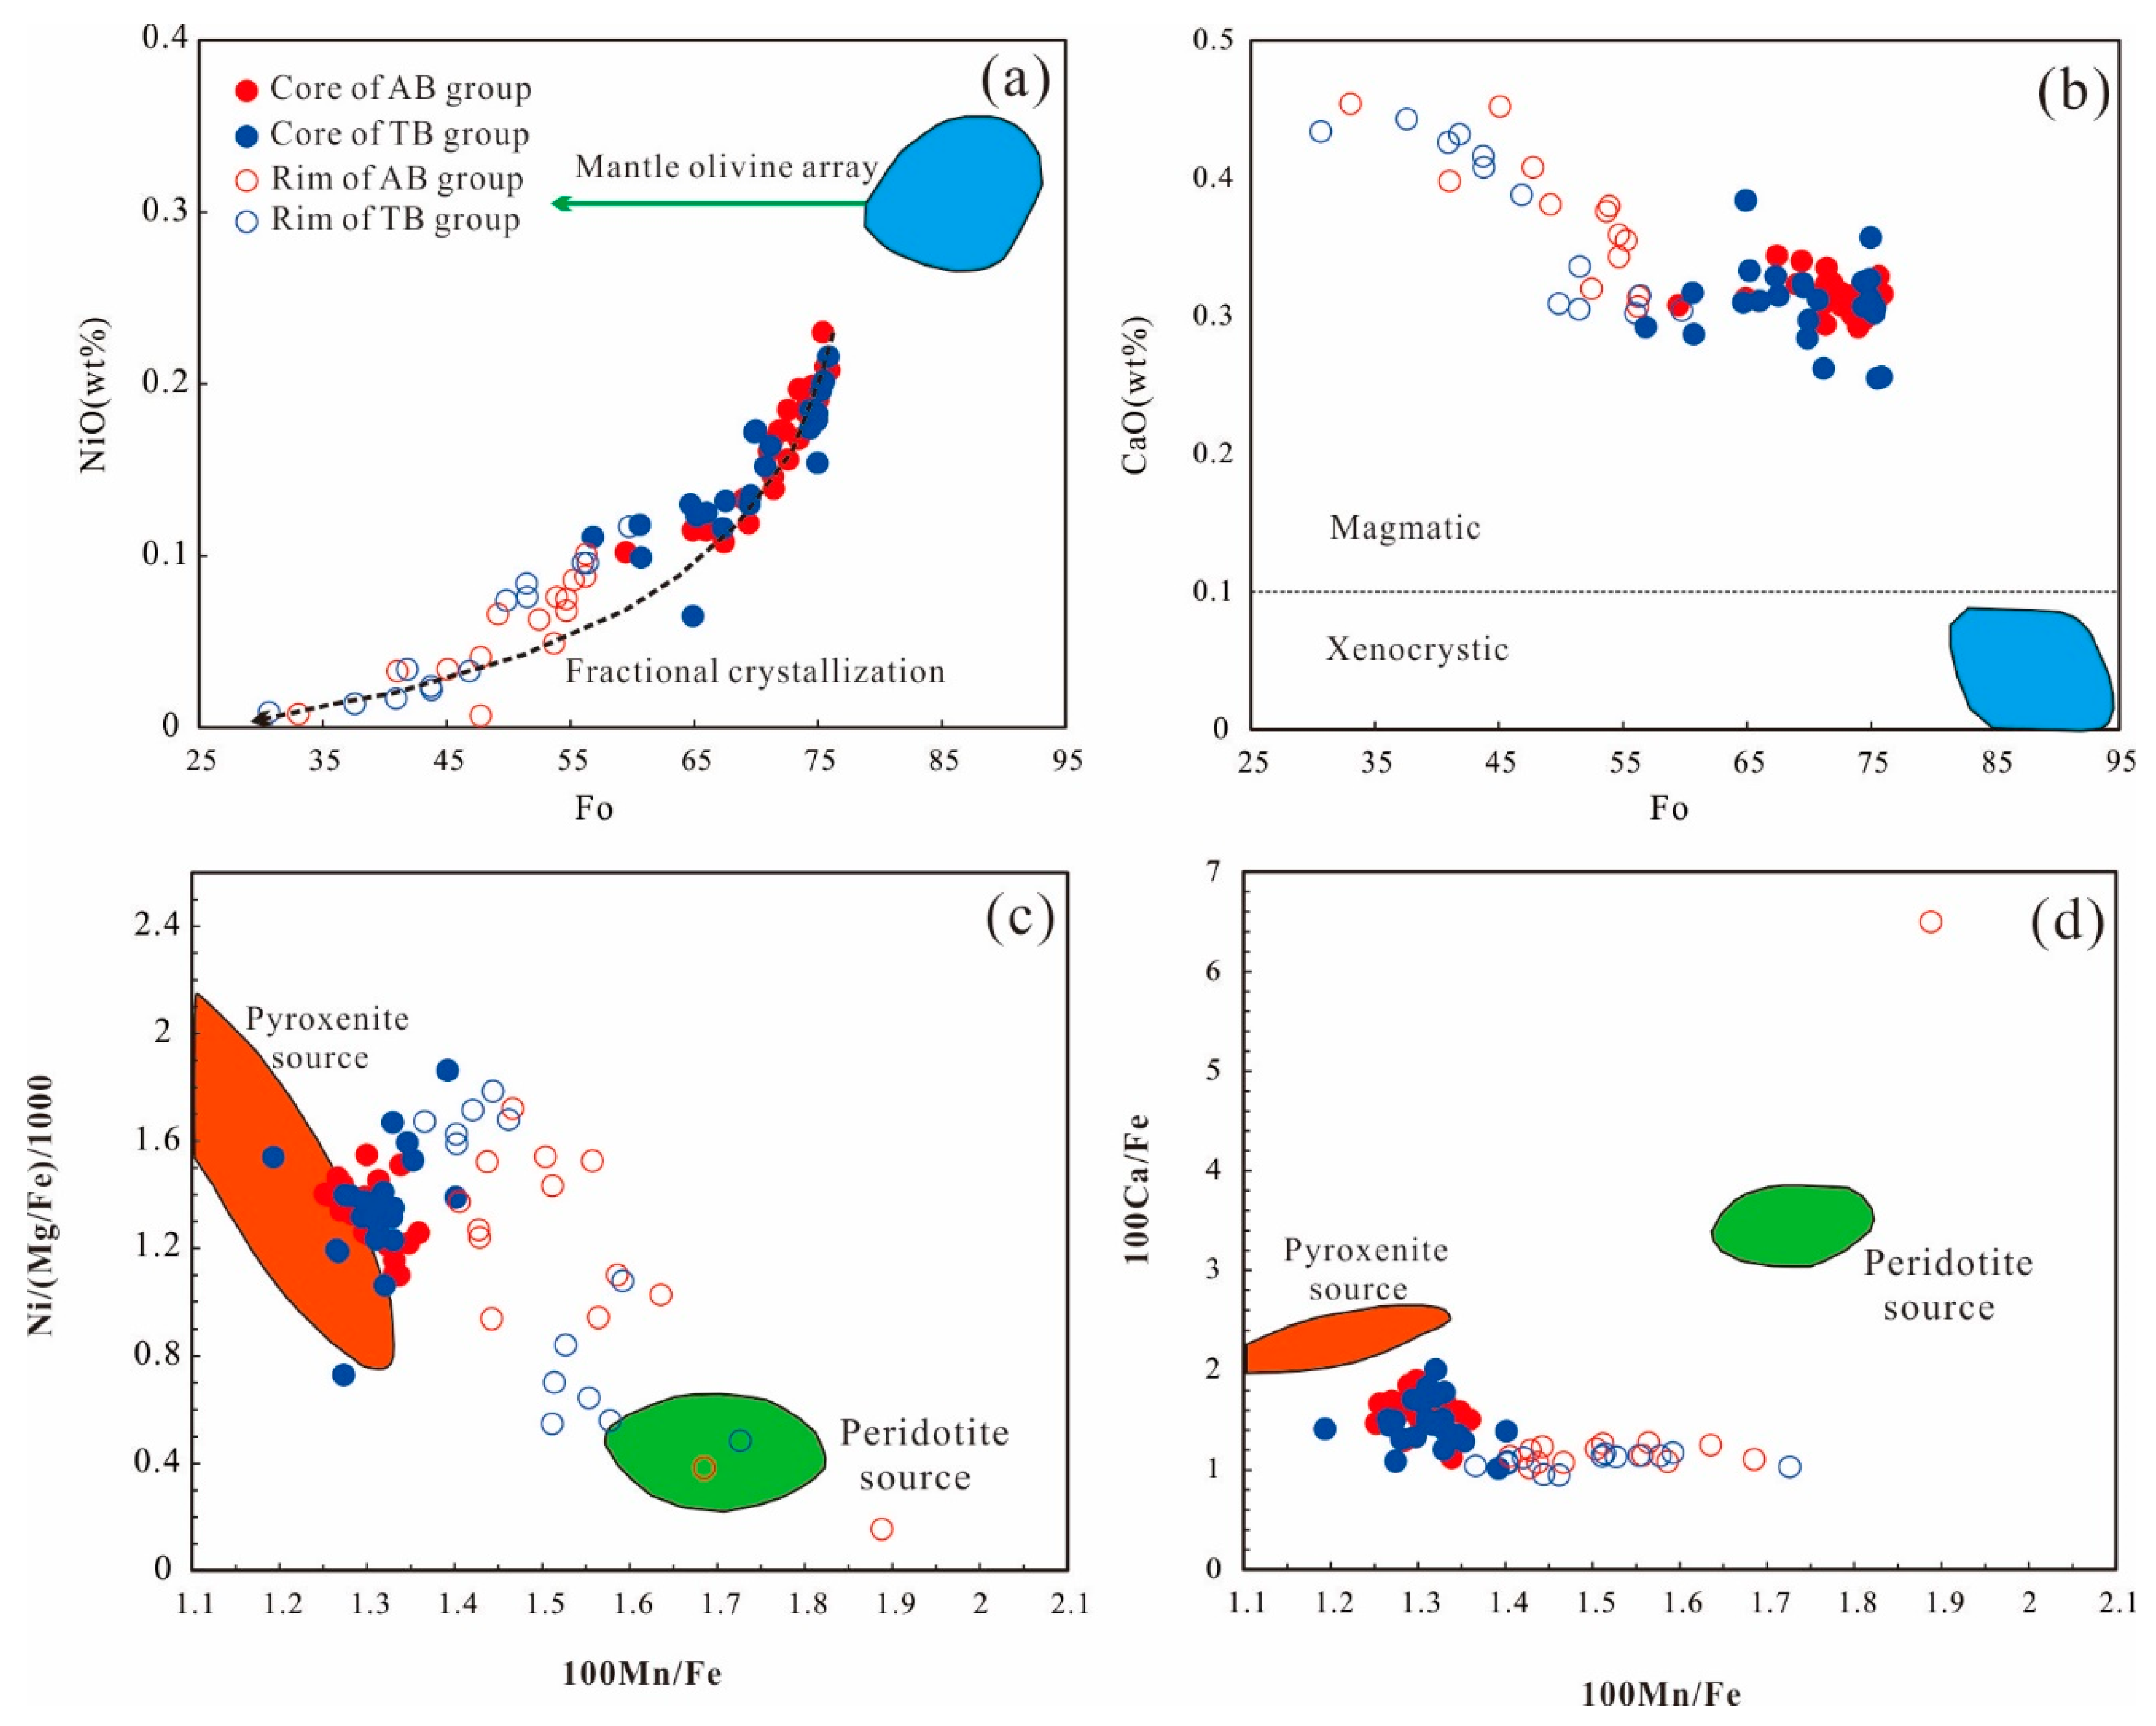
3.4. Olivine Composition Analyses

The major and minor elements of olivine were determined by EPMA (JEOL-JXA 8230) at the State Key Laboratory of Nuclear Resources and Environment, East China University of Technology, Nanchang, China. The operating conditions were conducted using 20 kV accelerating voltage, 300 nA beam current, 2 μm beam diameter, and 20 s peak counting time for major elements (Mg, Fe, Si), 40s peak counting time for Ca and Mn, and 90 s peak counting time for Ni. In details, Si, Mg, Al, and Ca were normalized to olivine, Fe and Mn to diopside, and Ni to ZBA Oxide NiO. The original data reduction was performed using the ZAF correction.

4. Results

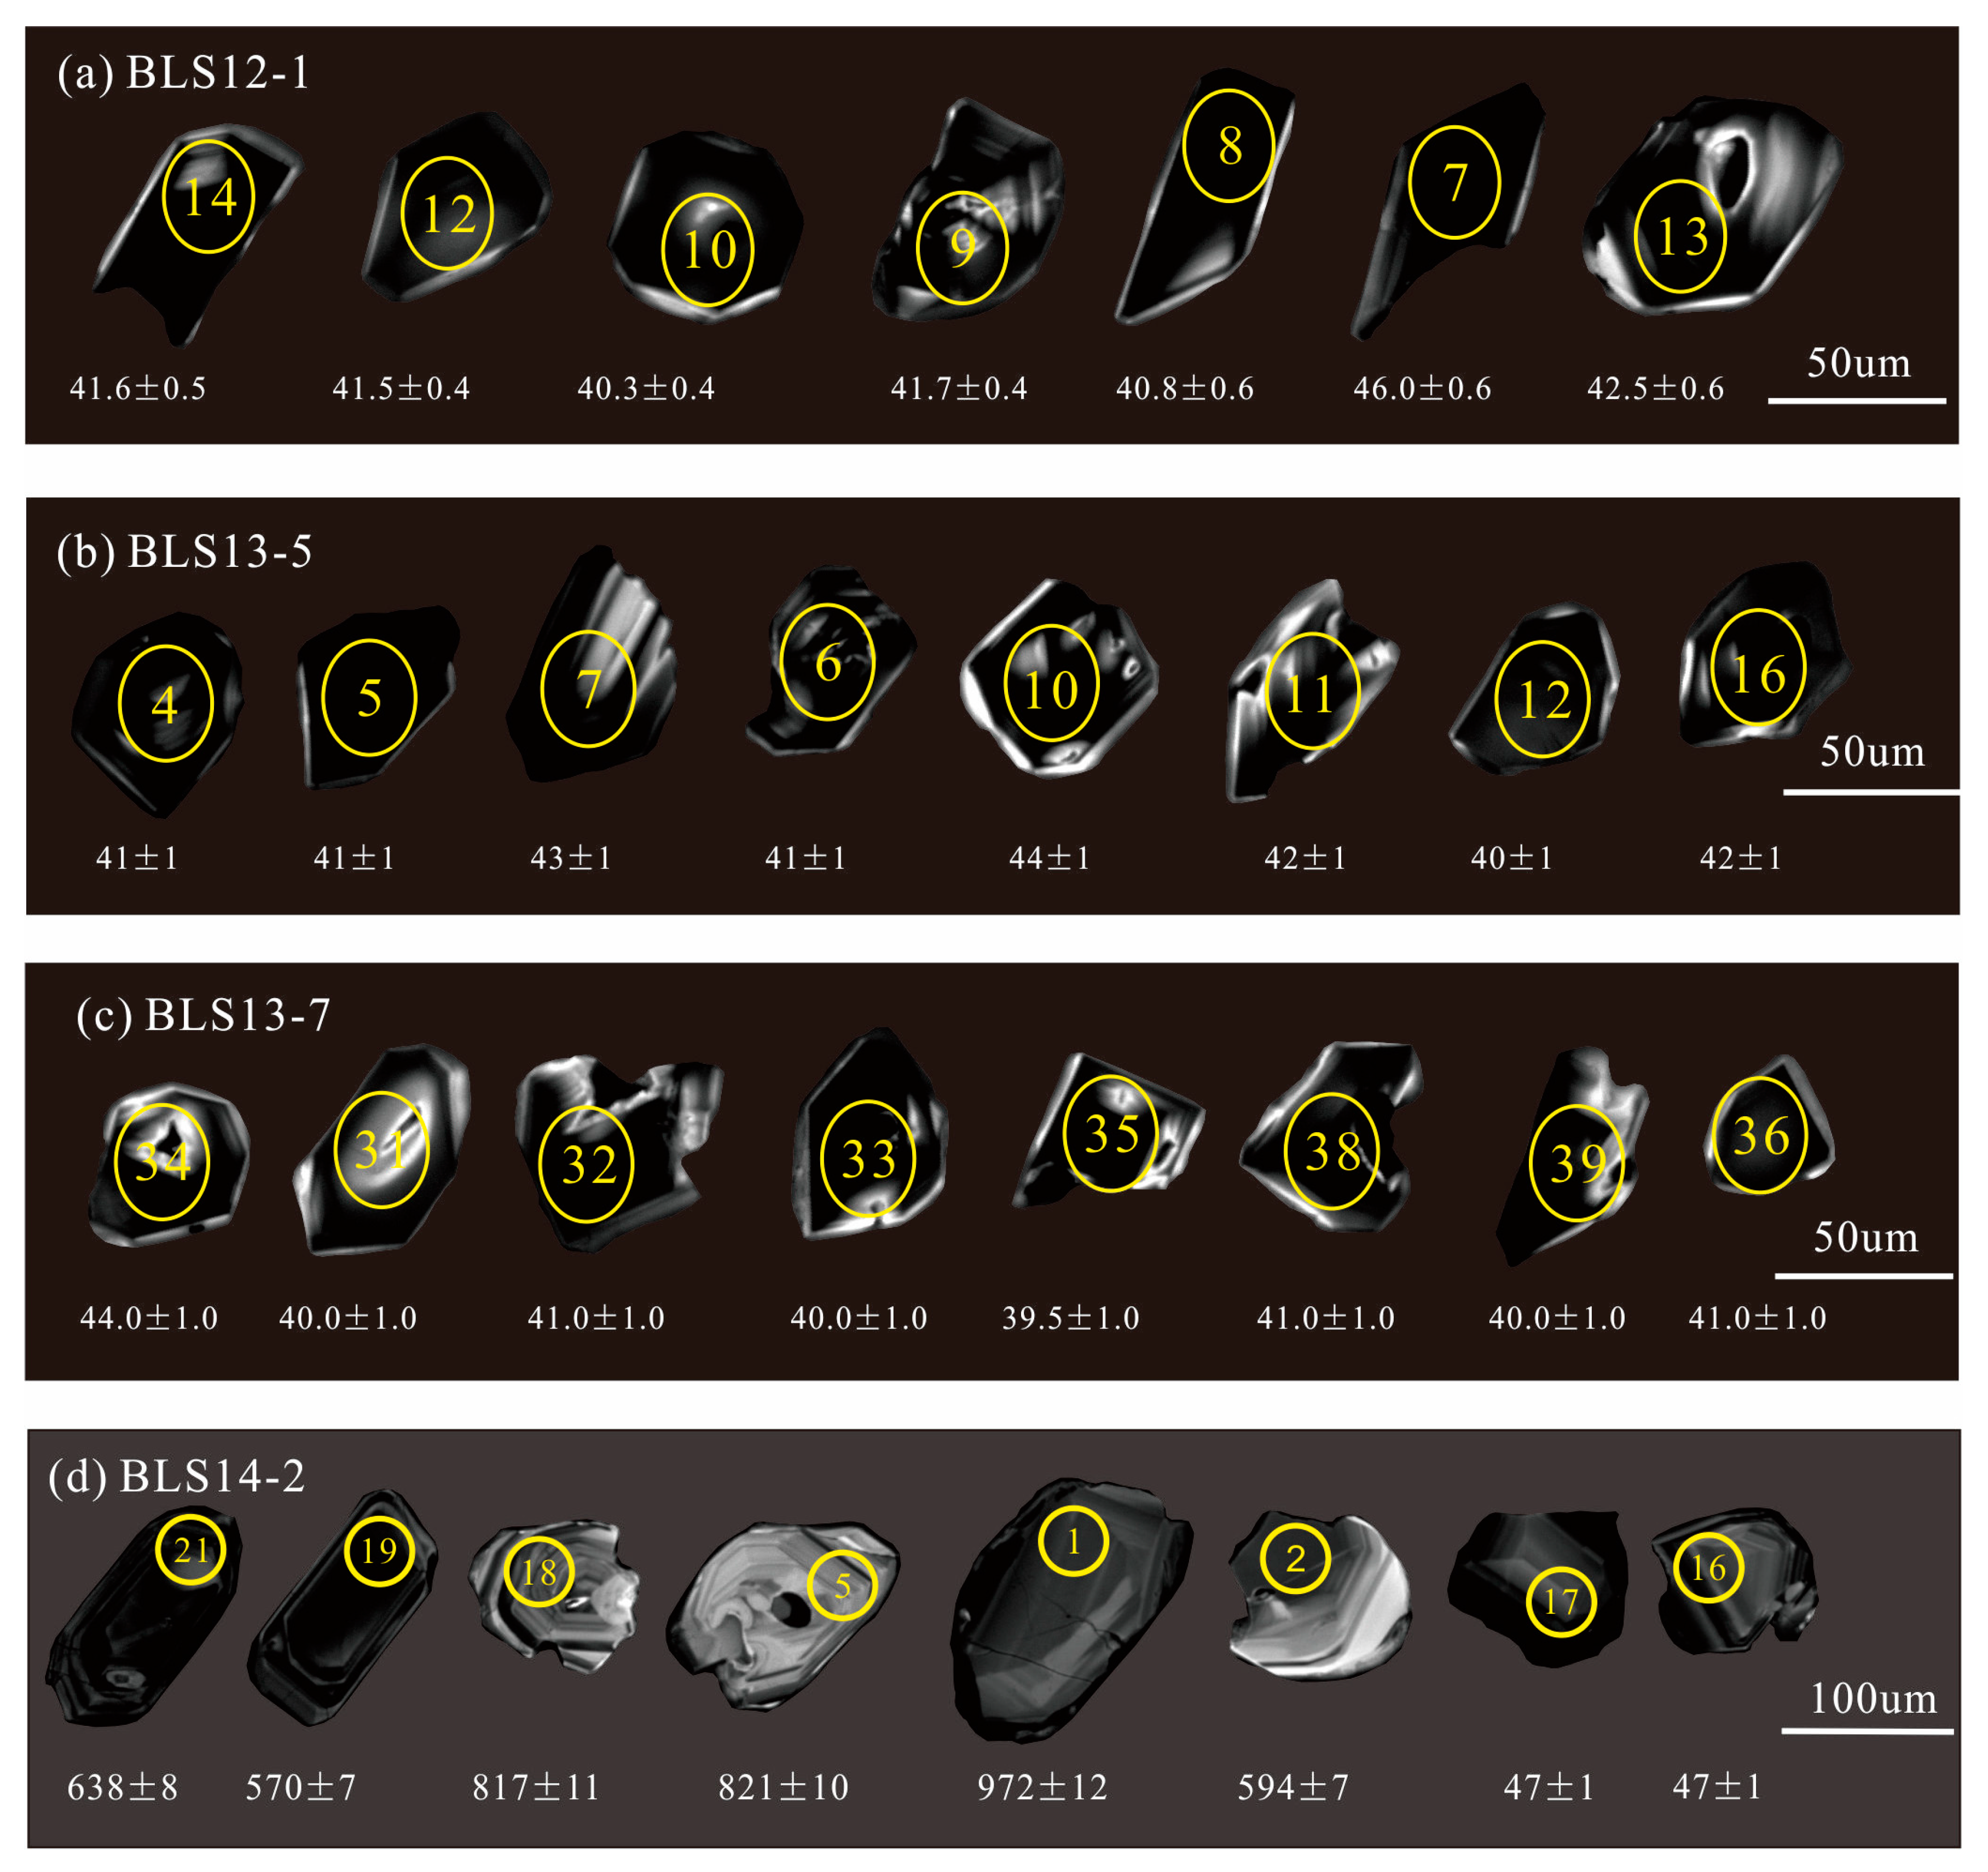
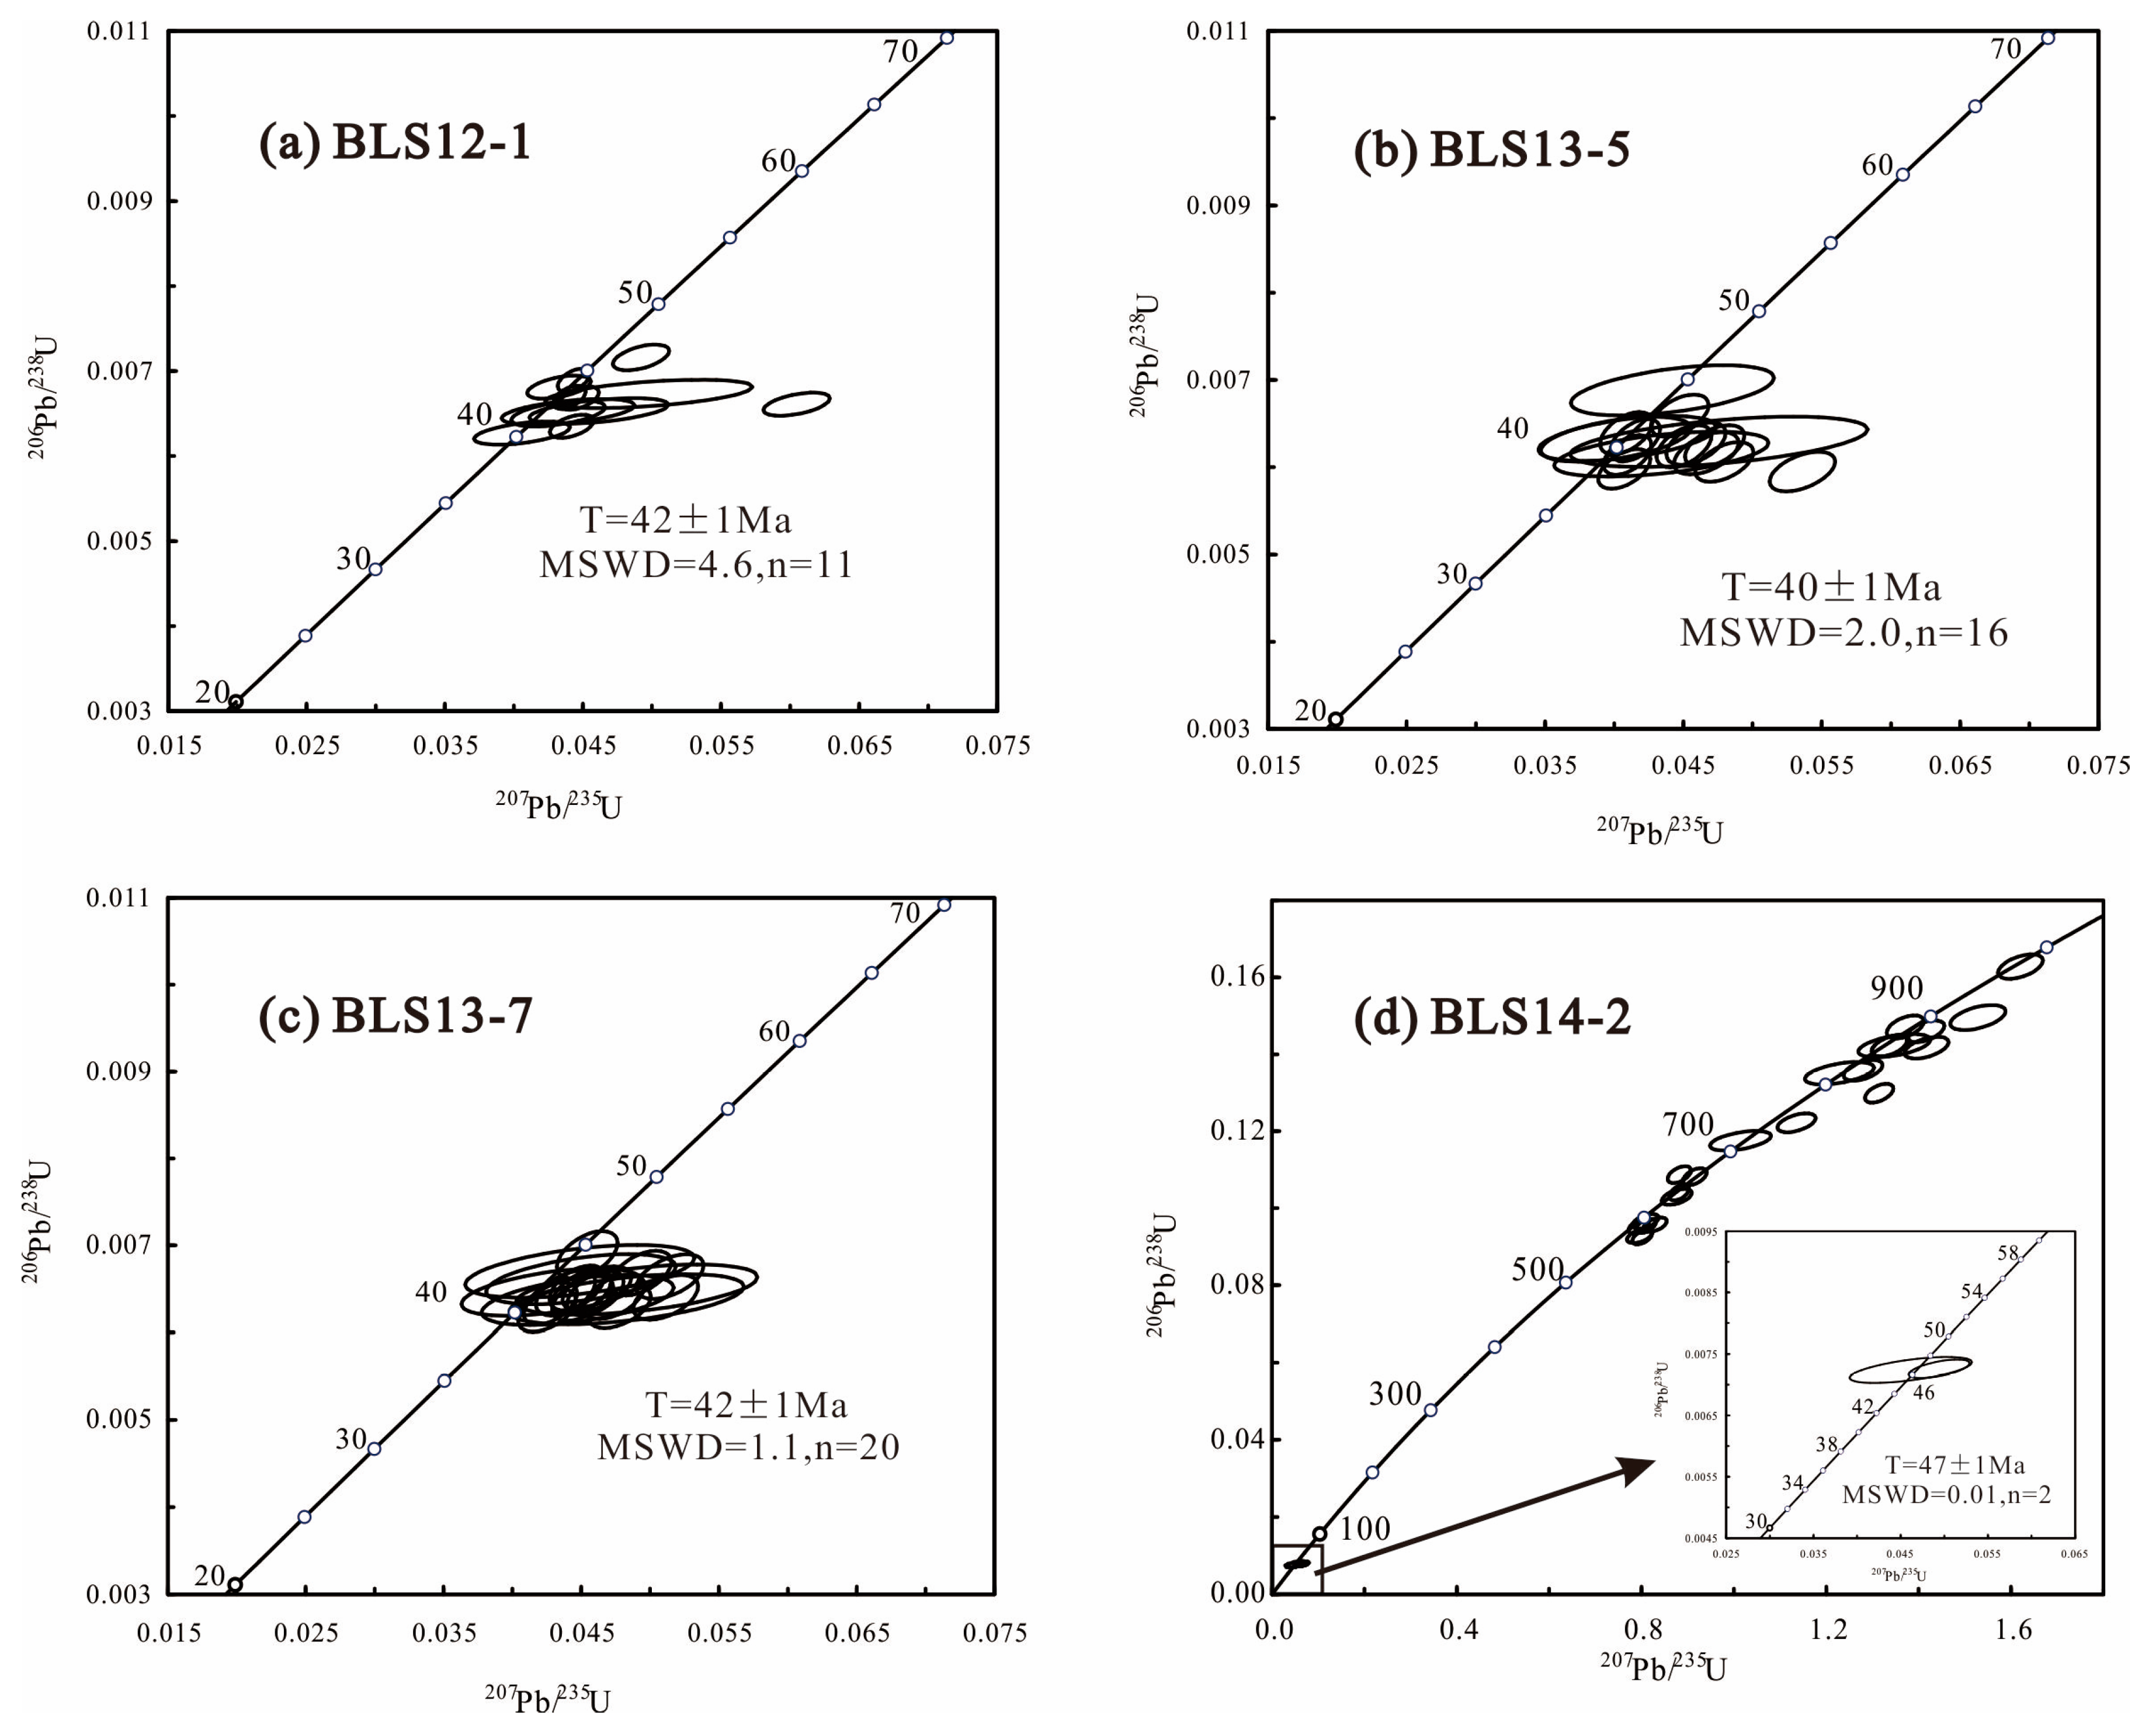
4.1. U-Pb Zircon Geochronology

The analyzed zircons were clear euhedral–subhedral prisms and showed fine-scale and striped absorption oscillatory zoning (Figure 4). They had high Th/U ratios of 0.51–1.82 (Table S1), indicating their magmatic origin [44]. Four samples yielded ages of 46.6–40.3 Ma that were significantly younger than the stratigraphic ages of the Yaojia Formation (∼91–88.5 Ma) [45]. Generally, silica-rich mafic rocks with coarse-grained texture have more potential to crystallize their own zircons. In this study, three samples of medium- to coarse-grained mafic rocks (sample BLS12-1, BLS13-5, and BLS13-7) yielded ages of 42.3–40.3 Ma; nevertheless, only two zircon grains from fine-grained mafic rocks (sample BLS14-2) yielded apparent ages of 46.5 and 46.6 Ma (Table S1).
A total of 20 concordant zircon U–Pb analyses were obtained from sample BLS12-1, yielding apparent ages ranging from 40 ± 1 to 3549 ± 17 Ma. Twelve zircon grains yielded apparent ages between 40 ± 1 and 44 ± 1 Ma, with a weighted mean 206Pb/238U age of 42 ± 1 Ma (N = 12, mean square weighted deviation (MSWD) = 4.6; Figure 5a). The remaining zircons yielded apparent ages between 254 and 3549 Ma (Table S1). The younger age of 42 ± 1 Ma represents the crystallization age of the diabase, with the older ages representing the crystallization ages of captured zircon grains entrained by the diabase.
A total of 15 concordant zircon U–Pb analyses were obtained from sample BLS13-5, yielding 206Pb/238U ages ranging from 38 to 42 Ma, with a weighted mean 206Pb/238U age of 40 ± 1 Ma (N = 16, MSWD = 2.0; Figure 5b), representing the crystallization age of the diabase porphyrite.
A total of 20 concordant zircon U–Pb analyses were obtained from sample BLS13-7, yielding 206Pb/238U ages ranging from 40 to 44 Ma with a weighted mean 206Pb/238U age of 42 ± 1 Ma (N = 20, MSWD = 1.1; Figure 5c), representing the crystallization age of the diabase.
A total of 25 U–Pb analyses were obtained from sample BLS14-2 (Table S1), and most grains showed apparent ages ranging from 46.5 ± 0.9 to 972 ± 12 Ma (Figure 5d). Two zircon grains yielded 206Pb/238U ages of 46.5 and 46.6 Ma, with a weighted mean 206Pb/238U age of 47 ± 1 Ma (N = 2, MSWD = 0.01; Figure 5d). The remaining zircons yielded apparent ages between 570 and 898 Ma. These older ages represent the times of crystallization of captured zircons entrained by the diabase, whereas the younger age (47 Ma) was interpreted as the crystallization age of this diabase, which is very similar to the Ar-Ar age of the nearby Shuangliao alkali basalts (48.5~51 Ma) [46].

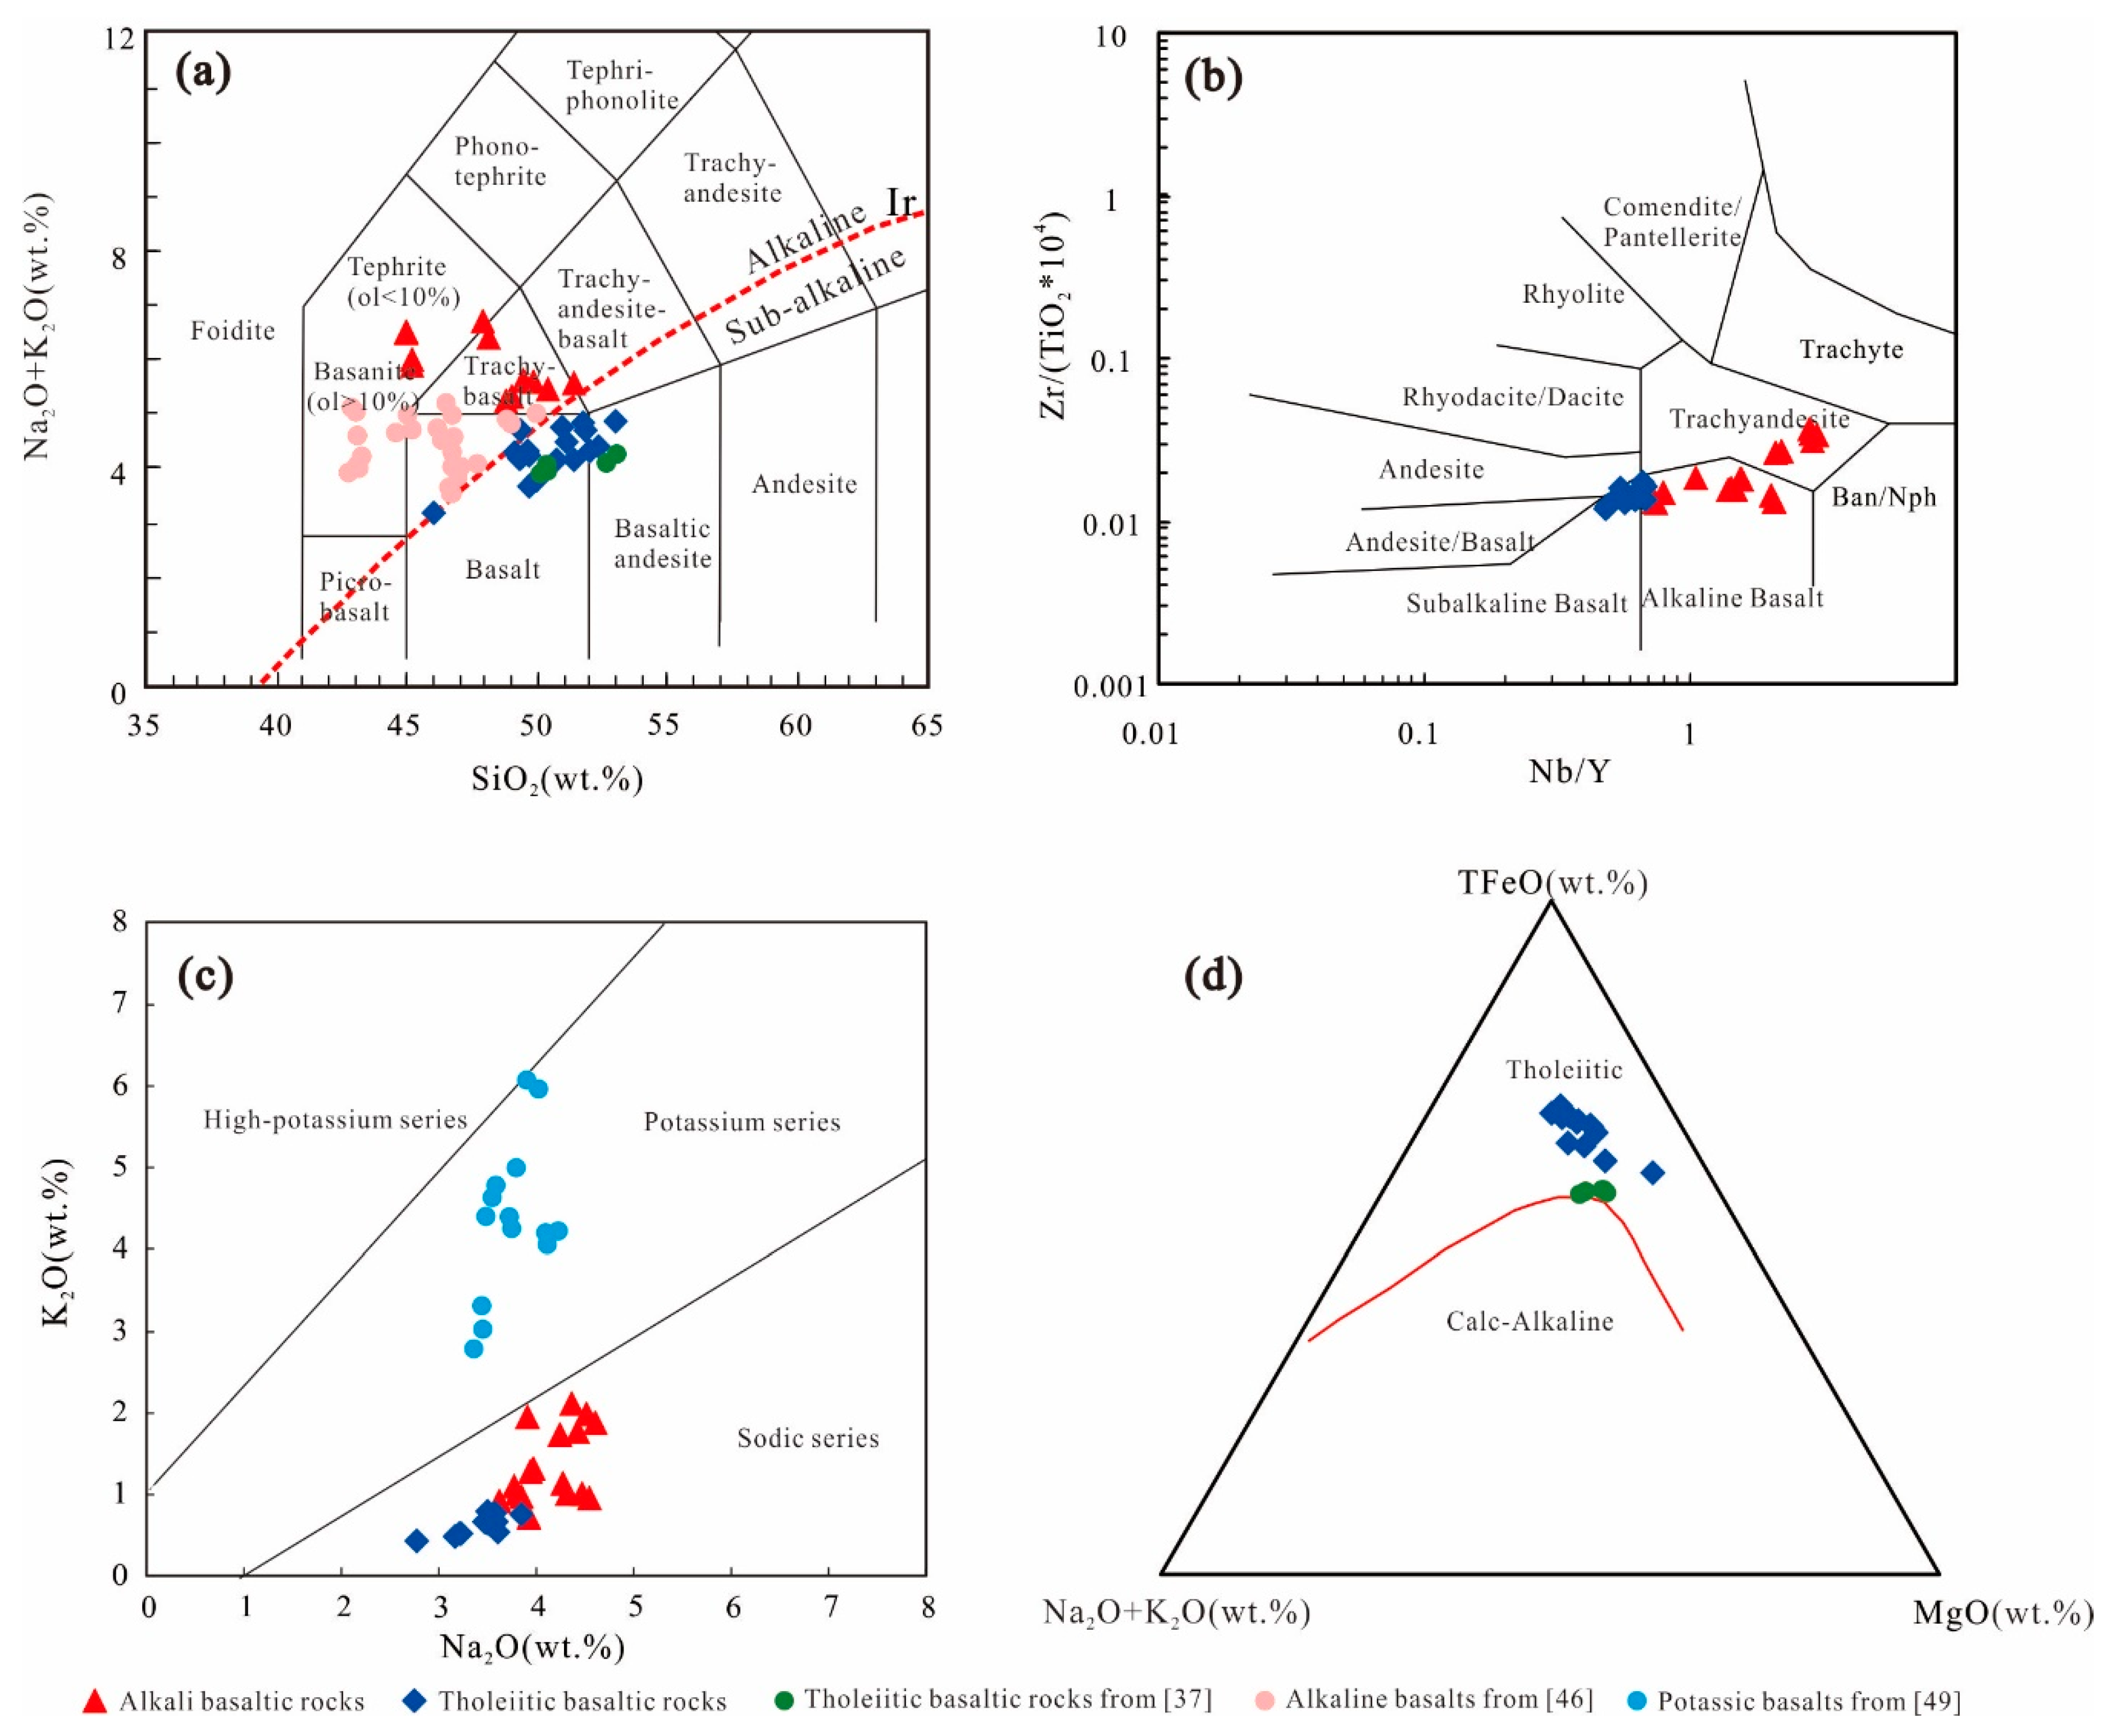
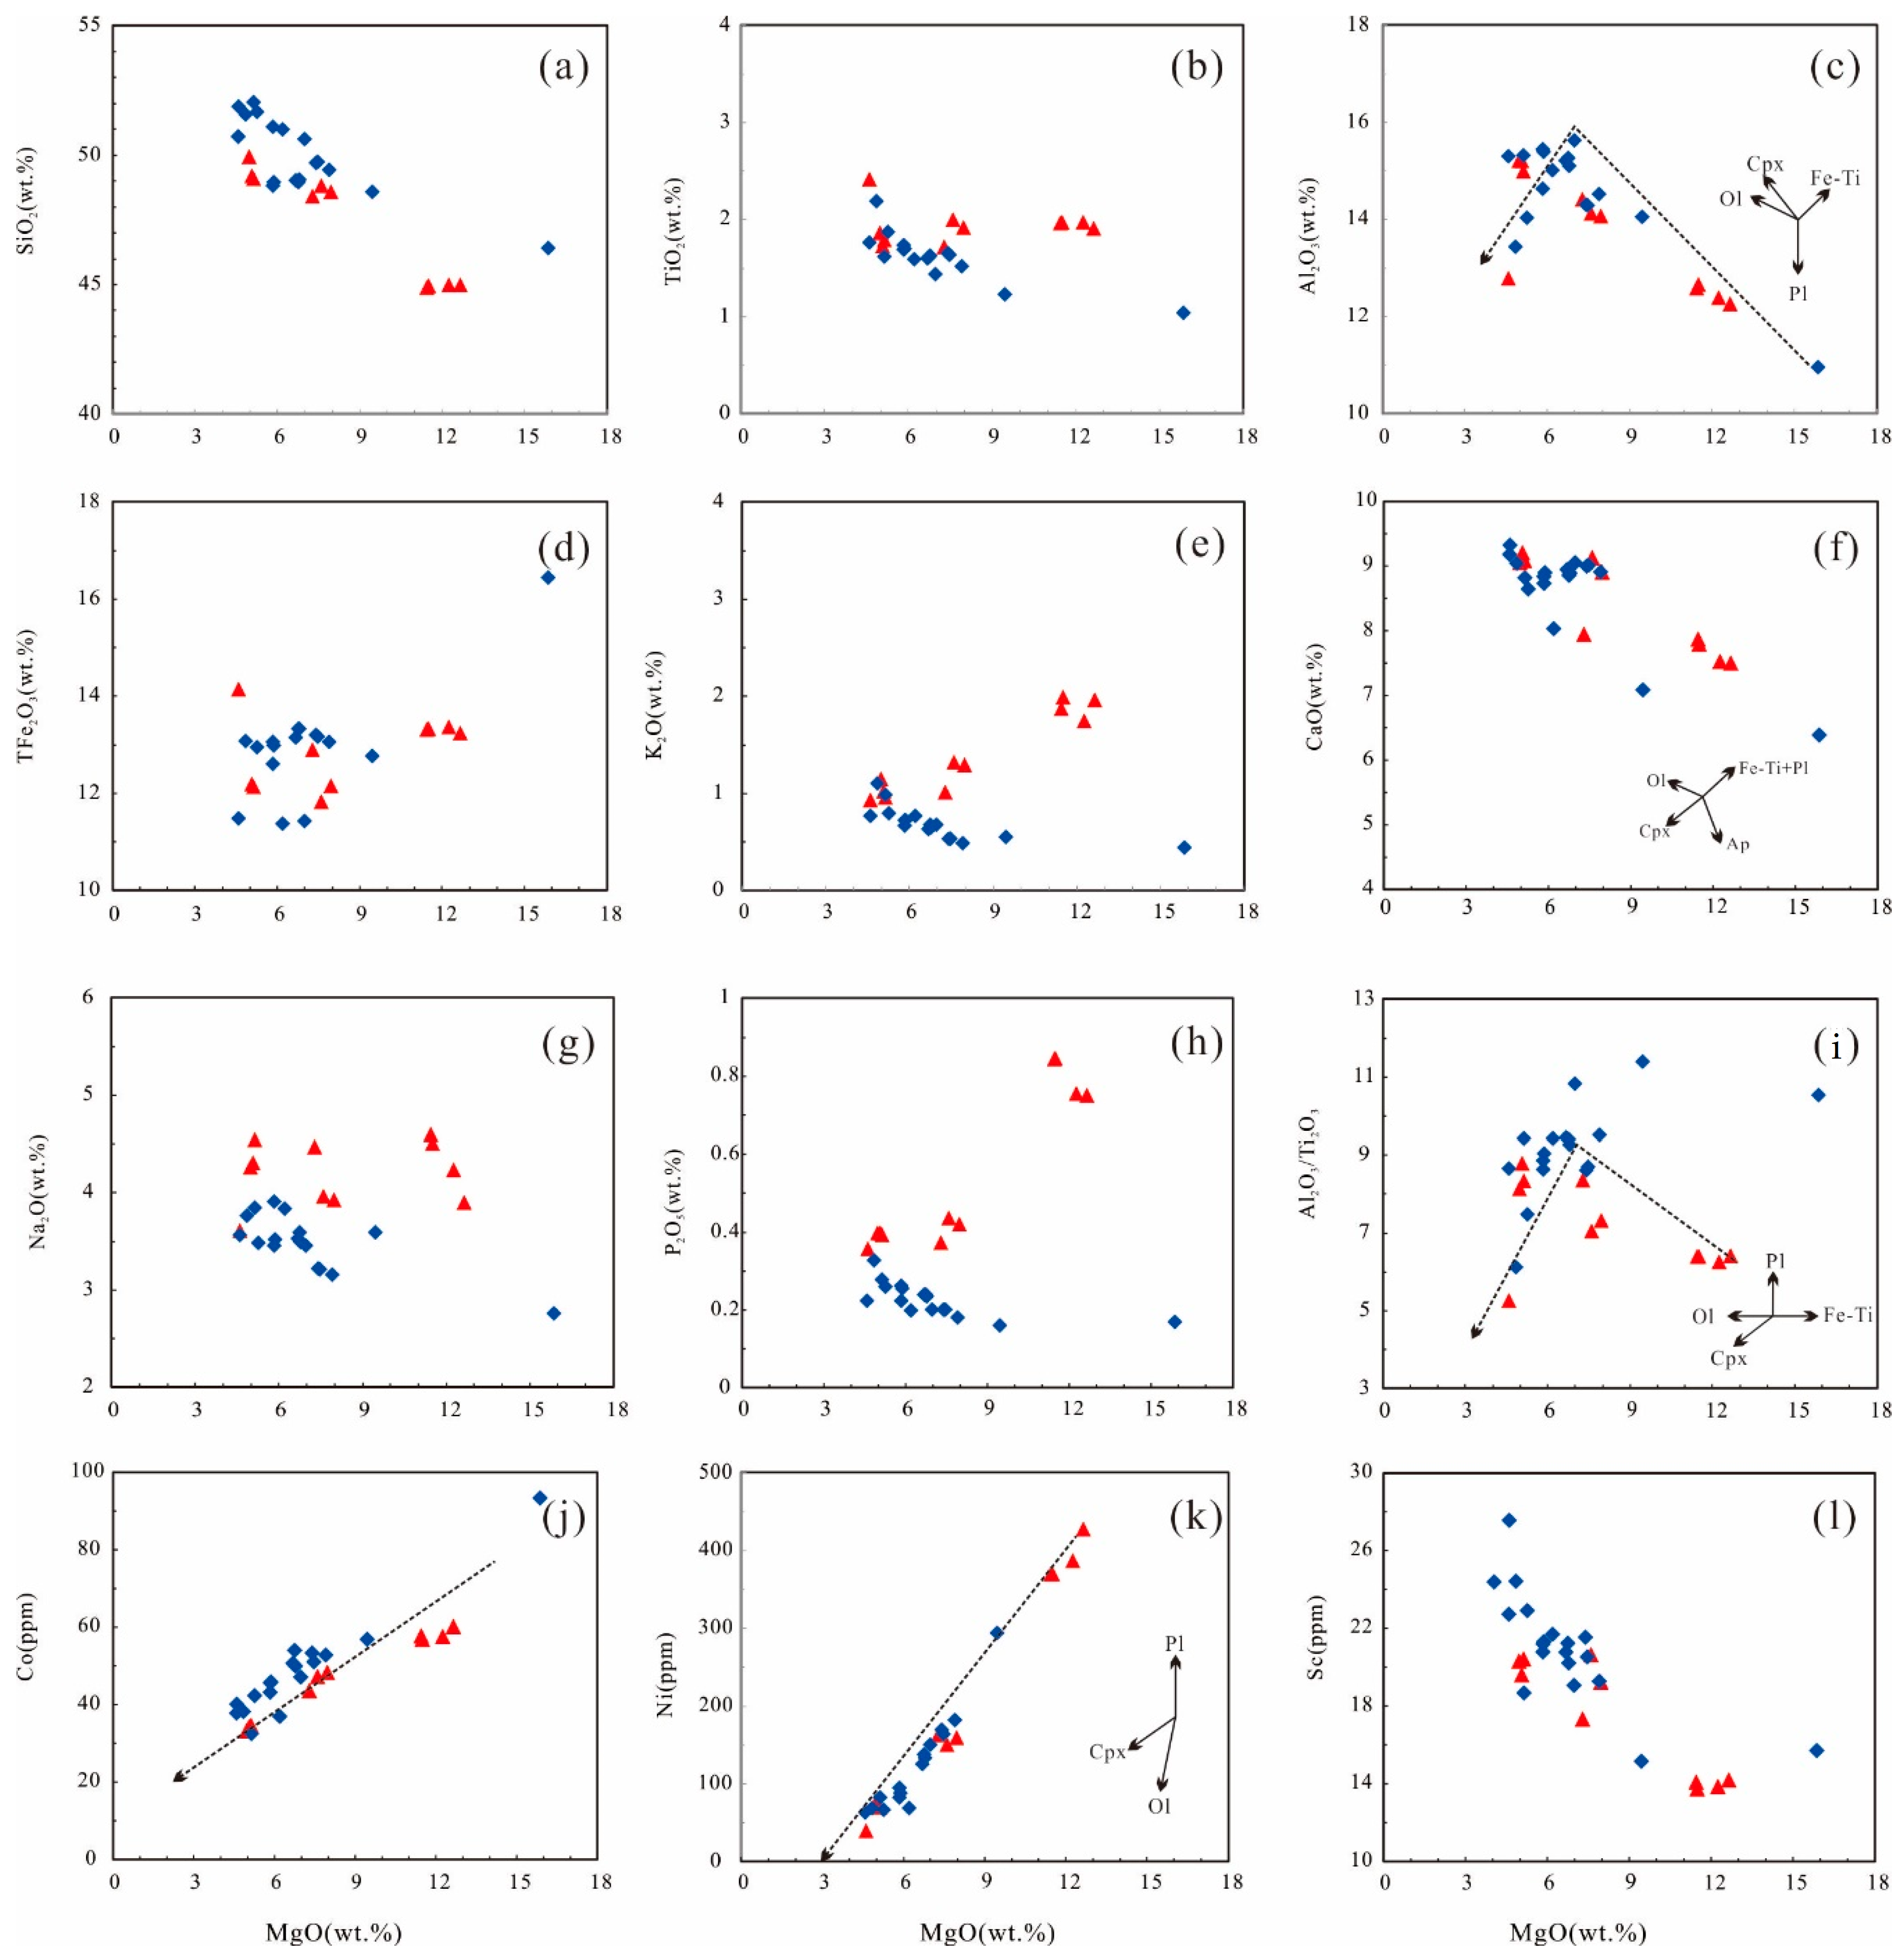
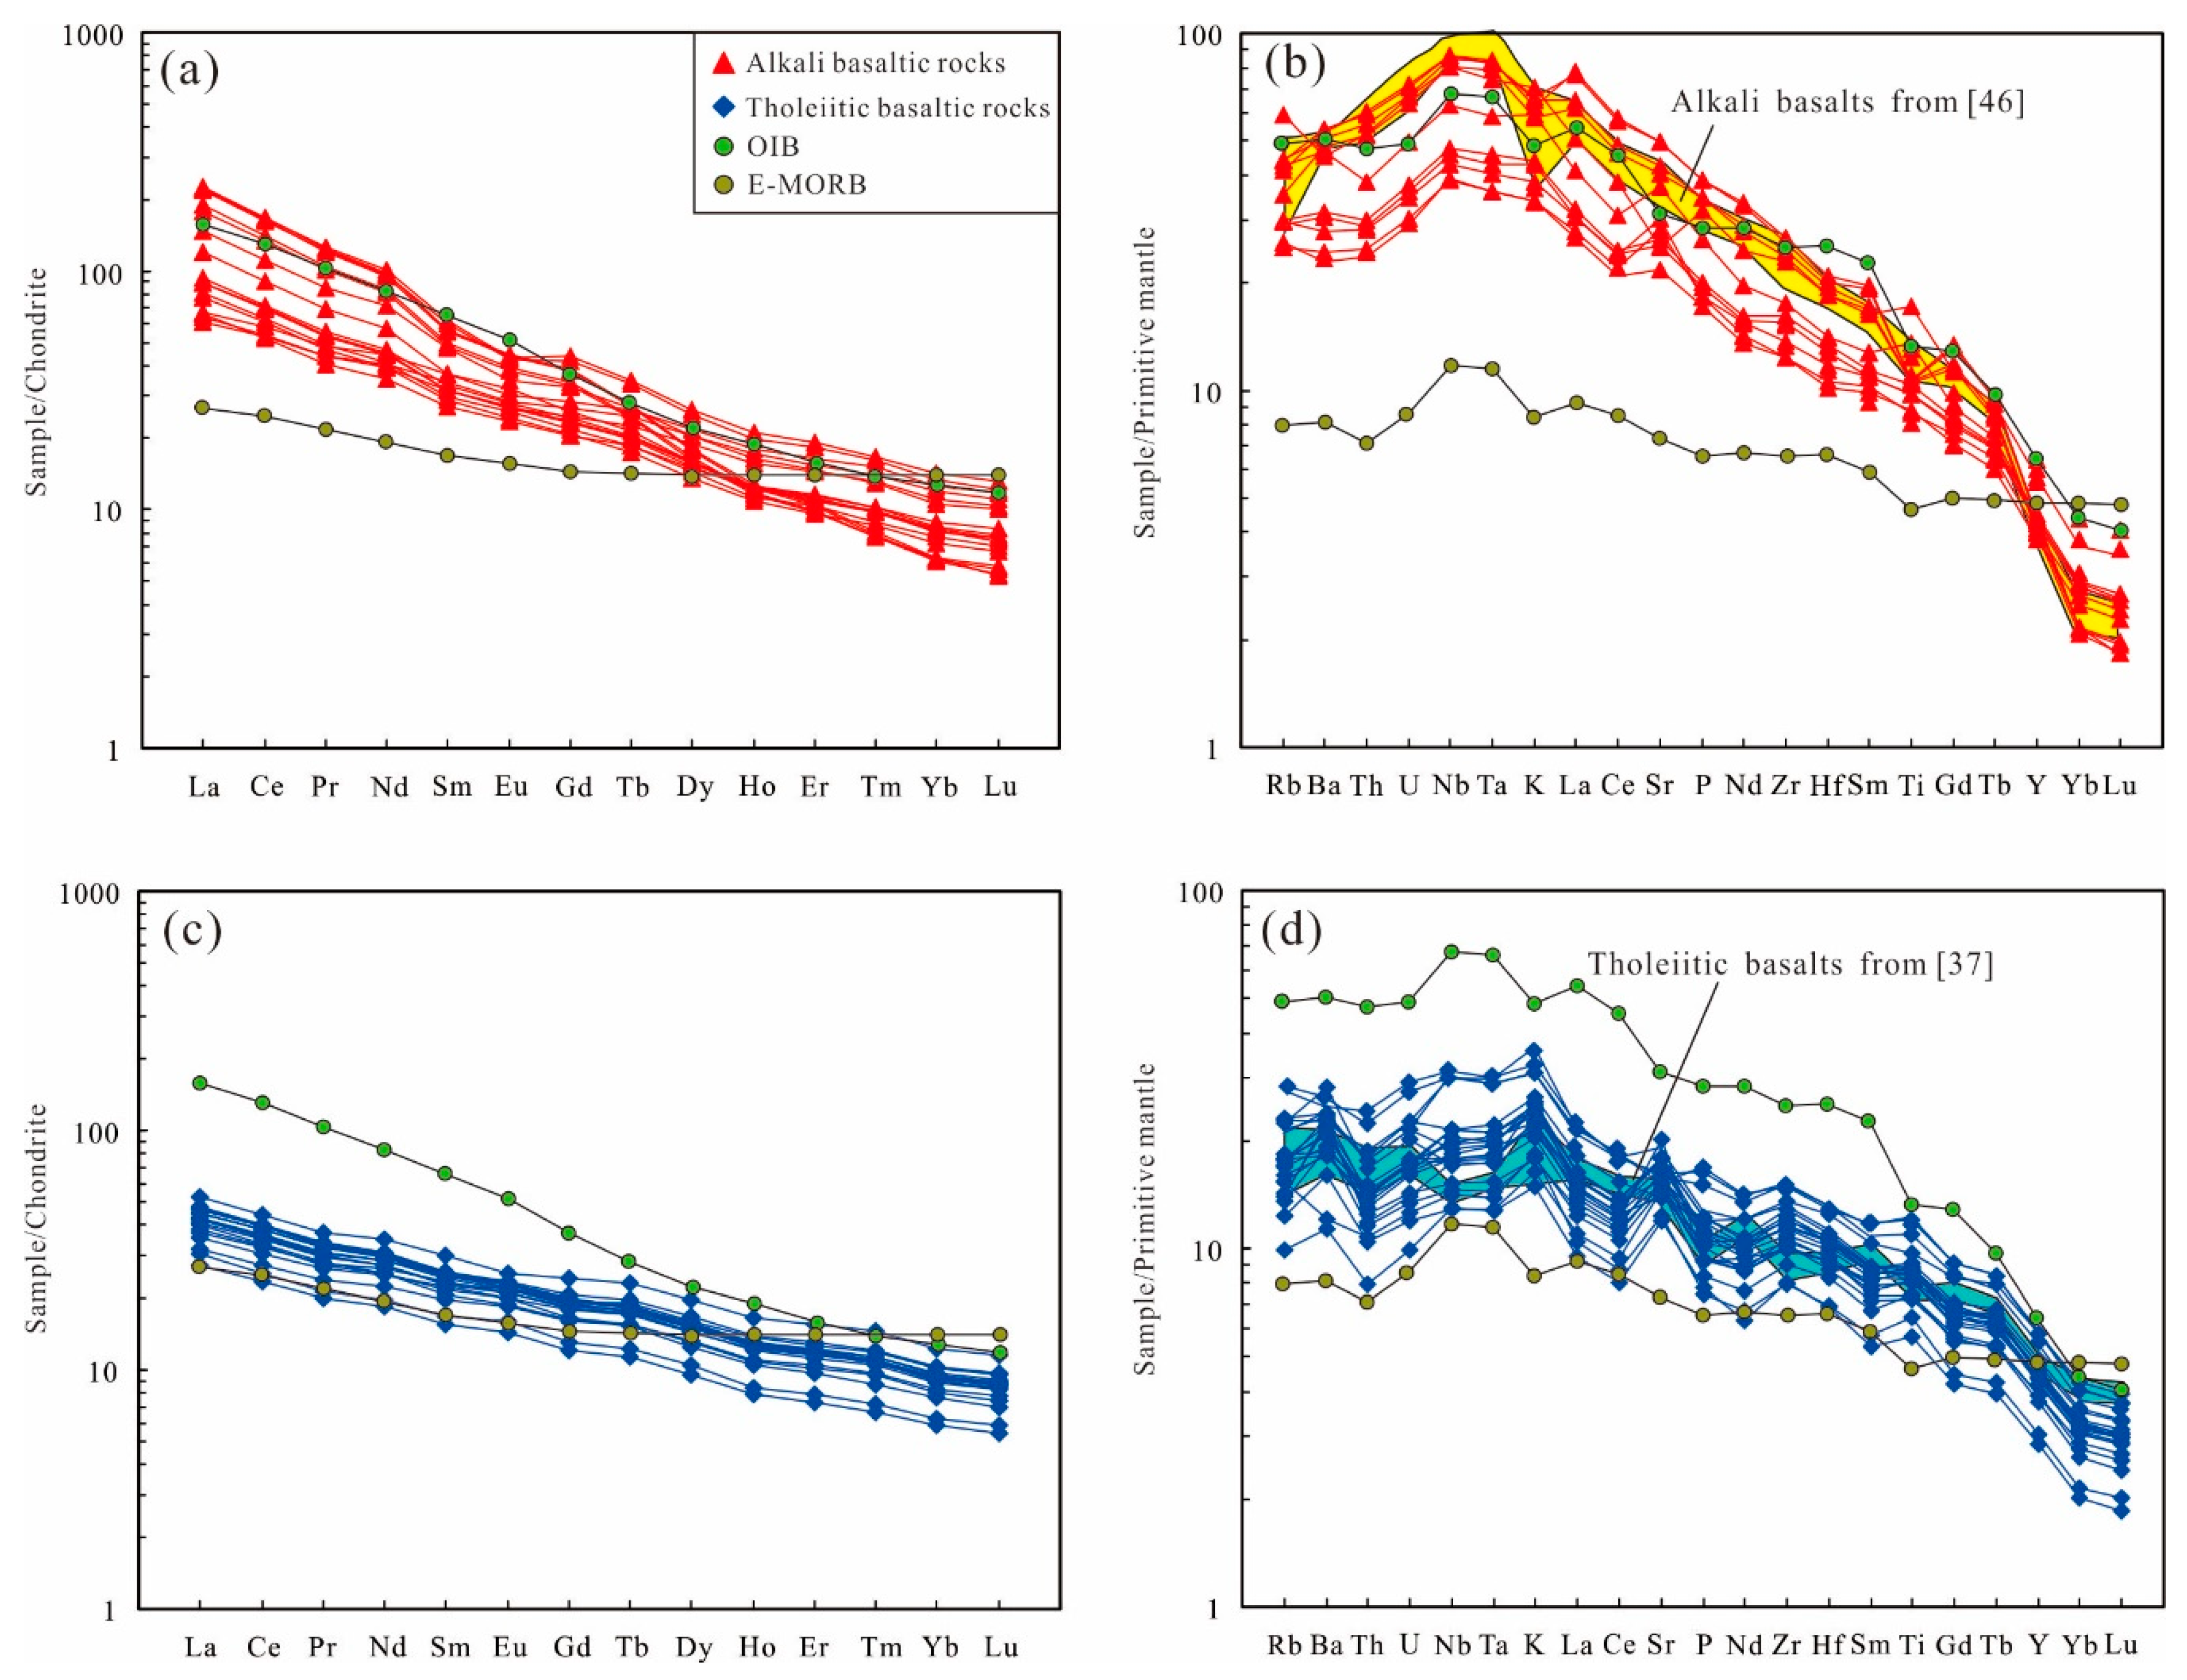
4.2. Major and Trace Elements

Major element data for a total of 27 rock samples are given in Table S2. The studied samples fall into two categories in the SiO2 vs. Na2O+K2O (Figure 6a) and Zr/TiO2 vs. Nb/Y diagrams (Figure 6b): The AB group is predominantly alkali basaltic rocks and the TB group is tholeiitic basaltic rocks (Figure 6d). The CIPW normative calculation further indicates that the AB group is mostly alkali olivine basaltic rocks and basanite, whereas the TB group is predominantly olivine tholeiitic basaltic rocks with minor quartz tholeiitic basalts (Table S2). Both AB and TB groups have high TFe2O3 (9.97–16.46 wt.%) and TiO2 (1.44–2.20 wt.%) contents and high FeOt/(FeOt + MgO) ratios (0.65–0.82), indicating a ferroan nature. These rocks also have higher Na2O contents compared to the Wudalainchi rocks and most of the Keluo-Nuomin samples (Figure 6c). In Harker diagrams (Figure 7), the AB group has higher TiO2, Na2O, K2O, and P2O5 contents than the TB group. The TB group has higher SiO2, Ni, Co, and Sc contents and Al2O3/TiO2 ratios relative to the AB group samples. In general, the increase of Ni and Co contents is positively correlated with the increase of MgO in AB and TB Groups (Figure 7).
Trace element data are presented in Table S2. For comparison, data for Eocene alkali basalts from Shuangliao and tholeiitic diabases from Qianjiadian are also plotted in Figure 8. All samples are enriched in large-ion lithophile elements (LILE) and light rare earth elements (LREEs), with obvious positive Ba and Sr anomalies and negative Th, U, and P anomalies (Figure 8a). In general, the AB group has higher LREE contents (La = 18.42–53.71 ppm) and LREE/HREE ratios ((La/Yb) N = 10.53–35.91) than the TB group (La = 7.52–15.29 ppm, (La/Yb) N = 3.80–7.41). In addition, the samples of AB group show positive Nb–Ta anomalies, which are similar to oceanic island basalt (OIB) (Figure 8b), whereas the TB samples display lower abundances of most trace elements similar to those of enriched mid-oceanic ridge basalt (E-MORB).

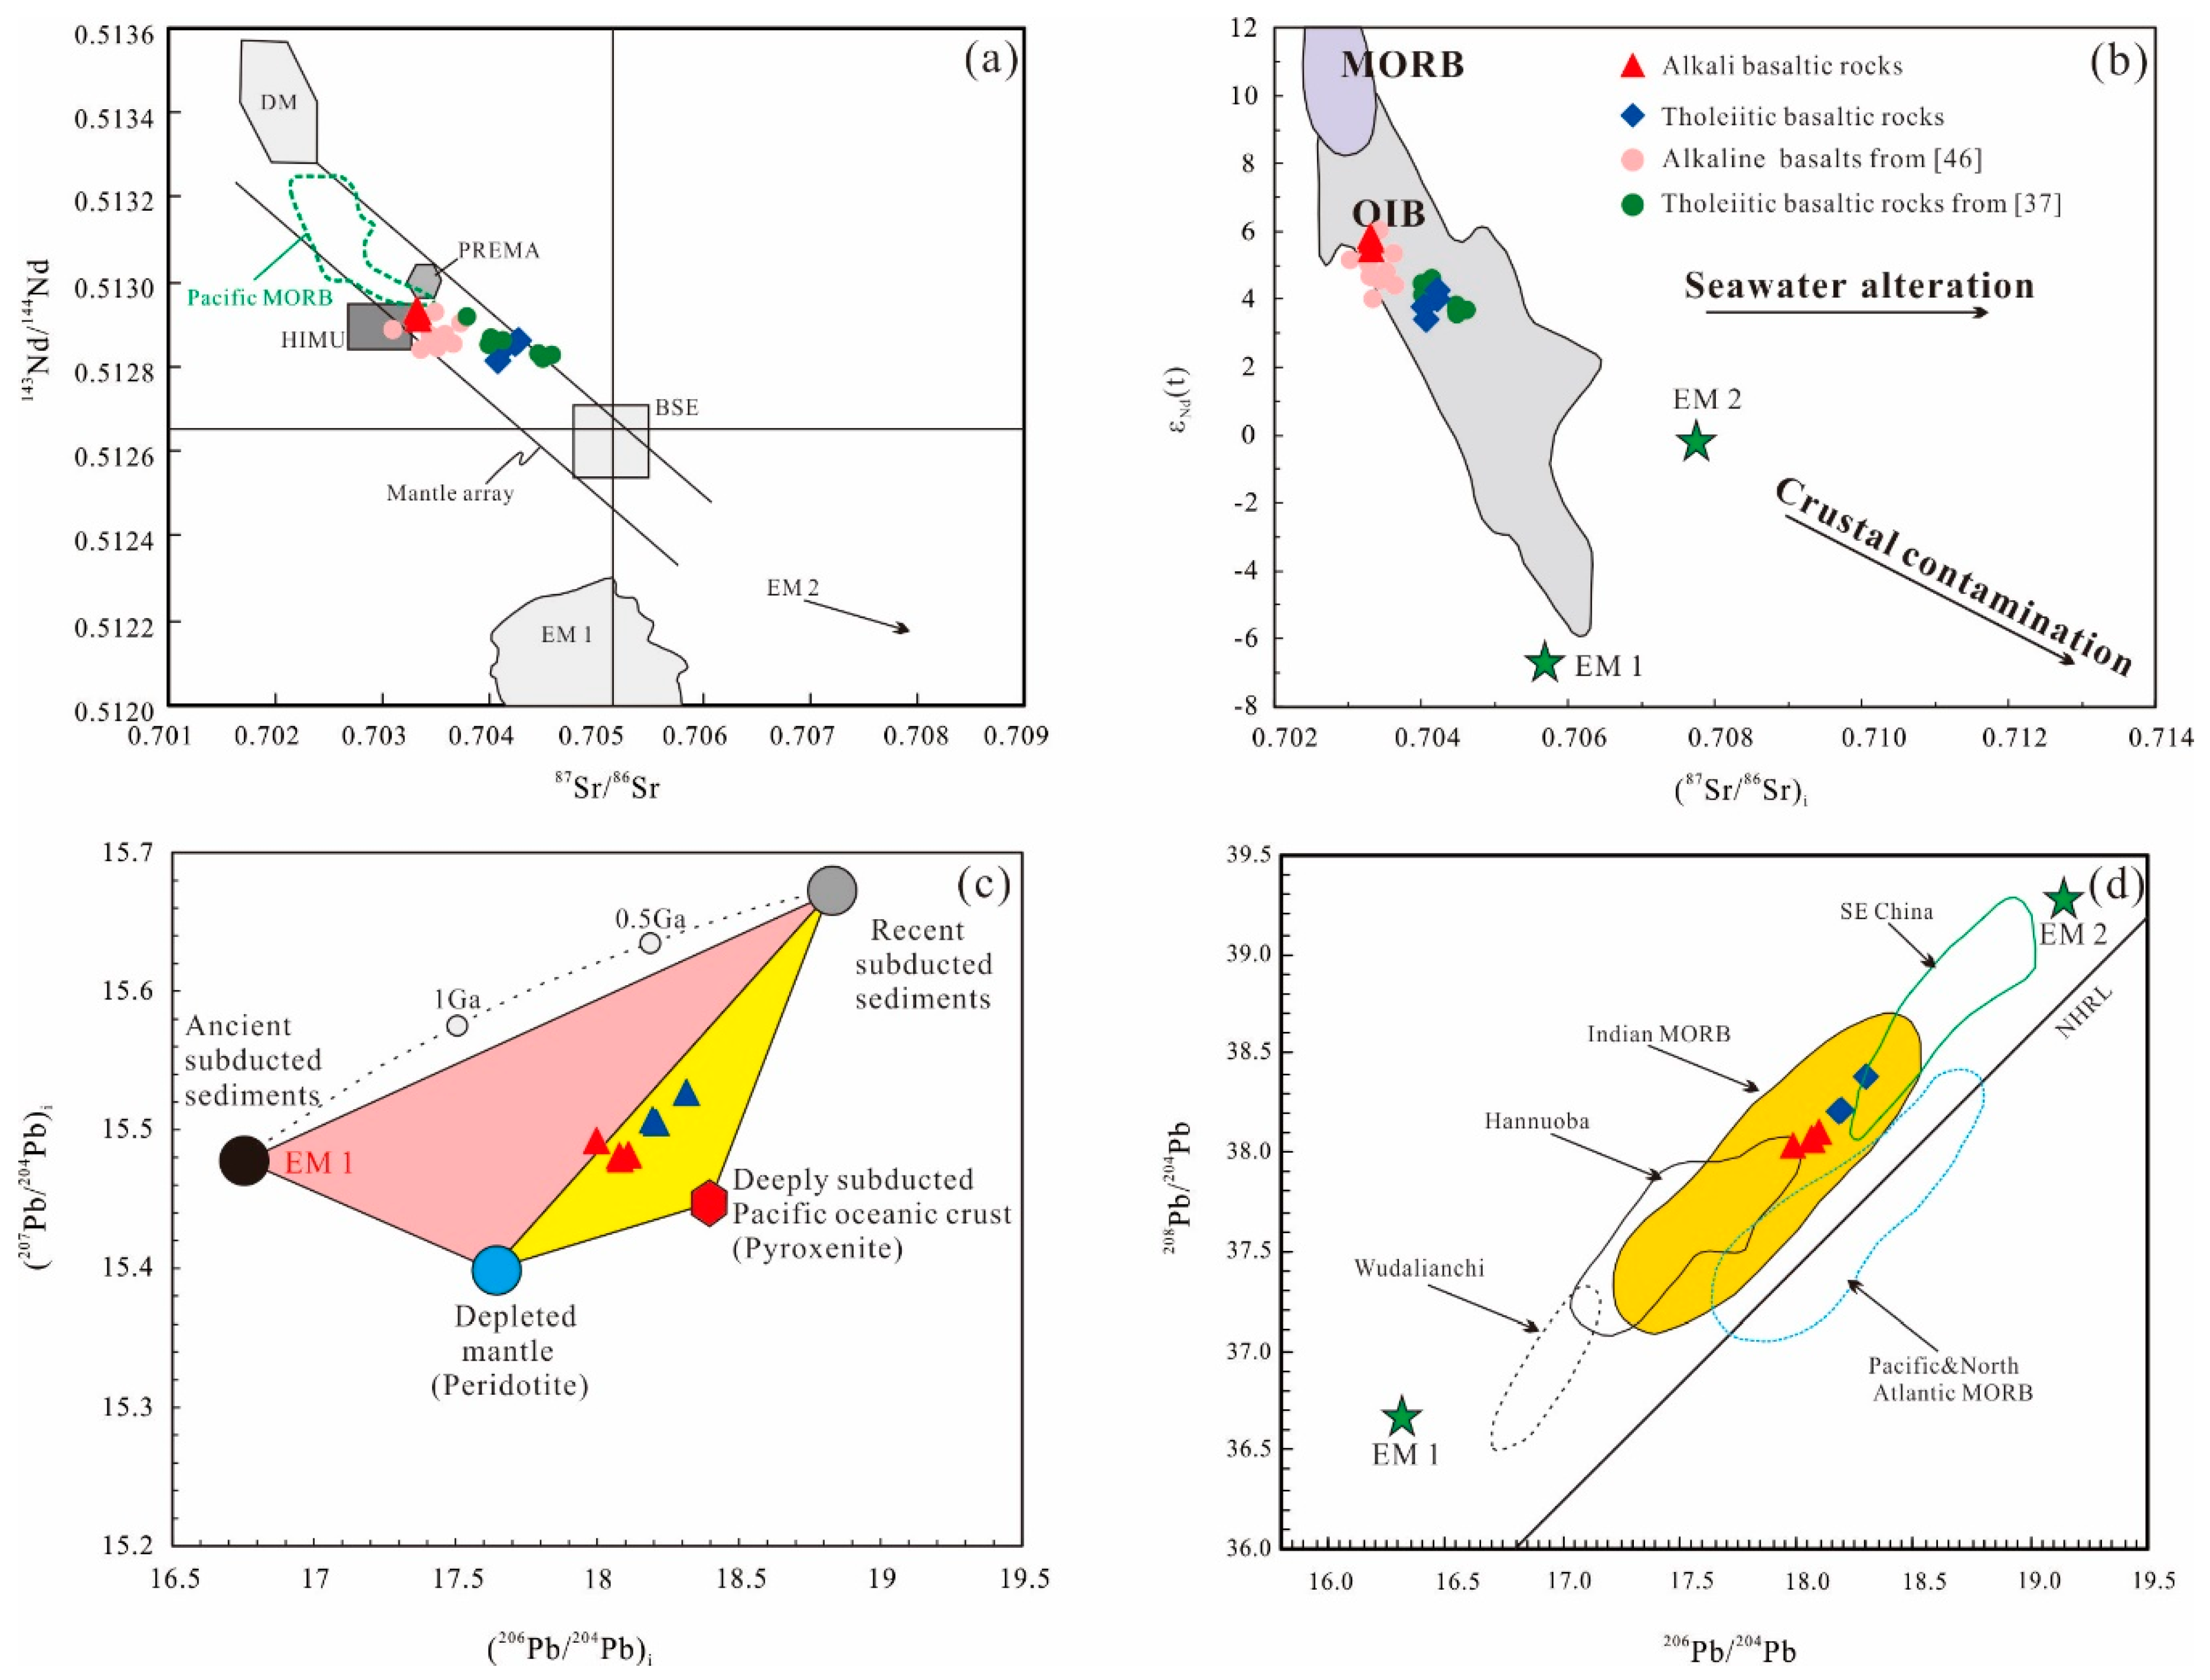
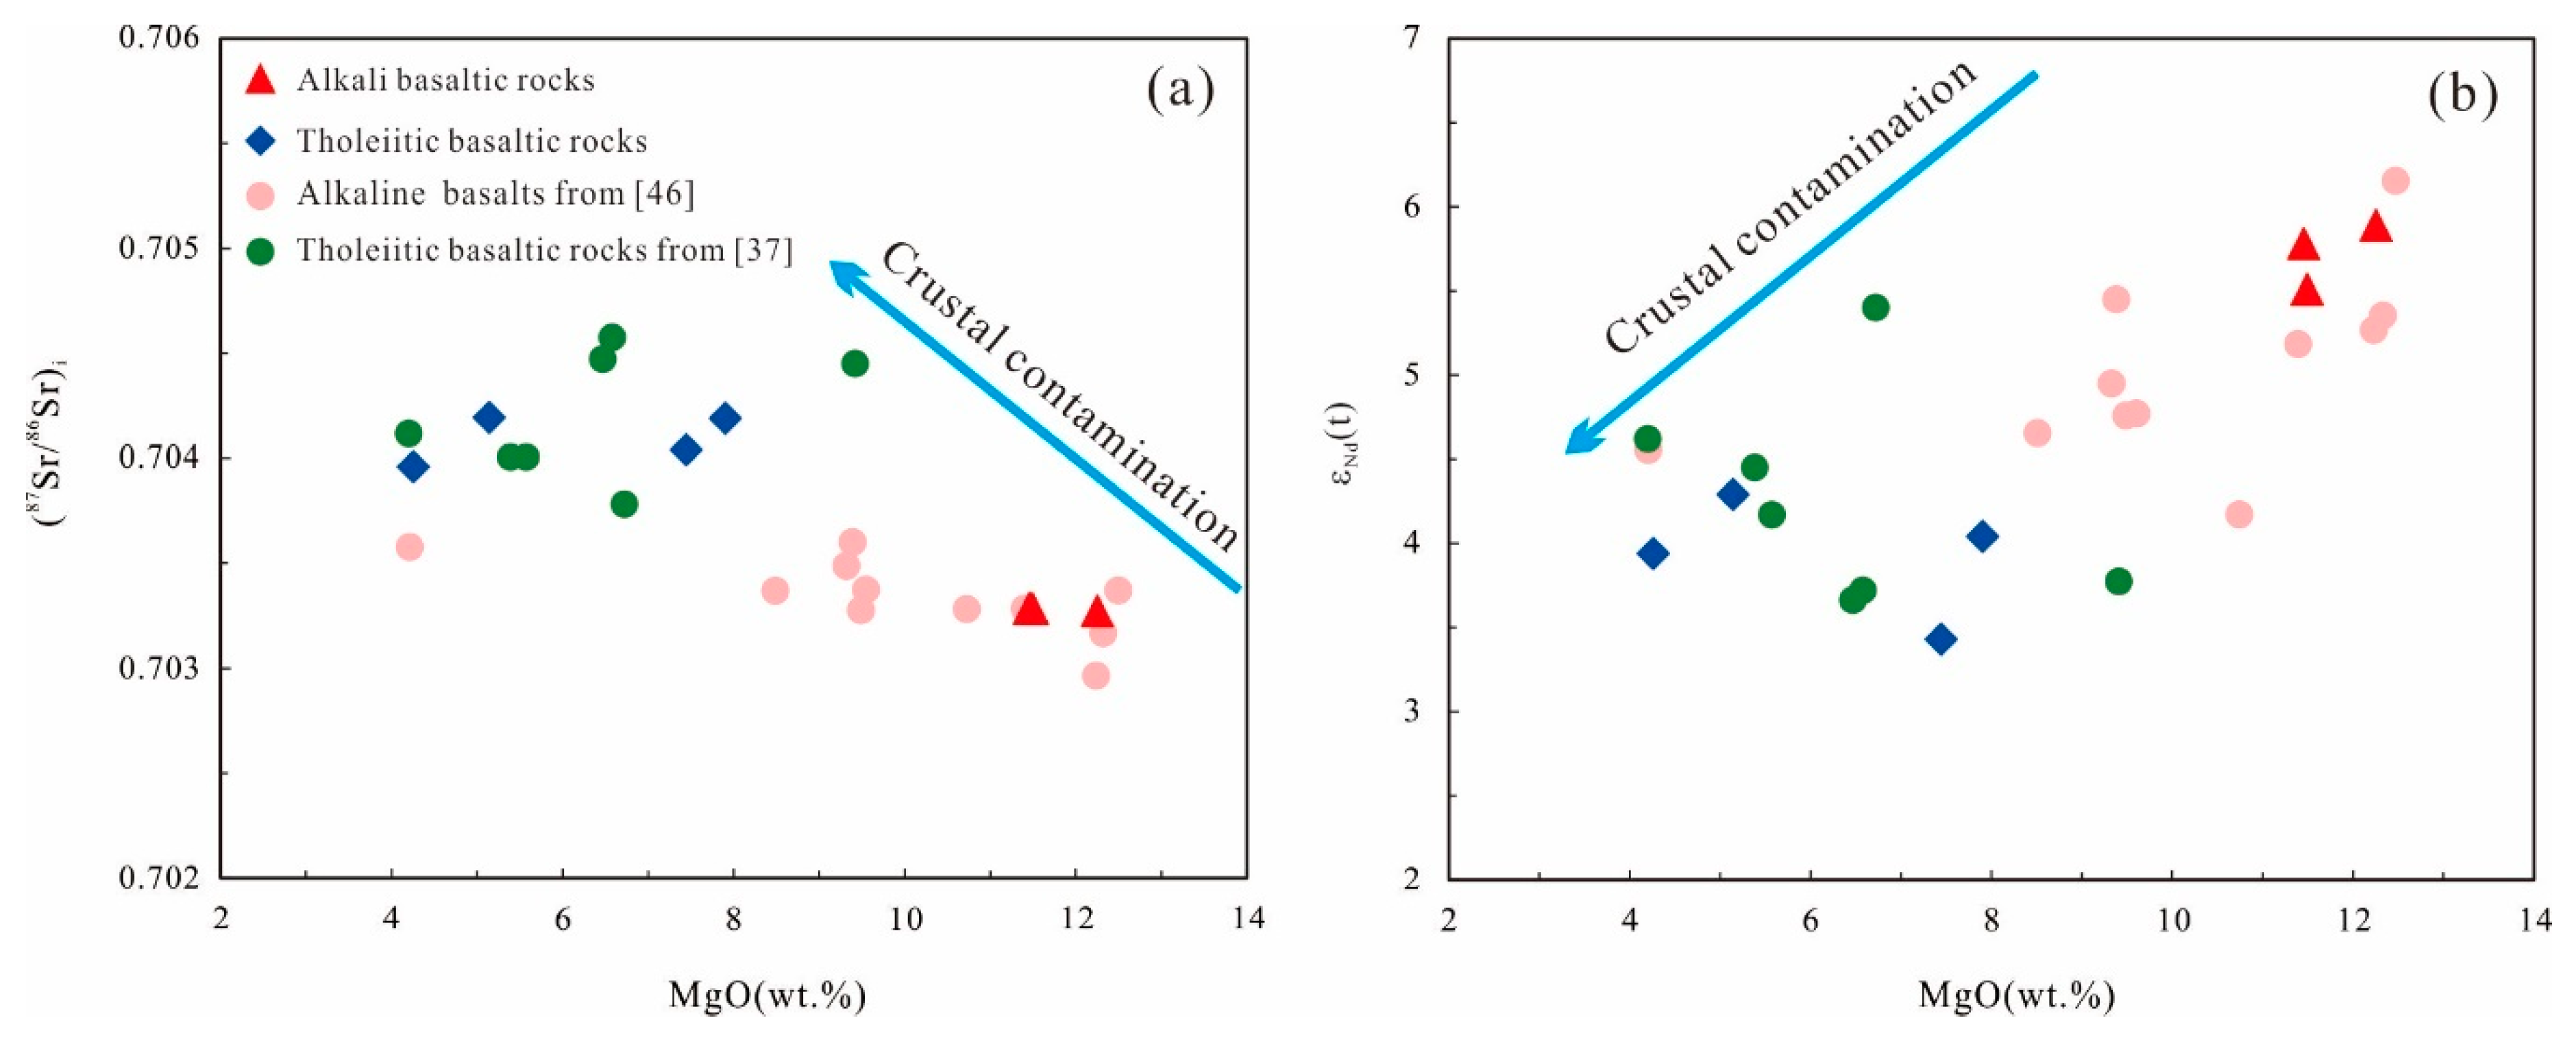
4.3. Sr–Nd–Pb Isotopes

The Sr–Nd–Pb isotope compositions are presented in Table S3. The isotope data of basalts from Hannuoba, Wudalianchi, southeast China, are also plotted for comparison (Figure 9). The Hannuoba and Wudalianchi basalts represent typical indicators of two end members mixing between the depleted mantle (DM) and the enriched mantle 1 (EM1) [50,51] and the basalts from southeast (SE) China record source mixing between DM and EM 2 components [52]. The Qianjiadian mafic rocks exhibit a limited range in Sr-Nd isotopic composition (87Sr/86Sr = 0.7033–0.7043, εNd (t) = 3.47–5.89) and plot to the right of the mantle array in the 143Nd/144Nd vs. 87Sr/86Sr diagram (Figure 9a). This horizontal displacement may reflect the hydrothermal interaction of seawater with oceanic crust [53]. The TB group displays lower εNd (t) (3.47–4.32) and higher (87Sr/86Sr)i (0.7040–0.7042) than AB group (εNd (t) = 5.51–5.89; (87Sr/86Sr)i = 0.7032–0.7033) (Figure 9a,b), indicating more enriched components in their mantle source. The studied samples also exhibit a relatively homogeneous Pb isotopic composition (206Pb/204Pb = 18.13–18.34, 207Pb/204Pb = 15.46–15.50, and 208Pb/204Pb = 38.18–38.58, Table S3). In the 208Pb/204Pb vs. 206Pb/204Pb isotopic correlation diagrams, the samples exhibit higher Pb isotopic ratios than those of Hannuoba and Wudalianchi, but lower than those of Cenozoic basalts in southeast China, and plot close to the region the Cenozoic basalts in Indian MORB (Figure 9d).
Figure 8. Chondrite-normalized REE patterns (a,c) and primitive mantle normalized trace element diagrams (b,d) for the samples from the Qianjiadian region. The values of chondrite and primitive mantle are from Boynton [54] and Sun and McDonough [55], respectively.
Minerals 10 01014 g008
Figure 9. Whole-rock Sr–Nd–Pb isotopic compositions for the Cenozoic Qianjiadian mafic rocks. (a) 87Sr/86Sr vs. 143Nd/144Nd diagram; (b) (87Sr/86Sr)i vs. εNd (t) diagram; (c) 206Pb/204Pb vs. 207Pb/204Pb; (d) 206Pb/204Pb vs. 208Pb/204Pb. DM, depleted mantle; EM-1 and EM-2, enriched mantle-1 and enriched mantle-2; HIMU, mantle with high U/Pb ratio; PREMA, frequently observed prevalent mantle; BSE, bulk silicate Earth; MORB, mid-ocean ridge basalt. The fields of the above mantle reservoirs are from Zindler and Hart (1986) [56]. Pb isotope mixing model is from Kuritani et al. [57]. Fields for the Southeastern (SE) China, Indian Ocean MORB, and Pacific and North Atlantic MORBs are from Chung et al., Barry and Kent (1998), and Zou et al. [52,58,59]. The Northern Hemisphere Reference Line (NHRL) is after Hart [60].
Minerals 10 01014 g009

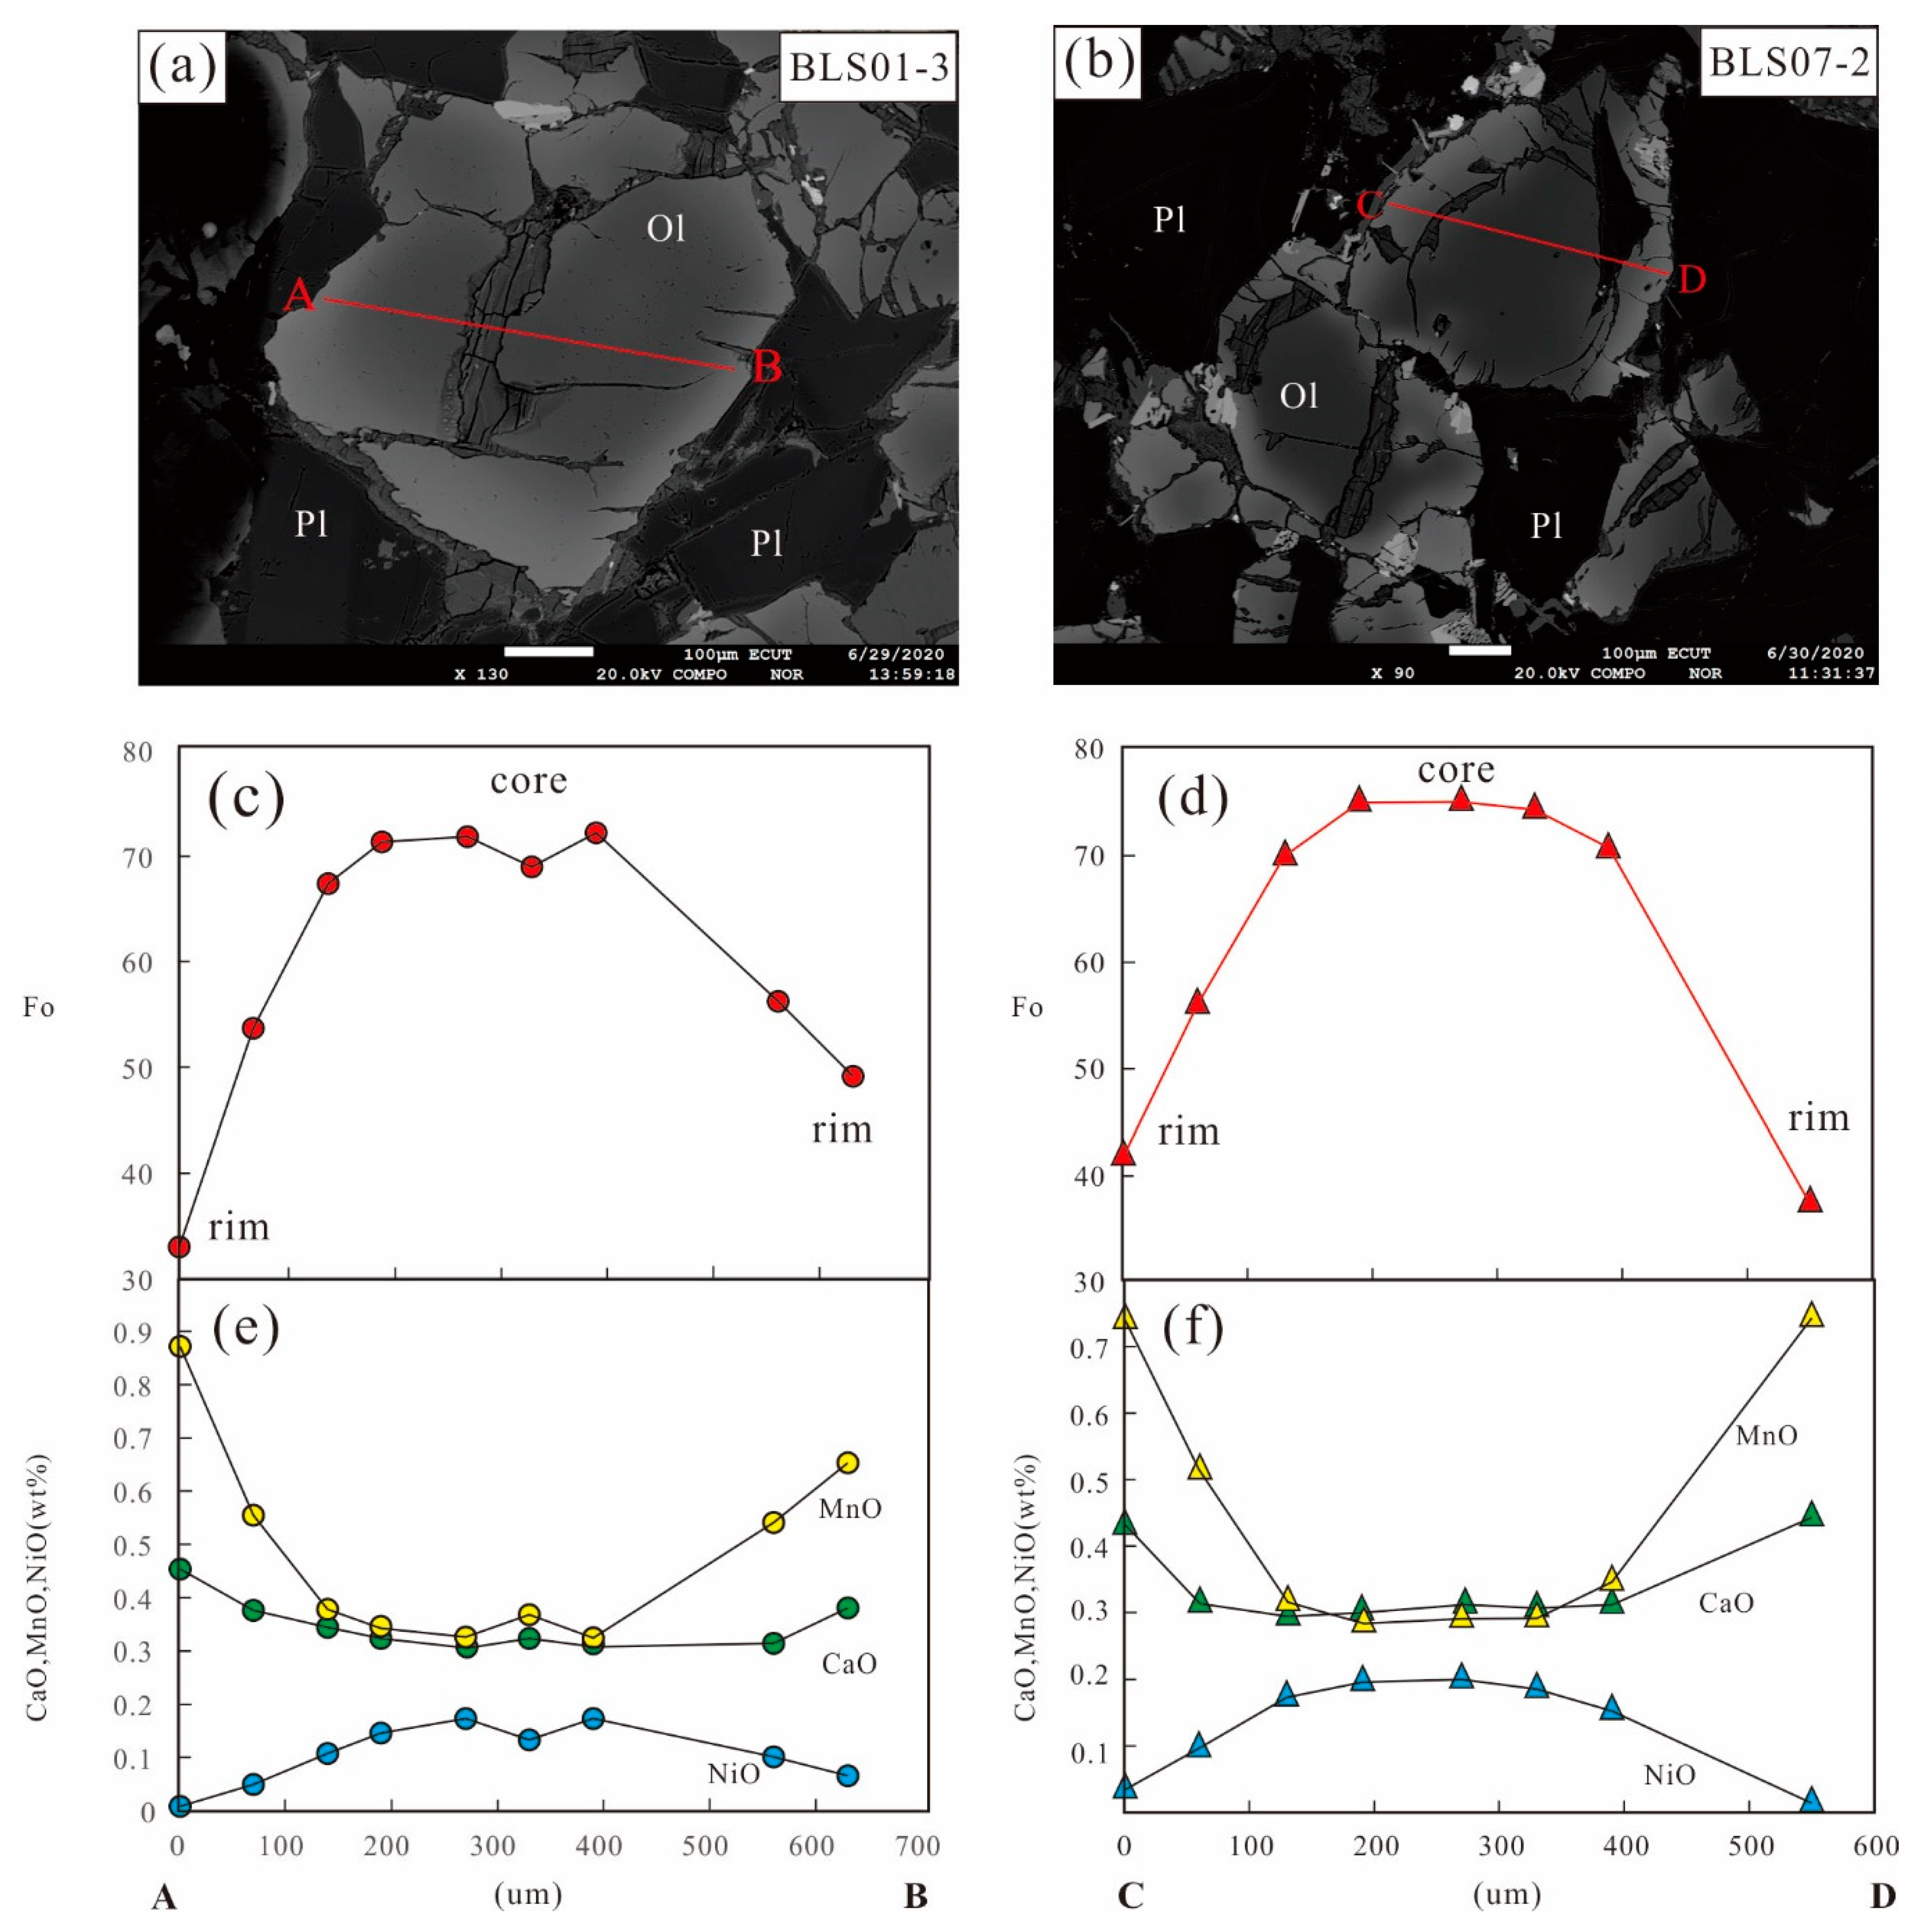
4.4. Mineral Compositions

The chemical compositions of olivine from alkali basaltic rocks (sample BLS01-3) and tholeiitic basaltic rocks (sample BLS07-2) were presented in Table S4 and plotted in Figure 10. The olivine exhibits granular in texture (Figure 10) and is characterized by higher CaO contents (> 0.26 wt.%), but lower NiO (< 0.23 wt.%) and Fo (<75.82) (Figure 11a,b) than the olivine xenocrysts of the peridotite xenoliths entrained from the Shuangliao basalts [61]. These characteristics are similar to magmatic phenocrysts, differing from fragmented mantle-derived xenocrysts.
The zoned olivine phenocrysts from alkali basalts and tholeiitic mafic rocks show consistent variations from core to rim (Figure 10a,b). In general, the rims have relatively lower NiO and Fo and higher CaO, FeO, and MnO contents than the cores (Figure 10c,f), which correspond to light margin and dark interior in BSE images (Figure 10a,b), respectively, indicating the effect of chemical diffusive re-equilibrium between olivine and melt in the process of crystallization [62,63]. We, therefore, favor that only the composition of the cores of olivine phenocrysts can reflect the natural origin of their mantle source.

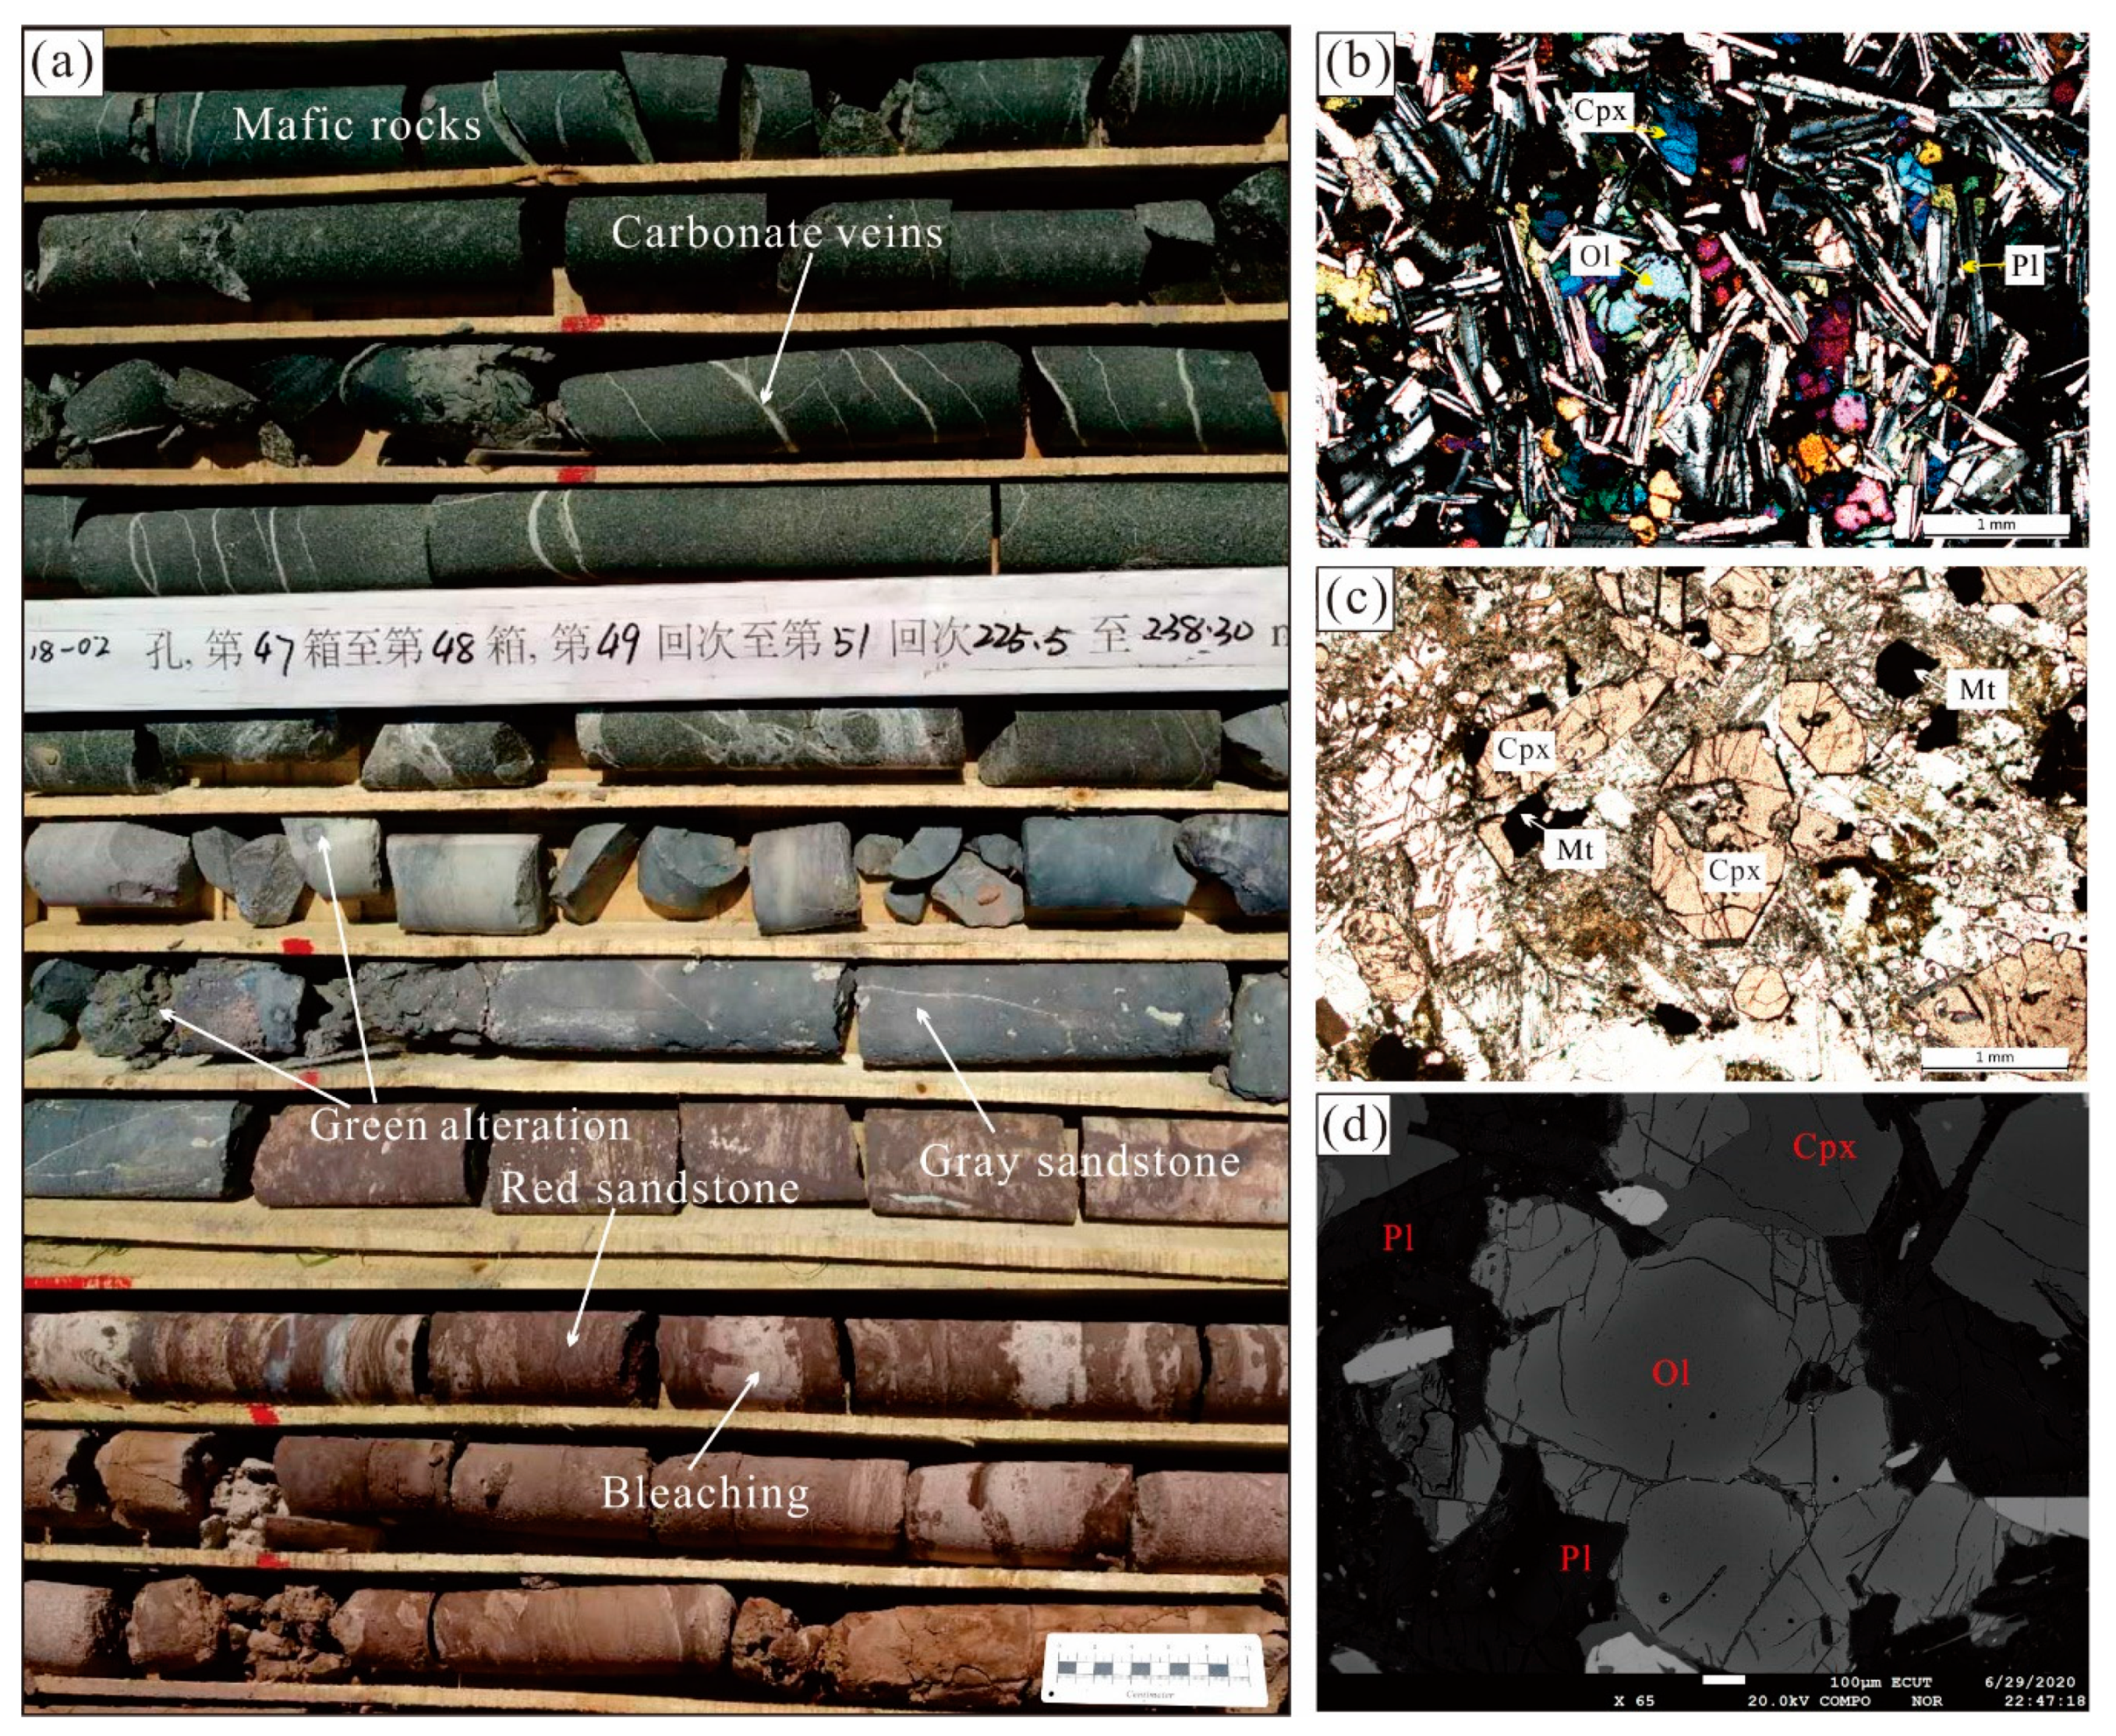
4.5. Characteristics of the Host Sandstones and Secondary Alteration Related to Mafic Intrusions

The sediments of the Yaojia Formation mainly consist of sandy conglomerate, very coarse- to fine-grained sands, siltstone, and mudstone. Volumetrically, sandy lithofacies predominate the stratigraphic column (Figure 2b). Sandy facies show a large grain-size distribution from very coarse to very fine sands and display constant stratigraphic occurrence of phytoclasts within primary reduced grey lithofacies [27]. The sandstones hosting the U mineralization in the Qianjiadian area are globally of arkosic sandstone-to-sandstone composition and are mainly grain-supported, except for fine-grained facies or altered lithologies, which are more matrix-supported or show secondary cementation. The primary reduced host sandstones are mainly composed of lithic fragments and individual detrital minerals such as quartz, K-feldspar, plagioclase, biotite, muscovite, and chlorite. In the Qianjiadian area, the U mineralization occurs at the redox interface between the primary reduced and the secondary oxidized sandstones (Figure 2b) or close to a secondary reduced green-white zone [18,27,31] related to mafic rock intrusions that are spatially distributed along the redox boundary (Figure 1c and Figure 2b). Besides, the content of U from Yaojia Formation sandstones is inversely correlated with REEs’ content [17]. Compared with the sandstones far from the mafic intrusions, the sandstones near the mafic intrusions are obviously depleted in REEs [17]. Regionally, sediments of the Yaojia Formation were deposited under a hot and dry climate; hence, resulting in the primary oxidation of part of these sediments (Figure 3a) [64]. Then, the sediments of the Yaojia Formation experienced a secondary reduction related to mafic intrusions, which are characterized by a pervasive green alteration in permeable sandstone (e.g., as shown in [27]) and the bleaching of primary oxidized lithologies (e.g., white sandstone in Figure 3a). The green alteration occurring within the alteration halo of these mafic rocks is mainly characterized by pore filling of the host sandstone with newly formed chlorite, epidote, and carbonate [27]. However, the spatial extension of this secondary reduction remains relatively limited and mostly restricted to the vicinity of the mafic rocks.
Figure 11. The composition variation of olivines from the Qianjaidian mafic rocks. (a) The mantle olivine array and fractional crystallization trend are from [65]. (b) The dashed line separates the composition of magmatic and xenocrystic olivine on the basis of CaO [66]. The fields and lines in plots (c,d) are from [67]. All plots concur in a dominant pyroxenite source for the Qianjaidian mafic rocks.
Minerals 10 01014 g011

5. Discussion

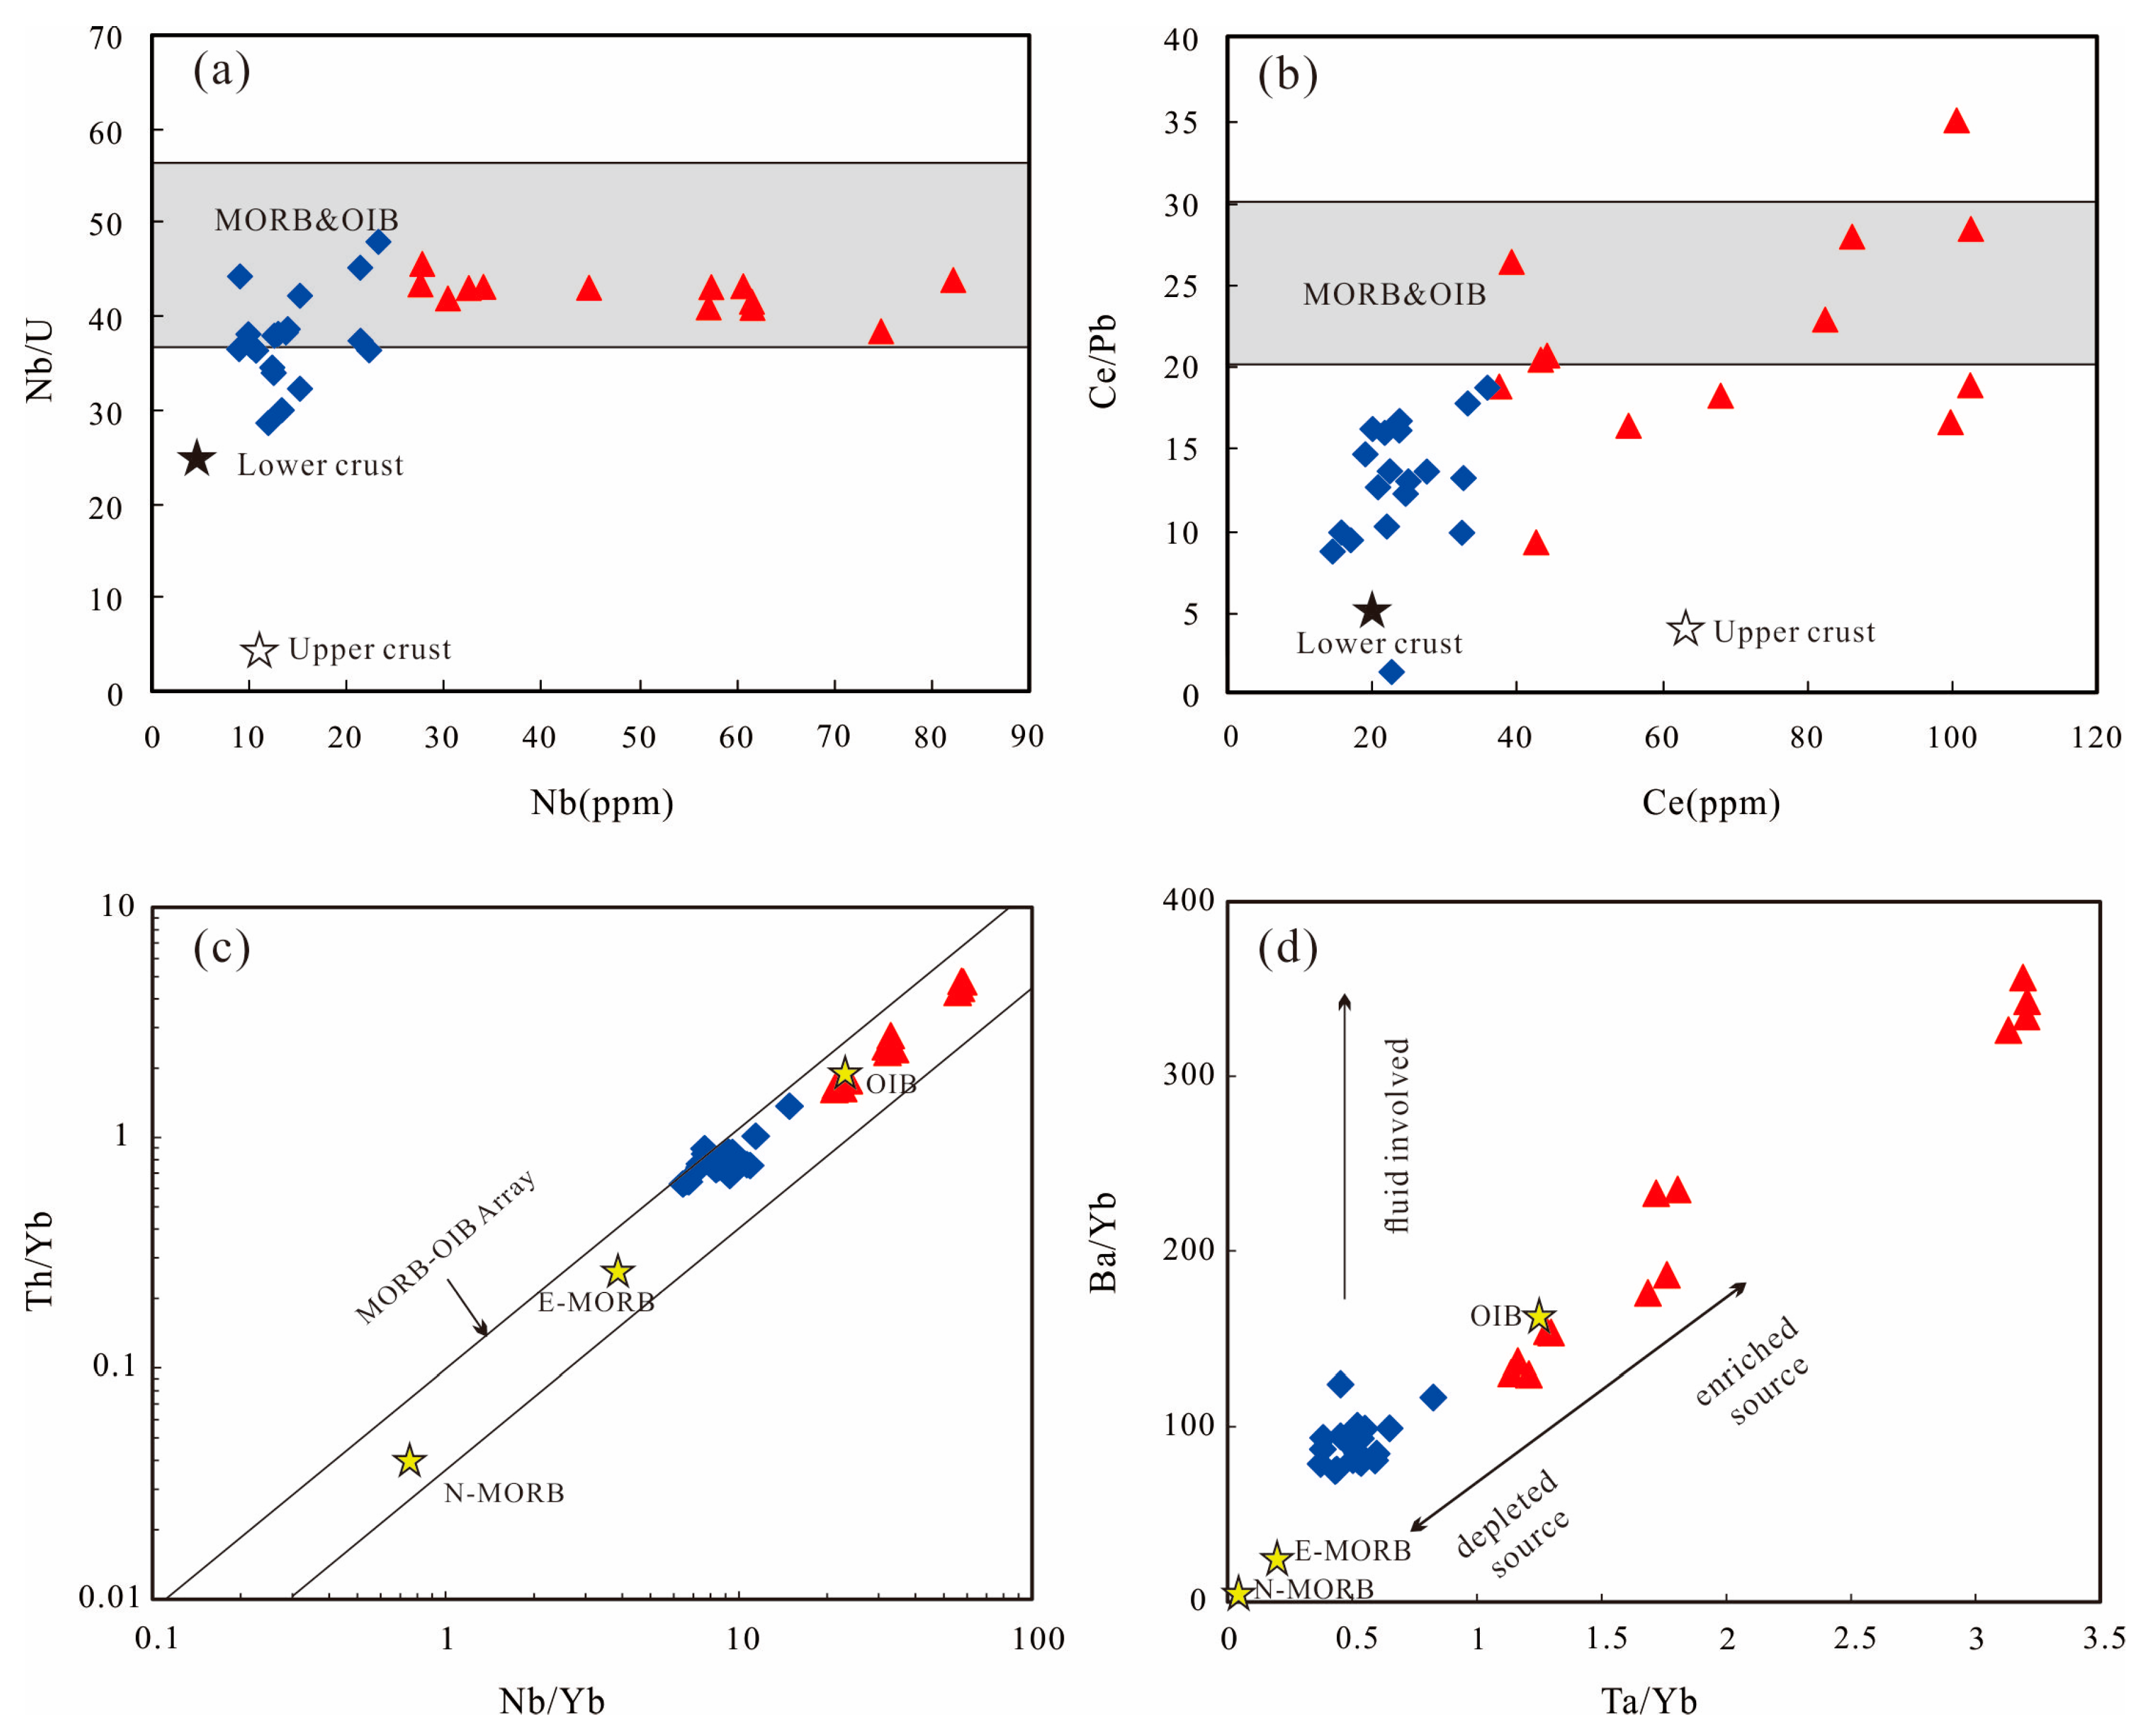
5.1. Crystal Fractionation and Crustal Contamination

Both fractional crystallization and crustal contamination could have significantly modified the composition of basalt and, thus, hamper our interpretation of the mantle source. The existence of inherited zircon grains (Figure 5d) suggests that a crustal assimilation occurred during magma ascent or emplacement. However, most mafic rocks have relatively low SiO2 and high MgO contents (Table S2). In the 87Sr/86Sr and εNd (t) vs. MgO diagrams (Figure 12), no clear linear relationship is observed, indicating insignificant crustal contamination was involved in the mantle source for the AB and TB group.
The low and variable Ni content (63.45–547 ppm) and Mg# values (42.58–65.86) (Table S2), indicating the basaltic samples, have suffered variable degrees of fractional crystallization (Figure 7). All samples show positive correlations of Ni and Co vs. MgO, indicating fractional olivine crystallization (Figure 7j,k). This is consistent with co-variations of NiO with Fo contents in the olivine phenocrysts (Figure 11a). Both AB and TB groups show no obvious Eu anomalies (δEu = 0.81–1.04), indicating that plagioclase fractionation was insignificant. The positive correlation between CaO and MgO content when MgO ≥ 7.0 wt.% and negative linear relation of CaO vs. MgO at MgO < 7.0 wt.% (Figure 7f,i) indicates that olivine was a major crystallizing phase at MgO ≥ 7.0 wt.% but that clinopyroxene started to fractionate at MgO < 7.0 wt.%.

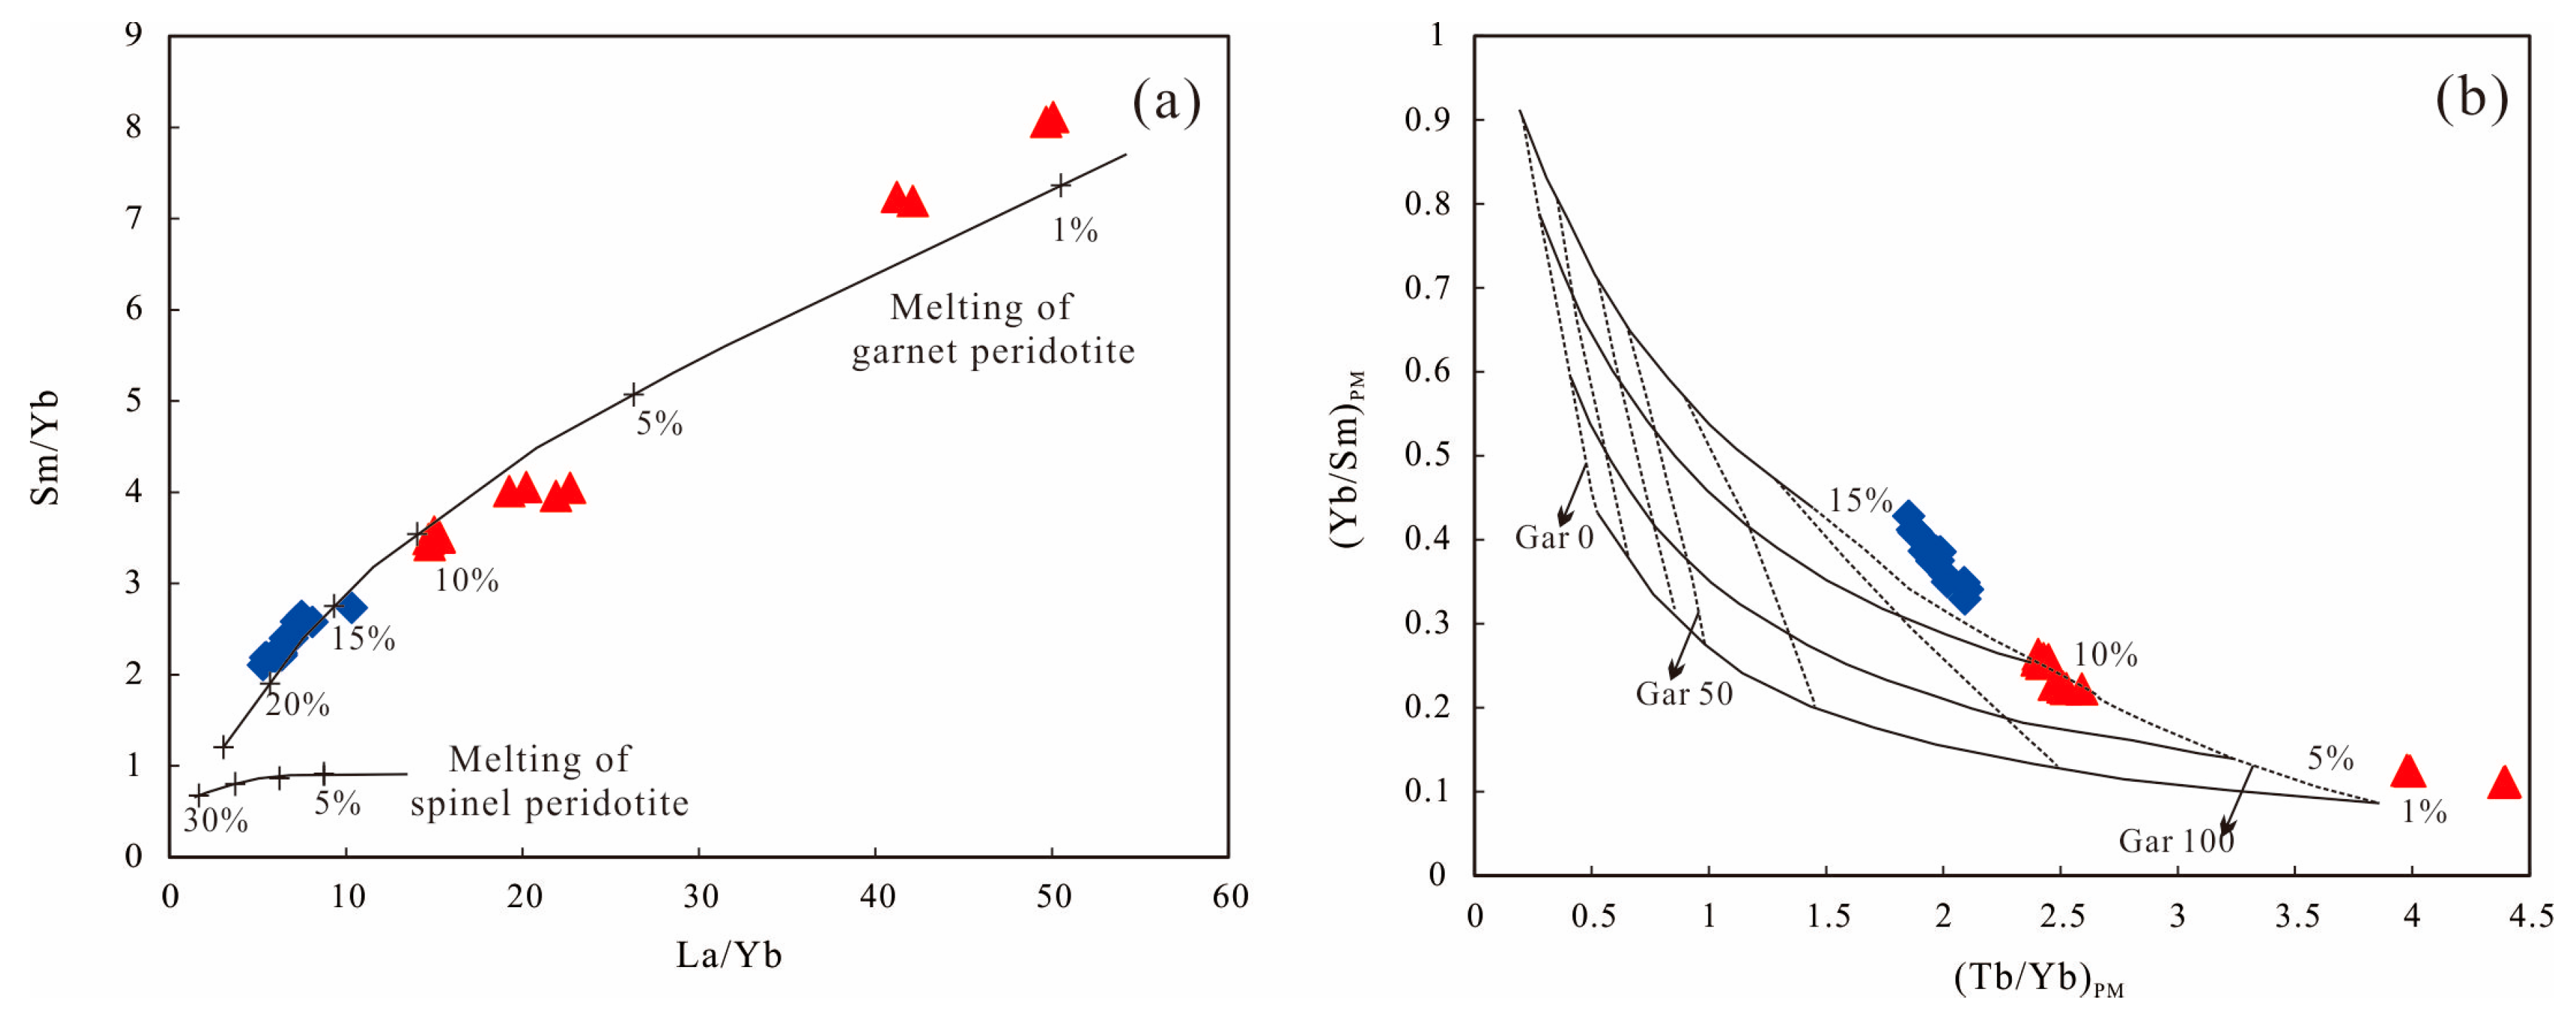
5.2. Mantle Source of the Qianjiadian Mafic Rocks

Continental flood basalts are widely considered as mantle derived. However, it is still unclear whether they are generated from metasomatized lithospheric mantle or partial melting of asthenospheric mantle [68]. In the Sr-Nd diagram (Figure 9a,b), the Qianjiadian mafic rocks have lower 87Sr/86Sr and higher 143Nd/144Nd ratios than the bulk silicate Earth, indicating a relatively depleted asthenospheric source. Furthermore, the samples from Qianjiadian area are characterized by positive Nb and Ta anomalies and high Nb/La (1.15–1.55), Nb/U (23.0–45.6), and Ce/Pb (3.93–34.9) ratios (those with low Ce/Pb sample may reflect fluid mobile element Pb was affected by post-magmatic processes), with OIB compositional signature (Figure 13a,b), providing another evidence of an asthenospheric origin [69].
However, the enrichment in incompatible elements such as LILEs and LREEs strongly reflecting a fertile composition have been involved in their mantle source. Moreover, Nb/Yb and Ta/Nb ratios overlap with the OIB field and are obviously different from that of MORB (Figure 13c,d). Hence, an additional process must be taken into account for the chemical variation of the Qianjiadian mafic rocks.
Ancient subducted continental sediments in the mantle transition zone (MTZ) may comprise K-hollandite with low 238U/204Pb value and can eventually evolve to EM 1-type with low 206Pb/204Pb after longtime (> 1.5 Ga) separation [73,74], which can be considered as the EM 1 component captured by basaltic magmas in eastern China [75]. However, high 206Pb/204Pb for the Qianjiadian mafic rocks cannot be the result of mixing between DM and EM 1 end members (Figure 9c,d). We propose that components of young subducting sediments with high 206Pb/204Pb may have been recycled into their mantle source because recent subducting sediments (including those from the Japanese island arc system) have pronounced high radiogenic 206Pb/204Pb (18.459–19.452) [76].
The cores of olivine phenocrysts both in the AB and TB group have higher Fe contents but lower Mn/Fe and Ca/Fe ratios than those crystallizing from peridotite melts, suggesting pyroxenite in their mantle source (Figure 11c,d). The low δ26Mg anomaly and low δ18O values of the clinopyroxene phenocrysts of Cenozoic continental basalts from the nearby Shuangliao indicate the contribution of water-rich sedimentary carbonate recycled into the upper mantle [77,78]. Recent seismic tomography studies also suggest a stagnant oceanic slab in the MTZ under eastern China [79,80], which can be the result of subduction of the Pacific plate. Some scholars even propose that pyroxenite was formed through reaction of the mantle peridotite with the carbonate-rich melts derived from the subducting oceanic crust [81].
As a whole, recent subducted slab-derived sediments may have an effect on the high radiogenic 206Pb/204Pb of the Qianjiadian mafic rocks, which can also be indicated by significant coherence between the mafic rocks and the triangle field determined by Pacific oceanic crust (silica-deficient pyroxenite), depleted mantle (peridotite), and recent subducted sediments (Figure 9c).

5.3. Tectono-Magmatic Significance

The Early Cenozoic magmatic events involved both alkaline and tholeiitic magmatism (AB group and TB group). However, the genetic relationship between this alkaline and tholeiitic magmatism is unclear; for example, it is unclear whether the compositional difference for AB and TB group is the results of crystallization differentiation, variable melting conditions from a similar source, or formed independently.
The AB group displays major and trace element composition different from those of the TB group, especially the lower abundances of most trace elements, such as Rb, Ba, Nb, Ta, K, and Ti of TB group in the primitive mantle-normalized spider diagrams (Figure 8b,d). These features likely indicate these two groups originated from independent sources. However, all the studied samples exhibit a limited range in Sr-Nd isotopic composition (Figure 9) regardless of their petrographic type. Therefore, the analyzed mafic rocks can be regarded as cogenetic, derived from a similar mantle source. The higher total REE contents of AB group than TB group argue against the viewpoint that variable degrees of fractional crystallization caused the compositional differences between the two groups. Therefore, different melting conditions are likely responsible for the compositional variation between AB and TB groups.
It is widely recognized that the melting pressure has an impact on the degree of silica saturation of the magmas [50,82,83]. Particularly, low degrees of partial melting at high pressure condition yield magmas with more normative nepheline (Ne), while partial melting with large degree at lower pressure condition generates magmas with normative hypersthene (Hy) and quartz (Q) [84]. In this study, the AB group has relatively high Ne-normative contents (1.53% to 13.94%), while most samples from the TB group have no Ne content (Table S2).
The plot of La/Yb vs. Sm/Yb has widely been used to distinguish between melting of spinel and garnet peridotite. Considering that Yb is more compatible than La and Sm in garnet, rocks with low degree of partial melting will exhibit high La/Yb and Sm/Yb ratios, whereas rocks with high degrees of batch melting or derived from the spinel stability field will generate magmas with low La/Yb and Sm/Yb ratios [50]. Figure 14a thus reveals that various degrees (1%–20%) of batch melting can produce alkali and tholeiitic mafic rocks in the Qianjiadian U deposit. Specifically, samples of TB group show higher degree of melting (15%–20%) than these AB group (1%–10%). The lower degree of melting in the AB group is consistent with the conclusion investigated using the (Tb/Yb)PM–(Yb/Sm)PM diagram (Figure 14b), given that melting degree shows negative correlation with melting depth [85], suggesting that the AB group may have been generated at deeper depth than the TB group.
Zircon U-Pb and previous Ar-Ar dating indicates that the alkali basaltic rocks formed earlier (51~47 Ma) than the tholeiitic basaltic rocks (42–39 Ma). Lithospheric thinning, therefore, can reveal the decreasing alkalinity of the Qianjiadian mafic rocks with time. It is likely that at ~50 Ma the lithosphere was relatively thick so that only the pyroxenite at deeper depths started to melt, forming basanites and alkali basalts (Figure 15a). Following the lithospheric thinning, at ~40 Ma the melting column moved to a relatively shallow level. Consequently, relatively large melting degree of pyroxenite occured to generate the tholeiites (Figure 15b).
Thus, we infer that that the Cenozoic mafic rocks in the Qianjiadian area were generated from a similar mantle source, and variable degrees of partial melting caused by lithospheric thinning may have controlled the genesis of the Qianjiadian mafic rocks.

5.4. Constraints on U Mineralization

Uranium is a typical redox sensitive element. It is ‘fluid-mobile’ when present as oxidized state (U6+) but largely immobile when present as reduced species (U4+) [88,89,90,91,92,93]. Sandstone-hosted U deposits are epigenetic deposits in which U minerals are present as disseminations and mineral replacements primarily in fluvial, lacustrine, and deltaic sandstones [94]. There are few important prerequisites for the formation of sandstone-hosted U deposits, which include (1) formation of reservoir sand bodies [95], (2) interlayer oxidized zone, (3) a leachable U source, and (4) a reducing environment, where the U is precipitated and concentrated [32,96]. In addition, tectonic inversion also exerts a significant role in the infiltration of meteoric oxidizing fluids and the migration directions of U-bearing groundwaters [1,2,3,4,5,6]. However, due to the incomplete stratigraphic record during the Cenozoic in the Songliao Basin, the timing of this tectonic inversion remains controversial. Based on the fold and thrust system and the continuous depocenter migration to the northwest Songliao basin, Wang et al. [41] proposed that tectonic inversion began at 79.1 Ma and ended at 64 Ma, whereas Cheng et al. [21] argued that this inversion characterized by the folds and the thrust faults mostly occurred during the Oligo–Miocene (~40–10 Ma), as indicated by apatite and zircon fission-track data. Combined with the research on basalts from the Shuangliao area, the Cenozoic mafic magmatic activity is characterized by alkali basaltic rocks formed at 50~47 Ma, followed by the emplacement of tholeiitic basaltic rocks at 42–40 Ma, indicating lithospheric thinning and crustal extension related to the subduction of the Pacific plate. Therefore, the Eocene (~50–40Ma) mafic rocks in southern Songliao Basin were emplaced prior to the Oligocene inversion (~40 Ma), described in [6,21], which marks the onset of a tectonic uplift period in the Qianjiadian area, concomitant with the main mineralization stage (Figure 15c).
Figure 15. (a,b) Petrogenetic model of the Early Cenozoic mafic rocks in Qianjiadian area caused by lithospheric thinning attributed to the subduction of the Pacific Plate, modified from [97]. (c) Basin evolution associated with sandstone-type uranium mineralization, modified from [27].
Minerals 10 01014 g015
Eocene mafic rocks are widespread in sandstones of the Yaojia Formation hosting the U mineralization in the Qianjiadian deposit (Figure 1). Previous studies proposed that the intrusion of these mafic rocks triggered subsequent circulation of mantle-derived CO2-rich hydrothermal fluids, which could have been responsible for U leaching from the surrounding sandstones [34]. In addition, it has also been proposed that the genesis of the U mineralization in the Qianjiadian area was controlled by BSR processes within organic matter (OM)-bearing sandstones [28,29,30,31,32,33]. A recent study on carbonaceous debris from the Qianjiadian U deposit showed the increase of the vitrinite reflectance of carbonaceous debris, hence, revealing the heat effect of diabase dikes and related fluids [20] and suggesting the close spatial relationship between the dikes and the U mineralization. Nevertheless, recent EPMA chemical dating indicated that most of the U mineralization ages are younger than 40 Ma, with a peak in the Miocene or later (<20 Ma) [36], which is in good agreement with the tectonic evolution model proposed in the previous paragraph. Moreover, these ages postdate the emplacement of the mafic rocks, hence, arguing against the model proposed by Nie et al. [34] involving mantle-derived CO2-rich hydrothermal fluids in the U ore genesis.
Alternatively, in addition to BSR-mediated processes [27,33] occurring in OM-bearing primary reduced sandstone, the mafic rocks may also have provided favorable physicochemical environment (chemical trap), promoting the reduction and deposition of U from oxidizing fluids in the Qianjiadian deposit. The fact that some mafic rocks show evidence for a secondary oxidation demonstrates their interaction with the U-bearing groundwater and also supports their role as reducing barrier for the fluids. Besides, the mafic rocks characterized in the Qianjiadian area have relatively high contents of Fe(II)-bearing minerals such as pyroxene and magnetite (Figure 3d) that could promote U precipitation from oxidizing fluids [98]. For instance, chemical reaction of uranium mineralization could be as follow:
UO2(CO3)22− + 2Fe3O4 +2Ca2+ +2H+ = UO2 + 3Fe2O3 + 2CaCO3 + H2O.
Moreover, the observations of carbonation in the mafic rocks (Figure 3a) and the common coexistence of uraninite and hematite in ores [16,18,19] would also corroborate this model. Finally, as discussed above, the hydrothermal alteration related to the mafic intrusions locally resulted in the secondary reduction of the host sediments mainly characterized by bleached and green-altered sandstones. As shown in Figure 3a and also described in [27] for the Baxingtu deposit, this alteration characterized by newly precipitated chlorite, epidote, and carbonate as sandstone cement has likely formed a secondary reducing barrier in oxidized sandstones or strengthened the reducing character of the primary reduced sandstones.
Therefore, the mafic rocks and their related hydrothermal alteration in the Qianjiadian area may have played a major role as reducing agent in the genesis of the U mineralization, as suggested by the close spatial relation between ore bodies and the mafic dikes shown in Figure 1c.

5.5. Comparison with the Ordos Basin

Sandstone-hosted uranium deposits in the Ordos Basin are mainly distributed in the northern margin of the basin, including the Dongsheng, Nalinggou, and Daying deposits. The U mineralization of these deposits is located in the contact zone between primary reduced grey sandstones and secondary reduced green sandstones within the Zhiluo Formation [31]. Similar to the Qianjiadian deposit, altered green sandstones are spatially closely related to the U mineralization [99]. Based on the study of clay minerals from ore-bearing sandstone, Ding et al. [100] proposed that these altered green sandstones were the result of the basalt-related alkaline hydrothermal alteration. In the Hangjingqi area basalts were emplaced at 126.2 ± 0.4 Ma [101], prior to the uranium mineralization. The uranium mineralization ages are spatiotemporally related to Miocene tectonics’ uplift [102], which is similar to that of the Qianjiadian deposit.
In summary, we propose that the organic compounds (detrital OM or migrated hydrocarbon) are required to allow BSR processes, but the mafic rocks may have also played an important role as reducing barrier promoting the precipitation of U from groundwater oxidizing fluids.

6. Conclusions

Based on the results of this study, we have drawn the following conclusions:
(1) Zircon U-Pb and previous Ar-Ar dating indicate that the alkali mafic rocks formed earlier (51~47 Ma) than the tholeiitic mafic rocks (42–40 Ma).
(2) Cenozoic mafic rocks in the Qianjiadian area were of asthenospheric origin and relatively more radiogenic 206Pb/204Pb ratios suggest the metasomatism from subducted Pacific materials prior to melting.
(3) Tholeiites generally equilibrate at shallower depths in the mantle than alkali olivine mafic rocks and variable degrees of partial melting may have an effect on the genesis of the Qianjiadian mafic rocks.
(4) The tectonic inversion from extension to tectonic uplift attributed to the subduction of the Pacific Plate occurred at ~40 Ma. The Eocene (~50–40Ma) mafic rocks from the Qianjiadian U deposit mark the extensional period that preceded the Oligo–Miocene (~40–10 Ma) tectonic uplift and represent reducing environment that may have played a significant role in the U ore genesis during the Oligo–Miocene.

Supplementary Materials

The following are available online at https://0-www-mdpi-com.brum.beds.ac.uk/2075-163X/10/11/1014/s1, Table S1. Zircon U–Pb isotopic data from the mafic rocks in the Qianjiadian U deposit, NE China. Table S2. Major element concentrations (in wt.%) and trace element concentrations (in ppm) of the Qianjiadian mafic rocks. Table S3. Sr–Nd–Pb isotopic composition. Table S4. EPMA data of olivine from Qianjiadian mafic rocks.

Author Contributions

Conceptualization, J.-H.W. and F.-J.N.; funding acquisition, F.-J.N. and F.X.; writing-original draft preparation, D.-G.Y.; writing-review and editing, C.B.; investigation and sampling, F.X., Z.-B.Y., J.-F.C., C.-D.W., H.-T.W. and J.-H.W. All authors have read and agreed to the published version of the manuscript.

Funding

This work was supported by the National Natural Science Foundation of China (grant no. 41372071, 41772068, and 41862010) and National Program on Key Basic Research Project (973 Program) (grant no. 2015CB453002).

Acknowledgments

We thank Geological team No. 243 of the China National Nuclear Corporation in Chifeng, Inner Mongolia, for help with the field expedition. We also thank Yujie Hao of the Key Laboratory of Mineral Resources Evaluation in Northeast Asia, Ministry of Land and Resources of China, Jilin University, China, for help and support during the LA-ICP-MS U–Pb analyses.

Conflicts of Interest

The authors declare no conflict of interest.

References

  1. Huston, D.L.; Mernagh, T.P.; Hagemann, S.G.; Doublier, M.P.; Fiorentini, M.; Champion, D.C.; Jaques, A.L.; Czarnota, K.; Cayley, R.; Skirrow, R.; et al. Tectono-metallogenic systems–The place of mineral systems within tectonic evolution, with an emphasis on Australian examples. Ore Geol. Rev. 2016, 76, 168–210. [Google Scholar] [CrossRef]
  2. Jin, R.S.; Miao, P.S.; SiMa, X.Z.; Li, J.G.; Zhao, H.L.; Zhao, F.Q.; Feng, X.X.; Chen, Y.; Chen, L.L.; Zhao, L.J.; et al. Structure styles of Mesozoic-Cenozoic U-bearing rock series in Northern China. Acta Geol. Sin. 2016, 90, 2104–2116. [Google Scholar] [CrossRef]
  3. Wang, F.F.; Liu, C.Y.; Qiu, X.W.; Guo, P.; Zhang, S.H.; Cheng, X.H. Characteristics and distribution of world’s identified sandstone-type uranium resources. Acta Geol. Sin. 2017, 91, 2021–2046, (In Chinese with English Abstract). [Google Scholar]
  4. Zhao, Z.H.; Bai, J.P.; Lai, T.G. Reversal structure and its relation to metallization of sandstone-type uranium deposit in Northern Songliao Basin. Uranium Geol. 2018, 34, 274–279, (In Chinese with English Abstract). [Google Scholar]
  5. Cheng, Y.H.; Wang, S.Y.; Jin, R.S.; Li, J.G.; Ao, C.; Teng, X.M. Global Miocene tectonics and regional sandstone-style uranium mineralization. Ore Geol. Rev. 2019, 106, 238–250. [Google Scholar] [CrossRef]
  6. Cheng, Y.H.; Wang, S.Y.; Zhang, T.F.; Teng, X.M.; Ao, C.; Jin, R.S.; Li, H.L. Regional sandstone-type uranium mineralization rooted in Oligo–Miocene tectonic inversion in the Songliao Basin, NE China. Gondwana Res. 2020, 88, 88–105. [Google Scholar] [CrossRef]
  7. Jin, R.S.; Teng, X.M.; Li, X.G.; Si, Q.H.; Wang, W. Genesis of sandstone-type uranium deposits along the northern margin of the Ordos Basin, China. Geosci. Front. 2020, 11, 215–227. [Google Scholar] [CrossRef]
  8. Leroy, J. The Margnac and Fanay uranium deposits of the La Crouzille district (western Massif Central, France): Geologic and fluid inclusion studies. Econ. Geol. 1978, 73, 1611–1634. [Google Scholar] [CrossRef]
  9. Marignac, C.; Cuney, M. Ore deposits of the French Massif Central, Insight into the metallogenesis of the Variscan belt. Miner. Depos. 1999, 34, 472–504. [Google Scholar] [CrossRef]
  10. Ling, H.F.; Shen, W.Z.; Deng, P.; Jiang, S.Y.; Ye, H.M.; Pu, W.; Tan, Z.Z. Geochemical characteristics and genesis of Luxi-Xiazhuang diabase dikes in Xiazhuang uranium orefield, northern Guangdong province. Acta Geol. Sin. 2005, 79, 497–506. [Google Scholar]
  11. Hu, R.Z.; Bi, X.W.; Zhou, M.F.; Peng, J.T.; Su, W.C.; Liu, S.; Qi, H.W. Uranium metallogenesis in South China and its relationship to crustal extension during the Cretaceous to Tertiary. Econ. Geol. 2008, 103, 583–598. [Google Scholar] [CrossRef]
  12. Wang, L.X.; Ma, C.Q.; Lai, Z.X.; Marks, M.A.W.; Zhang, C.; Zhong, Y.F. Early Jurassic mafic dykes from the Xiazhuang ore district (South China): Implications for tectonic evolution and uranium metallogenesis. Lithos 2015, 239, 71–85. [Google Scholar] [CrossRef]
  13. Polito, P.A.; Kyser, T.K.; Rheinberger, G.; Southgate, P.N. A paragenetic and isotopic study of the Proterozoic Westmoreland uranium deposits, Southern McArthur Basin, Northern Territory, Australia. Econ. Geol. 2005, 100, 1243–1260. [Google Scholar] [CrossRef]
  14. Xia, Y.L.; Lin, J.R.; Li, Z.Y.; Li, S.X.; Liu, H.B.; Wang, Z.M.; Fan, G.; Zheng, J.W.; Li, Z.J.; Zhang, M.Y. Perspective and resource evaluation and metallogenic studies on sandstone-type uranium deposit in Qianjiadian depression of Songliao Basin. China Nucl. Sci. Technol. Rep. 2003, 3, 105–117, (In Chinese with English Abstract). [Google Scholar]
  15. Xia, Y.L.; Zheng, J.W.; Li, Z.Y.; Li, L.Q.; Tian, S.F. Metallogenic characteristics and model of the Qianjiadian uranium deposit in the Songliao basin. Miner. Depos. 2010, 29, 154–155, (In Chinese with English Abstract). [Google Scholar]
  16. Jiao, Y.Q.; Wu, L.Q.; Peng, Y.B.; Rong, H.; Ji, D.M.; Miao, A.S.; Li, H.L. Sedimentary-tectonic setting of the deposition-type uranium deposits forming in the Paleo-Asian tectonic domain, North China. Earth Sci. Front. 2015, 22, 189–205, (In Chinese with English Abstract). [Google Scholar]
  17. Rong, H.; Jiao, Y.; Wu, L.; Jia, J.; Cao, M. Effects of basic intrusions on REE mobility of sandstones and their geological significance: A case study from the Qianjiadian sandstone-hosted uranium deposit in the Songliao Basin. Appl. Geochem. 2020, 120, 104665. [Google Scholar] [CrossRef]
  18. Luo, Y.; Ma, H.F.; Xia, Y.L.; Zhang, Z.G. Geologic characteristics and metallogenic model of Qianjiadian uranium deposit in Songliao Basin. Uranium Geol. 2007, 23, 193–201, (In Chinese with English Abstract). [Google Scholar]
  19. Rong, H.; Jiao, Y.; Wu, L.; Ji, D.; Li, H.; Zhu, Q.; Cao, M.; Wang, X.; Li, Q.; Xie, H. Epigenetic alteration and its constraints on uranium mineralization from the Qianjiadian uranium deposit, southern Songliao Basin. Earth Sci. 2016, 41, 153–166, (In Chinese with English Abstract). [Google Scholar]
  20. Rong, H.; Jiao, Y.Q.; Wu, L.Q.; Wan, D.; Cui, Z.J.; Guo, X.J.; Jia, J.M. Origin of the carbonaceous debris and its implication for mineralization within the Qianjiadian uranium deposit, southern Songliao Basin. Ore Geol. Rev. 2019, 107, 336–352. [Google Scholar] [CrossRef]
  21. Cheng, Y.H.; Wang, S.Y.; Li, Y.; Ao, C.; Li, Y.F.; Li, J.G.; Li, H.L.; Zhang, T.F. Late Cretaceous–Cenozoic thermochronology in the southern Songliao Basin, NE China: New insights from apatite and zircon fission track analysis. J. Asian Earth Sci. 2018, 160, 95–106. [Google Scholar] [CrossRef]
  22. Min, M.; Xu, H.F.; Chen, J.; Mostafa, F. Evidence of uranium biomineralization in sandstone-hosted roll-front uranium deposits, northwestern China. Ore Geol. Rev. 2005, 26, 198–206. [Google Scholar] [CrossRef]
  23. Cai, C.F.; Dong, H.L.; Li, H.T.; Xiao, X.J.; Ou, G.X.; Zhang, C.M. Mineralogical and geochemical evidence for coupled bacterial uranium mineralization and hydrocarbon oxidation in the Shashagetai deposit, NW China. Chem. Geol. 2007, 236, 167–179. [Google Scholar] [CrossRef]
  24. Grant, B.D.; Charles, R.M.B.; David, J.G. Geology, geochemistry and mineralogy of the lignite-hosted ambassador palaeochannel uranium and multi-element deposit, Gunbarrel Basin, Western Australia. Miner. Depos. 2011, 46, 761–787. [Google Scholar]
  25. Abzalov, M.Z.; Paulson, O. Sandstone hosted uranium deposits of the great divide basin, Wyoming, USA. Appl. Earth Sci. 2012, 121, 76–83. [Google Scholar] [CrossRef]
  26. Jiang, L.; Cai, C.F.; Zhang, Y.D.; Mao, S.Y.; Sun, Y.G.; Li, K.K.; Xiang, L.; Zhang, C.M. Lipids of sulfate reducing bacteria and sulfur-oxidizing bacteria found in the Dongsheng uranium deposit. Chin. Sci. Bull. 2012, 57, 1311–1319. [Google Scholar] [CrossRef] [Green Version]
  27. Bonnetti, C.; Liu, X.; Yan, Z.; Cuney, M.; Michels, R.; Malartre, F.; Mercadier, J.; Cai, J. Coupled uranium mineralisation and bacterial sulphate reduction for the genesis of the Baxingtu sandstone-hosted U deposit, SW Songliao Basin, NE China. Ore Geol. Rev. 2017, 82, 108–129. [Google Scholar] [CrossRef]
  28. Meunier, J.D.; Trouiller, A.; Brulhet, J.; Pagel, M. Uranium and organic matter in a paleodeltaic environment: The Coutras Deposit (Gironde, France). Econ. Geol. 1989, 84, 1541–1556. [Google Scholar] [CrossRef]
  29. Cai, C.F.; Zhao, L. Thermochemical sulfate reduction and its effects on petroleum composition and reservoir quality: Advances and problems. Bull. Mineral. Petrol. Geochem. 2016, 35, 851–859, (In Chinese with English Abstract). [Google Scholar]
  30. Sangély, L.; Chaussidon, M.; Michels, R.; Brouand, M.; Cuney, M.; Huault, V.; Landais, P. Micrometer scale carbon isotopic study of bitumen associated with Athabasca uranium deposits: Constraints on the genetic relationship with petroleum sourcerocks and the abiogenic origin hypothesis. Earth Planet. Sci. Lett. 2007, 258, 378–396. [Google Scholar] [CrossRef]
  31. Jiao, Y.Q.; Wu, L.Q.; Rong, H.; Peng, Y.B.; Miao, A.S.; Wang, X.M. The relationship between Jurassic coal measures and sandstone-type uranium deposits in the northeastern Ordos Basin, China. Acta Geol. Sin. 2016, 90, 2117–2132. [Google Scholar] [CrossRef]
  32. Jiao, Y.Q.; Wu, L.Q.; Rong, H. Model of inner and outer reductive media within uranium reservoir sandstone of Sandstone-type Uranium deposits and its ore-controlling mechanism: Case studies in Daying and Qianjiadian uranium deposit. Earth Sci. 2018, 43, 459–474, (In Chinese with English Abstract). [Google Scholar]
  33. Bonnetti, C.; Zhou, L.; Riegler, T.; Brugger, J.; Fairclough, M. Large S isotope and trace element fractionations in pyrite of uranium roll front systems result from internally-driven biogeochemical cycle. Geochim. Cosmochim. Acta 2020. [Google Scholar] [CrossRef]
  34. Nie, F.J.; Yan, Z.B.; Xia, F.; Li, M.G.; Feng, Z.B.; Lu, Y.Y.; Cai, J.F. Mineralisation from hot fluid flows in the sandstone-type uranium deposit in the Kailu Basin, Northeast China. Appl. Earth Sci. 2018, 127, 2–14. [Google Scholar] [CrossRef]
  35. Feng, Z.Q.; Jia, C.Z.; Xie, X.N.; Zhang, S.; Feng, Z.H.; Timothy, A.C. Tectonostratigraphic units and stratigraphic sequences of the nonmarine Songliao basin, northeast China. Basin Res. 2010, 22, 79–95. [Google Scholar]
  36. Zhao, L.; Cai, C.F.; Jin, R.S.; Li, J.G.; Li, H.L.; Wei, J.L.; Guo, F.; Zhang, B. Mineralogical and geochemical evidence for biogenic and petroleum-related uranium mineralization in the Qianjiadian deposit, NE China. Ore Geol. Rev. 2018, 101, 273–292. [Google Scholar] [CrossRef]
  37. Cheng, Y.H.; Li, Y.; Wang, S.Y.; Li, Y.F.; Ao, C.; Li, J.G.; Sun, L.X.; Li, H.L.; Zhang, T.F. Late Cretaceous tectono-magmatic event in Songliao Basin, NE China: New insights from mafic dyke geochronology and geochemistry analysis. Geol. J. 2018, 53, 2991–3008. [Google Scholar] [CrossRef]
  38. Wang, P.J.; Xie, X.A.; Mattern, F.; Ren, Y.G.; Zhu, D.F.; Sun, X.M. The Cretaceous Songliao Basin: Volcanogenic succession, sedimentary sequence and tectonic evolution, NE China. Acta Pet. Sin. 2007, 81, 1002–1011. [Google Scholar]
  39. Wu, F.Y.; Sun, D.Y.; Ge, W.C.; Zhang, Y.B.; Grant, M.L.; Wilde, S.A.; Jahn, B.M. Geochronology of the Phanerozoic granitoids in northeastern China. J. Asian Earth Sci. 2011, 41, 1–30. [Google Scholar] [CrossRef] [Green Version]
  40. Wu, F.Y.; Sun, D.Y.; Li, H.M.; Wang, X.L. The nature of basement beneath the Songliao Basin in NE China: Geochemical and isotopic constraints. Phys. Chem. Earth Part A 2001, 26, 793–803. [Google Scholar] [CrossRef]
  41. Wang, P.J.; Mattern, F.; Didenko, A.; Zhu, D.F.; Singer, B.; Sun, X.M. Tectonics and cycle system of the Cretaceous Songliao Basin: An inverted active continental margin basin. Earth Sci. Rev. 2016, 159, 82–102. [Google Scholar] [CrossRef] [Green Version]
  42. Zhang, W.L.; Su, X.B.; Zhang, B. Discussion on mining utilization coefficient for in situ leaching sandstone type uranium resource: A case study of qianjiadian uranium deposit. Uranium Minine Metall. 2017, 36, 19–22, (In Chinese with English Abstract). [Google Scholar]
  43. Liu, X.M.; Gao, S.; Diwu, C.R.; Yuan, H.L.; Hu, Z.C. Simultaneous in situ determination of U–Pb age and trace elements in zircon by LA–ICP–MS in 20 µm spot size. Chin. Sci. Bull. 2007, 52, 1257–1264. [Google Scholar] [CrossRef]
  44. Hoskin, W.O.; Schaltegger, U. The composition of zircon and igneous and metamorphic petrogenesis. Rev. Mineral. Geochem. 2003, 53, 27–62. [Google Scholar] [CrossRef]
  45. Yang, F.P.; Chen, F.J.; Wang, Y.H.; Li, J.K. Apatite fission track analysis in the central depression, Songliao Basin. Pet. Explor. Dev. 1995, 22, 20–25, (In Chinese with English Abstract). [Google Scholar]
  46. Xu, Y.G.; Zhang, H.H.; Qiu, H.N.; Ge, W.C.; Wu, F.Y. Oceanic crust components in continental basalts from Shuangliao, Northeast China: Derived from the mantle transition zone. Chem. Geol. 2012, 328, 168–184. [Google Scholar] [CrossRef]
  47. Irvine, T.H.; Baragar, W.R.A. A guide to the chemical classification of the common volcanic rocks. Can. J. Earth Sci. 1971, 8, 523–548. [Google Scholar] [CrossRef]
  48. Winchester, J.A.; Floyd, P.A. Geochemical discrimination of different magma series and their differentiation products using immobile elements. Chem. Geol. 1977, 20, 325–343. [Google Scholar] [CrossRef] [Green Version]
  49. Liu, J.Q.; Chen, L.H.; Wang, X.J.; Zhong, Y.; Yu, X.; Zeng, G.; Erdmann, S. The role of melt-rock interaction in the formation of Quaternary high-MgO potassic basalt from the Greater Khingan Range, Northeast China. J. Geophys. Res. Solid Earth. 2017, 122, 262–280. [Google Scholar] [CrossRef]
  50. Xu, Y.G.; Ma, J.L.; Frey, F.A.; Feigenson, M.D.; Liu, J.F. Role of lithosphere–asthenosphere interaction in the genesis of Quaternary alkali and tholeiitic basalts from Datong, western North China Craton. Chem. Geol. 2005, 224, 247–271. [Google Scholar] [CrossRef]
  51. Wang, X.J.; Chen, L.H.; Hofmann, A.W.; Mao, F.G.; Liu, J.Q.; Zhong, Y.; Xie, L.W.; Yang, Y.H. Mantle transition zone-derived EM1 component beneath NE China: Geochemical evidence from Cenozoic potassic basalts. Earth. Planet. Sci. Lett. 2017, 465, 16–28. [Google Scholar] [CrossRef]
  52. Zou, H.B.; Zindler, A.; Xu, X.S.; Qi, Q. Major, trace element, and Nd, Sr and Pb isotopic studies of Cenozoic basalts in SE China: Mantle sources, regional variations, and tectonic significance. Chem. Geol. 2000, 17, 33–47. [Google Scholar] [CrossRef] [Green Version]
  53. DePaolo, D.J.; Wasserburg, G.J. The sources of island arcs as indicated by Nd and Sr isotopic studies. Geophys. Res. Lett. 1977, 4, 465–468. [Google Scholar] [CrossRef] [Green Version]
  54. Boynton, W.V. Geochemistry of the rare earth elements: Meteorite studies. In Rare Earth Element Geochemistry; Elsevier: Amsterdam, The Netherlands, 1984; pp. 63–114. [Google Scholar]
  55. Sun, S.S.; McDonough, W.F. Chemical and isotopic systematics of oceanic basalts: Implications for mantle composition and processes. In Magmatism in the Ocean Basins; Saunders, A.D., Norry, M.J., Eds.; Geological Society Publications: London, UK, 1989; pp. 313–345. [Google Scholar]
  56. Zindler, A.; Hart, S. Chemical geodynamics. Annu. Rev. Earth Planet. Sci. 1986, 14, 493–571. [Google Scholar] [CrossRef]
  57. Kuritani, T.; Ohtani, E.; Kimura, J.-I. Intensive hydration of the mantle transition zone beneath China caused by ancient slab stagnation. Nat. Geosci. 2011, 4, 713–716. [Google Scholar] [CrossRef]
  58. Chung, S.L.; Yang, T.F.; Chen, S.J.; Chen, C.H.; Lee, T.; Chen, C.H. Sr―Nd isotope compositions of high-pressure megacrysts and a lherzite inclusion in alkali basalts from western Taiwan. J. Geol. Soc. China. 1995, 38, 15–24. [Google Scholar]
  59. Barry, T.L.; Kent, R.W. Cenozoic magmatism in Mongolia and the origin of Central and East Asian basalts. In Mantle Dynamics and Plate Interactions in East Asia; Flower, M.F.J., Chung, S.L., Lo, C.H., Lee, T.Y., Eds.; American Geophysical Union: Washington, DC, USA, 1998; pp. 347–364. [Google Scholar]
  60. Hart, S.R. A large isotope anomaly in the southern hemisphere mantle. Nature 1984, 309, 753–757. [Google Scholar] [CrossRef]
  61. Guo, P.; Ionov, D.A.; Xu, W.L.; Wang, C.G.; Luan, J.P. Mantle and recycled oceanic crustal components inmantle xenoliths from northeastern China and their mantle sources. J. Geophys. Res. Solid Earth 2020, 125, e2019JB018232. [Google Scholar] [CrossRef]
  62. Danyushevsky, L.V.; Della-Pasqua, F.N.; Sokolov, S. Re-equilibration of melt inclusions trapped by magnesian olivine phenocrysts from subduction-related magmas: Petrological implications. Contrib. Mineral. Petrol. 2000, 138, 68–83. [Google Scholar] [CrossRef] [Green Version]
  63. Danyushevsky, L.V.; Sokolov, S.; Falloon, T.J. Melt inclusions in olivine phenocrysts: Using diffusive re-equilibration to determine the cooling history of a crystal, with implications for the origin of olivine-phyric volcanic rocks. J. Petrol. 2002, 43, 1651–1671. [Google Scholar] [CrossRef] [Green Version]
  64. Wang, C.S.; Scott, R.W.; Wan, X.Q.; Graham, S.A.; Huang, Y.J.; Wang, P.J.; Wu, H.C.; Dean, W.E.; Zhang, L.M. Late Cretaceous climate changes recorded in Eastern Asian lacustrine deposits and North American Epieric sea strata. Earth Sci. Rev. 2013, 126, 275–299. [Google Scholar] [CrossRef]
  65. Sato, H. Nickel content of basaltic magmas: Identification of primary magmas and a measure of the degree of olivine fractionation. Lithos 1977, 10, 113–120. [Google Scholar] [CrossRef]
  66. Thompson, R.N.; Gibson, S.A. Transient high temperatures in mantle plume heads inferred from magnesian olivines in Phanerozoic picrites. Nature 2000, 407, 502–506. [Google Scholar] [CrossRef] [PubMed]
  67. Sobolev, A.V.; Hofmann, A.W.; Kuzmin, D.V.; Yaxley, G.M.; Arndt, N.T.; Chung, S.L.; Danyushevsky, L.V.; Elliott, T.; Frey, F.A.; Garcia, M.O. The amount of recycled crust in sources of mantle-derived melts. Science 2007, 316, 412. [Google Scholar] [CrossRef]
  68. McDonough, W.F. Constraints on the composition of the continental lithospheric mantle. Earth Planet. Sci. Lett. 1990, 101, 1–18. [Google Scholar] [CrossRef]
  69. Smith, E.I.; Sanchez, A.; Walker, J.D.; Wang, K. Geochemistry of maficmagmas in the Hurricane Volcanic field, Utah: Implications for small-and large-scale chemical variability of the lithospheric mantle. J. Geol. 1999, 107, 433–448. [Google Scholar] [CrossRef] [Green Version]
  70. Hofmann, A.W.; Jochum, K.P.; Seufert, M.; White, W.M. Nb and Pb in oceanic basalts: New constraints on mantle evolution. Earth Planet. Sci. Lett. 1986, 79, 33–45. [Google Scholar] [CrossRef]
  71. Rudnick, R.L.; Gao, S. Composition of the continental crust. Treatise Geochem. 2003, 3, 1–64. [Google Scholar]
  72. Pearce, J.A. Geochemical fingerprinting of oceanic basalts with applications to ophiolite classification and the search for Archean oceanic crust. Lithos 2008, 100, 14–48. [Google Scholar] [CrossRef]
  73. Murphy, D.T.; Collerson, K.D.; Kamber, B.S. Lamproites from Gaussberg, Antarctica: Possible transition zonemelts of Archaean subducted sediments. J. Petrol. 2002, 43, 981–1001. [Google Scholar] [CrossRef]
  74. Zhang, M.L.; Guo, Z.F. Origin of Late Cenozoic Abaga–Dalinuoer basalts, eastern China: Implications for a mixed pyroxenite–peridotite source related with deep subduction of the Pacific slab. Gondwana Res. 2016, 37, 130–151. [Google Scholar] [CrossRef]
  75. Kuritani, T.; Kimura, J.I.; Ohtani, E.; Miyamoto, H.; Furuyama, K. Transition zone origin of potassic basalts from Wudalianchi volcano, northeast China. Lithos 2013, 156–159, 1–12. [Google Scholar] [CrossRef]
  76. Plank, T. The chemical composition of subducting sediments. In Treatise on Geochemistry; Holland, H.D., Turekian, K.K., Eds.; Elsevier: Oxford, UK, 2014; pp. 607–629. [Google Scholar]
  77. Li, S.G.; Yang, W.; Ke, S.; Meng, X.N.; Tian, H.C.; Xu, L.J.; He, Y.; Huang, J.; Wang, X.C.; Xia, Q.; et al. Deep carbon cycles constrained by a large-scale mantle Mg isotope anomaly in eastern China. Natl. Sci. Rev. 2017, 4, 111–120. [Google Scholar] [CrossRef] [Green Version]
  78. Chen, H.; Xia, Q.K.; Deloule, E.; Ingrin, J. Typical oxygen isotope profile of altered oceanic crust recorded in continental intraplate basalts. J. Earth Sci. 2017, 28, 578–587. [Google Scholar] [CrossRef]
  79. Huang, J.L.; Zhao, D.P. High-resolution mantle tomography of China and surrounding regions. J. Geophys. Res. 2006, 111, B09305. [Google Scholar] [CrossRef]
  80. Wei, W.; Zhao, D.; Xu, J.; Wei, F.; Liu, G. P and S wave tomography and anisotropy in Northwest Pacific and East Asia: Constraints on stagnant slab and intraplate volcanism. J. Geophys. Res. 2015, 120, 1642–1666. [Google Scholar] [CrossRef]
  81. Xu, R.; Liu, Y.S.; Wang, X.H.; Zong, K.Q.; Hu, Z.C.; Chen, H.H.; Zhou, L. Crust recycling induced compositional-temporal-spatial variations of Cenozoic basalts in the Trans-North China Orogen. Lithos 2017, 274, 383–396. [Google Scholar] [CrossRef]
  82. Takahashi, E.; Kushiro, I. Melting of a dry peridotite at high pressures and basalt magma genesis. Am. Mineral. 1983, 68, 859–879. [Google Scholar]
  83. Kushiro, I. Partial melting experiments on peridotite and origin of mid-ocean ridge basalt. Annu. Rev. Earth Planet. Sci. 2001, 29, 71–107. [Google Scholar] [CrossRef]
  84. DePaolo, D.J.; Daley, E.E. Neodymium isotopes in basalts of the southwest basin and range and lithospheric thinning during continental extension. Chem. Geol. 2000, 169, 157–185. [Google Scholar] [CrossRef]
  85. Langmuir, C.H.; Klein, E.M.; Plank, T. Petrological systematics of mid-ocean ridge basalts: Constraints on melt generation beneath ocean ridges. In Mantle Flow and Melt Generation at Mid-Ocean Ridges; Morgan, J.P., Blackman, D.K., Sinton, J.M., Eds.; Geophysical Monograph Series; AGU: Washington, DC, USA, 1992. [Google Scholar]
  86. Johnson, K.T.M.; Dick, H.J.B.; Shimizu, N. Melting in the oceanic upper mantle: An ion microprobe study of diopsides in abyssal peridotites. J. Geophys. Res. 1990, 95, 2661–2678. [Google Scholar] [CrossRef] [Green Version]
  87. Zhang, Z.C.; Mahoney, J.J.; Mao, J.W.; Wang, F.S. Geochemistry of picritic and associated basalt flows of the western Emeishan flood basalt province, China. J. Petrol. 2006, 47, 1997–2019. [Google Scholar] [CrossRef] [Green Version]
  88. Langmuir, D. Uranium solution-mineral equilibria at low temperatures with applications to sedimentary ore deposits. Geochim. Cosmochim. Acta 1978, 42, 547–569. [Google Scholar] [CrossRef]
  89. Wilde, A.; Otto, A.; Jory, J.; MacRae, C.; Pownceby, M.; Wilson, N.; Torpy, A. Geology and mineralogy of uranium deposits from Mount Isa, Australia: Implications for albitite uranium deposit models. Minerals 2013, 3, 258–283. [Google Scholar] [CrossRef]
  90. Peng, X.; Min, M.; Qiao, H.; Wang, J.; Fayek, M. Uranium-series disequilibria in the groundwater of the Shihongtan sandstone-hosted uranium deposit, NW China. Minerals 2016, 6, 3. [Google Scholar] [CrossRef] [Green Version]
  91. René, M.; Dolníček, Z.; Sejkora, J.; Škácha, P.; Šrein, V. Uraninite, coffinite and ningyoite from vein-type uranium deposits of the Bohemian Massif (Central European Variscan Belt). Minerals 2019, 9, 123. [Google Scholar] [CrossRef] [Green Version]
  92. Gigon, J.; Skirrow, R.G.; Harlaux, M.; Richard, A.; Mercadier, J.; Annesley, I.R.; Villeneuve, J. Insights into B-Mg-metasomatism at the Ranger U deposit (NT, Australia) and comparison with Canadian unconformity-related U deposits. Minerals 2019, 9, 432. [Google Scholar] [CrossRef] [Green Version]
  93. Wu, D.; Pan, J.; Xia, F.; Huang, G.; Lai, J. The mineral chemistry of chlorites and its relationship with uranium mineralization from Huangsha uranium mining area in the middle Nanling range, SE China. Minerals 2019, 9, 199. [Google Scholar] [CrossRef] [Green Version]
  94. Finch, W.I.; Davis, J.F. Sandstone-type uranium deposits-an introduction. In Geological Environments of Sandstone-Type Uranium Deposits; TECDOC-328; IAEA: Vienna, Austria, 1985; pp. 11–20. [Google Scholar]
  95. Jiao, Y.Q.; Wu, L.Q.; Yang, S.K.; Lü, X.B.; Yang, Q.; Wang, Z.H.; Wang, M.F. Sedimentology of uranium reservoir. In The Exploration and Production Base of Sandstone-Type Uranium Deposits; Geology Publishing House: Beijing, China, 2006; p. 331. (In Chinese) [Google Scholar]
  96. Rallakis, D.; Michels, R.; Brouand, M.; Parize, O.; Cathelineau, M. The role of organic matter on uranium precipitation in Zoovch Ovoo, Mongolia. Minerals 2019, 9, 310. [Google Scholar] [CrossRef] [Green Version]
  97. Xu, Y.G.; Li, H.Y.; Hong, L.B.; Ma, L.; Ma, Q.; Sun, M.D. Generation of Cenozoic intraplate basalts in the big mantle wedge under eastern Asia. Sci. China Earth Sci. 2018, 61, 869–886. [Google Scholar] [CrossRef]
  98. Tappa, M.J.; Ayuso, R.A.; Bodnar, R.J.; Aylor, J.G.; Beard, J.; Henika, W.S.; Vazquez, J.A.; Wooden, J.L. Age of host rocks at the Coles Hill uranium deposit, Pittsylvania county, Virginia, based on zircon U-Pb geochronology. Econ. Geol. 2013, 109, 513–530. [Google Scholar] [CrossRef]
  99. Li, Z.Y.; Fang, X.Y.; Chen, A.P.; Ou, G.X.; Xiao, X.J.; Sun, Y.; Liu, C.Y.; Wang, Y. Origin of gray-green sandstone in ore bed of sandstone type uranium deposit in north Ordos Basin. Sci. China Ser. D Earth Sci. 2007, 50, 165–173, (In Chinese with English Abstract). [Google Scholar] [CrossRef]
  100. Ding, B.; Liu, H.X.; Zhang, B.; Yi, C.; Wang, G.; Li, P. Formation mechanism of tabular orebody in Nalinggou uranium deposit, Ordos Basin: Constraints on study of clay minerals from ore-bearing sandstone. Miner. Depos. 2020, 39, 184–195, (In Chinese with English Abstract). [Google Scholar]
  101. Zhou, H.P.; Zhang, K.; Li, G. Early Cretaceous tectonic-thermal event of the Ordos Basin: Evidence from the Ar-Ar dating of the Hangjinqi basalts. Geotecton. Metallog. 2008, 3, 360–364, (In Chinese with English Abstract). [Google Scholar]
  102. Zhang, C.; Yi, C.; Dong, Q.; Cai, Y.Q.; Liu, H.X. Geological and geochronological evidence for the effect of Paleogene and Miocene uplift of the Northern Ordos Basin on the formation of the Dongsheng uranium district, China. J. Geodyn. 2018, 14, 1–18. [Google Scholar] [CrossRef]
Figure 1. (a) A sketch map showing the location of the Songliao Basin. (b) Tectonic units of the Songliao Basin (modified from [35]). (c) Spatial distribution of the interstratified oxidation and mafic rocks in the Qianjiadian uranium deposit, modified after [19,34].
Minerals 10 01014 g001
Figure 2. Geological cross-section (a) and lithological column of drill hole ZKX35-14 (b) in the Qianjiadian uranium deposit showing the relationship between diabase, faults, and uranium mineralization (the location is shown in Figure 1b).
Minerals 10 01014 g002
Figure 3. Field photographs and photomicrographs of selected samples from the Cenozoic mafic rocks in the Qianjiadian region. (a) Field photographs show the contact relationship of mafic rocks, grey sandstone with green alteration, and secondary reduced (bleaching) white/pink siltstone. (b) Microscope photograph of diabases with Ol, Cpx, and Pl. (c) Diabases with Mt and Cpx. (d) Back scattered electron (BSE) image of diabase with Ol, Cpx, and Pl. Cpx= clinopyroxene; Ol = olivine; Pl = plagioclase; Mt = magnetite.
Minerals 10 01014 g003
Figure 4. Representative cathodoluminescence (CL) images of selected zircons from the Cenozoic mafic rocks in the Qianjiadian region.
Minerals 10 01014 g004
Figure 5. (ad) U–Pb concordia diagrams for zircons from samples of Cenozoic mafic rocks in the Qianjiadian area.
Minerals 10 01014 g005
Figure 6. Plots of (a) Na2O+K2O vs. SiO2 (after Irvine and Baragar [47]), (b) Zr/(TiO2 × 10−4) vs. Nb/Y (after Winchester and Floyd [48]), (c) K2O (wt.%) versus Na2O (wt.%) [49], and (d) TFeO-Na2O+K2O-MgO triangular diagram, the boundary line between alkaline series and the tholeiitic series after Irvine and Baragar [47], A = Na2O + K2O (wt.%); F = TFeO (wt.%); M = MgO (wt.%). The chemical data for the alkaline basalts of Shuangliao [46], Tholeiitic basaltic rock of Qianjaidian areas [37], and potassium basalts of Greater Khingan Range [49] are shown for comparison.
Minerals 10 01014 g006
Figure 7. MgO versus major (ai) and trace elements (jl) of the Cenozoic mafic rocks in the Qianjiadian area.
Minerals 10 01014 g007
Figure 10. Core-rim compositions of two representative zoned olivine from samples BLS01-3 and BLS07-2 of the Qianjiadian basaltic rocks. Back-scattered electron images show the compositional traverses (cf) marked by red lines (a,b). The cores have higher Fo and NiO and lower MnO and CaO content than the rims. Fo = 100 × Mg/(Mg + Fe + Mn). For mineral abbreviations, see Figure 3.
Minerals 10 01014 g010
Figure 12. (a) Diagram of (87Sr/86Sr)i versus MgO and (b) diagram of εNd(t) versus MgO for the identification of continental contamination.
Minerals 10 01014 g012
Figure 13. (a) Nb/U vs. Nb, (b) Ce/Pb vs. Ce, (c) Th/Yb vs. Nb/Yb, and (d) Ba/Yb vs. Ta/Yb diagrams for the Cenozoic Qianjiadian mafic rocks. Data for MORB and OIB are from [70], data for the upper and lower crusts are calculated after Rudnick and Gao [71], and the field of the MORB-OIB mantle array is from [72].
Minerals 10 01014 g013
Figure 14. (a) La/Yb vs. Sm/Yb for the mafic rocks. Also shown are batch melting curves calculated for garnet peridotite and spinel peridotite. Partition coefficients are taken from [86]. (b) (Tb/Yb)PM versus (Yb/Sm)PM for the for the samples from the Qianjiadian region. The black thick lines represent 1%, 5%, 10%, and 15% of aggregated fractional melting of peridotite and the dotted curves suggest the percentage of melt contribution from a garnet-facies mantle (Gar); e.g., Gar 100 corresponds to the melt from garnet peridotite and Gar 0 corresponds to the melt from spinel peridotite. The inverse modeling used here follows [87].
Minerals 10 01014 g014
Publisher’s Note: MDPI stays neutral with regard to jurisdictional claims in published maps and institutional affiliations.

