Prediction Models for Evaluating the Strength of Cemented Paste Backfill: A Comparative Study


School of Mines, China University of Mining and Technology, Xuzhou 221116, China
*
Author to whom correspondence should be addressed.
Minerals 2020, 10(11), 1041; https://0-doi-org.brum.beds.ac.uk/10.3390/min10111041
Submission received: 24 October 2020
/
Revised: 11 November 2020
/
Accepted: 17 November 2020
/
Published: 21 November 2020
(This article belongs to the Special Issue Innovative Strategies for Solid Waste Minimisation in the Mining and Minerals Industry)
Abstract
:Cemented paste backfill (CPB) is widely used in underground mining, and attracts more attention these years as it can reduce mining waste and avoid environmental pollution. Normally, to evaluate the functionality of CPB, the compressive strength (UCS) is necessary work, which is also time and money consuming. To address this issue, seven machine learning models were applied and evaluated in this study, in order to predict the UCS of CPB. In the laboratory, a series of tests were performed, and the dataset was constructed considering five key influencing variables, such as the tailings to cement ratio, curing time, solids to cement ratio, fine sand percentage and cement types. The results show that different variables have various effects on the strength of CPB. The optimum models for predicting the UCS of CPB are a support vector machine (SVM), decision tree (DT), random forest (RF) and back-propagation neural network (BPNN), which means that these models can be directly applied for UCS prediction in future work. Furthermore, the intelligent model reveals that the tailings to cement ratio has the most important influence on the strength of CPB. This research can boost CPB application in the field, and guide the artificial intelligence application in future mining.
1. Introduction
Cemented paste backfill (CPB) is an environment-friendly material, as it uses mining waste as the main aggregate [1,2,3,4,5]. Normally, cement and water should be added to CPB to increase the strength and flowability. The function of CPB is to fill the underground stope and to keep the work environment safe. Due to its key role of support of underground space in mines, it attracts more attention these years, especially in research areas such as strength and durability, etc. [6,7,8,9].
As described above, the compressive strength is a key indicator to evaluate the functionality of CPB in the underground mine, and hence most studies focus on the experiments and revealing the mechanism. Normally, the strength of CPB was tested in the laboratory, and mine engineers find the best proportion of materials in CPB [8,10,11]. However, experimental studies are time and money consuming, and are not suitable for a mass of experiments [12]. Parts of scholars apply empirical formulas to predict the strength of CPB, and parts of them are useful, but most of the formulas are constrained by its inputs and dataset [13,14]. Due to the low accuracy of empirical formulas, there is a limited application of the formulation [15,16]. To predict the strength of CPB accurately, more simple and reliable models should be presented and utilized.
It is a hot research interest in the concrete area of using artificial intelligence approaches to evaluate or predict mechanical properties [17,18,19,20]. Furthermore, some researchers have applied machine learning methods to assess the properties of CPB. For example, the artificial neural network (ANN) and other evolved optimization algorithms have been applied to predict the compressive strength of CPB [21]. Moreover, more intelligent algorithms such as random forest (RF), support vector machine (SVM) and decision trees (DT) have been utilized in such areas [22]. It should be pointed out that most machine learning models can make the prediction accurately, but they are limited studies on the effect of different models on the accuracy of prediction. The mentioned algorithms are differently sensitive for various datasets with different properties. Therefore, it is necessary to use different models to predict the compression and find the optimum model for future applications [23].
In this study, various experimental tests were conducted to construct the dataset considering five key factors: the cement type; cement-coarse tailings ratio; solids-water ratio; fine tailings percentage; and time. Then, eight machine learning models, i.e., BPNN, SVM, DT and RF, were used for the prediction of the strength of CPB, and the hyperparameters of these models were tuned by a beetle antennae search algorithm (BAS). Lastly, the prediction results were compared and analyzed, which give the best models in CPB strength prediction. Furthermore, the importance of influencing variables was conducted, and the most sensitive factor was found. The study provides the best models for CPB strength prediction, which is an important guideline in this research field.
2. Materials and Experimental Methods
2.1. Experimental Tests
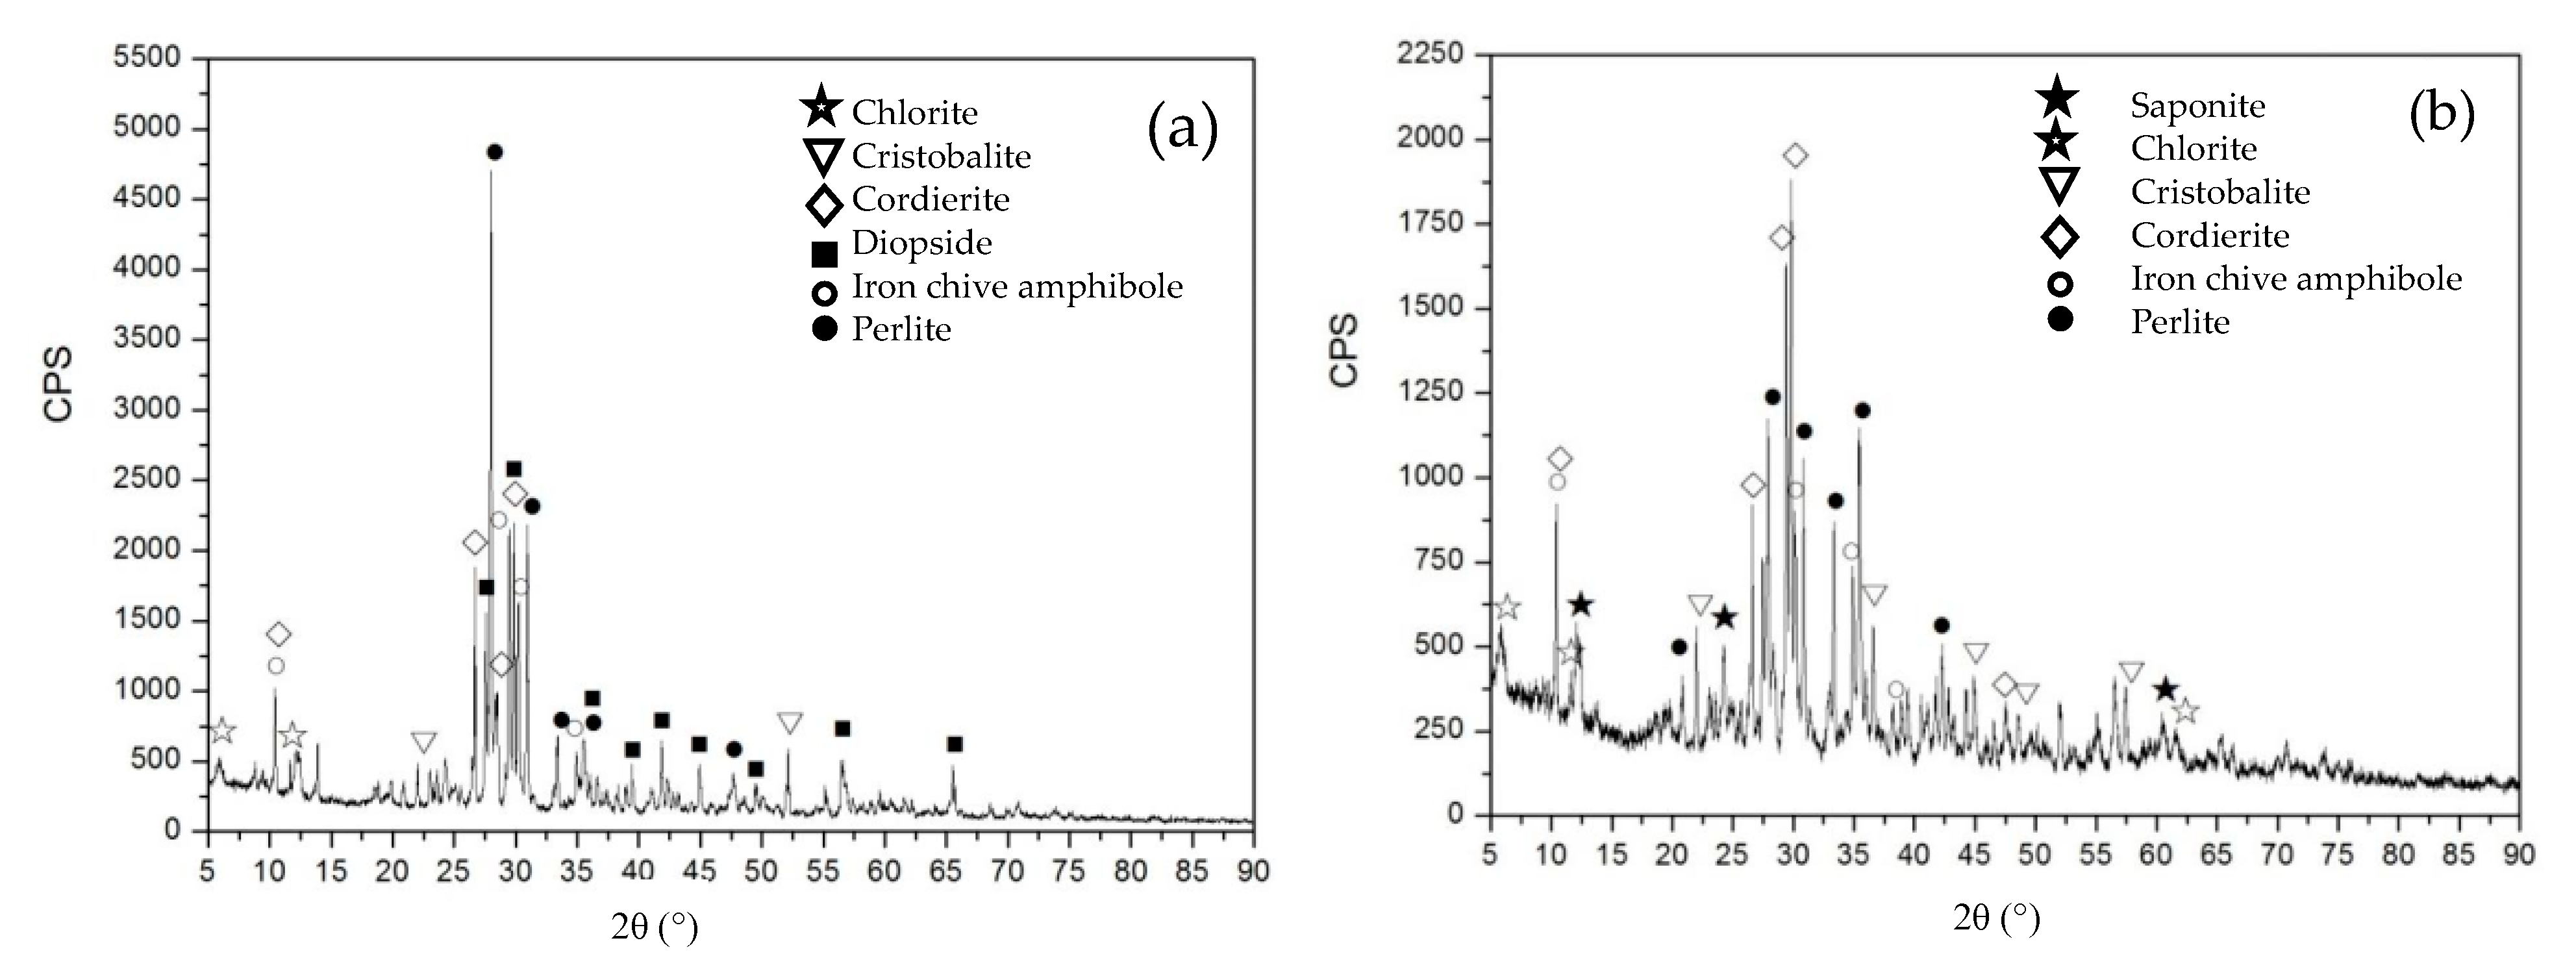
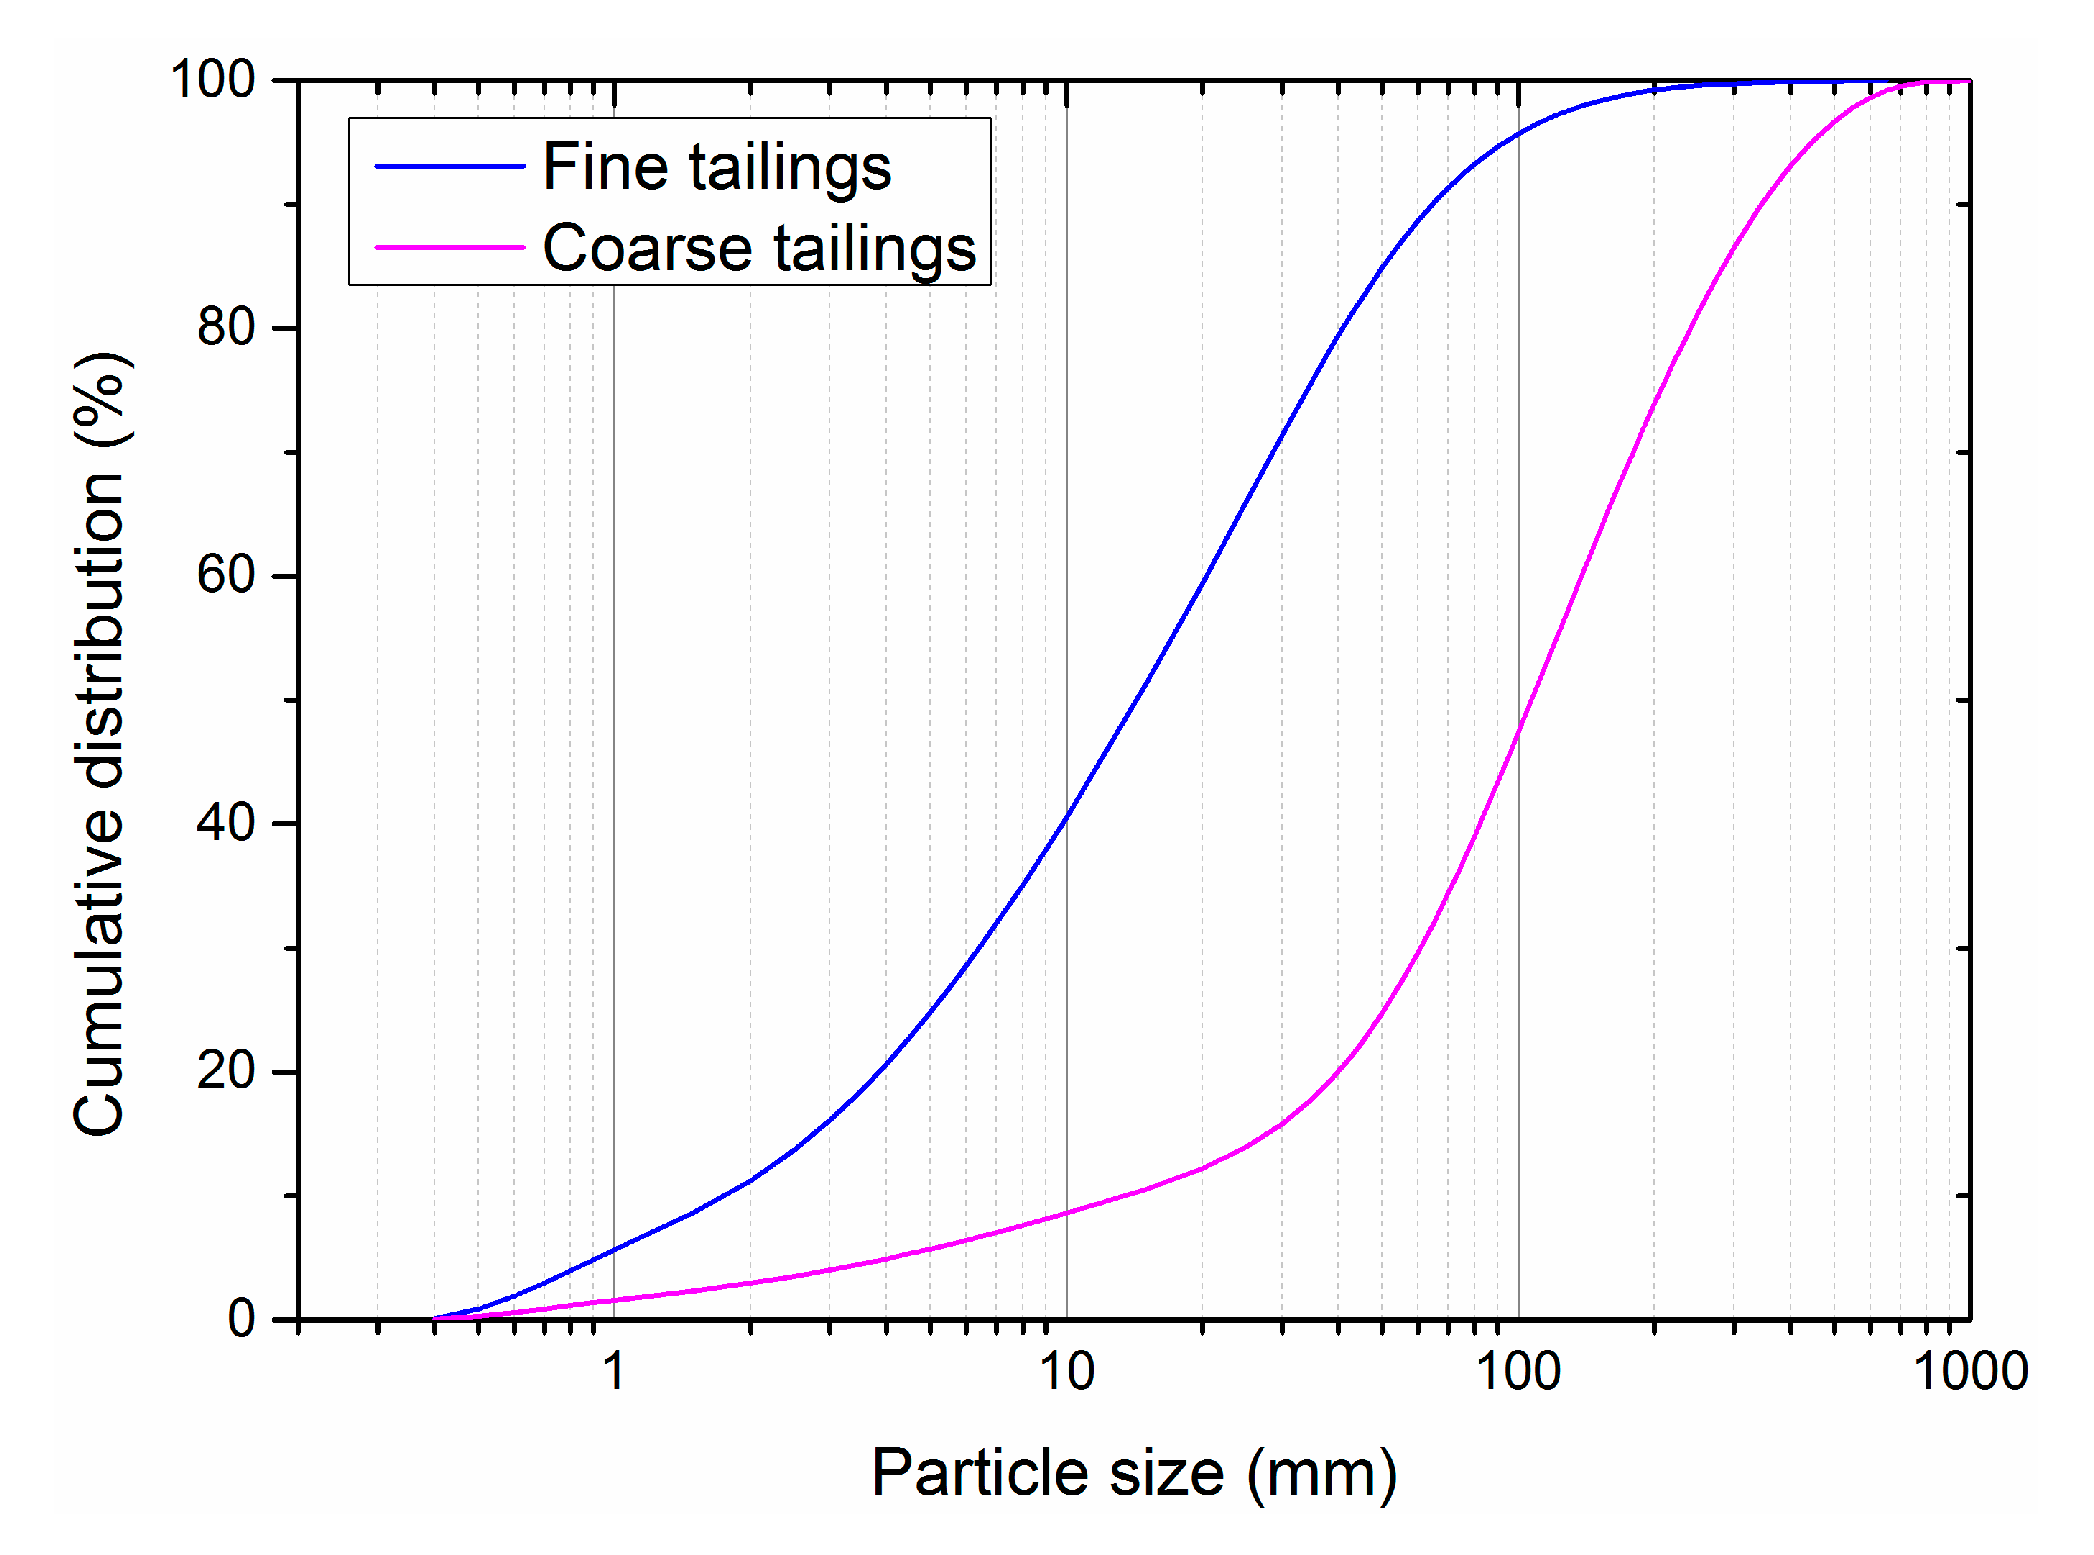
In this field, the CPB was normally composited with water, different cement types, coarse tailings and fine tailings. In this study, the CPB specimen was constructed in the laboratory. The component of coarse tailings and fine tailings are determined by X-ray diffraction (XRD), and the results are given in Figure 1. The mineralogical composition of coarse tailings and fine tailings are given in Table 1 and Table 2, respectively. The particle size distribution of fine tailings and coarse tailings is given in Figure 2. As for the Portland cement PO. 325R, two types of cement (1# (Shangfeng cement), 2# (Maan Cement)) were selected as a binder, and a series of tests were performed. The test results are shown in Table 3. The water chemical elements were analyzed by ICP, and the results are given in Table 4. Importantly, the scheme of a mix of CPB is summarized in Table 5. In China, to obtain a relatively high strength of CPB to keep the unground mine safe, more cement is normally added. According to the previous study [21], the coarse tailings-cement ratio was set as 4, 6, 8 and 10. Due to the negative effect of fine tailings percentage on CPB strength, the percentage of fine tailings was selected as 0%, 10%, 15% and 20%. Considering the fluidity of CPB slurry, the solids-water ratio should be under 72%, and then the ratio was set as 68%, 70% and 72% in this study. Curing time is also an important factor affecting the strength of CPB, and it is therefore chosen as seven days, 28 days and 60 days.
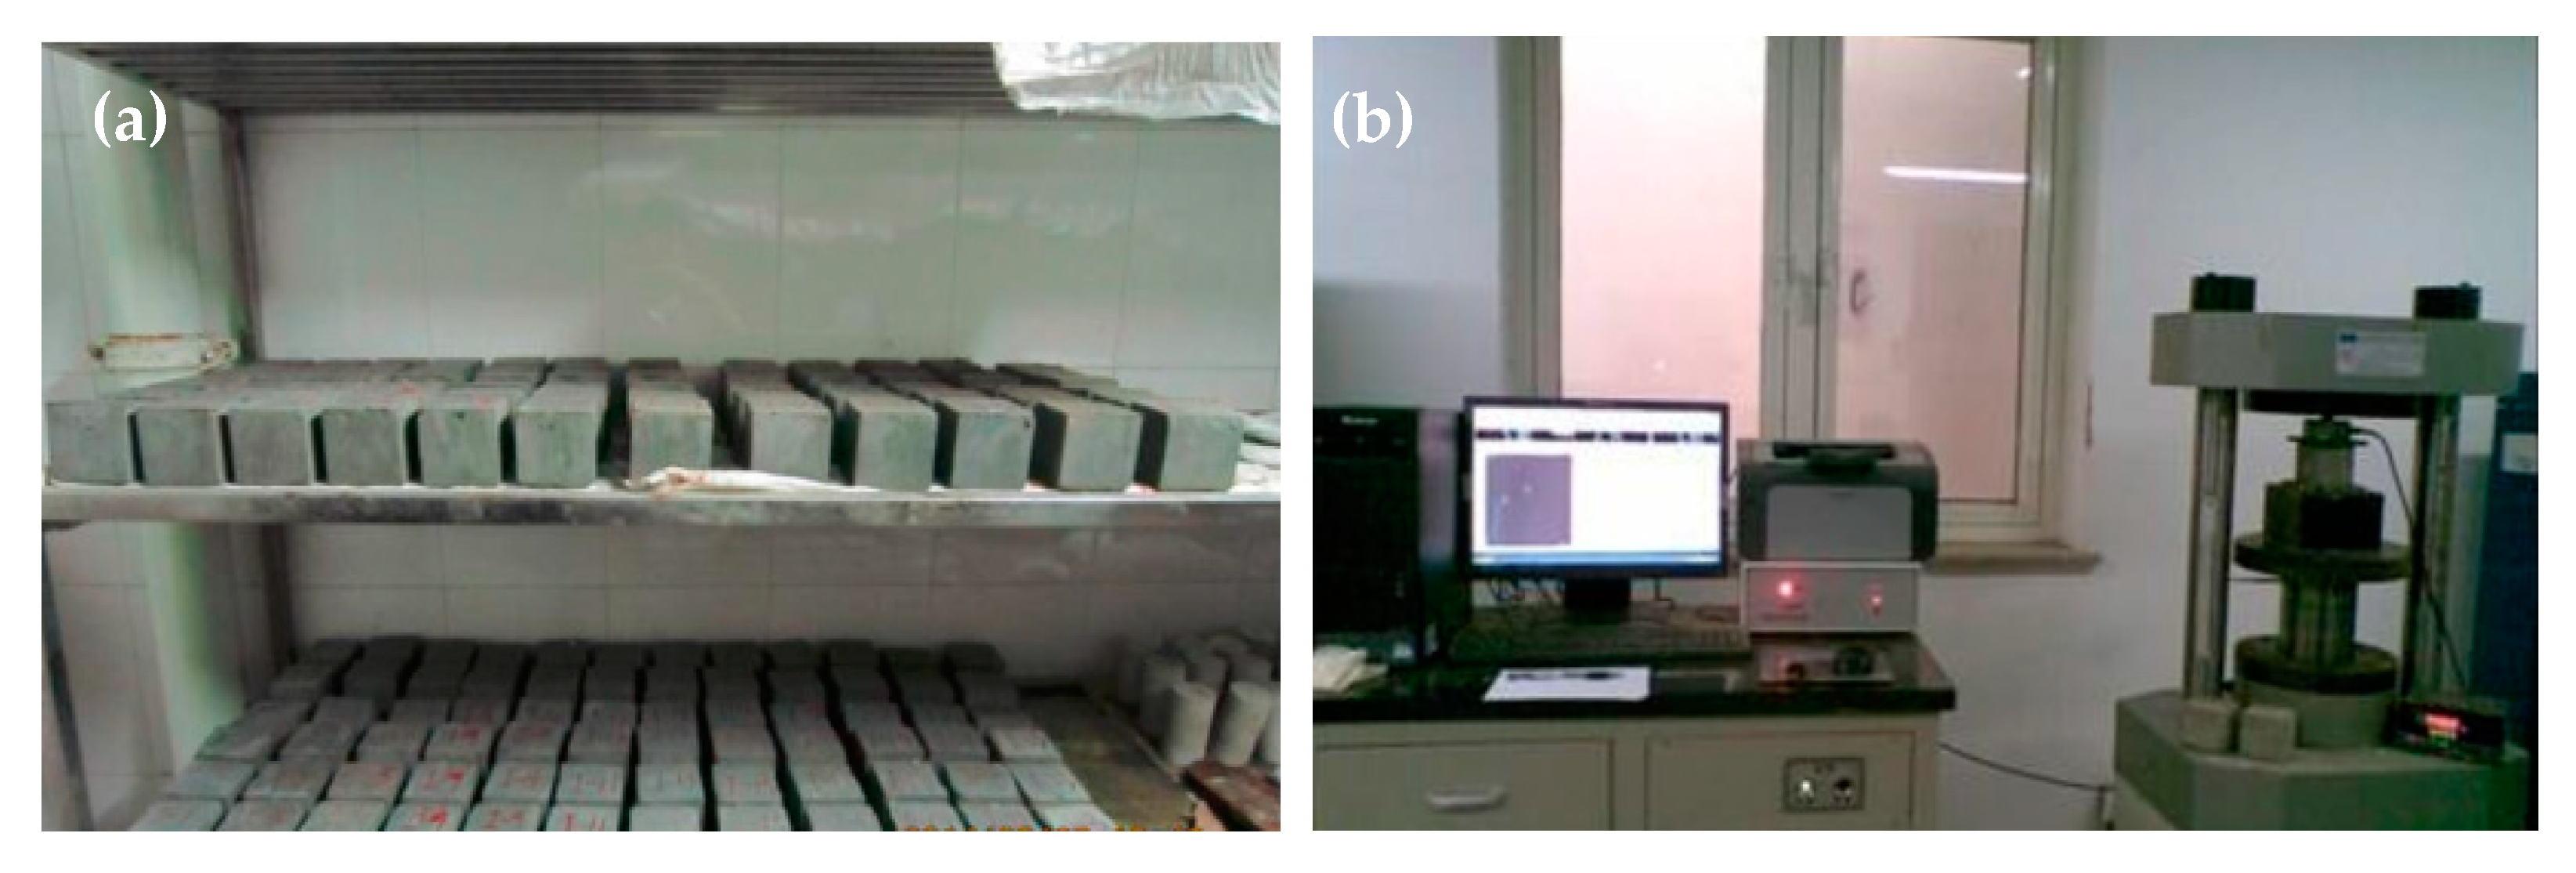
A mixer (UJZ-15) was used for mixing cement, tailings and water. First, the tailings and cement were mixed for 0.5 min, and then with the increase of time, the water was poured into the mixture. The water, cement and tailings were continuously mixed for at least five minutes until the components mixed well. Then, the mixture was poured into the cubical molds (70.1 mm × 70.1 mm × 70.1 mm) and tamped uniformly. After 48 h, the CPB specimen was demolded. Furthermore, the test specimen was placed at a constant temperature (20 ℃) and humidity (90%) for curing (Figure 3a).
A total of 870 specimens were constructed, and were used for obtaining the compressive strength by a hydraulic servo testing machine (Figure 3b), according to Chinese standards (GBT50107-2019 [24]). The standard deviations of UCS test results are given in Table 6. It should be pointed out that the UCS test should normally use ASTM standard, and therefore the cylindrical specimens should be prepared. However, the cubical sample is easier for casting and demolding. Furthermore, a large number of specimens need to find a better way to improve efficiency. Hence, the cubical specimens were applied in this study. According to research by R.L. Hermite, there is a conversion formula between the strength of the cylindrical specimen and the strength of the cubical specimen, as follows:
where fcylinder is the strength of cylindrical specimen (diameter of 150 mm and height of 300 mm, Unit: MPa); fcube is the strength of cubical specimen (side length 70.1 mm, Unit: MPa).
2.2. Applied Machine Learning Models
In this study, seven machine learning models, i.e., back-propagation neural network (BPNN), support vector machine (SVM), decision tree (DT), random forest (RF), k-nearest neighbors (KNN), mixed logistic regression (MLR) and logistic regression (LR) were utilized for the prediction of the UCS of CPB [25,26,27,28,29]. In these models, the input variables were set as cement types, curing time, coarse tailings-cement ratio, fine tailings percentage and solids-water ratio, while the UCS is the output. These machine learning algorithms are widely used in regression problems, such as the prediction of concrete properties, prediction of rock properties and prediction of rockburst events. However, these models have not been compared, especially in CPB materials. Thus, it is necessary to compare them and find the best model to predict the UCS of CPB.
2.3. Building Waste Heat Simulation with EnergyPlus
As for the performance of a machine learning model, the evaluation method is critical, as it can help the researcher to find the optimum algorithm for application. In this study, the dataset was split into two parts i.e., training set (70%) and testing set (30%) [30]. Then, the 10-fold cross-validation approach was used for validation in each dataset. According to the literature, the correlation coefficient (R) and root-mean-square error (RMSE) are utilized in this study for assessing the performance of the applied model and the formula are as follows:
where N is the numbers in the dataset; and are the expected values and real values, respectively; and means the mean predicted values and mean actual values, respectively.
3. Results and Discussion
3.1. The Results of UCS of Cemented Paste Backfill (CPB)
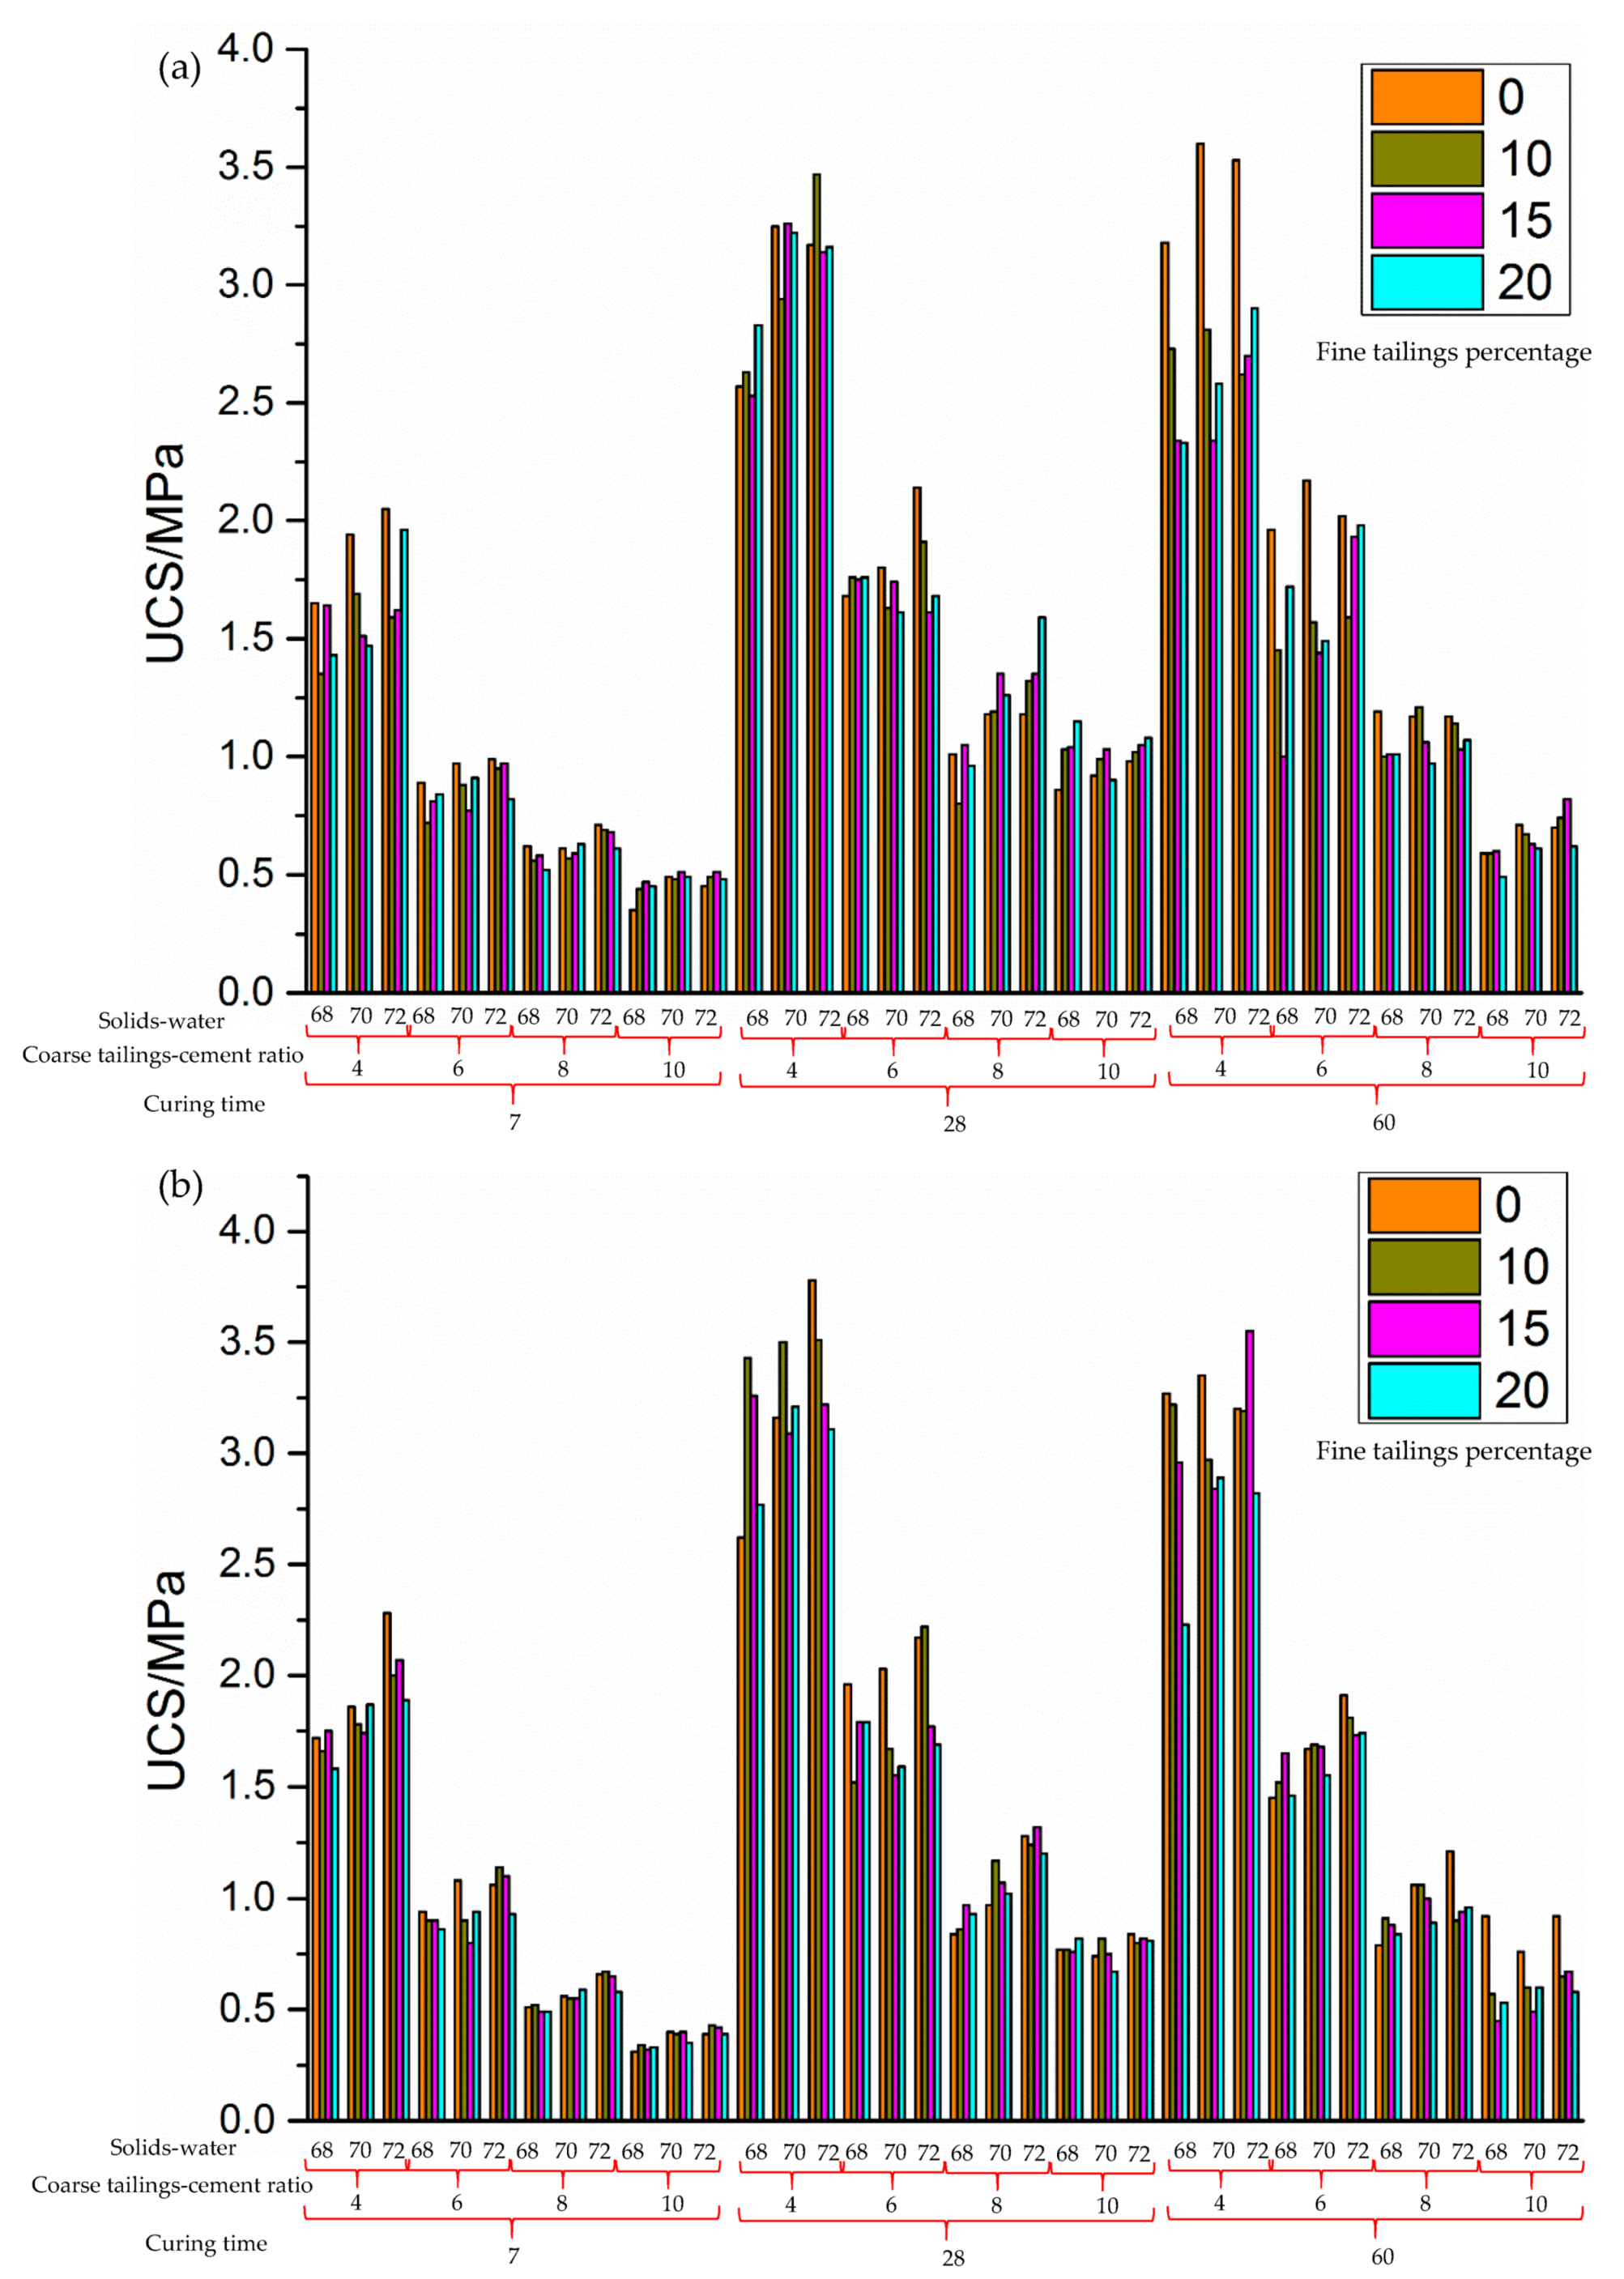
Based on the experimental results, all data are given in Figure 4. It is evident from Figure 4 that, normally, fine tailing percentage plays a negative effect on the cemented paste backfill (CPB) strength, which means that with the decrease of fine tailing, the UCS of CPB increases. However, it should be pointed out that in some cases, the effect of fine tailing is not clear. Moreover, with the increase of curing time, the strength of CPB increases quickly. A similar trend can be found in the solids to water ratio, and the UCS increases with the increase of that percentage. However, the strength decreases with the increase of the tailing to cement ratio. Cement types also affect the strength of CPB. The CPB with #2 cement has a higher strength than that with cement #1. The results obtained from the laboratory are consistent with the literature mentioned before, indicating that the dataset is reliable and accurate.
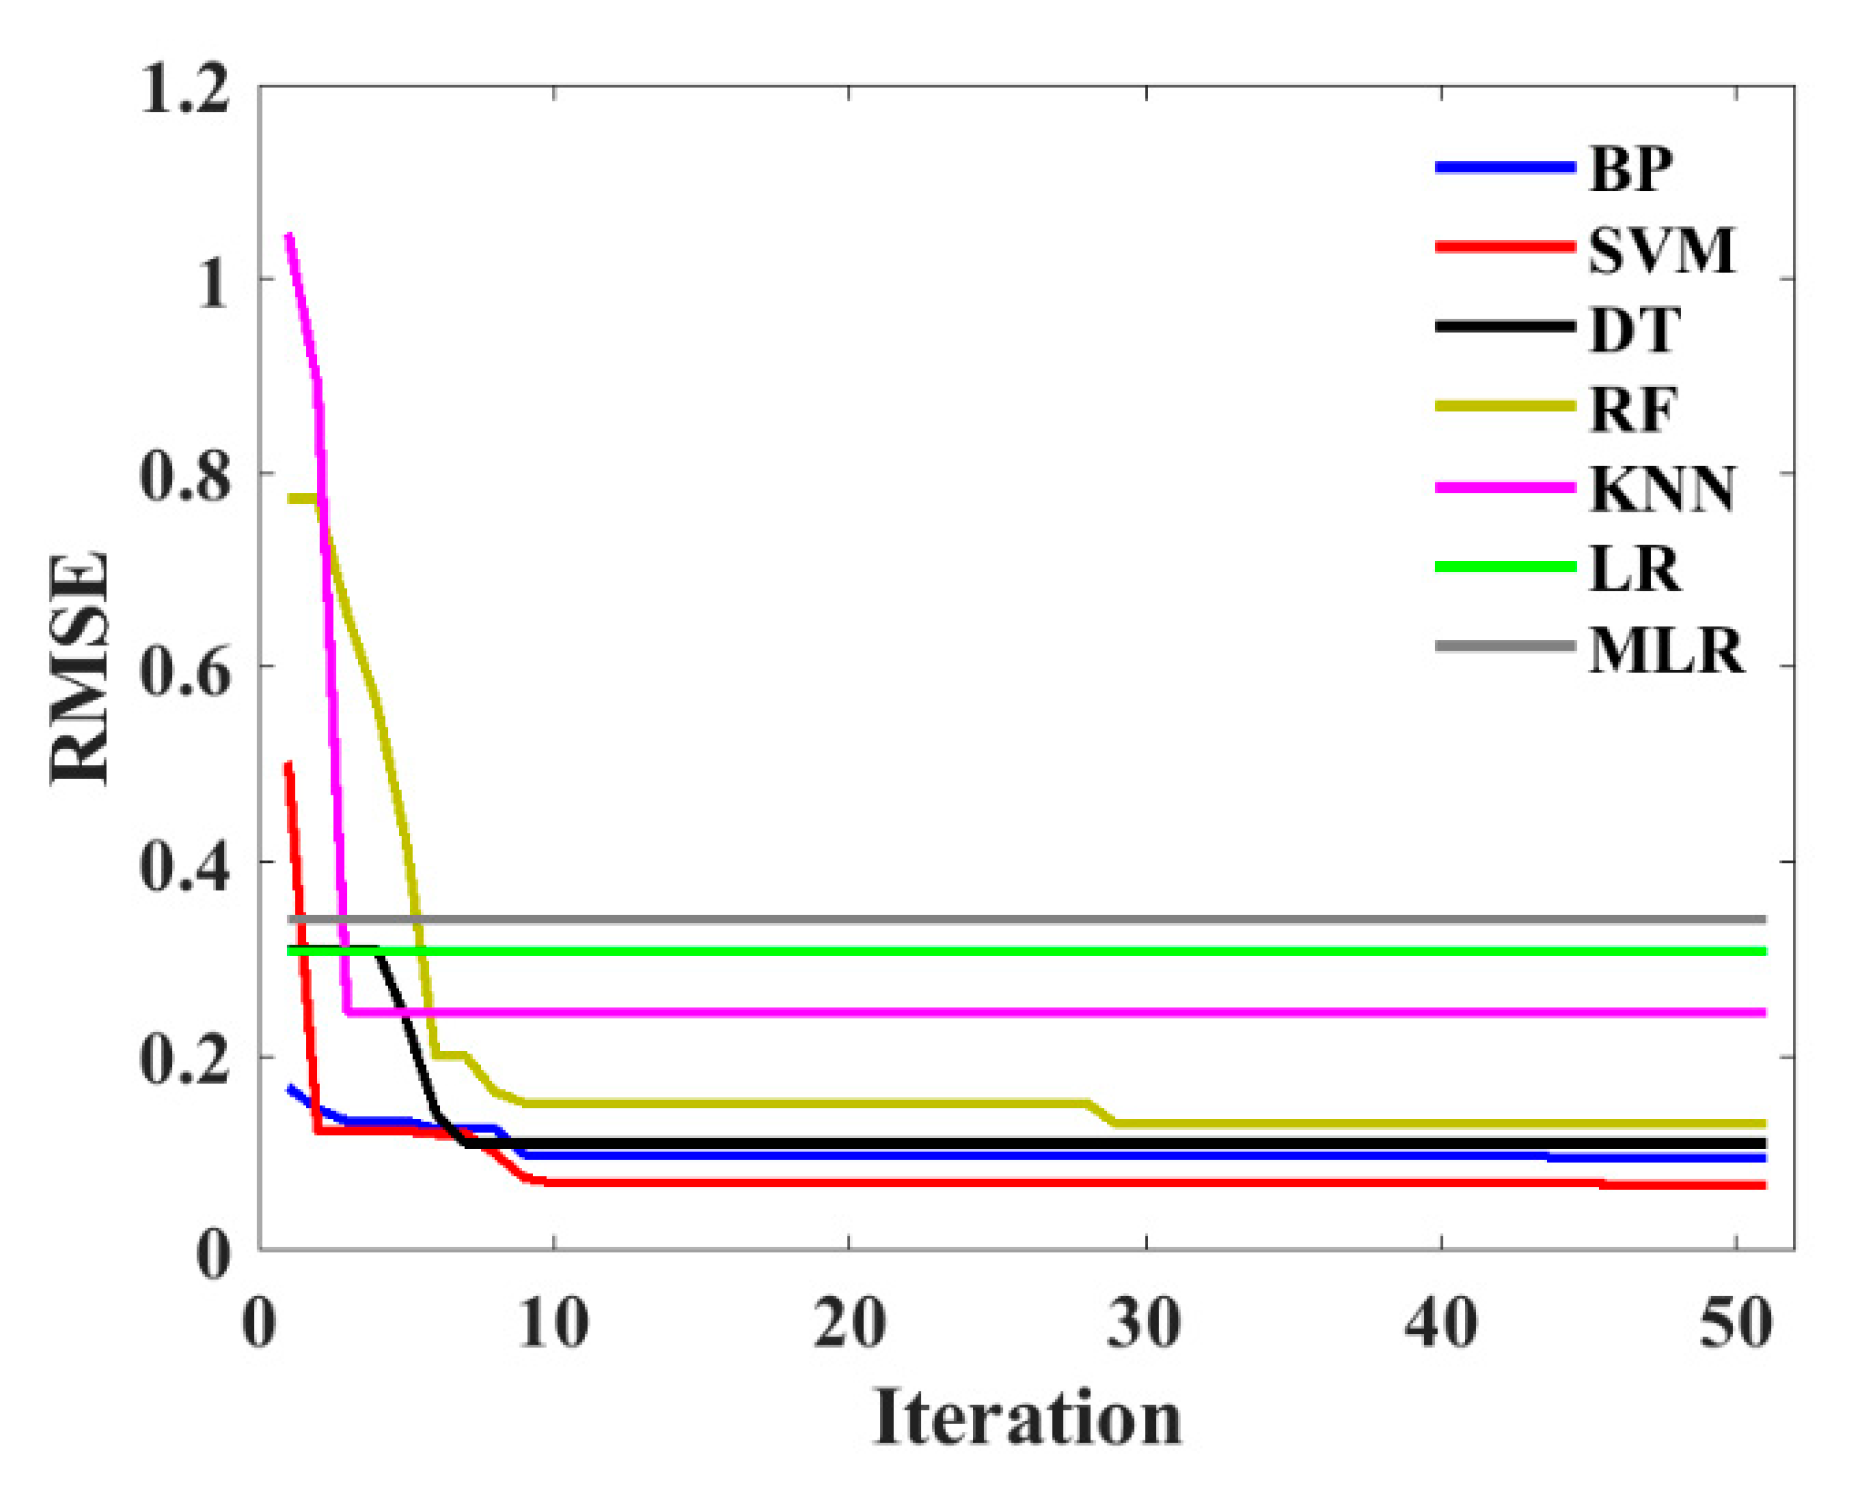
3.2. Hyper-Parameters Tuning
For different machine learning models, the BAS is used for finding the optimum hyperparameters. As can be seen from Figure 5, the RMSE decreased quickly after several iterations, and then the value was kept stable, which means that the BAS can tune these models effectively. Moreover, from Figure 5, it is clear that the SVM model can achieve the smallest RMSE after 10 iterations due to the BAS tuning, while the BAS is inefficient in the LR and MLR models.
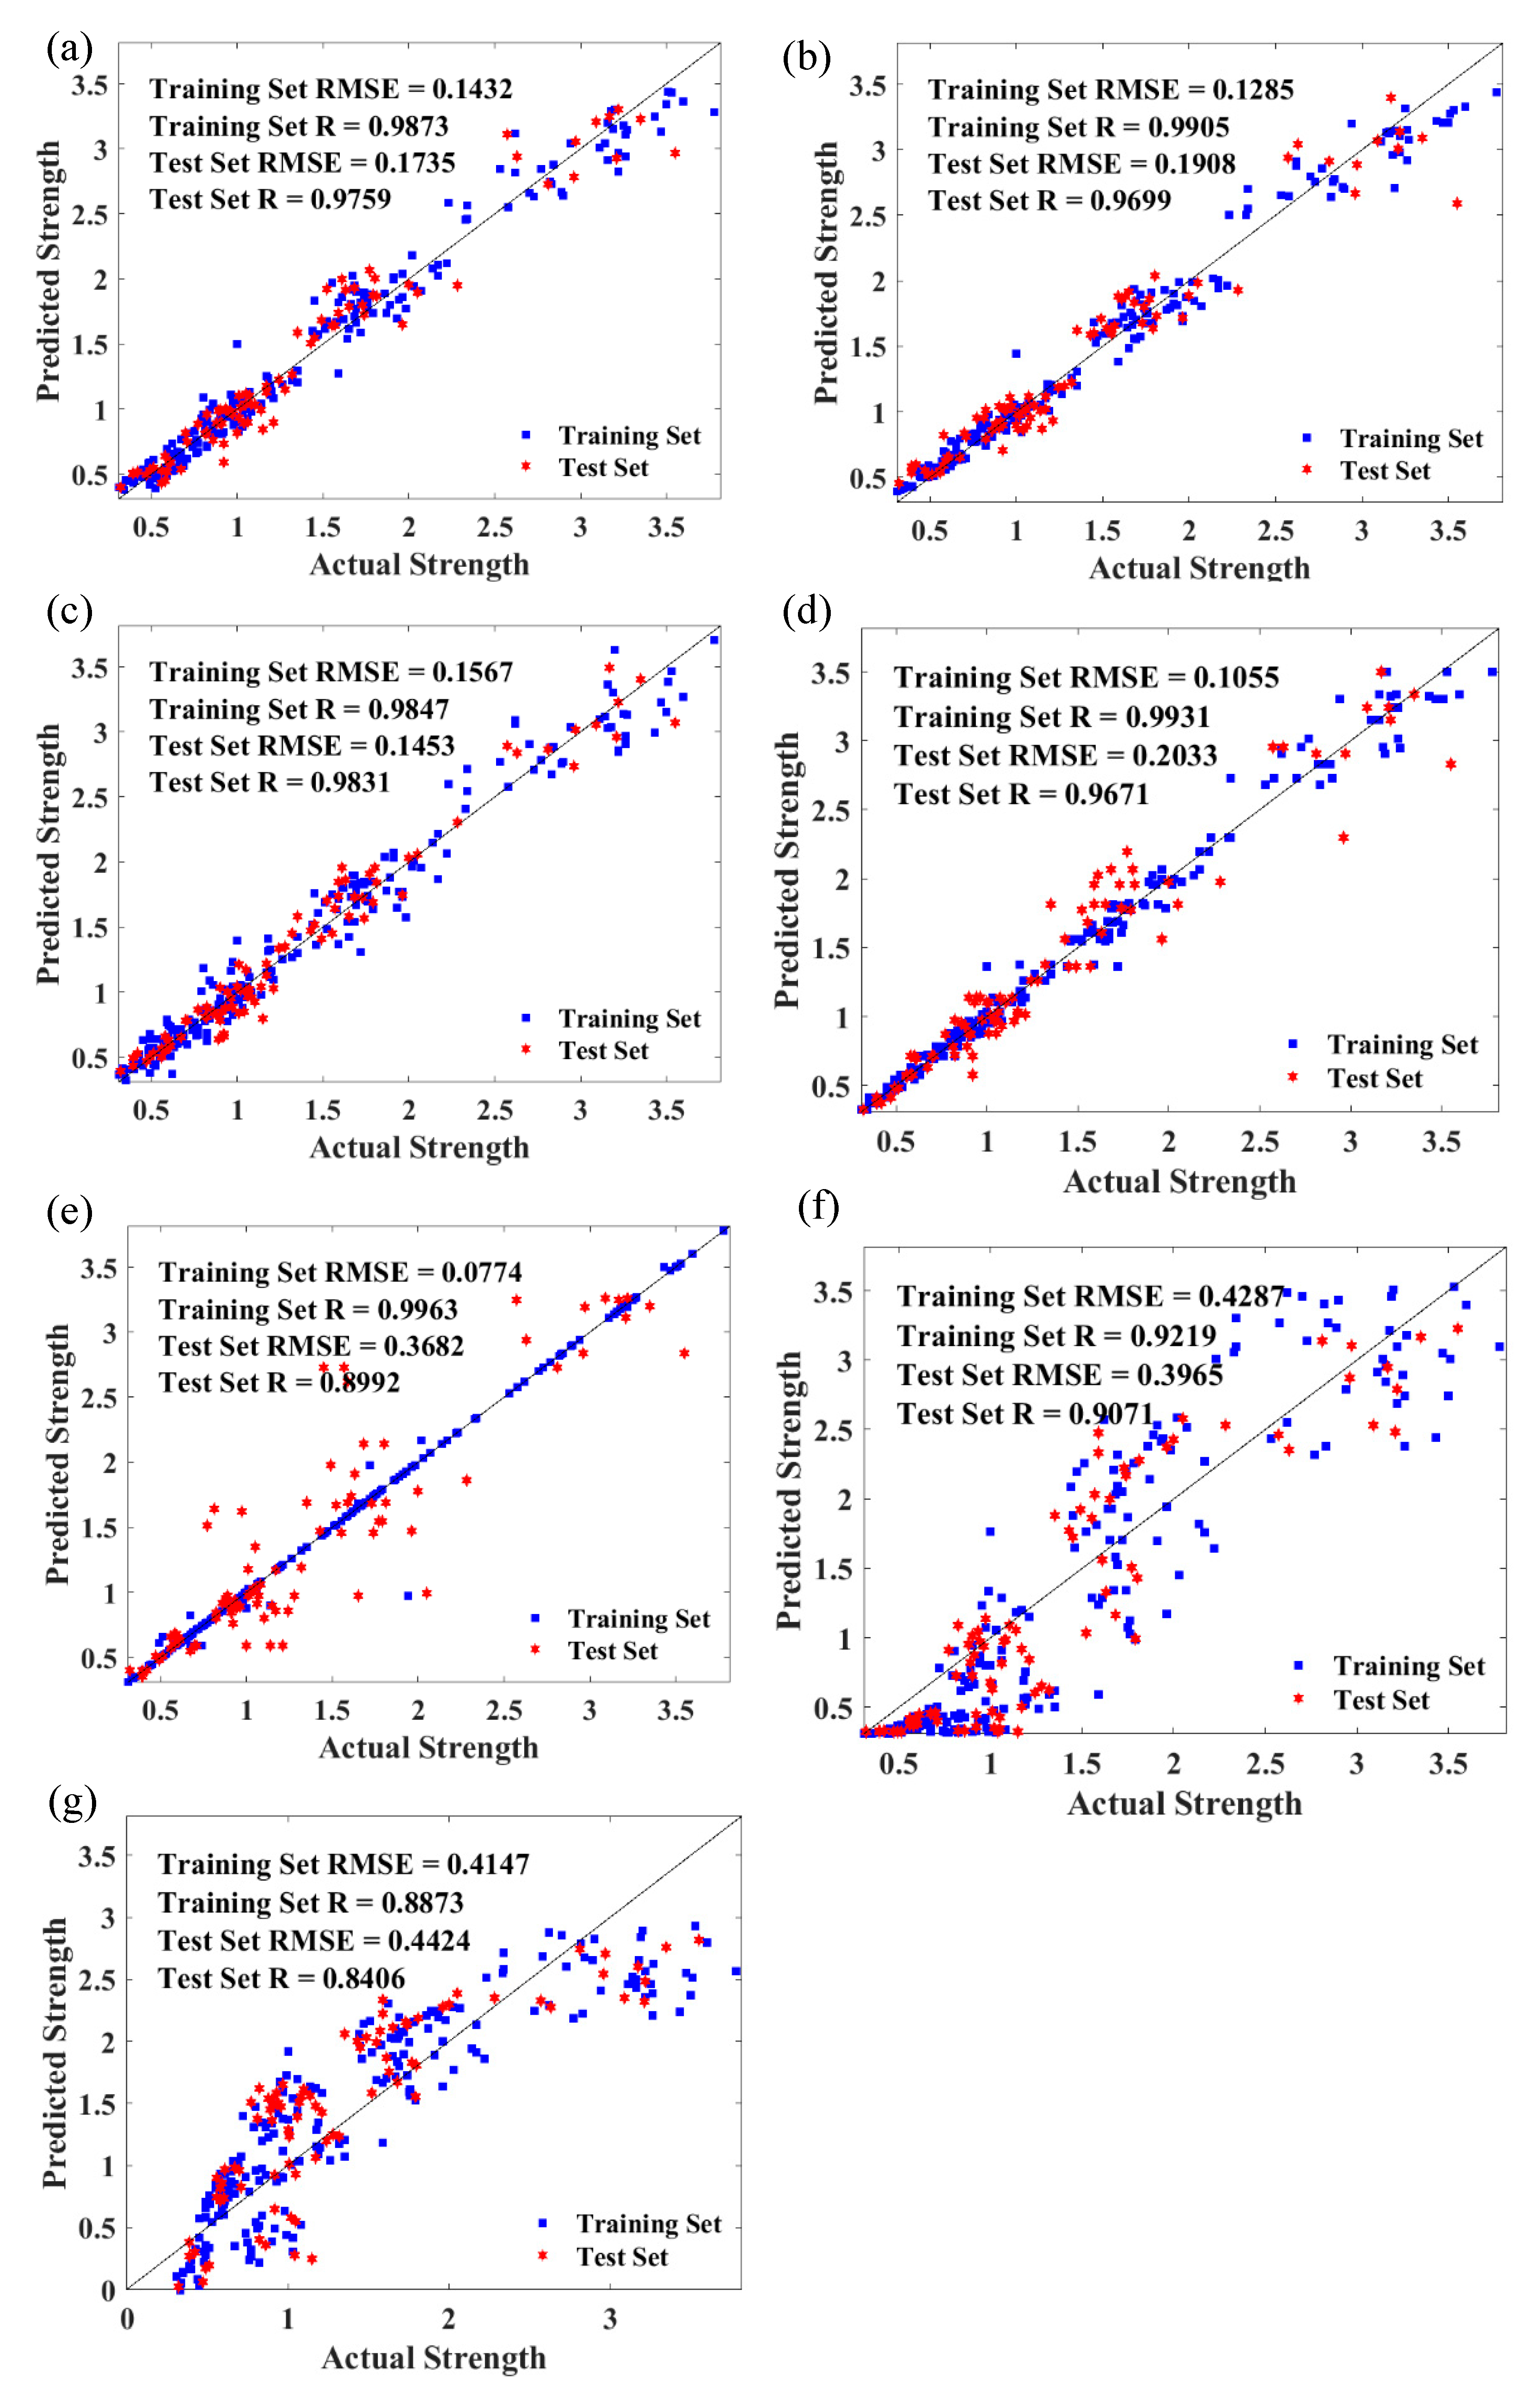
3.3. Model Evaluation
The seven models were systematically compared, as shown in Figure 6. The root-mean-square error (RMSE) and R for the training dataset and testing dataset were given in Figure 6. It can be seen that the support vector machine (SVM), random forest (RF), back-propagation (BP) and decision tree (DT) models show better performance than other models. It should be pointed out that for different datasets, the performance of the same model shows different predictive accuracy. For example, k-nearest neighbors (KNN) has the best performance on the training dataset, with the highest R (0.9963) and the lowest RMSE (0.0774), although the KNN model shows a not perfect performance on the testing set, with a low R (0.8992) and a high RMSE (0.3682). As for the LR and MLR, it can be observed that the prediction performance is worse compared with other machine learning models, which indicates that the baseline models are inefficient in this CPB dataset.
3.4. Spatial Variations of Anthropogenic Heat Intensity
The UCS of CPB can be effectively predicted by the proposed model, and then the relative importance of variables can also be accurately determined by machine learning models. In the study, the RF model was used for calculating variable importance, and the results were presented in Figure 7. It is evident that the ratio between tailings and cement is the most important variable over the others, which has an influencing score of 7.06. Curing time (5.593) also works as an important parameter in the UCS of CPB, followed by the solids to water ratio (0.85) and fine sand. However, the cement type (0.413) has the least importance on the strength of CPB, which means that engineers should pay more attention to cement content. Furthermore, adding more cement can obviously increase the CPB strength. The above results are quite useful for CPB application, and can guide the field study.
4. Conclusions
Based on a series of experimental studies of CPB, the dataset was constructed, and was used for evaluating the proposed models. Seven machine learning models were applied for predicting the strength of CPB, and then different models were compared. The relative results are as follows:
- The results of UCS of CPB shows that with the increase of ratio between solids and water ratio, as well as curing time, the UCS of CPB increased, while the strength of CPB declined with the increase of fine sand percentage and the tailing to cement ratio.
- According to the prediction models, the SVM RF, BP and DT models can predict the UCS of CPB effectively and accurately, although the KNN, LR and MLR have a relatively worse performance on the prediction.
- The tailing to cement ratio can affects the strength of CPB obvious, followed by Curing time, solids to water ratio, fine sand, and cement type, which can guide the CPB application in the field.
It should be pointed out that the accuracy and reliability of machine learning algorithms depend on the dataset, i.e., the number and types of samples. Thus, in the future, more samples should be obtained and more efficient models should be proposed.
Author Contributions
Conceptualization, J.L.; methodology, J.L. and J.H.; writing—original draft preparation, J.L. and S.Y.; writing—review and editing, G.L.; supervision, J.H. All authors have read and agreed to the published version of the manuscript.
Funding
This study was financially supported by the “Fundamental Research Funds for the Central Universities (grant number: 2020ZDPY0221)”.
Conflicts of Interest
The authors declare no conflict of interest.
References
- Qi, C.; Fourie, A.; Chen, Q.; Zhang, Q. A strength prediction model using artificial intelligence for recycling waste tailings as cemented paste backfill. J. Clean. Prod. 2018, 183, 566–578. [Google Scholar] [CrossRef]
- Chen, Q.-S.; Zhang, Q.-L.; Fourie, A.; Chen, X.; Qi, C.-C. Experimental investigation on the strength characteristics of cement paste backfill in a similar stope model and its mechanism. Constr. Build. Mater. 2017, 154, 34–43. [Google Scholar] [CrossRef]
- Qi, C.; Fourie, A. Cemented paste backfill for mineral tailings management: Review and future perspectives. Miner. Eng. 2019, 144, 106025. [Google Scholar] [CrossRef]
- Belem, T.; Benzaazoua, M.; Bussière, B. Mechanical behaviour of cemented paste backfill. In Proceedings of the 53rd Canadian Geotechnical Conference, Montreal, QC, Canada, 15–18 October 2000; pp. 373–380. [Google Scholar]
- Benzaazoua, M.; Bussière, B.; Demers, I.; Aubertin, M.; Fried, É.; Blier, A. Integrated mine tailings management by combining environmental desulphurization and cemented paste backfill: Application to mine doyon, Quebec, Canada. Miner. Eng. 2008, 21, 330–340. [Google Scholar] [CrossRef]
- Qi, C.; Tang, X.; Dong, X.; Chen, Q.; Fourie, A.; Liu, E. Towards intelligent mining for backfill: A genetic programming-based method for strength forecasting of cemented paste backfill. Miner. Eng. 2019, 133, 69–79. [Google Scholar] [CrossRef]
- Qi, C.; Chen, Q.; Fourie, A.; Zhang, Q. An intelligent modelling framework for mechanical properties of cemented paste backfill. Miner. Eng. 2018, 123, 16–27. [Google Scholar] [CrossRef]
- Fall, M.; Pokharel, M. Coupled effects of sulphate and temperature on the strength development of cemented tailings backfills: Portland cement-paste backfill. Cem. Concr. Compos. 2010, 32, 819–828. [Google Scholar] [CrossRef]
- Komurlu, E.; Kesimal, A.; Demir, S. Experimental and numerical analyses on determination of indirect (splitting) tensile strength of cemented paste backfill materials under different loading apparatus. Geomech. Eng. 2016, 10, 775–791. [Google Scholar] [CrossRef]
- Sun, Y.; Li, G.; Zhang, J.; Sun, J.; Xu, J. Development of an ensemble intelligent model for assessing the strength of cemented paste backfill. Adv. Civ. Eng. 2020, 2020, 5198583. [Google Scholar] [CrossRef]
- Helinski, M.; Fahey, M.; Fourie, A. Behavior of cemented paste backfill in two mine stopes: Measurements and modeling. J. Geotech. Geoenviron. 2011, 137, 171–182. [Google Scholar] [CrossRef]
- Mashrei, M.A.; Seracino, R.; Rahman, M. Application of artificial neural networks to predict the bond strength of frp-to-concrete joints. Constr. Build. Mater. 2013, 40, 812–821. [Google Scholar] [CrossRef]
- González-Taboada, I.; González-Fonteboa, B.; Martínez-Abella, F.; Pérez-Ordóñez, J.L. Prediction of the mechanical properties of structural recycled concrete using multivariable regression and genetic programming. Constr. Build. Mater. 2016, 106, 480–499. [Google Scholar] [CrossRef]
- Thompson, B.D.; Bawden, W.F.; Grabinsky, M. In situ measurements of cemented paste backfill at the cayeli mine. Can. Geotech. J. 2012, 49, 755–772. [Google Scholar] [CrossRef]
- Sun, Y.; Li, G.; Zhang, J. Developing hybrid machine learning models for estimating the unconfined compressive strength of jet grouting composite: A comparative study. Appl. Sci. 2020, 10, 1612. [Google Scholar] [CrossRef]
- Kolovos, K.G.; Asteris, P.G.; Tsivilis, S. Properties of sandcrete mixtures modified with metakaolin. Eur. J. Environ. Civ. Eng. 2016, 20, s18–s37. [Google Scholar] [CrossRef]
- Ouellet, S.; Bussière, B.; Aubertin, M.; Benzaazoua, M. Microstructural evolution of cemented paste backfill: Mercury intrusion porosimetry test results. Cem. Concr. Res. 2007, 37, 1654–1665. [Google Scholar] [CrossRef]
- Zhang, J.; Li, D.; Wang, Y. Toward intelligent construction: Prediction of mechanical properties of manufactured-sand concrete using tree-based models. J. Clean. Prod. 2020, 258, 120665. [Google Scholar] [CrossRef]
- Sun, J.; Zhang, J.; Gu, Y.; Huang, Y.; Sun, Y.; Ma, G. Prediction of permeability and unconfined compressive strength of pervious concrete using evolved support vector regression. Constr. Build. Mater. 2019, 207, 440–449. [Google Scholar] [CrossRef]
- Sun, Y.; Li, G.; Zhang, J.; Qian, D. Prediction of the strength of rubberized concrete by an evolved random forest model. Adv. Civ. Eng. 2019, 2019, 1643529. [Google Scholar] [CrossRef] [Green Version]
- Zhang, J.; Huang, Y.; Ma, G.; Sun, J.; Nener, B. A metaheuristic-optimized multi-output model for predicting multiple properties of pervious concrete. Constr. Build. Mater. 2020, 249, 118803. [Google Scholar] [CrossRef]
- Le, L.T.; Nguyen, H.; Dou, J.; Zhou, J. A comparative study of pso-ann, ga-ann, ica-ann, and abc-ann in estimating the heating load of buildings’ energy efficiency for smart city planning. Appl. Sci. 2019, 9, 2630. [Google Scholar] [CrossRef] [Green Version]
- Sun, Y.; Zhang, J.; Li, G.; Wang, Y.; Sun, J.; Jiang, C. Optimized neural network using beetle antennae search for predicting the unconfined compressive strength of jet grouting coalcretes. Int. J. Numer. Anal. Methods Geomech. 2019, 43, 801–813. [Google Scholar] [CrossRef]
- GBT50107-2019. Standard for Inspection and Evaluation of Concrete Strength; Ministry of urban and rural construction and environmental protection of the people’s Republic of China: Beijing, China, 2019. [Google Scholar]
- Sun, Y.; Zhang, J.; Li, G.; Ma, G.; Huang, Y.; Sun, J.; Wang, Y.; Nener, B. Determination of young’s modulus of jet grouted coalcretes using an intelligent model. Eng. Geol. 2019, 252, 43–53. [Google Scholar] [CrossRef]
- Qi, C.; Fourie, A.; Chen, Q. Neural network and particle swarm optimization for predicting the unconfined compressive strength of cemented paste backfill. Constr. Build. Mater. 2018, 159, 473–478. [Google Scholar] [CrossRef]
- Qi, C.-C. Big data management in the mining industry. Int. J. Miner. Metall. Mater. 2020, 27, 131–139. [Google Scholar] [CrossRef]
- Sun, Y.; Li, G.; Zhang, N.; Chang, Q.; Xu, J.; Zhang, J. Development of ensemble learning models to evaluate the strength of coal-grout materials. Int. J. Min. Sci. Technol. 2020. [Google Scholar] [CrossRef]
- Zhang, J.; Huang, Y.; Aslani, F.; Ma, G.; Nener, B. A hybrid intelligent system for designing optimal proportions of recycled aggregate concrete. J. Clean. Prod. 2020, 273, 122922. [Google Scholar] [CrossRef]
- Zhang, J.; Huang, Y.; Wang, Y.; Ma, G. Multi-objective optimization of concrete mixture proportions using machine learning and metaheuristic algorithms. Constr. Build. Mater. 2020, 253, 119208. [Google Scholar] [CrossRef]
Figure 1.
Results of X-ray diffraction (XRD) for coarse tailings and fine tailings: (a) coarse tailings; (b) fine tailings.
Figure 1.
Results of X-ray diffraction (XRD) for coarse tailings and fine tailings: (a) coarse tailings; (b) fine tailings.

Figure 2.
The particle size distribution of fine tailings and coarse tailings.

Figure 3.
CPB specimen and its UCS test: (a) Prepared specimen; (b) UCS tests.

Figure 4.
UCS test results of CPB in 4D. (a) 1# cement; (b) 2# cement.

Figure 5.
Root-mean-square error (RMSE) versus iterations.

Figure 6.
Comparison of different models: (a) support vector machine (SVM); (b) random forest (RF); (c) back-propagation (BP); (d) decision tree (DT); (e) k-nearest neighbors (KNN); (f) logistic regression (LR); and (g) mixed logistic regression (MLR).
Figure 6.
Comparison of different models: (a) support vector machine (SVM); (b) random forest (RF); (c) back-propagation (BP); (d) decision tree (DT); (e) k-nearest neighbors (KNN); (f) logistic regression (LR); and (g) mixed logistic regression (MLR).

Figure 7.
Variable importance of CPB.


Table 1.
Mineralogical composition of coarse tailings.
| Elements | SiO2 | Al2O3 | TFe | FeO | MgO | CaO | Na2O |
|---|---|---|---|---|---|---|---|
| Content % | 46.52 | 6.2 | 7.86 | 5.44 | 8.99 | 19.2 | 1.64 |
| Elements | K2O | TiO2 | P2O5 | MnO | S | Cu | Zn |
| Content % | 0.25 | 0.27 | 0.18 | 0.21 | 0.61 | 0.11 | 5.08 |
Table 2.
Mineralogical composition of fine tailings.
| Elements | SiO2 | Al2O3 | TFe | FeO | MgO | CaO | Na2O |
|---|---|---|---|---|---|---|---|
| Content % | 43.4 | 5.67 | 8.56 | 7.43 | 10.65 | 18.89 | 1.44 |
| Elements | K2O | TiO2 | P2O5 | MnO | S | Cu | Zn |
| Content % | 0.31 | 0.25 | 0.25 | 0.19 | 0.94 | 0.2 | 6.14 |
Table 3.
The tests results of different cement.
| Sample | Fineness (<0.0045 mm/%) | Initial Setting Time/min | Final Setting Time/min | 28d-UCS/MPa | 28d-Flexural Strength/MPa |
|---|---|---|---|---|---|
| #1 | 23.2 | 240 | 305 | 30.7 | 6.5 |
| #2 | 6 | 180 | 255 | 39.8 | 8 |
Table 4.
Results of chemical element analysis of water.
| Program | Results/(mg/L) | Program | Results/(mg/L) |
|---|---|---|---|
| Al | 0.39 | Li | <0.05 |
| As | <0.05 | Mg | 20.8 |
| Ba | 0.058 | Mn | 0.22 |
| Be | <0.05 | Ni | <0.05 |
| Bi | 0.074 | Pb | <0.05 |
| Ca | 6.26 | Sb | <0.05 |
| Cd | <0.05 | Sn | <0.05 |
| Co | <0.05 | Sr | 6.74 |
| Cr | <0.05 | Ti | <0.05 |
| Cu | <0.05 | V | <0.05 |
| Fe | 0.15 | Zn | <0.05 |
Table 5.
The experimental design of CPB.
| Cement Types | Coarse Tailings-Cement Ratio | Fine Tailings Percentage | Solids-Water Ratio | Curing Time (Days) |
|---|---|---|---|---|
| #1 | 4 | 0% | 0.68 | 7 |
| #2 | 6 | 10% | 0.70 | 28 |
| 8 | 15% | 0.72 | 60 | |
| 10 | 20% |
Table 6.
The standard deviations of UCS test results.
| Cement Type | Curing Time (Days) | Standard Deviations of UCS |
|---|---|---|
| #1 | 7 | 0.47 |
| 28 | 0.81 | |
| 60 | 0.85 | |
| #2 | 7 | 0.57 |
| 28 | 0.96 | |
| 60 | 0.94 |
Publisher’s Note: MDPI stays neutral with regard to jurisdictional claims in published maps and institutional affiliations. |
© 2020 by the authors. Licensee MDPI, Basel, Switzerland. This article is an open access article distributed under the terms and conditions of the Creative Commons Attribution (CC BY) license (http://creativecommons.org/licenses/by/4.0/).
Share and Cite
MDPI and ACS Style
Liu, J.; Li, G.; Yang, S.; Huang, J. Prediction Models for Evaluating the Strength of Cemented Paste Backfill: A Comparative Study. Minerals 2020, 10, 1041. https://0-doi-org.brum.beds.ac.uk/10.3390/min10111041
AMA Style
Liu J, Li G, Yang S, Huang J. Prediction Models for Evaluating the Strength of Cemented Paste Backfill: A Comparative Study. Minerals. 2020; 10(11):1041. https://0-doi-org.brum.beds.ac.uk/10.3390/min10111041
Chicago/Turabian StyleLiu, Jiandong, Guichen Li, Sen Yang, and Jiandong Huang. 2020. "Prediction Models for Evaluating the Strength of Cemented Paste Backfill: A Comparative Study" Minerals 10, no. 11: 1041. https://0-doi-org.brum.beds.ac.uk/10.3390/min10111041
Note that from the first issue of 2016, this journal uses article numbers instead of page numbers. See further details here.