Article

Optimization of the Mix Formulation of Geopolymer Using Nickel-Laterite Mine Waste and Coal Fly Ash

by
Alberto Longos, Jr.
1,*,
April Anne Tigue
1,
Ithan Jessemar Dollente
1,
Roy Alvin Malenab
1,
Ivyleen Bernardo-Arugay
2,
Hirofumi Hinode
3,
Winarto Kurniawan
3 and
Michael Angelo Promentilla
1,4,*
1
Department of Chemical Engineering, De La Salle University, Manila 1004, Philippines
2
Department of Materials and Resources Engineering and Technology, MSU-Iligan Institute of Technology, Iligan 9200, Philippines
3
Department of Transdisciplinary Science and Engineering, Tokyo Institute of Technology, 2-12-1 Ookayama, Meguro-ku, Tokyo 152-8550, Japan
4
Center for Engineering and Sustainable Development Research, De La Salle University, Manila 1004, Philippines
*
Authors to whom correspondence should be addressed.
Submission received: 13 November 2020 / Revised: 16 December 2020 / Accepted: 17 December 2020 / Published: 21 December 2020

Abstract

:
Geopolymer cement has been popularly studied nowadays compared to ordinary Portland cement because it demonstrated superior environmental advantages due to its lower carbon emissions and waste material utilization. This paper focuses on the formulation of geopolymer cement from nickel–laterite mine waste (NMW) and coal fly ash (CFA) as geopolymer precursors, and sodium hydroxide (SH), and sodium silicate (SS) as alkali activators. Different mix formulations of raw materials are prepared to produce a geopolymer based on an I-optimal design and obtained different compressive strengths. A mixed formulation of 50% NMW and 50% CFA, SH-to-SS ratio of 0.5, and an activator-to-precursor ratio of 0.429 yielded the highest 28 d unconfined compressive strength (UCS) of 22.10 ± 5.40 MPa. Furthermore, using an optimized formulation of 50.12% NMW, SH-to-SS ratio of 0.516, and an activator-to-precursor ratio of 0.428, a UCS value of 36.30 ± 3.60 MPa was obtained. The result implies that the synthesized geopolymer material can be potentially used for concrete structures and pavers, pedestrian pavers, light traffic pavers, and plain concrete.

1. Introduction

The rapid increase in construction activity has been observed to meet the ever-increasing infrastructure demands [1]. In most construction activities, cement-based concrete is an essential and widely used material. The use of cement-based concrete, like ordinary Portland cement (OPC), is globally accepted due to ease of operation, excellent mechanical properties, and low-cost production compared to other construction materials [2]. However, OPC has drawbacks as it releases approximately one ton of CO2, a greenhouse gas, to produce one ton of OPC [3]. It also has high energy consumption during production, and it consumes a significant amount of natural resources [2,3]. Due to increasing awareness of these issues, a viable alternative for the conventional Portland cement is currently being reviewed and studied by many researchers and scientists. Geopolymer cement is one of the emerging greener alternatives for the construction industry. It results from the chemical reaction between aluminosilicate waste materials and alkaline activators resulting in the inorganic polymer [3]. It is comprised of repeating units of silico-oxide (Si-O-Si), silico-aluminate (Si-O-Al-O-), ferro-silico-aluminate (-Fe-O-Si-O-Al-O-), or alumino-phosphate (-Al-O-P-O-), created through a process of geopolymerization [4].
Aluminosilicate sources, also called geopolymer precursors, can be sourced out from waste such as fly ash, blast furnace slag, silica fume, and rice husk or a combination of these precursors, which are rich from silicon (Si), aluminum (Al), or iron (Fe) in an amorphous form [5]. Mine waste has also emerged as a potential geopolymer precursor because it contains Si, Al, and Fe. Valorization of such waste would also reduce the environmental burden. For example, thermal and mechanical activations pretreatment were done to Ni-laterite mine waste from the Philippines to enhance its property as a geopolymer precursor [6]. Likewise, gold mine tailings in the Philippines are used to produce geopolymer bricks with a compressive strength of 5.5 MPa [7].
As properties of raw materials for geopolymer precursors could vary from one place to another, it is necessary to perform mix formulation studies to evaluate the potential application of such construction material. For example, using fly ash and granulated blast furnace as precursors, the optimal rational mix design resulted in an improved compressive strength comparable to OPC ranging from 32 to 66 MPa [1]. A statistical mix design of the experiment was also used to optimize the geopolymer properties from the ternary blend of red mud waste, rice husk ash, and diatomaceous earth [8]. Other studies showed that different mixes and combinations of fly ash-mine tailings (MT) mix [9], laterite–calcite, and laterite–slag mix [10], could increase the compressive strength. However, a binary blend of coal fly ash (CFA) and nickel–laterite mine waste (NMW) sourced out from the Philippines as geopolymer precursors have not been explored yet [9]. Thus, this study extends the work described in Longos et al. [6] and apply the statistical design of experiment [8] to determine the optimal mix formulation of coal fly ash (CFA) and nickel–laterite mine waste (NMW) with sodium hydroxide (SH)-sodium silicate (SS) as alkali activators.

2. Materials and Methods

2.1. Raw Material Preparation

Raw NMW was collected from a siltation pond of a nickel–laterite mining company, while CFA was obtained from a coal power plant located in Mindanao, Philippines. Raw materials were oven-dried at 105 °C for 24 h. Dried NMW showed clay-like characteristics, and the clumping of this clayey material facilitated the need for pre-grinding. The dried NMW was reduced in size using a Raijin portable attrition mill pulverizer with a power of 1500 Watts, blade diameter of 150 mm, and rotary speed of 1400 rpm. On the other hand, dried CFA already exhibited the needed fineness and would not need further grinding. Both raw material samples were then screened using a Tyler mesh sieve passing 50 mesh (0.297 mm). Analytical grade sodium silicate (water glass solution with 34.13% SiO2, 14.65% Na2O, 51.22% H2O) with a silica modulus of 2.33, and sodium hydroxide flakes with 98% purity (manufactured by Formosa Plastic Corporation, Kaohsiung, Taiwan) were used in the study as the alkali activator components.

2.2. Raw Material Characterization Procedure

A particle size distribution (PSD) analysis of both raw materials was performed using a Tyler standard sieve series (Thomas Scientific, Swedesboro, NJ, USA.) ranging from mesh 4 to mesh 200 (4.75 mm to 0.075 mm) in a vibrating screen.
The chemical compositions of raw NMW and CFA were performed with X-ray fluorescence spectroscopy using Horiba Scientific XGT-7200 X-ray analytical microscope (Horiba Ltd., Kyoto, Japan) with an X-ray beam generation of 50 kV voltage and 35 A current.
The mineralogical analysis was also performed for both raw materials using a Multiflex Rigaku automated powder x-ray diffractometer (XRD) (Rigaku Corporation, Tokyo, Japan) (λCu Kα = 1.54 Å, Voltage = 40 kV, Current = 30.0 mA) with a measuring angle of 5–60°.
Scanning electron microscope (SEM) captured the morphological images and properties of raw materials using a FESEM Dual Beam Helios Nanolab 600i (FEI, Hillsboro, OR, USA.) with a voltage of 2.0 kV and beam current of 43 pA equipped with energy-dispersive X-ray spectroscopy (EDS) with a voltage of 15.0 kV and a beam current of 0.69 nA.

2.3. Toxicity Characteristic Leaching Procedure (TCLP)

Toxicity characteristic leaching procedure using US EPA Method 1311 was performed for both raw materials. This procedure is to determine the heavy metal leachability property, whether these materials are hazardous or not. The parameters used were liquid to solid ratio of 20:1 and an agitation speed of 30 rpm for 12 h. Leachate was then analyzed using an Agilent Technology inductively coupled plasma–mass spectrometry (ICP-MS) and Agilent 5100 inductively coupled plasma-optical emission spectroscopy (ICP-OES), both are done by a third-party laboratory.

2.4. Thermal Activation of Nickel-Laterite Mine Waste (NMW)

Pretreatment of NMW by thermal activation was performed first before experimental runs were conducted [7]. NMW samples were heat treated in the laboratory furnace at a ramping rate of 10 °C per minute to attain a temperature of 700 °C at a holding time of 2 h. The samples were left inside the furnace to be cooled down to room temperature after soaking at 700 °C.

2.5. Experimental Procedures and Runs

The design of the experiment was based on an I-optimal design, which is a mixture experiment intended to predict the responses for all possible formulations of the mixture and to identify optimal proportions for each of the ingredients minimizing the average variance of prediction. Table 1 shows the factors used in the mixture design like the activator-to-precursor ratio of 0.429 to 1.0 [8,11], NMW-CFA content (% NMW) of 50% to 100% [9,12] and SH-to-SS ratio of 1:2 to 2:1 [10,13].
The performance of the different factors was evaluated independently using runs randomly ordered by Design-Expert 11 (Design-Expert® software, version 11). A total of 18 runs were generated, with three as replicate points. The 18 experimental runs are shown in Table 2 with different combinations of factor levels.

2.6. Geopolymer Synthesis

For geopolymer preparation, run number 15 is the basis of the amounts of raw materials used. A 500 g of precursor (50% NMW + CFA) was prepared and set aside first for mixing later. With an activator-to-precursor of 0.438, the alkali activator was prepared first by mixing 71 g of 12 M sodium hydroxide (SH) with 143 g sodium silicate solution (SS). Then, 250 g of CFA was mixed with the prepared alkali activator. Manual mixing was done for at least 5 min until the consistency of the CFA-activator mixture was homogenized. Another 250 g NMW was then added to the mixture, and the second stage of manual mixing was done for at least 5 min until the consistency of the mixture was homogenized. During mixing, it must be noted that the mixture hardens immediately. After stabilization, the geopolymer was placed in a square mold made of polyethylene material with a dimension of 50 mm × 50 mm × 50 mm. The prepared geopolymer can make 3 square molds. The molded sample was set for at least 24 h before it was demolded. The demolded sample was then placed in a polyethylene Ziploc. Next, the air was removed manually from the Ziploc before sealing. The sealed geopolymer samples were then placed in an oven at 80 °C for 24 h. Lastly, the samples were cured for 28 d at ambient temperature before further test and analysis.

2.7. Unconfined Compressive Strength (UCS)

Unconfined compressive strength (UCS) was the response variable to evaluate the engineering property of the geopolymer specimens. It was performed following ASTM C109/C109M. This test method covers the determination of the compressive strength of hydraulic cement mortars, using 2-inch (50-mm) cube specimens to determine compliance with specifications.

3. Results and Discussions

3.1. Raw Material Characterization

3.1.1. X-ray Fluorescence Spectroscopy (Chemical Composition)

The elemental analysis of NMW and CFA is shown in Table 3, which is primarily composed of oxides of iron (Fe2O3), silicon (SiO2), calcium (CaO), aluminum (Al2O3), magnesium (MgO), and nickel (NiO). Trace elements in both samples include oxides of manganese (MnO), titanium (TiO2), potassium (K2O), and silver (Ag2O). NMW contains an oxide of chromium (Cr2O3), which is not present in CFA but contains oxides of strontium (SrO) and sulfur (SO3). The composition of both raw materials showed that it could be a geopolymer precursor because of the high presence of silica and alumina.

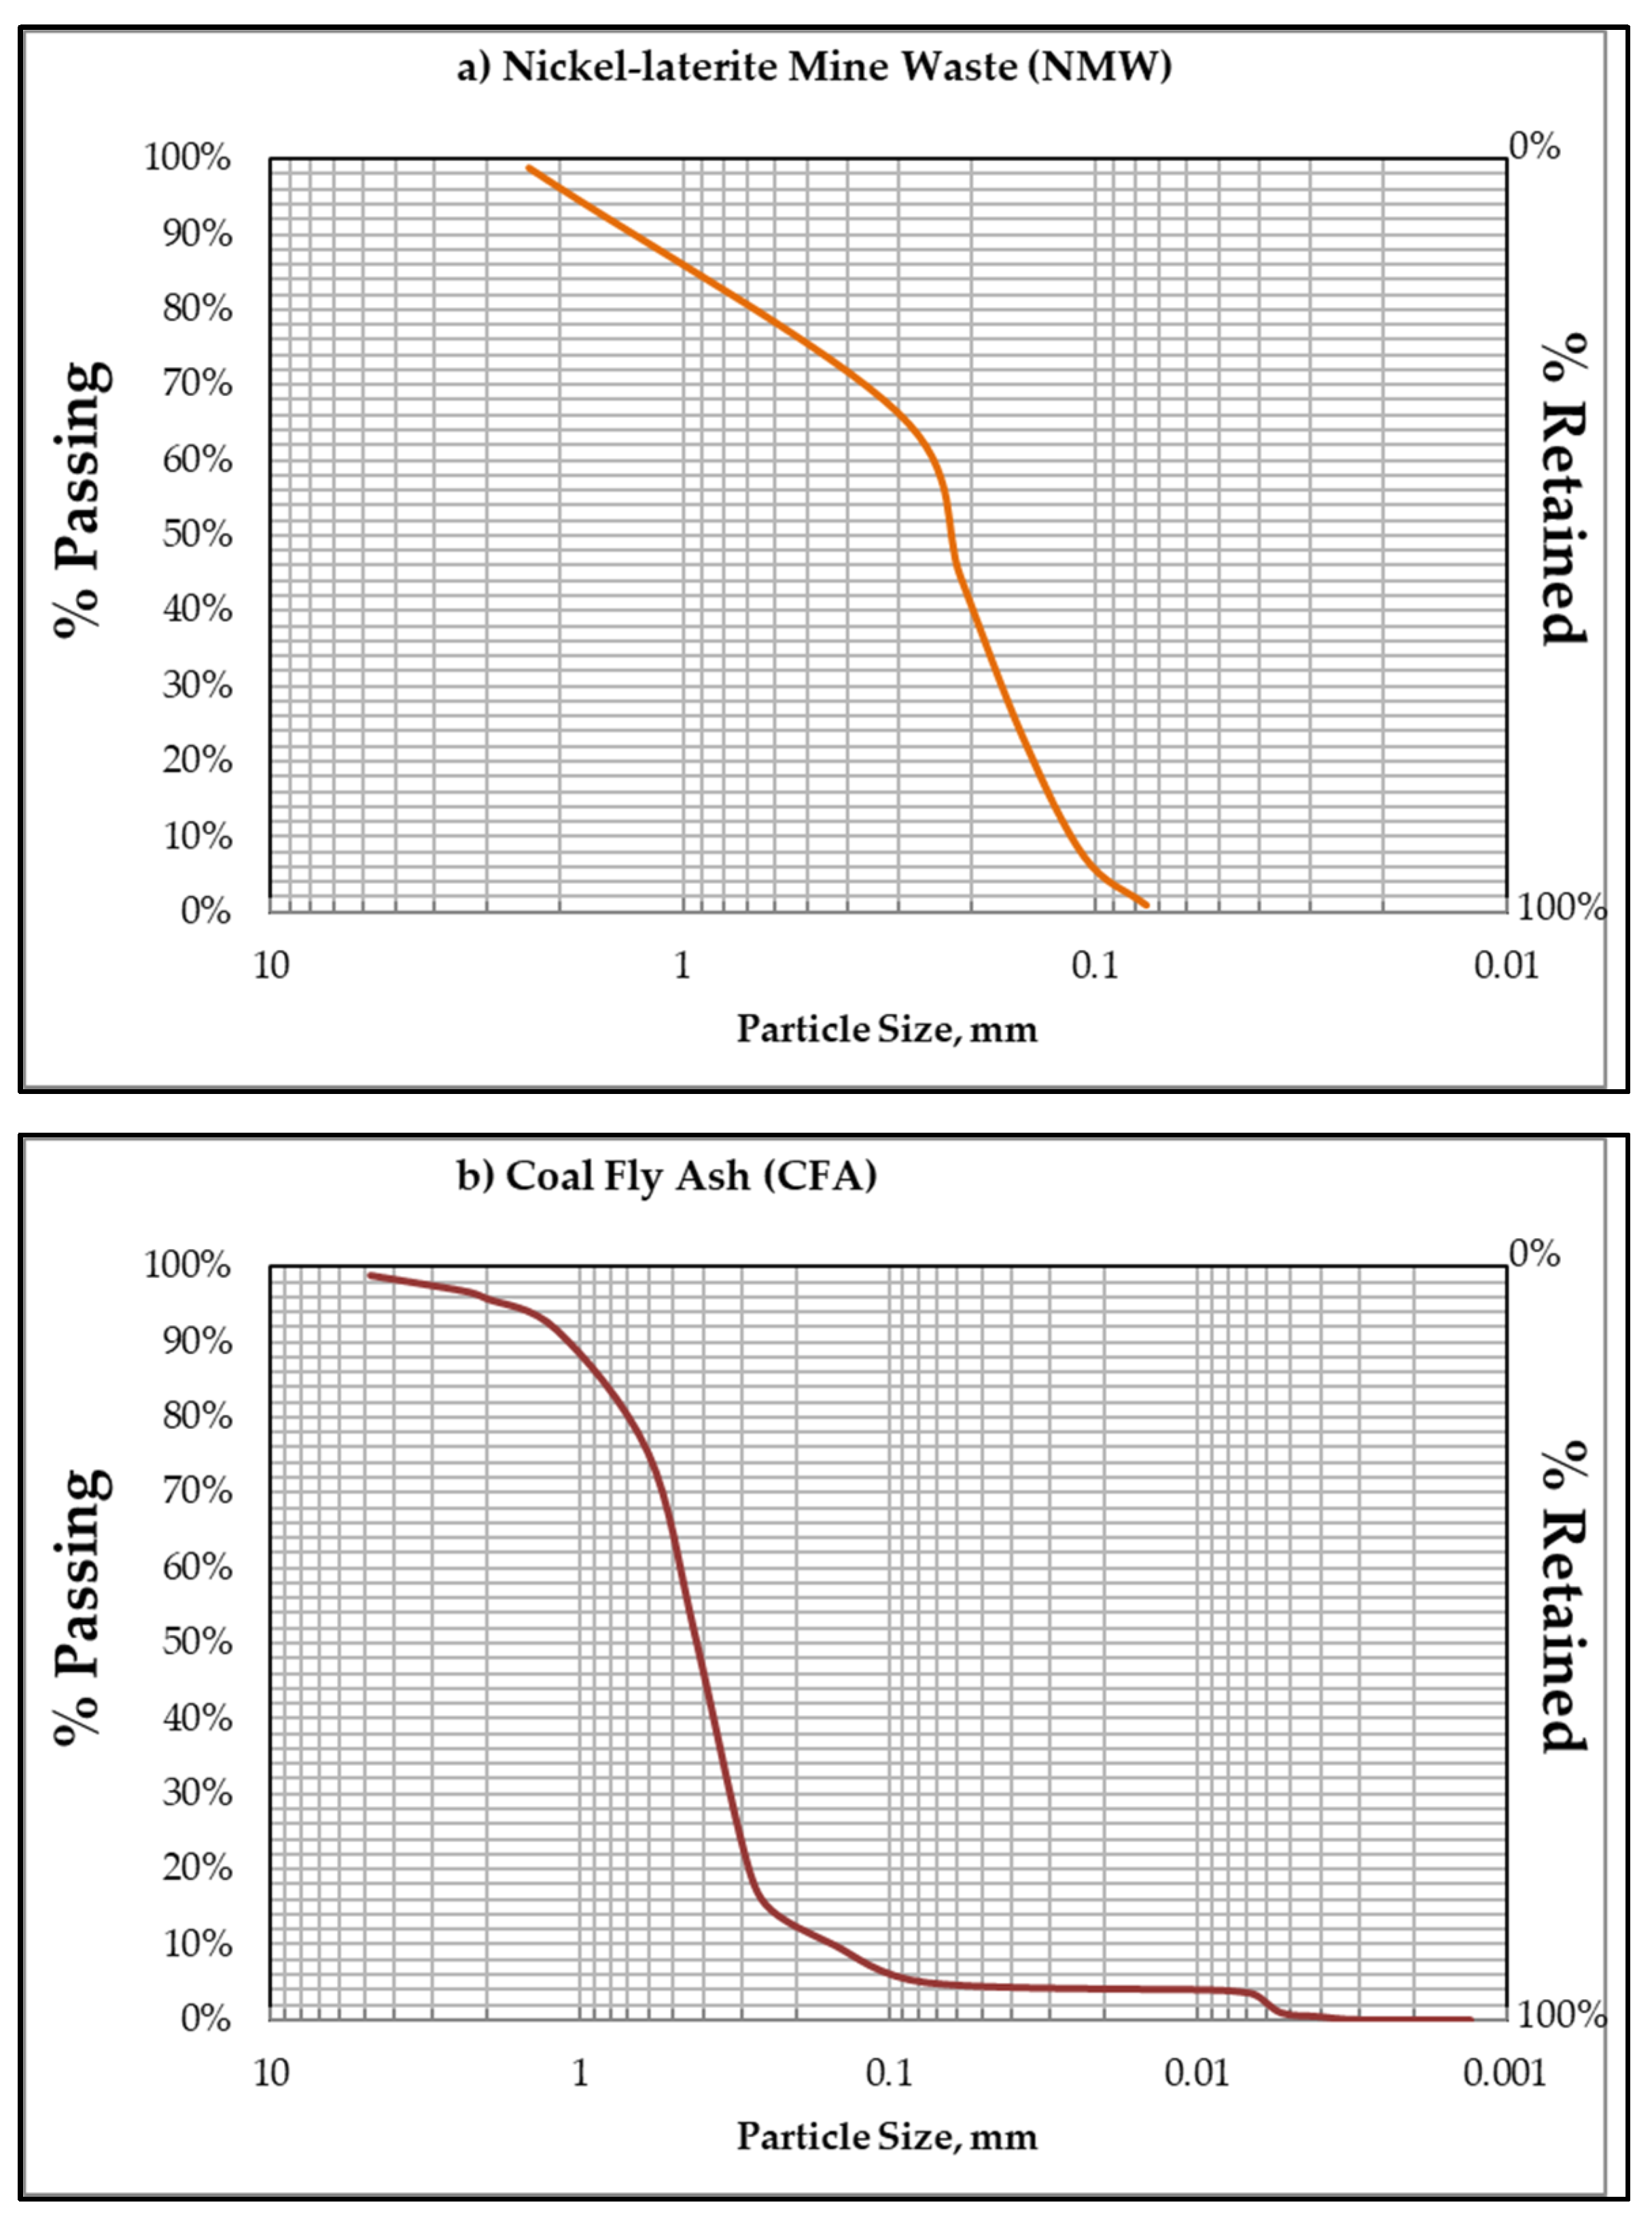
3.1.2. Particle Size Distribution

The particle size distributions of NMW and CFA are shown in Figure 1. The particle size of NMW is between 0.075 to about 2.36 mm with D50 (median diameter) of about 0.25 mm. At the same time, the particle size of CFA is between 0.0013 mm to about 4.75 mm with D50 (median diameter) of about 0.425 mm.

3.1.3. Leachability of Metals Based on Toxicity Characteristics Leaching Procedure (TCLP)

Numerous studies have shown that under certain conditions, coal fly ash releases traces of heavy metals to the environment [14,15,16]. With this condition and the possibility of NMW leaching out heavy metals, the TCLP method was employed in this study for geopolymer precursors. This test determines the mobility of organic and inorganic analytes present in the liquid, solid, and multiphase waste [17]. Furthermore, it simulates the conditions that may be present in a landfill where water may pass through the landfilled waste and travel into the groundwater carrying the soluble materials with it. Table 4 shows the leachability of NMW and CFA. Indication suggests that the metallic components in both samples are well below the TCLP limits and considered non-hazardous according to the United States Environmental Protection Agency limits [18] and Philippines’ DENR Administrative Order 2013-22 Standards for the Management of Hazardous Wastes [19].
However, it should be noted that initial leachability results warrant further study. For example, one study considers the limitations of such a test and emphasized that the test mimics leachate in landfills with lower pH and higher organic acid content than most of the municipal solid waste (MSW) [20]. Other factors need to be considered, as demonstrated by previous studies [21,22,23]. The mobility of trace elements and heavy metals in the environment depends mainly on the properties of solution and solids, such as pH, redox potential, chemical composition, surface properties, and mineral contents.
Moreover, the TCLP result is compared with the Philippine regulatory standard for Class A and Class C water body quality (Table 4) based on DENR Administrative Order 2016-08 on Water Quality Guidelines and General Effluent Standards. These classifications and parameters are intended to maintain and preserve the quality of all water bodies based on their intended beneficial usage. Class A is intended for drinking water supply sources after conventional treatment, while Class C is intended for agriculture and irrigation [23,24]. While not conclusive, TCLP results suggest that both raw materials could potentially leach high quantities if beneficially used in an unconsolidated matter such as arsenic in CFA for both water classes. However, because TCLP simulates conditions within the environment (i.e., landfill) that are different from beneficial use scenarios, the values presented in Table 5 are higher than those obtained using non-buffered extractants such as distilled water [25]. The added benefit of comparing these values is that there is conservatism with the comparison.
Nevertheless, TCLP is still widely used as a test to determine if individual material is hazardous since the test function is a conservative predictor of leaching. In the Philippines, the same limit and test are also used to classify hazardous wastes, as stated in the DENR Administrative Order 2013-22 on Hazardous Waste Management Procedural Manual [19].
On the other hand, the leachability of the NMW-CFA geopolymer is also worthy to note as the alkalinity of the leachates of the precursors (NMW and CFA) or the geopolymer itself can influence the leachability behavior of inorganic pollutants [26]. With this, some of the heavy metals initially present may be more mobile due to higher pH values and warrant further investigation on the geopolymer [23]. For example, a study by Tigue et al. using a modified percolation test set-up has shown that the arsenic leached out in high concentration compared with other heavy metals present in the geopolymer sample [27]. On the other hand, some studies have also revealed that geopolymer technology is an effective technique in the immobilization of heavy metals. For instance, Ahmari et al. confirmed that heavy metals were found to be effectively immobilized in mine tailing geopolymer bricks [28]. Thus, this will be considered in future work, especially that the mobility of metals present in the material varies depending on the condition.

3.1.4. X-ray Diffractometer (XRD)

The XRD patterns of CFA and NMW are shown in Figure 2. It was detected that CFA contains minerals such as endellite, julgoldite, quartz, magnetite, troilite, and maghemite. The most substantial peak intensities in this pattern were quartz, which is a typical XRD pattern for coal fly ash similar to other studies [1,9]. On the other hand, NMW had various minerals identified; however, minerals that were dominantly detected include silhydrite, montmorillonite, kaolinite, santafeite, dickite, sodalite, szymanskiite, nontronite, moganite, tridymite, quartz, ferrosaponite, chegemite, maghemite, and goethite. Most minerals identified contain Fe, namely santafeite, nontronite, ferrosaponite, maghemite, and goethite, which can be matched with the XRF analysis with the highest composition at 47.68% Fe2O3. Table 5 summarized the minerals with their corresponding chemical formula. Most of the minerals for both samples contain Si and Al or aluminosilicate materials, which is a good indication for a geopolymer precursor. Moreover, broad peaks between 26–27°, 35–37° 2θ for CFA, and between 19–23°, 33–37° 2θ for raw NMW may correspond to the amorphous content of the material. It is believed that the amorphous content of the material has played a significant role in geopolymerization due to its reactive nature. This inference can be correlated with the study reported in Jaarsveld et al., wherein materials having high amorphous content were found to yield a geopolymer having a better mechanical property in binders [29].

3.1.5. Scanning Electron Microscope

SEM images of raw materials were also captured, as shown in Figure 3. The structure of the raw NMW is platy and loose with sheets, which is favorable for water storage [31]. On the other hand, CFA images show that most of the particles are spherical (cenosphere) or are occurring as microspheres and are looser than the NMW particles. These microspheres increase the specific surface area of the fly ash [32]. Thus, there is a high probability that the total surface area of CFA is higher than a coarser platy structure, which may make the CFA more reactive than NMW.

3.2. Compressive Strength

The unconfined compressive strengths of the synthesized geopolymer were observed to range from 1.93 MPa up to 22.14 MPa after 28 d (Figure 4). The experimental formulation mix number 15 with an activator-to-precursor ratio of 0.429, 50% NMW, and with SH-to-SS ratio of 1:2 yielded the highest value making it the best mix sample among other runs. The sample with an activator-to-precursor ratio of 1, 100% NMW with 2 parts of sodium hydroxide and 1-part sodium silicate (SH-to-SS ratio of 2:1) resulted in deflocculation of NMW; hence it did not harden. This result is due to the following: (1) the precursor is made from 100% NMW, which is not that reactive as CFA; (2) the high ratio of SH-to-SS and low reactive Si and Al content of NMW resulted in excess amounts of NaOH and water. Additional water generally improves the workability of the geopolymer paste made from a precursor with high water holding capacity such as NMW. However, the excess water content can cause a dilution effect, which affects the geopolymerization and, consequently, the number of active components that can be mobilized [33]. It was also observed that the higher viscosity of concentrated NaOH solution hindered the evaporation of excess water. This result means that the geopolymeric paste needs more time or higher curing temperature to gain better or full strength [34,35].

3.3. Model Statistics

The summary of model statistics suggested that the analysis model is quadratic with an adjusted R-squared of 92.69% and a predicted R-squared of 80.97%, as shown in Table 6.
The analysis of variance (ANOVA) for the quadratic model, shown in Table 7, indicates that the model is significant. However, there are quadratic model terms with insignificant p-values, which the model must be reduced, as shown in Table 8.

3.4. Factors Affecting Compressive Strength

All three factors significantly affect the compressive strength of the synthesized geopolymer based on ANOVA (Table 8). Representative plots of the relationship of individual factors with their compressive strength are shown in Figure 5. All factors namely activator-to-precursor ratio (A), percentage NMW (B) and SH-to-SS ratio (C) show the same effect to the compressive strength which increases as individual factor decreases.
Factors affecting the compressive strength of geopolymers are related to the mechanisms involved in the alkaline activation of various aluminosilicate precursors. Garcia-Lodeiro et al. reviewed various geopolymerization models that can be summarized as follows: initially, the contact between the solid aluminosilicate source and the alkaline solution causes the glassy or amorphous precursor components to dissolve, releasing aluminates and silicates, probably as monomers. These monomers interact to form dimers, trimers, tetramers, and so on. When the solution reaches saturation, an aluminosilicate gel called N-A-S-H undergoes precipitation and restructuring. This step determines the composition, structure, and physical properties of the resulting geopolymer [36].
Based on the above mechanism, the amount and reactivity of precursors and alkaline activating solutions are crucial in geopolymer synthesis and properties. This result may have been because more precursor is present in the system to participate in the geopolymerization process. In the study of Pacheco-Torgal et al. [37], it suggested that aside from the composition of the precursor materials, the relative amount of the precursor and composition of the alkaline activators also affect the strength and other properties of geopolymers. This observation may be due to the increase in coal fly ash percentage, which is more reactive than the NMW. The decrease of SH-to-SS ratio means more SS in the solution, which means more SiO3 content in the system can participate in the geopolymerization reaction.
Figure 6 shows the interaction graph of AB and BC. The interaction of factors A (activator-to-precursor ratio) and B (% NMW) shows that the compressive strength increases as both factors decrease (Figure 6a). The interaction AB shows that the trend of compressive strength is affected when %NMW (B) is changed from 50% to 100%. At 100% NMW, the change in compressive strength is less obvious when the activator-to-precursor ratio (A) is changed. Decreasing the % NMW (B) corresponds to the increase of CFA content in the system, in which CFA is more reactive for geopolymerization. Moreover, when the activator-to-precursor ratio (A) decreases, a higher precursor amount is present in the system. When the amount of precursor is increased, the geopolymerization reaction is boosted because of the high reactivity of CFA, increasing the compressive strength of the product. Similarly, Figure 6b also shows the interaction of factors B (% NMW) and C (SH-to-SS ratio) that compressive strength also increases as both factors B and C decreases. The interaction BC shows that when SH-to-SS ratio (C) is increased from 0.5 to 2, the trend of the compressive strength decreased slowly when % NMW (B) is increased from 50% to 100%.The possible explanation for this is that when % NMW is decreased, more CFA is present in the system. This interaction can be further explained by the mineralogy of the precursors. The XRD of the NMW shows that it has less active aluminosilicate components than CFA. Thus, increasing the amount of CFA in the precursor mix improves the reactivity and influence the compressive strength of the final geopolymer mixture. Moreover, when SH-to-SS is decreased, it means a high value of SS (Na2SiO3) is present. The SH may have easily dissolved the reactive aluminosilicates in both the NMW and CFA, so less hydroxide is needed before the geopolymerization process. Thus, SS is considerably needed as a binding source and promoter of hardening [38].

3.5. Regression Model

The regression result further explains the result of ANOVA. The resulting linear regression model based on these observed values is as follows:
Y = 86.337 30.408 A 1.310 B 11.408 C + 0.268 A B + 0.0996 B C + 0.0052 B 2
where:
  • Y = C o m p r e s s i v e   s t r e n g t h ,   M P a
  • A = A c t i v a t o r t o p r e c u r s o r   r a t i o
  • B = N M W C F A   c o n t e n t ,   %   N M W
  • C = S H t o S S   r a t i o
From Equation (1), it can be observed that factor B (% NMW) can significantly affect the compressive strength of the geopolymer as it is present in 4 out of 7 coefficients in the equation. Based on the regression model, the compressive strength decreases linearly with B (% NMW) while increases with the following second-order terms: AB, BC, and B2. However, as shown in Figure 5 (One-factor plot), the observed inverse relationship of compressive strength and B (% NMW) is more prevalent compared to the direct relationship of the 2nd degree involving B (% NMW) to the compressive strength. This model is expected since these are primary raw materials containing SiO2 and Al2O3, which are necessary components to undergo geopolymerization. The decrease in % NMW corresponds to the increase of CFA content in the mixture. The raw material characterization of CFA suggests that it could be more reactive than NMW, and thus, the modification of the percentage from 100% to 50% NMW enhances the compressive strength. Moreover, CFA has higher SiO2 and Al2O3 content. Thus, when the amount of CFA is increased, more aluminosilicate can participate in the reaction [5]. Furthermore, the increase of SiO2 and Al2O3, with the additional presence of Fe3+ in the mixture, may also influence the compressive strength of the product by replacing or substituting Al3+ by Fe3+ in the octahedral sites of an aluminosilicate structure [39,40]. This model indicates that the proper selection of precursors needs to be determined using characterization methods. Lastly, the I-optimal design of the experiment can help us fine-tune the mix design of the geopolymer for the sampling and selection of a new precursor source [38].

3.6. Response Surface Methodology (Optimization)

The numerical optimization tool of the Design-Expert software was used to find the optimal point on the response surface to maximize the unconfined compressive strength of the synthesized geopolymer. The selected values were followed in the region where maximum strength can be seen, which from Figure 7, it can be observed that the maximum strength is approaching the minimum values of all the factors. With desirability of 1.0, the calculated optimized mix formulation is obtained with an activator-to-precursor ratio of 0.438, percent NMW of 50.1%, and an SH-to-SS ratio of 0.520. The predicted value is calculated at 22.9 MPa with a predicted R2 equivalent of 0.890.

3.7. Confirmatory Run

Using the calculated optimized mix formulation obtained with an activator-to-precursor ratio of 0.438, percent NMW of 50.1%, and an SH-to-SS ratio of 0.520, a confirmatory run of the synthesized geopolymer was performed. The unconfined compressive strength of the confirmatory run was obtained to be 36.3 MPa with a deviation of −58.0% (Table 9).
The deviation of −58.0% could be attributed to the noise that was not controlled and measured during the experiment. Nonetheless, the result is in reasonable agreement with the predicted R2 equivalent to 0.8902. The deviation may be attributed to the uncontrolled external factors, such as the type and strength of manual mixing of raw materials, the person who performed the mixing, and the UCS equipment used for the optimized sample analyzed by a third party.

3.8. Morphological Properties of Synthesized Geopolymer

Figure 8 shows the different images of synthesized geopolymer with different NMW-CFA content. Synthesized geopolymer using 100% NMW has several voids and more unreacted NMW, resulting in a lower compressive strength than a matrix with a compact structure. The morphology of geopolymer with 75% NMW has cemented surfaces but with fewer voids and fewer unreacted NMW, which can be a basis of a higher compressive strength than the previous geopolymer. Geopolymer with 50% NMW has the most apparent or widest distribution of cemented surfaces among the geopolymers, which signifies a higher compressive strength. Although, there are some spherical shapes seen, which is unreacted coal fly ash. On the other hand, the optimized sample has a larger cemented surface area, which explains its highest compressive strength for all the samples.

3.9. Potential Engineering Application

Table 10 shows the unconfined compressive strength of the synthesized geopolymer (optimized, 50% NMW, 75% NMW, and 100% NMW) and compared it to several types of concretes. Based on the standard unconfined compressive strengths, the synthesized geopolymers can have a potential application for concrete structures and concrete pavers, pedestrian and light traffic pavers, and plain concretes.

4. Conclusions

This paper presents an experimental study to produce an optimized geopolymer material that yields the highest value of unconfined compressive strength from the mixture of nickel–laterite mine waste (NMW), coal fly ash (CFA), and an alkali activator with components of sodium hydroxide (SH) and sodium silicate (SS). The optimum formulation mix was found to have an activator-to-precursor ratio of 0.428% NMW of 50.1%, and SH-to-SS ratio of 0.520, which produces a geopolymer with an average 28-day compressive strength of 36.3 MPa. This value is comparable to ordinary Portland cement for concrete structures and pavers, pedestrian pavers, light traffic pavers, and plain concrete.
SEM/EDX also showed that the optimum formulation has a cemented surface, resulting in a high unconfined compressive strength. The sample with low compressive strength was observed to have large voids in the microstructure, explaining its lower unconfined compressive strength.
Future work includes exploring the leachability of the NMW-CFA mixture to evaluate further the leachability of different mixtures, which may affect its pH during the test. Moreover, the leachability behavior of the NMW-CFA geopolymer product warrants further investigation as the nature of the material becomes more basic. Exploring the effect of the iron content of the NMW in the synthesis of the geopolymer, curing conditions, and other formulation mixes of the synthesized geopolymer should also consider in future studies. Other engineering properties can also be explored like water absorption, flexural strength, shrinkage, heat resistance, and porosity for other engineering applications like filtrations, panel boards, bricks, tiles, and other ceramic and building applications.

Author Contributions

Conceptualization, M.A.P.; methodology, A.L.J., A.A.T., and I.J.D.; validation, R.A.M., I.B.-A., and M.A.P.; formal analysis, A.L.J., and A.A.T.; investigation, M.A.P.; resources, M.A.P.; data curation, A.L.J., and A.A.T.; writing—original draft preparation, A.L.J.; writing—review and editing, M.A.P., I.B.-A., R.A.M., A.A.T., and I.J.D.; visualization, A.L.J., and I.J.D.; supervision, M.A.P., H.H., W.K., I.B.-A.; and R.A.M.; project administration, A.A.T.; funding acquisition, M.A.P. All authors have read and agreed to the published version of the manuscript.

Funding

This research was funded by the Department of Science and Technology-Philippine Council for Industry, Energy and Emerging Technology Research and Development (Project No. 07132) under the implementing agency of the Center for Engineering and Sustainable Development Research, De La Salle University-Manila and the APC was funded by Department of Science and Technology-Engineering Research and Development for Technology.

Acknowledgments

Authors acknowledge the following organizations: Department of Transdisciplinary Science and Engineering of Tokyo Institute of Technology; iNano Research Facility, De La Salle University; Advanced Device and Materials Testing Laboratory; Office of the Vice-Chancellor for Research and Innovation, De La Salle University; Geopolymers and Advanced Materials Engineering Research for Sustainability Laboratory (G.A.M.E.R.S. Lab), De La Salle University; Ceramics Engineering, MSU-Iligan Institute of Technology; Agata Mining Ventures, Inc. (AMVI); and STEAG Power, Inc.

Conflicts of Interest

The authors declare no conflict of interest. The funders had no role in the design of the study; in the collection, analyses, or interpretation of data; in the writing of the manuscript, or in the decision to publish the results.

References

  1. Reddy, M.S.; Dinakar, P.; Rao, B.H. Mix design development of fly ash and ground granulated blast furnace slag based geopolymer concrete. J. Build. Eng. 2018, 20, 712–722. [Google Scholar] [CrossRef]
  2. Patankar, S.V.; Ghugal Yuwaraj, M.; Jamkar, S.S. Mix Design of Fly Ash Based Geopolymer Concrete. In Advances in Structural Engineering; Springer: New Delhi, India, 2015; pp. 1619–1634. [Google Scholar] [CrossRef]
  3. Li, N.; Shi, C.; Zhang, Z.; Wang, H.; Liu, Y. A review on mixture design methods for geopolymer concrete. Compos. Part B Eng. 2019, 178, 107490. [Google Scholar] [CrossRef]
  4. Tchakouté, H.K.; Rüscher, C.H.; Hinsch, M.; Djobo, J.N.Y.; Kamseu, E.; Leonelli, C. Utilization of sodium waterglass from sugar cane bagasse ash as a new alternative hardener for producing metakaolin-based geopolymer cement. Chemie der Erde 2017, 77, 257–266. [Google Scholar] [CrossRef]
  5. Ferdous, M.W.; Kayali, O.; Khennane, A. A Detailed Procedure of Mix Design for Fly Ash Based Geopolymer Concrete. In Proceedings of the Fourth Asia-Pacific Conference on FRP in Structures (APFIS 2013), Melbourne, Australia, 11–13 December 2013; pp. 11–13. [Google Scholar]
  6. Longos, A.; Tigue, A.A.; Malenab, R.A.; Dollente, I.J.; Promentilla, M.A. Mechanical and thermal activation of nickel-laterite mine waste as a precursor for geopolymer synthesis. Results Eng. 2020, 7, 100148. [Google Scholar] [CrossRef]
  7. Aseniero, J.P.J.; Opiso, E.M.; Banda, M.H.T.; Tabelin, C.B. Potential utilization of artisanal gold-mine tailings as geopolymeric source material: Preliminary investigation. SN Appl. Sci. 2019, 1, 35. [Google Scholar] [CrossRef]
  8. Promentilla, M.A.B.; Thang, N.H.; Kien, P.T.; Hinode, H.; Bacani, F.T.; Gallardo, S.M. Optimizing Ternary-blended Geopolymers with Multi-response Surface Analysis. Waste Biomass Valoriz. 2016, 7, 929–939. [Google Scholar] [CrossRef]
  9. Zhang, L.; Ahmari, S.; Zhang, J. Synthesis and characterization of fly ash modified mine tailings-based geopolymers. Constr. Build. Mater. 2011, 25, 3773–3781. [Google Scholar] [CrossRef]
  10. Phetchuay, C.; Horpibulsuk, S.; Arulrajah, A.; Suksiripattanapong, C.; Udomchai, A. Strength development in soft marine clay stabilized by fly ash and calcium carbide residue based geopolymer. Appl. Clay Sci. 2016, 127–128, 134–142. [Google Scholar] [CrossRef]
  11. Singh, B.; Ishwarya, G.; Gupta, M.; Bhattacharyya, S.K. Geopolymer concrete: A review of some recent developments. Constr. Build. Mater. 2015, 85, 78–90. [Google Scholar] [CrossRef]
  12. Pavithra, P.; Srinivasula Reddy, M.; Dinakar, P.; Hanumantha Rao, B.; Satpathy, B.K.; Mohanty, A.N. A mix design procedure for geopolymer concrete with fly ash. J. Clean. Prod. 2016, 133, 117–125. [Google Scholar] [CrossRef]
  13. Yankwa Djobo, J.N.; Elimbi, A.; Kouamo Tchakouté, H.; Kumar, S. Mechanical properties and durability of volcanic ash based geopolymer mortars. Constr. Build. Mater. 2016, 124, 606–614. [Google Scholar] [CrossRef]
  14. Ibrahim, L.A.A. Chemical characterization and mobility of metal species in fly ash–water system. Water Sci. 2015, 29, 109–122. [Google Scholar] [CrossRef] [Green Version]
  15. Akar, G.; Polat, M.; Galecki, G.; Ipekoglu, U. Leaching behavior of selected trace elements in coal fly ash samples from Yenikoy coal-fired power plants. Fuel Process. Technol. 2012, 104, 50–56. [Google Scholar] [CrossRef] [Green Version]
  16. Koukouzas, N.; Ketikidis, C.; Itskos, G. Heavy metal characterization of CFB-derived coal fly ash. Fuel Process. Technol. 2011, 92, 441–446. [Google Scholar] [CrossRef]
  17. US Environmental Agency (US EPA). Toxicity Characteristic Leaching Procedure Method 1311. Available online: https://www.epa.gov/sites/production/files/2015-12/documents/1311.pdf (accessed on 10 December 2020).
  18. US EPA. Characteristics Introduction and Regulatory Definitions. Available online: https://www.epa.gov/sites/production/files/2015-10/documents/chap7_0.pdf (accessed on 21 February 2020).
  19. DENR Department of Environment and Natural Resources (DENR). Administrative Order No. 2013-22 Revised Procedures and Standards for the Management of Hazardous Wastes (Revising DAO 2004-36). Available online: https://emb.gov.ph/wp-content/uploads/2018/06/dao-2013-22.pdf (accessed on 11 December 2020).
  20. Intrakamhaeng, V.; Clavier, K.A.; Roessler, J.G.; Townsend, T.G. Limitations of the toxicity characteristic leaching procedure for providing a conservative estimate of landfilled municipal solid waste incineration ash leaching. J. Air Waste Manag. Assoc. 2019, 69, 623–632. [Google Scholar] [CrossRef]
  21. Liu, Y.; Clavier, K.A.; Spreadbury, C.; Townsend, T.G. Limitations of the TCLP fluid determination step for hazardous waste characterization of US municipal waste incineration ash. Waste Manag. 2019, 87, 590–596. [Google Scholar] [CrossRef]
  22. Tabelin, C.B.; Igarashi, T.; Villacorte-Tabelin, M.; Park, I.; Opiso, E.M.; Ito, M.; Hiroyoshi, N. Arsenic, selenium, boron, lead, cadmium, copper, and zinc in naturally contaminated rocks: A review of their sources, modes of enrichment, mechanisms of release, and mitigation strategies. Sci. Total Environ. 2018, 645, 1522–1553. [Google Scholar] [CrossRef]
  23. Tabelin, C.; Silwamba, M.; Paglinawan, F.C.; Jane, A.; Mondejar, S.; Gia, H.; Joy, V.; Opiso, E.M. Solid-phase partitioning and release-retention mechanisms of copper, lead, zinc and arsenic in soils impacted by artisanal and small-scale gold mining (ASGM) activities. Chemosphere 2020, 260, 127574. [Google Scholar] [CrossRef]
  24. Department of Environment and Natural Resources (DENR). Administrative Order No. 2016-08 on Water Quality Guidelines and General Effluent Standards of 2016. Available online: http://water.emb.gov.ph/wp-content/uploads/2016/06/DAO-2016-08-WQG-and-GES.pdf (accessed on 10 December 2020).
  25. Alves, B.S.Q.; Dungan, R.S.; Carnin, R.L.P.; Galvez, R.; De Carvalho Pinto, C.R.S. Metals in waste foundry sands and an evaluation of their leaching and transport to groundwater. Water Air. Soil Pollut. 2014, 225. [Google Scholar] [CrossRef]
  26. Özkök, E.; Davis, A.P.; Aydilek, A.H. Leaching of As, Cr, and Cu from High-Carbon Fly Ash–Soil Mixtures. J. Environ. Eng. 2013, 139, 1397–1408. [Google Scholar] [CrossRef] [Green Version]
  27. Tigue, A.A.S.; Malenab, R.A.J.; Dungca, J.R.; Yu, D.E.C.; Promentilla, M.A.B. Chemical stability and leaching behavior of one-part geopolymer from soil and coal fly ash mixtures. Minerals 2018, 8, 411. [Google Scholar] [CrossRef] [Green Version]
  28. Ahmari, S.; Zhang, L. Durability and leaching behavior of mine tailings-based geopolymer bricks. Constr. Build. Mater. 2013, 44, 743–750. [Google Scholar] [CrossRef]
  29. Van Jaarsveld, J.G.S.; Van Deventer, J.S.J.; Lukey, G.C. The characterization of source materials in fly ash-based geopolymers. Fuel Energy Abstr. 2004, 45, 23. [Google Scholar] [CrossRef]
  30. Whitney, D.L.; Evans, B.W. Abbreviations for Names of Rock-Forming Minerals Abbreviations for names of rock-forming minerals. Am. Mineral. 2015, 95, 185–187. [Google Scholar] [CrossRef]
  31. Li, B.; Wang, H.; Wei, Y. The reduction of nickel from low-grade nickel laterite ore using a solid-state deoxidisation method. Miner. Eng. 2011, 24, 1556–1562. [Google Scholar] [CrossRef]
  32. Liu, H.; Sun, Q.; Wang, B.; Wang, P.; Zou, J. Morphology and composition of microspheres in fly ash from the luohuang power plant, Chongqing, Southwestern China. Minerals 2016, 6, 30. [Google Scholar] [CrossRef] [Green Version]
  33. Cherki El Idrissi, A.; Roziere, E.; Loukili, A.; Darson, S. Design of geopolymer grouts: The effects of water content and mineral precursor. Eur. J. Environ. Civ. Eng. 2018, 22, 628–649. [Google Scholar] [CrossRef]
  34. Xu, H.; Van Deventer, J.S.J. The effect of alkali metals on the formation of geopolymeric gels from alkali-feldspars. Colloids Surf. A Physicochem. Eng. Asp. 2003, 216, 27–44. [Google Scholar] [CrossRef]
  35. Livi, C.; Repette, W. Effect of NaOH concentration and curing regime on geopolymer. Rev. IBRACON Estruturas e Mater. 2017, 10, 1174–1181. [Google Scholar] [CrossRef] [Green Version]
  36. Garcia-Lodeiro, I.; Palomo, A.; Fernández-Jiménez, A. An Overview of the Chemistry of Alkali-Activated Cement-Based Binders; Woodhead Publishing Limited: Cambridge, UK, 2015; ISBN 9781782422884. [Google Scholar]
  37. Pacheco-Torgal, F.; Castro-Gomes, J.; Jalali, S. Alkali-activated binders: A review. Part 2. About materials and binders manufacture. Constr. Build. Mater. 2008, 22, 1315–1322. [Google Scholar] [CrossRef] [Green Version]
  38. Solouki, A.; Viscomi, G.; Lamperti, R.; Tataranni, P. Quarry waste as precursors in geopolymers for civil engineering applications: A decade in review. Materials 2020, 13, 3146. [Google Scholar] [CrossRef] [PubMed]
  39. Gomes, K.C.; Lima, G.S.T.; Torres, S.M.; De Barros, S.; Vasconcelos, I.F.; Barbosa, N.P. Iron distribution in geopolymer with ferromagnetic rich precursor. Mater. Sci. Forum 2010, 643, 131–138. [Google Scholar] [CrossRef]
  40. Obonyo, E.A.; Kamseu, E.; Lemougna, P.N.; Tchamba, A.B.; Melo, U.C.; Leonelli, C. A sustainable approach for the geopolymerization of natural iron-rich aluminosilicate materials. Sustainability 2014, 6, 5535–5553. [Google Scholar] [CrossRef] [Green Version]
  41. Association of Structural Engineers of the Philippines. National Structural Code of the Philippines 2010: Buildings, Towers and other Vertical Structures, 6th ed.; Association of Structural Engineers of the Philippines: Quezon City, Philippines, 2010; ISBN 2094-5477. [Google Scholar]
  42. Japan International Cooperation Agency. The Urgent Development Study on the Project on Rehabilitation and Recovery from Typhoon Yolanda in the Philippines, Implemented by DOF, DPWH, DILG, Philippines. Available online: https://openjicareport.jica.go.jp/pdf/12283420_03.pdf (accessed on 21 February 2020).
Figure 1. Particle size distribution (PSD) of (a) nickel–laterite mine waste and (b) coal fly ash.
Minerals 10 01144 g001
Figure 2. Mineralogical pattern (XRD) of raw materials (a) CFA and (b) NMW.
Minerals 10 01144 g002
Figure 3. SEM images at magnification 3000× for (a) raw nickel–laterite mine waste and (b) coal fly ash.
Minerals 10 01144 g003
Figure 4. Comparison of unconfined compressive strength at different mix proportions.
Minerals 10 01144 g004
Figure 5. One-factor plot.
Minerals 10 01144 g005
Figure 6. Interaction graph.
Minerals 10 01144 g006
Figure 7. Response surface of unconfined compressive strength.
Minerals 10 01144 g007
Figure 8. SEM images of synthesized geopolymer at different precursor mix (1000×) with corresponding UCS.
Minerals 10 01144 g008
Table 1. Parameters of each factor and level for geopolymer synthesis.
FactorsLow LevelMid LevelHigh Level
1. Activator-to-precursor ratio0.4290.6671.0
2. NMW-CFA content, as % NMW50%75%100%
3. SH-to-SS ratio1:21:12:1
Table 2. Experimental runs in standard order.
Std OrderRun OrderFactor 1:
Activator-to-Precursor Ratio
Factor 2:
NMW-CFA Content
as % NMW
Factor 3:
SH-to-SS Ratio
1150.428650%1:2
251.000050%1:2
360.428675%1:2
4100.6667100%1:2
5161.0000100%1:2
690.666750%1:1
710.666750%1:1
820.666775%1:1
9110.666775%1:1
1080.666775%1:1
1141.000075%1:1
Std OrderRunOrderFactor 1:
Activator-to-Precursor Ratio
Factor 2:
NMW-CFA Content
as % NMW
Factor 3:
SH-to-SS Ratio
12120.4286100%1:1
1330.428650%2:1
1471.000050%2:1
15180.666775%2:1
16171.000075%2:1
17140.4286100%2:1
18131.0000100%2:1
Table 3. Chemical Composition of raw nickel–laterite mine waste (NMW) and coal fly ash (CFA).
Mass %SiO2Al2O3Fe2O3CaOMgONiOCr2O3MnOTiO2K2OAg2OSrOSO3LOI
NMW20.542.7947.685.464.231.940.850.380.250.350.04--15.50
CFA26.128.0122.7029.351.980.03-0.230.970.890.120.305.314.0
- No detection in the analysis.
Table 4. Toxicity characteristic leaching procedure (TCLP) Analysis of raw materials samples in mg/L.
Raw MaterialAgAsBaCdCrHgNiPbSe
CFA0.000510.0692.5440.000420.0350.000850.2140.00270.0228
NMW0.000450.000050.1080.000370.190.00012.9290.003350.001
TCLP limit a5.05.0100.01.05.00.2-5.01.0
Class A b-0.010.70.0030.010.0010.020.010.01
Class C b-0.0230.0050.010.0020.20.050.02
a US Environmental Protection Agency [18] and Philippines’ DAO 2013-22 Standards for the Management of Hazardous Wastes [19].; b Philippines DAO 2016-08 Water Quality Guidelines and General Effluent Standards [24].; - No regulatory limit.
Table 5. List of detected minerals for NMW and CFA.
Mineral IDAbbreviation cChemical Formula
CFA
EndelliteEndAl2Si2O5(OH)4·2(H2O)
JulgolditeJulCa2Fe3+(Fe3+,Al)2(SiO4)(Si2O7)(O,OH)2·(H2O)
QuartzQzSiO2
MagnetiteMagFe3O4
MaghemiteMghγ-Fe2O3
HematiteHemFe2O3
TroiliteTroFeS
NMW
SilhydriteSih3SiO2·(H2O)
MontmorilloniteMnt(Na,Ca)0,3(Al,Mg)2Si4O10(OH)2·n(H2O)
KaoliniteKlnAl2Si2O5(OH)4
SantafeiteSan(Mn,Fe,Al,Mg)2(Mn4+,Mn2+)2(Ca,Sr,Na)3(VO4,AsO4)4(OH)3·2(H2O)
DickiteDckAl2Si2O5(OH)4
SodaliteSdlNa8Al6Si6O24Cl2
SzymanskiiteSzyHg+16(Ni,Mg)6(H3O)8(CO3)12·3(H2O)
NontroniteNonNa0.3Fe3+2(Si,Al)4O10(OH)2·n(H2O)
MoganiteMogSiO2
FerrosaponiteFsapCa0.3(Fe2+,Mg,Fe3+)3(Si,Al)4O10(OH)2·4(H2O)
TridymiteTrdSiO2
ChegemiteCheCa7(SiO4)3(OH)2
Mineral IDAbbreviation cChemical Formula
MaghemiteMghγ-Fe2O3
GoethiteGthFe3+O(OH)
c Nomenclature of minerals is based on the International Mineralogical Association (IMA). Minerals not found in the table are abbreviated based on the format of Kretz as cited by Whitney et al. [30].
Table 6. Summary of model statistics for UCS.
SourceStd. Dev.R2Adjusted R2Predicted R2Remarks
Linear3.100.8230.7850.704
2FI2.640.8990.8440.748
Quadratic1.810.9660.9270.801Suggested
Cubic0.7160.9980.989 Aliased
Table 7. ANOVA for the quadratic model.ANOVA for the quadratic model.
SourceSum of SquaresdfMean SquareF-Valuep-ValueRemarks
Model735.05981.6724.94<0.0001significant
A—activator-to-precursor ratio99.69199.6930.440.0006significant
B—NMW-CFA content320.701320.7097.93<0.0001significant
C—SH-to-SS ratio107.221107.2232.740.0004significant
AB24.69124.697.540.0252significant
AC0.0210.020.010.9451not significant
BC27.62127.628.430.0198significant
0.4510.450.140.7200not significant
25.45125.457.770.0236significant
4.2214.221.290.2890not significant
Residual26.2083.27
Lack of fit24.6654.939.610.0458significant
Pure error1.5430.51
Cor total761.2517
Table 8. ANOVA for the reduced quadratic model.
SourceSum of SquaresdfMean SquareF-Valuep-ValueRemarks
Model727.586121.2639.61<0.0001significant
 A—activator-to-precursor ratio95.31195.3131.130.0002significant
 B—NMW-CFA content (% NMW)315.151315.15102.94<0.0001significant
 C—SH-to-SS ratio100.181100.1832.720.0001significant
 AB29.33129.339.580.0102significant
 BC28.54128.549.320.0110significant
 B²44.58144.5814.560.0029significant
Residual33.68113.06
 Lack of fit32.1484.027.830.0591not significant
 Pure error1.5430.5133
 Cor total761.25
Table 9. Predicted and observed values of unconfined compressive strength (UCS) of the confirmatory run.
A—Activator-to-Precursor RatioB: NMW-CFA Content
(% NMW)
C: SH-to-SS RatioPredicted UCS MPaObserved UCS MPa% Deviation
0.43850.10.52022.936.3−58.0%
Table 10. Comparison of unconfined compressive strength from the standard materials.
MaterialMixtureApplicationUCS (MPa)Source
Class A ConcreteOPC-sand mixtureConcrete structures and concrete pavements20.7DPWH and ASTM Standards [41,42]
Class C ConcreteOPC-sand mixturePedestrian and light traffic paver20.7
Class B ConcreteOPC-sand mixturePlain concrete for structure (curbs, gutter, sidewalks)16.5
Class F ConcreteOPC-sand mixturePlain concrete for leveling11.8
GeopolymerOptimized samplePavers, bricks36.3 ± 3.6This study, 2020
50% NMW; 50% CFAPavers22.1 ± 5.4
75% NMW; 25% CFACoring bricks13.7 ± 2.9
100% NMWClay bricks4.42 ± 0.3
Publisher’s Note: MDPI stays neutral with regard to jurisdictional claims in published maps and institutional affiliations.

