Article

Detrital Zircon U-Pb Ages in the East China Seas: Implications for Provenance Analysis and Sediment Budgeting

1
State Key Laboratory of Marine Geology, Tongji University, Shanghai 200092, China
2
School of Geography, Geomatics and Planning, Jiangsu Normal University, Xuzhou 221116, China
3
Qingdao Institute of Marine Geology, China Geological Survey, Ministry of Natural Resources, Qingdao 266071, China
*
Authors to whom correspondence should be addressed.
Submission received: 5 April 2020 / Revised: 25 April 2020 / Accepted: 29 April 2020 / Published: 29 April 2020

Abstract

:
Linking marine sinks to potential terrestrial sources is one of most intriguing but challenging aspects of sediment source-to-sink studies. In this study, we analyzed 23 zircon samples (3271 filtered best ages) from surface sediments of the east China seas (ECSs) that cover a large portion of the Bohai Sea, Yellow Sea, East China Sea to part of the northeastern South China Sea. The results of U-Pb age distributions exhibit variable signatures in different seas. The Bohai Sea is characterized by 4 age populations at 203–286 Ma, 383–481 Ma, 1830–1940 Ma and 2480–2548 Ma, whereas the southern Yellow Sea and the East China Sea are featured by 5 age populations at 176–223 Ma, 383–481 Ma, 732–830 Ma, 1830–1940 Ma and 2480–2548 Ma. We propose that the presence or absence of the population of 732–830 Ma in the Yangtze Craton (YC) and the North China Craton (NCC) is a possible geochronological signature to distinguish zircon grains derived from the two source regions. Furthermore, on the basis of multidimensional scaling (MDS), U-Pb ages in the sediments of the Bohai Sea, East China Sea and the Taiwan Strait could be correspondently linked to those of the Yellow River, the Yangtze River and Taiwan rivers. The good linkages support the view that U-Pb age distributions of detrital zircons in the margin seas are mainly controlled by fluvial discharges, and ultimately, by the tectonic history of the corresponding source regions. Using a sediment forward mixing model, we obtained the relative sediment contributions and spatial variations of five most important river discharges in the region. The mixing results suggest that the major rivers in the region, i.e., the Yangtze and the Yellow Rivers, are the dominant sediment contributors to the continental margin, and their mixing coefficients could be used to infer relative sediment budgeting. In addition, spatial variations in mixing coefficient in the East China Sea indicate that sediment mixing and partitioning processes in the marine depositional environment have played a part role in propagating the provenance signals as a result of interaction of oceanic currents and tides. The combined method between provenance analysis and mixing modeling provides a feasible way to appreciate sediment budgeting in the geological past.

1. Introduction

Continental margin sea is the most important sink for terrestrial sediments due to large accommodation space and rapid sediment accumulation rates [1]. Linking marine sinks to terrestrial sources using sedimentological or geochemical methods is one of the most intriguing but challenging aspects of sediment routing system studies [2]. From a perspective of source-to-sink systems, it is very important to know where sediments have been derived from and how associated environmental signals, such as provenance and sediment fluxes related to tectonics and climate change, are propagated and modified within the systems [3]. To estimate sediment budgeting influenced by natural forcing or by human activities is therefore fundamental to understand source-to-sink processes in sedimentary systems [4,5]. With the rapid development of in situ micro-analytical techniques in Earth science since the last two decades, the detrital zircon U-Pb geochronology has been widely applied to examine various sedimentary questions, such as sediment provenance, ages and rock characteristics of source terranes, stratigraphic correlation and determination of maximum depositional ages [6,7,8,9]. It has been regarded as a real progress in provenance analysis by providing a time dimension to assist the interpretation of detrital modes [10]. However, many previous studies were focused on long-term provenance analysis and based on an untested premise that detrital zircon ages are mainly controlled by tectonic factors and are less susceptible to hydrological sorting and other factors. Some recent studies argued that detrital zircon ages could be applied to investigate sedimentary mixing processes on short-term scales [11,12], and the age distributions may be influenced by factors other than tectonics, such as fertility [13], grain-size sorting [14] and the number of analyses [15]. Due to the on-going debate on the factors that control detrital zircon U-Pb ages in sediments, it is necessary to examine it from continental margin seas, which are the important sinks for terrestrial sediment.
The east China seas (hereafter referred to as ECSs) are favored in this contribution for several reasons. First, the ECSs contain the broadest continental shelf in the world. Annually, there are large amounts of sediments discharged into them by large rivers like the Yangtze and Yellow River that are originated from the Tibetan Plateau and numerous moderate and small mountainous rivers draining in tectonically stable areas like SE China and active one like Taiwan [16,17,18,19]. Due to the remarkable contrasts in tectonic setting and lithology, fluvial sediments with distinguished terrestrial U-Pb age signatures could be preserved in marine sediments. Second, a substantial of detrital zircon U-Pb ages have been published from many modern fluvial sediments in East Asia [20,21,22,23,24,25], making it possible to link terrestrial sources to marine sinks by U-Pb geochronological methods. Lastly, despite that the sandy deposits in the ECSs cover a larger extent in the region (Figure 1), less attention has been paid to them when compared with the muddy deposits [26,27,28]. As a result, the sources of marine sediments and to which extent ocean hydrodynamics, such as currents, tides or waves, can play a role in the dispersion of terrestrial sediments and propagation of provenance signals in the seas are still not clear. Accordingly, there are three primary objectives of this study: (1) link marine sediments in the ECSs to the present-day fluvial sediments using detrital zircon U-Pb geochronology; (2) examine how marine hydrological processes may modify provenance signatures of sediments in different seas; (3) estimate the sediment budgeting in the seas quantitatively or semi-quantitatively using sediment mixing models developed in the community [8,29].

2. Sedimentary and Tectonic Setting

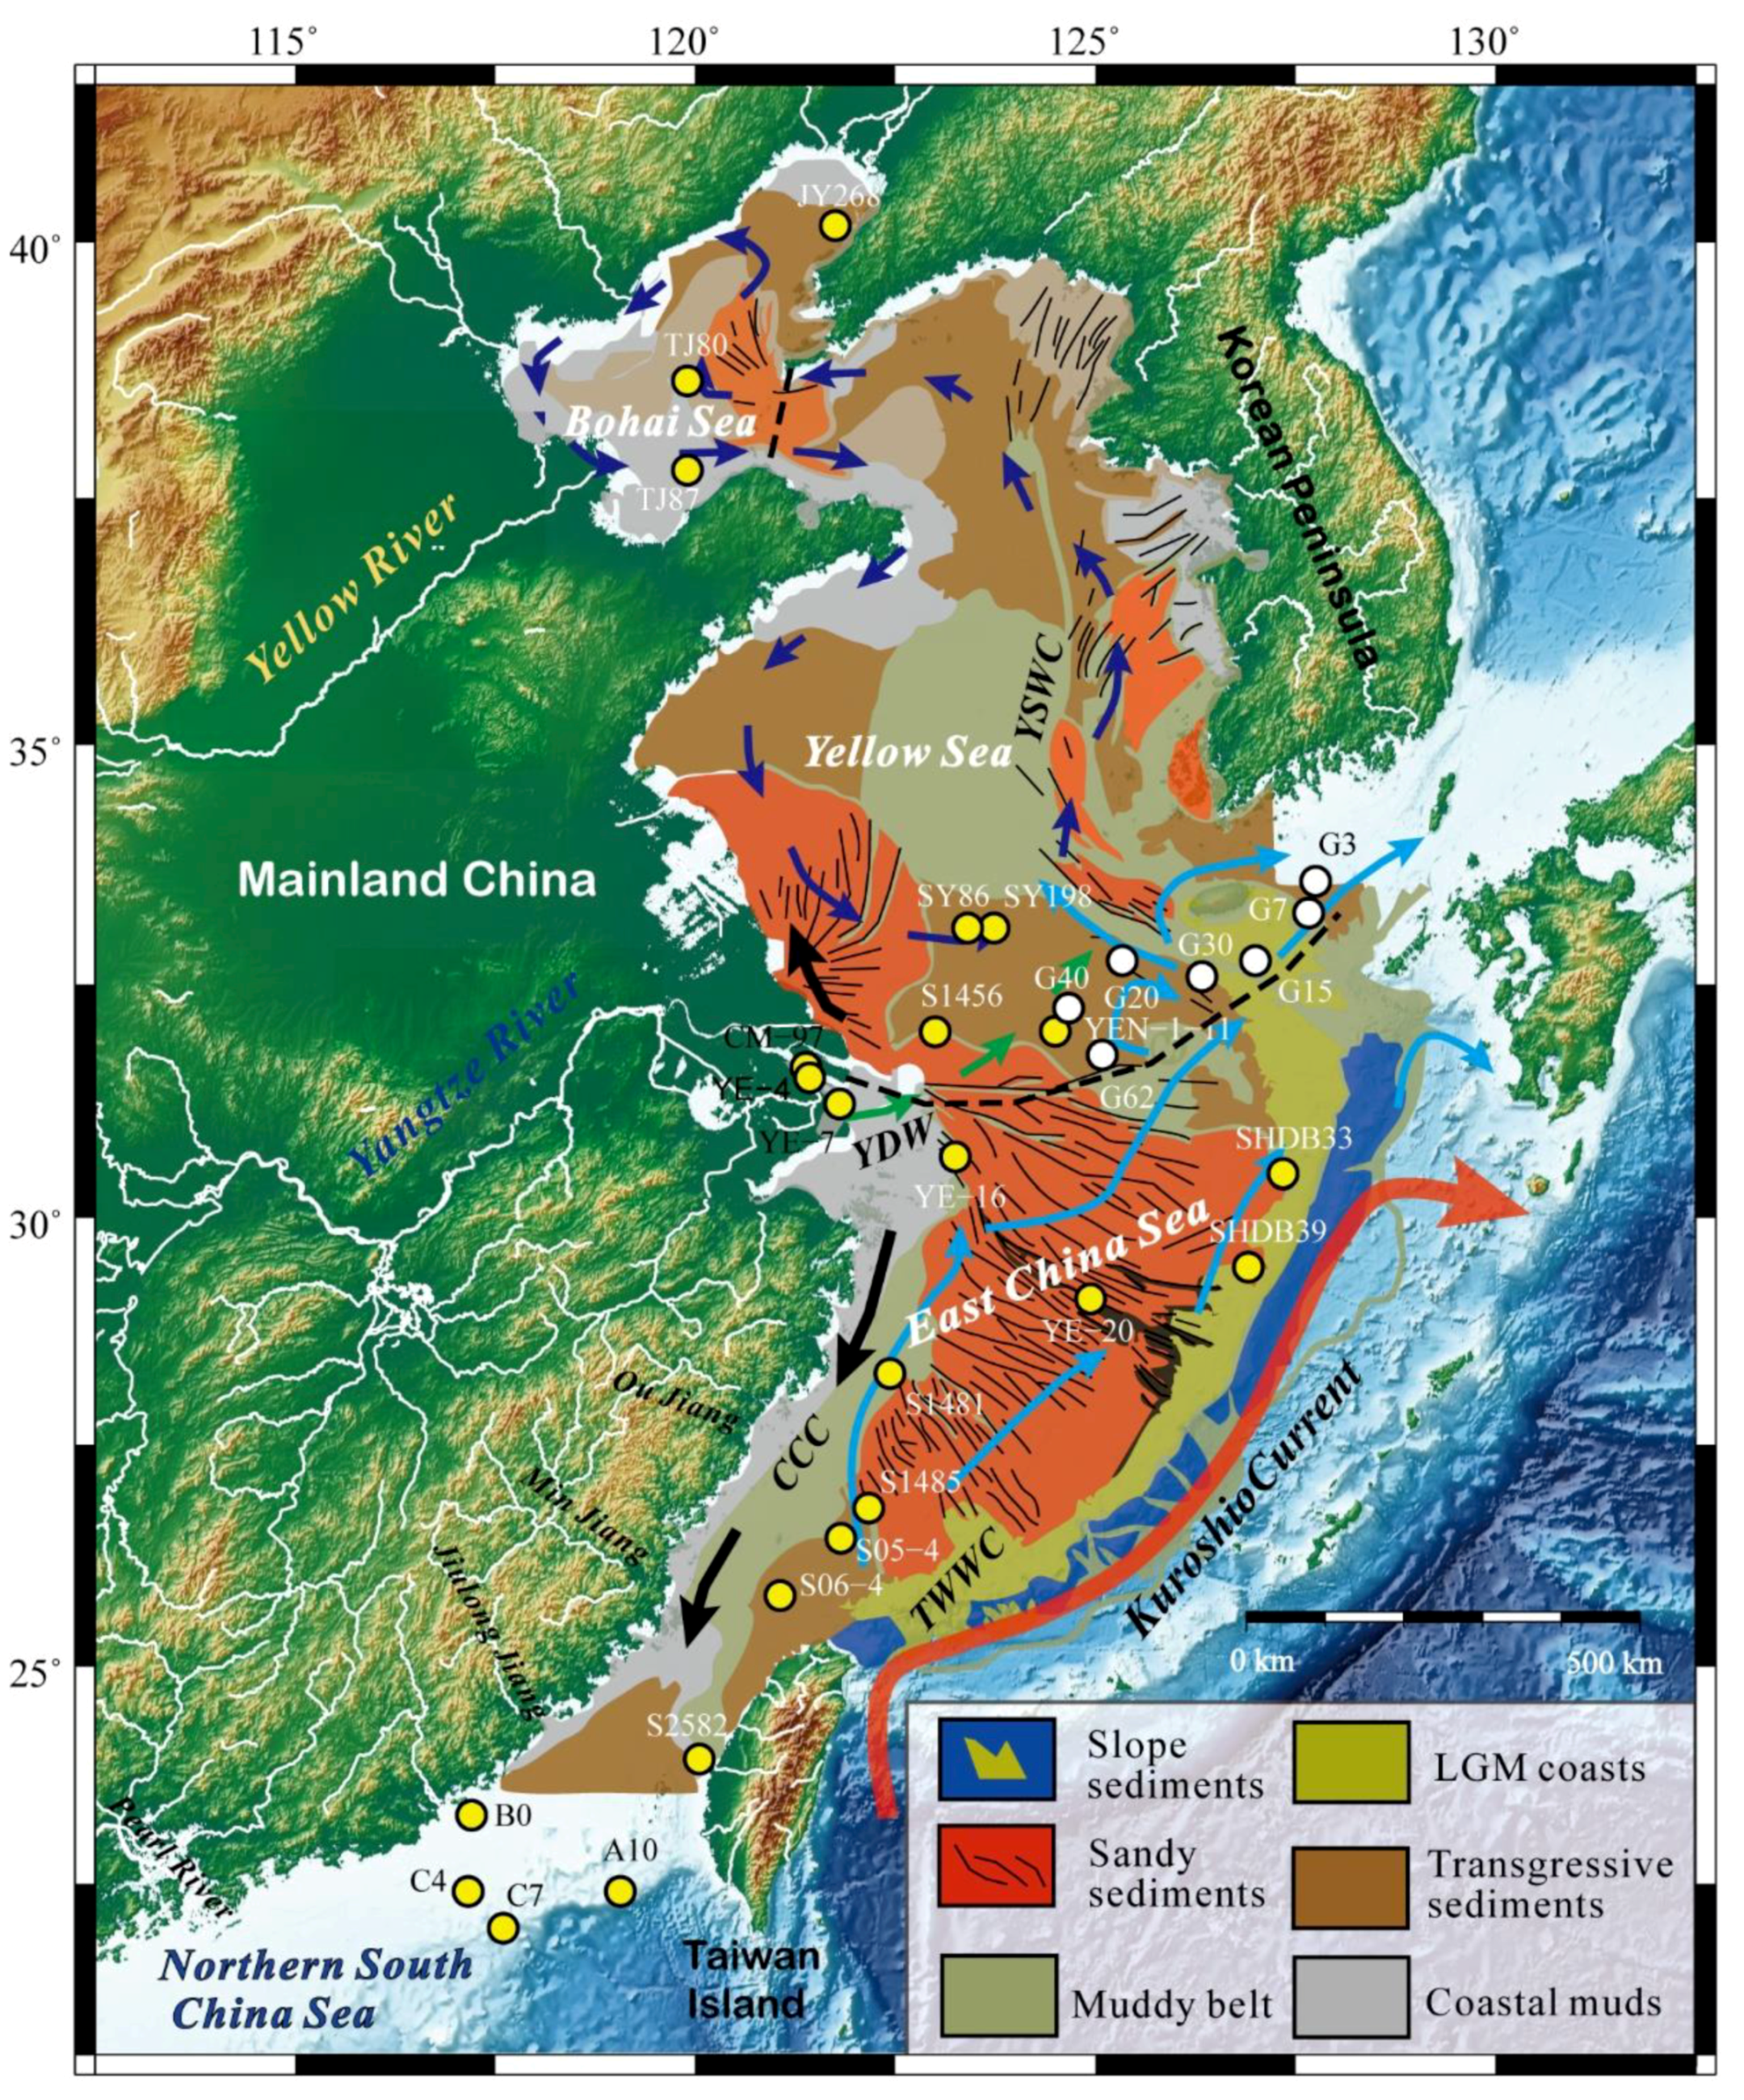
2.1. Sediment Fluxes and Oceanic Hydrodynamics

The ECSs in this study are defined as an area consisting of the Bohai Sea, Yellow Sea, East China Sea and a part of the northern South China Sea (Figure 1). This extensive area is surrounded by mainland China to the west and the north, by the Korean Peninsula and Kyushu and Ryukyu Islands to the east and by Taiwan Island to the south. There are large but variable discharges of sediment into the seas.
The highest sediment discharge was from the Yellow River with annual suspended sediments reaching to 1086 Mt in the history [33], but it has reduced to less than 100 Mt since the last decade possibly due to human activities. The second highest sediment discharge is from the Yangtze River, which had a pre-dam annual discharge of about 500 Mt but has dropped to less than 130 Mt nowadays [34]. Although mountainous rivers in Taiwan Island are smaller in terms of catchment area and river length, the annual sediment discharge could be as high as 300 Mt [35]. A number of Zhe-Min (Zhejiang and Fujian provinces) rivers draining in SE China (Figure 1) have a total annual sediment discharge of 23 Mt [16], which is relatively less important compared with Taiwan. The annual sediment discharge of rivers in the Korean Peninsula is around 20 Mt [36], which is equivalent to that of the Zhe-Min rivers.
The sediment distribution in the ECSs is mainly controlled by the dynamic climate and ocean settings in the region [30,37]. According to the result of oceanographic observations, the surface and bottom current systems in the ECSs are strongly influenced by a large-scale anti-clockwise circulation in the western Pacific [38] (Figure 1). As a result, there are several persistent currents in the region, including the Kuroshio Current, Taiwan Warm Current (TWWC), Tsushima Warm Current, Yellow Sea Warm Current (YSWC) and the China Coastal Current (CCC). In contrast, the Yangtze Diluted Water Current (DWC) is stronger in summer than in winter. In addition to the ocean currents, there are very strong tidal currents and waves with the great axis of the tidal ellipse-oriented NW to SE in the East China Sea [39]. It is believed that sand ridges are formed in the areas with strong rectilinear tidal currents, sand sheets in areas are dominated by strong rotatory tidal currents, and clay sediments are deposited mainly in the areas of weak tidal currents [40].

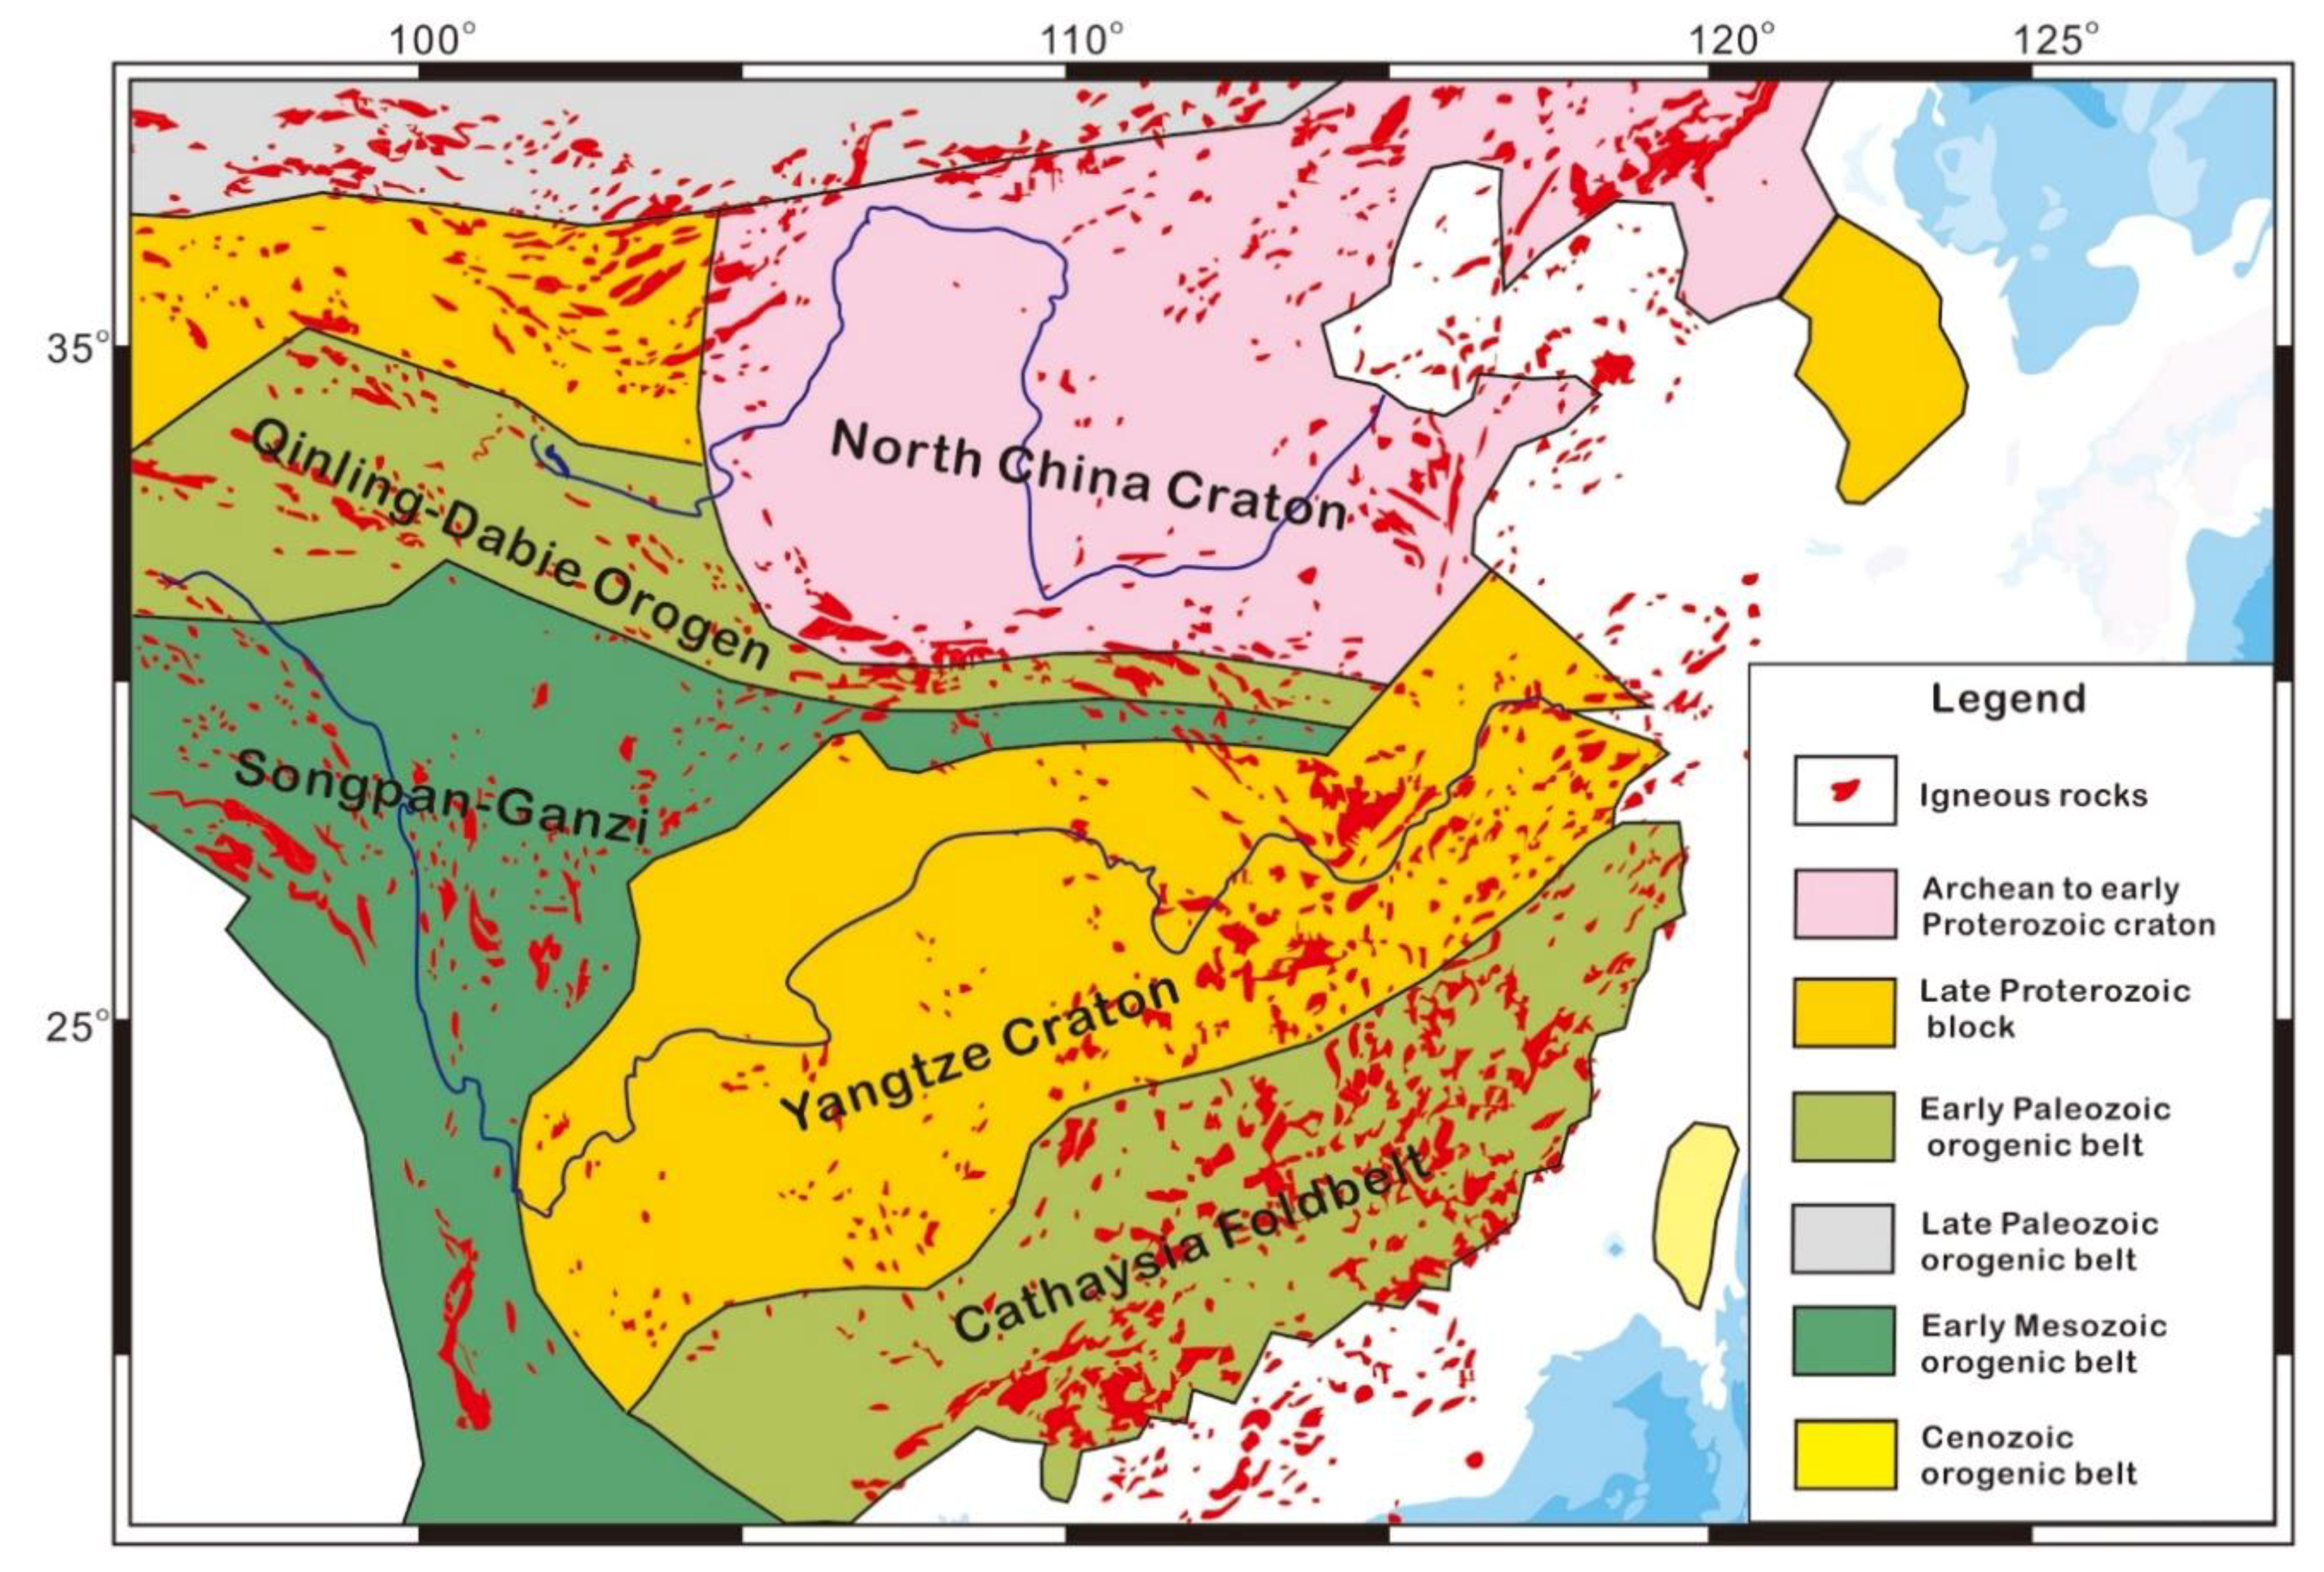
2.2. Tectonic Setting

Geologically, the rivers flowing into the ECSs drain different first-order tectonic units, containing the North China Craton (NCC) in the north, the Yangtze Craton (YC) and the Cathaysia Fold Belt (CF) in the south and the Songpan–Ganzi Fold Belt (SPGF) in the west (Figure 2). Each of the tectonic units has a different geological history in terms of the basement, sedimentary cover and igneous rocks (Figure 2).
The NCC has a widespread Neoarchean basement formed around 2.7–2.5 Ga, which covers 85% of the total exposed basement [43,44]. The cratonization of the NCC started during the Paleoproterozoic (1.9–1.8 Ga), and there were no significant tectonic activities until the Paleozoic Era. According to a compilation in [45], there were six stages of magmatism in the NCC from the Paleozoic to the Cenozoic, with age populations around the Carboniferous to Early Permian (324–270 Ma), Late Permian to Middle Triassic (262–236 Ma), Late Triassic (231–199 Ma), Jurassic (189–146 Ma), Early Cretaceous (141–108 Ma) and the Cenozoic (65 Ma–present).
The YC is separated from the NCC by the Qinling–Dabie Orogen, which was formed during the period from the late Paleozoic to middle Mesozoic (Figure 2). In contrast to the NCC, rocks of the Archean and Paleoproterozoic are sporadically outcropped in the YC, and most of the exposed basements were formed during the Neoproterozoic. This is supported by abundant 790–900 Ma granitoids observed in the Jiangnan Orogenic Belt in the southern margin of the YC and 740–830 Ma felsic plutonic and volcanic rocks at the western margin [46]. The tectonic activity in the YC became reactivated during the Paleozoic and the Mesozoic, which is characterized by the presence of late Paleozoic Emeishan basalts (260 Ma) in the upper YC [47] and Early Cretaceous igneous rocks (134–125 Ma) in the lower YC [48].
The CF is located southeast to the YC (Figure 2). The two blocks were assembled together during the Neoproterozoic (1.00–0.85 Ga). Unlike to the YC, which has a widespread exposure of the Neoproterozoic rocks, the CF is characterized by voluminous outcrops of the Paleozoic to Mesozoic igneous rocks [44,49]. The more distinct age populations are related to the Paleozoic Kwangsian granites (420–442 Ma) and Yanshanian granitoids and volcanic rocks (80–190 Ma).
The SPGF is located at eastern edge of the Qinghai–Tibetan Plateau (Figure 2), which is the headwater region of the present Yellow and Yangtze rivers. The block is mainly covered by a thick Triassic flysch sequence and was a part of Permo–Triassic orogenic belts situated at the northeast Tibetan Plateau and southwest China [50]. The detrital zircons in this region are explained to have been derived from two different sources [51]. The first one is the YC, which is characterized by a Neoproterozoic U-Pb age population at 720–900 Ma, while the second is the Qinling Mountains (Figure 2), which contribute older U-Pb ages at 2.2–1.4 Ga.
Although Taiwan Island is relatively small in area, it has a very complicated geological history. It is marked by a Mesozoic basement and a mélange assembly in the Tananao Complex, slate formations of the Eocene-early Oligocene in the Hsuehsan Range and the late Oligocene to Pleistocene at the West Foothills [52]. Similarly, the Korean fluvial sediments may be derived mainly from the Precambrian igneous and metamorphic rocks [53] and Jurassic–Cretaceous granites and schists [54].

3. Samples and Methods

3.1. Samples

We carried out a detrital zircon U-Pb analysis on 23 samples in this study, including 22 surface samples taken from the ECSs and one early Holocene sample from a borehole at the Yangtze Delta (Figure 1). Most samples are mainly composed of silty sands except for those obtained from the Bohai Sea and the Yellow Sea, which are silty muds. A detailed information on water depths and the numbers of U-Pb best age are given in Table 1.
Using standard mineral separation techniques, which included heavy liquids, magnetic separation and handy picking concentrates, zircon grains were first separated from the sediments. Afterwards, about 300 grains for each sample were randomly chosen and mounted in the epoxy within 1-inch mounting cups. After drying in an oven, the mounts were sanded down and polished to expose interiors of most zircon grains. Images of transmitted and reflected light of the zircon grains were taken using an optical microscope. A field emission scanning electron microscope (TESCAN, MIRA 3LMH, Nanjing Hongchuang Geological Exploration Technology Service Co., Ltd., Nanjing, China) was used to obtain the cathodoluminescence (CL) images. With help of these images, spots for the laser ablation were chosen by avoiding inclusions, fractures and inherited cores in zircons.

3.2. LA-ICP-MS

Mounted zircon grains were ablated at Tongji University using a Resonetics RESOlution M50 193 nm excimer laser system connected to a quadrupole inductively coupled plasma mass spectrometry (LA-ICP-MS, Agilent 7900, Santa Clara, CA, USA). Before data acquisition, a standard reference material glass (SRM 612) produced by the National Institute of Standards and Technology (NIST) was used to tune the ICP-MS. The glass was ablated in a routine condition with a beam spot size of 40 µm and a laser repletion of 6 Hz at fluence of 4 J·cm−2. After tuning, the sensitivity of mass 238U reached to 40,000 counts or 10,000 cps/ppm with a fractionation between 232Th and 238U less than 2% and oxide production rate (ThO/Th) less than 0.3%. Data were obtained for masses 204, 206, 207, 208, 232, 235 and 238 using the ion counting modes of the detector and the integration time for each mass was set to 20 ms. The data acquisition sequence for each unknown or reference material consisted of 15 s blank, 40 s ablation and 15 s washout. Reference zircon materials 91500 [55] and Plešovice [56] were measured periodically in a sample sequence to perform external U-Pb age calibration and monitor the quality of measurements. Except for very fine grain-size samples, which were ablated at a spot size of 18 µm, most of the samples were ablated at a spot size of 26 µm. The spot size differences between samples and the tuning were due to the size limitation of zircon sizes in samples. Despite of the differences, this did not cause significant age deviations in the measurements as supported by the consistent age results from the reference zircon materials.
Data reduction was conducted using the method of mean of isotopic ratios [57], which consisted of the blank subtraction, isotopic ratio calculation, normalization by primary zircon isotopic ratios and the instrumental drift correction in a sequence. The data reduction, age calculation and uncertainty propagation were performed on an in-house Shiny server website software developed by the first author (Huang X.T.), which is accessible at http://60.205.227.89:3838/LaUPb. The weighted mean concordia ages of zircon 91500 (n = 754) and Plešovice (n = 374) are 1061.5 ± 0.25 and 334.9 ± 1.6 Ma (2 se, standard error), respectively, which are consistent with the published U-Pb ages (1062 Ma [55], 337 Ma [56]) within the uncertainty.
In total we obtained 3664 zircon U-Pb ages and filtered out 3271 so-called best ages used in the following discussion. The filtering was mainly based on a 10% cutoff of the discordance of a given 206Pb/238U age [9]. The discordance of 206Pb/238U age less than 1.4 Ga is defined as 100 × (1 – 206Pb/238 U/207Pb/235U) and the discordance of 206Pb/238U age greater than 1.4 Ga is defined as 100 × (1 – 206Pb/238U/207Pb/206Pb). Additionally, when a 206Pb/238 U age is less than 300 Ma, the 206Pb/U238 age is set as the best age due to the low precision of 207Pb [14]. The dataset of this study is provided in the Supplementary Table S1.

3.3. Multidimensional Scaling (MDS)

In order to trace the sediment sources in the East China Sea, a robust statistical method known as multidimensional scaling (MDS) was applied to evaluate the similarity between different U-Pb age distributions [58]. Compared to the other visual or statistical methods, such as cross correlation coefficient, Kolmogorov-Smirnov test (K-S) and Kuiper test [59], the advantage of the MDS lies in its effectiveness to remove redundant features of age distributions while preserving and amplifying the significant differences between them [60]. This is particularly efficient for the pairwise comparison between a large number of samples. Using the DZmds, a MATLAB graphical user interface developed by [59], we chose the kernel density estimates (KDEs) at a bandwidth of 25 M yrs to perform a metric cross-correlation comparison mainly due to the differences of the best ages among the samples and potential sources. We produced a MDS plot for a group of marine and fluvial samples produced in this study and cited from the literature (the Yellow River [23,61], the Yangtze River [20], Korean rivers [24], the Choshui River in western Taiwan [25], Ou Jiang [21] (Jiang means river in Chinese), Min Jiang [22], Jiulong Jiang [21] and Pearl River [62]). The goodness of fit is suggested by a Shepard stress of 0.16, which is a fair result according to rules of thumb [60]. When the wide range of our samples and the potential sources is considered, the results are believed to be good enough to distinguish the dissimilarity among these distributions and more details will be discussed in Section 5.1.

3.4. Mixing Model of Detrital Zircon U-Pb Age Distribution

To quantitatively estimate the relative contribution of sediments or zircon grains from different fluvial systems, we applied a sediment linear mixing model for detrital zircon U-Pb age distributions [29]:
D m = i = 1 n M i P i
where Pi is the ith parent or fluvial source age distribution and Mi is the corresponding mixing coefficient or relative contribution and Dm is the modeled mixed daughter distribution, which is the best fit for a measured sample distribution.
To the best of our knowledge, there are generally two ways to solve mixing models [4,8,11,29]. The first are forward models in which the number and distributions of sources are known or specified through geological interpretation and assumption. The second are reverse models in which both the number and distributions are unknown, but they can be solved through optimization methods. In this study, we favor the former one because: (1) the age distributions of fluvial sources can be readily achieved in the literature and (2) they are intimately associated with the geological settings and (3) the source signals are relatively homogeneous spatially and temporally. For example, the U-Pb age distributions become homogenized in the lower reaches of modern Yangtze [20,63] and Yellow rivers [23]. The uniform distributions have been also observed on glacial-interglacial and tectonic time scales. For instance, zircon U-Pb age distributions of the Mangshan loess-palaeosol profile [64], which have been deposited in the flood plain of the Yellow River since the late Pleistocene, are similar to those of the modern Yellow River [23]. In addition, the present Yangtze-like age distributions have been reported from the Pleistocene to Miocene sedimentary records in the Yangtze delta [65] and catchment [63]. As a result, we treated the age distributions in lower reaches of modern rivers as source signals for marine sediments (Figure 3) and applied the forward mixing model (AnalySize) developed by [66] to obtain the mixing coefficients from different sources. We did no use the default non-parametric approach in the mixing model [66] to obtain the parent distributions because it is difficult for the model to get geologically meaningful results due to the uncertainty on the determination of the number of the endmembers and a very large variability in the KDE distributions. Instead, we performed the mixing modeling by using the KDEs shown in Figure 3 as the defined endmembers and the KDEs of our samples as the mixed daughter distributions (Equation (1)). The mixing results are given in Table 2, in which we combined the mixing coefficients of the Zhe-Min Rivers together. The coefficients of determination (R2) of this forward mixing modeling are generally higher than 0.75 (Table 2), indicating a goodness-of-fit of the modeling. More confidently, most of the mixing results are consistent with the regional sedimentary and oceanic setting. Please see more details in Section 4.2 and Section 5.4.

4. Results

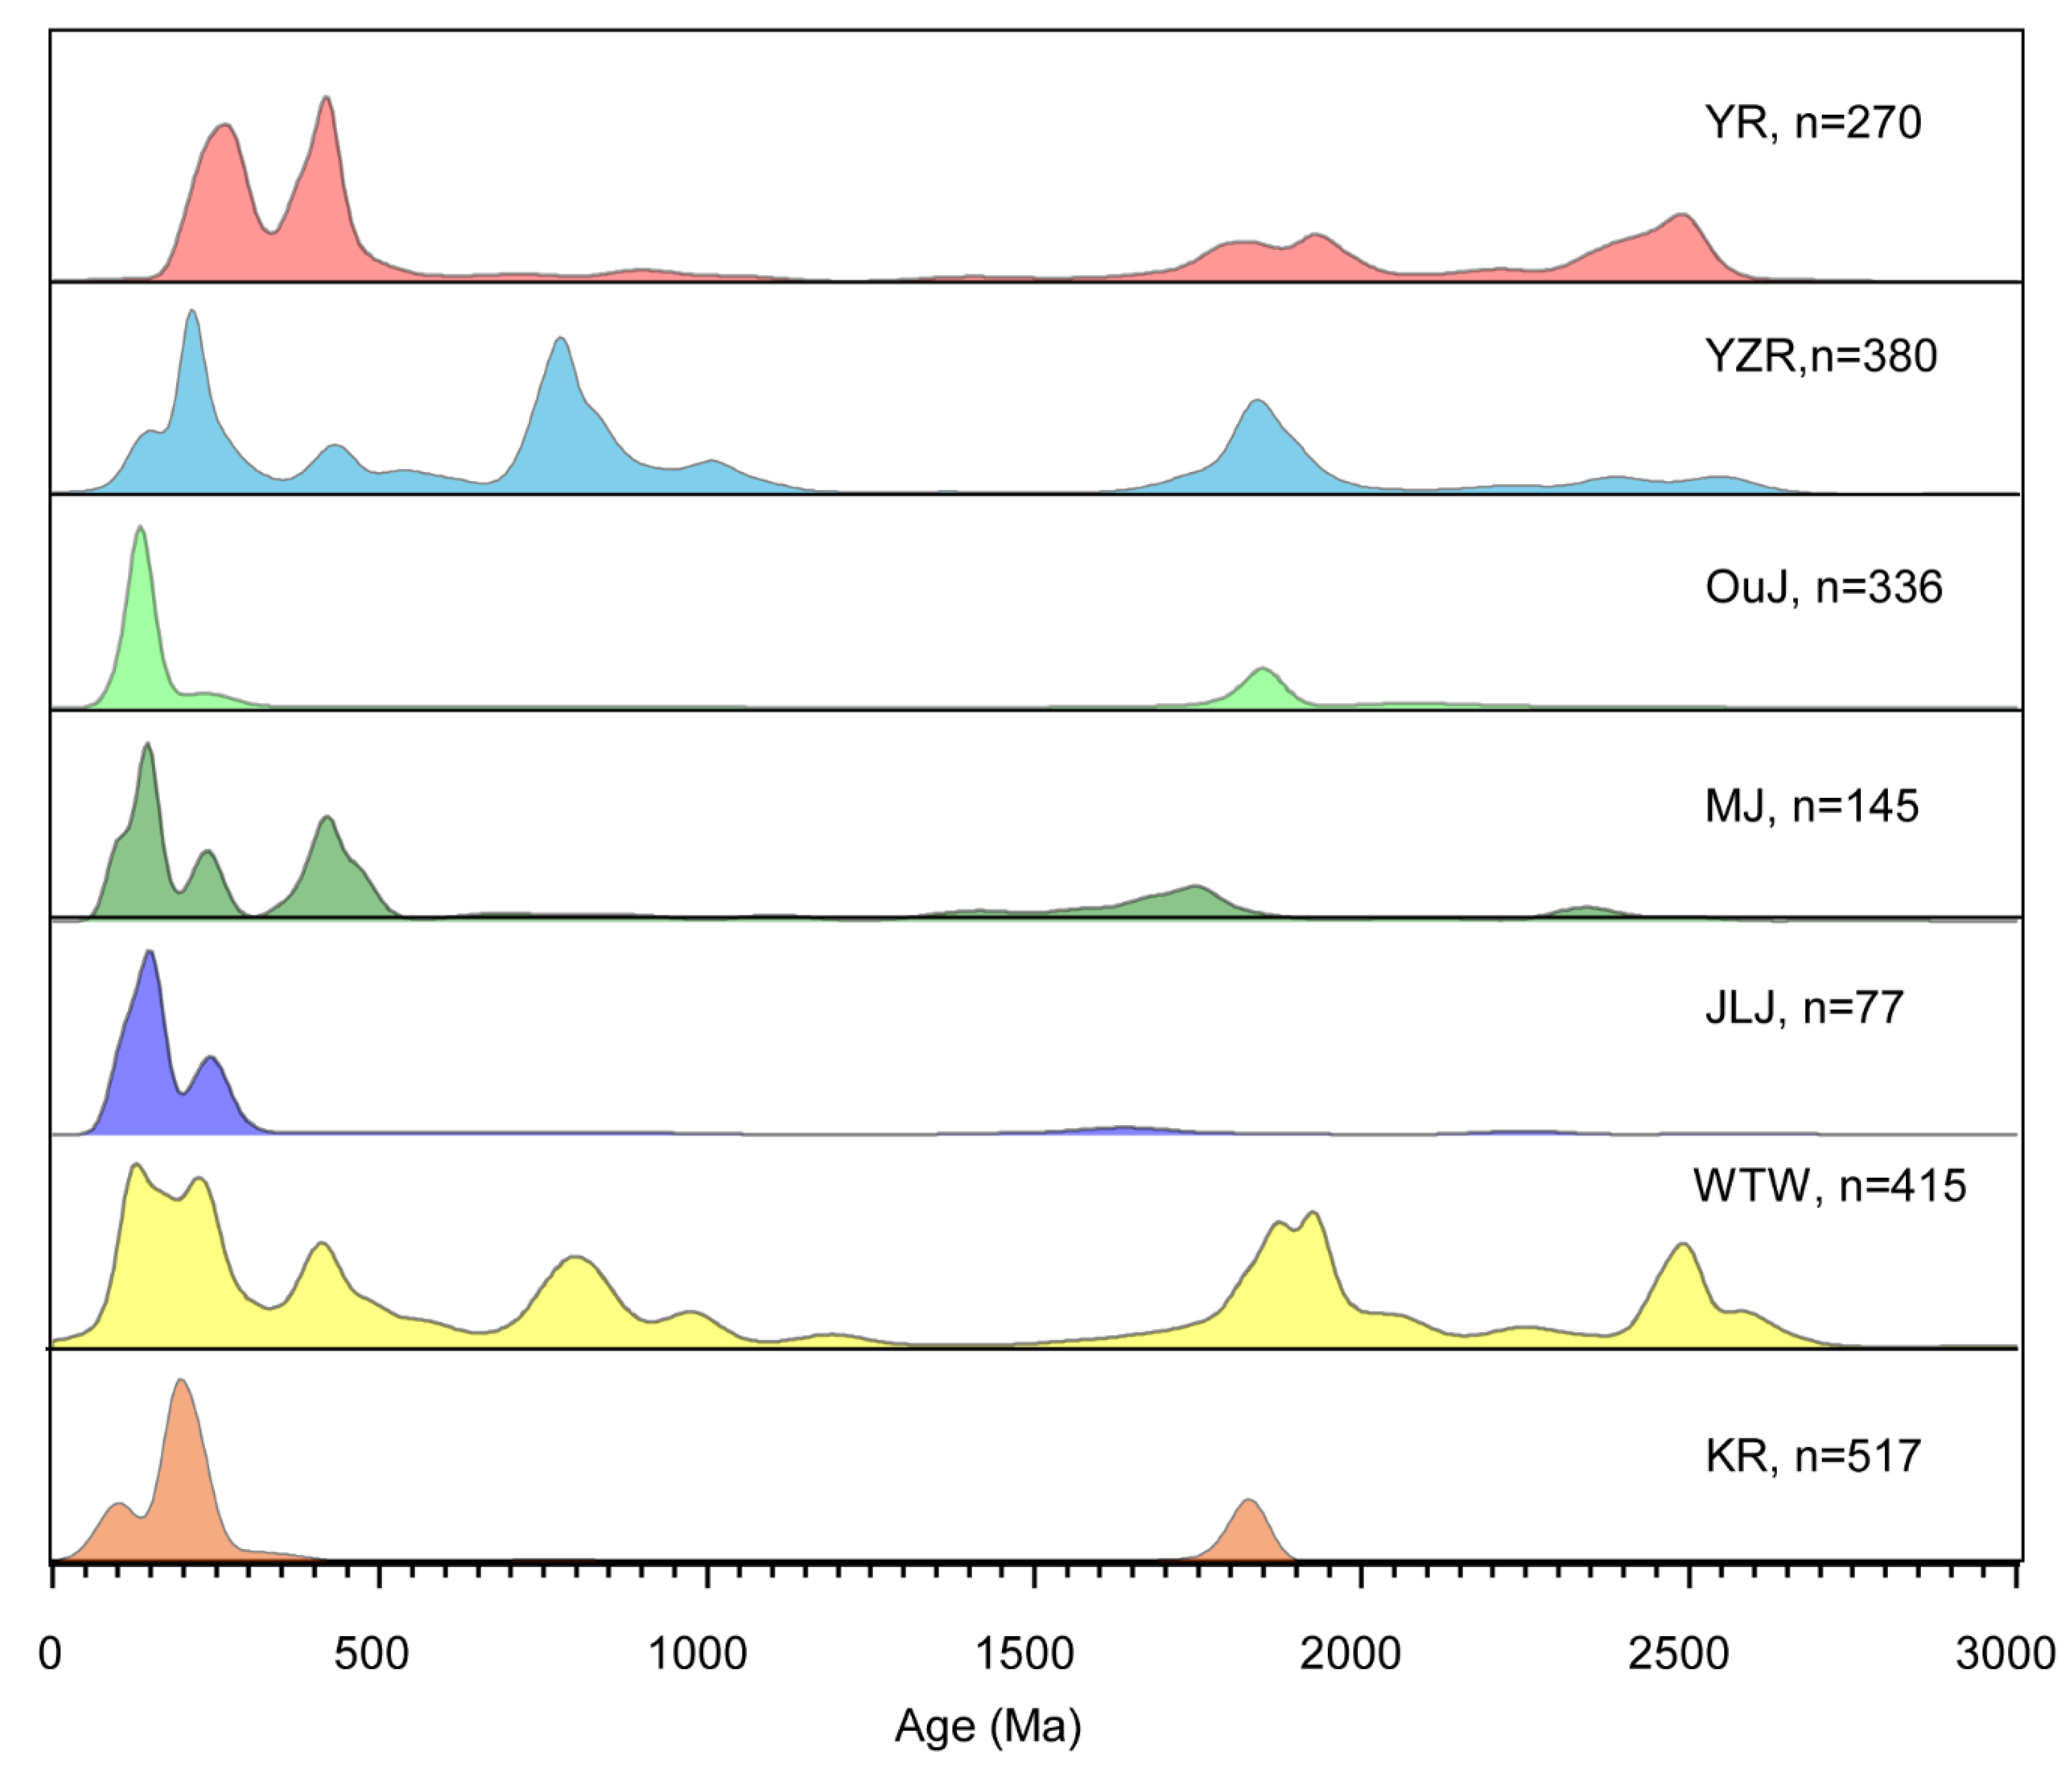
4.1. U-Pb Age Distribution

Because the numbers of best age are variable among different samples (Table 1) and the standard technique kernel density estimation (KDE) is a more robust alternative to conventional age probability distribution [67], we used a KDE plot (Figure 4) to visualize the U-Pb age distributions in this contribution. There are four primary age populations for samples in the Bohai Sea, which are at 203–286 Ma with a peak around 252 Ma, 383–481 Ma with peaks around 420 Ma and 460 Ma, 1830–1940 Ma with a peak around 1860 Ma and 2480–2548 Ma with a peak around 2500 Ma (Figure 4a–c). The most abundant age population is the Mesozoic to Paleozoic one at 203–286 Ma, accounting for a detrital zircon population of 25–40%. Despite that the basement of the NCC formed mainly during the Neoarchean and Paleoproterozoic [45,68,69], there is a minor grain contribution (<10%) from the populations at 1830–1940 and 2480–2548 Ma. The signature of the dominant Mesozoic to Paleozoic age populations in the Bohai Sea samples is similar to that observed from Chinese loess sediments [64], fluvial and desert sediments in the Yellow River catchment [23]. This provides strong evidence from detrital zircon to argue that sediments in the Bohai Sea were derived probably from the Yellow River catchment, and this is true—at least in recent geological history, like the late Pleistocene.
In contrast to samples in the Bohai Sea, the age distributions in the Yellow Sea are obviously different (Figure 4d–g). First, the most abundant age population is at 176–223 Ma with a peak around 200 Ma, which is obviously younger than the age population at 203–286 Ma in the Bohai Sea. Second, there are no Neoproterozoic ages in samples of the Bohai Sea but a very remarkable population at 732–830 Ma in samples of the Yellow Sea occurs. Because that the Yellow River flowed into the Yellow Sea during some periods in the history, the differences of zircon signatures between the Bohai Sea and the Yellow Sea may imply that their sources were different and there existed alternative sediment sources for the sediments in the Yellow Sea other than the Yellow River.
Similar to those of the Yellow Sea sediments, the primary age populations in the East China Sea sediments contain the one at 176–223 Ma with peaks around 200 Ma, 383–481 Ma with peaks around 420 Ma and 440 Ma, 732–830 Ma with a peak around 780 Ma, 1830–1940 Ma with peaks around 1850 Ma and 1900 Ma and 2480–2548 Ma with a primary peak about 2500 Ma (Figure 4h–s). In addition to these five most pronounced populations, for samples in the southern East China Sea there is noticeable one at 81–152 Ma peaking around 130 Ma (Figure 4o–s).
With the exception of sample A10, samples in the northern South China Sea have relatively simple age distributions compared with the other seas. Up to 50% of zircon grains are in the range of 81–152 Ma that peaks around 130 Ma (Figure 4u–w).

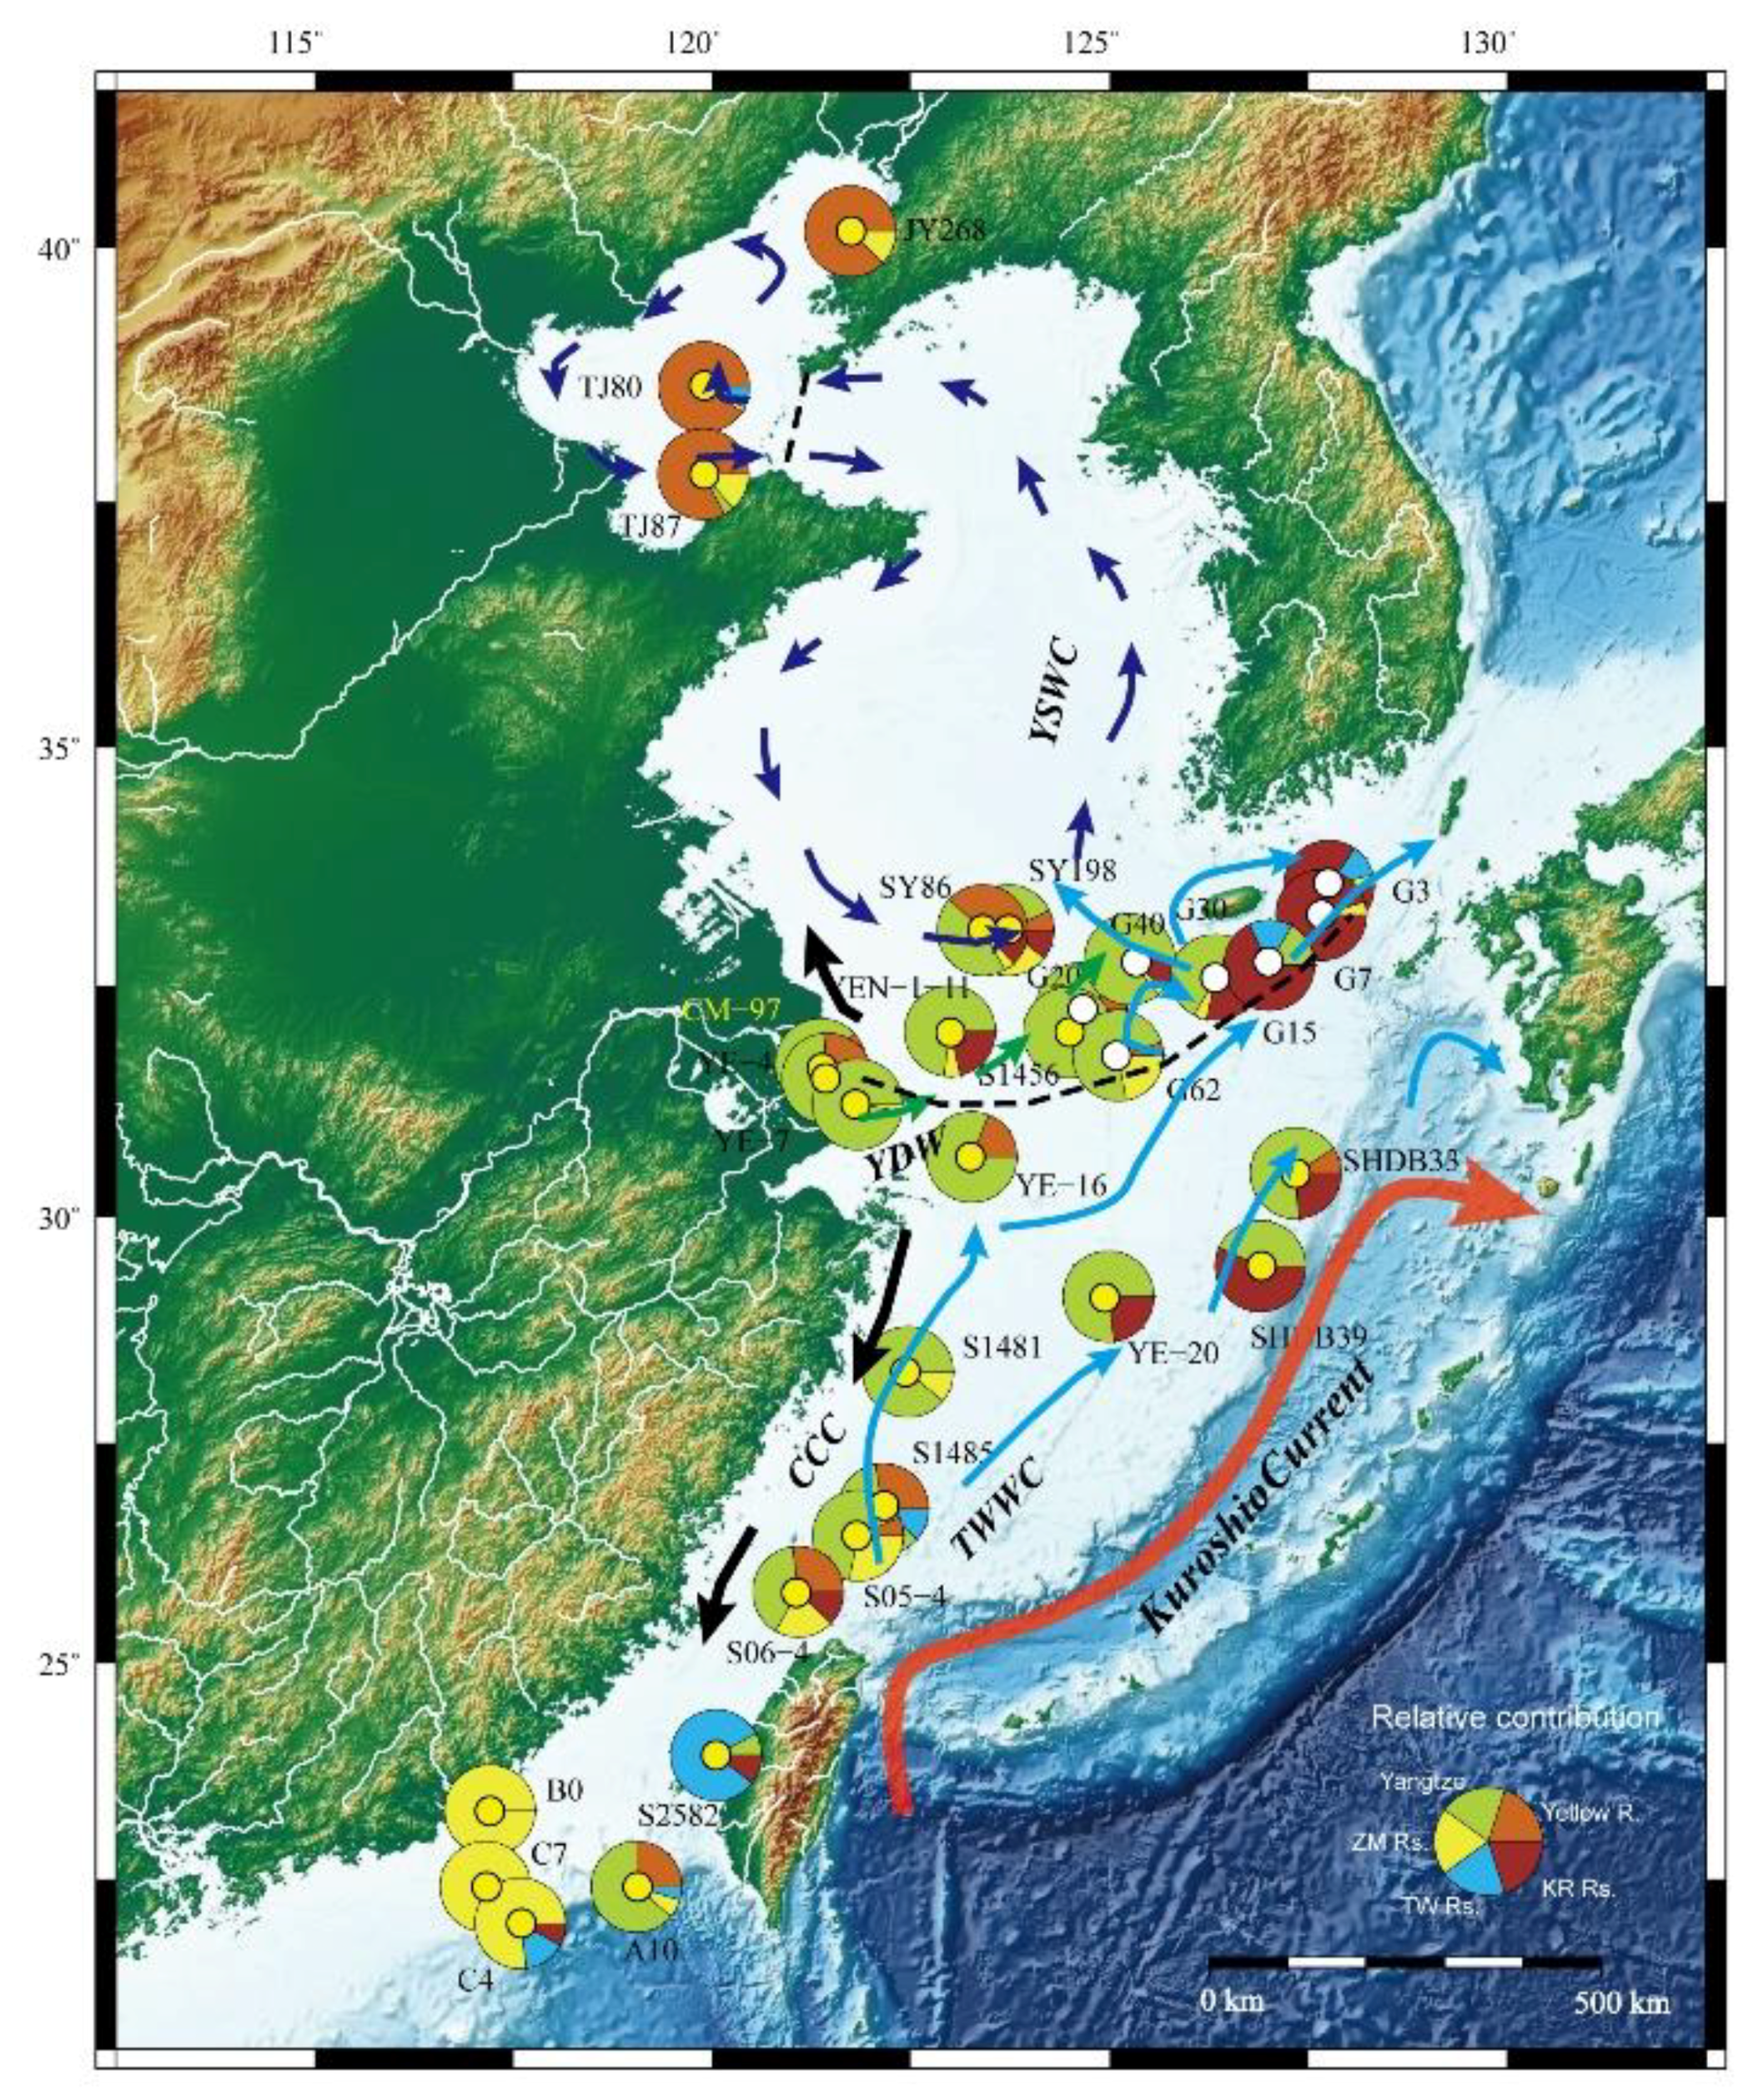
4.2. Spatial Variability of Mixing Coefficient

The results of mixing coefficients are shown in Figure 5, which indicate relative variations in sediment contribution from different fluvial sources. Samples in the Bohai Sea are dominated by the contribution of the Yellow River, with mixing coefficients in the range of 80–90%. Except for sample TJ87, there seems to be no contribution from the Yangtze River. However, it seems that there are 7–14% contributions of small rivers in Taiwan and Zhe-Min provinces, SE China (Figure 4). We think that this is an artifact either due to that we input irrelevant endmembers in the mixing model for samples in the Bohai Sea, or due to the uncertainty of the mixing model to distinguish age overlapping between different samples.
In contrast, samples in the Yellow Sea present increased contributions from the Yangtze River and Korean rivers (Figure 5). The mixing coefficients of the Yangtze river are in the range of 40–70%, while a minor 10–20% for Korean rivers. In contrast, the contributions of the Yellow River in the Yellow Sea reduce to 10–40%. Samples in the East China Sea are dominated by the Yangtze source signal with mixing coefficients in the range of 40–98% except for Sample S2582, which has a mixing coefficient of 8% for the Yangtze River. This exception can be explained by enhanced contributions from Taiwan rivers, such as the Choshui River [25]. The contributions from the Yellow River to the East China Sea are generally lower than 30%, indicating a dominant Yangtze contribution in the sea. In addition, the contributions of Zhe-Min rivers can only be observed in the southern part of the East China Sea in the range of 10–30%. In contrast, their contributions in the northern South China Sea increase greatly up to 50–90%.

5. Discussion

5.1. Provenance Linkage between Fluvial and Marine Surface Sediments

The analyses of detrital zircons U-Pb ages in the ECSs provide us a way to link various fluvial age signals to the those in the continental margin seas. The MDS plot in Figure 6 produced a ‘map’ of points on which similar samples cluster closely together, and dissimilar samples stay far apart, which provides a straightforward way to distinguish provenance similarity and linkage. As shown in the plot of MDS (Figure 6), samples in the Bohai Sea are very close to those in the lower Yellow River reaches [23,61]. This agrees with the fact that modern sediments in the Bohai Sea are mainly derived from the Yellow River catchment.
Similarly, samples in the northern South China Sea are clustered around the fluvial endmembers, including Ou Jiang [21], Min Jiang [22], Jiulong Jiang [21] and the Pearl River [62] (Figure 6). This implies that the rivers draining the CF (Figure 1) have contributed most of sediments deposited in the northern South China Sea. This is at least correct for sediments in the shallow sea. On the other hand, the contribution from Taiwan Island would be significant when samples taken from slope and deep sea are examined (e.g., sample A10).
Samples S2582 and S06-4 exhibit a short distance to the Choshui River in western Taiwan, suggesting a source-to-sink connection (Figure 5). In contrast, samples A10 and S05-4 have closest neighbors of samples in the Yangtze delta (YE-4) and the Yellow Sea (SY198). This is difficult to explain on current geographic context and we propose two contrasting explanations. The first is that it could be caused by the recycling processes of zircon grains in which some zircon grains in Taiwan Strait may have been derived from the YC and NCC in geological past [25]. The recycling processes have made the signal less distinguished. If this is true, the discrimination between Taiwan and Yangtze sources by the method of zircon U-Pb geochronology alone would be difficult. Another explanation is that it could have been caused by sediment mixing between those derived from Taiwan Island and the Cathaysia. This is more likely because the U-Pb age distributions of the Yangtze River and Choshui River can be slightly distinguished by the presence or absence of a ~130 Ma population [20,25], which is the most distinct age population in fluvial sediments from the CF [21,22]. As shown in Figure 4, our results are in agreement with the latter explanation.
In contrast to samples taken from the other seas, which show clear source-to-sink connections, there exists a more complicated pattern for sediments in the East China Sea and the Yellow Sea (Figure 5). Despite of that, most samples exhibit good correlations with the Yangtze fluvial sediments as indicated by the first and second closest neighbor lines in Figure 5, which evidently suggest that sediments derived from the Yangtze Catchment have played a very important role in determining detrital zircon signatures over this very broad continental shelf. On the other hand, the very scattered points on the MDS plot for samples in the East China Sea also imply that the fluvial source signals have been modified in the shallow sea environment relative to the Yangtze fluvial source [20]. We consider that this pattern is related to the hydrodynamical system in the region, which will be discussed in detail in Section 5.3.

5.2. Provenance Discrimination from A Tectonic Perspective

In order to discuss our results from a geological perspective, we classified the age distributions in Figure 6 based on the most pronounced tectonic events in the geological history of China and East Asia [71]. The samples from the Bohai Sea are characterized by high proportions of zircon grains of the Paleozoic and Paleoproterozoic-Neoarchean eras. Originally, the Paleozoic grains were associated with four tectonic events, such as Indianian (200–260 Ma), Tianshanian (260–397 Ma), Qilianian (397–513 Ma) and Sinian (513–680 Ma). The Paleoproterozoic-Neoarchean grains may be related to the tectonic events of Lvliang (1800–2500 Ma) and Wutai (2500–2800 Ma) which are related to the formation of the NCC. By taking the U-Pb ages in the Yellow River catchment [23,61] into account, we argue that there are two potential sources of the zircon grains for the modern sediments of interest. The first is the Neoarchean basement of the NCC, which is characterized by the presences of 1.8 Ga and 2.5 Ga zircons. The second is the northeastern Tibetan Plateau, which is marked by a dominant Paleozoic zircon U-Pb at populations of 200–350 Ma and 350–550 Ma (Figure 7).
Different to the Bohai zircon ages, the presence of Neoproterozoic zircons is very typical in the Yellow and East China Sea. We think the Neoproterozoic zircons can be related to the formation of the basement of Yangtze Craton in the Jinning Orogeny during 700–900 Ma [70]. Although the high proportions of Paleozoic zircons in the Yellow and East China Seas appear to be similar to those in the Bohai Sea (Figure 7), the sporadic distribution of Mesozoic igneous rocks in the lower Yangtze due to the subduction of Paleo–Pacific plate to the Eurasian plate may have provided extra grains [48].
The provenance of zircon in Taiwan Island is a matter of controversy. Potential sources include the YC [71], CF [22], NCC [25] and a subducted unknown microcontinent [52]. As shown in Figure 6, the zircon U-Pb age proportions of samples close to Taiwan Island in our study looks similar to those from the Yangtze source. In contrast, they have relatively low content of zircons of the Indosinian and Jinning periods but relatively high of the Wutai period (2500–2800 Ma). Moreover, in samples of S05-4 and S06-4, there are distinctive contributions from the Yanshanian period (135–200 Ma). This suggests that the zircon grains of these sites have multiple sources, which is possibly due to sediment mixing between Taiwan Island and the CF. According to the present-day configuration of ocean currents (Figure 1), it is less likely for zircons from the Yangtze River to be transported to the Taiwan Strait or further southward to the South China Sea.
The U-Pb age compositions in the northern South China Sea are featured by a dominance of Mesozoic Yanshanian zircon grains and a paucity of Neoproterozoic grains. This allows us to speculate that their source area may consist of relatively young rocks and are very proximal to the place of deposition. The widely exposed Mesozoic Yanshanian igneous rocks in the CF are therefore the most likely sources [21,22].

5.3. Hydrodynamic Influence on Zircon U-Pb Age Distribution

Because zircon is generally believed to be resistant to chemical and physical weathering during sediment transport, it has been regarded one of the most reliable approach for provenance analysis [9]. However, this view has been challenged because an age distribution may be biased by factors like fertility [13], grain size [14] or sampling and analytical procedures [72]. To discuss these factors is far beyond the scope of this study, however, we would expect less grain-size sorting on our samples as we just focused on the very fine fraction of the zircons (60–125 µm) and there is no statistically significant correlation between zircon sizes and U-Pb ages on this fraction [14]. As the result, we would like to just focus on the question of spatial variability of the Yangtze mixing coefficients in the East China Sea.
As shown in Figure 8, there is a gradual decreasing trend of the Yangtze mixing coefficients from the estuary to the continental shelf along directions of 60° NE and 200° SW. The decreasing trend implies the fluvial provenance signal has changed in the marine environment. It seems contradictory to our argument above that the provenance or fluvial source is the dominant factor controlling U-Pb age distribution of the sediments in the seas. This can be attributed to the influences of oceanic hydrodynamics on zircon age populations. Spatial variations in mixing coefficients of the Yangtze River are generally consistent with seasonal current change in the East China Sea (Figure 8). The surface and deep currents of the East China Sea are mainly driven by the Asian summer/winter monsoons. During summer as the result of the northeastward movements of surface and bottom currents (Figure 1 and Figure 8), the surface and bottom sediments are transported in the primary directions. The coastal currents—driven by the northeast winter monsoon—become strengthened in winter, which may cause part of sediments transporting southward. Moreover, a recent study using the regional ocean circulation model (ROMS) also suggested that the sediments derived from the Yangtze River are not only deposited in the East China Sea but also in the Yellow Sea [73]. In addition, a tide–current model suggested that a very pronounced trend of erosion/deposition of sediments along the direction from the Yangtze Estuary to the Cheju Island due to the influence of tides [40]. Therefore, we argue that the gradual decreasing trends of mixing coefficients of the Yangtze River in the East China Sea are resulted from the combined effects of currents and tides (Figure 1 and Figure 8).

5.4. Sediment Budgeting

Mixing coefficients modeled from U-Pb age distributions have been used in some studies as proxies for relative erosion rates in various fluvial catchments [4,8,11,74]. From a perspective of mass balance, when a long-term equilibrium between sediment erosion and deposition is reached, the mixing coefficients in sink area can be used to infer relative depositional fluxes/rates and sediment budgeting [8]. To test whether this is true in the marine environment, we compared the mixing coefficients of our study with sediment budgets estimated from nuclides methods such as 210Pb and 137Cs from short-cores in the ECSs [75,76].
According to the sediment budgeting model in [75], the historical annual sediment flux of the Yellow River can reach to 1086 Mt per year and ~70% of the sediments are deposited in the Bohai Sea while ~30% are transported into the Yellow Sea. This means that most sediments derived from the Yellow River are deposited in the Bohai Sea and only 30% of them, equivalent to 376 Mt sediments per year, are transported into the Yellow Sea. This accounts for 57% of total input sediments of the Yellow Sea [75]. Despite it is still not clear which are the sources of the rest of input (~40%), there are 414 Mt sediments deposited in the Yellow Sea per year [75]. This means that the relative sediment contribution from the Yellow River in the Yellow Sea could reduce to around 22%, which coincides broadly with the mixing coefficients of samples SY198 and SY86 that are in the range of 7–38% (Table 2). The decreasing trend of the mixing coefficients of the Yellow River from Bohai Sea to the Yellow Sea helps us to catch a glimpse of provenance signal modification along different sedimentary systems as the result of sediment mixing.
A similar decreasing trend of mixing coefficients of the Yangtze River is also observed in the East China Sea. The mean sediment contribution from the Yangtze River in the East China Sea is estimated to be about 72% [75], which is strikingly consistent with the averaged mixing coefficient (72.8%) in the East China Sea (Table 2). According to the study [76], the annual sediment contribution from the Zhe-Min rivers in the East China Sea is about 17–20 Mt, the contribution from the Taiwan rivers is in the range 70–150 Mt and the rest 55 Mt may be from the Yangtze River or the northern East China Sea. If this is correct, this means that 33–67% of sediments are derived from the Taiwan rivers. However, it is different with our results that give a very high mixing coefficient value (81.6%) in the sample of S2582 but very low coefficients (0–11%) in the other samples close to the Taiwan Island in the East China Sea (Figure 5). This could be partly attributed to the scale differences between the two studies.
According to the above discussion, we argue that the mixing coefficients of a specific source obtained from zircon U-Pb age mixing models could be applied to infer relative sediment budgeting when the present source signal is well defined. From the mixing coefficients of the Yangtze River distributed in the East China Sea, we can observe that most of surface sandy sediments in the East China Sea are primarily derived from the Yangtze River and the contributions from the Yellow River are limited to the region of the Bohai and Yellow seas. This argument seems different if compared with a recent provenance study in the Okinawa Trench [28], in which the authors suggested that the main source of terrestrial sediments in the Okinawa Trench was the Yellow River during the period of the last deglaciation. It is difficult to compare results of the two studies directly due to the differences in methods, sediment grain-sizes and time scales. It needs to be studied further in the future, especially when the technique of small-volume U-Pb zircon geochronology by laser ablation multi-collector ICP-MS [77] and the large-n analysis [15,72] become routinely feasible, which will minimize the uncertainties in terms of source and sink signals of the mixing model and disentangle provenance signature from signals of hydrodynamics [78].

6. Conclusions

In this study, we obtained over three thousand detrital zircon U-Pb ages from 23 samples in the ECSs and a number of conclusions can be drawn as follows:
(1)
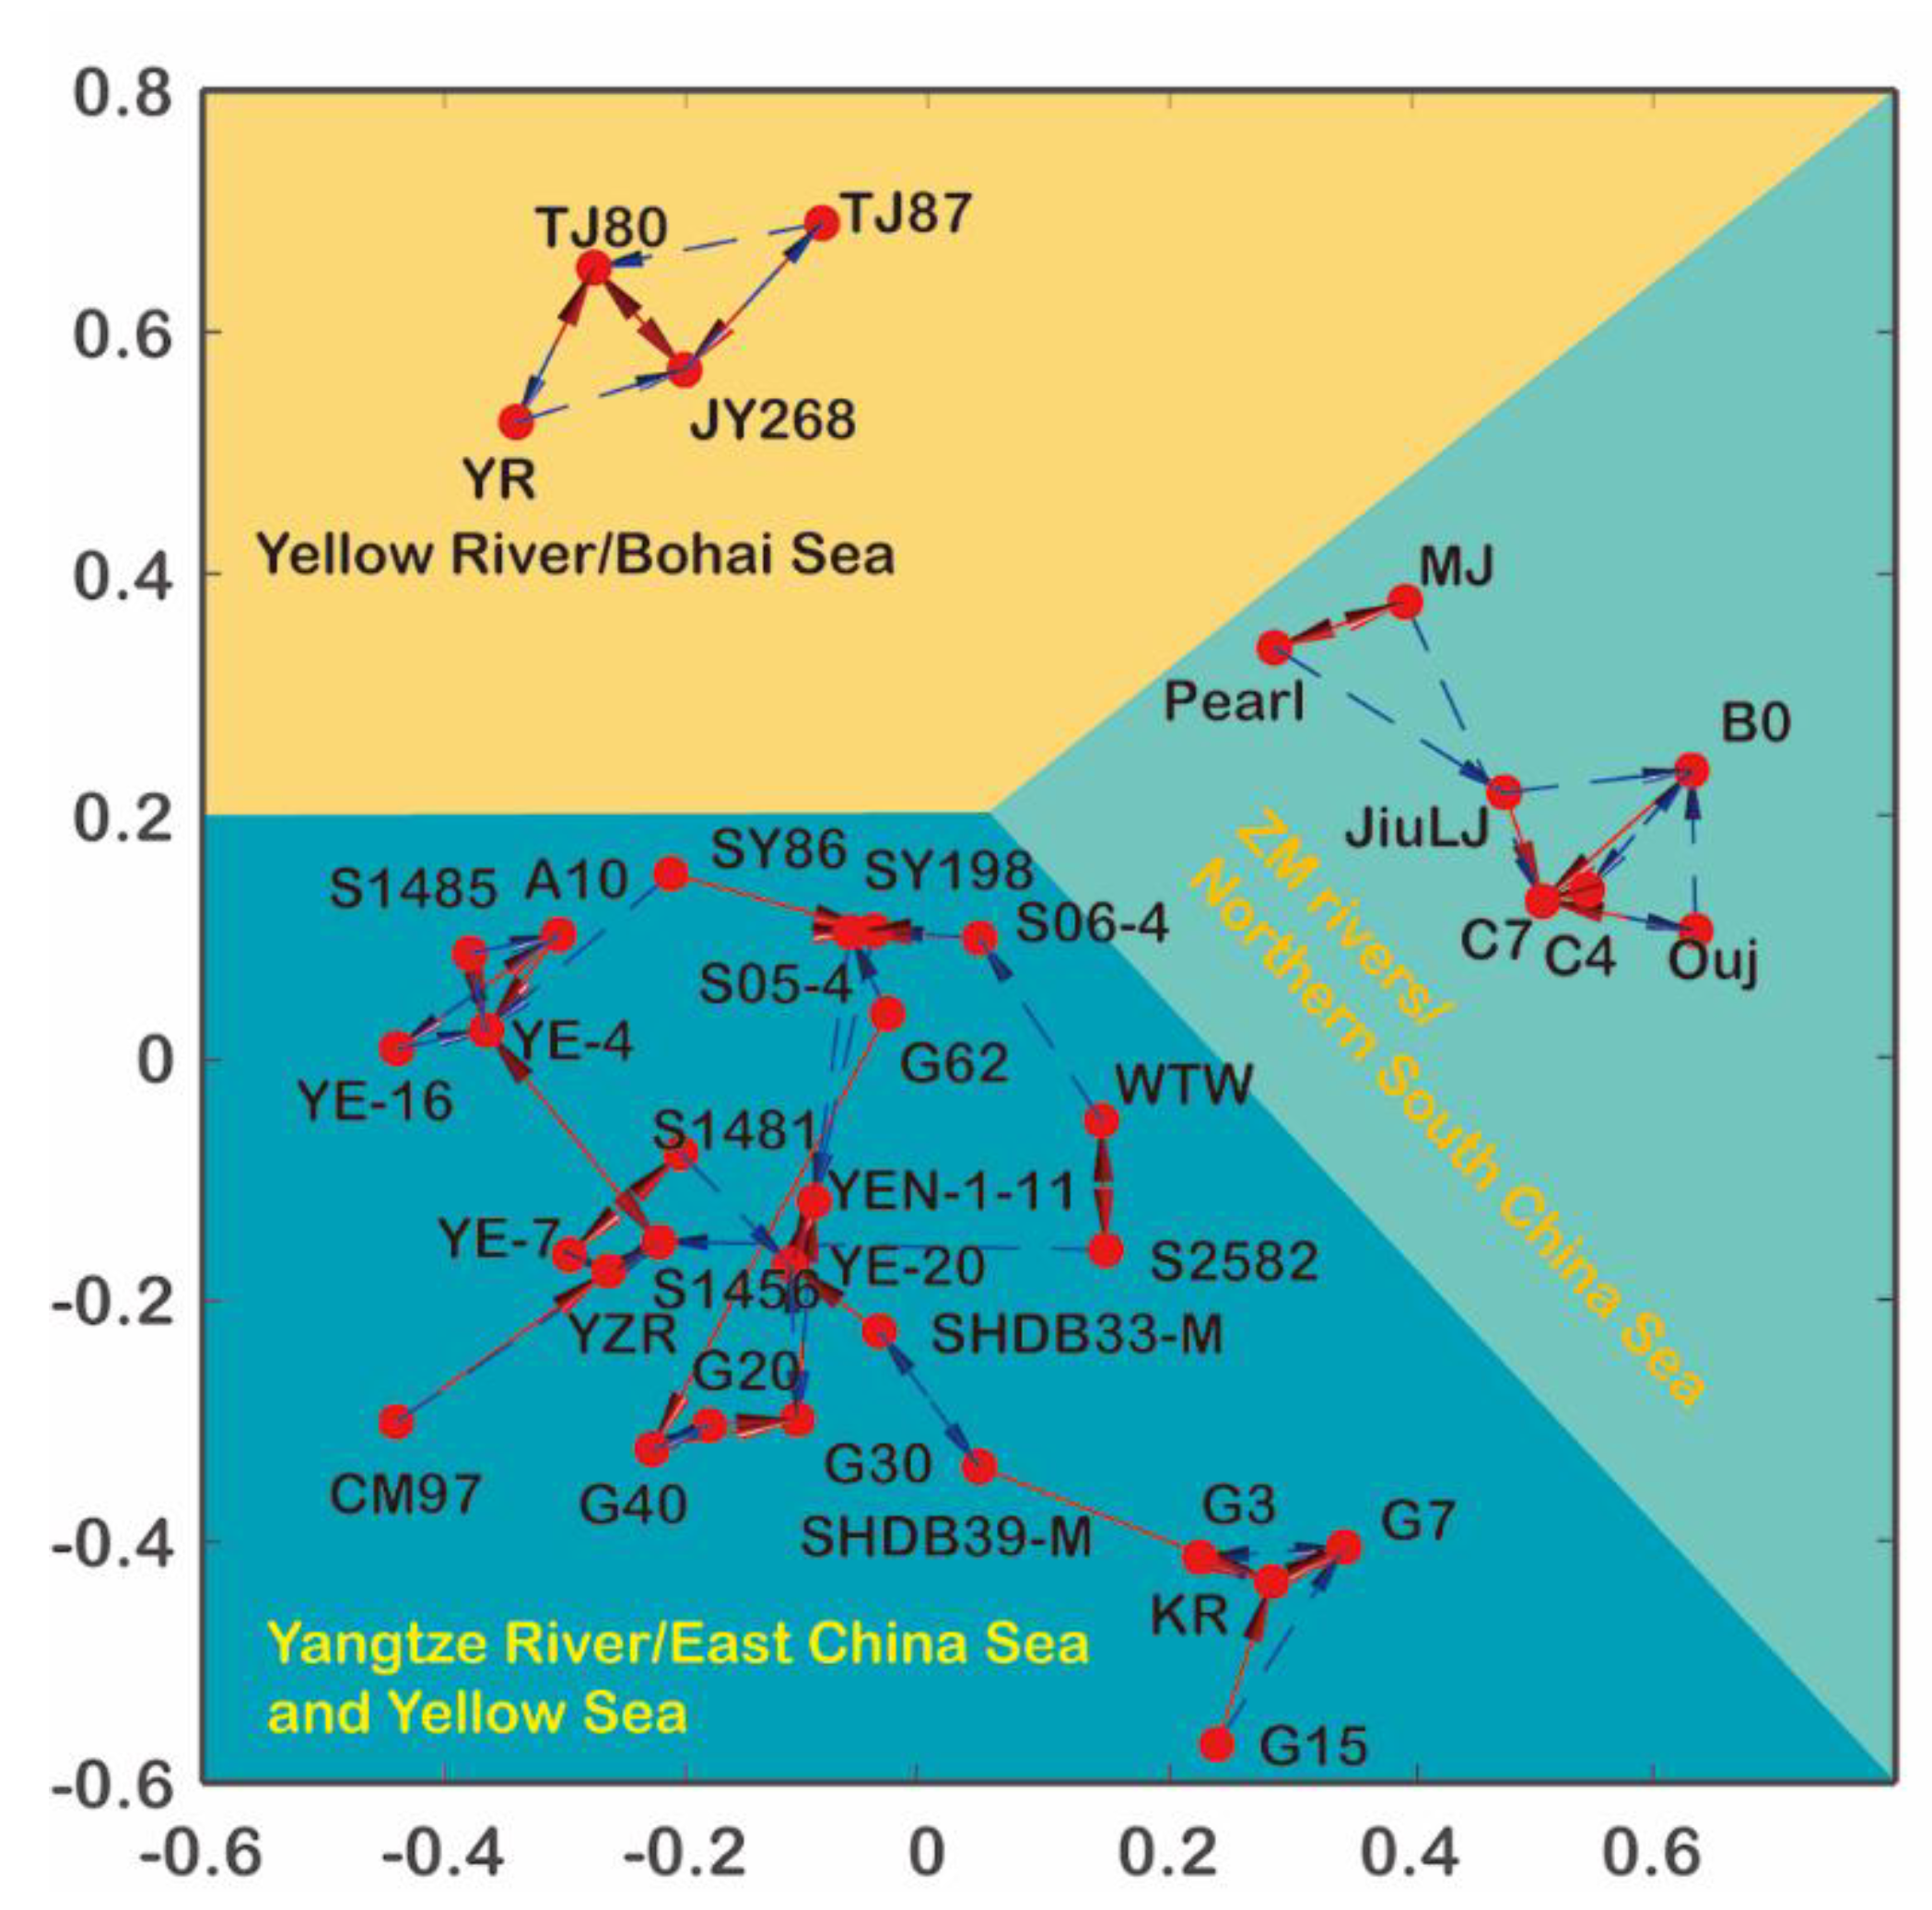
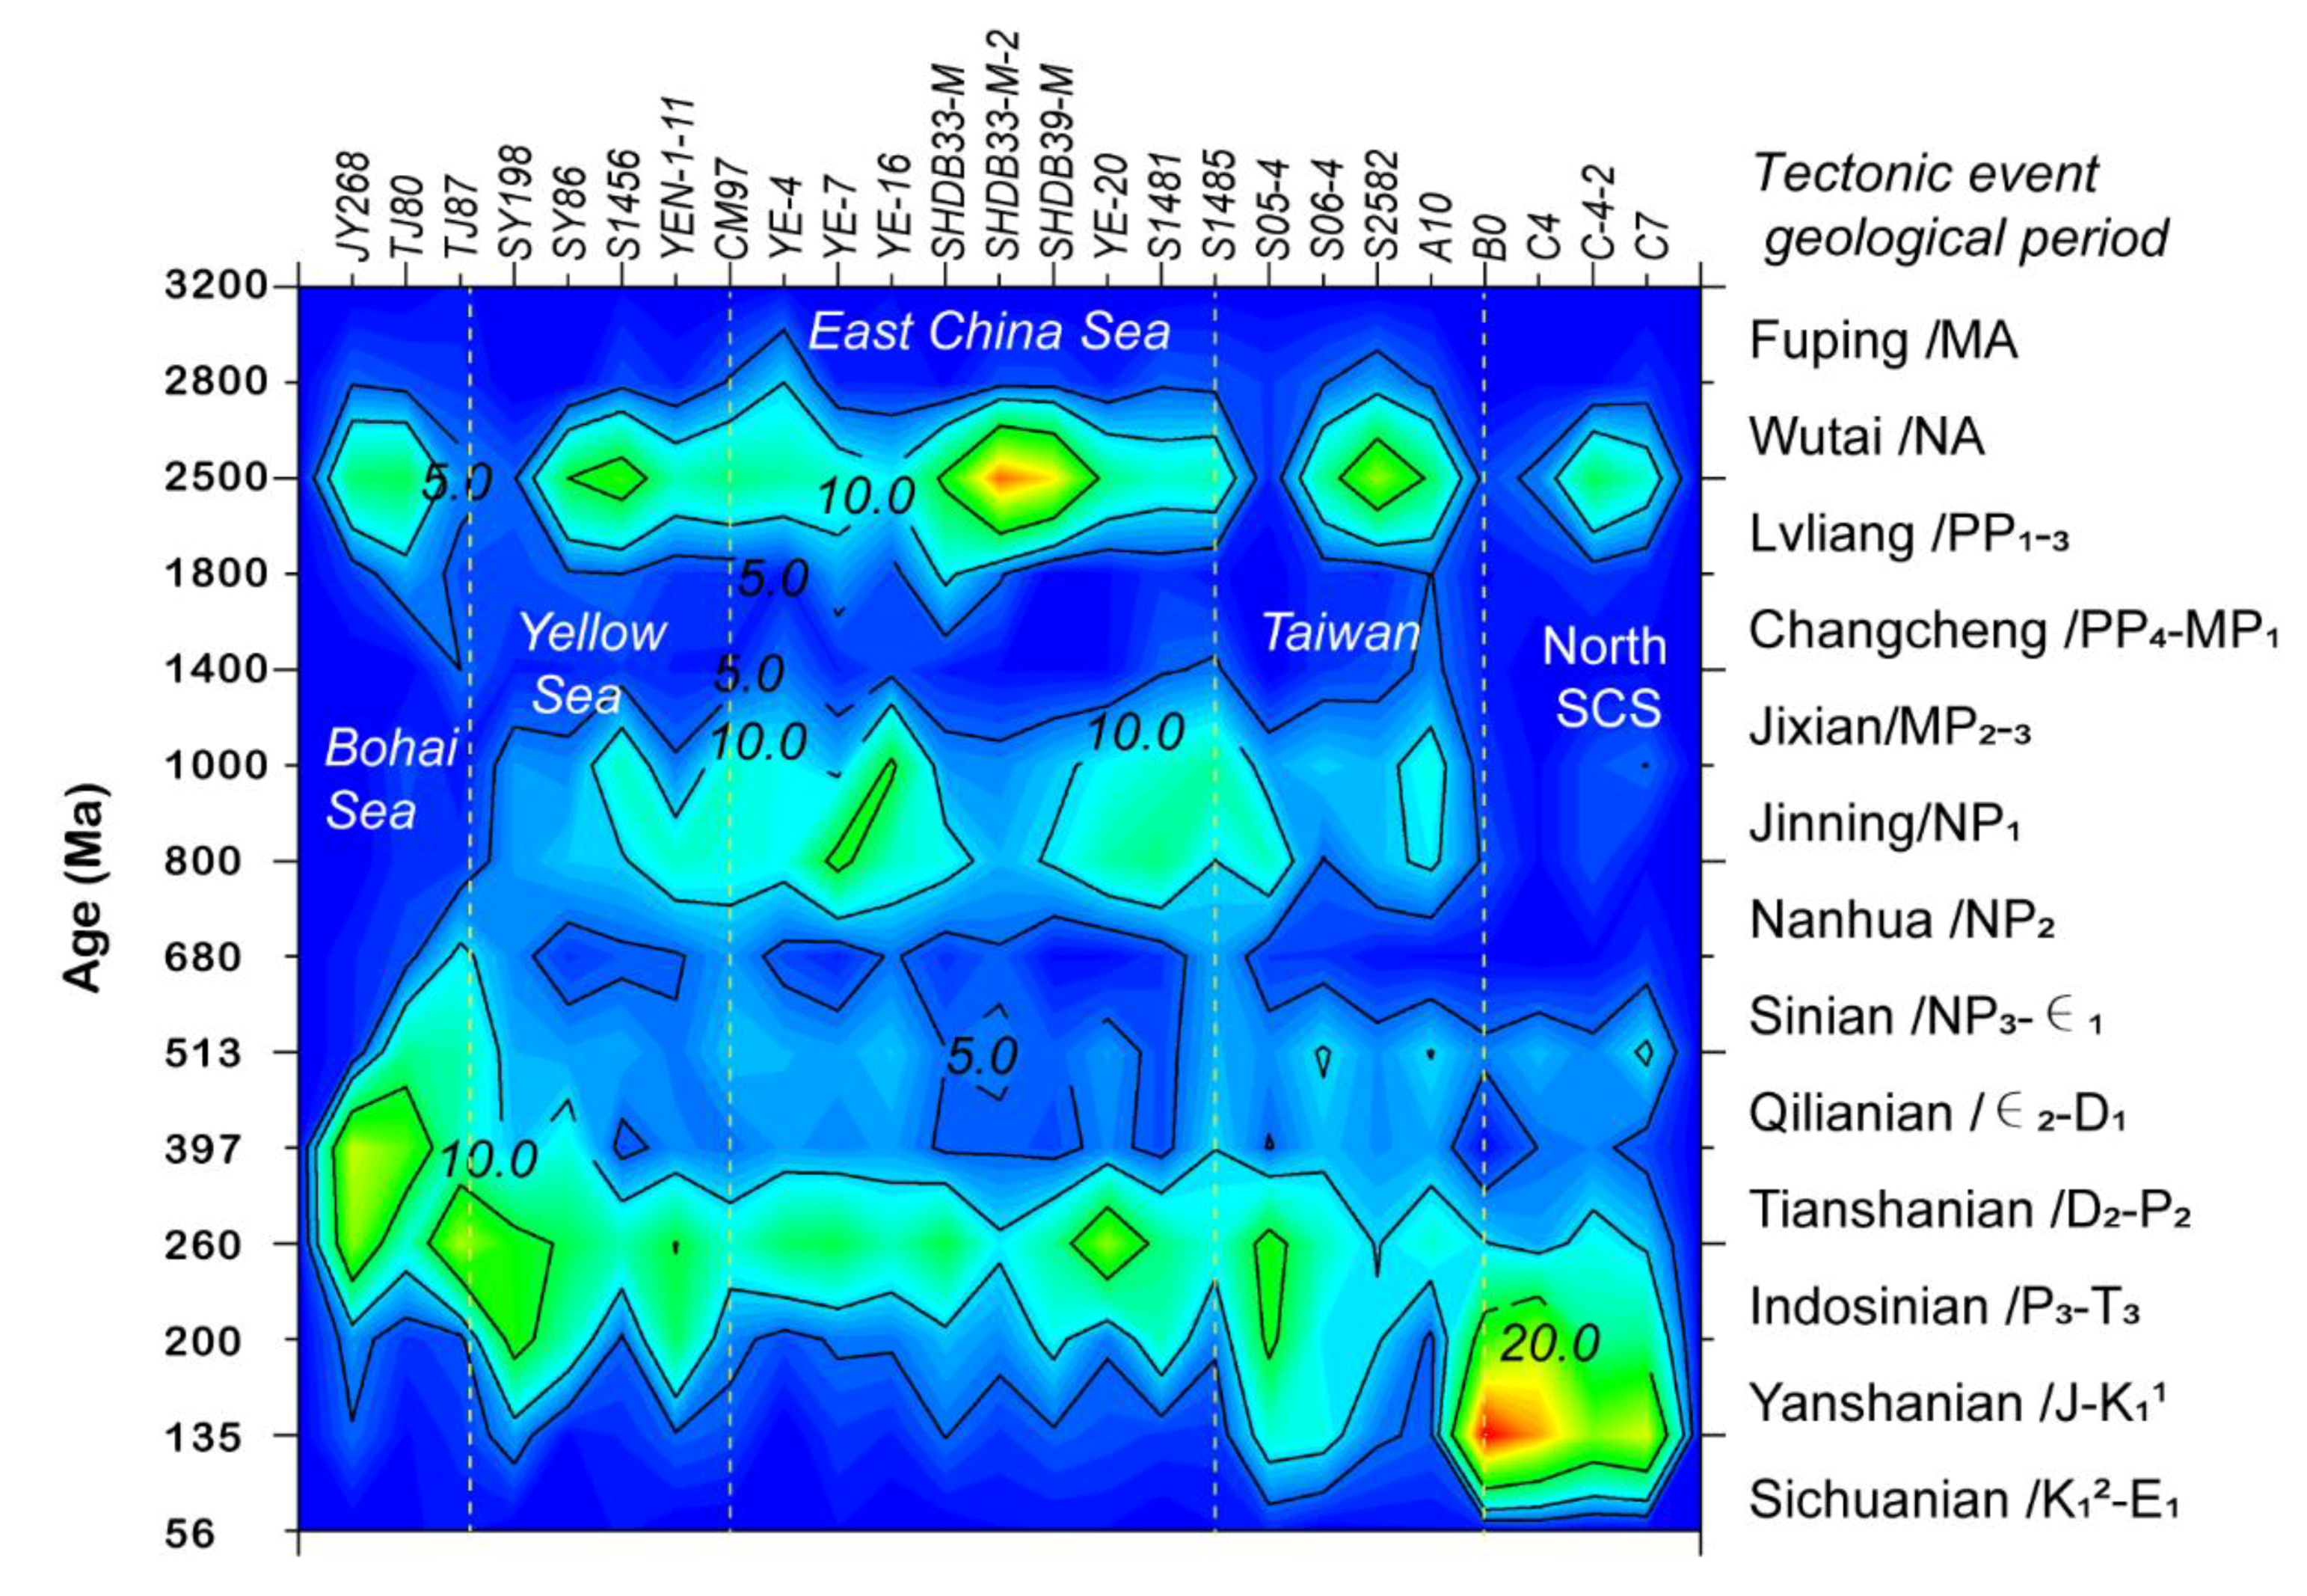
Sediments in Bohai Sea, East China Sea and Taiwan Strait can be readily linked to fluvial inputs from the Yellow River, Yangtze River and Taiwan rivers, respectively. The presence or absence of the population of 732–830 Ma in the YC and NCC is the most reliable age signature to distinguish zircon grains derived from the two source regions. Detrital zircon U-Pb geochronology is very robust approach to perform provenance analysis for surface sediments in the ECSs. The age distributions of detrital zircon in the margin seas are mainly controlled by tectonic settings of the continent.
(2)
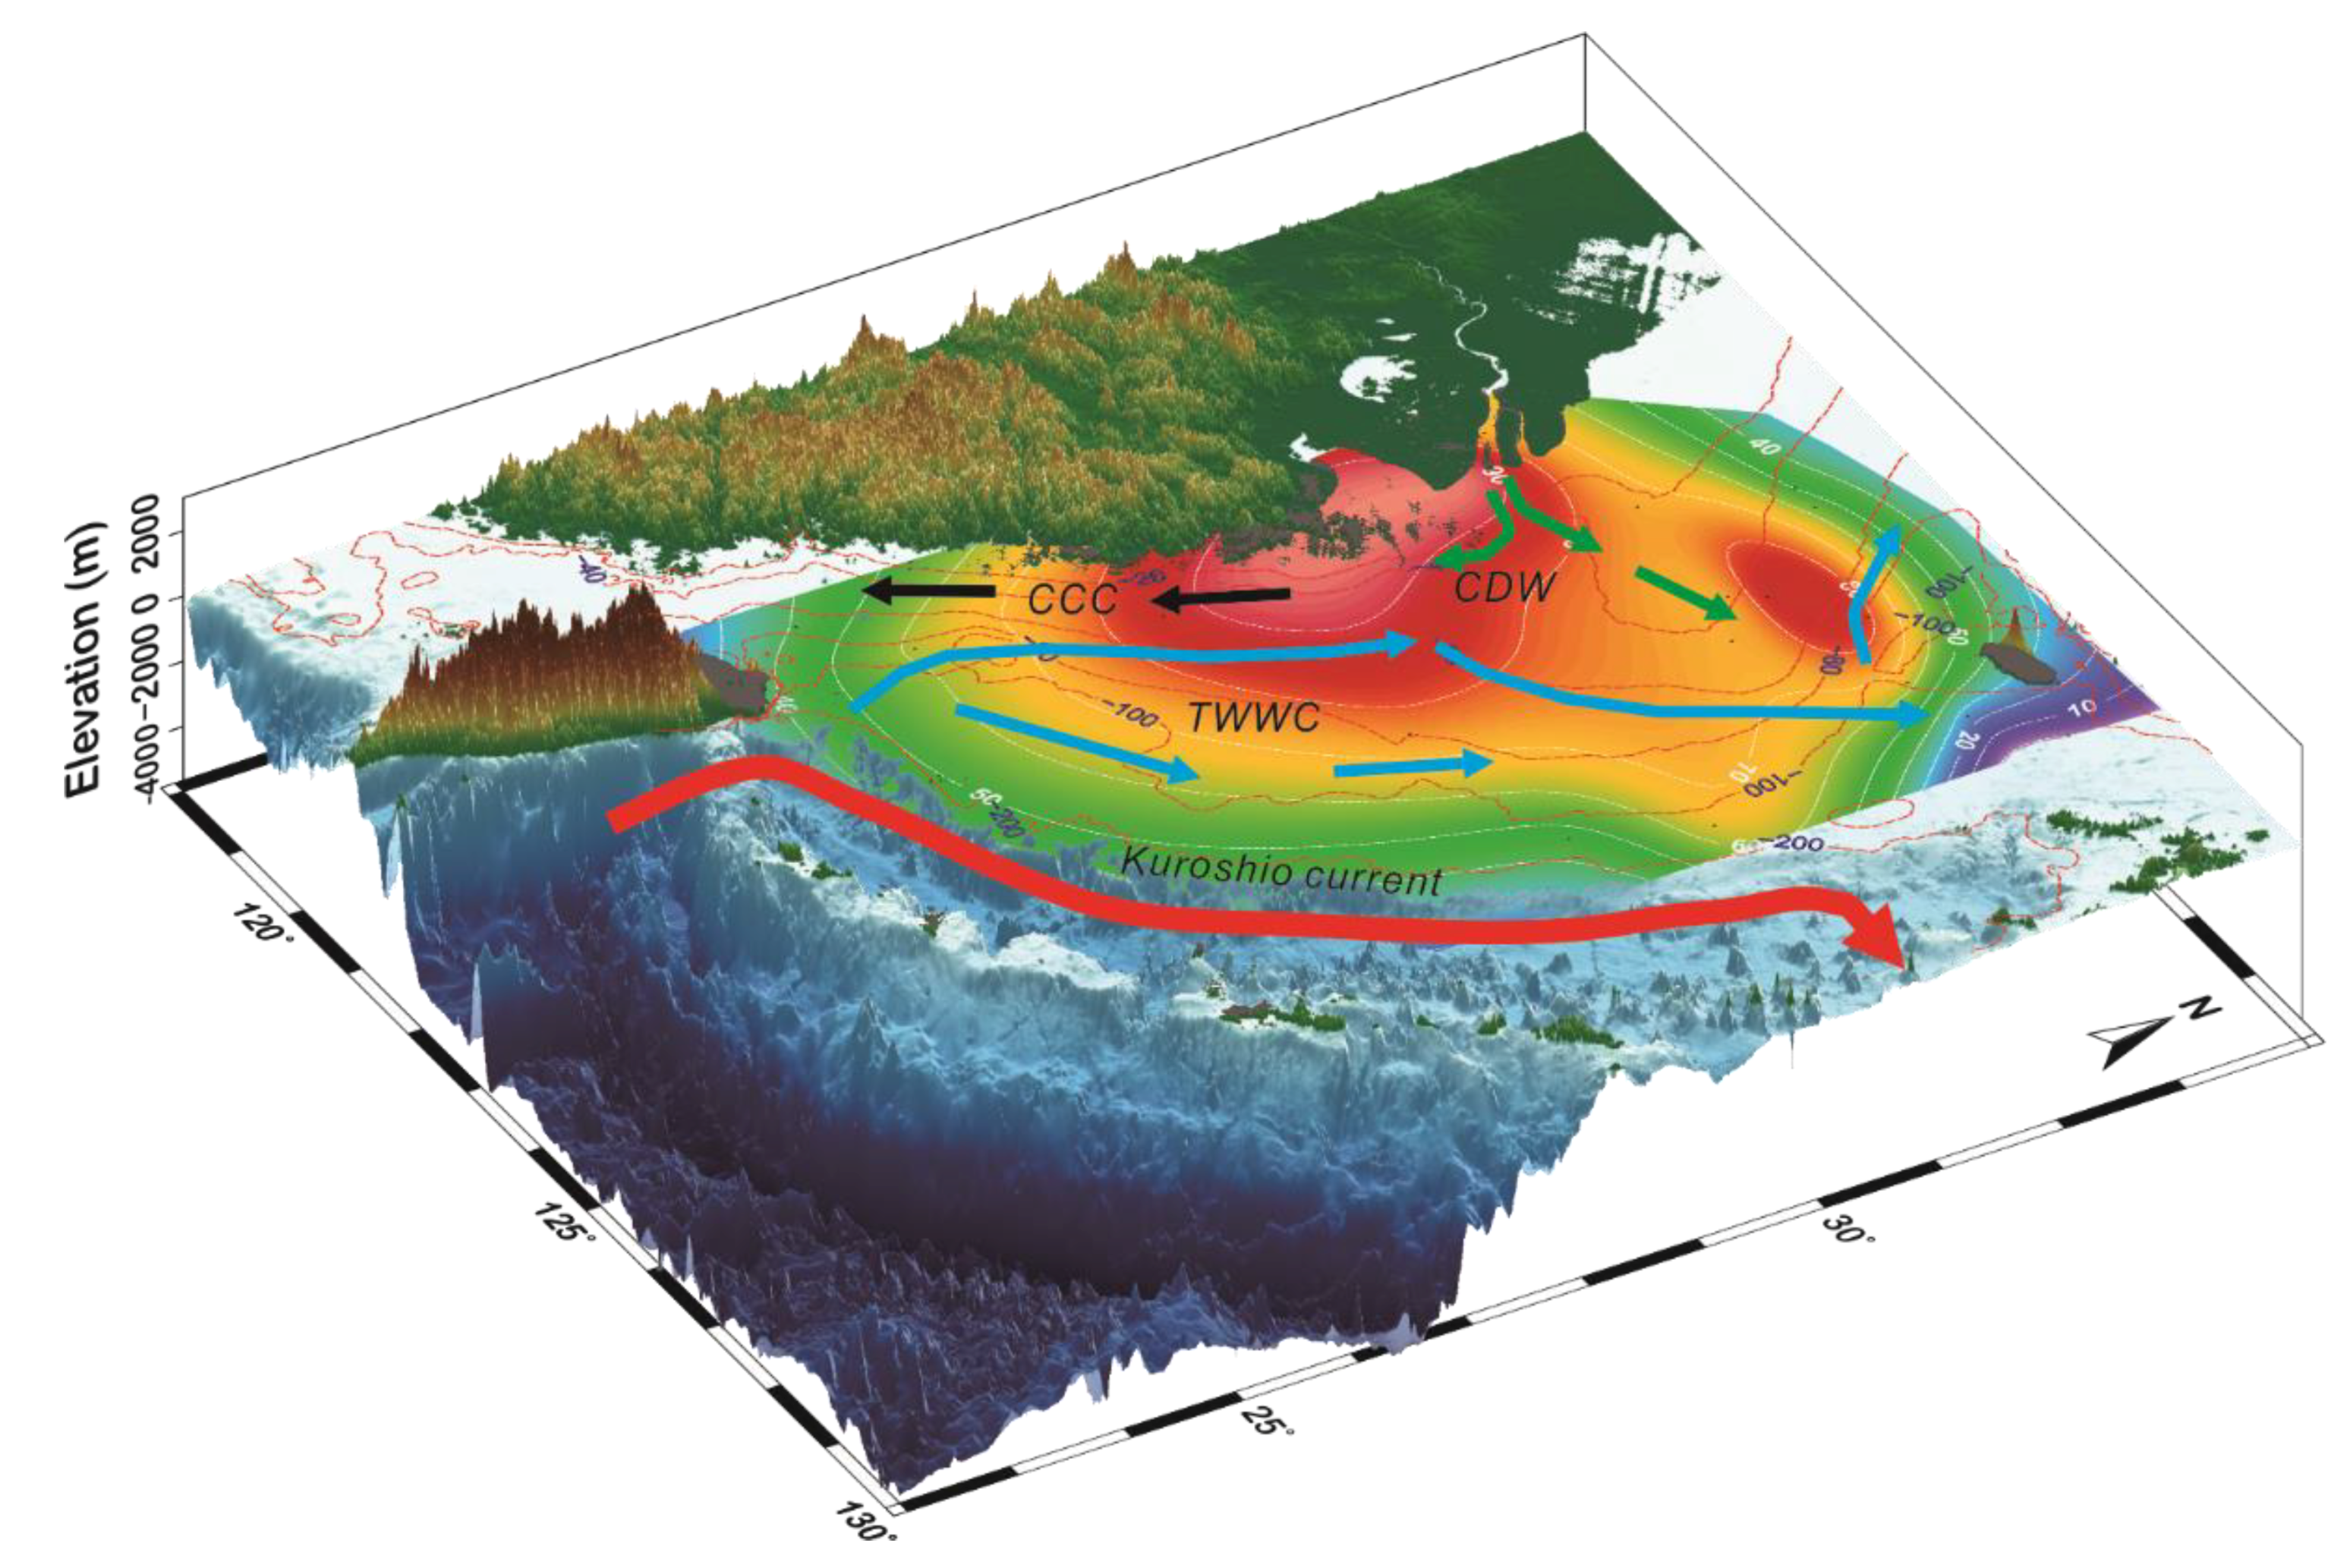
Due to the combined effects of currents and tides, the sediments derived from the Yangtze River could be distributed over a very wide area in the East China Sea, resulting in two dominant transport trends as viewed from the mixing coefficient pattern. The ocean hydrodynamics play an important role in partitioning sediments and modifying associated provenance signals in the marine source-to-sink system. The spatial variations of mixing coefficient of a special source endmember could provide a quantitative or semi-quantitative way to understand how the provenance signal change in the seas due to the influence of hydrodynamics.
(3)
Lastly, the mixing modeling results of the Yangtze River are generally comparative to the sedimentation rate pattern of the sea. This enables us to argue that the sediment discharge from large rivers (e.g., the Yangtze and Yellow River) have contributed more sediments in the continental margin. As a result, we conclude that the combination of the U-Pb zircon geochronology with mixing models could provide us a feasible way to infer relative changes of sediment budgets in the geological past when the U-Pb distributions of present rivers are well defined and their distinctive signatures have been preserved in sediment records.

Supplementary Materials

The following are available online at https://0-www-mdpi-com.brum.beds.ac.uk/2075-163X/10/5/398/s1, Table S1: U-Pb ratios and ages of surface sediments in the east China seas.

Author Contributions

Conceptualization, X.H. and S.Y.; methodology, J.S., W.Y., Y.L. and F.L.; resources, Z.W. and X.M.; writing—original draft preparation, X.H.; writing—review and editing, E.L. and S.Y.; funding acquisition, X.H., S.Y. and Z.W. All authors have read and agreed to the published version of the manuscript.

Funding

This research was funded by the National Natural Science Foundation of China (grant No. 41730531, 41991324, 41876059), Shanghai Committee of Science and Technology, China (grant No. 18ZR1440400) and China Geology Survey (DD20190208).

Conflicts of Interest

The authors declare no conflict of interest.

References

  1. Nittrouer, C.A.; Austin, J.A.; Field, M.E.; Kravitz, J.H.; Syvitski, J.P.M.; Wiberg, P.L. Writing a Rosetta Stone: Insights into Continental-Margin Sedimentary Processes and Strata. In Continental Margin Sedimentation; Jarvis, I., Nittrouer, C.A., Austin, J.A., Field, M.E., Kravitz, J.H., Syvitski, J.P.M., Wiberg, P.L., Eds.; Wiley: Malden, MA, USA, 2007; pp. 1–48. [Google Scholar]
  2. Allen, P.A. From landscapes into geological history. Nature 2008, 451, 274–276. [Google Scholar] [CrossRef] [Green Version]
  3. Romans, B.W.; Castelltort, S.; Covault, J.A.; Fildani, A.; Walsh, J.P. Environmental signal propagation in sedimentary systems across timescales. Earth-Sci. Rev. 2016, 153, 7–29. [Google Scholar] [CrossRef] [Green Version]
  4. Mason, C.C.; Fildani, A.; Gerber, T.; Blum, M.D.; Clark, J.D.; Dykstra, M. Climatic and anthropogenic influences on sediment mixing in the Mississippi source-to-sink system using detrital zircons: Late Pleistocene to recent. Earth Planet. Sci. Lett. 2017, 466, 70–79. [Google Scholar] [CrossRef]
  5. Hinderer, M. From gullies to mountain belts: A review of sediment budgets at various scales. Sediment. Geol. 2012, 280, 21–59. [Google Scholar] [CrossRef]
  6. Cawood, P.A.; Hawkesworth, C.J.; Dhuime, B. The continental record and the generation of continental crust. Geol. Soc. Am. Bull. 2013, 125, 14–32. [Google Scholar] [CrossRef] [Green Version]
  7. Cawood, P.A.; Nemchin, A.A.; Freeman, M.; Sircombe, K. Linking source and sedimentary basin: Detrital zircon record of sediment flux along a modern river system and implications for provenance studies. Earth Planet. Sci. Lett. 2003, 210, 259–268. [Google Scholar] [CrossRef]
  8. Amidon, W.H.; Burbank, D.W.; Gehrels, G.E. Construction of detrital mineral populations: Insights from mixing of U-Pb zircon ages in Himalayan Rivers. Basin Res. 2005, 17, 463–485. [Google Scholar] [CrossRef]
  9. Gehrels, G. Detrital zircon U-Pb geochronology applied to tectonics. Annu. Rev. Earth Planet. Sci. 2014, 42, 127–149. [Google Scholar] [CrossRef]
  10. Garzanti, E.; Vermeesch, P.; Rittner, M.; Simmons, M. The zircon story of the Nile: Time-structure maps of source rocks and discontinuous propagation of detrital signals. Basin Res. 2018, 30, 1098–1117. [Google Scholar] [CrossRef]
  11. Saylor, J.E.; Knowles, J.N.; Horton, B.K.; Nie, J.; Mora, A. Mixing of Source Populations Recorded in Detrital Zircon U-Pb Age Spectra of Modern River Sands. J. Geol. 2013, 121, 17–33. [Google Scholar] [CrossRef]
  12. Sickmann, Z.T.; Paull, C.K.; Graham, S.A. Detrital-Zircon Mixing and Partitioning in Fluvial to Deep Marine Systems, Central California, USA. J. Sediment. Res. 2016, 86, 1298–1307. [Google Scholar] [CrossRef]
  13. Moecher, D.P.; Samson, S.D. Differential zircon fertility of source terranes and natural bias in the detrital zircon record: Implications for sedimentary provenance analysis. Earth Planet. Sci. Lett. 2006, 247, 252–266. [Google Scholar] [CrossRef]
  14. Lawrence, R.L.; Cox, R.; Mapes, R.W.; Coleman, D.S. Hydrodynamic fractionation of zircon age populations. Geol. Soc. Am. Bull. 2011, 123, 295–305. [Google Scholar] [CrossRef]
  15. Pullen, A.; Ibanez-Mejia, M.; Gehrels, G.E.; Ibanez-Mejia, J.C.; Pecha, M. What happens when n = 1000? Creating large-n geochronological datasets with LA-ICP-MS for geologic investigations. J. Anal. Atom. Spectrom. 2014, 29, 971–980. [Google Scholar] [CrossRef]
  16. Zhang, J.; Liu, C.L. Riverine composition and estuarine geochemistry of particulate metals in China—Weathering features, anthropogenic impact and chemical fluxes. Estuar. Coast. Shelf Sci. 2002, 54, 1051–1070. [Google Scholar] [CrossRef]
  17. Dadson, S.J.; Hovius, N.; Chen, H.; Dade, W.B.; Lin, J.C.; Hsu, M.L.; Lin, C.W.; Horng, M.J.; Chen, T.C.; Milliman, J.; et al. Earthquake-triggered increase in sediment delivery from an active mountain belt. Geology 2004, 32, 733–736. [Google Scholar] [CrossRef]
  18. Yang, S.L.; Belkin, I.M.; Belkina, A.I.; Zhao, Q.Y.; Zhu, J.; Ding, P. Delta response to decline in sediment supply from the Yangtze River: Evidence of the recent four decades and expectations for the next half-century. Estuar. Coast. Shelf Sci. 2003, 57, 689–699. [Google Scholar] [CrossRef]
  19. Wang, H.J.; Saito, Y.; Zhang, Y.; Bi, N.S.; Sun, X.X.; Yang, Z.S. Recent changes of sediment flux to the western Pacific Ocean from major rivers in East and Southeast Asia. Earth-Sci. Rev. 2011, 108, 80–100. [Google Scholar] [CrossRef]
  20. He, M.Y.; Zheng, H.B.; Clift, P.D. Zircon U-Pb geochronology and Hf isotope data from the Yangtze River sands: Implications for major magmatic events and crustal evolution in Central China. Chem. Geol. 2013, 360, 186–203. [Google Scholar] [CrossRef]
  21. Xu, X.S.; O’Reilly, S.Y.; Griffin, W.L.; Wang, X.L.; Pearson, N.J.; He, Z.Y. The crust of Cathaysia: Age, assembly and reworking of two terranes. Precambrian Res. 2007, 158, 51–78. [Google Scholar] [CrossRef]
  22. Xu, Y.H.; Sun, Q.Q.; Yi, L.; Yin, X.J.; Wang, A.; Li, Y.H.; Chen, J. Detrital Zircons U-Pb Age and Hf Isotope from the Western Side of the Taiwan Strait: Implications for Sediment Provenance and Crustal Evolution of the Northeast Cathaysia Block. Terr. Atmos. Ocean. Sci. 2014, 25, 505–535. [Google Scholar] [CrossRef] [Green Version]
  23. Nie, J.S.; Stevens, T.; Rittner, M.; Stockli, D.; Garzanti, E.; Limonta, M.; Bird, A.; Ando, S.; Vermeesch, P.; Saylor, J.; et al. Loess Plateau storage of Northeastern Tibetan Plateau-derived Yellow River sediment. Nat. Commun. 2015, 6, 1–10. [Google Scholar] [CrossRef] [PubMed] [Green Version]
  24. Choi, T.; Lee, Y.I.; Orihashi, Y. Crustal growth history of the Korean Peninsula: Constraints from detrital zircon ages in modern river sediments. Geosci. Front. 2016, 7, 707–714. [Google Scholar] [CrossRef]
  25. Deng, K.; Yang, S.Y.; Li, C.; Su, N.; Bi, L.; Chang, Y.P.; Chang, S.C. Detrital zircon geochronology of river sands from Taiwan: Implications for sedimentary provenance of Taiwan and its source link with the east China mainland. Earth-Sci. Rev. 2017, 164, 31–47. [Google Scholar] [CrossRef]
  26. Xu, K.; Li, A.; Liu, J.P.; Milliman, J.D.; Yang, Z.; Liu, C.-S.; Kao, S.-J.; Wan, S.; Xu, F. Provenance, structure, and formation of the mud wedge along inner continental shelf of the East China Sea: A synthesis of the Yangtze dispersal system. Mar. Geol. 2012, 291, 176–191. [Google Scholar] [CrossRef]
  27. Xu, K.; Milliman, J.D.; Li, A.; Liu, J.P.; Kao, S.-J.; Wan, S. Yangtze- and Taiwan-derived sediments on the inner shelf of East China Sea. Cont. Shelf Res. 2009, 29, 2240–2256. [Google Scholar] [CrossRef]
  28. Li, Q.; Zhang, Q.; Li, G.; Liu, Q.; Chen, M.-T.; Xu, J.; Li, J. A new perspective for the sediment provenance evolution of the middle Okinawa Trough since the last deglaciation based on integrated methods. Earth Planet. Sci. Lett. 2019, 528, 115839. [Google Scholar] [CrossRef]
  29. Sharman, G.R.; Johnstone, S.A. Sediment unmixing using detrital geochronology. Earth Planet. Sci. Lett. 2017, 477, 183–194. [Google Scholar] [CrossRef]
  30. Li, G.X.; Li, P.; Liu, Y.; Qiao, L.L.; Ma, Y.Y.; Xu, J.S.; Yang, Z.G. Sedimentary system response to the global sea level change in the East China Seas since the last glacial maximum. Earth-Sci. Rev. 2014, 139, 390–405. [Google Scholar] [CrossRef]
  31. Hickox, R.; Belkin, I.; Cornillon, P.; Shan, Z. Climatology and seasonal variability of ocean fronts in the east China, Yellow and Bohai Seas from satellite SST data. Geophys. Res. Lett. 2000, 27, 2945–2948. [Google Scholar] [CrossRef] [Green Version]
  32. Choi, T.; Lee, Y.I.; Orihashi, Y.; Yi, H.I. The provenance of the southeastern Yellow Sea sediments constrained by detrital zircon U-Pb age. Mar. Geol. 2013, 337, 182–194. [Google Scholar] [CrossRef]
  33. Milliman, J.D.; Syvitski, J.P.M. Geomorphic Tectonic Control of Sediment Discharge to the Ocean—The Importance of Small Mountainous Rivers. J. Geol. 1992, 100, 525–544. [Google Scholar] [CrossRef]
  34. Yang, S.L.; Zhang, J.; Zhu, J.; Smith, J.P.; Dai, S.B.; Gao, A.; Li, P. Impact of dams on Yangtze River sediment supply to the sea and delta intertidal wetland response. J. Geophys. Res.-Earth Surf. 2005, 110, 1–12. [Google Scholar] [CrossRef]
  35. Dadson, S.J.; Hovius, N.; Chen, H.G.; Dade, W.B.; Hsieh, M.L.; Willett, S.D.; Hu, J.C.; Horng, M.J.; Chen, M.C.; Stark, C.P.; et al. Links between erosion, runoff variability and seismicity in the Taiwan orogen. Nature 2003, 426, 648–651. [Google Scholar] [CrossRef]
  36. Yang, S.Y.; Jung, H.S.; Lim, D.I.; Li, C.X. A review on the provenance discrimination of sediments in the Yellow Sea. Earth-Sci. Rev. 2003, 63, 93–120. [Google Scholar] [CrossRef]
  37. Liu, J.P.; Xu, K.H.; Li, A.C.; Milliman, J.D.; Velozzi, D.M.; Xiao, S.B.; Yang, Z.S. Flux and fate of Yangtze river sediment delivered to the East China Sea. Geomorphology 2007, 85, 208–224. [Google Scholar] [CrossRef]
  38. Isobe, A. Recent advances in ocean-circulation research on the Yellow Sea and East China Sea shelves. J. Oceanogr. 2008, 64, 569–584. [Google Scholar] [CrossRef]
  39. Berne, S.; Vagner, P.; Guichard, F.; Lericolais, G.; Liu, Z.X.; Trentesaux, A.; Yin, P.; Yi, H.I. Pleistocene forced regressions and tidal sand ridges in the East China Sea. Mar. Geol. 2002, 188, 293–315. [Google Scholar] [CrossRef]
  40. Zhu, Y.R.; Chang, R.F. On the relationships between the radial tidal current field and the radial sand ridges in the southern Yellow Sea: A numerical simulation. Geo-Mar. Lett. 2001, 21, 59–65. [Google Scholar] [CrossRef]
  41. Zhao, G.C.; Wilde, S.A.; Cawood, P.A.; Sun, M. Archean blocks and their boundaries in the North China Craton: Lithological, geochemical, structural and P-T path constraints and tectonic evolution. Precambrian Res. 2001, 107, 45–73. [Google Scholar] [CrossRef]
  42. Xiong, S.Q.; Yang, H.; Ding, Y.Y.; Li, Z.K.; Li, W. Distribution of igneous rocks in China revealed by aeromagnetic data. J. Asian Earth Sci. 2016, 129, 231–242. [Google Scholar] [CrossRef] [Green Version]
  43. Zhai, M.G.; Santosh, M. The early Precambrian odyssey of the North China Craton: A synoptic overview. Gondwana Res. 2011, 20, 6–25. [Google Scholar] [CrossRef]
  44. Zheng, Y.F.; Xiao, W.J.; Zhao, G.C. Introduction to tectonics of China. Gondwana Res. 2013, 23, 1189–1206. [Google Scholar] [CrossRef]
  45. Zhu, R.X.; Yang, J.H.; Wu, F.Y. Timing of destruction of the North China Craton. Lithos 2012, 149, 51–60. [Google Scholar] [CrossRef]
  46. Zhou, X.M.; Sun, T.; Shen, W.Z.; Shu, L.S.; Niu, Y.L. Petrogenesis of Mesozoic granitoids and volcanic rocks in South China: A response to tectonic evolution. Episodes 2006, 29, 26–33. [Google Scholar] [CrossRef] [Green Version]
  47. Xu, Y.-G.; Luo, Z.-Y.; Huang, X.-L.; He, B.; Xiao, L.; Xie, L.-W.; Shi, Y.-R. Zircon U-Pb and Hf isotope constraints on crustal melting associated with the Emeishan mantle plume. Geochim. Cosmochim. Acta 2008, 72, 3084–3104. [Google Scholar] [CrossRef]
  48. Chen, L.; Zheng, Y.F.; Zhao, Z.F. A common crustal component in the sources of bimodal magmatism: Geochemical evidence from Mesozoic volcanics in the Middle-Lower Yangtze Valley, South China. Geol. Soc. Am. Bull. 2018, 130, 1959–1980. [Google Scholar] [CrossRef]
  49. Wang, Y.; Fan, W.; Zhang, G.; Zhang, Y. Phanerozoic tectonics of the South China Block: Key observations and controversies. Gondwana Res. 2013, 23, 1273–1305. [Google Scholar] [CrossRef]
  50. She, Z.; Ma, C.; Mason, R.; Li, J.; Wang, G.; Lei, Y. Provenance of the Triassic Songpan-Ganzi flysch, west China. Chem. Geol. 2006, 231, 159–175. [Google Scholar] [CrossRef]
  51. Chen, Y.L.; Li, D.P.; Zhou, J.; Liu, F.; Zhang, H.F.; Nie, L.S.; Jiang, L.T.; Song, B.; Liu, X.M.; Wang, Z. U-Pb dating, geochemistry, and tectonic implications of the Songpan-Ganzi block and the Longmen Shan, China. Geochem. J. 2009, 43, 77–99. [Google Scholar] [CrossRef] [Green Version]
  52. Chen, C.H.; Lee, C.Y.; Lin, J.W.; Chu, M.F. Provenance of sediments in western Foothills and Hsuehshan Range (Taiwan): A new view based on the EMP monazite versus LA-ICPMS zircon geochronology of detrital grains. Earth-Sci. Rev. 2019, 190, 224–246. [Google Scholar] [CrossRef]
  53. Sagong, H.; Cheong, C.S.; Kwon, S.T. Paleoproterozoic orogeny in South Korea: Evidence from Sm-Nd and Pb step-leaching garnet ages of Precambrian basement rocks. Precambrian Res. 2003, 122, 275–295. [Google Scholar] [CrossRef]
  54. Kee, W.S.; Kim, S.W.; Jeong, Y.J.; Kwon, S. Characteristics of Jurassic Continental Arc Magmatism in South Korea: Tectonic Implications. J. Geol. 2010, 118, 305–323. [Google Scholar] [CrossRef]
  55. Wiedenbeck, M.; Alle, P.; Corfu, F.; Griffin, W.L.; Meier, M.; Oberli, F.; Vonquadt, A.; Roddick, J.C.; Speigel, W. Three Natural Zircon Standards for U-Th-Pb, Lu-Hf, Trace-Element and Ree Analyses. Geostand. Newsl. 1995, 19, 1–23. [Google Scholar] [CrossRef]
  56. Slama, J.; Kosler, J.; Condon, D.J.; Crowley, J.L.; Gerdes, A.; Hanchar, J.M.; Horstwood, M.S.A.; Morris, G.A.; Nasdala, L.; Norberg, N.; et al. Plesovice zircon—A new natural reference material for U-Pb and Hf isotopic microanalysis. Chem. Geol. 2008, 249, 1–35. [Google Scholar] [CrossRef]
  57. Fisher, C.M.; Longerich, H.P.; Jackson, S.E.; Hanchar, J.M. Data acquisition and calculation of U-Pb isotopic analyses using laser ablation (single collector) inductively coupled plasma mass spectrometry. J. Anal. Atom. Spectrom. 2010, 25, 1905–1920. [Google Scholar] [CrossRef]
  58. Spencer, C.J.; Kirkland, C.L.; Taylor, R.J.M. Strategies towards statistically robust interpretations of in situ U-Pb zircon geochronology. Geosci. Front. 2016, 7, 581–589. [Google Scholar] [CrossRef] [Green Version]
  59. Saylor, J.E.; Sundell, K.E. Quantifying comparison of large detrital geochronology data sets. Geosphere 2016, 12, 203–220. [Google Scholar] [CrossRef] [Green Version]
  60. Vermeesch, P. Multi-sample comparison of detrital age distributions. Chem. Geol. 2013, 341, 140–146. [Google Scholar] [CrossRef]
  61. Yang, J.; Gao, S.; Chen, C.; Tang, Y.Y.; Yuan, H.L.; Gong, H.J.; Xie, S.W.; Wang, J.Q. Episodic crustal growth of North China as revealed by U-Pb age and Hf isotopes of detrital zircons from modern rivers. Geochim. Cosmochim. Acta 2009, 73, 2660–2673. [Google Scholar] [CrossRef]
  62. Shao, L.; Meng, A.; Li, Q.; Qiao, P.; Cui, Y.; Cao, L.; Chen, S. Detrital zircon ages and elemental characteristics of the Eocene sequence in IODP Hole U1435A: Implications for rifting and environmental changes before the opening of the South China Sea. Mar. Geol. 2017, 394, 39–51. [Google Scholar] [CrossRef]
  63. Zheng, H.B.; Clift, P.D.; Wang, P.; Tada, R.J.; Jia, J.T.; He, M.Y.; Jourdan, F. Pre-Miocene birth of the Yangtze River. Proc. Natl. Acad. Sci. USA 2013, 110, 7556–7561. [Google Scholar] [CrossRef] [PubMed] [Green Version]
  64. Shang, Y.; Prins, M.A.; Beets, C.J.; Kaakinen, A.; Lahaye, Y.; Dijkstra, N.; Rits, D.S.; Wang, B.; Zheng, H.B.; van Balen, R.T. Aeolian dust supply from the Yellow River floodplain to the Pleistocene loess deposits of the Mangshan Plateau, central China: Evidence from zircon U-Pb age spectra. Quat. Sci. Rev. 2018, 182, 131–143. [Google Scholar] [CrossRef] [Green Version]
  65. Jia, J.T.; Zheng, H.B.; Huang, X.T.; Wu, F.Y.; Yang, S.Y.; Wang, K.; He, M.Y. Detrital zircon U-Pb ages of Late Cenozoic sediments from the Yangtze delta: Implication for the evolution of the Yangtze River. Chin. Sci. Bull. 2010, 55, 1520–1528. [Google Scholar] [CrossRef]
  66. Paterson, G.A.; Heslop, D. New methods for unmixing sediment grain size data. Geochem. Geophys. Geosyst. 2015, 16, 4494–4506. [Google Scholar] [CrossRef] [Green Version]
  67. Vermeesch, P. On the visualisation of detrital age distributions. Chem. Geol. 2012, 312, 190–194. [Google Scholar] [CrossRef]
  68. Zhai, M.; Peng, P. Paleoproterozoic events in the north China craton. Acta Petrol. Sin. 2007, 23, 2665–2682. [Google Scholar]
  69. Kusky, T.M.; Windley, B.F.; Zhai, M.-G. Tectonic evolution of the North China Block: From orogen to craton to orogen. Geol. Soc. Lond. Spec. Publ. 2007, 280, 1–34. [Google Scholar] [CrossRef]
  70. Wan, T. Introduction. In The Tectonics of China: Data, Maps and Evolution; Wan, T., Ed.; Springer: Berlin/Heidelberg, Germany, 2012; pp. 1–26. [Google Scholar]
  71. Zhang, R.Q.; Sun, W.D.; Li, C.Y.; Lehmann, B.; Seltmann, R. Constraints on tin mineralization events by cassiterite LA-ICP-MS U-Pb dating. Miner. Resour. Discov. 2017, 3, 1009–1012. [Google Scholar]
  72. Ibanez-Mejia, M.; Pullen, A.; Pepper, M.; Urbani, F.; Ghoshal, G.; Ibanez-Mejia, J.C. Use and abuse of detrital zircon U-Pb geochronology-A case from the Rio Orinoco delta, eastern Venezuela. Geology 2018, 46, 1019–1022. [Google Scholar] [CrossRef]
  73. Bian, C.; Jiang, W.; Greatbatch, R.J. An exploratory model study of sediment transport sources and deposits in the Bohai Sea, Yellow Sea, and East China Sea. J. Geophys. Res.-Ocean. 2013, 118, 5908–5923. [Google Scholar] [CrossRef] [Green Version]
  74. Sharman, G.R.; Covault, J.A.; Stockli, D.F.; Wroblewski, A.F.J.; Bush, M.A. Early Cenozoic drainage reorganization of the United States Western Interior-Gulf of Mexico sediment routing system. Geology 2017, 45, 187–190. [Google Scholar] [CrossRef]
  75. Qiao, S.Q.; Shi, X.F.; Wang, G.Q.; Zhou, L.; Hu, B.Q.; Hu, L.M.; Yang, G.; Liu, Y.G.; Yao, Z.Q.; Liu, S.F. Sediment accumulation and budget in the Bohai Sea, Yellow Sea and East China Sea. Mar. Geol. 2017, 390, 270–281. [Google Scholar] [CrossRef]
  76. Jia, J.J.; Gao, J.H.; Cai, T.L.; Li, Y.; Yang, Y.; Wang, Y.P.; Xia, X.M.; Li, J.; Wang, A.J.; Gao, S. Sediment accumulation and retention of the Changjiang (Yangtze River) subaqueous delta and its distal muds over the last century. Mar. Geol. 2018, 401, 2–16. [Google Scholar] [CrossRef]
  77. Johnston, S.; Gehrels, G.; Valencia, V.; Ruiz, J. Small-volume U-Pb zircon geochronology by laser ablation-multicollector-ICP-MS. Chem. Geol. 2009, 259, 218–229. [Google Scholar] [CrossRef] [Green Version]
  78. Blum, M.; Rogers, K.; Gleason, J.; Najman, Y.; Cruz, J.; Fox, L. Allogenic and Autogenic Signals in the Stratigraphic Record of the Deep-Sea Bengal Fan. Sci. Rep. 2018, 8, 7973. [Google Scholar] [CrossRef] [Green Version]
Figure 1. Map showing surface sediment types, ocean currents and sampling sites in the east China seas. The surface sediment distribution and ocean currents are from the literature [30,31], respectively. Ocean currents are denoted by solid lines with different colors (red: Kuroshio Current; light blue: Taiwan Warm Current (TWWC); black: China Coast Current (CCC); green: Yangtze Diluted Water (YDW); dark blue: Yellow Sea Warm Current (YSWC)). Circles filled by yellow are sites analyzed in this study; the ones filled by white are from the literature [32].
Minerals 10 00398 g001
Figure 2. Schematic map illustrating ancient orogenic belts, first-order tectonic units and the distribution of igneous rocks in East Asia (modified after [41,42]).
Minerals 10 00398 g002
Figure 3. Normalized kernel density estimates (KDEs) of U-Pb age distribution in sediments of seven rivers flowing into the ECSs. The age numbers (n) are shown along the KDE distributions. Abbreviations: YR (Yellow River), YZR (Yangtze River), OuJ (Ou Jiang), MJ (Min Jiang), WTW (rivers in western Taiwan) and KR (Rivers in South Korea).
Minerals 10 00398 g003
Figure 4. KDEs of detrital zircon U-Pb ages of in the ECSs. Different colors are used to represent the samples taken from different seas, with brown for the Bohai Sea (ac), green-yellow for the Yellow Sea (dg), blue for the East China Sea (hs) and green for the northern South China Sea (tw). The visually distinctive age populations are highlighted by the vertical dashed bars.
Minerals 10 00398 g004
Figure 5. Spatial distribution of the mixing coefficients illustrating the relative contributions of zircons in the ECSs from five major river sources. The relative contributions from different sources at sampling sites are shown in the pie plots.
Minerals 10 00398 g005
Figure 6. Multidimensional scaling (MDS) configuration of samples in the ECSs. There are three distinct groups in the MDS configuration, which could be linked to the potential sources. The solid (red) and dash (blue) lines denote the first and second closest neighbors, which indicate more similar age distributions and closer provenance linkages.
Minerals 10 00398 g006
Figure 7. Spatial variation in the relative abundances of different zircon age populations in the east China seas. Zircon age populations are classified according to tectonic events that happened in the geological history of East Asia [70]. The yellow dashed lines are used to mark samples taken from different seas.
Minerals 10 00398 g007
Figure 8. Spatial distribution of mixing coefficients of the Yangtze River in the East China Sea and the relationship with regional ocean currents. The color-filled area are contours of mixing coefficient of the Yangtze River while the red dashed denote the bathymetric contours. The arrows are ocean currents denoted in Figure 1.
Minerals 10 00398 g008
Table 1. Detrital U-Pb sample locations, water depths and the number of best U-Pb ages in the east China seas (ECSs).
Sample IDLatitudeLongitudeWater Depth (m)AreaBest Age NumberSources
JY26840°9′47″121°44′57″8Bohai Sea106This study
TJ8038°39′29″119°54′6″26Bohai Sea115This study
TJ8737°46′39″119°54′6″26Bohai Sea80This study
SY19833°5′40″123°44′2″46Southern Yellow Sea112This study
SY8633°5′40″123°24′17″39Southern Yellow Sea110This study
S145632°0′3″124°29′60″47Southern Yellow Sea241This study
YEN-1-1131°59′52″122°59′60″32East China Sea/Yellow Sea109This study
YE-1630°39′17″123°15′1″53East China Sea109This study
YE-2029°6′47″124°56′23″87East China Sea112This study
YE-431°30′20″121°25′50″10Yangtze Estuary194This study
YE-731°13′36″121°48′14″9Yangtze Estuary108This study
CM-9731°37′0″121°22′60″−60Yangtze Estuary112This study
S05–426°27′0″121°49′12″89East China Sea106This study
S06-425°48′12″121°3′36″82East China Sea105This study
S148128°17′20″122°26′2″70East China Sea111This study
S148526°47′29″122°10′0″90East China Sea231This study
S258223°56′27″120°2′58″33Taiwan Straight267This study
SHDB3330°28′29″127°20′41″117East China Sea227This study
SHDB3929°27′43″126°54′40″120East China Sea113This study
A1022°24′37″119°3′54″124Northern South China Sea119This study
B023°17′33″117°12′21″30Northern South China Sea117This study
C422°24′34″117°9′43″41Northern South China Sea249This study
C721°58′55″117°35′59″127Northern South China Sea118This study
G333°35′5″127°45′5″109Southeastern Yellow Sea61[32]
G733°15′7″127°39′51″128.2Southeastern Yellow Sea61[32]
G1532°45′3″127°0′1″115.3Southeastern Yellow Sea67[32]
G2032°45′3″125°20′6″115.3Southeastern Yellow Sea60[32]
G3032°34′57″126°19′51″105.4Southeastern Yellow Sea67[32]
G4032°14′59″124°39′56″45Southeastern Yellow Sea74[32]
G6231°44′55″125°5′5″45.7Southeastern Yellow Sea62[32]
Table 2. Mixing coefficients of five important river sources in the east China seas.
Sample IDR2 *YRYZRZMR *WTWKR
JY2680.6587.70.012.30.00.0
TJ800.5890.90.01.87.40.0
TJ870.4782.83.713.50.00.0
SY1980.637.258.723.60.010.5
SY860.7638.245.03.90.013.0
S14560.858.367.80.012.111.8
YEN-1-110.690.072.85.90.021.3
CM970.7011.579.00.02.07.5
YE-40.7526.260.70.013.20.0
YE-70.790.097.62.40.00.0
YE-160.7418.981.10.00.00.0
SHDB33-M0.919.266.80.10.023.9
SHDB39-M0.950.043.20.00.056.8
YE-200.750.077.00.00.023.0
S14810.850.088.911.10.00.0
S14850.7627.860.60.011.60.0
S05-40.756.665.228.10.00.0
S06-40.8827.039.721.20.012.2
S25820.790.08.00.081.610.4
B00.850.00.0100.00.00.0
A100.7125.063.66.74.70.0
C40.940.00.089.90.010.1
C70.770.00.077.214.88.0
G200.720.086.02.90.011.1
G30.810.00.04.011.584.5
G300.630.067.14.60.028.3
G400.530.089.92.60.07.5
G620.634.873.122.10.00.0
G70.960.00.04.70.095.3
G150.830.016.80.015.467.7
* R2 is the linear determination coefficient to indicate the goodness-of-fit of the mixing modeling; ZMR represents rivers of Ou Jiang, Min Jiang and Jiulong Jiang.

