Article

Ochre-Based Pigments in the Tablinum of the House of the Bicentenary (Herculaneum, Italy) between Decorative Technology and Natural Disasters

1
Department of Cultural Heritage (DBC), University of Padova, Piazza Capitaniato 7, 35139 Padova, Italy
2
Inter-Departmental Research Center for the Study of Cement Materials and Hydraulic Binders (CIRCe), University of Padova, Via Gradenigo 6, 35131 Padova, Italy
3
Getty Conservation Institute (GCI), 1200 Getty Center Drive, Suite 700, Los Angeles, CA 90049-1684, USA
4
J. Paul Getty Museum, 1200 Getty Center Drive, Los Angeles, CA 90049, USA
5
Department of Geosciences (DG), University of Padova, Via Gradenigo 6, 35131 Padova, Italy
6
Department of Environment, Construction and Design, Institute of Materials and Construction, University of Applied Sciences and Arts of Southern Switzerland (SUPSI), Campus Mendrisio, Via Francesco Catenazzi 23, 6850 Mendrisio, Switzerland
*
Author to whom correspondence should be addressed.
Submission received: 30 November 2020 / Revised: 31 December 2020 / Accepted: 7 January 2021 / Published: 11 January 2021

Abstract

:
Ochre-based pigments have been employed since the first artistic expressions of mankind, with widespread diffusion during the Roman civilization. Such prominent use influenced their technological development, focused on functional and aesthetic optimization through complex manufacturing procedures. Furthermore, their appearance is also influenced by degradation processes, sometimes driven by natural disasters such as the eruption of Mount Vesuvius in 79 AD, in which yellow ochres of Vesuvian sites were sometimes converted to red by thermal alteration. In this contribution, a multi-analytical approach was adopted based on preliminary non-invasive investigations complemented by laboratory analyses to characterize the painted surfaces of the tablinum of the House of the Bicentenary (Herculaneum) with a particular focus on the ochre-based monochrome backgrounds. The study was aimed at (a) reconstructing the original color scheme of the walls and (b) deciphering the complex decorative techniques adopted by Roman craftsmen. The analytical results allowed testing and defining analytical procedures for the discrimination between the original and converted red pigments. Furthermore, these studies indicated that specific decorative technologies were adopted according to aesthetic, functional, and economic purposes, including the utilization of various qualities of ochre with different compositional and textural properties, and the mixture of ochre pigments with other compounds.

1. Introduction

Red and yellow ochres constitute by far the most widespread and extensively used class of mineral pigments since the beginning of the artistic expression of humankind, being among the earliest pigments used from the Paleolithic era, and later in Egyptian, Persian, Greek, and Roman art, up to the Byzantine, Medieval, and modern period [1]. They are either natural or partially treated pigments composed of a mixture of ferric oxo-hydroxide minerals as chromophore agents. Hematite and goethite constitute the most common chromophore phases in red and yellow ochre, respectively. Furthermore, they are generally associated with accessory silicate minerals like clays, quartz, and feldspars, whose amount and composition are mainly related to the source of extraction and processing of raw materials [2]. They are usually found in lateritic soil horizons widely occurring in subtropical as well as temperate regions, making them the most readily available mineral pigments throughout the world. Ochres are characterized by exceptional aesthetic and technological properties, such as good pigmenting properties and relatively high chemical and physical stability, favoring their application on a wide range of organic and inorganic substrates and employing a wide variety of binding media [2].
Ochre-based pigments were widely used during the Roman civilization [3,4,5]. The almost ubiquitous presence of ochre in Roman wall painting practice is evident in archaeological remains, with countless examples in well-known sites like Pompeii, Herculaneum, and Oplontis, as well as sites across the Italian peninsula and the Mediterranean region. The widespread use of ochre pigments in evolved societies like ancient Rome deeply influenced the development of their technological application in wall paintings. Optimization of their aesthetic and functional properties led to the formulation of complex and/or physically modified pigment mixtures, as testified by the written sources of several Latin authors. Vitruvius and Pliny dedicated ample passages in their encyclopedic manuals De Architectura and Naturalis Historia to ochre-based pigments, called either Sinopis, Rubrica, or Ochra, defining both sources of raw materials and technological practices to enhance their properties [3] (pp. 283–291), [4] (pp. 117–121).
The ubiquitous utilization of ochre-based pigments is related not only to the widespread occurrence of raw materials for their production but also to the existence of a wide range of simple operational processes to concentrate the active compounds and optimize their optical and aesthetic properties. Apart from direct extraction from naturally concentrated ores, an enrichment of chromophore ochre compounds from lateritic soils can be easily obtained through simple sieving and decantation procedures [2].
Furthermore, due to the close chemical and crystallographic correlation between the chromophores in the main classes of ochre pigments, pyrotechnology has long been used to change the chromatic properties of the extracted raw materials, as in the case of producing red ochre from yellow ochre by heating [6]. Despite being characterized by different unit cells (goethite α-FeOOH crystallizes in the orthorhombic space group Pbnm, while hematite α-Fe2O3 crystallizes in the rhombohedral space group R 3 ¯ c), the phases are characterized by common anionic sub-lattices [7]. This structural characteristic allows the transformation from goethite to hematite through a topotactic process after dehydroxylation at relatively low temperatures (below 300 °C), with ongoing debates in the scientific community related to the possible formation of metastable non-stoichiometric compounds such as hydrohematite [8] and protohematite [7] during the reaction process. Since prehistoric times, this technological property favored the treatment of yellow ochre to produce the red counterpart artificially through simple manufacturing processes to obtain the desired colors. Furthermore, apart from intentional thermal treatments of the pigments, the chromatic conversion process may also be induced by natural disasters such as fires or volcanic eruptions like the one of Mount Vesuvius in 79 AD, with associated alterations to original palettes, especially in wall paintings. During the catastrophic event, temperatures around 280–300 °C were reached in the city of Pompeii due to the action of the pyroclastic flow [9], while the pyroclastic surge that struck the city of Herculaneum was characterized by even higher temperatures (around 400 °C), causing evident chromatic changes in the famous monochrome panels decorating the luxurious domus and other public and private buildings of the towns.
For these reasons, the determination of solid analytical protocols for the discrimination between natural and thermally treated red ochres constitutes an important archaeometric challenge to decipher both production processes and alteration phenomena. Several studies have been reported in the literature on monitoring mineral composition and crystallographic changes during the thermal transformation processes through X-ray powder diffraction (XRPD) [6,7], micro- and nano-structural changes in the pore networks of oxo-hydroxides through transmission electron microscopy (TEM) [10,11], or on employing other analytical techniques such as thermal and spectroscopic analyses [12] and more articulated multi-analytical approaches [13]. Furthermore, a recent study [14] proposed an alternative approach based on portable X-ray fluorescence (p-XRF) that obtained promising results on Pompeian wall paintings using arsenic as a heavy metal tracer for the discrimination of original and converted red ochres. Nevertheless, the monitoring of heavy metals and other trace compounds for such purposes needs to be carefully evaluated considering the possible influence of adulterations and additions of other compounds to ochre pigments, widely used in the Roman world, as reported in the encyclopedic works of Vitruvius and Pliny. The addition of charcoal to ochres was quite common [15], as was the addition of artificial lead-based pigments [5]. Two of these mixed pigments, Sandyx and Syricum, are documented in the encyclopedic work of Pliny, and they were used for specific painting purposes, such as an under-coating for cinnabar and red lead [3] (pp. 283–295).
The complex technological framework related to the utilization of ochre pigments in the Roman world requires rigorous scientific efforts to characterize their application in wall paintings. This study reports the results of a phased multi-analytical archaeometric study to characterize ochre-based roman monochrome frescoes in the tablinum of the House of the Bicentenary at the archaeological site of Herculaneum, starting with non-invasive investigations to provide preliminary information on the pigments used and targeting representative sites for limited sampling, followed by in-depth laboratory research to characterize the pigments and understand transformation processes. The study was aimed at understanding the original palette and color scheme of the monochrome portions of the tablinum, thus distinguishing the fields of original red monochrome background from the fields of red converted from yellow due to the heat from the 79 AD eruption of Mount Vesuvius.
The research was carried out from 2015 to 2017 in the context of a collaborative project of the Getty Conservation Institute, the Herculaneum Conservation Project, and the Archaeological Park of Herculaneum, to study and conserve the architectural surfaces in the tablinum of this house, with a central component focused on the in-depth scientific study of the wall paintings.

2. Herculaneum and the House of the Bicentenary

Herculaneum, an ancient Roman town located on the Bay of Naples at the base of Mount Vesuvius, was a thriving city containing a wealth of architectural features typical of the period, including wall paintings and mosaic pavements [16].
The eruption of Mount Vesuvius in 79 AD had a devastating effect on the surrounding region. Entire towns and cities were destroyed and covered with hot ash and volcanic material. Herculaneum was buried under nearly 20 meters of pyroclastic flow that sealed it for centuries. Destroyed as a living city, it was preserved nearly intact for two millennia, until it was rediscovered in the 18th century, first excavated by tunneling, then as an open-air site from the late 19th century to the mid-20th century [17], followed by limited excavations since then.
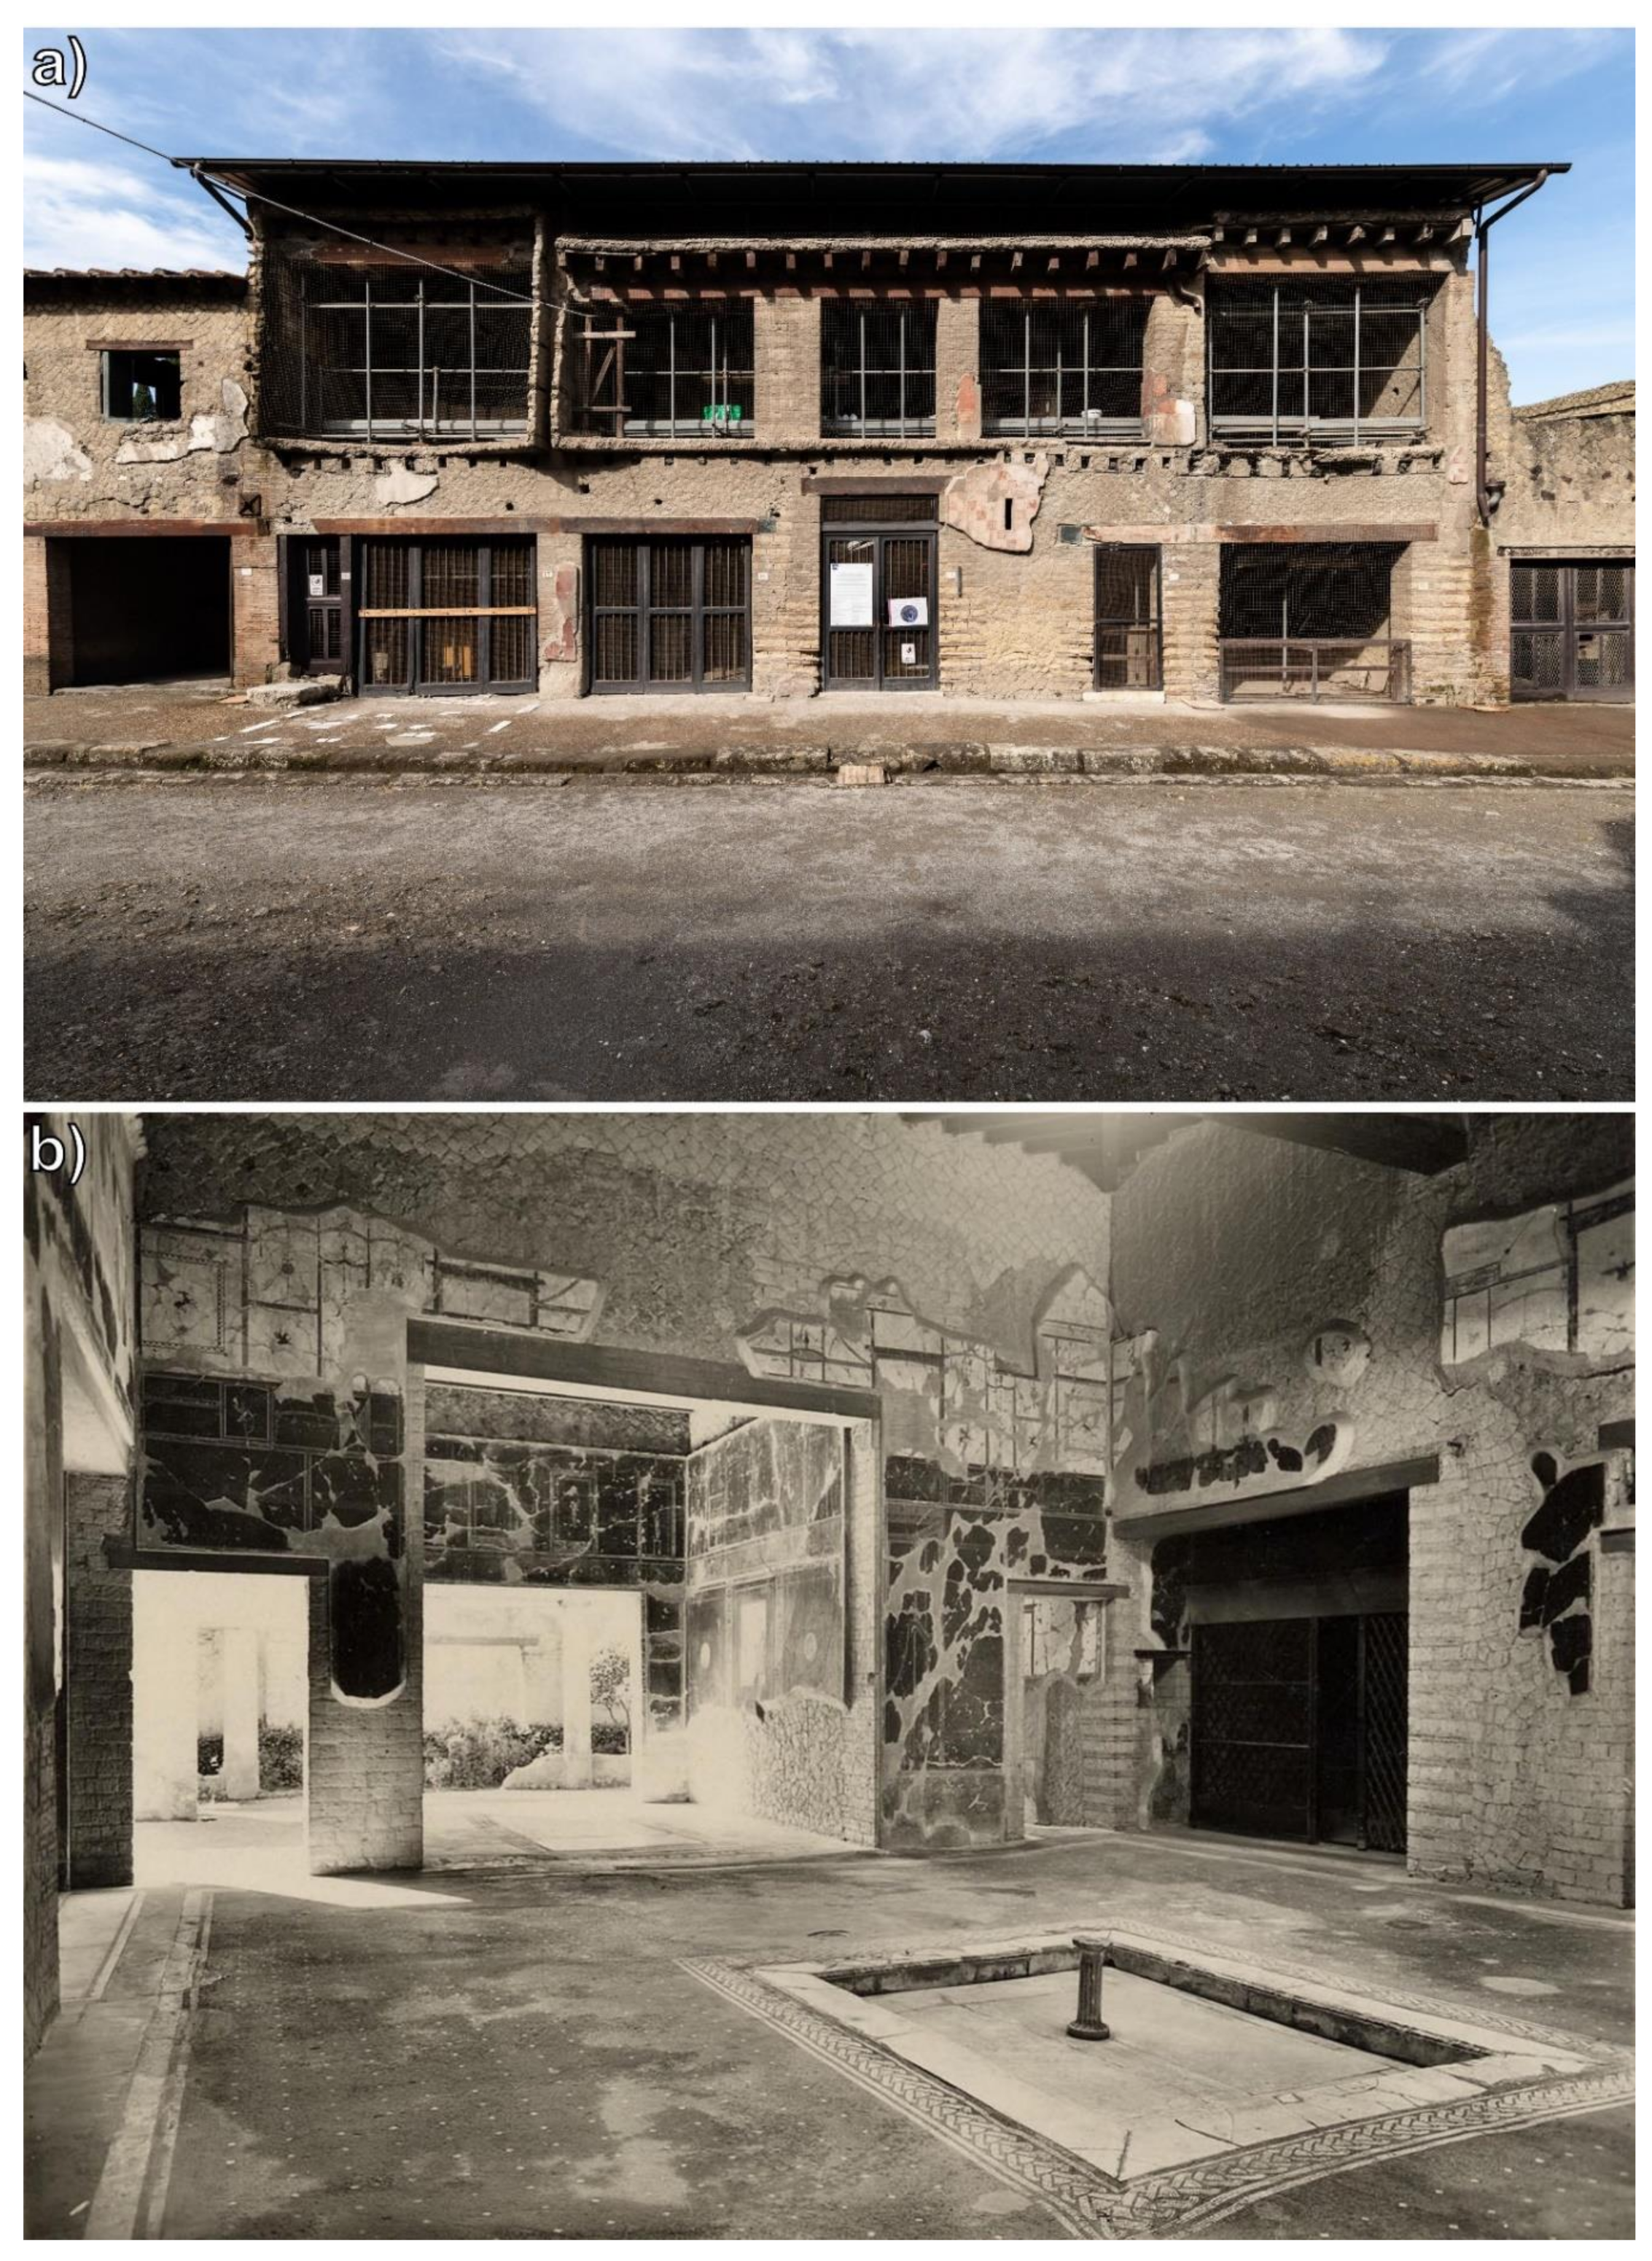
The House of the Bicentenary (Figure 1), excavated in 1938, is one of the most sumptuous and richly decorated domus located along the decumanus maximus. The tablinum or formal reception room, which is the focus of this project, is located along the central axis of the house, leading from the atrium to the peristyle garden. It has three walls oriented approximately east, south, and west. The north end is open to the atrium, and the south end has a large opening leading to the peristyle garden [18].
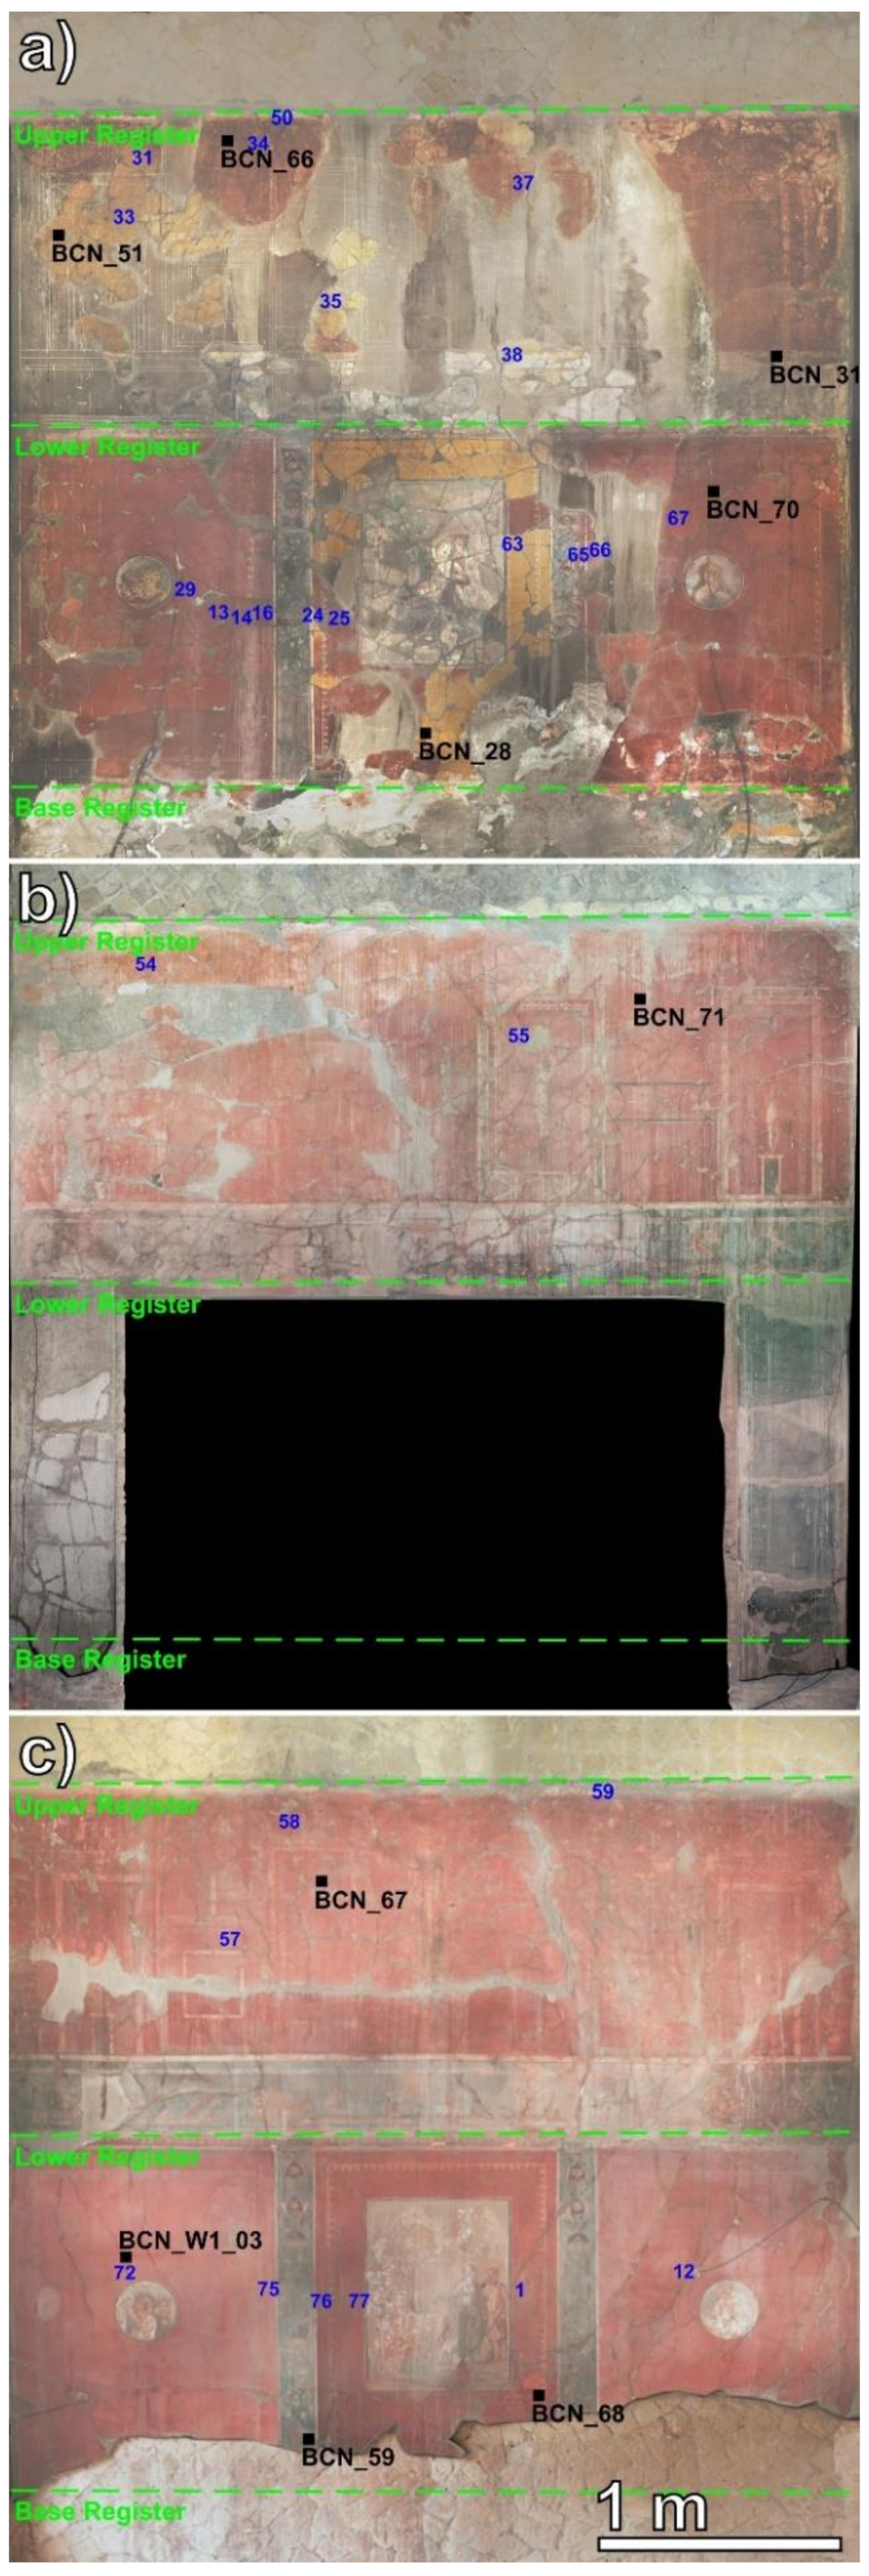
The tablinum exhibits a sophisticated decorative scheme dating to ca. 50 AD, with typical Fourth Style wall paintings and a mosaic pavement in red, yellow, and black. The painted scheme is divided into three horizontal sections (registers) that exhibit red and yellow backgrounds, separated by a frieze and vertical decorated bands with black backgrounds. A continuous upper register extends around the three walls, with a lower register further subdivided into three rectangular panels on the east and west walls and a base register along the three walls (Figure 2).
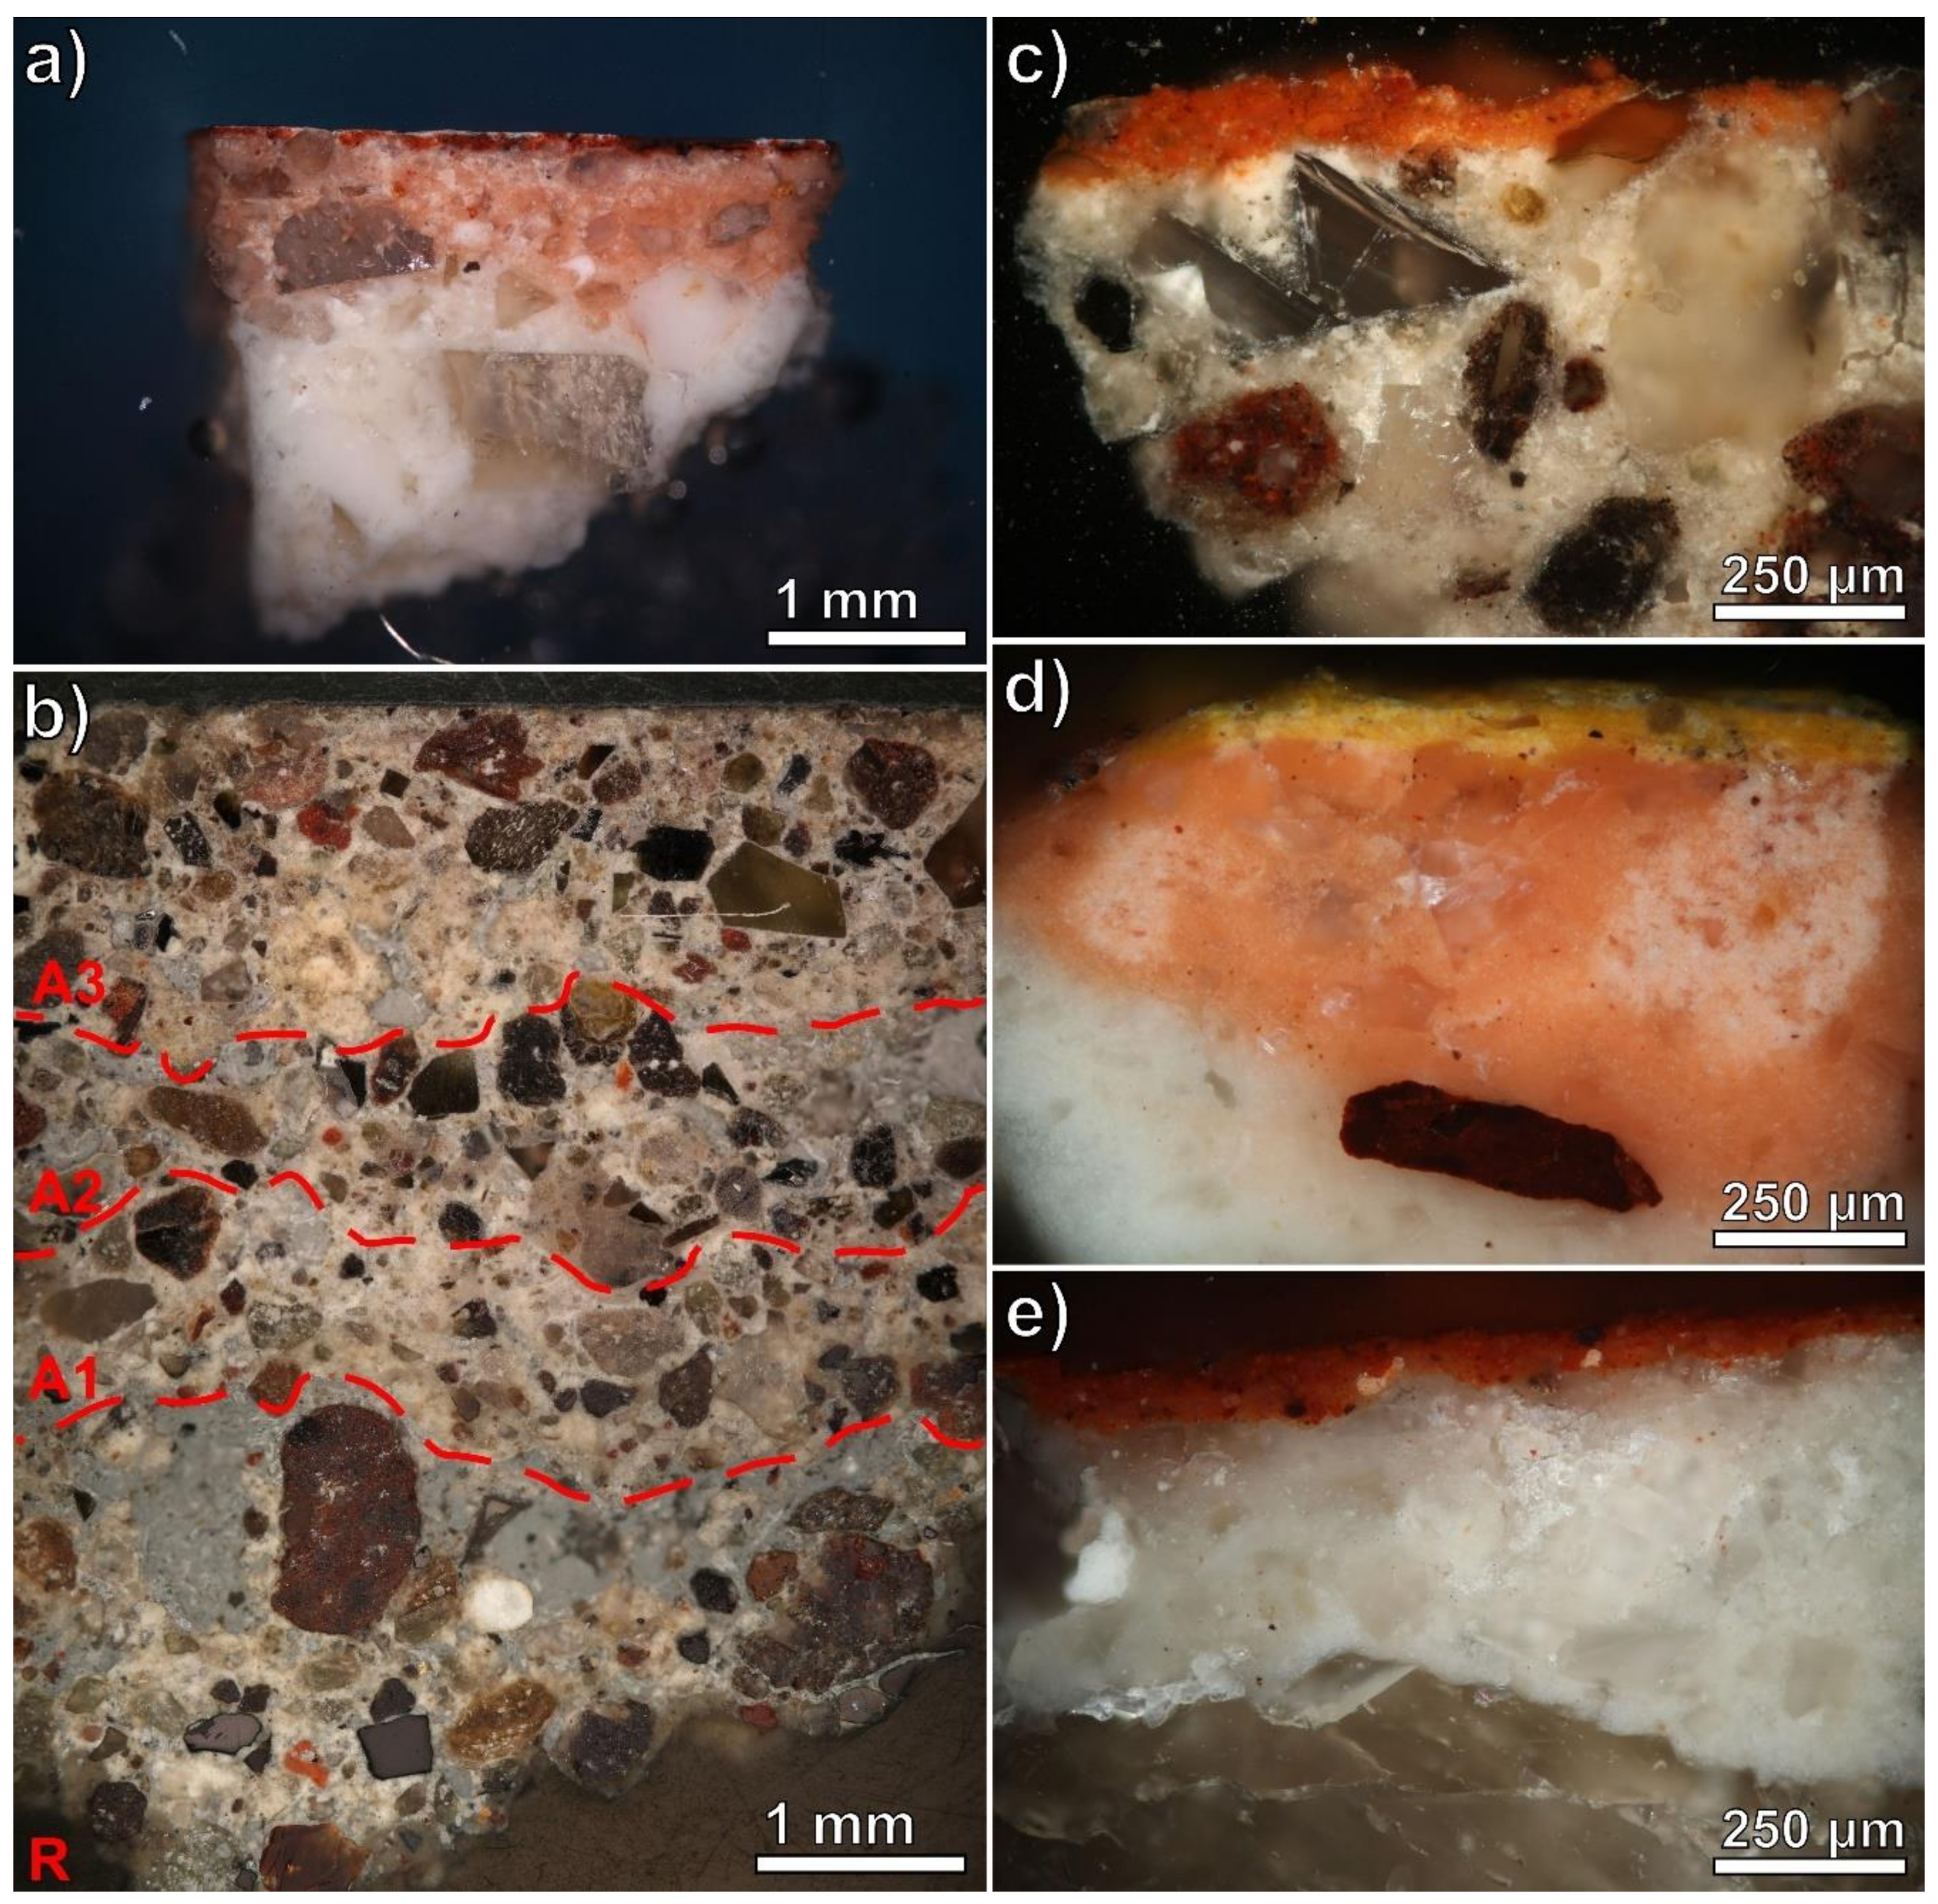
The decoration is painted over a complex plaster stratigraphy typical of Roman wall painting techniques (Figure 3), beginning with a series of progressively finer plaster layers composed of a lime-based binder with local silicate-based volcanic sand as aggregate [19], covered in the lower and upper registers by a fine finishing plaster composed of lime and marble dust. The finishing plaster on the upper register is a coarser preparation with less comminuted marble particles with respect to the lower registers. Furthermore, this final plaster layer is tinted pink superficially in the lower registers and the upper register of the south wall for an approximate thickness of 1 mm through the addition of a diluted admixture of red ochre pigment. Finally, the finishing plaster on the lower south wall contains crushed brick as aggregate [18]. The red and yellow backgrounds were painted in fresco technique, while mezzofresco or secco techniques were employed for the black backgrounds [20]. Materials analyses identified yellow ochre, red ochre, and carbon black as main background pigments. The frieze along the three walls and delicate architectural, floral, and figurative elements are painted in mezzofresco or secco technique, including high-quality figurative scenes imitating portable paintings that are centrally located in the panels of the lower registers. They are rectangular in the central panels and round in the side panels. The palette is typical of Roman paintings of the period, including pigments such as green earth, Egyptian blue, cinnabar, and lime white [18].
Due to their superb quality, the wall paintings are some of the most celebrated at the site. They have, however, suffered severe deterioration both during the eruption and since excavation. It appears that the pyroclastic surge led to at least the partial collapse and subsequent detachment of the wall paintings, especially on the east and south walls, while the west wall was less affected by this phenomenon. The detached and fallen fragments were collected during the mid-20th century excavations [17] and recomposed on backing support panels. Then, the panels were remounted in their original position on the tablinum walls [18]. The walls were subjected to significant deterioration processes even after the excavation and restoration phases, which related to severe water infiltration from the damaged roof of the tablinum and led to the formation of superficial deposits of secondary phases [18]. This phenomenon particularly affected the east and south walls.
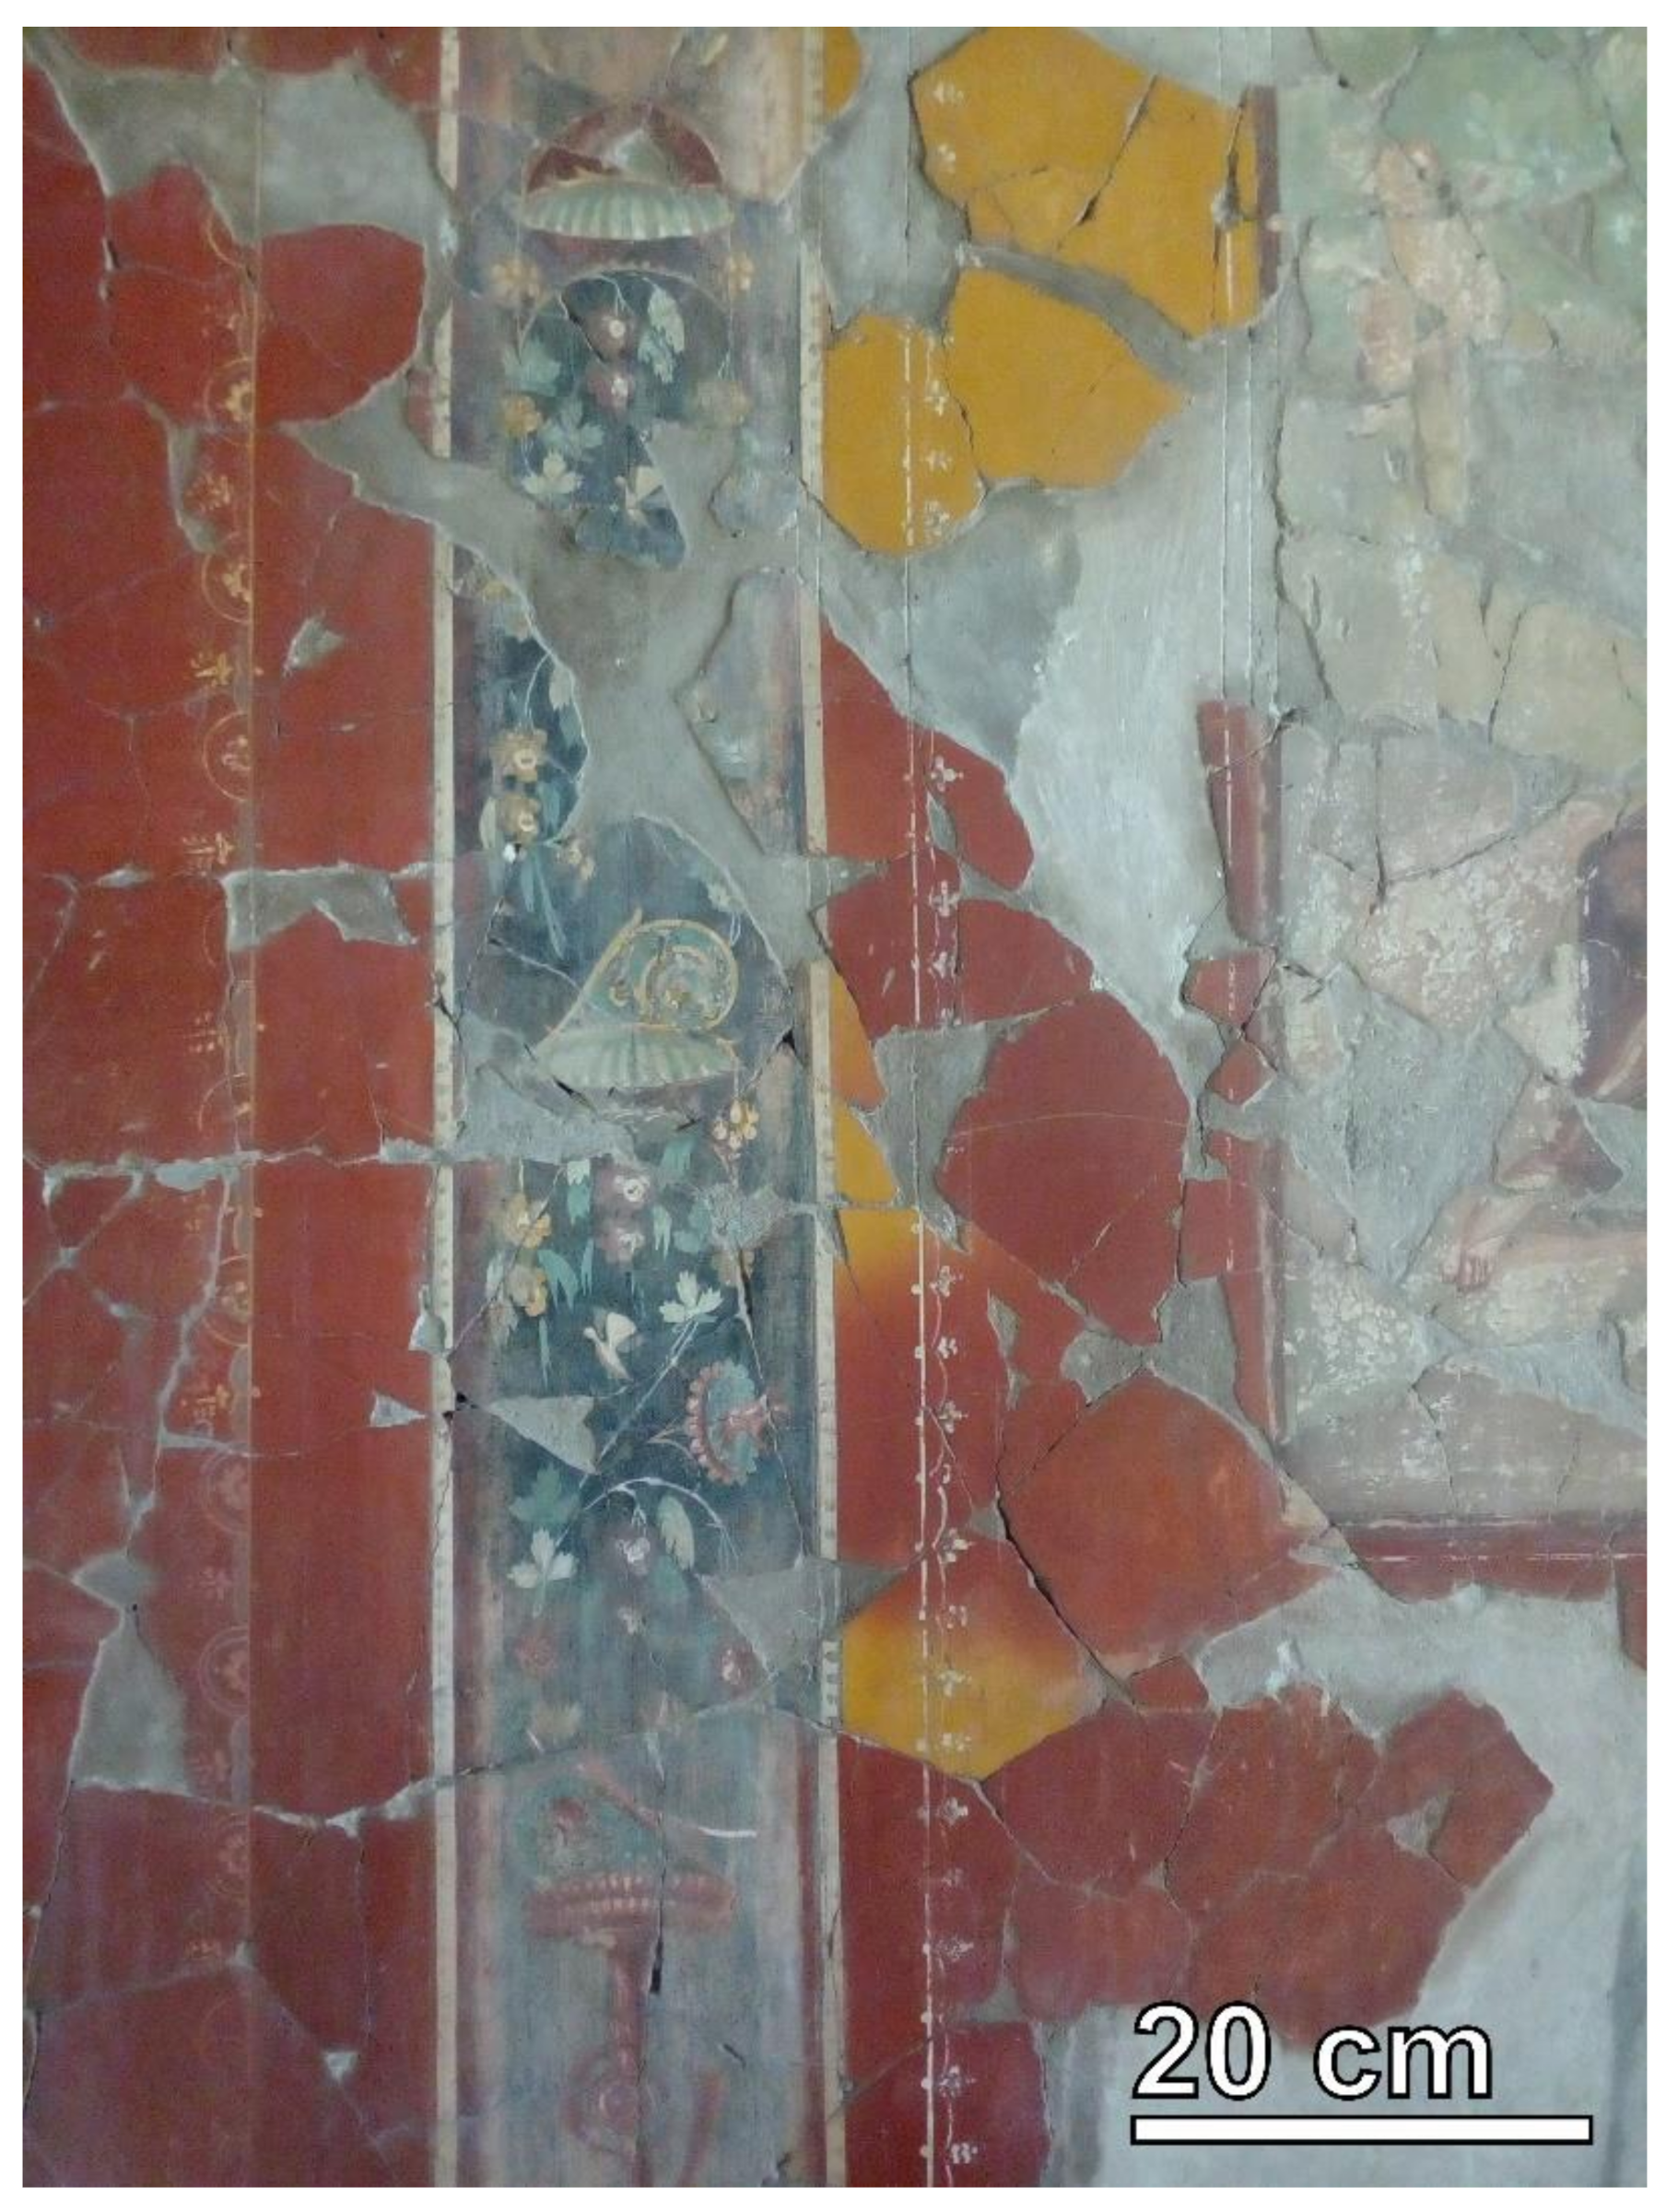
Furthermore, as a result of the eruption, the wall paintings show chromatic changes, notably in large swaths of yellow monochrome background converted to red when exposed to the heat generated by hot volcanic material deposited during the eruption, and likely by fire from burning architectural elements. This phenomenon is particularly evident in the reattached pieces that show heterogeneous chromatic variations related to a difference in exposure to high temperatures following the eruption (Figure 4).
This color shift significantly changed the appearance of the monochrome decorative scheme, which is thought to have been an alternating pattern of red and yellow fields of color in the panels of the lower registers, a yellow background on the upper register of all three walls, and red, yellow, and black bands along the base of the walls, as described by Maiuri in his description of the wall paintings [17]. Presently, the color of the monochrome backgrounds is predominantly red; however, the central panel of the east wall exhibits a yellow background around the figurative scene, and there are areas of yellow in the upper east wall as well.
A stylistic study conducted on several domus of the Vesuvian sites showed many examples of alternating yellow, red, and black schemes, with a good example in the Casa di Marco Lucrezio Frontone at Pompeii [13]. Furthermore, a number of other wall paintings at the site of Herculaneum show the same yellow to red conversion phenomenon, with notable examples in the Villa dei Papiri, in a room of the Quartiere Abitativo, and in the Casa del Rilievo di Telefo, where large areas of yellow have converted to red.

3. Materials and Methods

3.1. In Situ p-XRF Investigations and Sample Collection

To better understand the original color scheme of the room and for preliminary characterization of the pigments, non-invasive portable p-XRF mapping of the tablinum walls was carried out. Due to the high artistic significance of the wall paintings, a limited number of microsamples were authorized. For this reason, p-XRF mapping was also fundamental to define the most suitable sampling sites in terms of archaeometric significance while preserving the integrity of the decorated surfaces.
The mapping was performed on a grid of 90 points selected to include points thought to be originally red, originally yellow, and yellow transformed to red, as well as other original and restoration materials. Analyses of the monochrome backgrounds were made in three areas: the side panels of the lower register (designated group 1; n = 10; these appear to have been originally red), the central panels of the lower register (group 2; n = 6; these appear to have been yellow originally but have mostly converted to red), and the upper register (group 3; n = 10; this appears to have been yellow originally, but most of this area has also been converted to red). Additionally, two measurements of original plaster were made as control points where the paint layer was lost to ensure that the p-XRF instrument was measuring the paint layer and not the plaster (group 5; n = 2). The p-XRF point locations are reported in Figure 2.
XRF spectra were acquired with a hand-held Bruker Tracer III-V ED-XRF instrument (Bruker, Billerica, MA, USA) with a rhodium anode end-window X-ray source and a Si-PIN detector. The real acquisition time was 30 s, the voltage was 40 KeV, and the current was set at either 1.5 µA or 4.0 µA with no beam filtration. This configuration resulted in count rates of approximately 2800 cps and 4700 cps, respectively, and dead times of approximately 14% and 30%. Repeated test measurements performed in several points prior to the acquisition campaign confirmed the full reproducibility of the acquired data.
Standardless quantification was done by processing the spectra using PyMca fundamental parameters (FP) software, version 5.3.0 [21]. Background stripping was done using a channel width of one using 1000 iterations and Savitzky-Golay smoothing width of nine. An Mca Hypermet fit function was applied, with no continuum, 50 iterations, and a minimum χ2 difference of 0.001%. Fitting included accommodation for stripping, escape peaks and pile up (sum) peaks, and peak tailing (long tail area 0.1 and slope 0.05). X-ray tube output was modeled as a transmission tube using values of 20 µm for the thickness of the Be window, an α electron angle of 63°, and an α X-ray angle of 90°. K line groups were modeled for Al, Si, P, S, Cl, Ar, K, Ca, Ti, Mn, Fe, Ni, Cu, Zn, As, Sr, and Sn. L line groups were modeled for Ba, Hg, Pb, and Bi. Attenuators were modeled using values of 25 µm Kapton film, 5 mm air, 7.5 µm Be detector window, 450 µm detector thickness, and a copper matrix of infinite thickness. The incoming X-ray angle was modeled at 50° and the outgoing angle was modeled at 65°. The initial matrix description used for the calculation of X-ray attenuation in the sample was given as CaCO3. The matrix description was redefined iteratively (3X) based on successive standardless estimations of composition based on fundamental parameters. Flux was modeled at 3.6 × 10⁵ photons per second, sample-to-detector distance 2.5 cm, with an active detector area of 13 mm2. Standardless estimates of relative elemental composition for the modeled elements were generated using PyMca and are reported as “adjusted peak areas.” Results are only reported where the characteristic peaks were clearly defined. This was accomplished by excluding results where the uncertainty in the raw peak areas (calculated by PyMca at 1σ) was greater than 33% of the total peak area. Results were normalized to 100%.
In a multi-layer system with a significant portion of the sample material composed of elements that are not detectable by XRF and, with no standards available, it is not possible to generate quantitative estimates of elemental composition. However, the fundamental parameters method accounts for the relative sensitivity of the instrument to different elements as well as absorption and enhancement effects that cause non-linear responses, so the adjusted peak areas represent a useful metric for the relative (not absolute) amounts of elements present. Clearly, these values should not be considered a reliable quantitative measure of the actual mass present for each element. These values may be usefully compared with other results produced by this instrument and processed in an identical fashion, but they may not be usefully compared with results from other XRF instruments using alternative methods of spectral analysis.
Based on the information obtained, an accurate microsampling campaign was performed. Care was taken in selecting areas characterized by different monochrome background colors in the various registers of the walls of the tablinum, focusing mainly on the east and west walls, which exhibit the most variable areas of the monochrome panels. Furthermore, two samples were taken for comparison from the atrium of the house. The final sample list comprised yellow samples, supposed original red samples, and supposed original yellow samples converted to red by heat from the volcanic eruption. Micro-samples were taken both as powders obtained by scraping the superficial paint layers with surgical scalpels and removing microsamples of the paint and plaster layers. These samples were used for the preparation of cross sections made by mounting the materials in epoxy resin, sectioning them transversally, and polishing them with progressively finer diamond abrasives. The complete list of samples is reported in Table 1, with their locations, their visible and hypothetical original colors, sample type, and analytical techniques used for their characterization. The sampling points in the tablinum walls are reported in Figure 2.

3.2. Laboratory Analyses

The sampled materials were analyzed in the laboratory following a multi-analytical approach comprising mineralogical, microstructural, and microchemical analyses with a methodology already successful in similar architectural contexts of Vesuvian sites [22]. The analyses performed on each sample are reported in Table 1.

3.2.1. X-ray Powder Diffraction

Mineralogical quantitative phase analyses (QPAs) were performed by X-ray powder diffraction (XRPD) on the paint layers sampled by scraping. Due to the small amount of powder obtained from the samples, the micronization and the addition of the internal standard for the calculation of the amorphous fraction was not possible, so the materials were simply ground on an agate mortar and placed on Si zero-background sample holders for the analysis. Data were collected using a Bragg–Brentano θ-θ diffractometer (PANalytical X’Pert PRO, Malvern Panalytical, Malvern, UK; Co Kα radiation, 40 kV and 40 mA) equipped with a real-time multiple strip (RTMS) detector (X’Celerator, Malvern Panalytical, Malvern, UK). Divergence and anti-scattering slits of ¼° and ½°, respectively, were mounted in the incident beam pathway. The pathway of the diffracted beam included a Ni filter, a Soller slit (0.04 rad), and an anti-scatter blade (5 mm). Data acquisition was performed by operating a continuous scan in the range 3–85 (°2θ), with a virtual step scan of 0.02 (°2θ). Diffraction patterns were interpreted with X’Pert HighScore Plus 3.0 software (Malvern Panalytical, Malvern, UK), qualitatively reconstructing mineral profiles of the compounds by comparison with PDF databases from the International Centre for Diffraction Data (ICDD). Then, QPAs were performed using the Rietveld method [23]. Refinements were made using TOPAS software, version 4.1 (Bruker, Billerica, MA, USA). The observed Bragg peaks were modeled by a pseudo-Voigt function, whereas the background was fitted by a 12 coefficient Chebyshev polynomial. For each phase, the lattice parameters, Lorentzian crystal sizes, and scale factors were refined, and any residual preferred orientation effect was modeled with the March Dollase algorithm [24]. Furthermore, the obtained values of hematite Lorentzian crystal size were used as reference for the mean crystallite size of the phase within each sample. The starting structural models for the refinements were taken from the International Crystal Structure Database (ICSD).

3.2.2. µ-Raman Spectroscopy

Cross-section samples were spectroscopically characterized by means of micro-Raman spectroscopy (µ-Raman). The technique was applied to confirm the XRPD results from a micromineralogical point of view and to check for the possible occurrence of organic compounds not detected by diffraction. The analyses were performed using a DXR Thermo Scientific Raman microscope (Thermo Fisher Scientific, Waltham, MA, USA), equipped with a diode-pumped solid-state 532 nm laser, operating at a power of 8 mW, with a spot size of 1.1 μm and using a pinhole of 25 μm. The spectra were recorded in the range 100–3200 cm−1, with a resolution of 2 cm−1, using a 5 s exposure time and, generally, a 32-scan accumulation. Acquired spectra were processed using Ominc software and compared with the reference database published on the RRUFF website [25].

3.2.3. Scanning Electron Microscopy (SEM) and Energy-Dispersive Micro-Analysis

Subsequently, the cross-section samples were microstructurally and microchemically characterized by Scanning Electron Microscopy (SEM). A CamScan MX2500 scanning electron microscope was used (CamScan, Waterbeach, UK), equipped with a LaB6 cathode and a four-quadrant solid-state backscattered electron (BSE) detector for imaging. The analytical conditions were: accelerating voltage 20 kV; filament current 1.80 A; emission current 20 μA; aperture current 300 nA; working distance 20–30 mm. Furthermore, an EDAX energy dispersive X-ray fluorescence spectrometer (EDS) was used for chemical microanalysis (EDAX, Mahwah, NJ, USA), mounting a sapphire detector composed of a LEAP + Si(Li) crystal and a super-ultra-thin window. Qualitative interpretation of spectra and semiquantitative chemical analyses were performed using SEM Quant Phizaf software (EDAX, Mahwah, NJ, USA).
On the basis of the point SEM-EDS analyses, energy dispersive X-ray maps were collected on four selected cross-section samples (BCN_28, BCN_51, BCN_67, BCN_W1_03) to study the correlation between Fe and Pb in the paint layers. Measurements were carried out with a Zeiss Sigma HD SEM (Zeiss, Oberkochen, DE), equipped with in-lens, secondary electron (SE), and backscattered electron (BSE) detectors for imaging, with a spot size of 1 nm. Mapping was performed by recording the fluorescence emission from the samples with an INCA x-art EDX spectrometer (Oxford Instruments, Abingdon, UK), equipped with a silicon drift detector with a nominal resolution of 129 eV at 5.9 keV. Maps of 817 × 614 pixels were acquired, with 80 μs dwell time and a standard magnification value of 10,000. Data were acquired simultaneously for Al, Ca, Fe, K, Mg, Na, Pb, Si, S, and Ti. K-alpha lines were mapped for all the elements apart from Pb, whose concentration was monitored using the L-alpha line instead of the most intense M lines, due to superposition with the K-alpha lines of S. An auto-scaling function was applied so that each resulting map showed the relative variation in the amount of each element in the scanned region where the lower color intensity corresponds to the lower content of that element measured in the whole area. Then, all the acquired maps were subjected to a standard enhancement procedure through ImageJ 1.50a software [26]. The image treatment consisted of an optimization of the brightness/contrast values and in the removal of background noise artifacts applying a median filter with a radius of 4 pixels: the application of such a strong filter was necessary in order to retain only the true response signal from the rather noisy map of Pb. For this reason, the treated data cannot be considered as maps of absolute distribution for the concentration of the elements of interest, but rather as relative indicators of areas of the samples where the presence of the elements is confirmed. Finally, the correlation between the elements of interest was graphically represented through the superposition of individual maps on composite RGB images.

3.2.4. Electron Microprobe Analysis

The well-known limit for p-XRF and SEM-EDS standardless semiquantitative analyses is related to the insensitivity to light elements, such as carbon in inorganic and organic compounds and hydrogen in water (both structural and adsorbed) and hydroxyl groups. Thus, quantitative electron microprobe analyses on a wavelength-dispersive X-ray spectroscopy system (EMP-WDS) were performed on the four cross-section samples analyzed through EDS mapping. Point analyses were performed on the binder matrices of paint layers. Furthermore, additional measurements were performed on the binder matrices related to the uppermost portions of the finishing plasters, within 100 µm from the paint layers, and on selected lumps of pigment, when characterized by dimensions allowing reliable compositional determinations in relation to the spot size of the incident beam. The instrument used was a Cameca SX50 (Cameca, Gennevilliers, FR), equipped with four wavelength-dispersive spectrometers. Typical measurement conditions were 20 kV acceleration potential, 20 nA beam current, 10 s acquisition time on peak and 5 s on background positions. The following standards were used for calibration of specific chemical elements: periclase (Mg), ilmenite (Mn, Ti), diopside (Ca, Si), corundum (Al), hematite (Fe), orthoclase (K), and albite (Na). The Cameca-PAP program [27] was used to convert X-ray counts into oxide weight percentages. Analyses are accurate to within 2% relative for major and 5% relative for minor elements.

4. Results

4.1. p-XRF

The adjusted peak area results for the measured elements are presented in Table S1. Following the convention used by Marcaida et al. [14], sample sites have been labeled as original red (OR), original yellow (OY), and transformed yellow, now red (TY). Iron and calcium were the dominant elements detected, with iron likely related to the chromophore compounds of the ochre-based pigment dispersed in the paint layer, and calcium mainly deriving from the lime-based binder and marble aggregate of the underlying plaster, apart from the sample sites showing high levels of S, where part of calcium should be attributed to the occurrence of secondary gypsum, widely observed in the tablinum walls as superficial alteration product [18]. As for the other detected elements, they are likely related to the silicate-based accessory phases of the ochre pigments, even if the detection of significant amounts of some transition metal and metalloid elements such as lead and arsenic could imply the occurrence of other pigmenting compounds. Finally, part of the silicon and all the bismuth detected are attributable to prior conservation treatments of the wall surfaces with ethyl silicate as a consolidant, in which bismuth appears to be present as a catalyst [28].
To evaluate the possible presence of characteristic minor or trace element within the ochre pigment, peak areas for elements other than calcium, silicon, and bismuth were expressed as ratios to the iron peak area for each sample site. This approach has also been taken by Popelka-Filcoff et al. [29], MacDonald et al. [30], and Marcaida et al. [14]. Most elements did not show any consistent difference between the three areas studied, except for lead and arsenic, which proved to be highly discriminatory (Figure 5).
Group 1 sites (the originally red side panels) consistently showed the occurrence of significant amounts of lead, with a mean Pb:Fe ratio of 0.10, while arsenic levels were lower but still notable (mean As:Fe ratio of 0.05). Group 2 sites (the originally yellow central panels) differed significantly, with very low levels of both elements, with mean Pb:Fe and As:Fe ratios of 0.02 and 0.00, respectively. Finally, group 3 sites (the originally yellow upper register, Figure 5) showed the highest concentrations of lead, while arsenic was present only in trace amounts (mean Pb:Fe and As:Fe ratios of 0.13 and 0.01, respectively). Yellow ochre sites that had transformed to red (TY) showed no difference in lead and arsenic content in comparison to sites within the same panels that had not been transformed (OR).

4.2. XRPD-QPA

All the analyzed samples (Figure 6, Table 2) are characterized by the occurrence of calcium carbonates (calcite and aragonite), related both to the carbonation of the lime-based binder and to the carbonate aggregate added to the plaster. The phases are present in highly variable amounts, from 17.9 wt% of BCN_81 to 58.0 wt% of BCN_67, influenced by the adoption of variable pigment to plaster ratios, by the heterogeneity of sampling, and by the number of alteration phases, which always constitute a significant fraction of the materials.
Alteration is mineralogically shown by the occurrence of variable amounts (from 0 up to 14.1 wt%) of silicate phases of volcanic origin (feldspars, augite, and analcime) and dolomite. Such minerals are commonly found in the sediments of the Vesuvian area [19], and their presence within the paint layers is to be related to the superficial deposition of mineral dust from the surrounding environment. Furthermore, gypsum and calcium oxalate (weddellite) are present in all the samples, in amounts ranging from 14.2 wt% of BCN_31 up to 62.6 wt% of BCN_81. These minerals are common constituents of superficial secondary concretions in masonry, generated by the evaporation of percolating fluids [31]. Their occurrence has been clearly observed in the walls of the House of the Bicentenary, which is mainly related to the severe water infiltrations affecting the building [18]. Calcium oxalates could also be related to superficial consolidation treatments with ammonium oxalate-based compounds [32] even though their detection in samples from the atrium of the domus, where restoration interventions were not reported, makes it unlikely.
Apart from the calcium carbonates and alteration phases, the materials are characterized by markedly similar mineralogical profiles of pigment-related crystal phases. The chromophore phases are goethite for the analyzed yellow sample and hematite for the red samples. Furthermore, most of the analyzed materials are characterized by the presence of reduced bernalite fractions, an iron tri-hydroxide already reported as a weathering product of ochre-based pigments [33,34]. Apart from the chromophore phases, all samples show the presence of significant fractions of accessory silicate phases commonly found in earth-based pigments, namely quartz, muscovite, kaolinite, and clinochlore [2]. The ratios between chromophore and accessory phases (C:A, Table 2) show significant variations, from 0.6 of BCN_80 to 2.6 of BCN_68, with mean values of 1.6.
Apart from the accessory silicates commonly found in ochre-based pigments, all analyzed materials are characterized by the occurrence of talc, sometimes in significant amounts (sample BCN_71), and disordered hydrous silica of the opal-CT type, recognizable by the broad reflection with the maximum at about 4.10 Å [35]. Finally, all the analyzed samples, either original red, original yellow, or transformed yellow, are characterized by a total absence of diffraction peaks related to lead-bearing crystal phases.
As for the red samples, clear differentiation in hematite Lorentzian crystal sizes can be observed between the materials that were supposedly originally red and those presumably converted to red due to high temperatures reached in the eruption event. Specifically, the crystallinity of samples BCN_70 and BCN_81 (originally red backgrounds) is equal to 62.1 nm and 75.2 nm, respectively, while that of the remaining red samples from transformed yellow backgrounds is significantly lower, falling between 17.1 nm and 26.8 nm.

4.3. µ-Raman

The µ-Raman analyses on the paint layers confirmed the main mineralogical features determined through XRPD, giving further insight into the presence of compounds not determined by diffraction.
The Raman spectra of the pink-tinted plasters (Figure 7a) are characterized by the presence of strong calcite Raman peaks related to the carbonated binder, associated with weak peaks related to the crystallization of secondary gypsum. Furthermore, weak Raman peaks between 100 cm−1 and 650 cm−1 are to be related to the presence of hematite, indicating the addition of low fractions of red ochre pigment to obtain the pink tint of this plaster layer. Analyses on a macroscopic lump of red ochre pigment found in the pink-tinted plaster of sample BCN_28 (Figure 3) confirmed that it is mainly constituted of hematite (Figure 7b). A broad peak centered at 1332 cm−1 is also present, identifiable as the D band related to the vibrational modes of the sp3 C–C covalent bonds [36]: this evidence points out the occurrence of an accessory fraction of organic material in the sediment from which the red ochre was extracted.
The Raman spectra of the yellow paint layers (Figure 7c) are characterized by the typical sharp peaks of calcite related to the carbonated binder, associated with a series of broader peaks between 100 cm−1 and 700 cm−1 attributable to the mineral goethite. Furthermore, two strong broad peaks centered at 1332 cm−1 and 1582 cm−1 are present, identifiable as the D band related to the vibrational modes of the sp3 C–C covalent bonds and the G band related to the vibrational modes of the sp2 C–C covalent bonds, respectively, whose simultaneous occurrence is typical for charcoal [36]. This indicates the utilization of a mixture of yellow ochre and carbon black pigments in these paint layers. The stronger signal of the pigment components with respect to that observed in the pink-tinted plaster indicates the utilization of greater amounts of pigment to obtain a greater intensity of pigmentation in the decorated surface. Raman analyses on yellow ochre lumps dispersed in the binder matrices of the yellow paint layers (Figure 7d) confirmed that the pigment is mainly constituted of goethite, associated with reduced fractions of amorphous carbon.
The Raman spectra of the red paint layers (Figure 7e), both original and transformed, are also characterized by the presence of sharp calcite peaks of the carbonated binder, associated with a series of well-defined broad Raman peaks between 100 cm−1 and 650 cm−1 related to the occurrence of hematite from the ochre pigment. Distinctive peaks of goethite are always totally absent. Furthermore, strong broad bands centered at 1332 cm−1 and 1582 cm−1 are present, typical for charcoal and indicating the addition of carbon black to the pigment mixture. The lumps of pigment are characterized by spectra comparable to those of the pink-tinted plasters (Figure 7f).
For all the analyzed paint layers, no trace of peaks related to crystalline red or yellow lead oxide-based pigments was found.

4.4. SEM-EDS

BSE imaging on the pink-tinted plasters (Figure 8a) showed the occurrence of dense intergrown clusters of homogeneous cryptocrystalline phases, mainly calcic in composition and identifiable as anthropogenic carbonates developed by the aerial reaction of the lime binder while porosity is extremely low. Despite being microstructurally similar to the white finishing plaster underneath, this binder matrix is chemically differentiated by the systematic occurrence of minor amounts of iron in the EDS analyses, indicating the fine dispersion of nanometric red ochre particles, which is related to the addition of pigment fractions to the plaster mixture before applying it to the wall to confer the pink color. Furthermore, sporadic micrometric rounded grains characterized by high BSE signal were found randomly dispersed in the plaster matrices. EDS analyses showed a mainly ferric composition, associated with silicon, aluminum, calcium, magnesium, and alkalis. The chemical composition of the particles identified them as chromophore-rich micrometric lumps of red ochre pigment, constituted of dominant iron oxides and associated clay minerals and paracrystalline silicate phases. The macroscopic pigment lump found within the pink-tinted plaster of sample BCN_28 (Figure 3d) presents the same textural and chemical characteristics of the micrometric particles, suggesting that a poorly ground lump of ochre was unintentionally added to the plaster.
Clear microstructural differentiations of the binder matrices can be observed in the external yellow paint layer of the east wall central panel (Figure 8b). It presents a fairly uniform thickness of 80 µm, higher porosity than the plaster underneath, and the typical network of the pure carbonated matrix is progressively replaced by a dense microstructure of unresolved particles with overall lower BSE signal, cementing abundant micrometric particles characterized by a high BSE signal similar to those observed in the pink-tinted plaster layers. Mean BSE analyses of the matrices (Figure 9a) indicated a mainly calcic composition related to the lime binder, with significant fractions of silicon, iron, aluminum, magnesium, and alkalis, which points to the abundant occurrence of dispersed nanometric ochre-based particles rich in chromophore iron oxo-hydroxides and accessory silicate phases. The chemical composition of the micrometric particles (Figure 9b) is similar to those found in the pink-tinted plaster layers, identifying them as chromophore-rich lumps of ochre pigment.
The red paint layers of the side panels (Figure 8c,d) are microstructurally similar to the yellow paint layer of the east wall central panel. Nevertheless, their binder matrices present a chemically related higher BSE signal due to the systematic occurrence of minor amounts of lead, clearly detected by EDS analyses through the identification of Pb L-alpha and M lines, the latter causing a relevant asymmetry in S K-alpha lines (Figure 9c). This element is detectable in similar amounts also in the chromophore-rich lumps of red ochre pigment (Figure 9d), which are less abundant and of slightly larger size with respect to those of the yellow paint layer of the east wall central panel.
The paint layers of the upper register are differentiated from those of the lower registers by a marked microstructural heterogeneity. They are thicker (up to 200 µm) and more irregular than their counterparts in the lower registers. Furthermore, the matrices are generally constituted of highly calcic skeletal clusters of anthropogenic carbonates, poor in dispersed nanometric pigment phases and often fractured and dislocated, indicating a poor control of binder setting time. Such clusters form pockets filled with nanometric and micrometric pigment particles that are poorly cemented by the carbonated binder (Figure 8e,f), as indicated by EDS analyses, showing an overall prevalence of ochre-related elements over calcium, often with significant amounts of aluminum (Figure 9e). As seen also in the p-XRF data, a systematic occurrence of lead is observable in EDS analysis. Sample BCN_67 constitutes an exception, which presents a more homogeneous (Figure 8g,h), highly calcic matrix with lower observed amounts of ochre-related elements with respect to the other samples of the upper register and counterbalanced by the highest lead concentrations (Figure 9g). A dimensional increase of the chromophore-rich pigment lumps is clearly detectable in all the upper register samples with respect to their counterparts in the lower registers: they reach dimensions of tens of micrometers, in some cases showing heterogeneous composition with iron-rich portions (Figure 9f,h) and silicate-rich associated particles. Furthermore, a systematic occurrence of lead is observable in EDS analysis in amounts comparable to those of the matrices. For all the samples analyzed, porosity is high and often coalesced in elongated horizontal microcracks.
High-resolution EDS maps of the four representative samples (Figure 10) made it possible to better interpret the correlation between iron and lead in the paint layers of the different registers. Sample BCN_28 from the yellow central panel of the east wall presents local iron accumulations related to the ochre pigment, while areas of the matrix with clearly detectable amounts of lead are absent. On the other hand, all the other samples analyzed (BCN_W1_03 from the originally red side panel, BCN_51 from the originally yellow upper register, and BCN_67 from the transformed yellow upper register) are characterized by a uniform distribution of lead spots. These lead spots are uncorrelated with iron, indicating a ubiquitous distribution of the heavy metal regardless of the occurrence of local accumulation of chromophore iron-bearing phases from the ochre pigment. A greater occurrence of lead spots is observable in the samples of the upper registers, indicating a greater abundance of the element with respect to the side panels of the lower registers.

4.5. EMP-WDS

The results of the quantitative point analyses obtained through EMP-WDS on the four reference samples are reported in Table S2, while mean values and standard deviations of the measurements obtained from each target component (plasters, paint layers, and pigment lumps) are reported in Table S3. Compositional histograms are reported in Figure 11.
The samples show comparable compositional profiles of the finishing plasters. Calcium oxide is the dominant chemical compound that is related to the anthropogenic calcite of the binder and associated with comparable amounts of undetected compounds, which attributes mainly to the carbonate fraction of the binding phase. The two components consistently constitute more than 90 wt% of the overall chemical composition. The residual fraction is mainly constituted of silica, alumina, magnesium, and alkali metal oxides, likely related to impurities in the limestone used for the production of the lime binder [37]. Furthermore, a partial silica uptake could be related to superficial consolidation treatments with ethyl silicate-based compounds, while the systematic detection of limited sulfate fractions is to be ascribed to the presence of secondary gypsum. The detected iron oxide amounts delineated clear differentiations between the lower register samples, where the occurrence of reduced Fe2O3 fractions (mean values of 0.2800 wt% and 0.1856 wt% for BCN_28 and BCN_W1_03, respectively) are related to the addition of red ochre for the tinted plaster preparation, while the compound is almost absent in the samples of the upper register. Lead oxide fractions are also characterized by clear differentiation among the samples analyzed: they are null in BCN_28 from the central panel of the east wall, while BCN_W1_03 from the side panel of the west wall shows a mean PbO value of 0.1392 ox wt% comparable with Fe2O3 concentrations. The samples from the upper registers show further increases in PbO concentrations (mean values of 0.5316 wt% and 0.4634 wt% for BCN_51 and BCN_67, respectively), always higher than the detected Fe2O3 fractions in the analyzed spots (Figure 12a).
Significant chemical variations in the composition of the binding matrices are observable in the paint layers, which is mainly related to the addition of the pigmenting compounds. Firstly, a systematic decrease in CaO concentration is observable due to the lower relative proportions of the carbonated binder. This reduction is particularly evident in BCN_51 (mean CaO concentration of 6.5131 wt%), while it is more limited in BCN_W1_03. Nevertheless, CaO decrease is not matched by a proportional reduction of undetected compounds. This is to be ascribed either to the mineralogical assemblage of the ochres, rich in hydroxyl groups and water molecules and to the organic carbon of carbon black added to the pigmenting mixture. On the other hand, the decrease in CaO is counterbalanced by a significant increase in ochre pigment-related oxides, which is ascribable to the chromophore (Fe2O3) and accessory phases (silica, alumina, MgO, TiO2, MnO, and alkali metal oxides).
Samples BCN_28, BCN_W1_03, and BCN_67 are characterized by similar iron oxide concentrations comprised between 5 wt% and 7 wt%, while the amount of chromophore oxide is significantly higher in BCN_51 (13.1728 wt%). Furthermore, significant variations in the chemical profiles of accessory phases-related oxides are observable in the analyzed samples. A higher occurrence of accessory oxides is observable in the two OY samples, with mean cumulative amounts of 25.5761 wt% and 50.4834 wt% for BCN_28 and BCN_51, respectively. BCN_67 is still characterized by significant cumulative values (17.8797 wt%), while they are significantly lower for BCN_W1_03 (6.6034 wt%). Such inhomogeneities are correlated with the detected alumina amounts: they are high in the two OY samples, reaching values up to 30 wt% in BCN_51 and lower than 2 wt% in BCN_W1_03 and BCN_67. Furthermore, alumina concentration shows a good positive correlation with the mean cumulative amounts of MgO, TiO2, MnO, and alkali metal oxides, while it seems only partially correlated with silica, which is present in comparable amounts between 10 wt% and 15 wt% in the OY and TY samples, whereas it is more than three times lower in BCN_W1_03. This experimental evidence is likely related either to inhomogeneous superficial consolidation treatments with ethyl silicate-based compounds and/or different balances between phyllosilicates and basic silica compounds (quartz and opal CT) in the mineral assemblage of the paint layers, with higher amounts of sheet silicates in the samples richer in alumina, MgO, TiO2, MnO, and alkali metal oxides. Nevertheless, the high alumina concentrations detected in the two OY samples, especially in BCN_51, are not justifiable considering only the occurrence of aluminosilicate minerals, likely indicating the occurrence of amorphous aluminum oxo-hydroxides in the mineralogical assemblage of the applied pigments.
Marked heterogeneities in the four samples analyzed are also evident when analyzing PbO concentration trends and their correlation with Fe2O3 in the paint layer matrices. BCN_28 is characterized by the absence of significant lead oxide fractions, while it is present in similar and homogeneous amounts in the analyzed spots of BCN_W1_03 and BCN_51 (mean concentrations of 0.3637 wt% and 0.4081 wt%, respectively), regardless of iron oxide concentrations (Figure 12). Sample BCN_67 shows a difference in the presence of significantly higher PbO concentrations (mean value of 2.4037 wt%), more variable in the analyzed spots but still uncorrelated with Fe2O3 (Figure 12).
Finally, all the samples are characterized by the presence of variable SO3 fractions, particularly significant in BCN_W1_03, which is related to the presence of secondary sulfate phases.
The chemical profiles of the analyzed pigment lumps are always dominated by Fe2O3 and undetected compounds, confirming both an enrichment in chromophore phases and the presence of organic carbon fractions in the particles. The associated chemical species are consistent with those detected in the paint layers, both in terms of detected oxides and relative ratios between them. This is valid also for PbO concentrations and their correlations with Fe2O3: lead oxide is present in reduced and homogeneous amounts in the pigment lump within the pink-tinted plaster of BCN_28 (mean value of 0.2572 wt%), while higher amounts were detected in the lumps of BCN_51 and BCN_67 (mean concentrations of 0.9724 wt% and 2.9415 wt%, respectively). Again, no direct correlations with Fe2O3 are observable (Figure 12).

5. Discussion

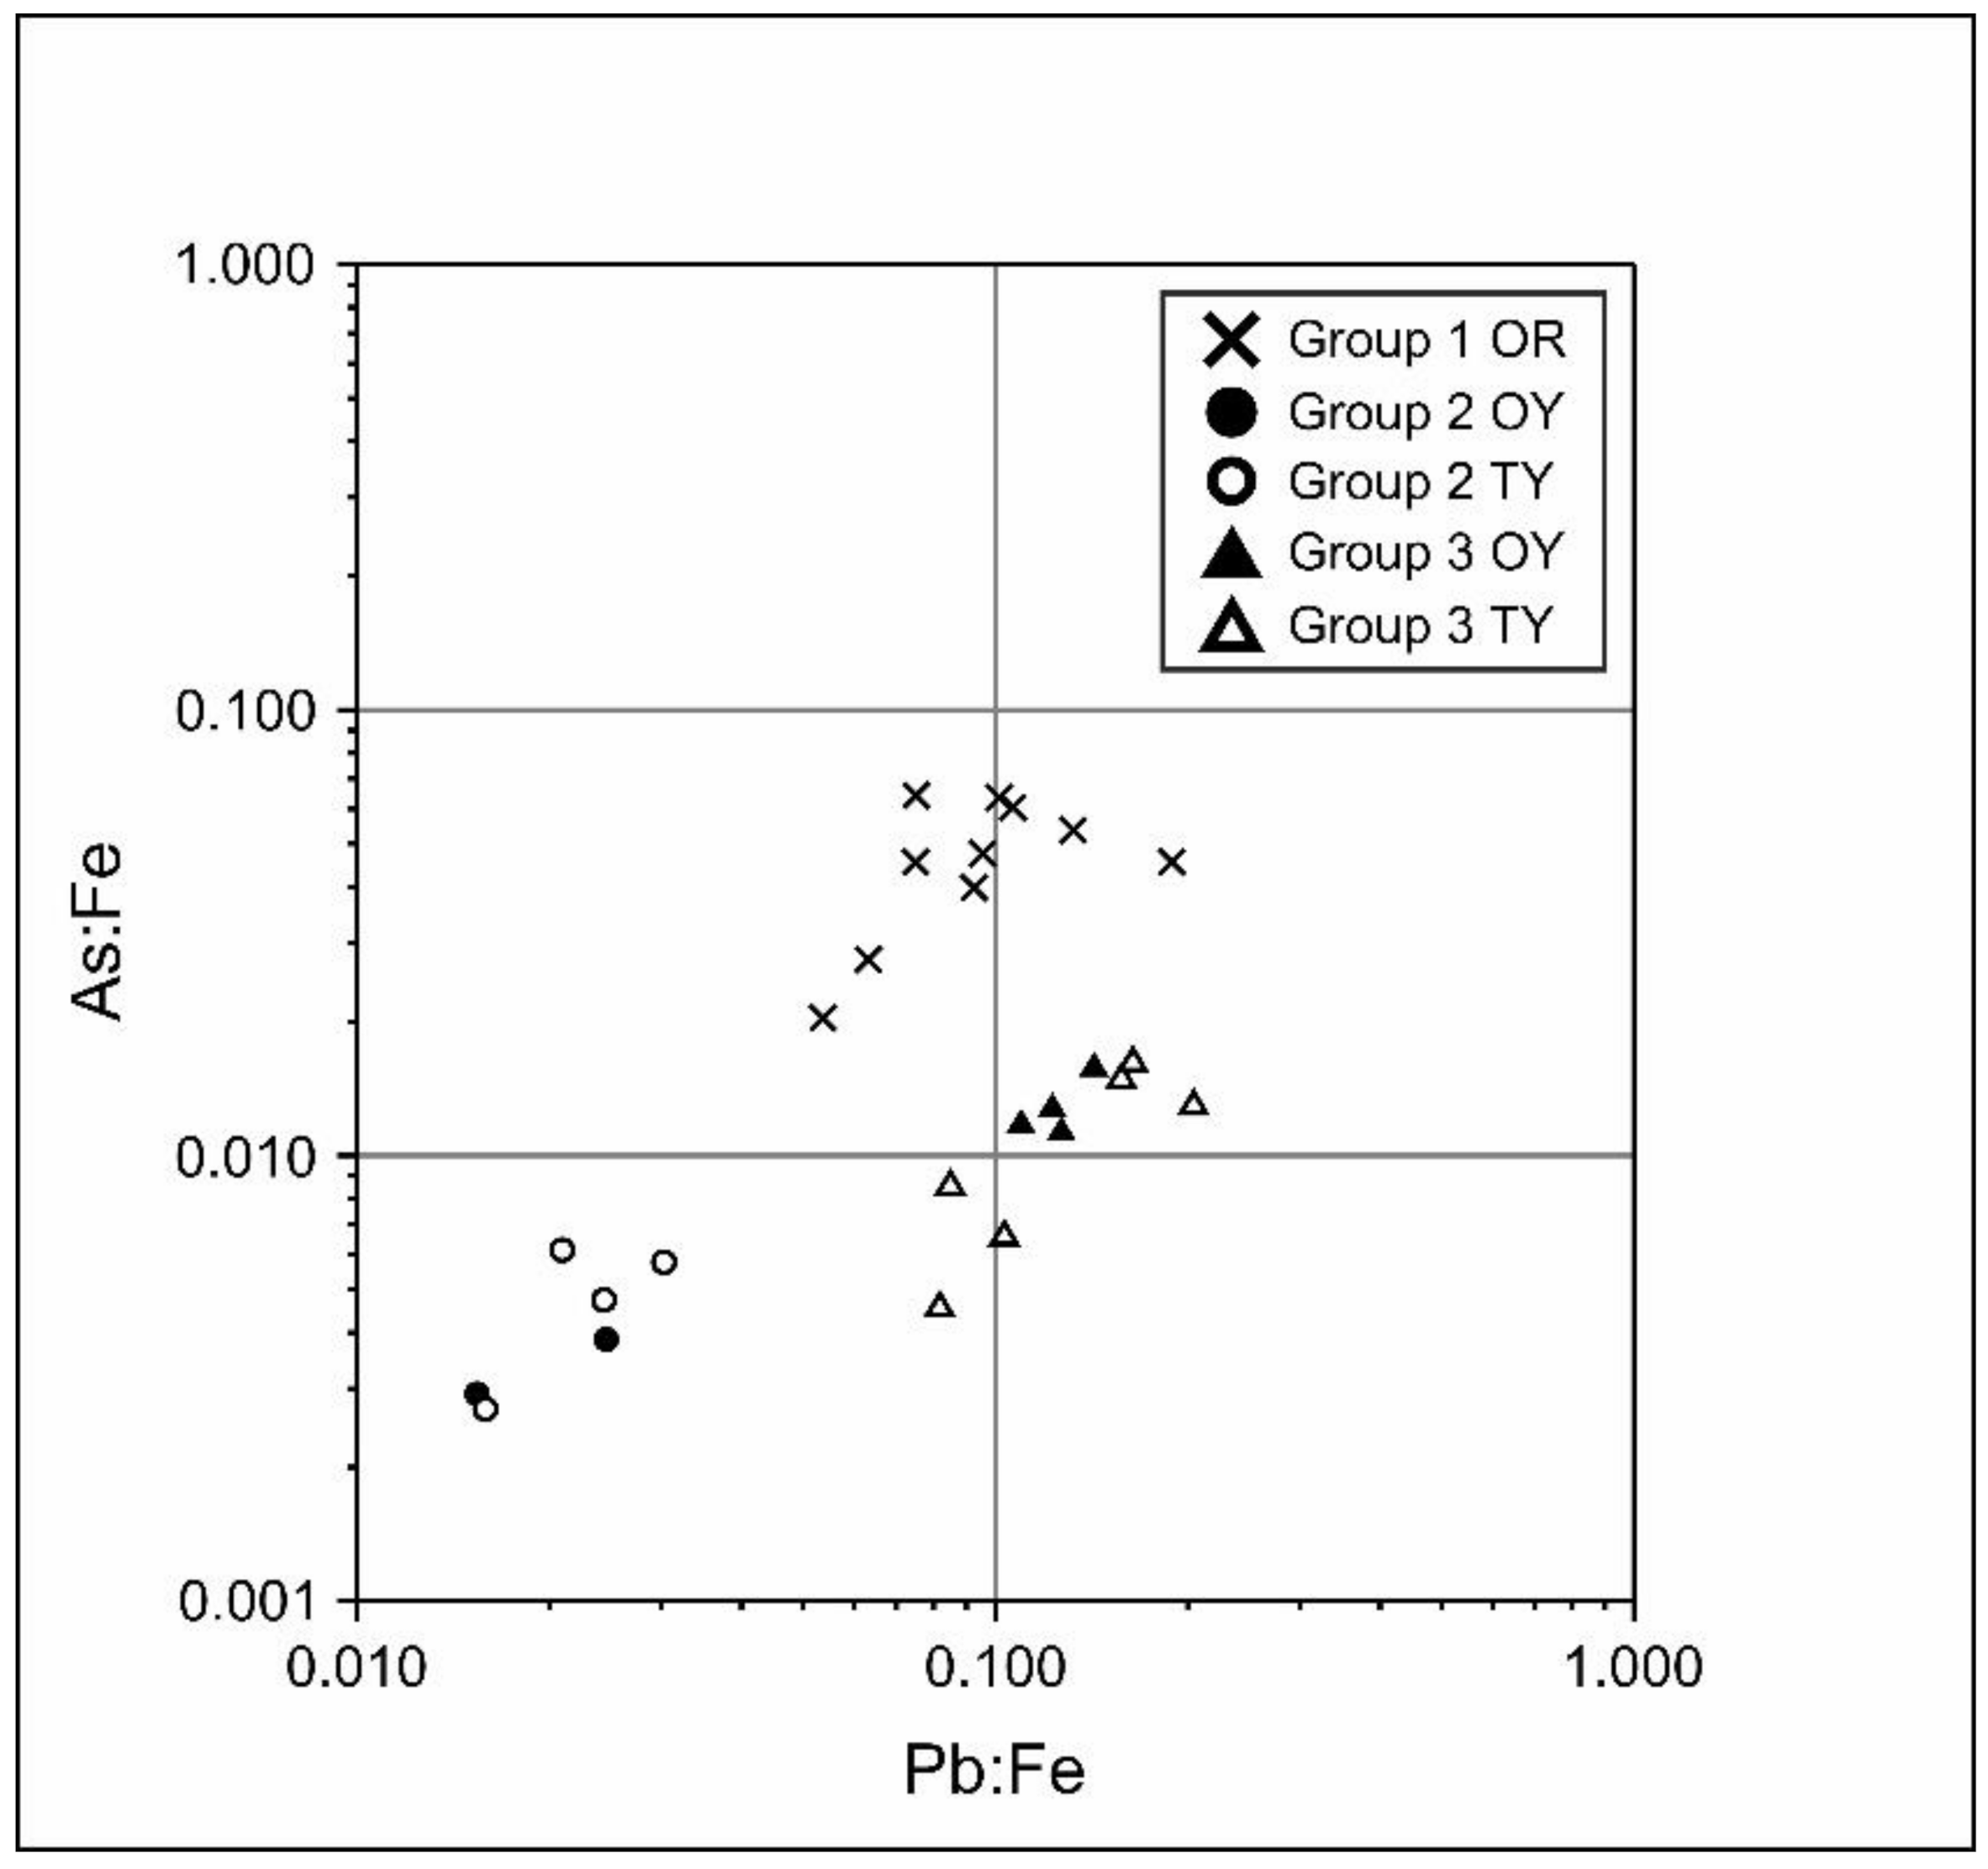
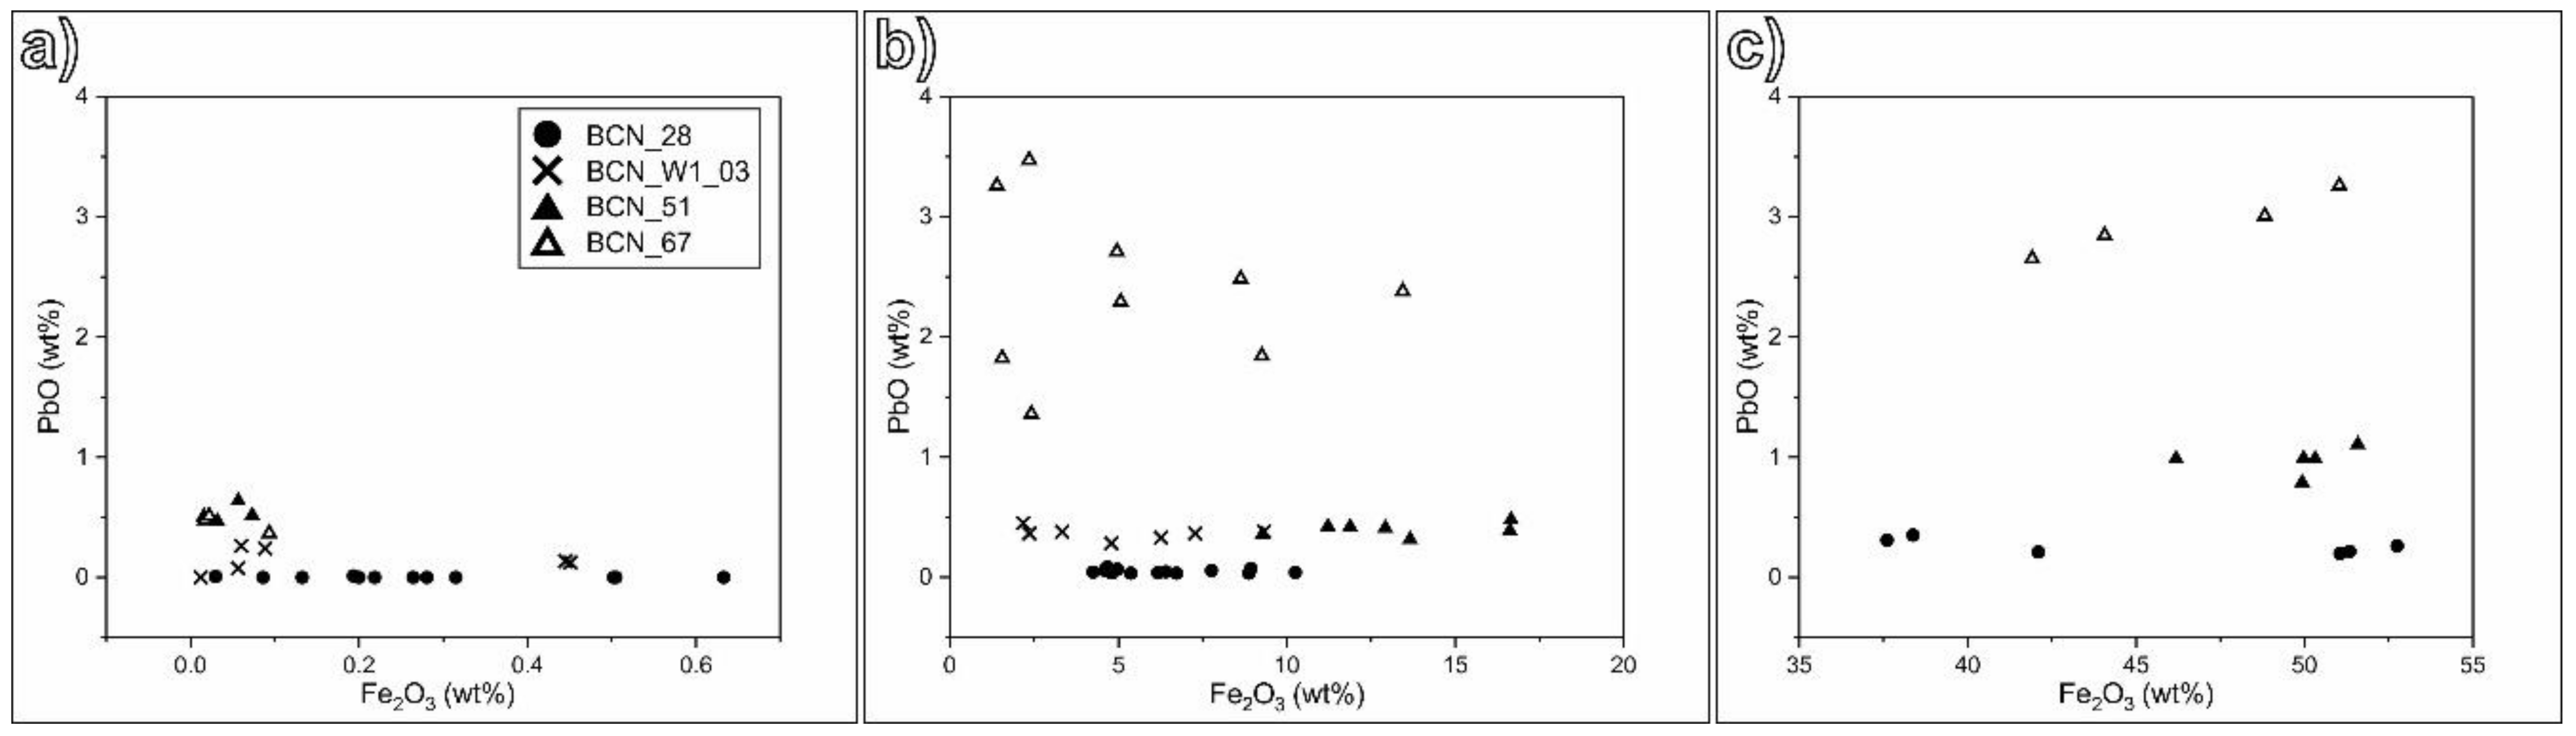
The initial onsite survey campaign by p-XRF on the Roman wall paintings in the tablinum of the House of the Bicentenary made it possible to perform a first chemical characterization of the decorated surfaces. The main information obtained indicated a significant chemical differentiation between central panels, side panels, and upper registers according to Pb:Fe/As:Fe ratios calculated from adjusted peak areas (central panels: low both Pb:Fe and As:Fe; side panels high Pb:Fe and medium As:Fe; upper registers: highest Pb:Fe and low As:Fe). Considering both hypothesized and observed original color patterns, the interpretation of such results indicated that As constitutes a useful chemical tracer for the discrimination between original red and transformed yellow backgrounds in the tablinum of the House of the Bicentenary in accordance with Marcaida et al. [14]. Furthermore, the similar Pb:Fe/As:Fe ratios of TY sites with those of OY sites in side panels and upper registers constitutes further strong evidence that these areas were actually yellow transformed to red due to the heat of the volcanic eruption.
It is not immediately clear why the three areas of monochrome background should show distinctly and consistently different patterns of lead and arsenic levels. It is possible that lead and arsenic are naturally occurring impurities in the ochres, considering their widely known tendency to be adsorbed through surface interactions onto several classes of crystalline compounds, especially phyllosilicates [38,39] and transition metal oxides [40,41]. Furthermore, both elements have been shown to be useful indicators of provenance in the investigation of ochre pigments [30,42,43]. As for this case study, the lack of proper comprehensive databases makes it difficult to formulate solid hypotheses on the provenance of the employed ochres, also considering the possibility that arsenic- or lead-based pigments were intentionally added to the ochre pigments to modify their color. If so, then arsenic would likely have been added as realgar (red; AsS) or orpiment (yellow; As2S3) and lead would likely have been added as minium (red lead, defined as Usta by Pliny; Pb2O3), litharge/massicot (yellow lead, defined as Sandaraca by Pliny; PbO), or hydrocerussite (white lead, defined as Cerussa by Pliny; (PbCO3)2·Pb(OH)2), although the latter was known to be unstable for lime-based wall paintings.
Published levels of naturally occurring Pb and As in ochre pigments are typically in the ppm range [30,42,43,44], suggesting that the detected levels in the tablinum samples are unlikely to be naturally occurring, at least for Pb, which is present in significantly higher amounts than As. To further investigate this hypothesis, a selection of 10 modern ochre and sienna pigments supplied by Kremer Pigmente (Kremer Pigmente, Aichstetten, DE), ranging from yellow to red, were also analyzed by p-XRF using the same methodology applied onsite, though with longer collection time to decrease noise in the spectra (Table S4). While some level of As was detected in eight of the 10 pigment samples, none yielded an As:Fe ratio greater than 0.002, far below the levels obtained in the side panels of the tablinum. Traces of lead were detected in only three of the ochre samples, but they were at levels so low that the Pb:Fe ratios calculated were 0.0003 or less and orders of magnitude lower than in the tablinum spectra.
Mock-up samples were prepared to make a rough estimate of how much arsenic- and/or lead-based pigment would have been added to the ochre pigment in order to produce lead and arsenic results similar to those found in the tablinum. Various mixtures of red ochre and yellow ochre pigments (with little to no lead or arsenic content) were prepared by adding either one part to ten or one part to twenty (by weight) of minium, litharge, and/or realgar. Pigment mixtures in a dilute acrylic binder were applied in a wash to a substrate of thick lime plaster to imitate the conditions on the walls of the tablinum. In the mock-ups as a whole, the addition of the arsenic- and lead-based pigments at a proportion of 1:20 by weight (significantly less by volume) made very little difference in the observable color of the final paint wash. A similar p-XRF instrument was used to acquire spectra from the mock-up samples and the spectra were processed using PyMca, in the same manner as the tablinum spectra, to generate As:Fe and Pb:Fe ratios. The results of this crude experiment suggest that lead levels found in the originally red side panels would likely correspond to substantially less than one part in 20 of red lead in red ochre by weight. Four measurements of the 1:20 mock-up yielded an average Pb:Fe ratio of 0.29 compared to the tablinum group 1 average of 0.10. Similarly, the As:Fe ratios found in the same tablinum panels would appear to correspond to a very minor addition of an arsenic-based pigment such as realgar; the 1:20 mock-up panel with realgar yielded an average As:Fe ratio of 0.27 compared to the tablinum group 1 average of 0.05. Mock-ups of litharge and red lead in yellow ochre pigment at 1:20 by weight yielded similar Pb:Fe ratios as the spectra collected from the tablinum’s originally yellow upper register (group 3). With a Pb:Fe ratio averaging about 0.13, the tablinum spectra fell between the litharge and red lead mock-ups, whose Pb:Fe ratios averaged 0.10 and 0.15, respectively.
In conclusion, the amount of lead and arsenic found by p-XRF in the background monochrome panels of the tablinum seems higher than expected for natural occurrence in ochre pigments, but lower than would be expected if lead or arsenic pigments were added to adjust the color of the paint. Of course, modern, industrially refined pigment mixtures are not the optimal point of comparison and may be significantly purer than ancient Roman varieties. Direct comparisons to a range of surviving examples of ancient roman ochres would be valuable.
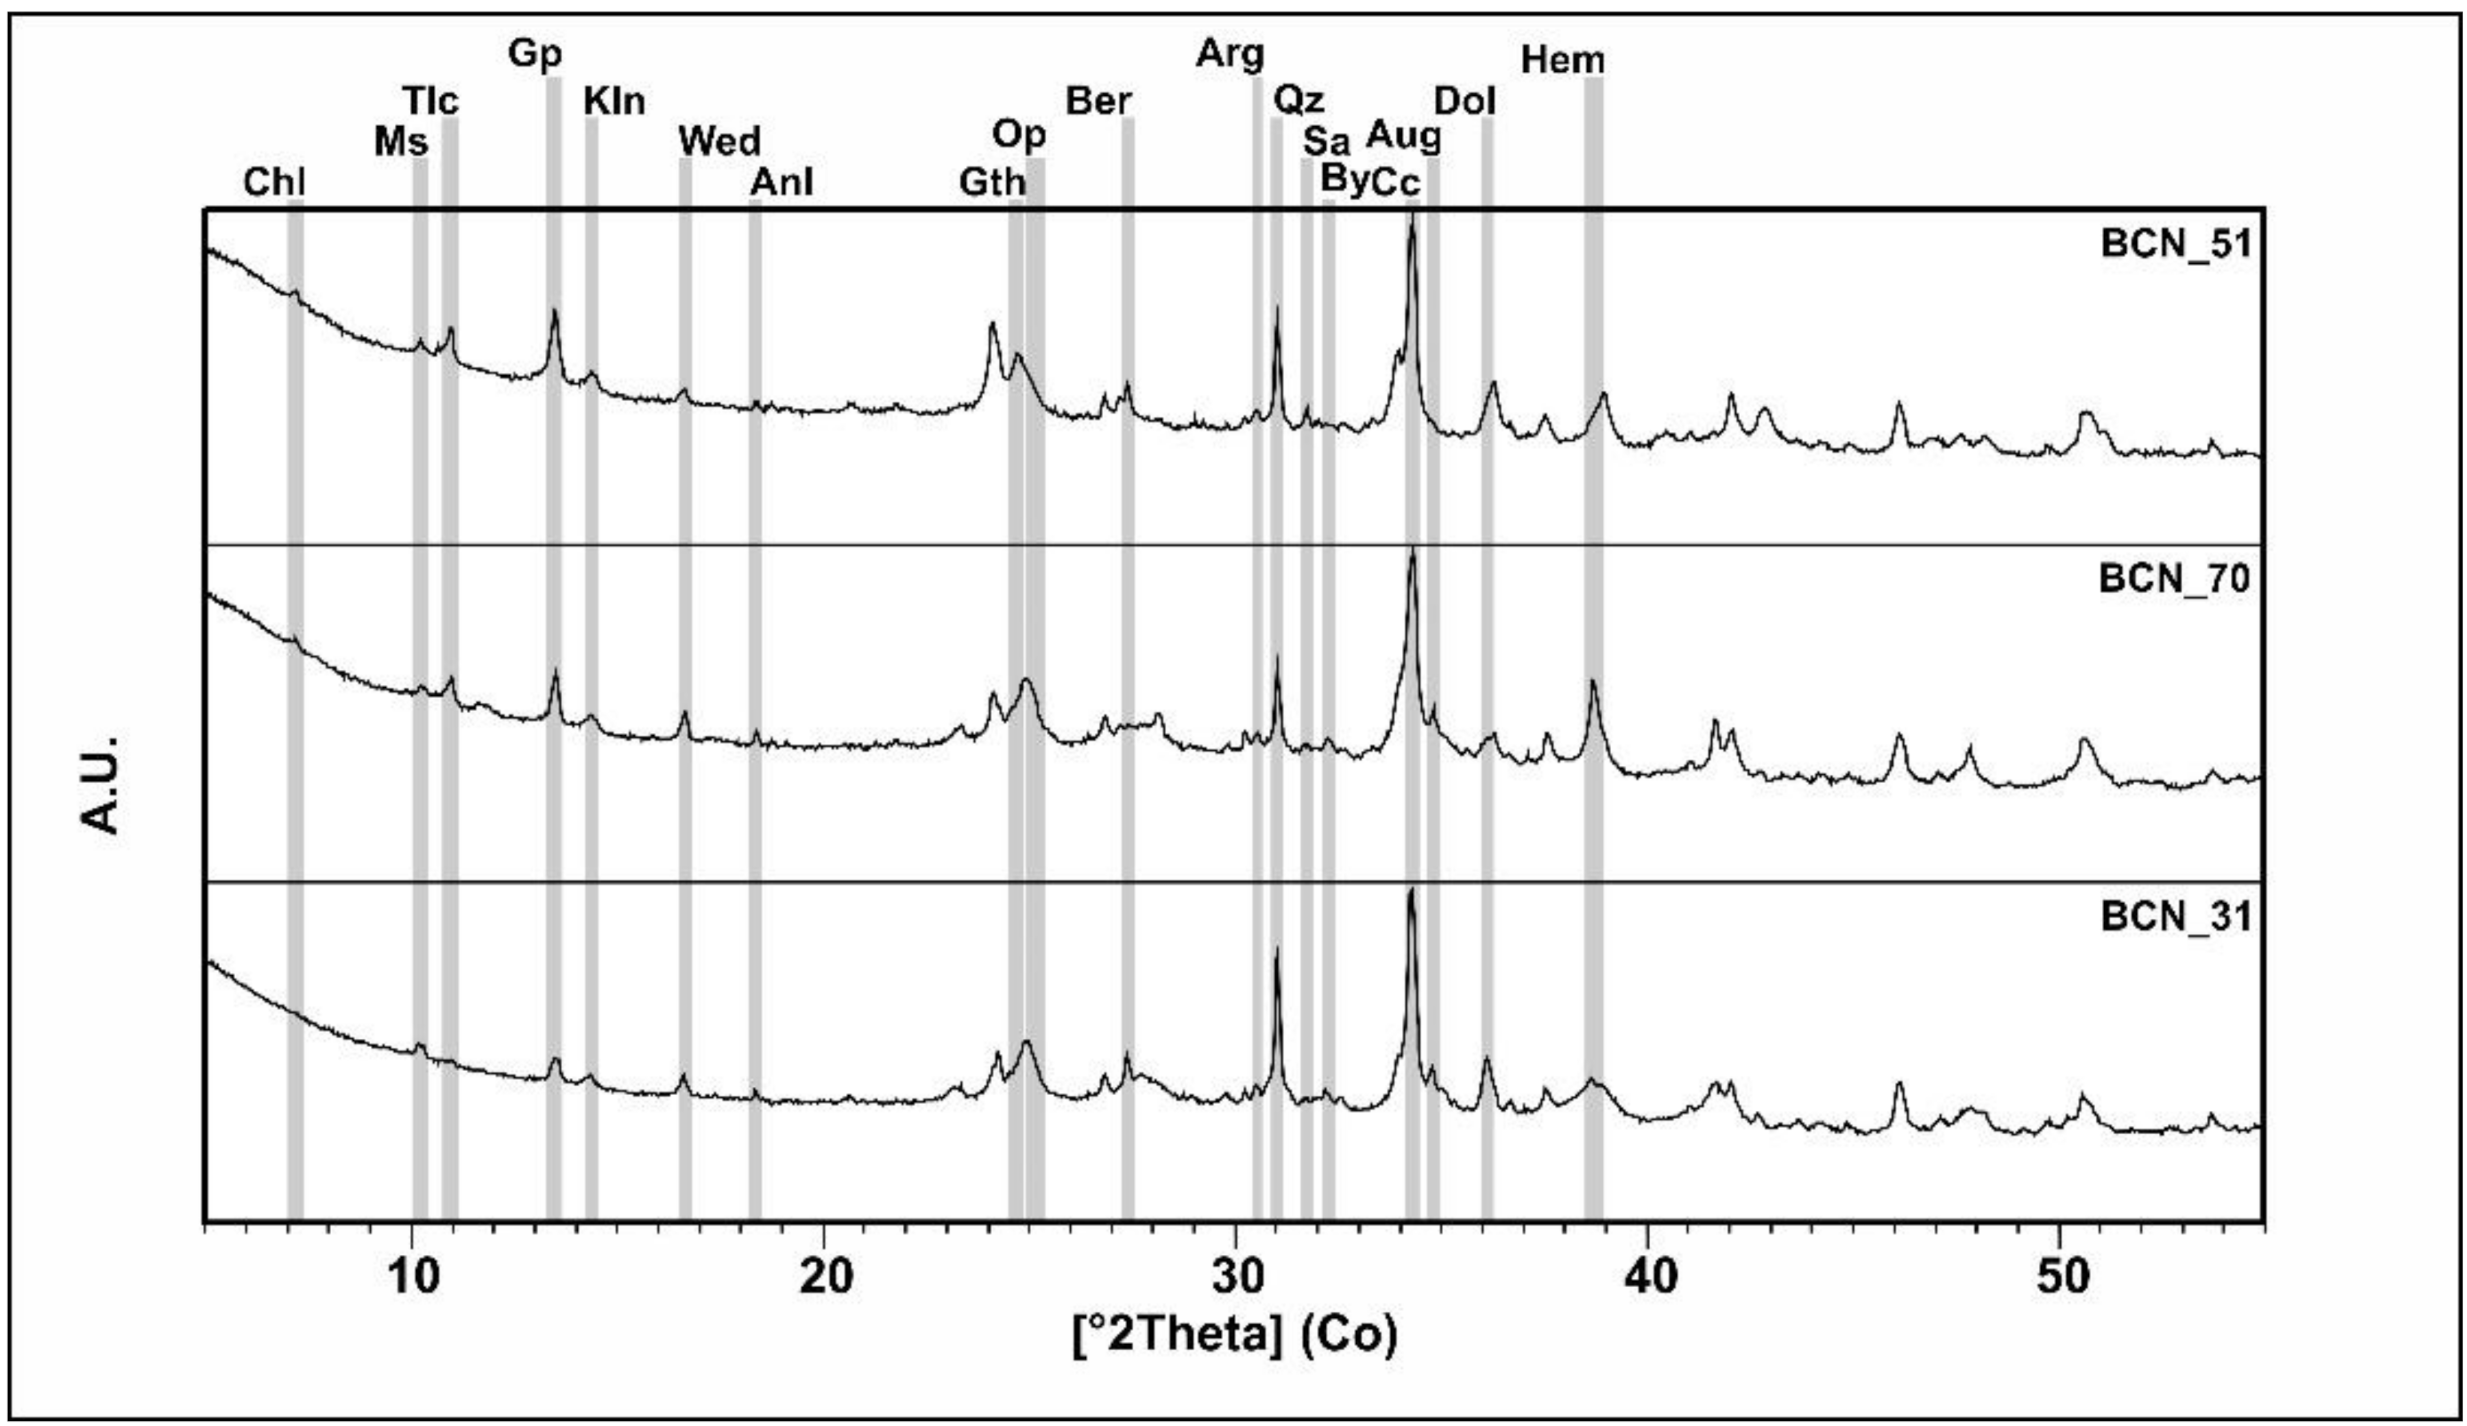
The mineralogical information obtained through XRPD analyses on micro-scrapings constituted a perfect analytical bridge to link broad onsite chemical data by p-XRF with the punctual outputs of microstructural and microchemical analyses by SEM-EDS, µ-Raman, and EMP-WDS on cross-section samples. As a first result, the analyses indicated significant perturbations of the original mineralogical assemblage related to alteration processes during eruptive, burial, and post-burial phases, in accordance with the complex conservation history of the building. This is shown both by the presence of phases of clear secondary origin, related either to the formation of superficial concretions (gypsum, weddellite), dust deposition (volcanic minerals, dolomite), or to the post-depositional transformation of chromophore compounds (bernalite), and by the mineralogical evidence of thermally-induced transformations of ferric oxo-hydroxides constituting the chromophore minerals of ochre-based pigments.
In this perspective, the study made it possible to determine an absolute mineralogical parameter for the discrimination between original and converted red monochromes, namely the level of crystallinity of chromophore hematite determined by the Lorentzian size of crystallites, higher than 60 nm in the original red ochres and lower than 30 nm in the original yellow ochres altered to red. This clearly indicates that the impulsive heat stimulation related to the ingress of the pyroclastic surge in the building and the fire of wooden architectural elements at temperatures lower than 500 °C, which did not allow a crystal growth process comparable with long-term lateritic alterations of soils or prolonged high-temperature thermal treatments like those applied for the manufacture of artificial red ochres. In terms of archaeometric significance, the data were consistent in confirming the chromatic pattern of the registers hypothesized by archaeologists and conservators.
Furthermore, the mineralogical profiling of the decorated surfaces clearly indicated the occurrence of significant fractions of accessory phases in the applied ochre pigments, sometimes in ratios comparable with the chromophore phases. This is coherent with the intrinsic limits of ancient technologies for the purification of lateritic sediments, constituting a further confirmation that direct comparisons with modern, industrially refined pigments should be carefully evaluated. As for the nature of the accessory phases, besides the occurrence of common minerals such as quartz and phyllosilicates, all the samples showed the presence of peculiar compounds such as talc and opal-CT. The presence of talc could be related also to the accessory mineralogical assemblage of the ochre pigments. Nevertheless, its voluntary addition as an additive for superficial treatment cannot be excluded, possibly as a luster enhancer, as already suggested by Angelini et al. [22]. As for opal-CT, the occurrence of the phase could be either related to the accessory mineralogical assemblage of the ochres or to superficial restoration treatments with ethyl silicate-based consolidants. Nevertheless, the second hypothesis is in contrast with published experimental evidence [45], indicating the absence of significant diffraction contributions from these classes of products after polymerization. Furthermore, opal-CT is present also in the materials sampled from the atrium of the domus, where superficial consolidation treatments were not reported. Assuming its correlation with the original mineralogical assemblage of the pigments, the presence of opal-CT would constitute a significant marker of common provenance for the ochres, likely ascribable to silcretized horizons of lateritic sediments, whose occurrence has been reported in France [46]. Furthermore, this would imply an extraction of the ore materials from sites where both red and yellow ochres were available, such as in the famous Roussillon quarries [47].
Also, this theory would strengthen the hypothesis that the heterogeneous elemental distributions in the tablinum walls determined by p-XRF are not actually related to trace contaminations in ochres coming from different extraction sources but rather are related to the addition of heavy-metal-based pigments to the pigmenting mixtures. This would be valid for Pb, also considering the significant detected amounts of the element, while it may be less likely for As, which is present in small amounts, compatible with trace contamination in the poorly purified ochre pigments applied in the tablinum wall paintings. As for the discrepancy of concentration of As between originally red and originally yellow ochres, this would be justified considering both the higher As sorption affinity of hematite with respect to goethite and its lower desorption tendency from hematite substrates at high pH levels, typical for lime-based binders [48,
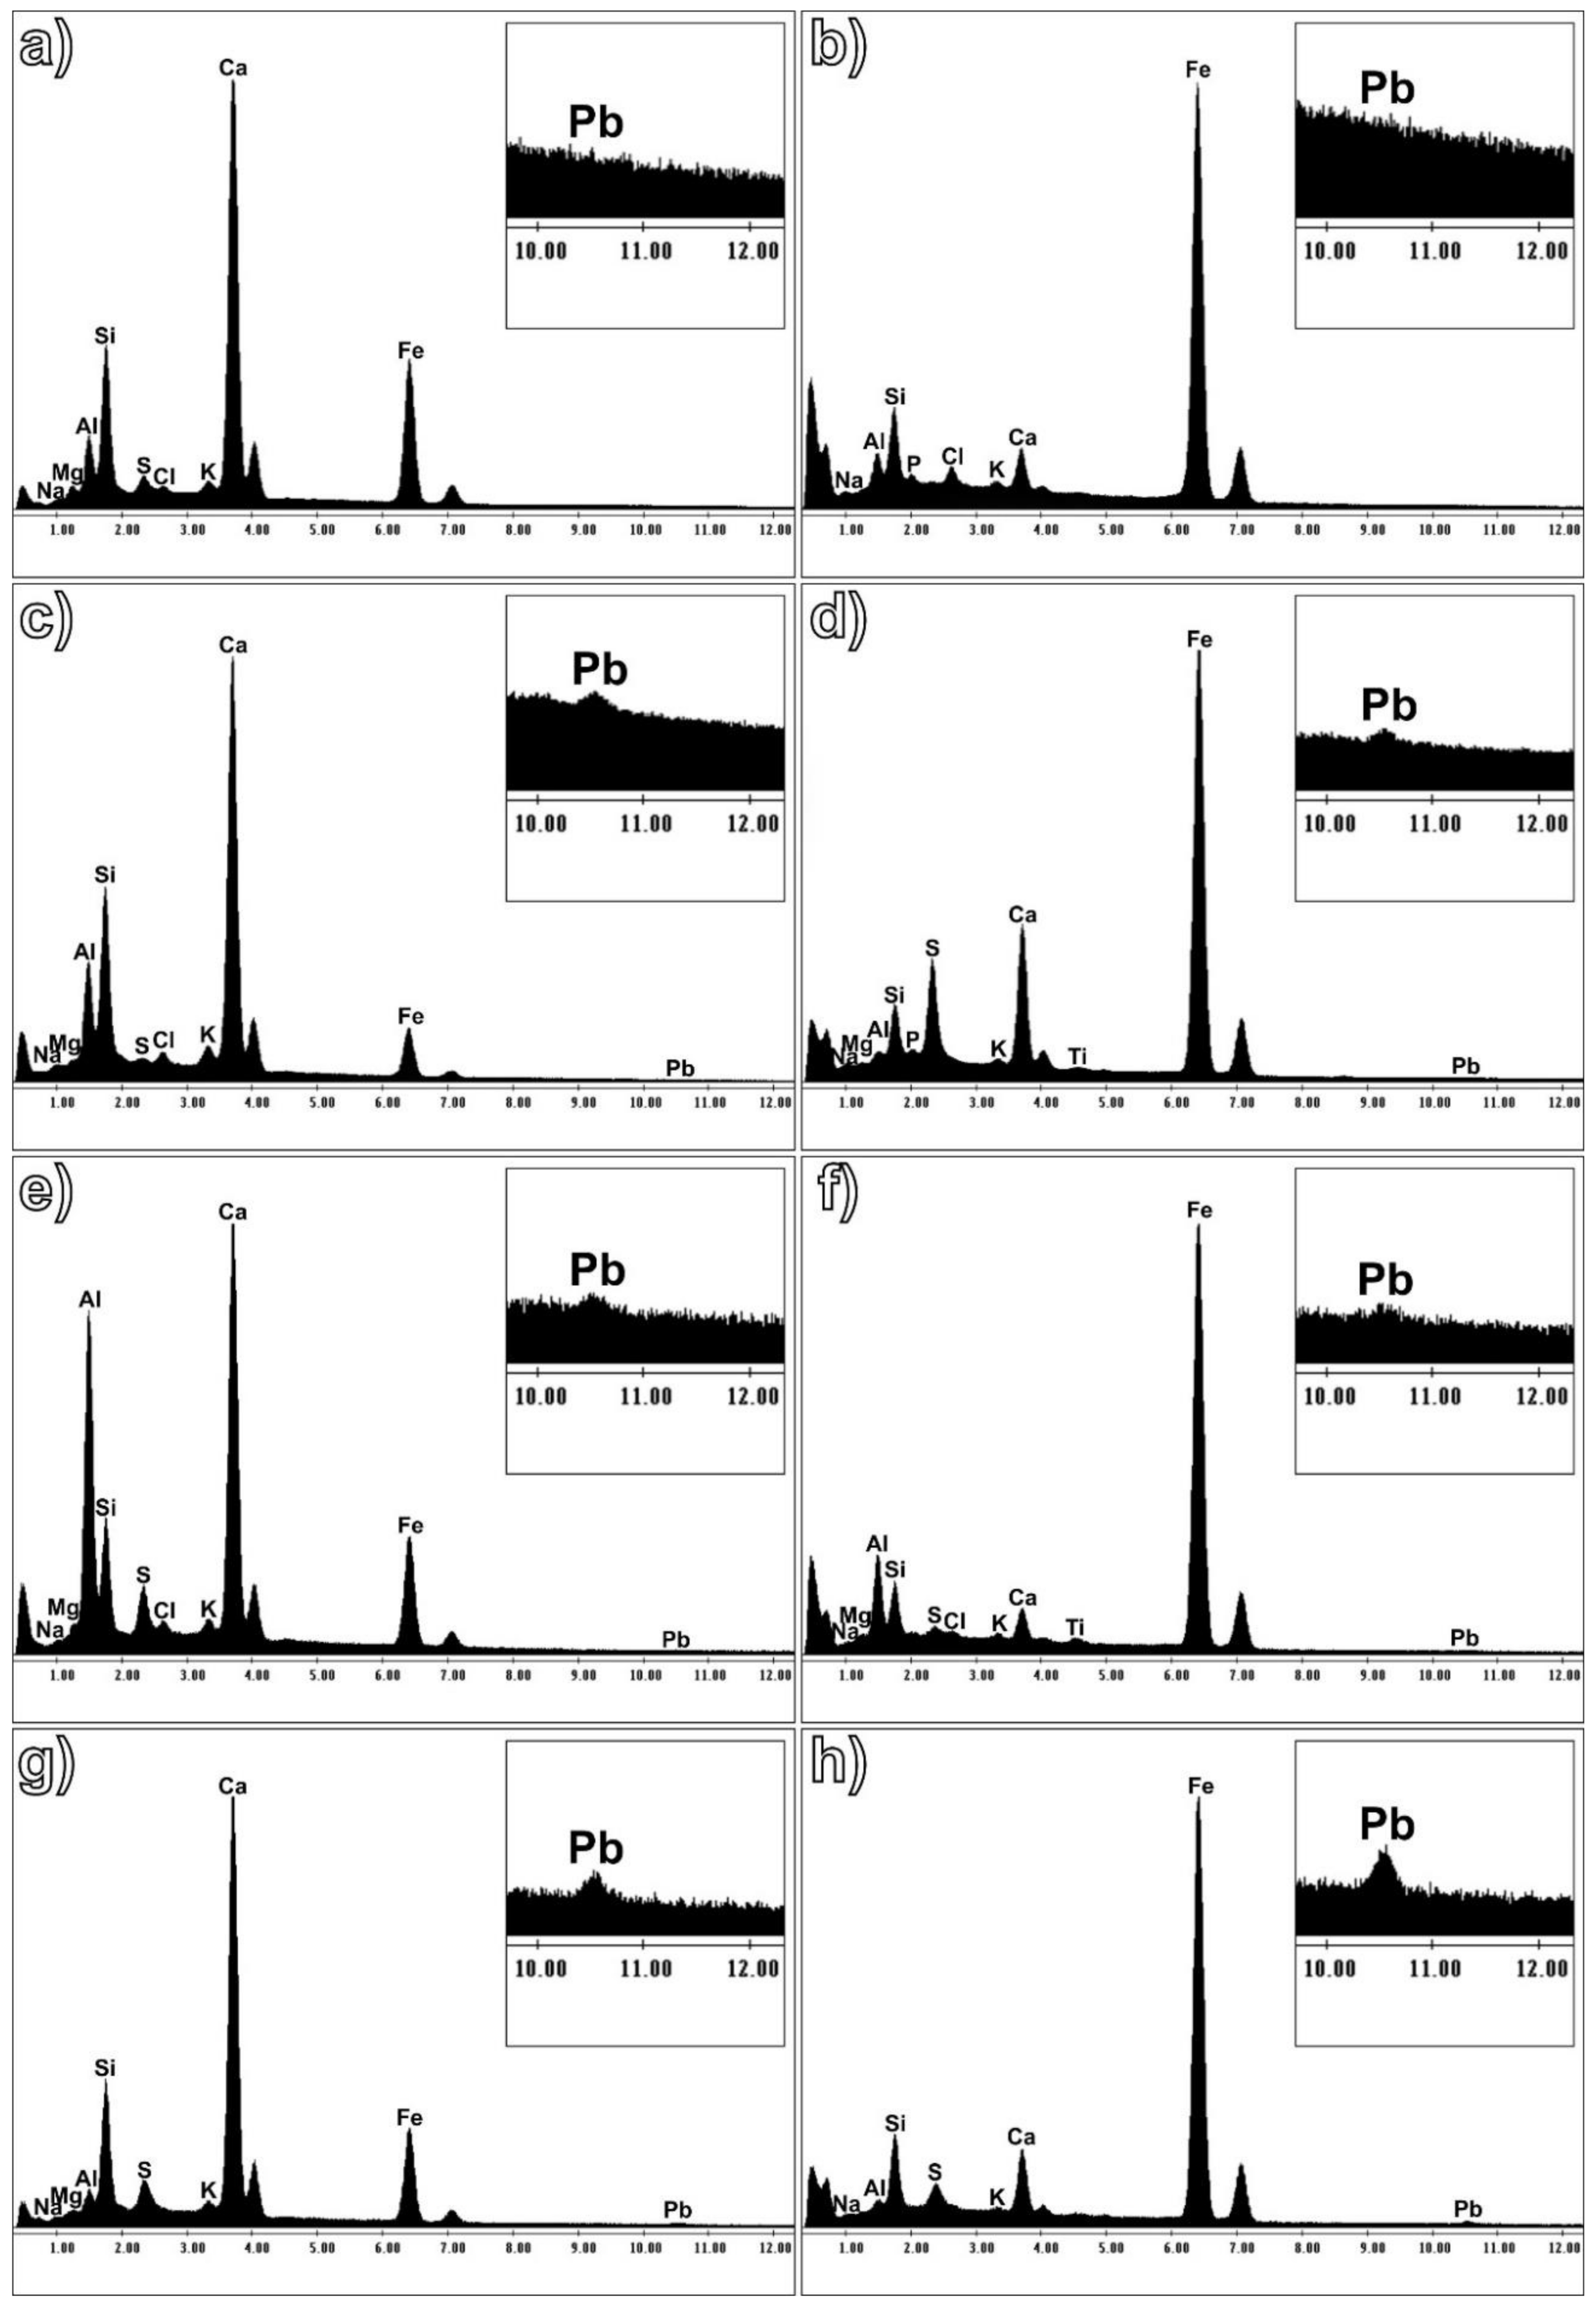
49]. Nevertheless, the hypothesis of the utilization of pigmenting mixtures containing both ochres and lead-based pigments contrasts with the fact that no traces of crystalline lead-based compounds were found in any of the samples analyzed, thus requiring a careful crosscheck with the results obtained from detailed microstructural and microchemical analyses on the cross-section samples analyzed.
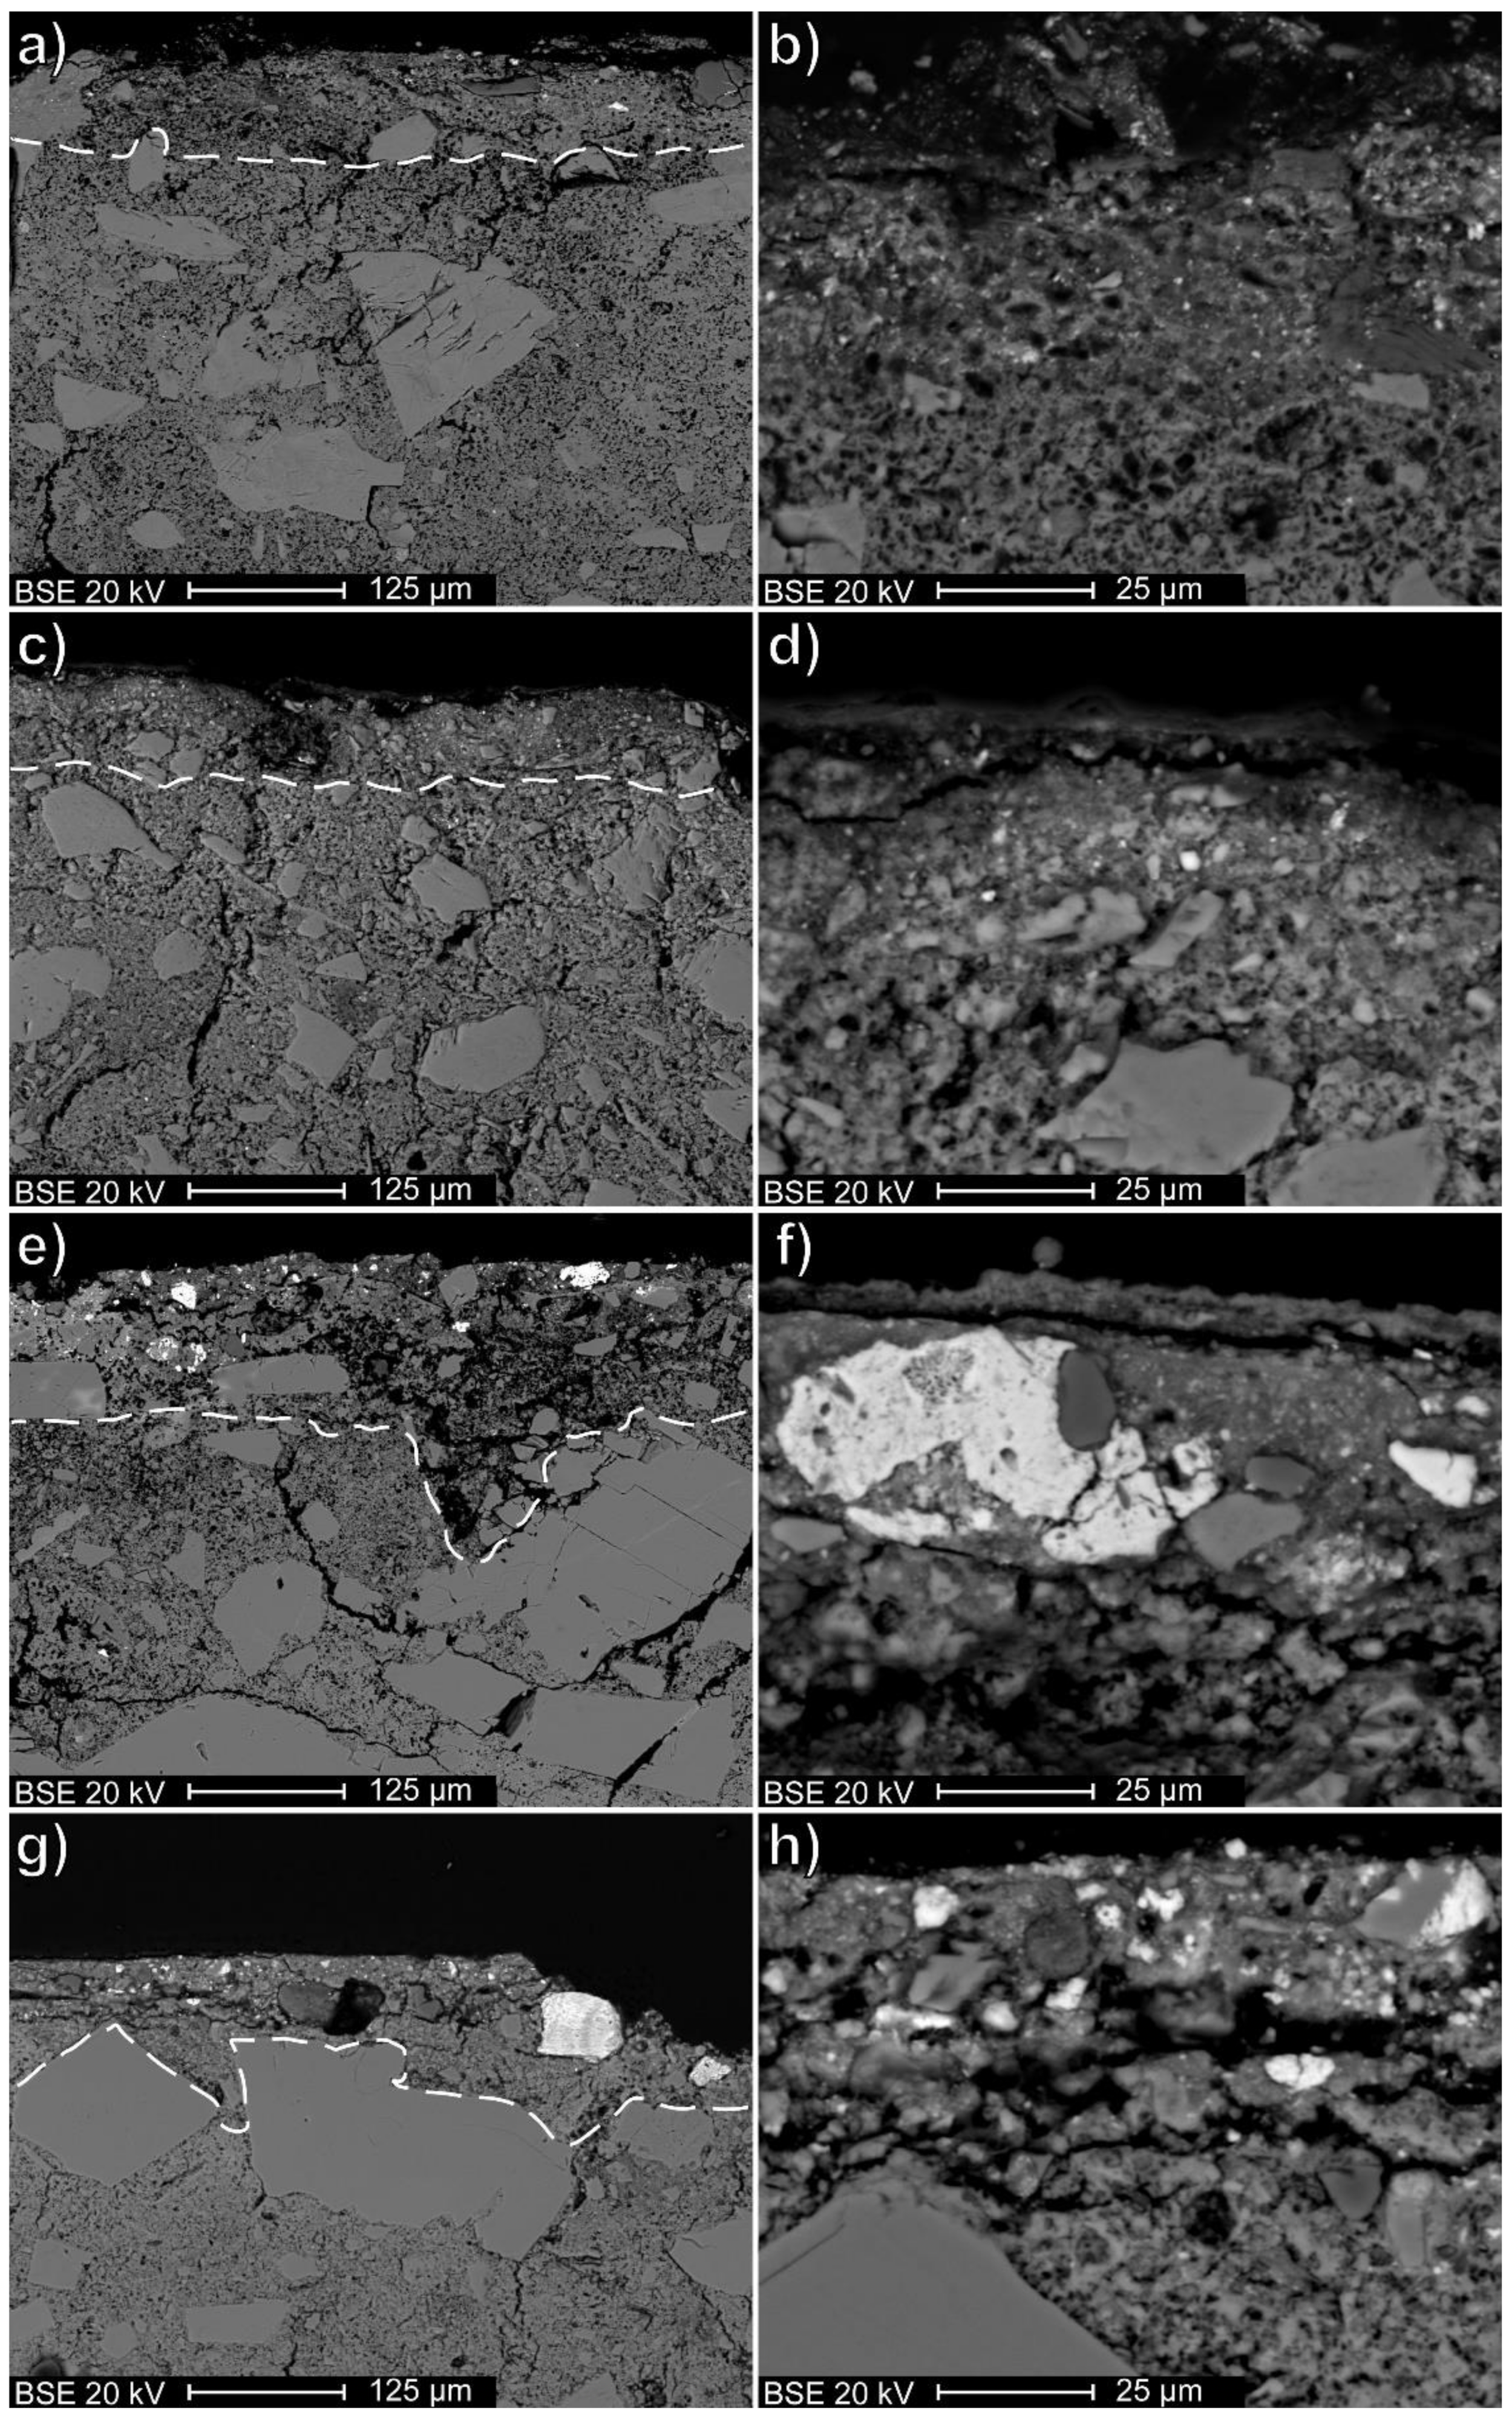
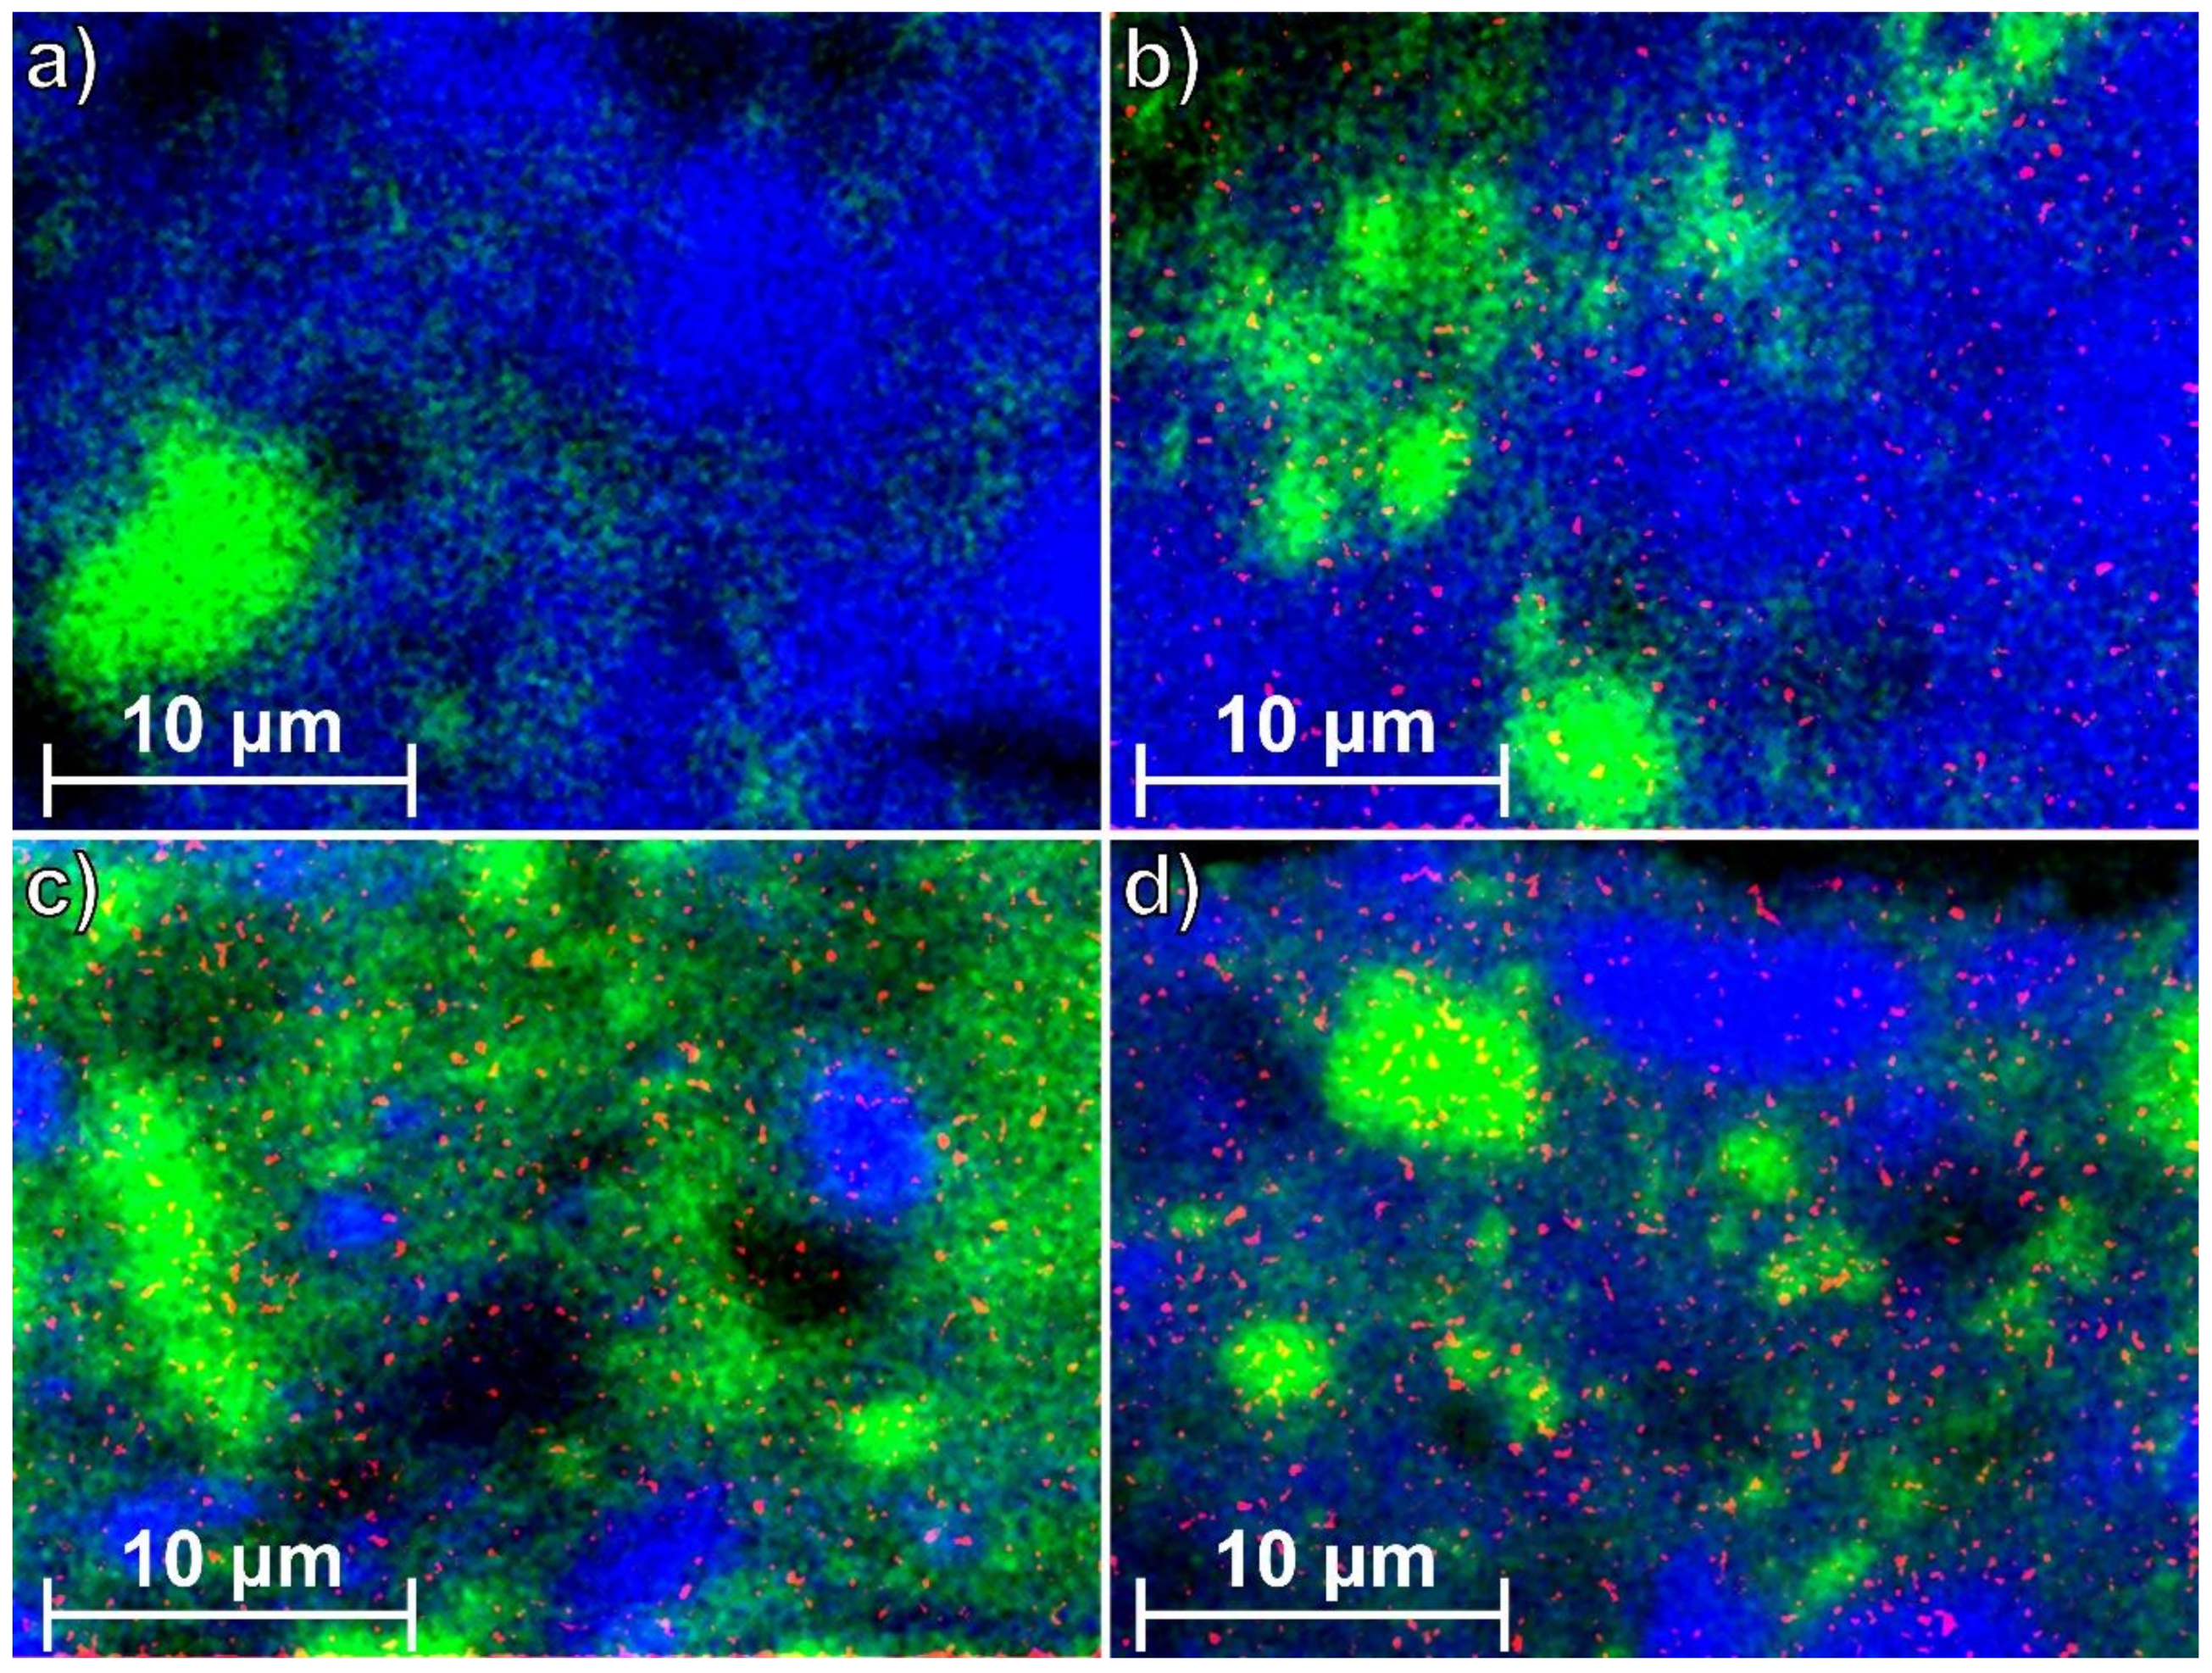
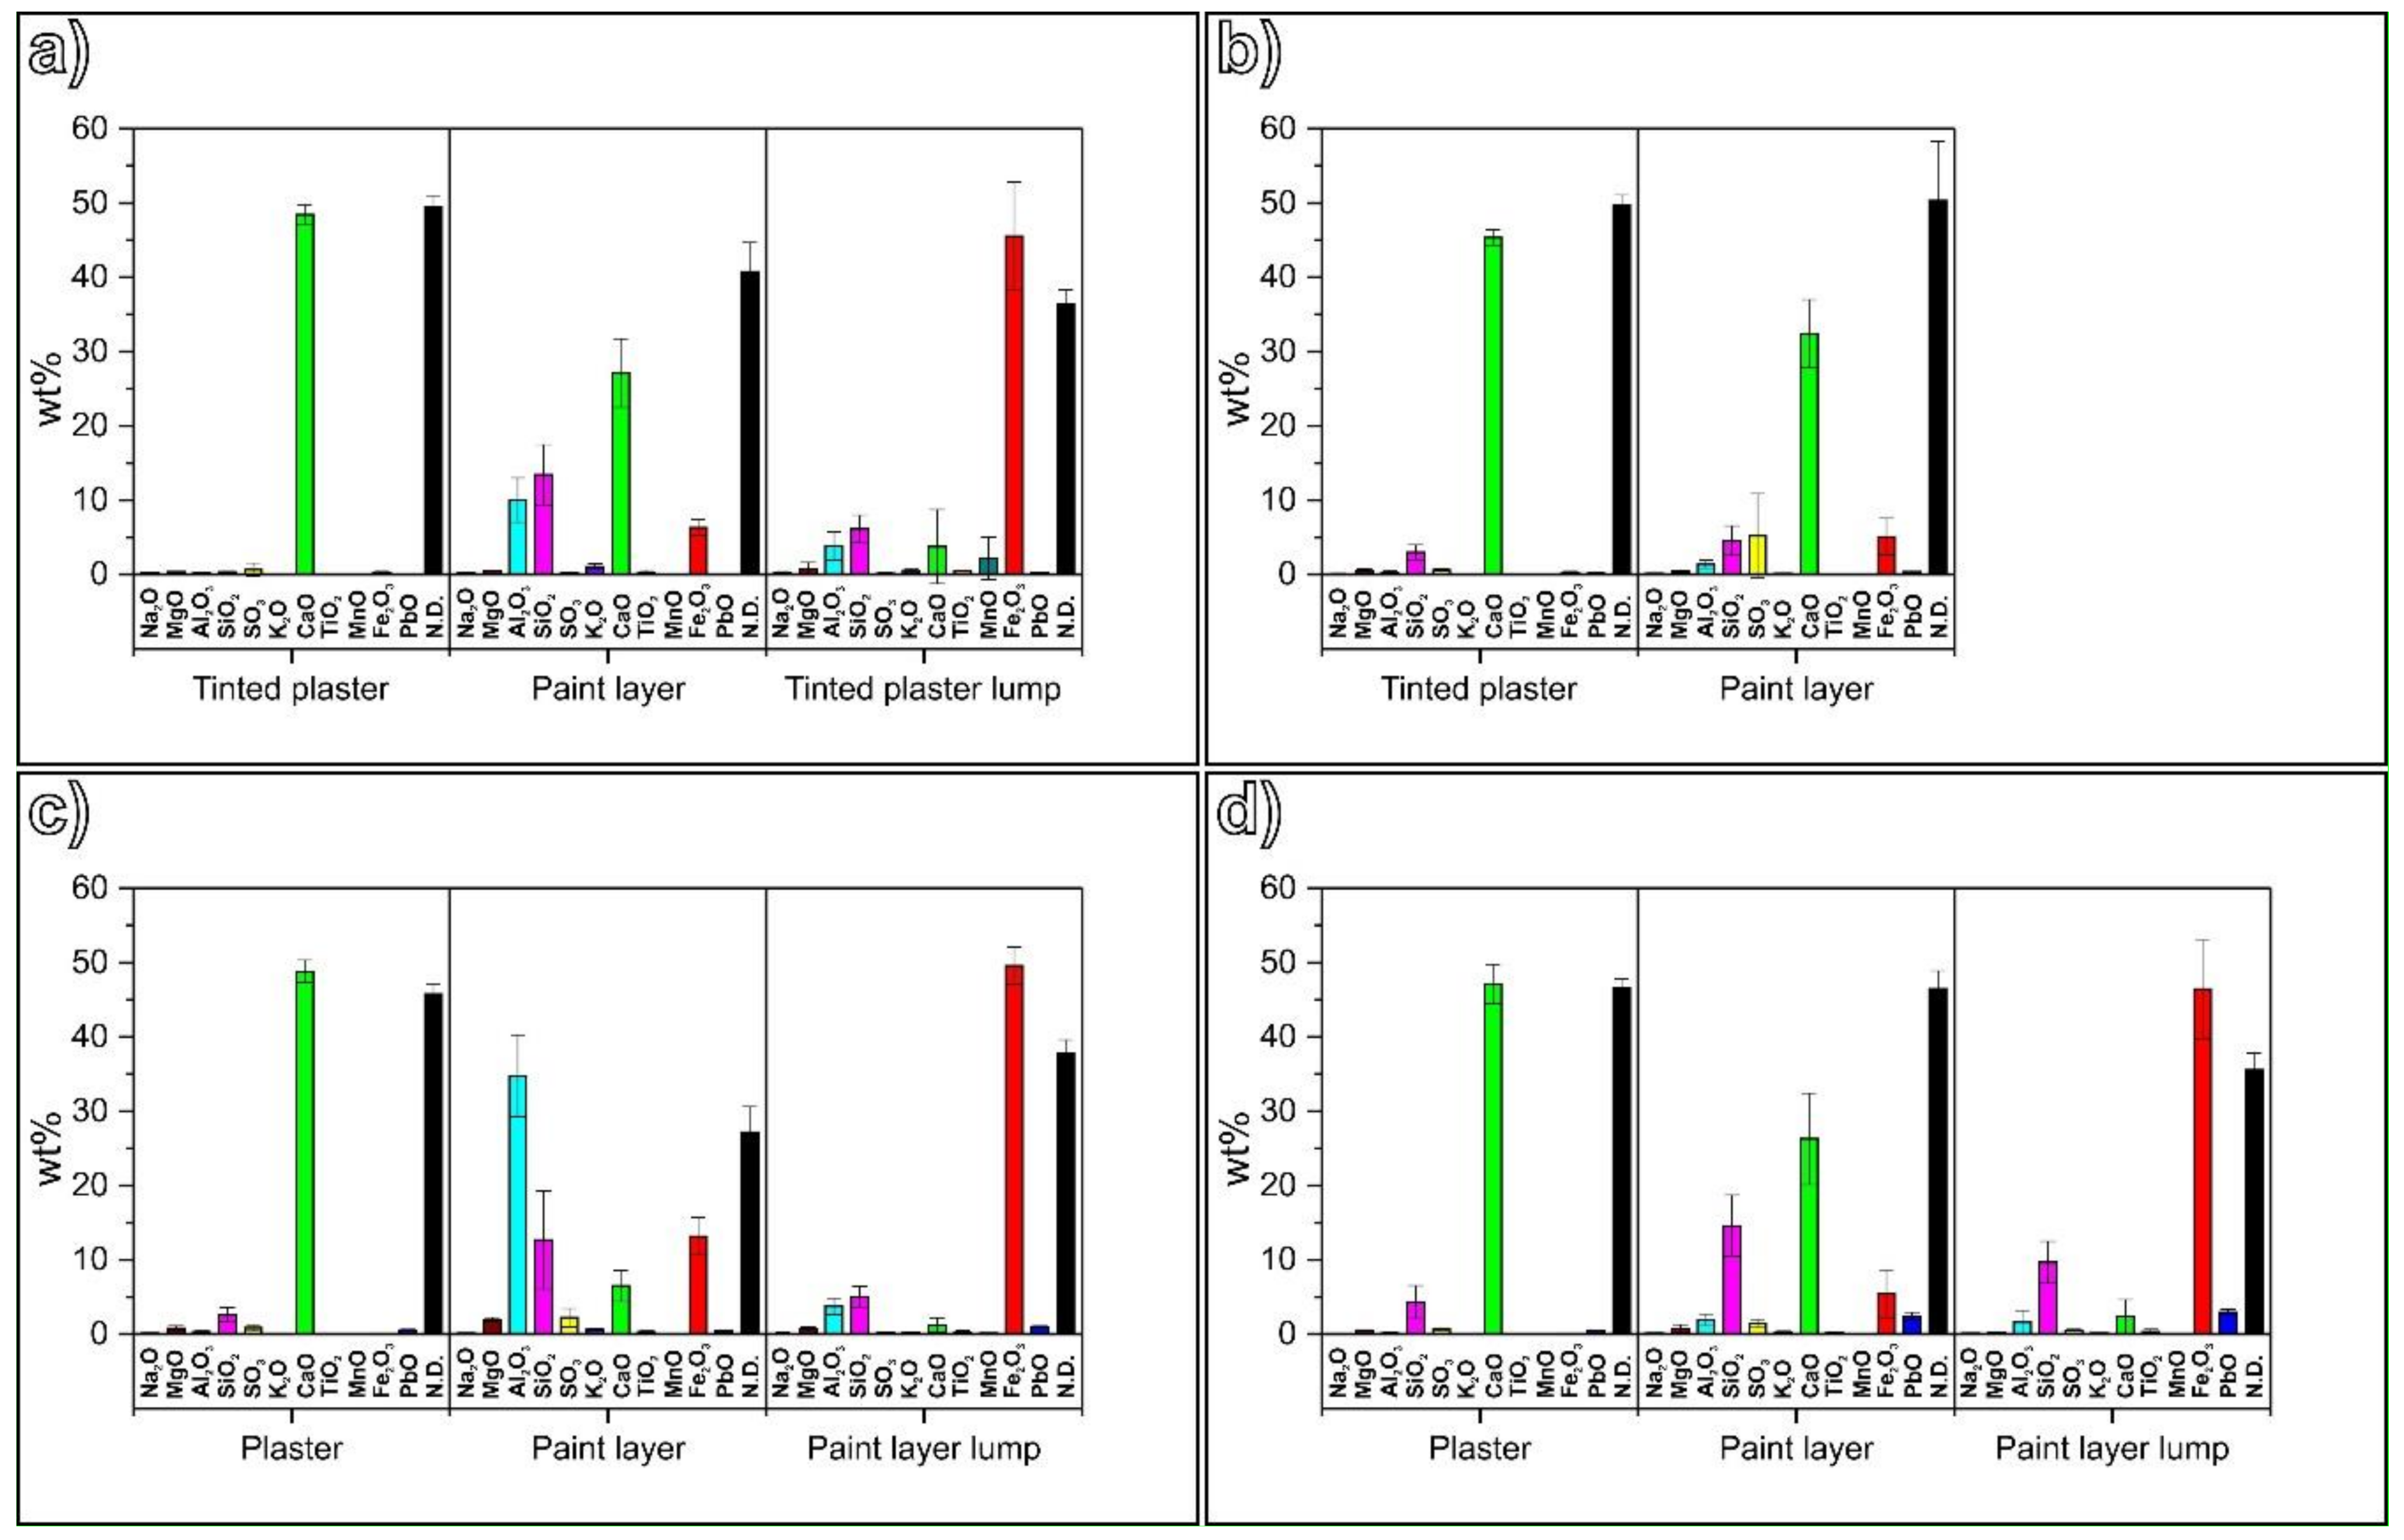
As a first result, the multi-analytical microstructural characterization of the tablinum cross-section samples made it possible to confirm and further characterize the Pb chemical zoning detected by p-XRF. The element is absent in the central panels, while it is present in reduced amounts on the side panels and in higher concentrations in the upper registers, with the highest concentration of approximately 3 wt% in the upper register of the west wall. The element is homogeneously distributed in the paint layer matrices, regardless of iron concentrations, apart from slight increases in the chromophore-rich pigment lumps of one sample from the upper east register. Furthermore, it shows a certain degree of diffusion in the uppermost portions of the finishing plasters of the side panels and upper registers, and it is present in reduced amounts in the macroscopic pigment lump within the pink-tinted plaster of the east-central panel sample. Such ubiquitous Pb distribution is to be considered even more peculiar when compared with the varying compositional profiles of major elements in the analyzed paint layers, not correlated with any architectural register or the related ochre type. These are characterized by variable Si/Al ratios, with excess Al in some areas suggesting the occurrence of amorphous aluminum oxo-hydroxides as accessory phases, fairly common in lateritic sediments [46], in association with phyllosilicates, quartz, and opal-CT, already determined by XRPD.
As a second significant result, a marked microstructural and qualitative difference of the painted plaster sequences applied in the three areas of the tablinum walls was observed, whose main characteristics are reported hereafter.
  • Base register. The ochre-based background pigment is incorporated in fresco technique within the uppermost volcanic sand-based preparatory plaster.
  • Lower register. The ochre-based background pigments are applied in fresco technique over a fine finishing plaster made with lime and marble dust aggregate. This finishing plaster is pink-tinted in the uppermost portions through the addition of a diluted red ochre fraction, to confer a homogeneous warm tone to the plaster. Over this pink-tinted layer, ochre particles are homogeneously dispersed in the supporting plaster forming a thin and compact paint layer, and they are characterized by a reduced particle size distribution. The black background on the lower register of the south wall is applied likely with a binder over a lime-based plaster containing crushed bricks as aggregate and with no pink-tinted plaster beneath.
  • Upper register. The ochre-based background pigment is applied in fresco technique over a coarser finishing plaster made with lime and marble dust aggregate with higher particle size distribution with respect to the lower registers. The pink-tinted plaster is absent on the east and west walls, while it is present on the south wall, and the paint layer is thicker, more irregular, and less homogeneous, with fractured and dislocated skins of carbonated lime forming pockets filled with poorly cemented pigment particles. These are characterized by significantly higher particle size distribution with respect to their counterparts in the lower registers.
The varying characteristics suggest greater care of the artisans in the preparation of the different areas. This is perfectly justified by the higher functional and artistic value of the lower registers of east and west walls, more visible and decorated with high-quality figurative scenes. This analytical evidence may imply either lower care of the painters in the preparation of the less important areas, as an efficiency measure, or the execution of such portions by less-skilled artisans. From this perspective, it is possible to hypothesize the availability in the painters’ palette of ochre batches with different grades of quality, related to differing post-extraction treatments such as decantation and comminution. Consequently, the ochres should have been characterized by different pigmenting properties that are obviously influenced by their fineness (the higher, the deeper, and homogeneous the color hue). To correct the hues during the application of the paint layer and guarantee an overall chromatic consistency, the artisans may have applied both simple proportioning procedures such as increasing the amount of applied pigment, as observed in the samples from the east upper register, and express variations of the pigment mixtures by the addition of specific compounds to the base ochre. Besides the hypothetical application of talc as a superficial additive, microanalyses highlighted the diffuse addition of carbon black pigment to the earth-based compounds, previously reported in scientific literature [15] and possibly applied as an opacifier of the fairly transparent ochre pigments.
This widespread utilization of additives further suggests the hypothesis of the application of lead-based pigments in the wall paintings of the tablinum. Such compounds are characterized by bright and deep colors, close to those of ochres and lime white, but they are denser, more finely textured, and with better hiding power [50]. Furthermore, they were artificially obtained since ancient times through simple chemical processing of scrap metals in acidic solutions, to obtain lead white, and subsequent calcination of lead white, to obtain red and yellow lead oxide pigments [51], thus representing a readily available substitute and/or adulterant for earth-based pigments.
The first route of interpretation to justify the occurrence of lead-based compounds in the monochrome backgrounds of the tablinum could be that the red pigments used in the side panels were not pure ochres but artificial mixtures of ochre and lead white calcined together to obtain the Sandyx (mixture of white lead and red ochre, then roasted) and Syricum (mixture of Sandyx and red ochre) pigments cited by Pliny [3] (pp. 283–295). This would not, however, justify the presence of lead in the upper registers, which were originally yellow-tinted. A second hypothesis would be the utilization of either red (minium/red lead) or yellow lead oxides (litharge, massicot) as express color/hue correctors added to the earth-based pigments to confer chromatic homogeneity to the monochrome backgrounds when lower-quality ochre batches were used. Finally, a third hypothesis would be the utilization of lead white pigment as an express whitening agent, either before or in concomitance with the ochre application and in areas where the lower quality of finishing plasters impaired the desired aesthetic effect.
Nevertheless, these theories are not supported by the fact that no traces of crystalline lead-based compounds were found in any of the analyzed samples. Furthermore, lead is generally present in low amounts, so it raises the question if such reduced additions would be capable of conferring specific chromatic properties to the treated surfaces. Nonetheless, both issues may be justified considering the well-known tendency of lead-based pigments to degrade and dissolve under the influence of oxido-reductive and pH-dependent transformation processes [51].
As for lead white, the strong instability of hydrocerussite in alkaline conditions typical for lime-based setting plasters is well-known [52,53,54]. Awareness of this issue was clearly demonstrated by Pliny in his Naturalis Historia, including Cerussa in the list of pigments that are not suitable for wet-on-wet applications [3] (pp. 297–299).
Other plausible degradation processes are the temperature-related ones [55,56]. Under standard conditions, thermal decomposition of lead oxides results in a progressive reduction of lead that is associated to a decrease in oxygen content. Such processes occur in the temperature range 330–570 °C, with the first conversion of plattnerite into minium through a series of stoichiometry intermediates, at temperatures around 375 °C, and the subsequent conversion of minium into the reduced forms, either into the low-temperature polymorph litharge stable at heating up to 490–540 °C or the high-temperature massicot. Furthermore, the transformation of lead monoxide into minium can be thermally induced both through oxidative heating of litharge at temperatures higher than 450 °C and through reverse oxidation of massicot at very slow cooling below 450 °C after the thermal decomposition of lead dioxide. Finally, the thermal decomposition of lead carbonates, both anhydrous (cerussite; PbCO3) and hydrated (hydrocerussite), starts at temperatures below 300 °C with the formation of distorted forms of α-PbO and subsequent conversion into the most stable lead monoxide polymorphs. All these transformation processes are widely within the temperature ranges that would have been subjected to the painted plasters of the House of the Bicentenary when struck by the pyroclastic surge of Mount Vesuvius eruption. Therefore, they may have concurred, together with the goethite to hematite transformation, to the yellow to the red transition of several portions of the monochromes. Nevertheless, they would still not justify the total absence of crystalline lead compounds and the low aliquots of lead detected in several areas of the wall.
Another less known alteration phenomenon involving lead oxide-based pigments is their whitening/bleaching [57,58]. This essentially consists of solution-mediated carbonation and sulfatation processes of lead oxides, preceded for minium by a stage of photochemical reduction of Pb(IV) to Pb(II), causing a progressive discoloration of the chromophore phases after transformation into colorless compounds. As for lime-based mural paintings, carbonation occurs after progressive uptake of atmospheric CO2 in pore solution, both in concomitance and after binder reaction, with the formation of hydrocerussite through the metastable carbonate-deficient compound plumbonacrite (3PbCO3·Pb(OH)2·PbO). In the same way, sulfatation could occur with the formation of anglesite (PbSO4) in the presence of sulfate-rich pore solutions. It is plausible to hypothesize a strong influence of both processes in the alteration of the analyzed plasters, which were subjected before and after burial to abundant percolation of carbonate and sulfate-rich solutions related to coastal proximity, deposits from the eruption of Mount Vesuvius, and post-excavation pollution factors, as demonstrated by the abundant occurrence of secondary gypsum in the Herculaneum wall paintings. Furthermore, given the net solubility increase of lead-based compounds after transformation from oxides to carbonates [53] and/or sulfates [59], especially in the typical pH/Eh conditions and pore solutions chemical composition of lime-based plasters, it is plausible to hypothesize a progressive dissolution and leaching of the alteration products during burial conditions.
Such transformation processes would justify both the absence of crystalline lead-bearing phases and the lead depletion in the paint layer matrices of the tablinum, with partial percolation of the element in the uppermost portions of the finishing plasters and preferential re-adsorption of the free ions by the compounds with a higher chemical affinity toward the heavy metal, such as iron oxo-hydroxides. Furthermore, this hypothesis would be consistent with the higher Pb fractions found in the sample from the upper west register, less affected by collapses during eruption and alteration processes during burial and post-burial phases with respect to the analyzed counterpart in the east wall.

6. Conclusions

The analytical campaign on the painted surfaces in the tablinum of the House of Bicentenary made it possible to answer the main archaeometric questions formulated at the beginning of the study, namely, (a) to determine the original decorative scheme of the red and yellow-painted backgrounds of the tablinum, heated by the pyroclastic surge of the eruption, and (b) to characterize the compositional and textural characteristics of the painted plaster sequences, determining the nature of the ochre-based pigments used for the fresco-painted monochrome backgrounds.
As for the first question, the results obtained made it possible to reconstruct the original color scheme of the monochrome backgrounds, heavily perturbed by chromatic transformations during and following the eruption. This was achieved by applying a chemical discrimination methodology based on the determination of As and Pb levels through p-XRF. Furthermore, it has been proven that observations of hematite crystal size through Rietveld refinement on XRPD data constitutes a reliable mineralogical parameter to distinguish between natural hematite and hematite thermally transformed from goethite by the heat of the pyroclastic surge. These results show that the decorative scheme in this room, and potentially many other decorative schemes in the Vesuvian region, were markedly different than they appear today, with the popular “Pompeiian red,” in some cases, actually being yellow.
As for the characterization of the painted plaster sequences, the experimental results demonstrated marked differences in the quality of the preparations, showing greater care in the execution of the panels in the lower registers both in terms of applied materials and manufacturing techniques. This is coherent with the higher visibility and artistic value of these portions of the walls, confirming once more a structured organization of work by Roman artisans, respectful of both aesthetic and economic factors. As for the pigment mixtures applied, the analytical results indicated that the ochre-based pigments constituting the main raw materials for the execution of the famous Roman monochrome backgrounds were available in different grades of quality, which were mainly related to their fineness. Such differentiation must have been obtained through post-treatment processes such as decantation and comminution of raw materials possibly related to common extraction sources if considering opal-CT a valid mineralogical tracer not related to modern superficial restoration treatments. Furthermore, they may not have been applied pure, but rather mixed with a variety of additives to enhance specific properties of the painted surfaces, potentially varying from those reported in Roman technical treaties. If some of these additions have already been reported in the literature, such as the combined utilization of ochre and carbon black, other hypothesized treatments constitute a novelty in this field of archaeometric research, such as the superficial addition of talc.
The widespread use of additives and pigment mixtures in Roman painting techniques leads to alternative routes of interpretation of the observed heavy metal chemical zoning in the different registers of the tablinum. While the presence of As in the original red of the side panels could be related to the original chemical profile of the red ochre, considering both the low level of depuration of ancient pigments compared to modern, more highly refined pigment manufacturing processes, and the higher sorption affinity of hematite to the element, the Pb levels seen in the upper register appear to be higher than expected for trace contaminations in the lateritic sediments. One hypothesis is that lower-quality ochres were mixed with lead oxide-based pigments to compensate for the lower-quality and/or perhaps to correct or enhance the hue. The availability of hybrid mixes obtained by calcination of red ochre with lead white was reported in the Roman world, in the description of the Sandyx and Syricum pigments in Pliny’s Naturalis Historia, but there are no written sources reporting the practice of correcting the color hue of ochres during the execution of fresco decorations by the express addition of lead oxide pigments, either minium, litharge, or massicot, so this hypothesis would constitute a novel finding in the definition of Roman painting technology. Similarly, the addition of lead white during the execution of fresco decorations as a whitening agent to compensate for the poor chromatic aspect of lower-quality finishing plasters has not been recorded, and Pliny stated that it should not be used in fresco applications due to its instability with lime-based plasters, so this hypothesis would indicate the flexibility of Roman artisans in following the indications of the technical treatises in common decorative practice.
Given the low detected fractions of Pb in most of the analyzed samples and the total absence of crystalline lead oxides, it was not possible to confirm these hypotheses, particularly given the well-known instability of lead pigments in mural paintings, further exacerbated by the marked deterioration processes that affected the tablinum since the 79 AD eruption of Mount Vesuvius. Therefore, the presence of Pb detected in the wall paintings of the tablinum of the House of the Bicentenary raises more questions than answers at this point. Further research in the field, through comparisons with other case studies and analysis of Roman pigment samples is warranted to shed further light on this relevant archaeometric question.
As a concluding remark, the phased multi-scale and multi-analytical approach adopted, starting with non-destructive tests onsite and complemented by detailed laboratory investigations on a limited number of samples to preserve the high cultural value of the analyzed context, made it possible to overcome intrinsic difficulties of interpretation related to the varying information obtained through single analytical techniques, leading to a comprehensive and integrated interpretation of the archaeometric issues.

Supplementary Materials

The following are available online at https://0-www-mdpi-com.brum.beds.ac.uk/2075-163X/11/1/67/s1, Table S1. Results of the p-XRF analyses on selected points of monochrome backgrounds. The adjusted peak area values for the measured elements obtained through fundamental parameters fitting of the spectroscopic data are reported, together with the calculated As:Fe and Pb:Fe ratios; Table S2. Results of the quantitative chemical analyses by EMP-WDS on the selected samples; Table S3. Mean chemical composition and related standard deviations of finishing plasters, paint layers, and pigment lumps (when available) of the samples analyzed through EMP-WDS; Table S4. Results of the p-XRF analyses on a selection of ten modern ochre and sienna pigments supplied by Kremer Pigmente. The adjusted peak area values for the measured elements obtained through fundamental parameters fitting of the spectroscopic data are reported, together with the calculated As:Fe and Pb:Fe ratios.

Author Contributions

Conceptualization, M.S., L.R., G.A., and F.P.; methodology, M.S., L.R., K.G., A.H., and I.A.; validation, L.R., G.A., and F.P.; formal analysis, M.S., K.G., A.H., and I.A.; investigation, M.S., L.R., K.G., G.A., and F.P.; resources, L.R., K.G., and F.P.; data curation, M.S., K.G., A.H., and I.A.; writing—original draft preparation, M.S., L.R., K.G., and A.H.; writing—review and editing, all authors; visualization, M.S., L.R., K.G., and A.H.; supervision, L.R., G.A., and F.P.; project administration, L.R. and K.G.; funding acquisition, L.R. and G.A. All authors have read and agreed to the published version of the manuscript.

Funding

This research received no external funding.

Institutional Review Board Statement

Not applicable.

Informed Consent Statement

Not applicable.

Data Availability Statement

The data presented in this study are available in www.mdpi.com/xxx/s1.

Acknowledgments

The analytical campaign of the present study was performed in the framework of the conservation of the architectural surfaces in the tablinum of the House of the Bicentenary, a collaborative project of the Getty Conservation Institute (GCI), the Herculaneum Conservation Project (HCP), and the Parco Archeologico di Ercolano (PA-ERCO). All these institutions are gratefully acknowledged for providing samples and technical expertise during the execution of the analytical activities. Support by Mapei S.p.A. in the framework of the Mapei-UNIPD research agreement is acknowledged. The technical staff at the Department of Geosciences of the University of Padova and at the Getty Conservation Institute is thanked for its analytical support. Niccolò Tommaso Michieli is gratefully acknowledged for the execution of the SEM-EDS mapping.

Conflicts of Interest

The authors declare no conflict of interest.

References

  1. Watson, E.L. The ancients knew their paints. Artifact 1969, 7, 1–6. [Google Scholar]
  2. Eastaugh, N.; Walsh, V.; Chaplin, T.; Siddal, R. Pigment Compendium: A Dictionary and Optical Microscopy of Historical Pigments; Butterworth-Heinemann: Oxford, UK, 2008. [Google Scholar]
  3. Rackham, M.A.H. Pliny Natural History; Harvard University Press: Cambridge, MA, USA; William Heinemann Ltd.: London, UK, 1938; Available online: http://archive.org/details/naturalhistory09plinuoft (accessed on 28 February 2020).
  4. Pollio, V.M. De Architectura; Gros, P.; Corso, A.; Romano, E., Translators; Giulio Einaudi Editore: Torino, Italy, 1997. [Google Scholar]
  5. Bearat, H. Quelle est la gamme exacte des pigments Romains? Confrontation des resultats d’analyse et des textes de Vitruve et de Pline. In Roman Wall Painting: Materials, Techniques, Analysis and Conservation. Proceedings of the International Workshop, Fribourg, Switzerland, 7–9 March 1996; Bearat, H., Fuchs, M., Maggetti, M., Paunier, D., Eds.; Fribourg Institute of Mineralogy and Petrography: Fribourg, Switzerland, 1997; pp. 11–34. [Google Scholar]
  6. Pomiès, M.; Morin, G.; Vignaud, C. XRD study of the goethite-hematite transformation: Application to the identification of heated prehistoric pigments. Eur. J. Solid State Inorg. Chem. 1998, 35, 9–25. [Google Scholar] [CrossRef]
  7. Gualtieri, A.F.; Venturelli, P. In situ study of the goethite-hematite phase transformation by real time synchrotron powder diffraction. Am. Miner. 1999, 84, 895–904. [Google Scholar] [CrossRef]
  8. Wolska, E.; Schwertmann, U. Nonstoichiometric structures during dehydroxylation of goethite. Z. Kristallogr. 1989, 189, 223–237. [Google Scholar]
  9. Gurioli, L.; Houghton, B.F.; Cashman, K.V.; Cioni, R. Complex changes in eruption dynamics during the 79 AD eruption of Vesuvius. Bull. Volcanol. 2004, 67, 144–159. [Google Scholar] [CrossRef]
  10. Pomiès, M.; Menu, M.; Vignaud, C. Tem observations of goethite dehydration: Application to archaeological samples. J. Eur. Ceram. Soc. 1999, 19, 1605–1614. [Google Scholar] [CrossRef]
  11. Gonzalez, G.; Sagarzazu, A.; Villalba, R. Study of the mechano-chemical transformation of goethite to hematite by TEM and XRD. Mater. Res. Bull. 2000, 35, 2295–2308. [Google Scholar] [CrossRef]
  12. Gialanella, S.; Girardi, F.; Ischia, G.; Lonardelli, I.; Mattarelli, M.; Montagna, M. On the goethite to hematite phase transformation. J. Therm. Anal. Calorim. 2010, 102, 867–873. [Google Scholar] [CrossRef]
  13. Knuutinen, U.; Mannerheimo, H.; Hornytzkyj, S. Project Report of Pigment Analyses of the Fourth Style Wall Paintings in the Casa di Marco Lucrezio (IX 3, 5.24) in Pompeii; EVTEK University of Applied Sciences: Helsinki, Finland, 2007. [Google Scholar]
  14. Marcaida, I.; Maguregui, M.; De Vallejuelo, S.F.-O.; Morillas, H.; Prieto-Taboada, N.; Veneranda, M.; Castro, K.; Madariaga, J.M. In situ X-ray fluorescence-based method to differentiate among red ochre pigments and yellow ochre pigments thermally transformed to red pigments of wall paintings from Pompeii. Anal. Bioanal. Chem. 2017, 409, 3853–3860. [Google Scholar] [CrossRef]
  15. Baraldi, P.; Bonazzi, A.; Giordani, N.; Paccagnella, F.; Zannini, P. Analytical Characterization of Roman Plasters of the ‘Domus Farini’ in Modena*. Archaeometry 2006, 48, 481–499. [Google Scholar] [CrossRef]
  16. Wallace-Hadrill, A. Herculaneum: Past and Future; Frances Lincoln Ltd.: London, UK, 2012. [Google Scholar]
  17. Maiuri, A. Ercolano: I Nuovi Scavi (1927–1958); Istituto Poligrafico dello Stato: Roma, Italy, 1985. [Google Scholar]
  18. Rainer, L.; Graves, K.; Maekawa, S.; Gittins, M.; Piqué, F. Conservation of the Architectural Surfaces in the Tablinum of the House of the Bicentenary, Herculaneum. Phase I: Examination, Investigations, and Condition Assessment; The Getty Conservation Institute: Los Angeles, CA, USA, 2017. [Google Scholar]
  19. Piovesan, R. Archaeometrical Investigations on Mortars and Paintings at Pompeii and Experiments for the Determination of the Painting Technique. Ph.D. Thesis, University of Padova, Padova, Italy, 2009. [Google Scholar]
  20. Piovesan, R.; Mazzoli, C.; Maritan, L.; Cornale, P. Fresco and lime-paint: An experimental study and objective criteria for distinguishing between these painting techniques. Archaeometry 2012, 54, 723–736. [Google Scholar] [CrossRef]
  21. Solé, V.; Papillon, E.; Cotte, M.; Walter, P.; Susini, J. A multiplatform code for the analysis of energy-dispersive X-ray fluorescence spectra. Spectrochim. Acta Part B At. Spectrosc. 2007, 62, 63–68. [Google Scholar] [CrossRef]
  22. Angelini, I.; Asscher, Y.; Secco, M.; Parisatto, M.; Artioli, G. The pigments of the frigidarium in the Sarno Baths, Pompeii: Identification, stratigraphy and weathering. J. Cult. Herit. 2019, 40, 309–316. [Google Scholar] [CrossRef]
  23. Rietveld, H.M. A profile refinement method for nuclear and magnetic structures. J. Appl. Crystallogr. 1969, 2, 65–71. [Google Scholar] [CrossRef]
  24. Dollase, W.A. Correction of intensities for preferred orientation in powder diffractometry: Application of the March model. J. Appl. Crystallogr. 1986, 19, 267–272. [Google Scholar] [CrossRef]
  25. Lafuente, B.; Downs, R.T.; Yang, H.; Stone, N. The power of databases: The RRUFF project. In Highlights in Mineralogical Crystallography; Armbruster, T., Danisi, R.M., Eds.; De Gruyter: Berlin, Germany, 2015; pp. 1–30. [Google Scholar]
  26. Schneider, C.A.; Rasband, W.S.; Eliceiri, K.W. NIH Image to ImageJ: 25 years of image analysis. Nat. Methods 2012, 9, 671–675. [Google Scholar] [CrossRef]
  27. Pouchou, J.L.; Pichoir, F. Microbeam Analysis; San Francisco Press: San Francisco, CA, USA, 1985. [Google Scholar]
  28. Berridge, C.A. Room Temperature Curing Organo Polysiloxane. US Patent 2,843,555, 15 July 1958. [Google Scholar]
  29. Popelka-Filcoff, R.S.; Robertson, J.D.; Glascock, M.D.; Descantes, C. Trace element characterization of ochre from geological sources. J. Radioanal. Nucl. Chem. 2007, 272, 17–27. [Google Scholar] [CrossRef]
  30. Macdonald, B.L.; Hancock, R.G.V.; Cannon, A.J.; McNeill, F.; Reimer, R.; Pidruczny, A. Elemental Analysis of Ochre Outcrops in Southern British Columbia, Canada. Archaeometry 2013, 55, 1020–1033. [Google Scholar] [CrossRef]
  31. Melander, J.M.; Lauersdorf, L.R. Masonry: Design and Construction, Problems and Repair; ASTM International: Philadelphia, PA, USA, 1993. [Google Scholar]
  32. Matteini, M. Inorganic treatments for the consolidation and protection of stone artefacts and mural paintings. Conserv. Sci. Cult. Herit. 2008, 8, 13–27. [Google Scholar]
  33. Perdikatsis, V.; Brecoulaki, H. The use of red and yellow ochres as painting materials in ancient Macedonia. In Proceedings of the 4th Symposium of the Hellenic Society for Archaeometry, Athens, Greek, 28–31 May 2003; Facorellis, Y., Zacharias, N., Polikreti, K., Eds.; BAR International Series 1746; British Archaeological Reports: Oxford, UK, 2008; pp. 559–567. [Google Scholar]
  34. Brecoulaki, H.; Sotiropoulou, S.; Perdikatsis, V.; Lluveras-Tenorio, A.; Bonaduce, I.; Colombini, M.P. A technological investigation of the painting materials. In The Wall Paintings of the West House at Mycenae; Tournavitou, I., Ed.; Appendix A; INSTAP Academic Press: Philadelphia, PA, USA, 2017; pp. 147–158. [Google Scholar]
  35. Wilson, M. The structure of opal-CT revisited. J. Non Cryst. Solids 2014, 405, 68–75. [Google Scholar] [CrossRef]
  36. Wang, Y.; Alsmeyer, D.C.; McCreery, R.L. Raman spectroscopy of carbon materials: Structural basis of observed spectra. Chem. Mater. 1990, 2, 557–563. [Google Scholar] [CrossRef]
  37. Boynton, R.S. Chemistry and Technology of Lime and Limestone; John Wiley and Sons: New York, NY, USA, 1966. [Google Scholar]
  38. Griffin, R.A.; Au, A.K. Lead Adsorption by Montmorillonite Using A Competitive Langmuir Equation. Soil Sci. Soc. Am. J. 1977, 41, 880–882. [Google Scholar] [CrossRef]
  39. Hizal, J.; Apak, R. Modeling of copper(II) and lead(II) adsorption on kaolinite-based clay minerals individually and in the presence of humic acid. J. Colloid Interface Sci. 2006, 295, 1–13. [Google Scholar] [CrossRef] [PubMed]
  40. Ainsworth, C.C.; Gassman, P.L.; Pilon, J.L.; Van Der Sluys, W.G. Cobalt, Cadmium, and Lead Sorption to Hydrous Iron Oxide: Residence Time Effect. Soil Sci. Soc. Am. J. 1994, 58, 1615–1623. [Google Scholar] [CrossRef]
  41. Dong, D.; Zhao, X.; Hua, X.; Zhang, J.; Wu, S. Lead and Cadmium Adsorption onto Iron Oxides and Manganese Oxides in the Natural Surface Coatings Collected on Natural Substances in the Songhua River of China. Chem. Res. Chin. Univ. 2007, 23, 659–664. [Google Scholar] [CrossRef]
  42. Popelka-Filcoff, R.S. Applications of Elemental Analysis for Archaeometric Studies: Analytical and Statistical Methods for Understanding Geochemical Trends in Ceramics, Ochre and Obsidian. Ph.D. Thesis, University of Missouri Libraries, Columbia, MO, USA, 2018. [Google Scholar]
  43. Montagner, C.; Sanches, D.; Pedroso, J.; Melo, M.J.; Vilarigues, M. Ochres and earths: Matrix and chromophores characterization of 19th and 20th century artist materials. Spectrochim. Acta Part A Mol. Biomol. Spectrosc. 2013, 103, 409–416. [Google Scholar] [CrossRef]
  44. Dayet, L.; Le Bourdonnec, F.-X.; Daniel, F.; Porraz, G.; Texier, P.-J. Ochre Provenance and Procurement Strategies During The Middle Stone Age at Diepkloof Rock Shelter, South Africa. Archaeometry 2015, 58, 807–829. [Google Scholar] [CrossRef]
  45. Sandrolini, F.; Franzoni, E.; Pigino, B. Ethyl silicate for surface treatment of concrete—Part I: Pozzolanic effect of ethyl silicate. Cem. Concr. Compos. 2012, 34, 306–312. [Google Scholar] [CrossRef]
  46. Taylor, G.; Eggleton, R.A. Regolith Geology and Geomorphology; John Wiley and Sons: Chichester, UK, 2001. [Google Scholar]
  47. Dubiel, S.; Cieslak, J.; Tarasiuk, J.; Nizioł, J. Relationship between the colour of ochre from Roussillon and the content of iron-bearing minerals. Appl. Clay Sci. 2011, 51, 54–60. [Google Scholar] [CrossRef]
  48. Giménez, J.; Martínez, M.; De Pablo, J.; Rovira, M.; Duro, L. Arsenic sorption onto natural hematite, magnetite, and goethite. J. Hazard. Mater. 2007, 141, 575–580. [Google Scholar] [CrossRef]
  49. Mamindy-Pajany, Y.; Hurel, C.; Marmier, N.; Roméo, M. Arsenic adsorption onto hematite and goethite. C. R. Chim. 2009, 12, 876–881. [Google Scholar] [CrossRef]
  50. Douma, M. Pigments through the Ages. 2008. Available online: http://www.webexhibits.org/pigments (accessed on 28 February 2020).
  51. Aze, S.; Vallet, J.-M.; Detalle, V.; Grauby, O.; Baronnet, A. Chromatic alterations of red lead pigments in artworks: A review. Phase Transit. 2008, 81, 145–154. [Google Scholar] [CrossRef]
  52. Giovannoni, S.; Matteini, M.; Moles, A. Studies and developments concerning the problem of altered lead pigments in wall painting. Stud. Conserv. 1990, 35, 21–25. [Google Scholar]
  53. Noel, J.D.; Wang, Y.; Giammar, D.E. Effect of water chemistry on the dissolution rate of the lead corrosion product hydrocerussite. Water Res. 2014, 54, 237–246. [Google Scholar] [CrossRef]
  54. Khramchenkova, R.; Ionescu, C.; Sitdikov, A.; Kaplan, P.; Gál, Á.; Gareev, B. A pXRF In Situ Study of 16th–17th Century Fresco Paints from Sviyazhsk (Tatarstan Republic, Russian Federation). Minerals 2019, 9, 114. [Google Scholar] [CrossRef] [Green Version]
  55. Burgio, L.; Clark, R.J.; Firth, S. Raman spectroscopy as a means for the identification of plattnerite (PbO2), of lead pigments and of their degradation products. Analyst 2001, 126, 222–227. [Google Scholar] [CrossRef]
  56. Gavrichev, K.S.; Bolshakov, A.; Kondakov, D.; Khoroshilov, A.; Denisov, S. Thermal transformations of lead oxides. J. Therm. Anal. Calorim. 2008, 92, 857–863. [Google Scholar] [CrossRef]
  57. Aze, S.; Vallet, J.-M.; Baronnet, A.; Grauby, O. The fading of red lead pigment in wall paintings: Tracking the physico-chemical transformations by means of complementary micro-analysis techniques. Eur. J. Miner. 2006, 18, 835–843. [Google Scholar] [CrossRef]
  58. Vanmeert, F.; Van Der Snickt, G.; Janssens, K. Plumbonacrite Identified by X-ray Powder Diffraction Tomography as a Missing Link during Degradation of Red Lead in a Van Gogh Painting. Angew. Chem. 2015, 127, 3678–3681. [Google Scholar] [CrossRef] [Green Version]
  59. Calmano, W.; Mangold, S.; Stichnothe, H.; Thöming, J. Clean-Up and Assessment of Metal Contaminated Soils. In Treatment of Contaminated Soil; Stegmann, R., Brunner, G., Calmano, W., Matz, G., Eds.; Springer Science and Business Media LLC: Berlin, Germany, 2001; pp. 471–490. [Google Scholar]
Figure 1. (a) Exterior of the House of the Bicentenary (Photo: Scott Warren); (b) View of the tablinum of the House of the Bicentenary (1938–1939) from the atrium at the time of excavation [17].
Minerals 11 00067 g001
Figure 2. Orthophotos of the walls of the tablinum: (a) east wall; (b) south wall; and (c) west wall. The three registers are indicated by green dashed lines. The spots where X-ray fluorescence (p-XRF) analyses on the monochrome backgrounds were performed are indicated by blue numbers. The sampling positions of the analyzed materials are indicated by black labels.
Minerals 11 00067 g002
Figure 3. Results of the microstratigraphic analyses on the Herculaneum samples (all the reported micrographs have been taken in reflected light, crossed polars): (a) sample BCN_59, lime/marble dust aggregate-based finishing plaster; (b) full stratigraphy of the lime/volcanic aggregate-based preparatory plaster sequence (R: uppermost portion of base rough (rinzaffo) plaster; A1, A2, A3: progressively finer (arriccio) plasters placed before the finishing plaster); (c) east base register, paint layer applied directly over the uppermost preparatory plaster; (d) sample BCN_28, the pink-tinted plaster, a macroscopic pigment lump at the base of the pink-tinted plaster and the paint layer are visible; (e) sample BCN_31, the uppermost portion of the finishing plaster and the paint layer are visible.
Minerals 11 00067 g003
Figure 4. Detail of a portion of the east wall of the tablinum, with evident signs of temperature-induced chromatic alteration of the original yellow ochre.
Minerals 11 00067 g004
Figure 5. Scatterplot of Pb:Fe vs. As:Fe in the points of the tablinum walls analyzed by p-XRF, calculated from the adjusted peak area values.
Minerals 11 00067 g005
Figure 6. Representative XRPD patterns of the Herculaneum samples. The main reflexes of the identified minerals are indicated by the following abbreviations: Chl = chlorite, Ms = muscovite, Tlc = talc, Gp = gypsum, Kln = kaolinite, Wed = weddellite, Anl = analcime, Gth = goethite, Op = opal-CT, Ber = bernalite, Arg = aragonite, Qz = quartz, Sa = sanidine, By = bytownite, Cc = calcite, Aug = augite, Dol = dolomite, and Hem = hematite.
Minerals 11 00067 g006
Figure 7. Representative Raman spectra of the Herculaneum samples and relative peaks identifications (compounds abbreviations: Cc = calcite, Gyp = gypsum, Hem = hematite, Goeth = goethite, and C = carbon). (a) BCN_28, pink-tinted plaster, matrix; (b) BCN_28, pink-tinted plaster, pigment lump; (c) BCN_28, yellow pictorial layer, matrix; (d) BCN_28, yellow pictorial layer, pigment lump; (e) BCN_59, red pictorial layer, matrix; (f) BCN_59, red pictorial layer, pigment lump.
Minerals 11 00067 g007
Figure 8. Representative backscattered electron (BSE) images of the Herculaneum samples (interfaces between plasters and paint layers are indicated by dashed lines): (a) BCN_28, upper portion; (b) BCN_28, detail of the paint layer; (c) BCN_W1_03, upper portion; (d) BCN_W1_03, detail of the paint layer; (e) BCN_31, upper portion; (f) BCN_51, detail of the paint layer; (g) BCN_67, upper portion; (h) BCN_67, detail of the paint layer.
Minerals 11 00067 g008
Figure 9. Representative EDS microanalyses of the Herculaneum samples, with the Kα peaks of the recognized elements indicated, apart from Pb, which was identified through the Lα line (magnification of the area of interest is reported in the upper box). (a) BCN_28, paint layer matrix; (b) BCN_28, pigment lump; (c) BCN_W1_03, paint layer matrix; (d) BCN_W1_03, pigment lump; (e) BCN_51, paint layer matrix; (f) BCN_51, pigment lump; (g) BCN_67, paint layer matrix; (h) BCN_67, pigment lump.
Minerals 11 00067 g009
Figure 10. High-resolution EDS mapping on the Herculaneum samples: composite images obtained through RGB convolution of the elaborated elemental maps of lead, iron, and calcium, placed in the R, G, and B channels, respectively. (a) BCN_28; (b) BCN_W1_03; (c) BCN_51; and (d) BCN_67.
Minerals 11 00067 g010
Figure 11. Histograms reporting mean compositional profiles of finishing plasters, paint layers, and pigment lumps (when available) in the samples analyzed through wavelength-dispersive X-ray spectroscopy system (EMP-WDS). Error bars are reporting the 95% confidence interval of the mean. (a) BCN_28; (b) BCN_W1_03; (c) BCN_51; and (d) BCN_67.
Minerals 11 00067 g011
Figure 12. Scatterplots of Fe2O3 vs. PbO concentrations obtained through punctual EMP-WDS measurements on the selected samples: (a) values obtained in the uppermost portions of the finishing plasters; (b) values obtained in the paint layers; (c) values obtained in the pigment lumps.
Minerals 11 00067 g012
Table 1. List of the analyzed samples. Sample labels, location, and visible and hypothesized colors for each sample are reported, together with sample type and applied analytical techniques.
SampleLocationVisible ColorOriginal Color
BCN_28Tablinum, lower east wall, central panelYellowYellow
BCN_31Tablinum, upper east wall, upper registerRedYellow
BCN_51Tablinum, upper east wall, upper registerYellowYellow
BCN_59Tablinum, lower west wall, side panelRedRed
BCN_66Tablinum, upper east wall, upper registerRedYellow
BCN_67Tablinum, upper west wall, upper registerRedYellow
BCN_68Tablinum, lower west wall, central panelRedYellow
BCN_70Tablinum, lower east wall, side panelRedRed
BCN_71Tablinum, upper south wall, upper registerRedYellow
BCN_80Atrium, upper south wallRedYellow
BCN_81Atrium, lower south wallRedRed
BCN_W1_03Tablinum, lower west wall, side panelRedRed
SampleSample TypeAnalytical Techniques
PowderCross SectionXRPD-QPAµ-RamanSEM-EDSEMP-WDS
BCN_28 X XXX
BCN_31XXXXX
BCN_51XXXXXX
BCN_59 X XX
BCN_66X X
BCN_67XXXXXX
BCN_68X X
BCN_70X X
BCN_71X X
BCN_80X X
BCN_81X X
BCN_W1_03 X XXX
Table 2. Results of the mineralogical quantitative phase analysis (expressed as wt.%), obtained by full profile fitting of the experimental X-ray powder diffraction (XRPD) patterns according to the Rietveld method. Chromophore to accessory phases ratios (C:A) of the ochres and values of hematite Lorentzian crystal size obtained through Rietveld refinement are also reported. Abbreviations reported in Figure 6 caption.
SamplePlaster PhasesPigment: Chromophores (C)Pigment: Accessory Phases (A)C:A
CcArgHemGthBerMsKlnChlQz
BCN_3126.52.717.40.02.02.92.60.09.51.3
BCN_5126.02.70.017.51.70.82.91.45.81.8
BCN_6638.30.016.90.02.22.72.40.05.21.9
BCN_6758.00.05.40.00.02.11.00.03.10.9
BCN_6845.51.023.50.00.71.62.90.04.62.6
BCN_7033.58.413.20.00.02.01.41.13.41.7
BCN_7136.80.012.20.01.60.42.00.54.21.9
BCN_8052.70.07.20.00.01.56.30.04.60.6
BCN_8117.90.06.60.00.00.90.50.41.32.1
SampleAlteration PhasesUndeterminedHematite Crystal Size (nm)
DolBySaAugAnlGpWedOpTlc
BCN_314.91.90.96.30.27.07.27.70.317.4
BCN_510.00.75.10.00.026.34.33.61.3-
BCN_660.00.00.00.00.310.210.39.22.317.1
BCN_670.05.50.00.00.016.33.83.41.522.6
BCN_680.00.00.00.00.013.01.93.22.116.5
BCN_702.41.90.73.80.210.17.68.51.662.1
BCN_713.21.32.50.00.315.84.97.76.726.8
BCN_806.80.90.90.00.113.81.82.11.619.7
BCN_810.04.50.00.00.156.85.82.22.975.2
Publisher’s Note: MDPI stays neutral with regard to jurisdictional claims in published maps and institutional affiliations.

