
A Method for Quality Control of Bauxites: Case Study of Brazilian Bauxites Using PLSR on Transmission XRD Data


1
Institute of Technology, Federal University of Pará (PRODERNA/ITEC/UFPA), 66075-110 Belém, Brazil
2
Institute of Geosciences, Federal University of Pará (PPGG/IG/UFPA), 66075-110 Belém, Brazil
*
Author to whom correspondence should be addressed.
Minerals 2021, 11(10), 1054; https://0-doi-org.brum.beds.ac.uk/10.3390/min11101054
Submission received: 26 May 2021
/
Revised: 4 July 2021
/
Accepted: 8 July 2021
/
Published: 28 September 2021
(This article belongs to the Special Issue Value of Mineralogical Monitoring for the Mining and Minerals Industry)
Abstract
:Available Alumina (AvAl2O3) and Reactive Silica (RxSiO2), the main parameters of bauxite controlled in the beneficiation process are traditionally measured by laborious, expensive, and time-consuming wet chemistry methods. Alternative methods based on XRD analysis, capable to provide a reliable estimation of these parameters and valuable mineralogical information of the ore, are being studied. In this work, X-ray diffraction data in transmission mode was used to estimate AvAl2O3 and RxSiO2 from Brazilian bauxites using the Partial Least Square Regression (PLSR) statistical tool. The proposed method comprises a routine of sample classification according to their similarities by Principal Component Analysis (PCA) and K-means, calibration of the PLSR model for each group of samples, grouping new bauxite samples according to the generated clustering model, and subsequent estimation of the parameters AvAl2O3 and RxSiO2 using the PLSR models for these samples. The results showed good accuracy and precision of the models generated for samples of the main ore lithology. The quality and pre-processing of the XRD data required for this method are discussed. The results demonstrated that this method has the potential to be industrially applied to quality control of bauxites as a rapid and automated procedure.
1. Introduction
Bauxite is the main aluminum ore with global resources estimated to be 55–75 billion tons. Brazil holds the 4th largest reserve and produces annually 35 million tons of bauxite, mainly to produce smelter grade alumina [1].
The main aluminum-ore mineral present in Brazilian lateritic bauxite is gibbsite (known as available alumina—AvAl2O3), and therefore, these bauxites are processed in low-temperature digestion (LTD) conditions (100–150 °C) [2,3]. In this context, among the silicon-bearing minerals, only kaolinite is leached in the Bayer process. This gangue mineral is well known in the industry as reactive silica (RxSiO2) since it rapidly and undesirably reacts with the sodium hydroxide solution releasing Na2SiO3 to the pregnant liquor (Equation (1)), which must be precipitated as zeolitic phases known as DSP (desilication product) even during the digestion stage (Equation (2)) [4]. These neoformed products significantly affect the costs of the process, either because they dictate the time and influence the temperature of digestion, but mainly because of the loss of caustic soda, making it, in many cases, economically unfeasible to process bauxites with RxSiO2 > 5% [3,4,5].
In the mineral industry, it is common to have quality control and process parameters based on chemical data instead of mineralogical. It is mainly due to the consolidation and availability of quantitative chemical analysis using wet methods, while methods for mineralogical determination are still under development. In the aluminum industry, it is no different. Quality control of ore in the mine and the Bayer process is done almost exclusively in terms of its chemical composition. Thus, samples from geological research, beneficiation, and Bayer process feedstock are analyzed to determine the content of available alumina (AvAl2O3) and reactive silica (RxSiO2)—traditionally determined by wet chemistry [2,6,7].
Paz et al. [2] report that the RxSiO2 content determined by such methods can be underestimated, depending on the content and the degree of crystallinity of the kaolinite in bauxite, which may change significantly over the bauxite profile. This means that the clay mineral present can be more reactive to the process, despite its concentration [2,8]. Thus, there is no guarantee that simple knowledge of the chemical composition of bauxite will allow efficient control in metallurgical processes [9]. Another downside of traditional methods is that they are time-consuming, demand manpower and space, and involve the handling of dangerous reagents [10,11].
In this context, several methods based on the mineralogical composition of the ore, obtained by X-ray diffraction (XRD) are being developed as an alternative for the process control in the bauxite and alumina industry. These methods are, in general, based on powder XRD data using Rietveld refinement [6,10,11,12,13,14,15,16,17] and multivariate statistics [18,19,20,21]. Feret [13] states that XRD has become a fundamental and irreplaceable tool in the control of raw materials of the aluminum industry. The advent of high-speed XRD detectors have enabled a fast data collection and, consequently, the development of rapid and accurate methods, as they use the whole XRD pattern, reducing the effect of preferred orientation and reflection extinction and even mitigating the inaccuracies due to amorphous content [10,11,13,14,15]. König et al. [10] demonstrated the mineralogical quantification of certified bauxite samples from several countries. Aylmore and Walker [14] and Nong et al. [15] also applied Rietveld-XRD for the quantification of Australian lateritic and Chinese karstic bauxites, respectively. Applications of powder XRD to quantify Brazilian bauxites from Paragominas and Juruti (northern Brazil) were also studied by Angélica et al. [6] and Negrão et al. [16], respectively. Feret and See [17] reported a bauxite analysis by XRD using synchrotron radiation to improve mineralogical quantification.
Principal Component Analysis (PCA) and Partial Least Square Regression (PLSR) are two statistical methods widely used in the chemometric field [22,23,24]. Viscarra Rossel et al. [25,26] demonstrated the use of PLSR from UV-Vis and infrared data to predict various soil properties (such as pH, organic carbon (OC), cation exchange capacity (CEC), etc.) and to determine the composition of mineral-organic mixtures in soils, while PCA was used to compare the synthetic mixtures with respective soils. Olatunde [27] reported excellent results using PLSR on infrared data to estimate the extractible total petroleum hydrocarbon (ETPH) in soils. The author highlights the accuracy and rapidness of this method. PLSR was also used on Energy dispersive X-ray fluorescence (EDXRF) data to predict some soil parameters (CEC, sum of exchangeable bases (SB), and base saturation percentage (BSP)) [28]. From XRD data, König et al. [29] demonstrated the utilization of PLSR for quality control of iron ore sinter as a reliable, easy and rapid method in contrast to wet chemistry.
Melo et al. [19,20] developed a methodology using PLSR on XRD data (reflection geometry), applied to estimate the bauxite quality control parameters. The authors reported that the estimation of AvAl2O3 and RxSiO2 obtained were in good agreement with the reference and within the acceptable limits of precision (<1.0–1.5% and <0.5%, respectively) [30]. However, it was observed that in samples of marginal ore lithologies with higher kaolinite content and degree of crystallinity (low defects kaolinite), the method does not meet the precision limits, probably due to the preferred orientation effect from manual sample preparation. To overcome this issue, this study aimed to use XRD data in transmission mode following a methodology similar to that of Melo et al. [19] applied to Brazilian gibbsitic bauxites. It is worth mentioning that the proposed method has several advantages over the traditional methods: rapidness, can be completely automated, no chemical reagents are required, and the ore mineralogy can also be monitored providing relevant information to the process.
2. Materials and Methods
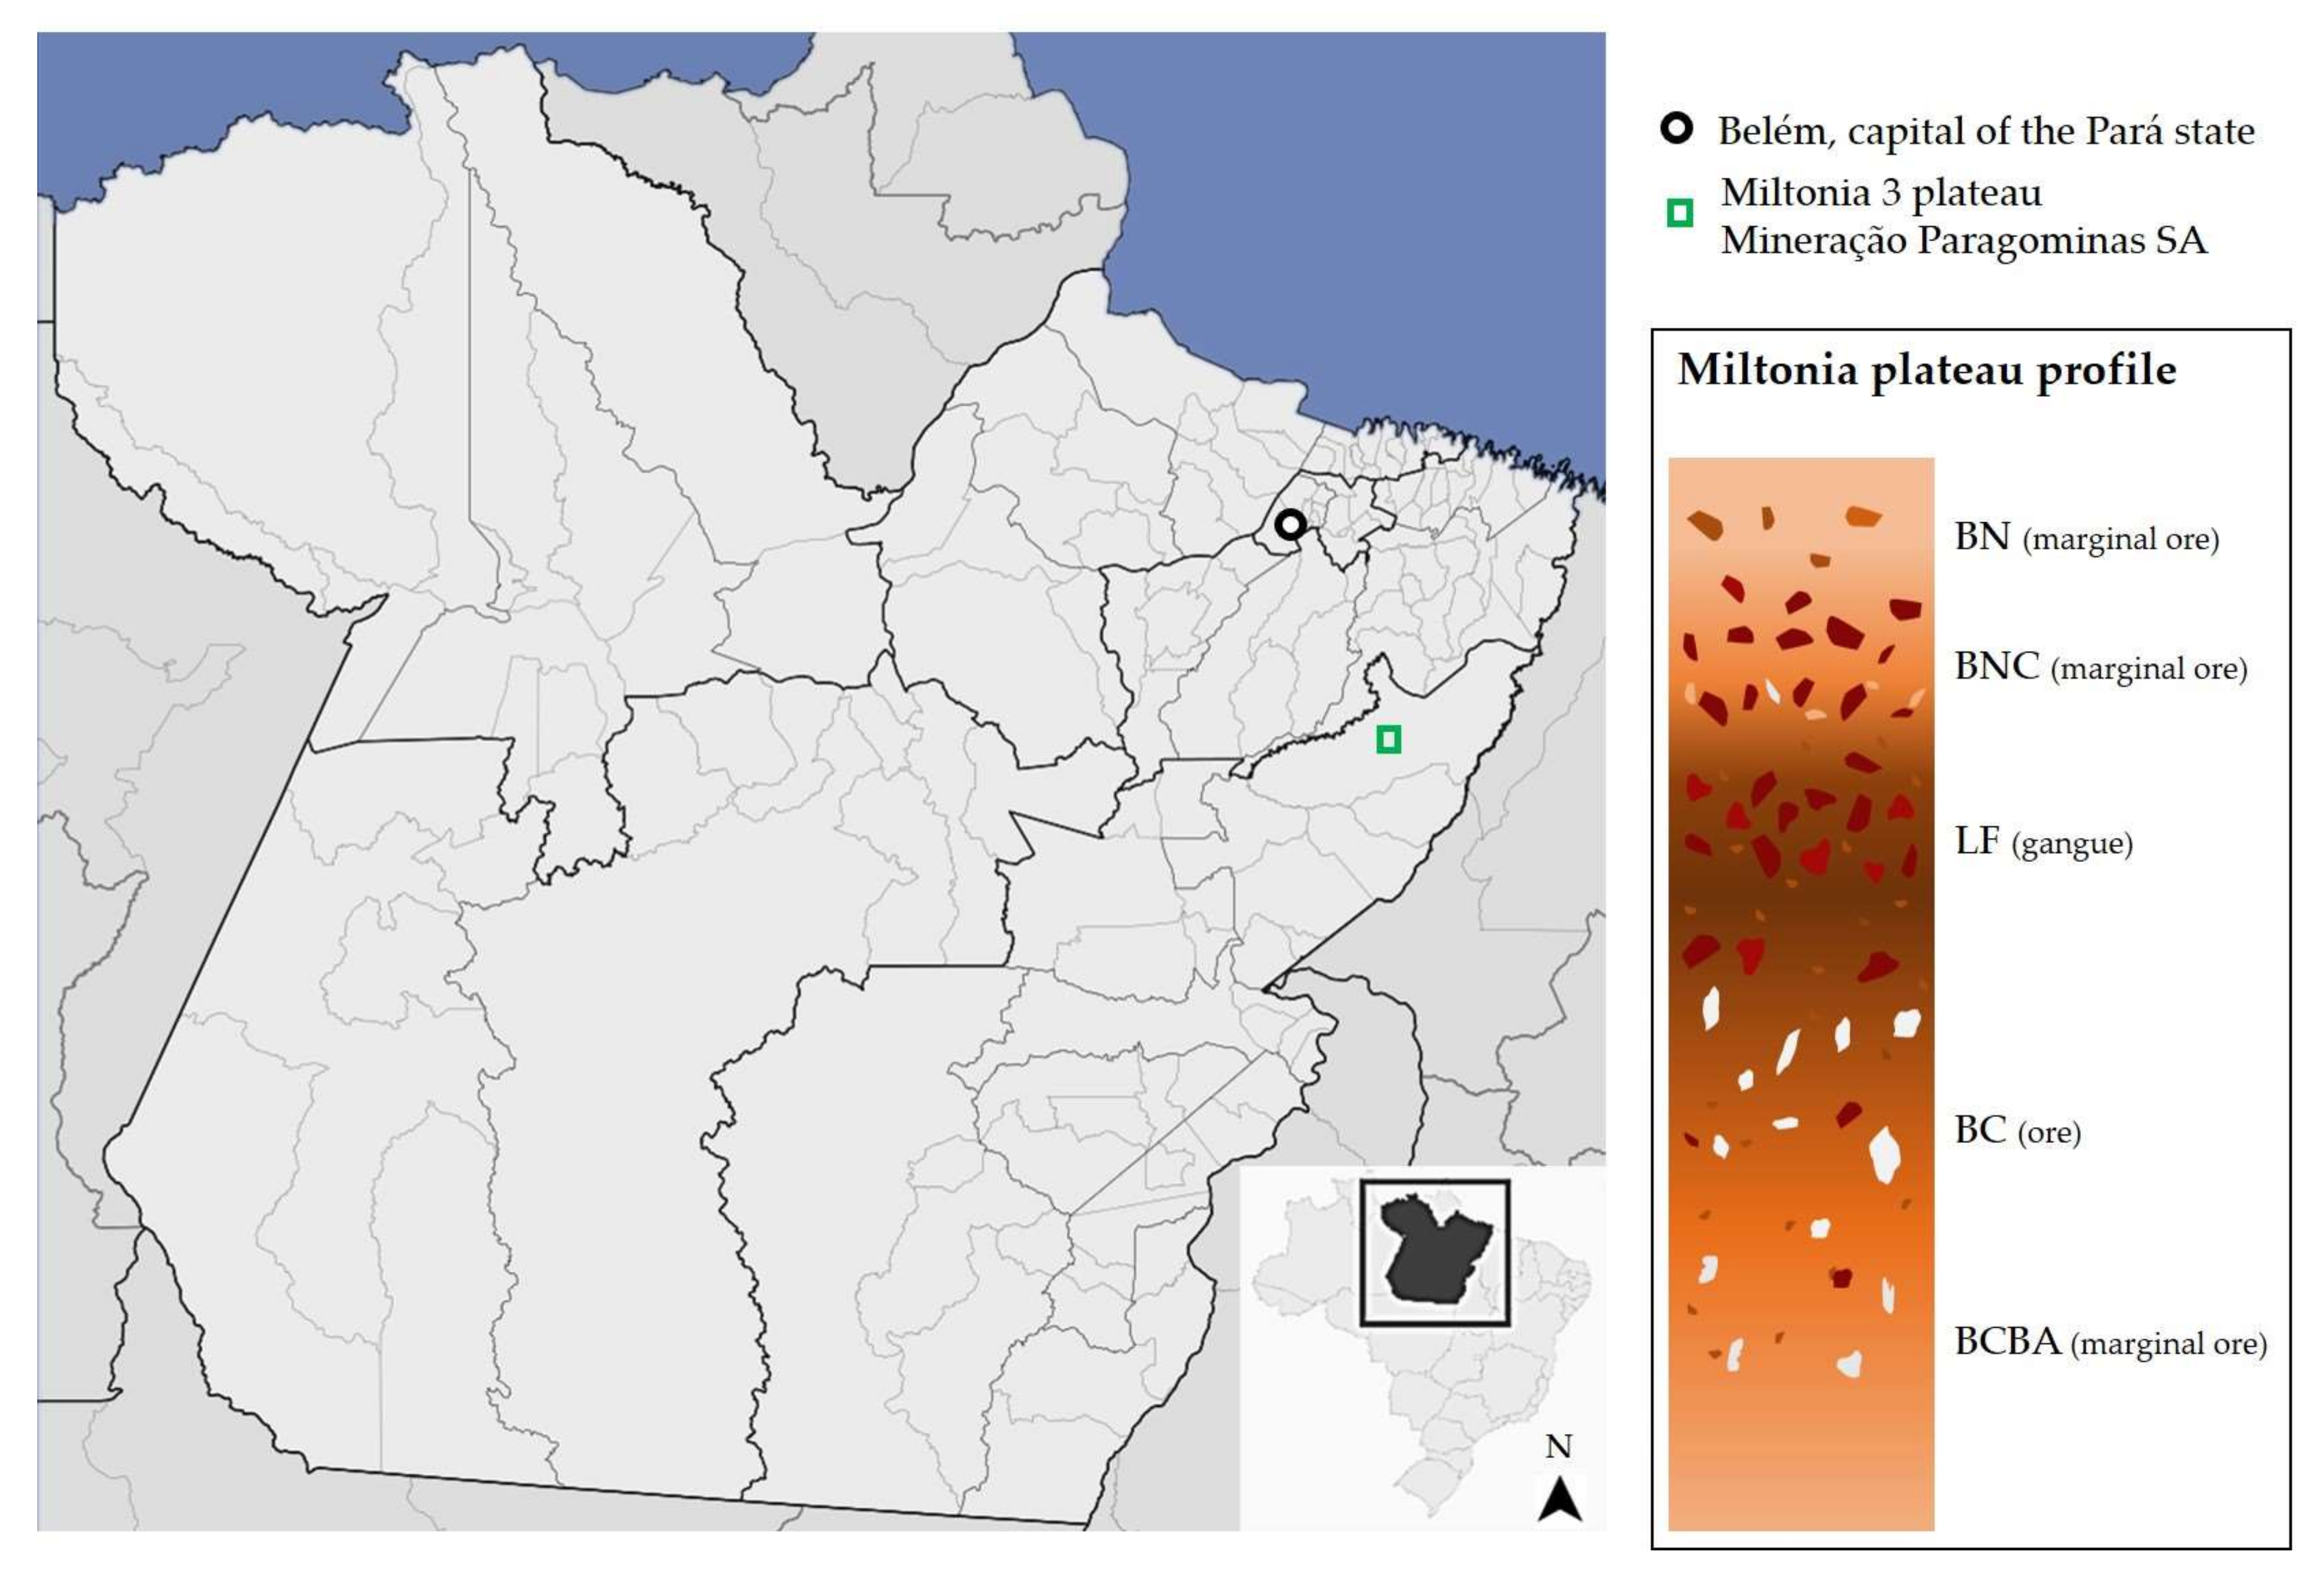
The bauxite samples were provided by Mineração Paragominas SA (Norsk Hydro) and correspond to a drilling campaign on the Miltonia 3 plateau, Pará state, northern Brazil [31]. In this study, 105 samples were used, corresponding to four lithologies: Nodular Bauxite (BN), Nodular-Crystalized Bauxite (BNC), Crystalized Bauxite (BC), and Crystalized-Amorphous Bauxite (BCBA). Details of this lithological profile and sample preparation can be found in Silva et al. [32] and Melo et al. [19]. Figure 1 depicts a schematic representation of the Miltonia location and geological profile.
The powder XRD data were collected using a diffractometer (Empyrean, Panalytical, Almelo, The Netherlands), Co X-ray tube (Kα1 = 1.789 Å), Fe Kβ filter, and PIXel3D 2 × 2 area detector (linear scanning mode) with an active length of 3.3473° 2θ (255 channels). The following conditions of data collection were used: Transmission mode; 40 kV and 35 mA; soller slit of 0.04 rad; fixed divergent and anti-scattering slits of 1/8°; 0.066° 2θ step-size; 22.96 s of time/step and scanning range from 5° to 70° 2θ. The step-size was defined based on Melo et al.’s [14] optimization conditions. Diffractograms were evaluated using the software HighScore Plus 4.8 (Panalytical, Almelo, The Netherlands).
Each sample was assembled in the sample holder and analyzed in duplicate by XRD. To perform the PCA, K-means and PLSR analyses, XRD data were used as dataset. Thus, all diffractograms are organized as an m × n matrix, where m (rows) are the bauxite samples and n (columns) are the intensity count value for each °2θ step of the XRD measurement for the respective sample. Here, the complete XRD pattern is taken as dependent variables, resulting in 984 features for modeling [19].
PCA was carried out to identify possible outliers and samples with mineralogical similarity; and K-means clustering algorithm (with k = 3, considering Euclidean distance measure) was used to group the samples with similarities (the clusters were named as C1, C2, and C3).
The samples classified in each cluster were randomly divided into two subsets: a calibration set (containing ~70% of the samples) and a test set (~30% of the samples). The samples from the calibration set were used to build the PLSR models. This statistical algorithm is particularly suitable for handling multi-collinear data, and an interesting alternative for predicting relevant information Y (obtained from expensive, difficult, or time-consuming measurements—e.g., wet chemistry) from X data (in general, cheap, easy, or fast measurements—e.g., XRD, Fourier Transform Infrared Spectroscopy (FTIR)) [18,22,33]. Thus, in this study, the content of AvAl2O3 and RxSiO2 (from wet chemistry) was predicted by using XRD data.
A “leave-one-out” cross-validation was used to find the best number of factors to include in the models and the Root Mean Square Error of Prediction (RMSEP, Equation (3)), Ratio of Prediction Deviation (RPD, Equation (4)), and Relative Error (RE, Equation (5)) were used to assess the performance of the models.
3. Results and Discussion
3.1. XRD Data
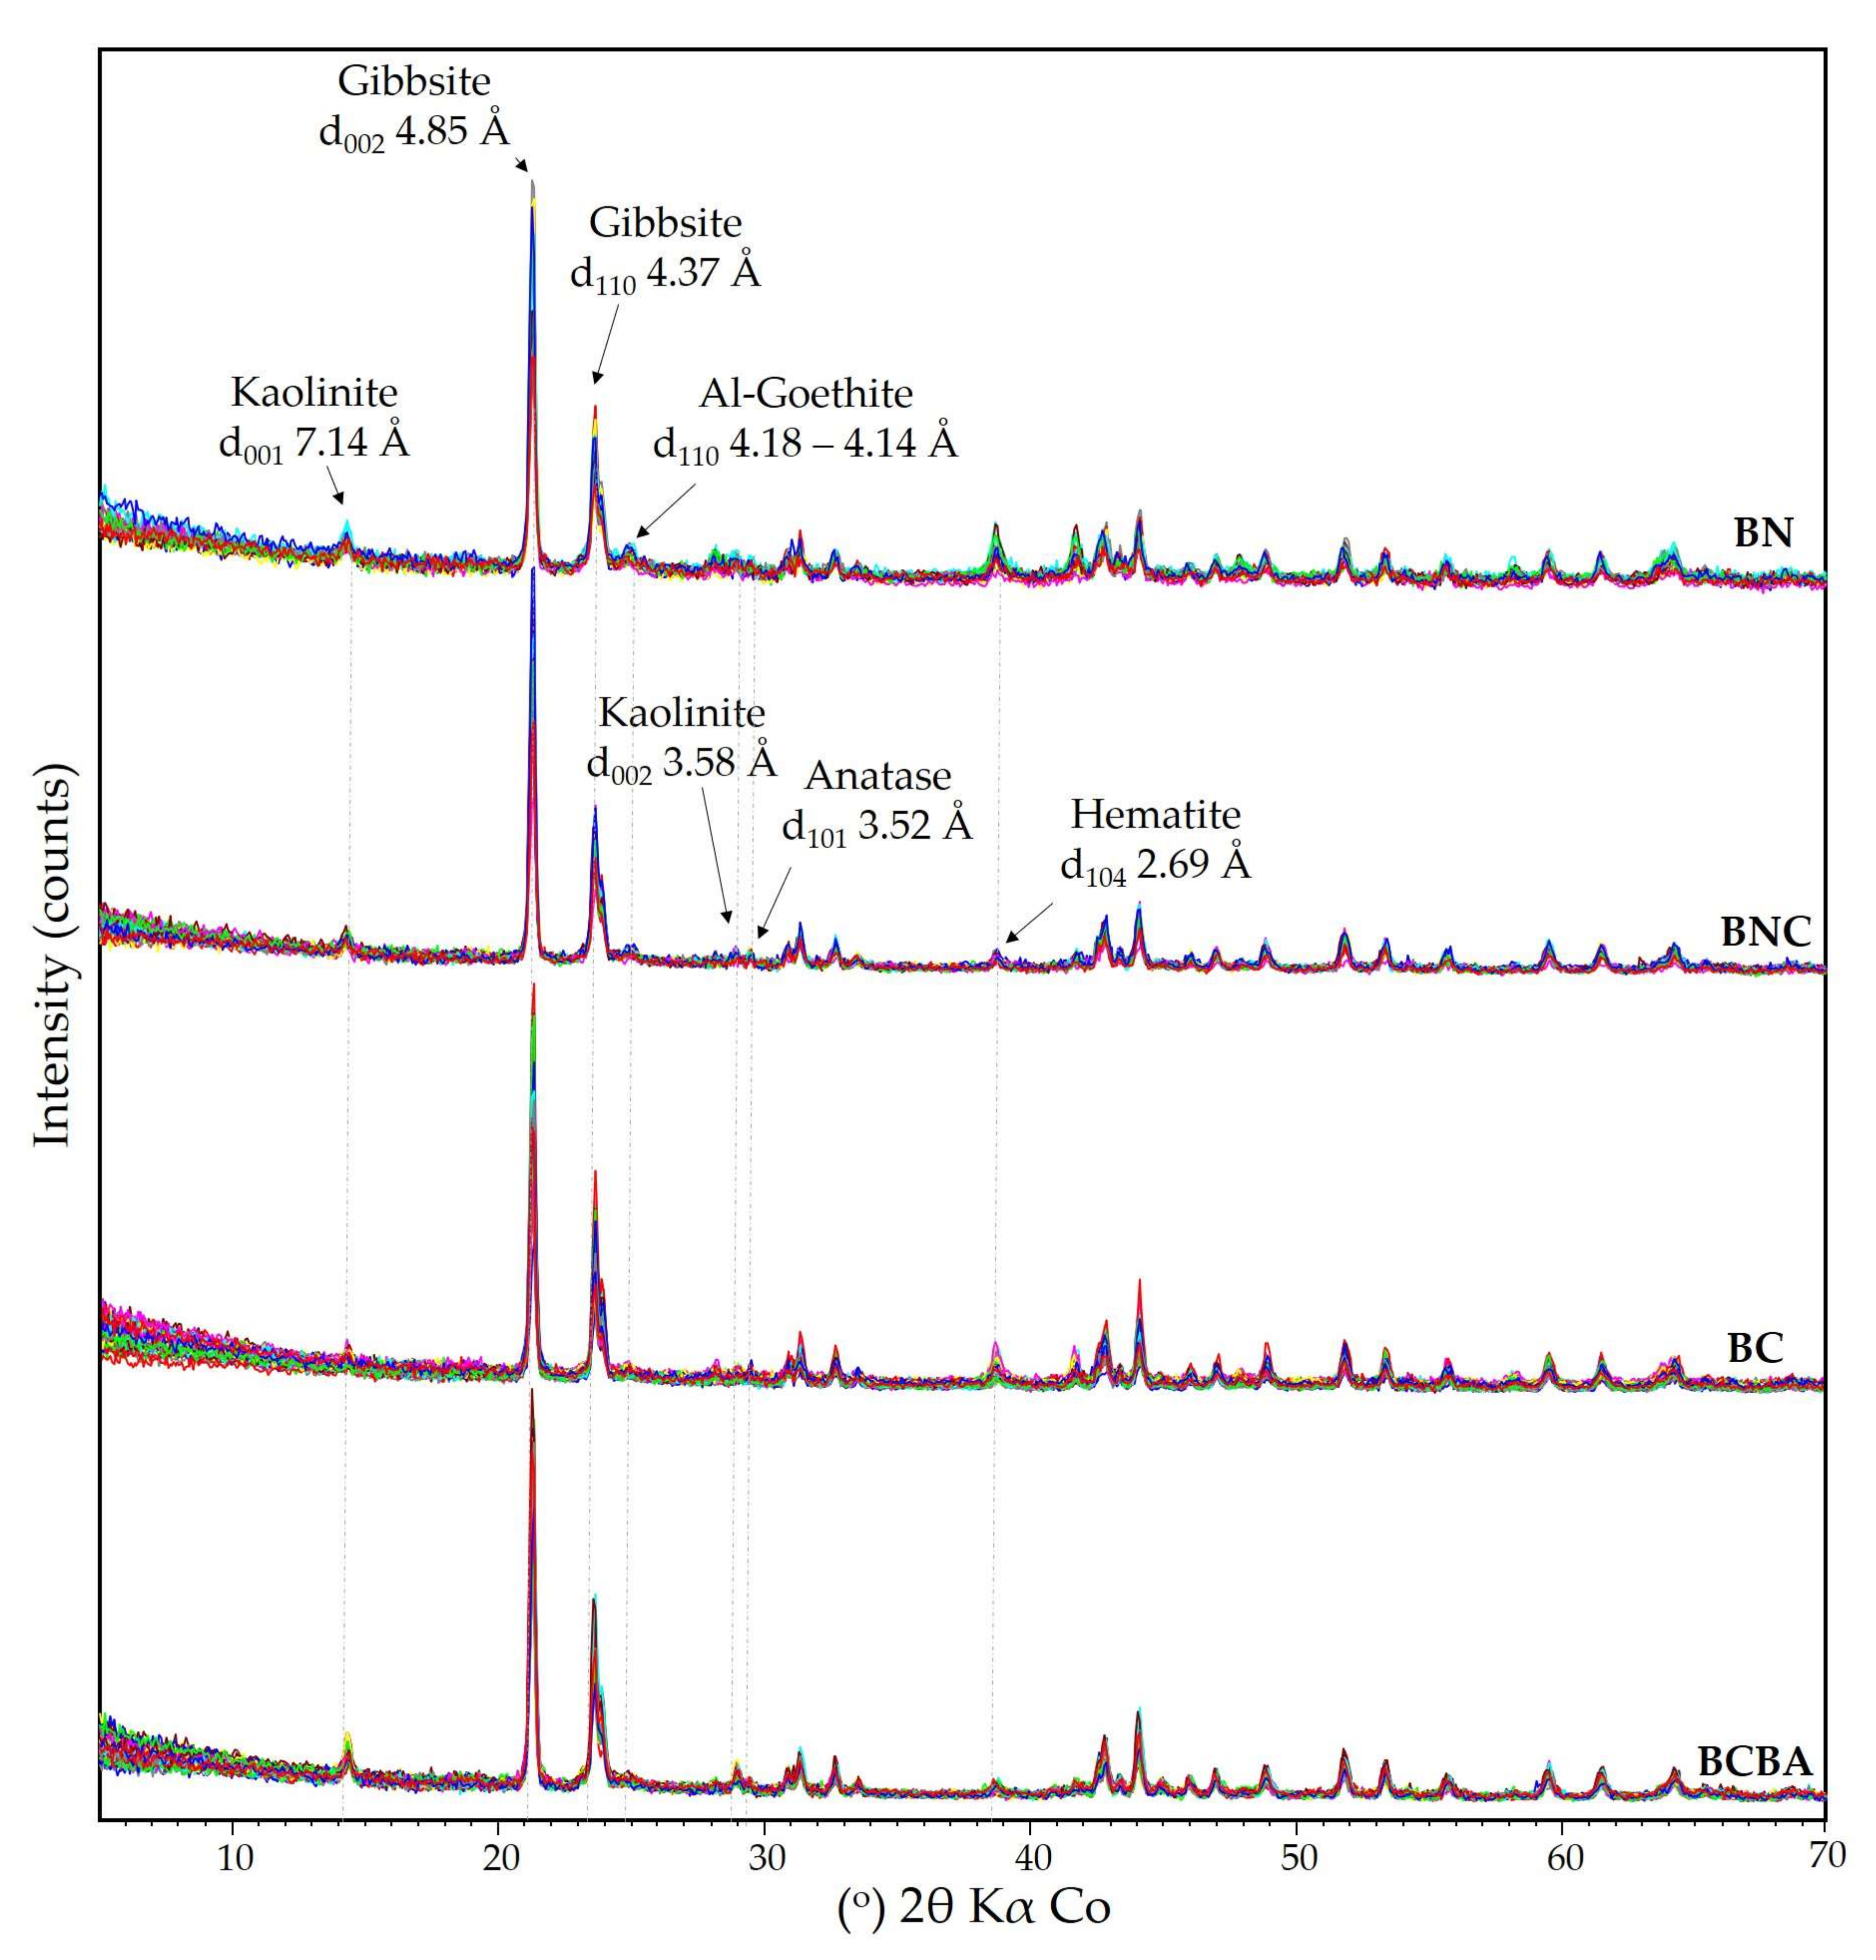
Figure 2 shows the X-ray diffractograms of all the bauxite samples used in this study collected by transmission mode. It can be noted that the bauxites of the four lithologies have the same mineralogical composition. The main phase is gibbsite (d002 = 4.85 Å and d110 = 4.37 Å). In general, the only SiO2 mineral identified is kaolinite (d001~7.14 Å and d002~3.58 Å). Quartz (d101 = 3.34 Å) may be present in some samples, but in minor content. Hematite (d104 = 2.69 Å) is observed as the main iron mineral, with intensity varying significantly among the lithologies, and Al-goethite (d101 ranging from 4.18 Å to 4.14 Å) is also observed, usually as a broad peak due to variations in the isomorphic substitution of Al in the structure [12,34]. Anatese (d101 = 3.52 Å) is also present in all samples.
Layered minerals (such as clay minerals) tend to orient themselves strongly during samples’ assembling in the sample holders for XRD analysis. Thus, for those samples rich in kaolinite and/or gibbsite, it is common to observe high intensities of the basal reflections (d00l) in detriment of the other reflections of the XRD pattern [35]. This effect is believed to be the major source of error in quantitative analysis based on XRD data [14,36]. It is interesting to note that this deleterious effect was avoided using the transmission mode, as evidenced by the intensity ratio of the peaks d110 and d002 of the gibbsite (~50%). For comparison, the same samples were analyzed by reflection mode with manual sample holder assembling [14], resulting in a ratio d110/d002 of only ~8%, a very low value considering the scale factor of this phase. At low angles, the noise is significant, although this mode of data collection allows a better resolution of possible peaks in this region of the diffractogram.
3.2. Data Evaluation by Principal Component Analysis (PCA)
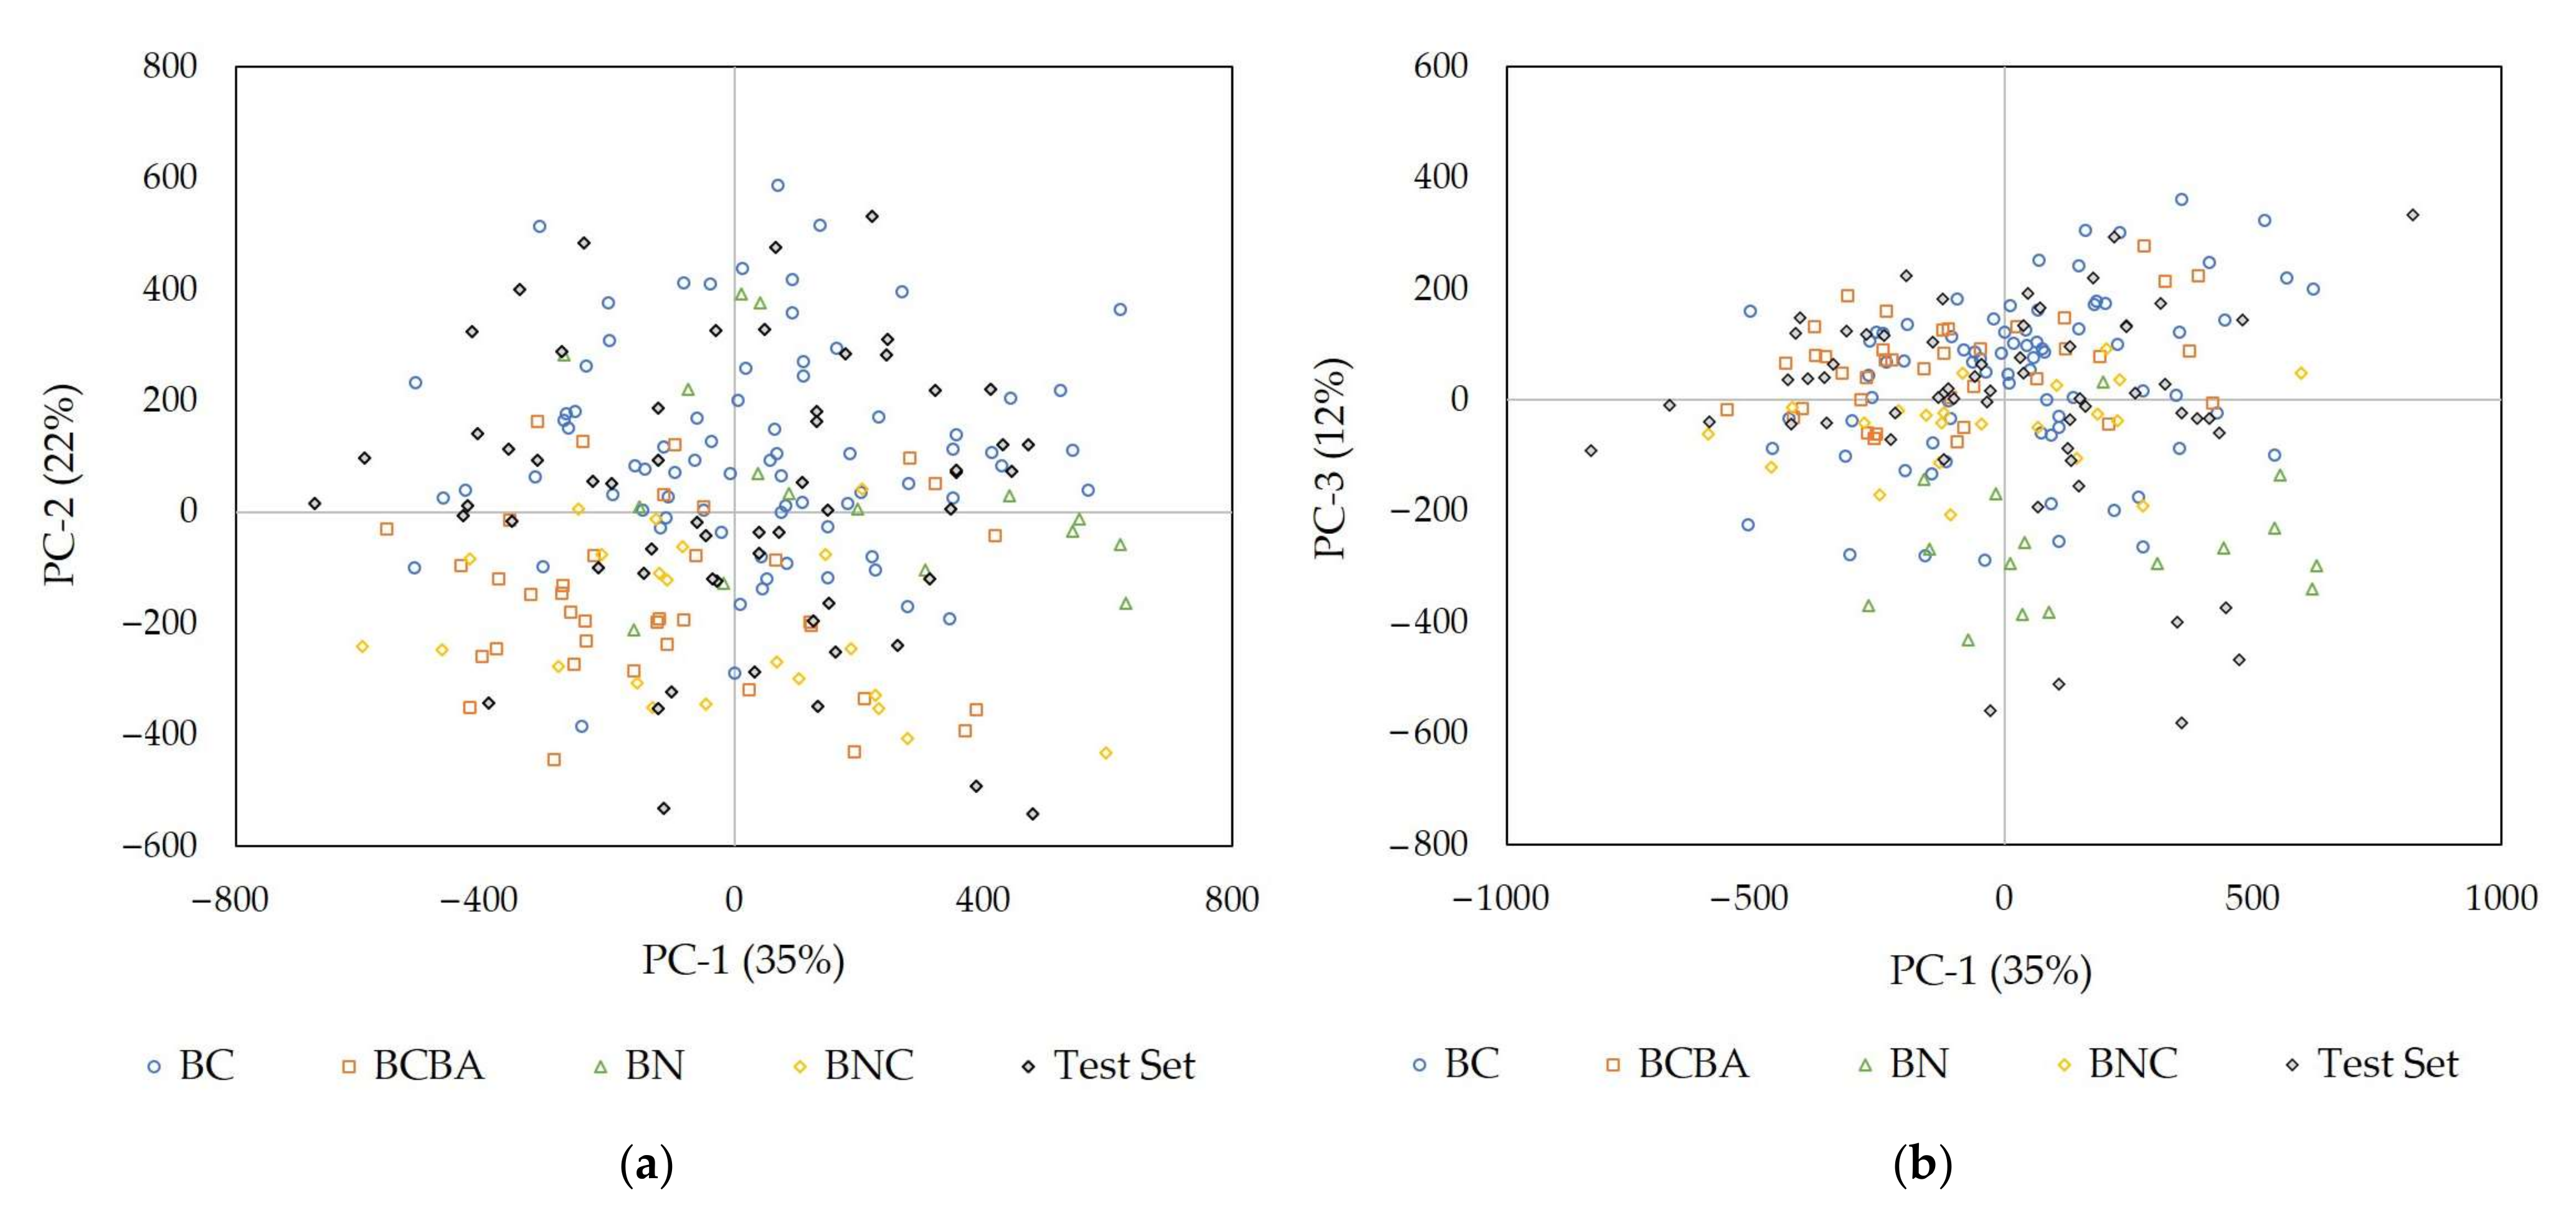
Figure 3 presents the score-plots for the first three principal components. As noted, the principal components PC-1, PC-2, and PC-3 explain, respectively, 35%, 22%, and 12% of the data variability (only 69% of the explained variance). Even considering 8 components, the explained variance remains lower than 75%. In contrast, Melo et al. [19] achieved 98% of the explained variance with only two components by using XRD reflection data. This shows that, although the preferred orientation effect was mitigated, the conditions of data collection by transmission mode used in this work resulted in a significant reduction in the intensities, which in turn, reduced the sensitivity of the statistical treatment in finding significant factors to reduce the data dimensionality.
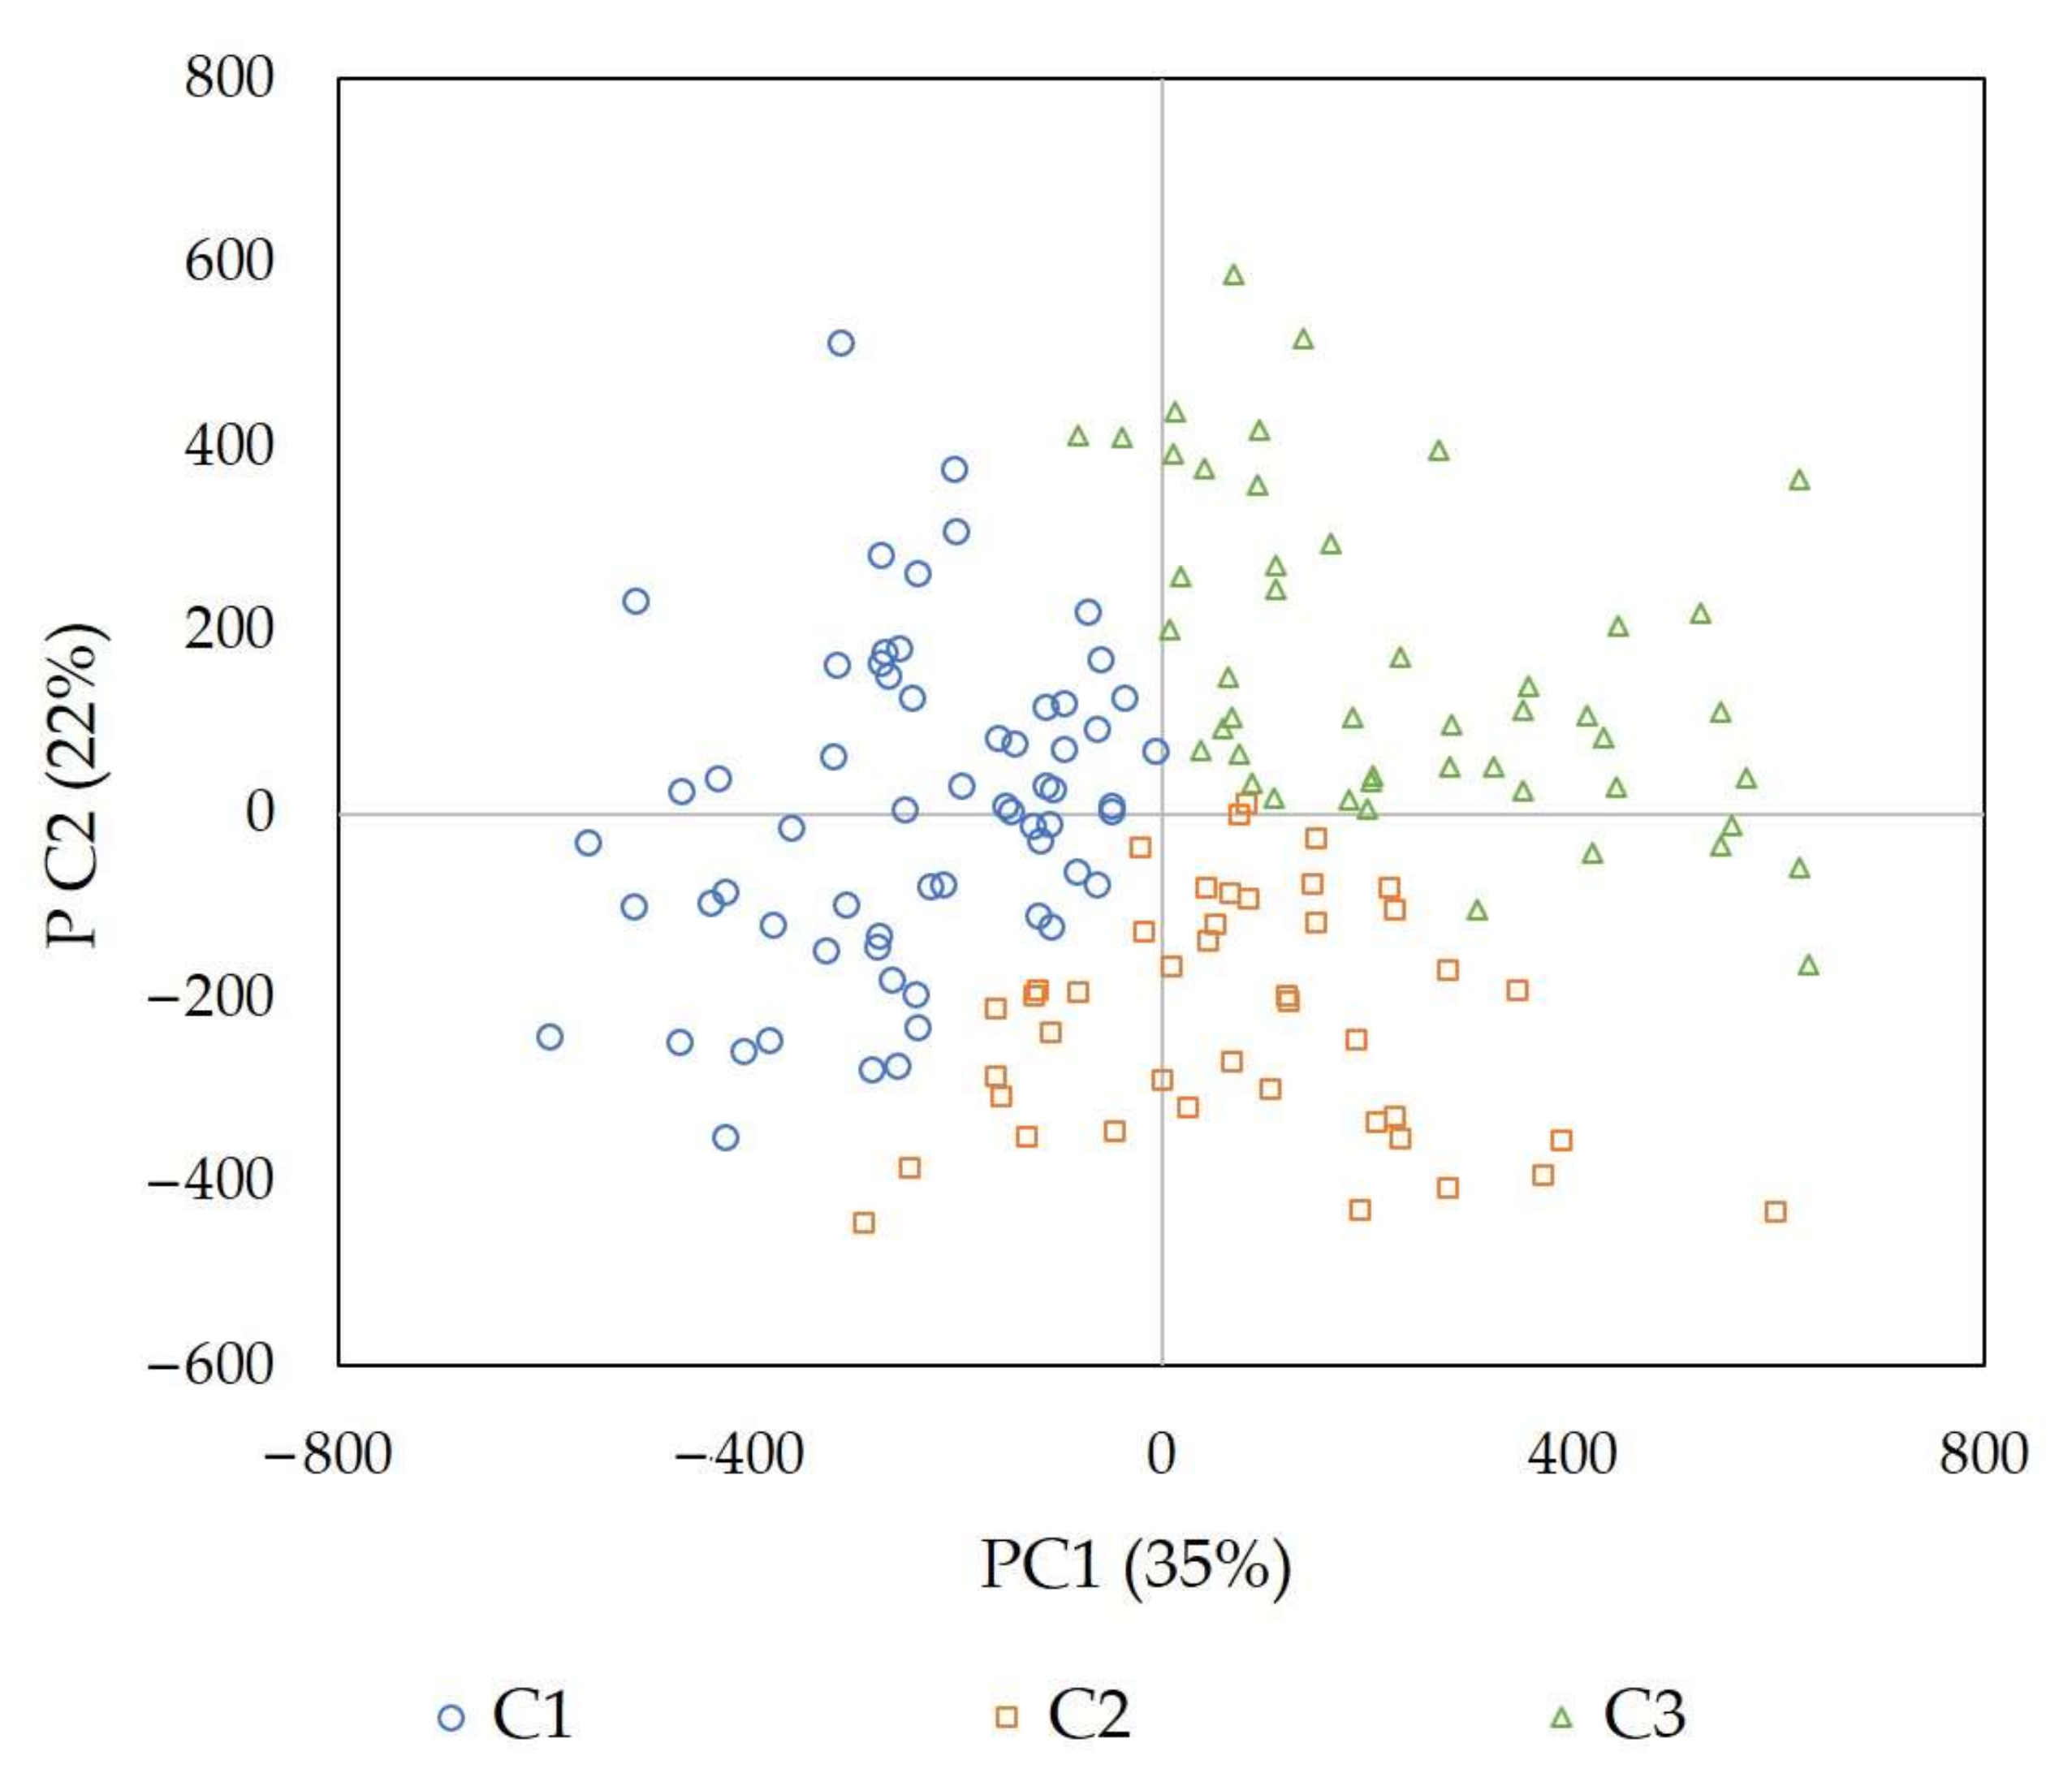
It is observed that no clustering is evidenced, even for those samples of the same lithology [8]. In this context, a K-means method was used to group the samples for further PLSR prediction. Figure 4 shows the PCA score-plot with the three clusters obtained (C1, C2, and C3). Although samples from the same lithology were classified into different clusters, C1 mostly contains BC; BNC and BCBA were mainly grouped in C1 and C2, while most BN samples were grouped in C3.
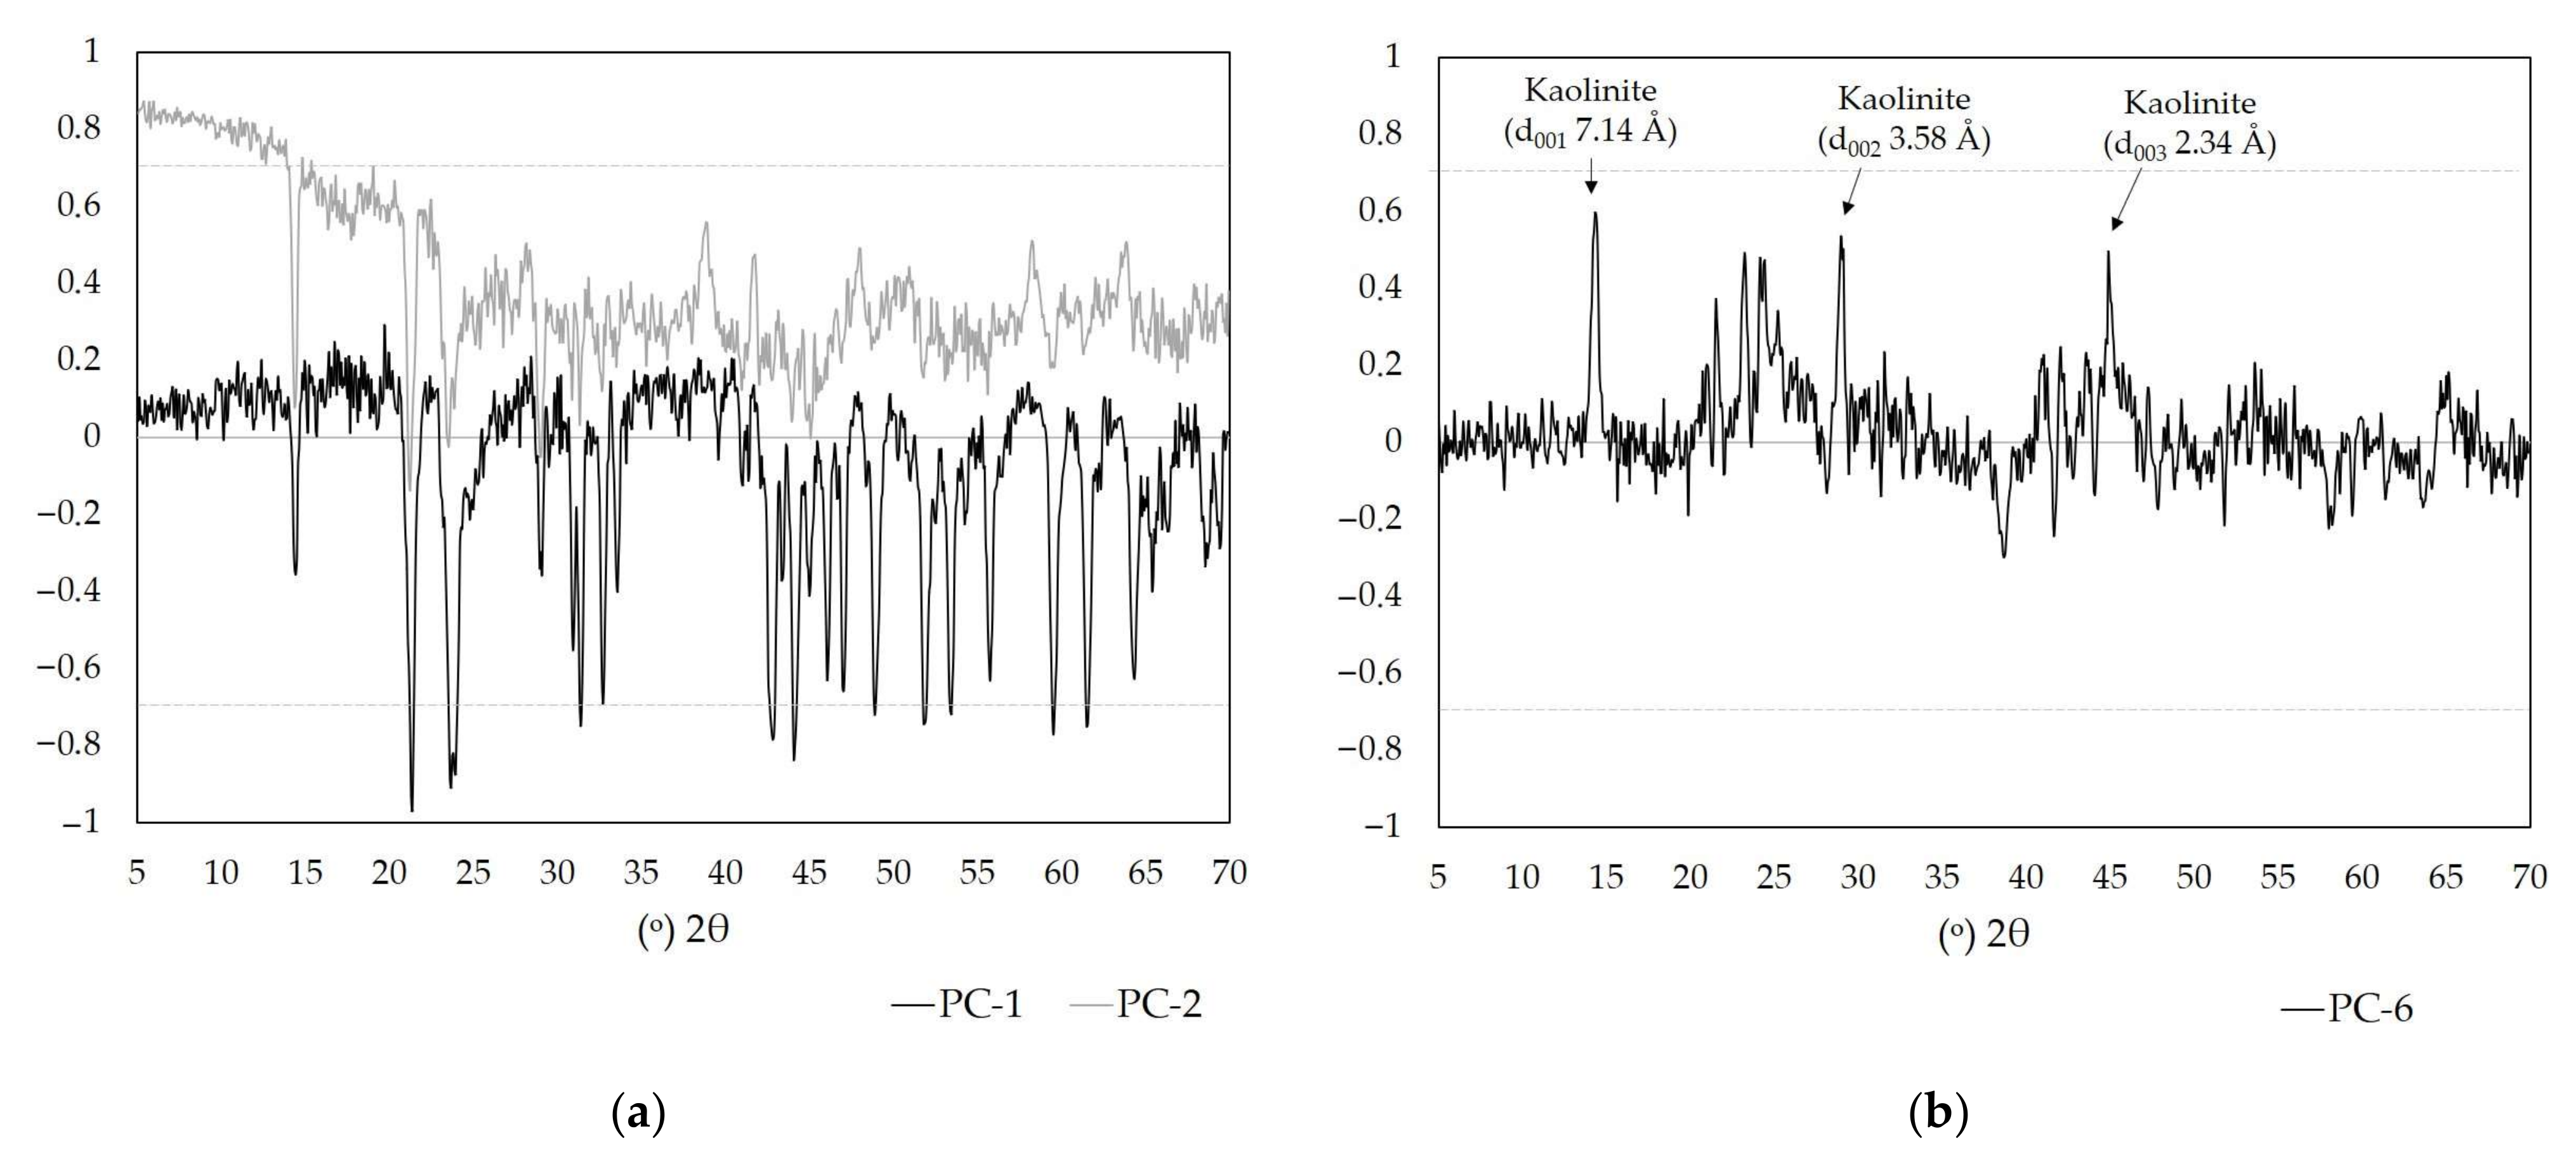
Figure 5 presents the linear-plot of the PCA loadings for PC-1, PC-2 (Figure 5a), and PC-6 (Figure 5b). It is observed that the reflections of the main mineral in the bauxite (gibbsite) have greater effect on PC-1 whilst PC-2 is more influenced by noise from low angles. The variability related to kaolinite were most extracted by PC-6.
3.3. Prediction of AvAl2O3 and RxSiO2 by PLSR
Once the samples were classified into C1, C2, and C3 clusters, the respective sample calibration sets were used to build the PLSR models. Melo et al. [19] achieved an optimized condition of XRD data collection by increasing the step-size from 0.026° to 0.065° (2θ) and reducing the 2θ range up to 13–34°, such optimized condition for reflection mode allowed a less than 1 min XRD scan time. As observed in the PCA loadings-plot (Figure 5), using transmission data, the full pattern is relevant to extract the latent variables, therefore, in this study, the diffractograms were reduced only to the 13–65° (2θ) interval, just removing the background noise. This treatment resulted in a scan time of 1 min 15 s. Comparing to the traditional wet chemistry in which analyses can take 3–8 h, the use of PLSR on XRD data is much faster, being able to provide quick feedback to the process for decision-making.
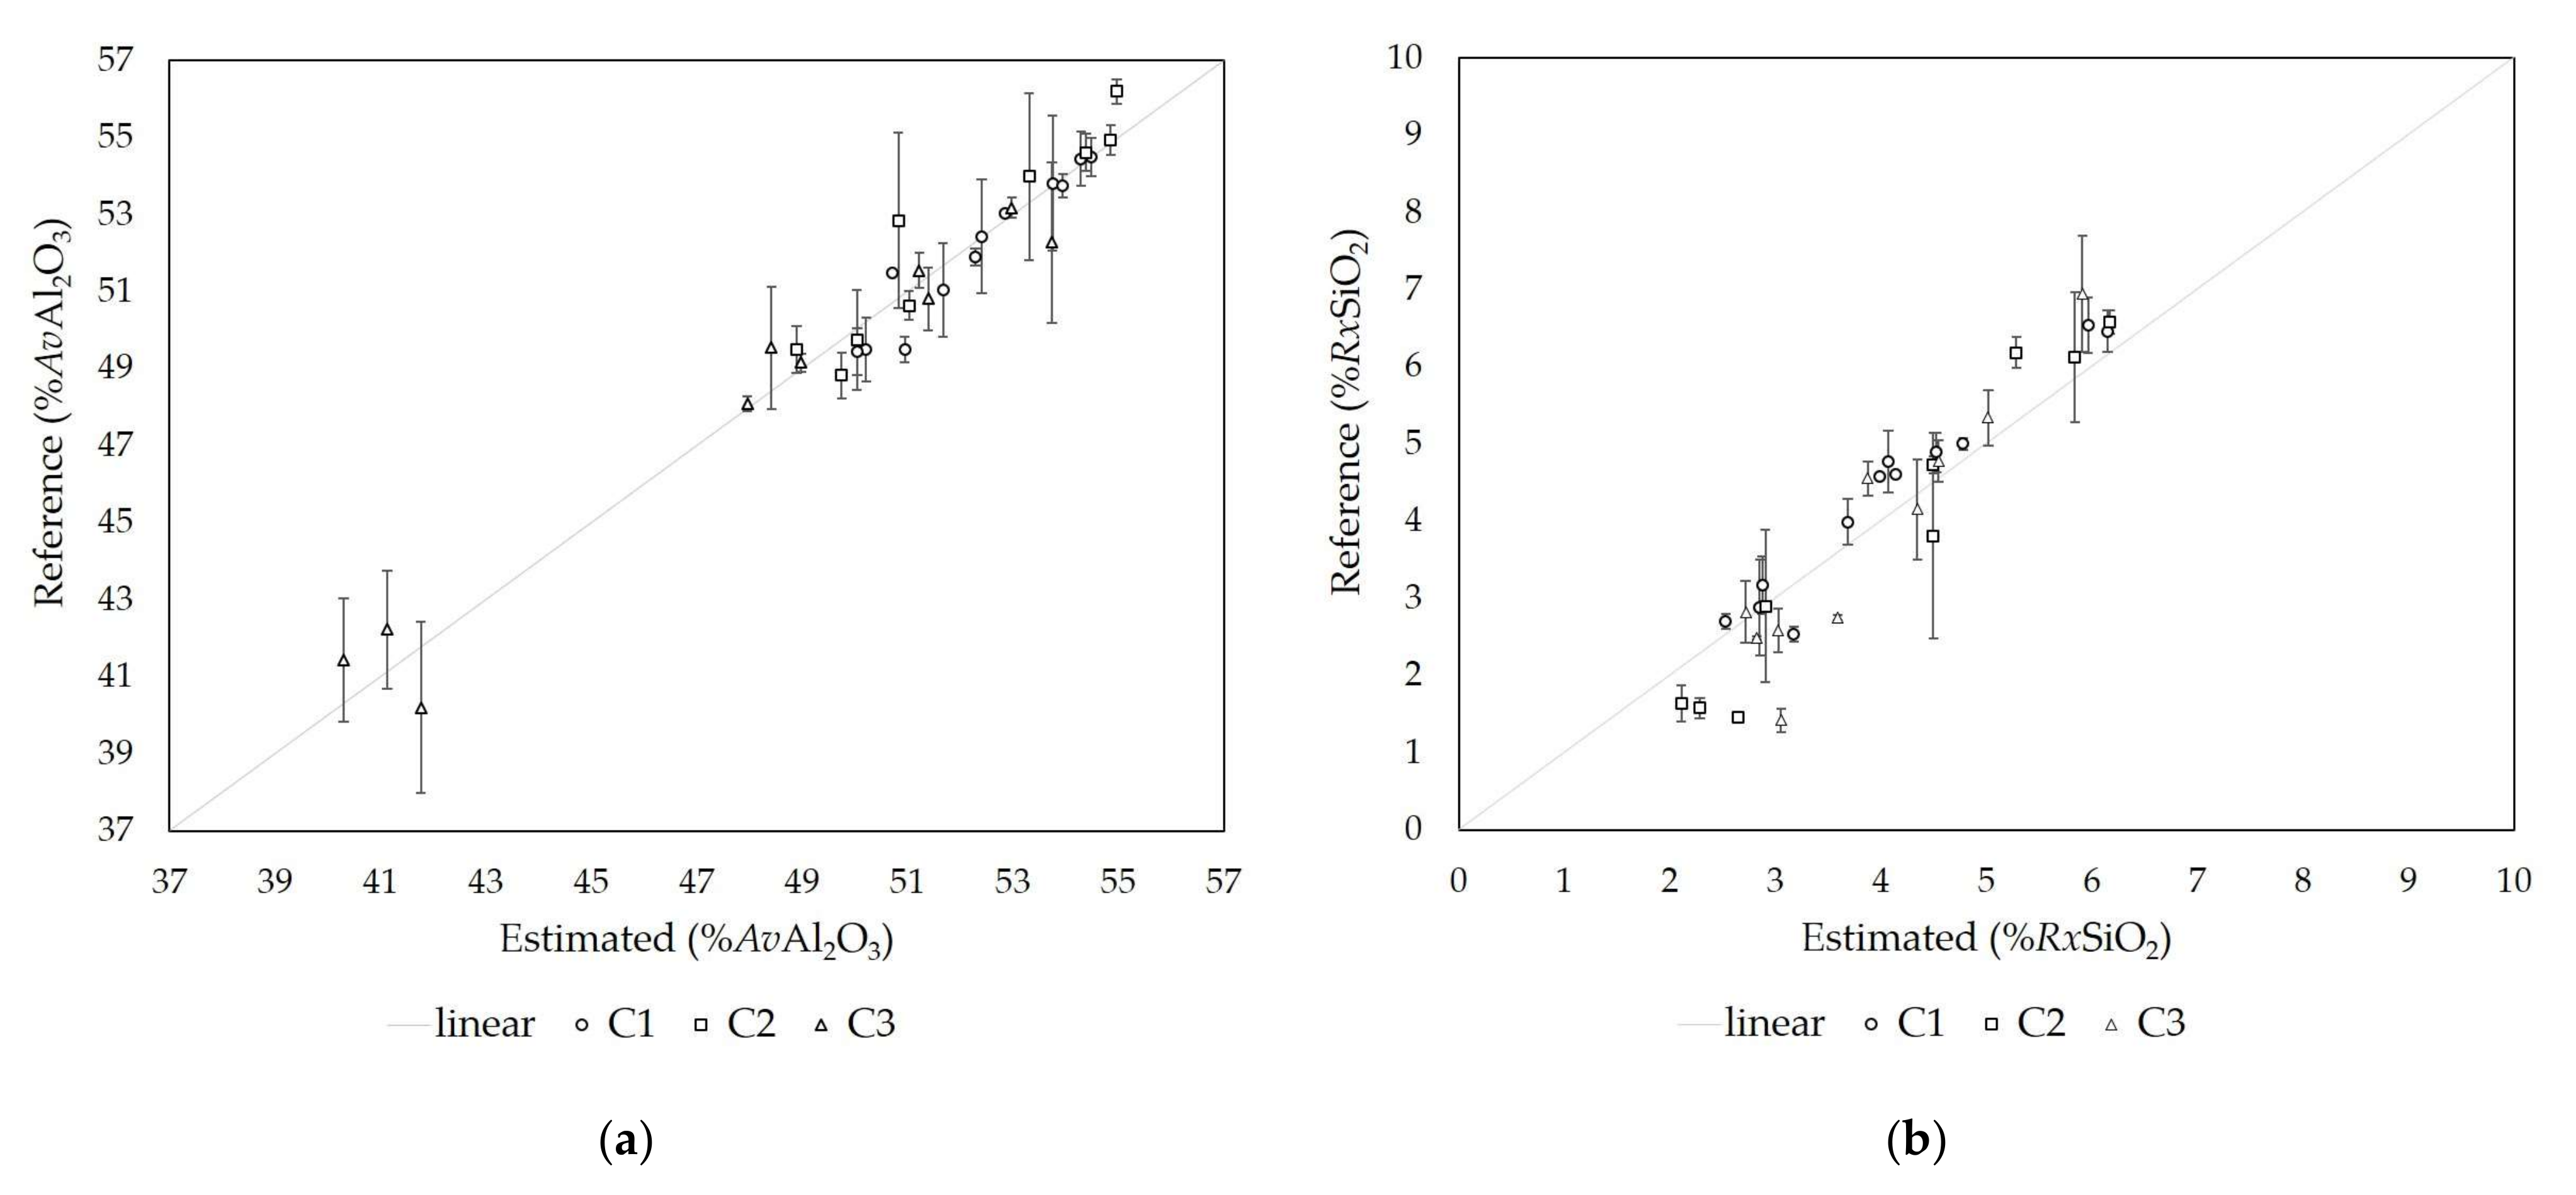
After calibrating the models, defining the best pre-processing method for the dataset (mean-centered or standardized) and the number of factors to be included in the models through cross-validation, each sample in the test set was classified into one of the three clusters and then the parameters of bauxite quality control—AvAl2O3 and RxSiO2 were predicted using the respective models. It can be observed in Figure 6 that there is a good fit of the predicted values for both parameters, mainly in those samples classified in C1.
Although the predicted mean values are close to the reference values, the models C2 and C3 showed a precision slightly lower than the acceptable limits for the quality control of bauxites [30]. The parameters that indicate the performance of the models are summarized in Table 1 and Table 2 for AvAl2O3 and RxSiO2, respectively.
A mean of residuals (mean of the difference between reference and predicted) close to zero denotes that the models present a good accuracy. The RMSEP denotes the precision of the model in the same unit as the predicted parameters (%AvAl2O3 and %RxSiO2). Thus, a model with high precision presents lower RMSEP. In terms of bauxite quality control, a precision of <1.0–1.5% for AvAl2O3 and <0.5% for RxSiO2 [14,25] is usually required. Feret [30] argues that these numbers are sometimes difficult to attain in the industrial practice using traditional wet chemistry methods.
The RPD indicates how well the model performs compared to using only the average of the original data [26]. Some authors argue that RPD < 1.0 denotes a very poor model, 1.0 ≤ RPD < 1.4 a poor model, 1.4 ≤ RPD < 1.8 a fair model, 1.8 ≤ RPD < 2.0 a good model and RPD ≥ 2.0 an excellent model [26,27,28]. It can be observed that the models C1 and C2 for both AvAl2O3 and RxSiO2 performed well with RPD ~2.0. It is interesting to note that, although the RMSEP of C3 model is high, it presented RPD = 2.9 which means an excellent model to predict AvAl2O3, denoting that the samples in this cluster have a wide range of AvAl2O3 content (min: 38.57%, max: 52.79%), and therefore, the model is sensitive to variations and capable of predicting this parameter satisfactorily.
It is interesting to note that the best model (C1) mostly contains samples of the main ore lithology (BC), denoting that the method is suitable for quality control. In contrast, the worst model (C3) is mainly related to the samples of the marginal ore (BN, generally considered as gangue). This bauxite lithology presents the highest kaolinite content and the lowest gibbsite content in the Miltonia 3 bauxite profile. The low degree of crystallinity of the kaolinite in this lithology affects the XRD profile [13,14]. Melo et al. [19] also observed a lower precision for this material that could be related to the preferred orientation. As this effect was eliminated using transmission mode, the low precision of the C3 model may be related to the wide range of AvAl2O3 and RxSiO2 content in the sample group or another unknown effect. It also may represent a limitation of this method (or an optimization point), that is, it is not suitable for geological survey applications; where it may be present, samples that strongly deviate from the ore in terms of mineralogical composition and phases’ content.
Feret et al. [37] state that methods of phase quantification based on regression may successfully be used in bauxite exploration, however, they are deposit-specific. Similarly, the method presented in this work (and also in Melo et al. [19]) represents a case study with lateritic gibbsitic bauxite from the Miltonia plateau. Although König and Norberg [18] reported satisfactory prediction using a generic PLSR model for bauxites from different locations, the results suggest that changes in the ore’s mineralogy, related only to the concentration and crystallinity of the phases, may impact prediction. Nevertheless, it is believed that the methodology can be easily adapted to bauxites of different origins, in particular, the Amazon lateritic bauxites (Paragominas plateau Miltonia 5, Juruti, Trombetas and Rondon do Pará) with similar mineralogy and containing only gibbsite as an aluminum-bearing mineral [6,12,16,38].
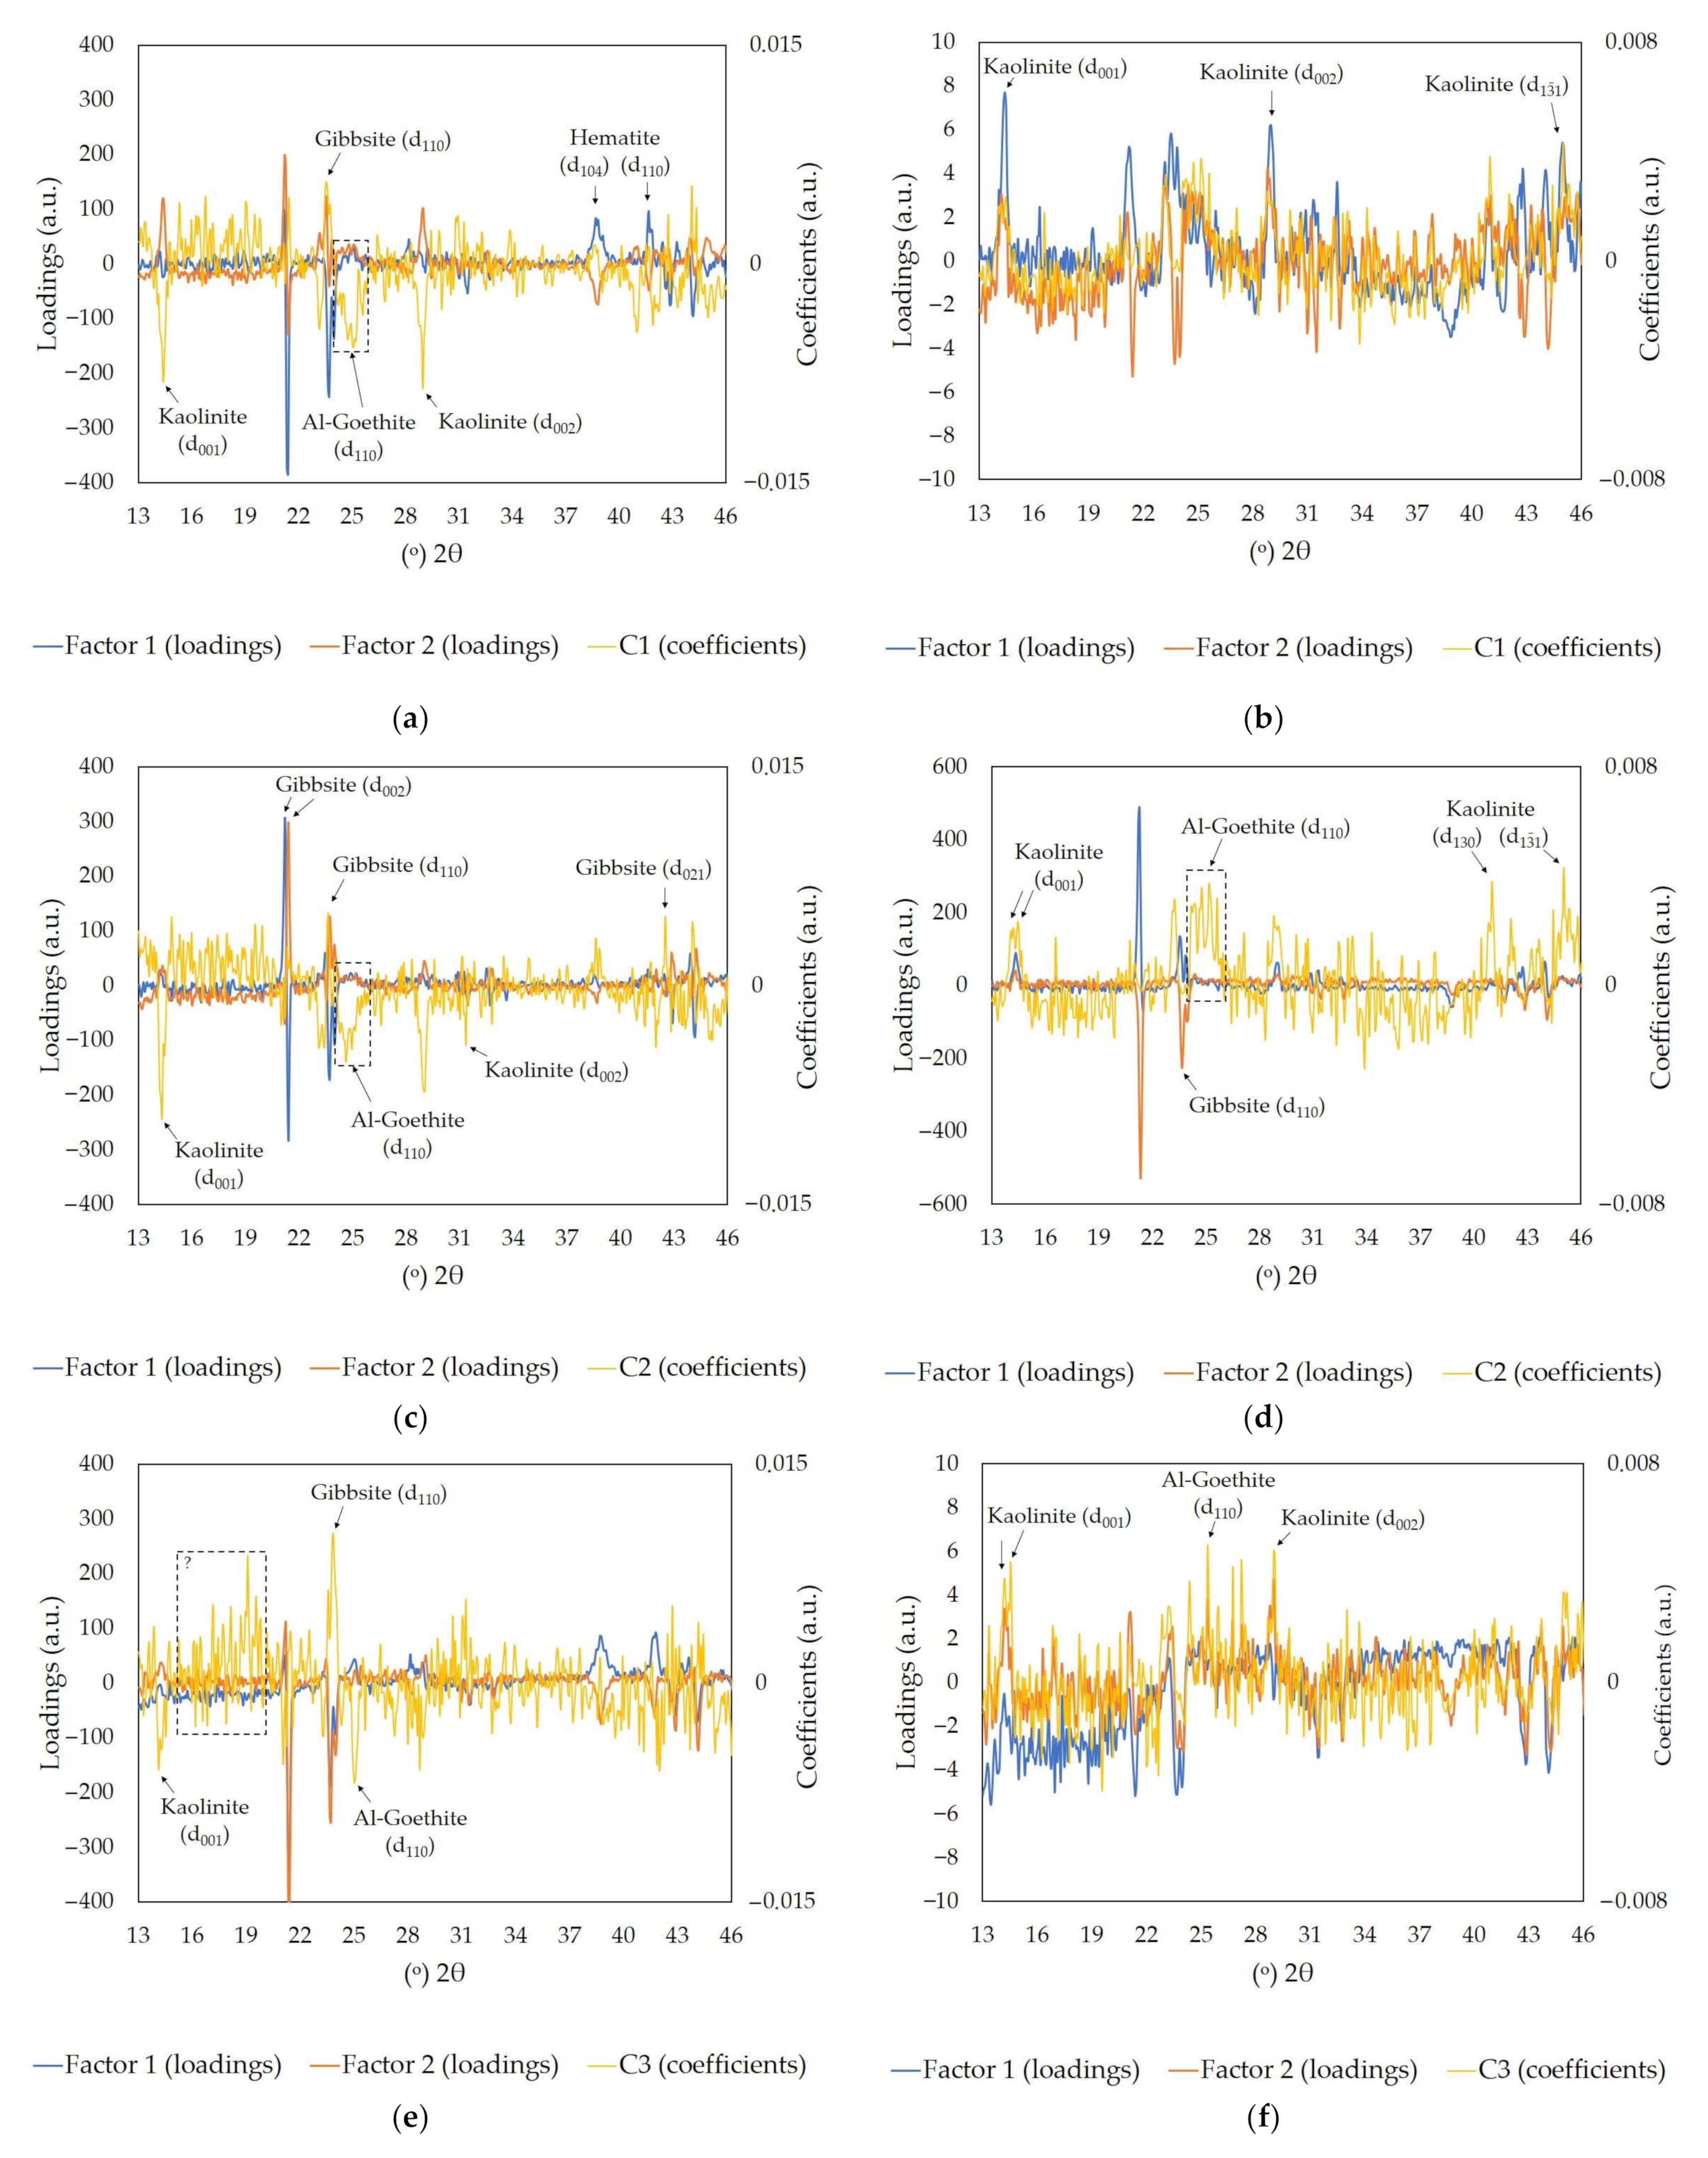
As depicted in Figure 7, the coefficients and factors of each PLSR model can be plotted in relation to the °2θ position, allowing to interpret the obtained model in terms of the XRD pattern of the clustered bauxite samples. It is observed that the largest coefficients of the AvAl2O3 models (C1, C2, and C3) are negatively correlated with kaolinite basal reflections and positively correlated with gibbsite (d110), whereas basal gibbsite reflection (d002) has greater weights on the factor loadings. The asymmetry shape of this reflection, however, was revealed as at least two generations of gibbsites. Similar results were observed by Melo et al. [19], and according to König et al. [10] and Negrão et al. [16], it could be associated with aluminum-rich horizons, where along the bauxite profile, well-formed coarse gibbsite crystals fills microvoids, and a new generation of fine, poor-crystalline gibbsite is dispersed in the matrix. Interestingly, Al-goethite (d110) has a high impact on model coefficients (highlighted area in Figure 7a,c). The respective broad peak area in C1 and C2 coefficients denote the presence of several %Al-substitution in the goethite structure. It is also noted that, in the C3 model, a wide area from 15–20° 2θ presented high coefficients. This area, however, has no XRD reflection associated, and therefore, may be related to the amorphous in these samples. It was not possible to quantify the amorphous, but it is assumed that this is more evident in the overlying lithologies, in particular, BNC and BN due to different laterization cycles and the greater presence of neoformed minerals [8,16]. This assumption is in agreement with the results since BN samples were mainly grouped in C3, and is probably related to the relatively low prediction of this model.
On the models for RxSiO2, higher coefficients related to kaolinite and Al-goethite were also observed, however, positively. For models with standardized datasets (C1 and C3), the basal reflections of kaolinite have greater impact on loadings, while in the C2 model (mean-centered), the d002 peak of gibbsite had greater weight. A double peak referring to the d001 of kaolinite was observed for the coefficients of models C2 and C3, which must also be associated with kaolinite generations with different degrees of crystallinity. Melo et al. [8] demonstrated that this difference actually occurs, so that kaolinites from the overlying lithologies are less ordered and, consequently, more reactive to the Bayer process. It is interesting to note that, although this significantly impacts processing costs, this information is not known by the industry in the context where all the quality control of bauxite is by traditional wet methods. The variability of kaolinite crystallinity in these two clusters may be associated with the reduced accuracy of the respective models.
4. Conclusions
In this work, the use of a method for quality control of bauxites based on statistical tools on XRD transmission data was evaluated. The method comprises classifying bauxite samples by PCA and K-means according to their latent mineralogical characteristics, building PLSR models for each sample group, and using these models to predict the AvAl2O3 and RxSiO2 parameters in new samples.
The samples were classified into three clusters (C1, C2, and C3) and the respective models were evaluated in relation to the wet chemistry reference values. The C1 model presented satisfactory accuracy and precision for both parameters. The RMSEP of 0.85% (AvAl2O3) and 0.49% (RxSiO2) attain the required limits (1.0–1.5% and 0.5%, respectively). The C2 and C3 models, related to marginal ore lithologies presented satisfactory accuracy but low precision.
These results also indicate that, although the preferred orientation was eliminated using the XRD transmission data collection, there was no incremental improvement compared with the PLSR models obtained with reflection data [14].
These results cleared showed that the methodology can be applied for quality control in the beneficiation plant, but not suitable for geological survey applications. It is worth mentioning that this method presents several advantages over traditional wet chemistry, mainly due to its speed (less than 5 min to run XRD analysis and obtain the prediction), ease of being completely automated, and no dangerous chemical reagents are required.
Author Contributions
Conceptualization, C.C.A.M.; methodology, C.C.A.M. and R.S.A.; formal analysis, C.C.A.M.; resources, data curation, S.P.A.P.; writing—original draft preparation, C.C.A.M. writing—review and editing, S.P.A.P. and R.S.A.; supervision, project administration, and funding acquisition, S.P.A.P. All authors have read and agreed to the published version of the manuscript.
Funding
This research was funded by CNPq (Conselho Nacional de Desenvolvimento Científico e Tecnológico), grant number 402.427/2016-5 (Edital Universal, for the following project: “Desenvolvimento e Otimização de Métodos Prospectivos e de Controle de Beneficiamento de Bauxitas Gibbsíticas”).
Data Availability Statement
The data presented in this study is contained within the present article.
Acknowledgments
The authors thank the Brazilian agencies: CAPES (Coordenação de Aperfeiçoamento de Pessoal de Nível Superior) for a PhD scholarship to the first author and CNPq (Conselho Nacional de Desenvolvimento Científico e Tecnológico). We also acknowledge the Mineração Paragominas SA Company (Norsk Hydro) for the support.
Conflicts of Interest
The authors declare no conflict of interest.
References
- US Geological Survey. Mineral Commodity Summaries 2021; Government Printing Office: Washinton, DC, USA, 2021; p. 200. [Google Scholar]
- Paz, S.; Angélica, R.; Kahn, H. Optimization of the reactive silica quantification method applied to Paragominas-type gibbsitic bauxites. Int. J. Miner. Process. 2017, 162, 48–57. [Google Scholar] [CrossRef]
- Authier-Martin, M.; Forte, G.; Ostap, S.; See, J. The mineralogy of bauxite for producing smelter-grade alumina. JOM 2001, 53, 36–40. [Google Scholar] [CrossRef]
- Ostap, S. Control of silica in the Bayer process used for alumina production. Can. Metall. Q. 1986, 25, 101–106. [Google Scholar] [CrossRef]
- Smith, P. The processing of high silica bauxites—review of existing and potential processes. Hydrometallurgy 2009, 98, 162–176. [Google Scholar] [CrossRef]
- Angélica, R.S.; Kahn, H.; Paz, S. A proposal for bauxite quality control using the combined Rietveld-Le Bail-Internal Standard PXRD method–Part 2: Application to a gibbsitic bauxite from the Paragominas region, northern Brazil. Miner. Eng. 2018, 122, 148–155. [Google Scholar] [CrossRef]
- Bredell, J.H. Calculation of available alumina in bauxite during reconnaissance exploration. Econ. Geol. 1983, 78, 319–325. [Google Scholar] [CrossRef]
- Melo, C.C.A.; Oliveira, K.S.; Angélica, R.S.; Paz, S. Análise de agrupamentos associada a difratometria de raios-X: Uma classificação mineralógica prática de bauxitas e seus produtos de digestão Bayer. Holos 2017, 6, 32. [Google Scholar] [CrossRef] [Green Version]
- O’Connor, D.J. Alumina Extraction from Nom Bauxitic Materials; Aluminium-Verlag: Sydney, Australia, 1988; p. 370. [Google Scholar]
- König, U.; Angélica, R.S.; Norberg, N.; Gobbo, L. Rapid X-ray diffraction (XRD) for grade control of bauxites. ICSOBA Proc. 2012, 19, 11. [Google Scholar]
- Paz, S.; Kahn, H.; Angélica, R.S. A proposal for bauxite quality control using the combined Rietveld–Le Bail–Internal Standard PXRD Method–Part 1: Hkl model developed for kaolinite. Miner. Eng. 2018, 118, 52–61. [Google Scholar] [CrossRef]
- Neumann, R.; Avelar, A.N.; Da Costa, G.M. Refinement of the isomorphic substitutions in goethite and hematite by the Rietveld method, and relevance to bauxite characterisation and processing. Miner. Eng. 2014, 55, 80–86. [Google Scholar] [CrossRef]
- Feret, F.R. Selected applications of Rietveld-XRD analysis for raw materials of the aluminum industry. Powder Diffr. 2013, 28, 112–123. [Google Scholar] [CrossRef] [Green Version]
- Aylmore, M.G.; Walker, G.S. The quantification of lateritic bauxite minerals using X-ray powder diffraction by the Rietveld method. Powder Diffr. 1998, 13, 136–143. [Google Scholar] [CrossRef]
- Nong, L.; Yang, X.; Zeng, L.; Liu, J. Qualitative and quantitative phase analyses of Pingguo bauxite mineral using X-ray powder diffraction and the Rietveld method. Powder Diffr. 2007, 22, 300–302. [Google Scholar] [CrossRef]
- Negrao, L.; Da Costa, M.L.; Pöllmann, H.; Horn, A. An application of the Rietveld refinement method to the mineralogy of a bauxite-bearing regolith in the Lower Amazon. Miner. Mag. 2018, 82, 413–431. [Google Scholar] [CrossRef]
- Feret, F.; See, J. Analysis of bauxite by X-ray diffraction using synchrotron radiation. In Proceedings of the ICSOBA Conference, Zhengzhou, China, 25–28 November 2010. [Google Scholar]
- König, U.; Norberg, N. New Tools for Process Control in Aluminium Industries-PLSR on XRD Raw Data. In AQW Proceedings 23 March 2019. Available online: http://www.aqw.com.au/papers/item/new-tools-for-process-control-in-aluminium-industries-plsr-on-xrd-raw-data.html (accessed on 5 May 2021).
- Melo, C.C.A.; Angélica, R.S.; Paz, S.P.A. A proposal for rapid grade control of gibbsitic bauxites using multivariate statistics on XRD data. Miner. Eng. 2020, 157, 106539. [Google Scholar] [CrossRef]
- Melo, C.C.A.; Paz, S.P.A. Estimation of AvAl2O3 and RxSiO2 by Partial Least Square Regression (PLSR) on XRD data: A case study using low grade bauxites. In Proceedings of the 36th International ICSOBA Conference, Belem, Brazil, 29 October–1 November 2018. [Google Scholar]
- Carneiro, C.D.C.; Yanez, D.N.D.V.S.; Ulsen, C.; Fraser, S.J.; Antoniassi, J.L.; Paz, S.; Angelica, R.S.; Kahn, H. Imputation of reactive silica and available alumina in bauxites by self-organizing maps. In Proceedings of the 2017 12th International Workshop on Self-Organizing Maps and Learning Vector Quantization, Clustering and Data Visualization (WSOM), Nancy, France, 28–30 June 2017. [Google Scholar]
- Wold, S.; Sjöström, M.; Eriksson, L. PLS-regression: A basic tool of chemometrics. Chemometr. Intell. Lab. Syst. 2001, 58, 109–130. [Google Scholar] [CrossRef]
- Bro, R.; Smilde, A.K. Principal component analysis. Anal. Methods 2014, 6, 2812–2831. [Google Scholar] [CrossRef]
- Cordella, C.B.Y. PCA: The basic building block of chemometrics. Anal. Chem. 2012, 7. [Google Scholar] [CrossRef] [Green Version]
- Rossel, R.V.; Walvoort, D.; McBratney, A.; Janik, L.; Skjemstad, J. Visible, near infrared, mid infrared or combined diffuse reflectance spectroscopy for simultaneous assessment of various soil properties. Geoderma 2006, 131, 59–75. [Google Scholar] [CrossRef]
- Rossel, R.V.; McGlynn, R.; McBratney, A. Determining the composition of mineral-organic mixes using UV–vis–NIR diffuse reflectance spectroscopy. Geoderma 2006, 137, 70–82. [Google Scholar] [CrossRef]
- Olatunde, K.A. Determination of petroleum hydrocarbon contamination in soil using VNIRDRS and PLSR modeling. Heliyon 2021, 7, e067942. [Google Scholar] [CrossRef] [PubMed]
- dos Santos, F.R.; de Oliveira, J.F.; Bona, E.; dos Santos, J.V.F.; Barboza, G.M.; Melquiades, F. EDXRF spectral data combined with PLSR to determine some soil fertility indicators. Microchem. J. 2020, 152, 104275. [Google Scholar] [CrossRef]
- König, U.; Degen, T.; Norberg, N. PLSR as new XRD method for downstream processing of ores–case study: Fe2+ determina-tion in iron ore sinter. Powder Diffr. 2014, 29, 78–83. [Google Scholar] [CrossRef]
- Feret, F.R. Inaccuracies in Estimation of Bauxite Extractable and Mineralogical Constituents. In Proceedings of the 36th Inter-national ICSOBA Conference, Belem, Brazil, 29 October–1 November 2018. [Google Scholar]
- Picanço, F.E.; Pinheiro, D.C.; Calado, W.M.; Almeida, K.R.; Quadros, C.R.R.; Rabelo, S.A. Amostragem em diferentes malhas de sondagem para minério de bauxita—Mina de Miltonia 03—Paragominas-PA. In Proceedings of the Anais do 13° Simpósio de Geologia da Amazônia, Belem, Brazil, 22–26 September 2013. [Google Scholar]
- Silva, H.M.; Picanço, E.; Maurity, C.; Morais, W.; Santos, H.C.; Guimarães, O. Geology, mining operation and scheduling of the Paragominas bauxite mine. In Proceedings of the 8th International Alumina Quality Workshop, 7–12 September 2008; The Workshop: Darwin, NT, Australia, 2008; pp. 11–16. [Google Scholar]
- Geladi, P.; Kowalski, B.R. Partial least-squares regression: A tutorial. Anal. Chim. Acta 1986, 185, 1–17. [Google Scholar] [CrossRef]
- Paz, S.P.A.; Torres, P.W.T.S.; Angélica, R.S.; Kahn, H. Synthesis, Rietveld refinement and DSC analysis of Al-goethites to support mineralogical quantification of gibbsitic bauxites. J. Therm. Anal. Calorim. 2017, 128, 841–854. [Google Scholar] [CrossRef]
- Moore, D.M.; Reynolds, R.C. X-ray Diffraction and the Identification and Analysis of Clay Minerals, 2nd ed.; Oxford University Press: Oxford, UK, 1997. [Google Scholar]
- Zhou, X.; Liu, D.; Bu, H.; Deng, L.; Liu, H.; Yuan, P.; Du, P.; Song, H. XRD-based quantitative analysis of clay minerals using reference intensity ratios, mineral intensity factors, Rietveld, and full pattern summation methods: A critical review. Solid Earth Sci. 2018, 3, 16–29. [Google Scholar] [CrossRef]
- Feret, F.; Authier-Martin, M.; Sajó, I. Quantitative phase analysis of Bidi-Koum bauxites (Guinea). Clay Clay Miner. 1997, 45, 418–427. [Google Scholar] [CrossRef]
- Negrão, L.; Pöllmann, H.; Alves, T.C. Mineralogical Appraisal of Bauxite Overburdens from Brazil. Minerals 2021, 11, 677. [Google Scholar] [CrossRef]
Figure 1.
Location and typical geological profile of Miltonia plateau (Pará state, northern Brazil). Legend: BN: Nodular Bauxite, BNC: Nodular-Crystalized Bauxite, LF: Ferruginous Laterite, BC: Crystalized Bauxite, and BCBA: Crystalized-Amorphous Bauxite lithology.
Figure 1.
Location and typical geological profile of Miltonia plateau (Pará state, northern Brazil). Legend: BN: Nodular Bauxite, BNC: Nodular-Crystalized Bauxite, LF: Ferruginous Laterite, BC: Crystalized Bauxite, and BCBA: Crystalized-Amorphous Bauxite lithology.

Figure 2.
XRD patterns of the bauxite samples from BN, BNC, BC and BCBA lithologies.

Figure 3.
PCA score-plots: (a) PC-1 vs. PC-2; (b) PC-1 vs. PC-3. Explained variance of each component given in parentheses.
Figure 3.
PCA score-plots: (a) PC-1 vs. PC-2; (b) PC-1 vs. PC-3. Explained variance of each component given in parentheses.

Figure 4.
Clustering of samples by K-means represented in the PCA score-plot.

Figure 5.
Linear-plot of PCA loadings: (a) PC-1 and PC-2; (b) PC-6. Dashed line represents 70% of the factors on the principal components.
Figure 5.
Linear-plot of PCA loadings: (a) PC-1 and PC-2; (b) PC-6. Dashed line represents 70% of the factors on the principal components.

Figure 6.
Comparison of reference and estimated values using PLSR models for each cluster: (a) AvAl2O3; (b) RxSiO2. Bars indicating residual standard deviation (RSD).
Figure 6.
Comparison of reference and estimated values using PLSR models for each cluster: (a) AvAl2O3; (b) RxSiO2. Bars indicating residual standard deviation (RSD).

Figure 7.
Linear representation of the coefficients and main factors of the models: (a) AvAl2O3 (C1); (b) RxSiO2 (C1); (c) AvAl2O3 (C2); (d) RxSiO2 (C2); (e) AvAl2O3 (C3), and (f) RxSiO2 (C3).
Figure 7.
Linear representation of the coefficients and main factors of the models: (a) AvAl2O3 (C1); (b) RxSiO2 (C1); (c) AvAl2O3 (C2); (d) RxSiO2 (C2); (e) AvAl2O3 (C3), and (f) RxSiO2 (C3).


Table 1.
Results of the prediction of AvAl2O3 with the models for each cluster.
| Models | Mean of Residuals | RMSEP (%) | RE (%) | RPD | Preprocessing Method (No. of Factors in the Model) |
|---|---|---|---|---|---|
| C1 | 0.24 | 0.85 | 1.63 | 1.98 | Mean-centered (5) |
| C2 | 0.35 | 1.24 | 2.37 | 1.98 | Mean-centered (4) |
| C3 | −0.30 | 1.71 | 3.58 | 2.90 | Mean-centered (5) |
Table 2.
Results of the prediction of RxSiO2 with the models for each cluster.
| Models | Mean of Residuals | RMSEP (%) | RE (%) | RPD | Preprocessing Method (No. of Factors in the Model) |
|---|---|---|---|---|---|
| C1 | −0.28 | 0.49 | 10.72 | 2.38 | Standardized (3) |
| C2 | −0.14 | 0.78 | 17.90 | 2.04 | Mean-centered (5) |
| C3 | −0.11 | 0.78 | 19.16 | 1.36 | Standardized (4) |
Publisher’s Note: MDPI stays neutral with regard to jurisdictional claims in published maps and institutional affiliations. |
© 2021 by the authors. Licensee MDPI, Basel, Switzerland. This article is an open access article distributed under the terms and conditions of the Creative Commons Attribution (CC BY) license (https://creativecommons.org/licenses/by/4.0/).
Share and Cite
MDPI and ACS Style
Melo, C.C.A.; Angélica, R.S.; Paz, S.P.A. A Method for Quality Control of Bauxites: Case Study of Brazilian Bauxites Using PLSR on Transmission XRD Data. Minerals 2021, 11, 1054. https://0-doi-org.brum.beds.ac.uk/10.3390/min11101054
AMA Style
Melo CCA, Angélica RS, Paz SPA. A Method for Quality Control of Bauxites: Case Study of Brazilian Bauxites Using PLSR on Transmission XRD Data. Minerals. 2021; 11(10):1054. https://0-doi-org.brum.beds.ac.uk/10.3390/min11101054
Chicago/Turabian StyleMelo, Caio C. A., Rômulo S. Angélica, and Simone P. A. Paz. 2021. "A Method for Quality Control of Bauxites: Case Study of Brazilian Bauxites Using PLSR on Transmission XRD Data" Minerals 11, no. 10: 1054. https://0-doi-org.brum.beds.ac.uk/10.3390/min11101054
Note that from the first issue of 2016, this journal uses article numbers instead of page numbers. See further details here.