Article

A MiniSandwich Experiment with Blended Ca-Bentonite and Pearson Water—Hydration, Swelling, Solute Transport and Cation Exchange

1
Karlsruher Institut für Technologie (KIT), Kompetenzzentrum für Materialfeuchte (IMB-CMM), 76344 Eggenstein-Leopoldshafen, Germany
2
Ingenieur-Gesellschaft für Sensorik in der Umwelttechnik mbH (ISU), 76185 Karlsruhe, Germany
3
Institut für Gebirgsmechanik (IfG), 04279 Leipzig, Germany
4
Stephan Schmidt KG, 65599 Dornburg-Langendernbach, Germany
*
Author to whom correspondence should be addressed.
Submission received: 29 July 2021 / Revised: 21 September 2021 / Accepted: 23 September 2021 / Published: 28 September 2021

Abstract

:
Shaft seals are geotechnical barriers in nuclear waste deposits and underground mines. The Sandwich sealing system consists of alternating sealing segments (DS) of bentonite and equipotential segments (ES). MiniSandwich experiments were performed with blended Ca-bentonite (90 mm diameter and 125 mm height) to study hydration, swelling, solute transport and cation exchange during hydration with A3 Pearson water, which resembles pore water of Opalinus Clay Formation at sandy facies. Two experiments were run in parallel with DS installed either in one-layer hydrate state (1W) or in air-dry two-layer hydrate (2W) state. Breakthrough at 0.3 MPa injection pressure occurred after 20 days and the fluid inlet was closed after 543 days, where 4289 mL and 2984 mL, respectively, passed both cells. Final hydraulic permeability was 2.0–2.7 × 10⁻¹⁷ m2. Cells were kept for another 142 days before dismantling. Swelling of DS resulted in slight compaction of ES. No changes in the mineralogy of the DS and ES material despite precipitated halite and sulfates occurred. Overall cation exchange capacity of the DS does not change, maintaining an overall value of 72 ± 2 cmol(+)/kg. Exchangeable Na+ strongly increased while exchangeable Ca2+ decreased. Exchangeable Mg2+ and K+ remained nearly constant. Sodium concentration in the outflow indicated two different exchange processes while the concentration of calcium and magnesium decreased potentially. Concentration of sulfate increased in the outflow, until it reached a constant value and chloride concentration decreased to a minimum before it slightly increased to a constant value. The available data set will be used to adapt numerical models for a mechanism-based description of the observed physical and geochemical processes.

1. Introduction

Shaft and drift-sealing systems for a nuclear waste repository and in deep underground mines limit the fluid inflow from the adjacent rock in the early stage after closure of the repository or a mine. In mines, partial active areas are protected from sudden fluid inflow, and in repositories and mines the release of possibly contaminated fluids at later stage are prevented, or at least delayed [1]. Current German concepts of shaft seals of nuclear waste repositories contain the hydraulic Sandwich sealing system as a component of the lower seal in the host rock [2].
The Sandwich sealing system consists of alternating sealing segments (DS) of bentonite and equipotential segments (ES), which are characterized by a higher hydraulic conductivity. Within ES, fluid is evenly distributed over the cross section of the seal. Water bypassing the seal via the excavation damaged zone (EDZ) or penetrating the seal inhomogeneously is contained and a more homogeneous hydration and swelling of the DS is obtained.
Proof of functionality of the system has been provided in semi-technical scale experiments [3,4] for different host rocks. In 2019, an in-situ large-scale experiment was launched at the Mont Terri Rock Laboratory (Mont Terri RL, Switzerland) in the sandy facies of the Opalinus clay to address the interaction between the sealing system and a potential host rock [5]. The sandy facies of the Opalinus clay at Mont Terri RL corresponds to the clay formation in the generic site model SOUTH [6] of the potential clay host rock in Germany.
Additional semi-technical scale experiments and extensive laboratory tests are carried out for material development and material parametrization to supplement the in-situ experiment by modeling. The current study covered MiniSandwich experiments [7] with blended Ca-bentonite to study hydration, swelling, solute transport and cation exchange during hydration with Pearson water.
The pore water of the Opalinus clay at Mont Terri Rock Laboratory (Mont Terri RL) (Pearson water) contains 150–250 mmol·L−1 NaCl. The concentration of divalent cations and anions is lower than 15% of the cations and anions, respectively [8,9,10].
The current German concept for engineered barriers does not specify a bentonite but two national bentonites from Bavaria (Calcigel, Clariant) and Westerwald (Secursol UHP, Stephan Schmidt KG) would be available [5]. Both bentonites are Ca-bentonites. Cation exchange in the interlayer of the swellable clay minerals [11], together with anion exchange, dissolution, and precipitation of secondary phases will take place during the hydration of the sealing system with a pore fluid, mainly containing sodium cations until geochemical equilibrium is obtained. Thereby, alteration of the hydration of the bentonites as well as hydraulic conductivity and swelling pressure is expected.
Cation exchange and reactive solute transport during the early stage of the hydration of engineered barriers was observed at elevated temperatures from the Long-Term Test of Buffer Material (LOT) and the Alternative Buffer Material (ABM) test at Äspö Hard Rock Laboratory (Äspö HRL) (e.g., [12,13,14,15]), but pore fluid composition at Äspö HRL and Mont Terri RL differ in composition and sealing systems will not be exposed to elevated temperatures. The objective of the current study was to enhance the understanding of hydromechanical behavior and reactive solute transport during hydration of a Sandwich-sealing system composed of Ca-bentonite under the inflow of A3 Pearson water, which resembles Opalinus Clay pore water at sandy facies [8,9].

2. Materials and Methods

2.1. Materials and Experimental Setup

Fine sand N45 (Nivelsteiner Sandwerke und Sandsteinbrüche GmbH, Herzogenrath, Germany) [11] was used for ES. The bentonite Secursol UHP (Ruppach, Lower Saxony, Germany) by the Stephan Schmidt group (Langendernbach, Germany) with a smectite content of about 80% (Table 1) from a batch of granular material, also used in a semi-technical scale experiment (HTV-6), was used in a material blend for the DS. The specific density (ρs) of Secursol UHP of 2.77 g/cm3 calculated from the phase content was confirmed by measurement after drying at 200 °C with a He pycnometer (Pycnomatic ATC Porotec, Hofheim, Germany).
The Westerwald bentonite is from the Miocene age and consists of highly altered tuffs from the late Oligocene age. Secursol UHP is characterized by a very high swelling pressure of >4 MPa at a dry density of about 1.55 g/cm3, which even exceeds 10 MPa at higher dry densities [5]. Therefore, the bentonite was blended with N45 to reduce its smectite content, and thus its swelling pressure, to avoid damage of the oedometer cells.
Pearson water [16] close to A3 composition [8,17] which resembles the pore fluid of the sandy facies of Opalinus clay at Mont Terri URL [9] (Table 2), perfused the MiniSandwich columns. The ionic strength was 0.5 M. The Pearson water was prepared in two batches.
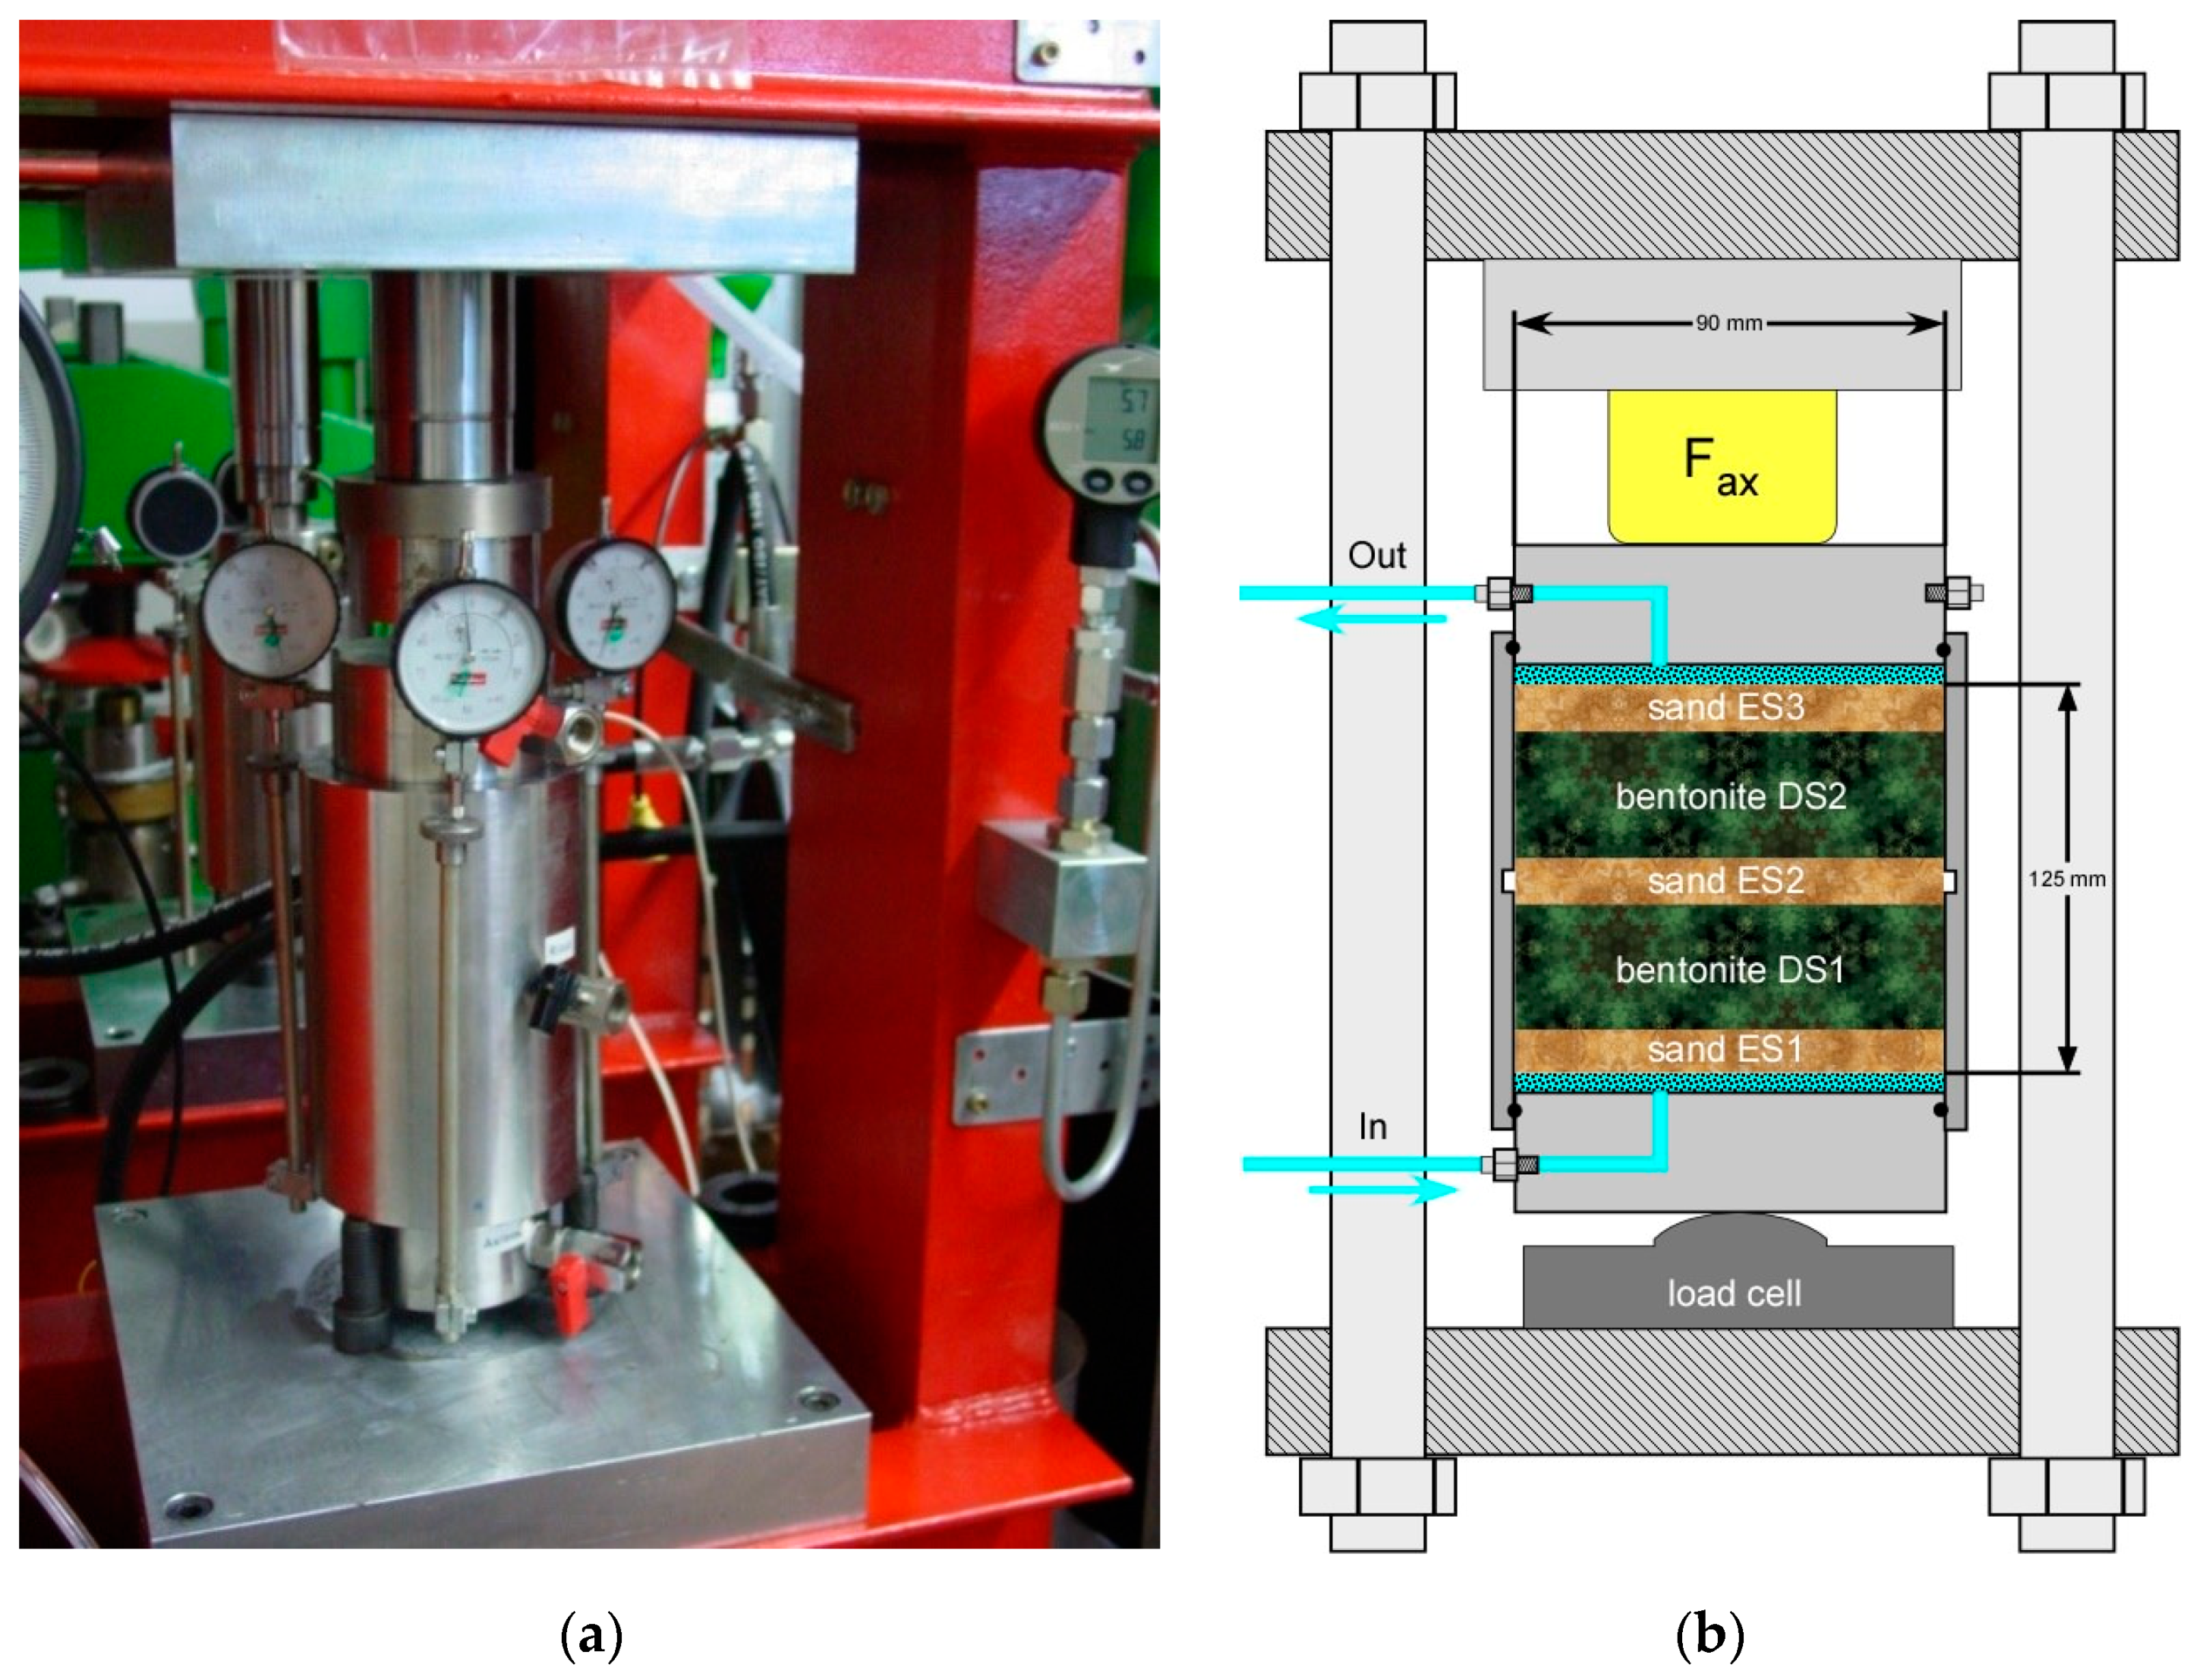
The MiniSandwich specimens consisted of three ES sandwiched by two DS of blended bentonite (Figure 1b), separated by filter papers (manufacturer: Macherey-Nagel, material: cellulose, pore size: 7.0–12.0 µm). The diameter of the columns was 90 mm and a total sample height of 125 mm was envisaged. Actual sample heights of 130 and 131 mm, respectively, were obtained (Table 3). Sample heights decreased to 129.2 and 129.8 mm, respectively, by applying the axial load prior to the start of the hydration.
Two experiments were run in parallel with the bentonite in DS, installed either in air-dry state (cell 10) or after conditioning by drying over a concentrated H2SO4 solution atmosphere for several months (cell 9) to study different initial hydration states of the smectite (Table 4). The water content of the bentonite determined at (105 °C) 200 °C was (13.3%) 16.5% in air dry state and (0.9%) 3.9% after drying at very low relative humidity. Only the water content determined at 200 °C will be used for further calculations.
One aliquot of bentonite (dry weight) was mixed with 0.28 aliquots of N45 (water content <0.1%) resulting in a starting water content in DS of 3.1% (cell 9) and 12.9% (cell 10). The specific density of the blend was 2.75 g/cm3. The bentonite sand mixture could be compacted only to a dry density (ρd) between 1.26 and 1.33 g/cm3 (Table 3), and a very low resulting EMDD (Dixon et al. 1985) between 0.95 and 1.02 g/cm3. The N45 in ES was installed with a ρd of 1.56 g/cm3.
For the MiniSandwich experiments modified oedometer cells with two movable pistons and filter plates for adjusting well-defined saturation conditions [18] were located in hydraulic load frames (Figure 1a). The axial strain/displacement was measured by three gauges (rotated by 120°) and was regularly reset to zero by increasing or decreasing the axial load measured by a load cell. Thus, during the tests, axial expansion due to swelling of the sample has been reset recompacting the material to the initial volume to keep the MiniSandwich under quasi-constant volume conditions.
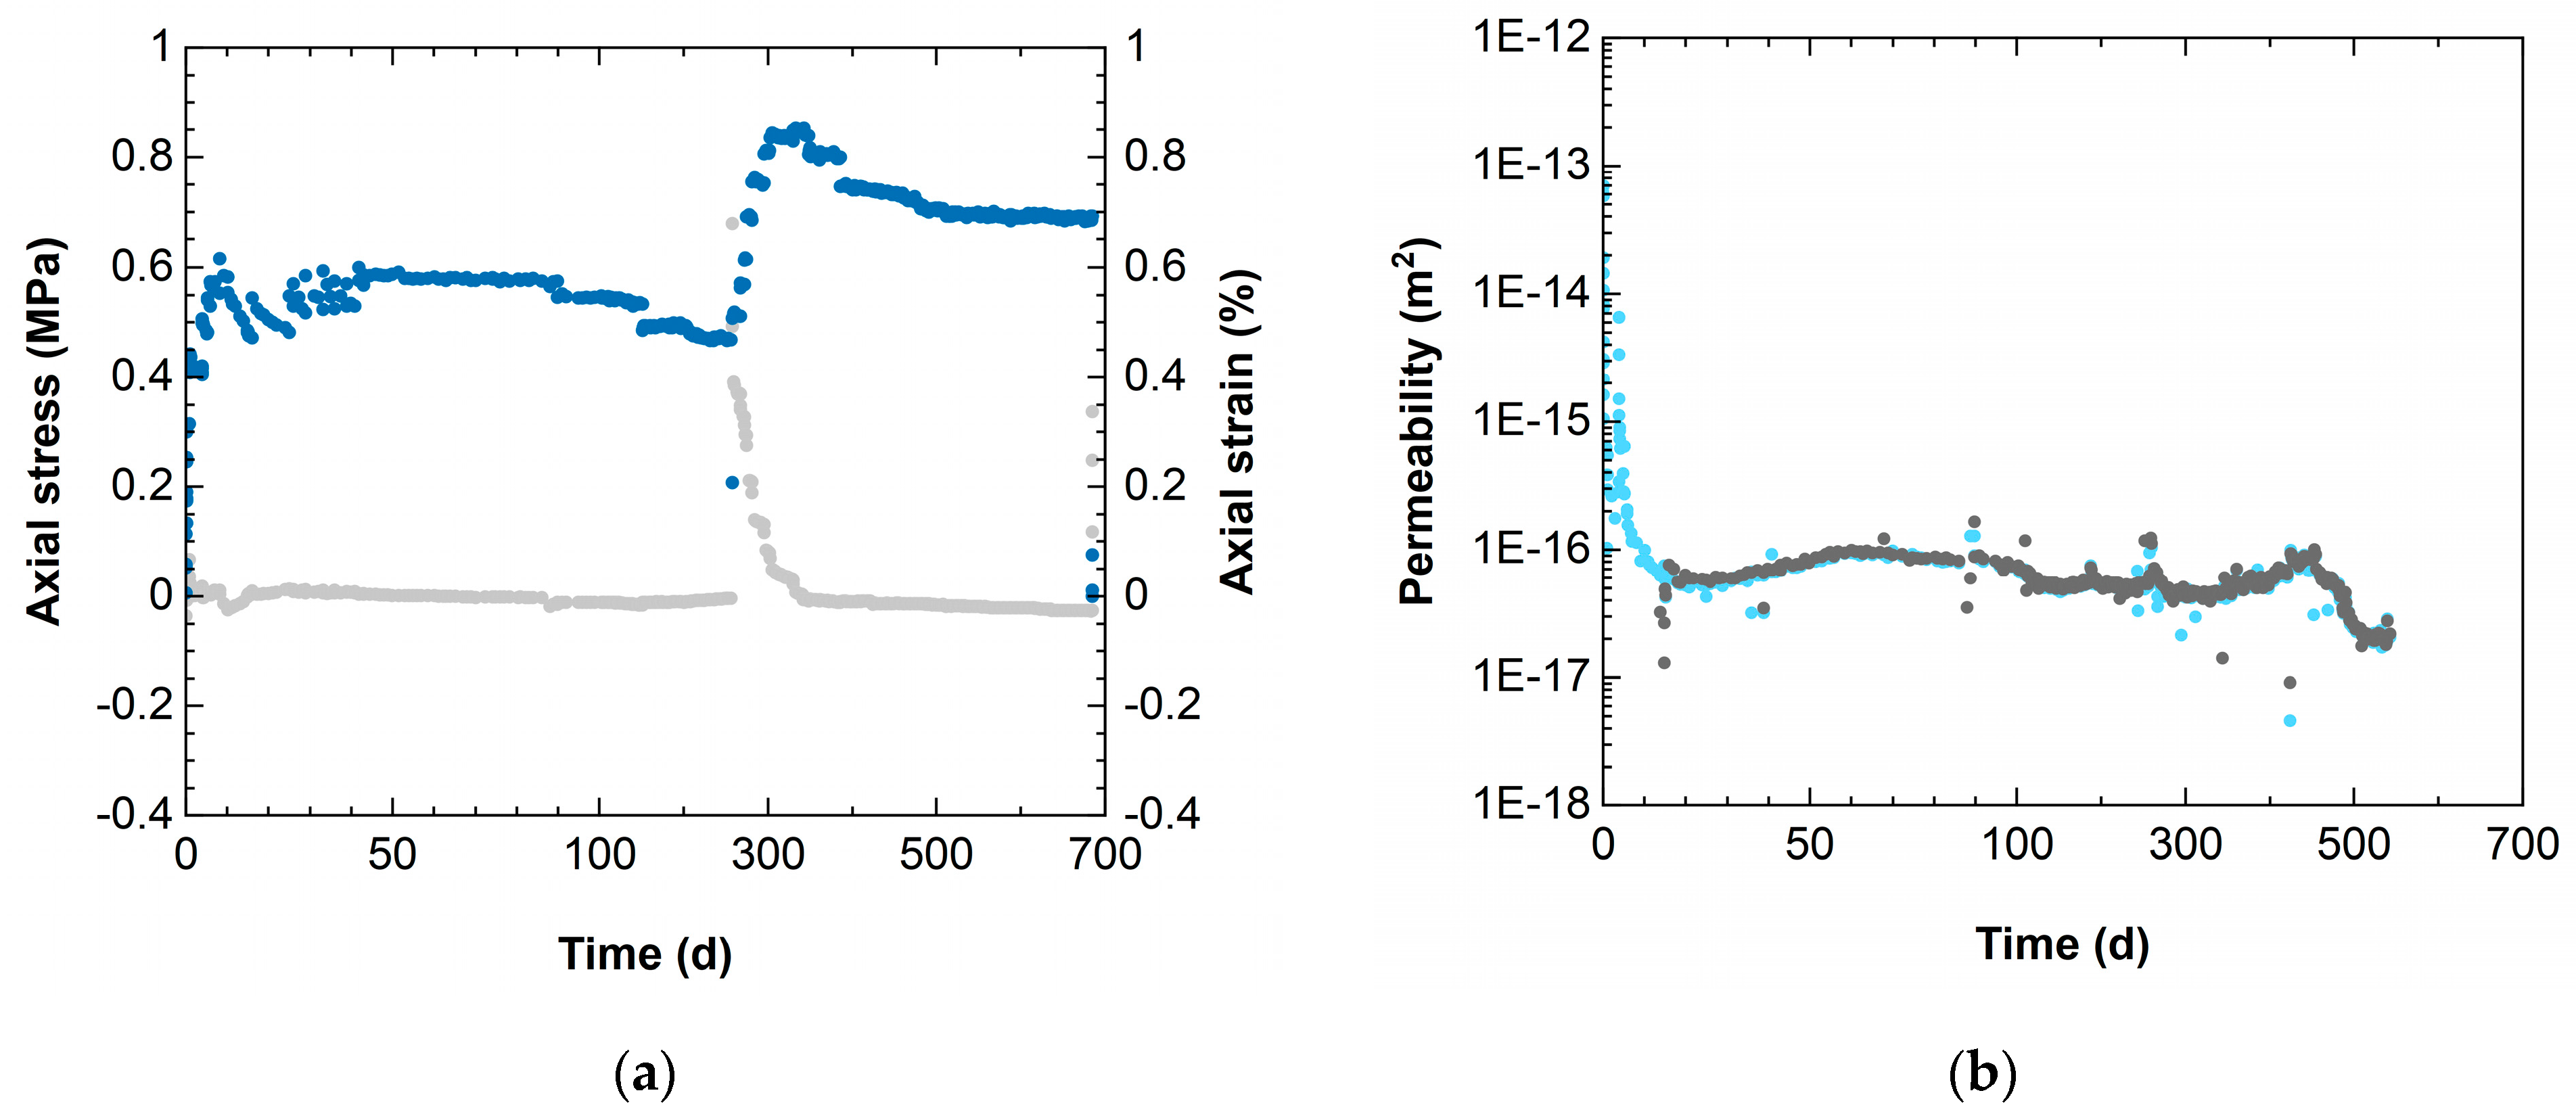
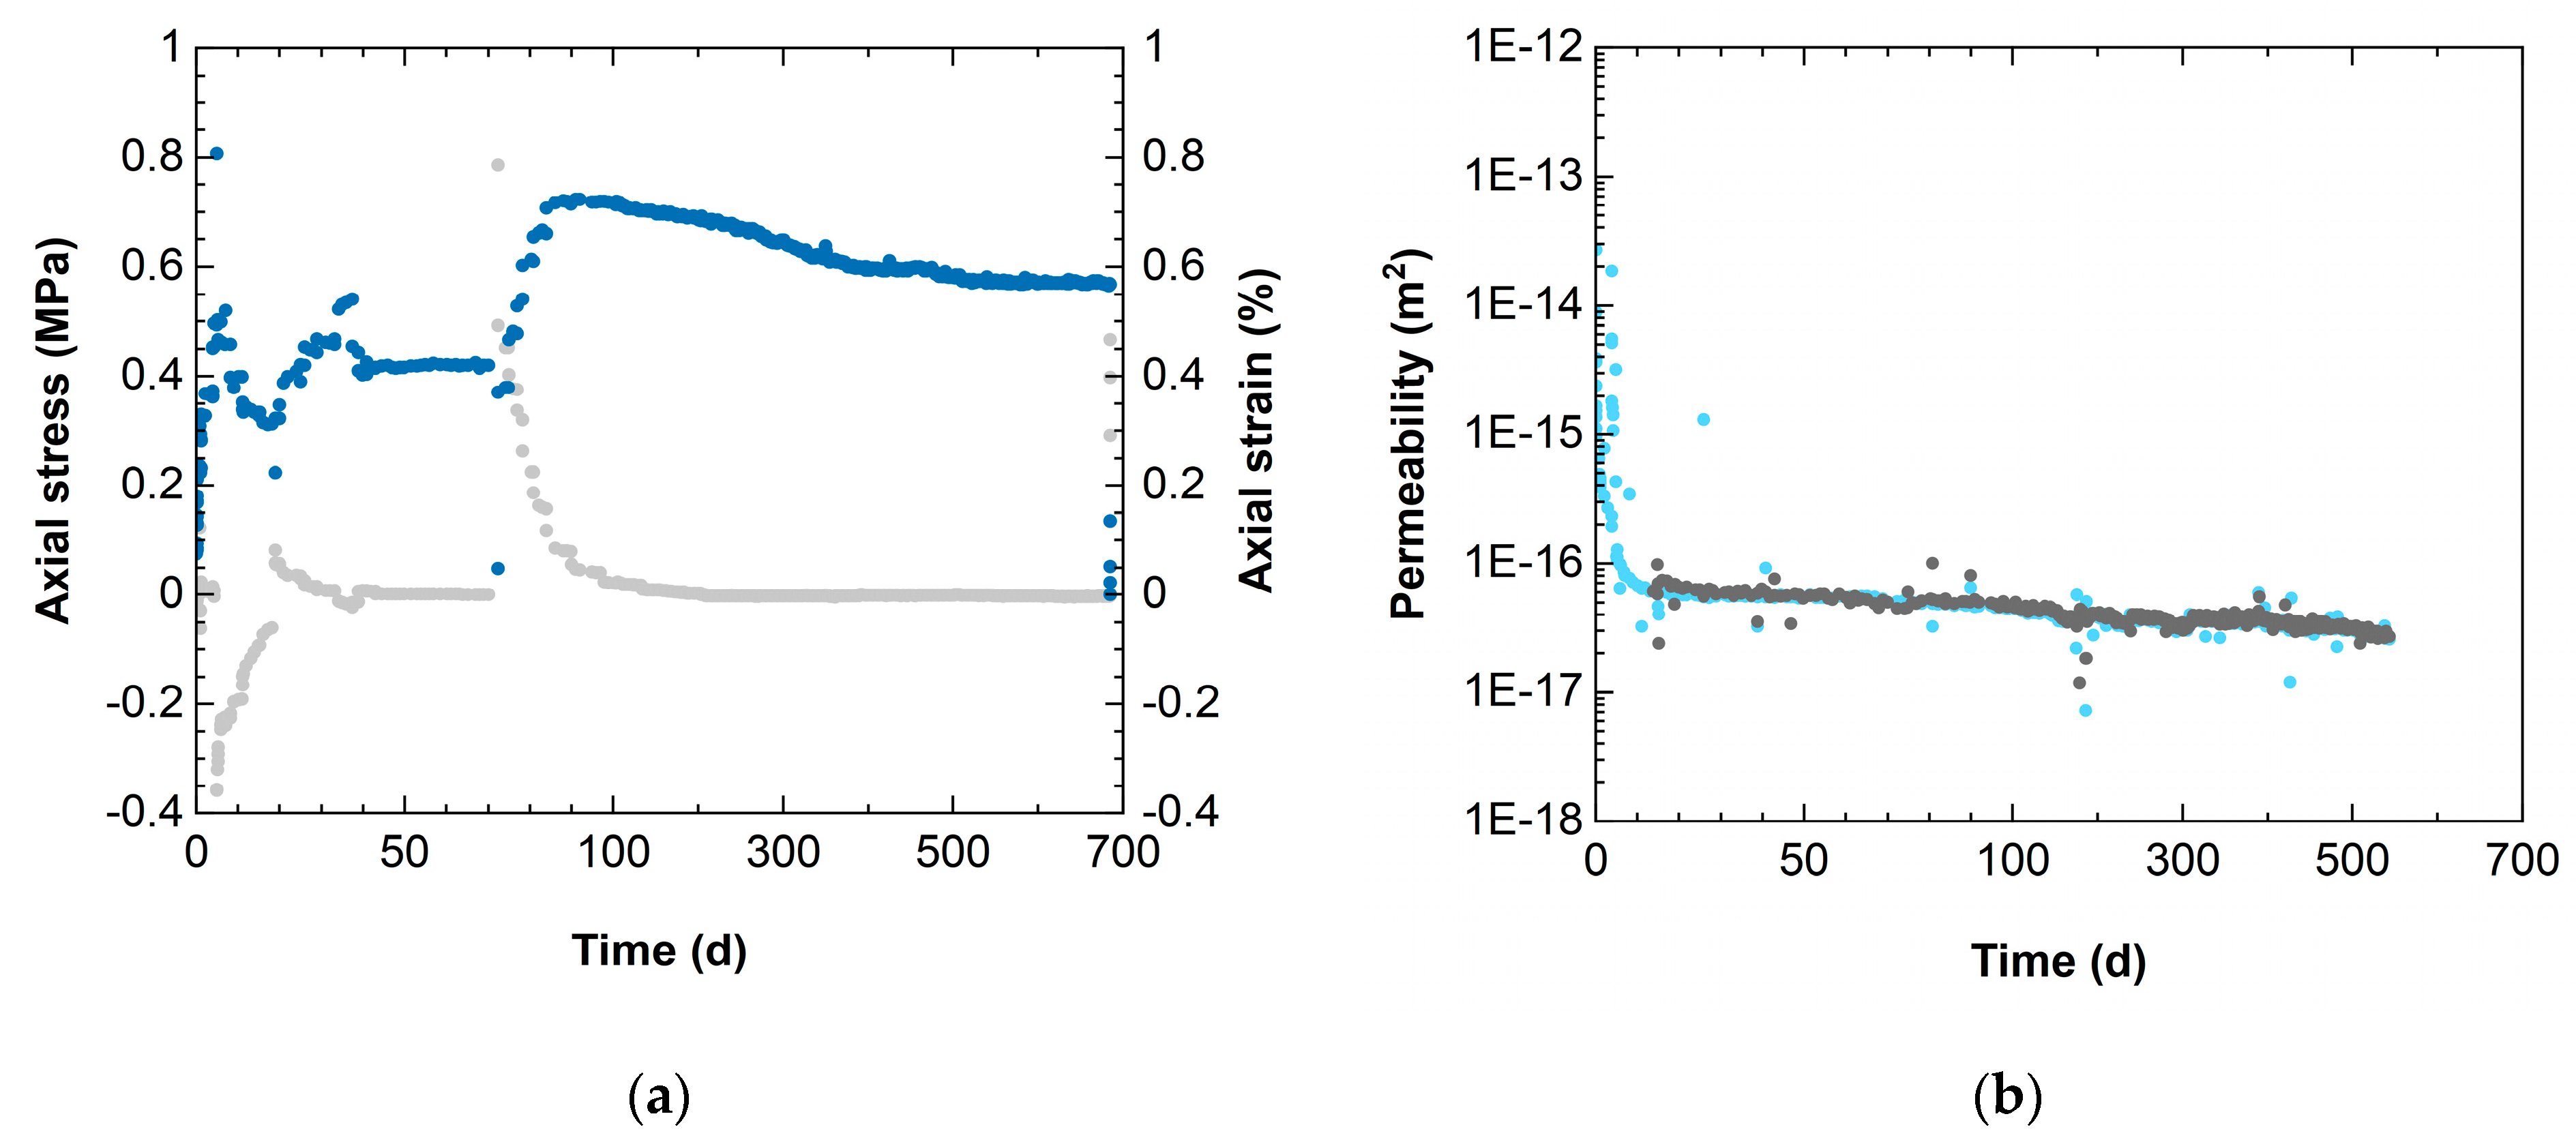
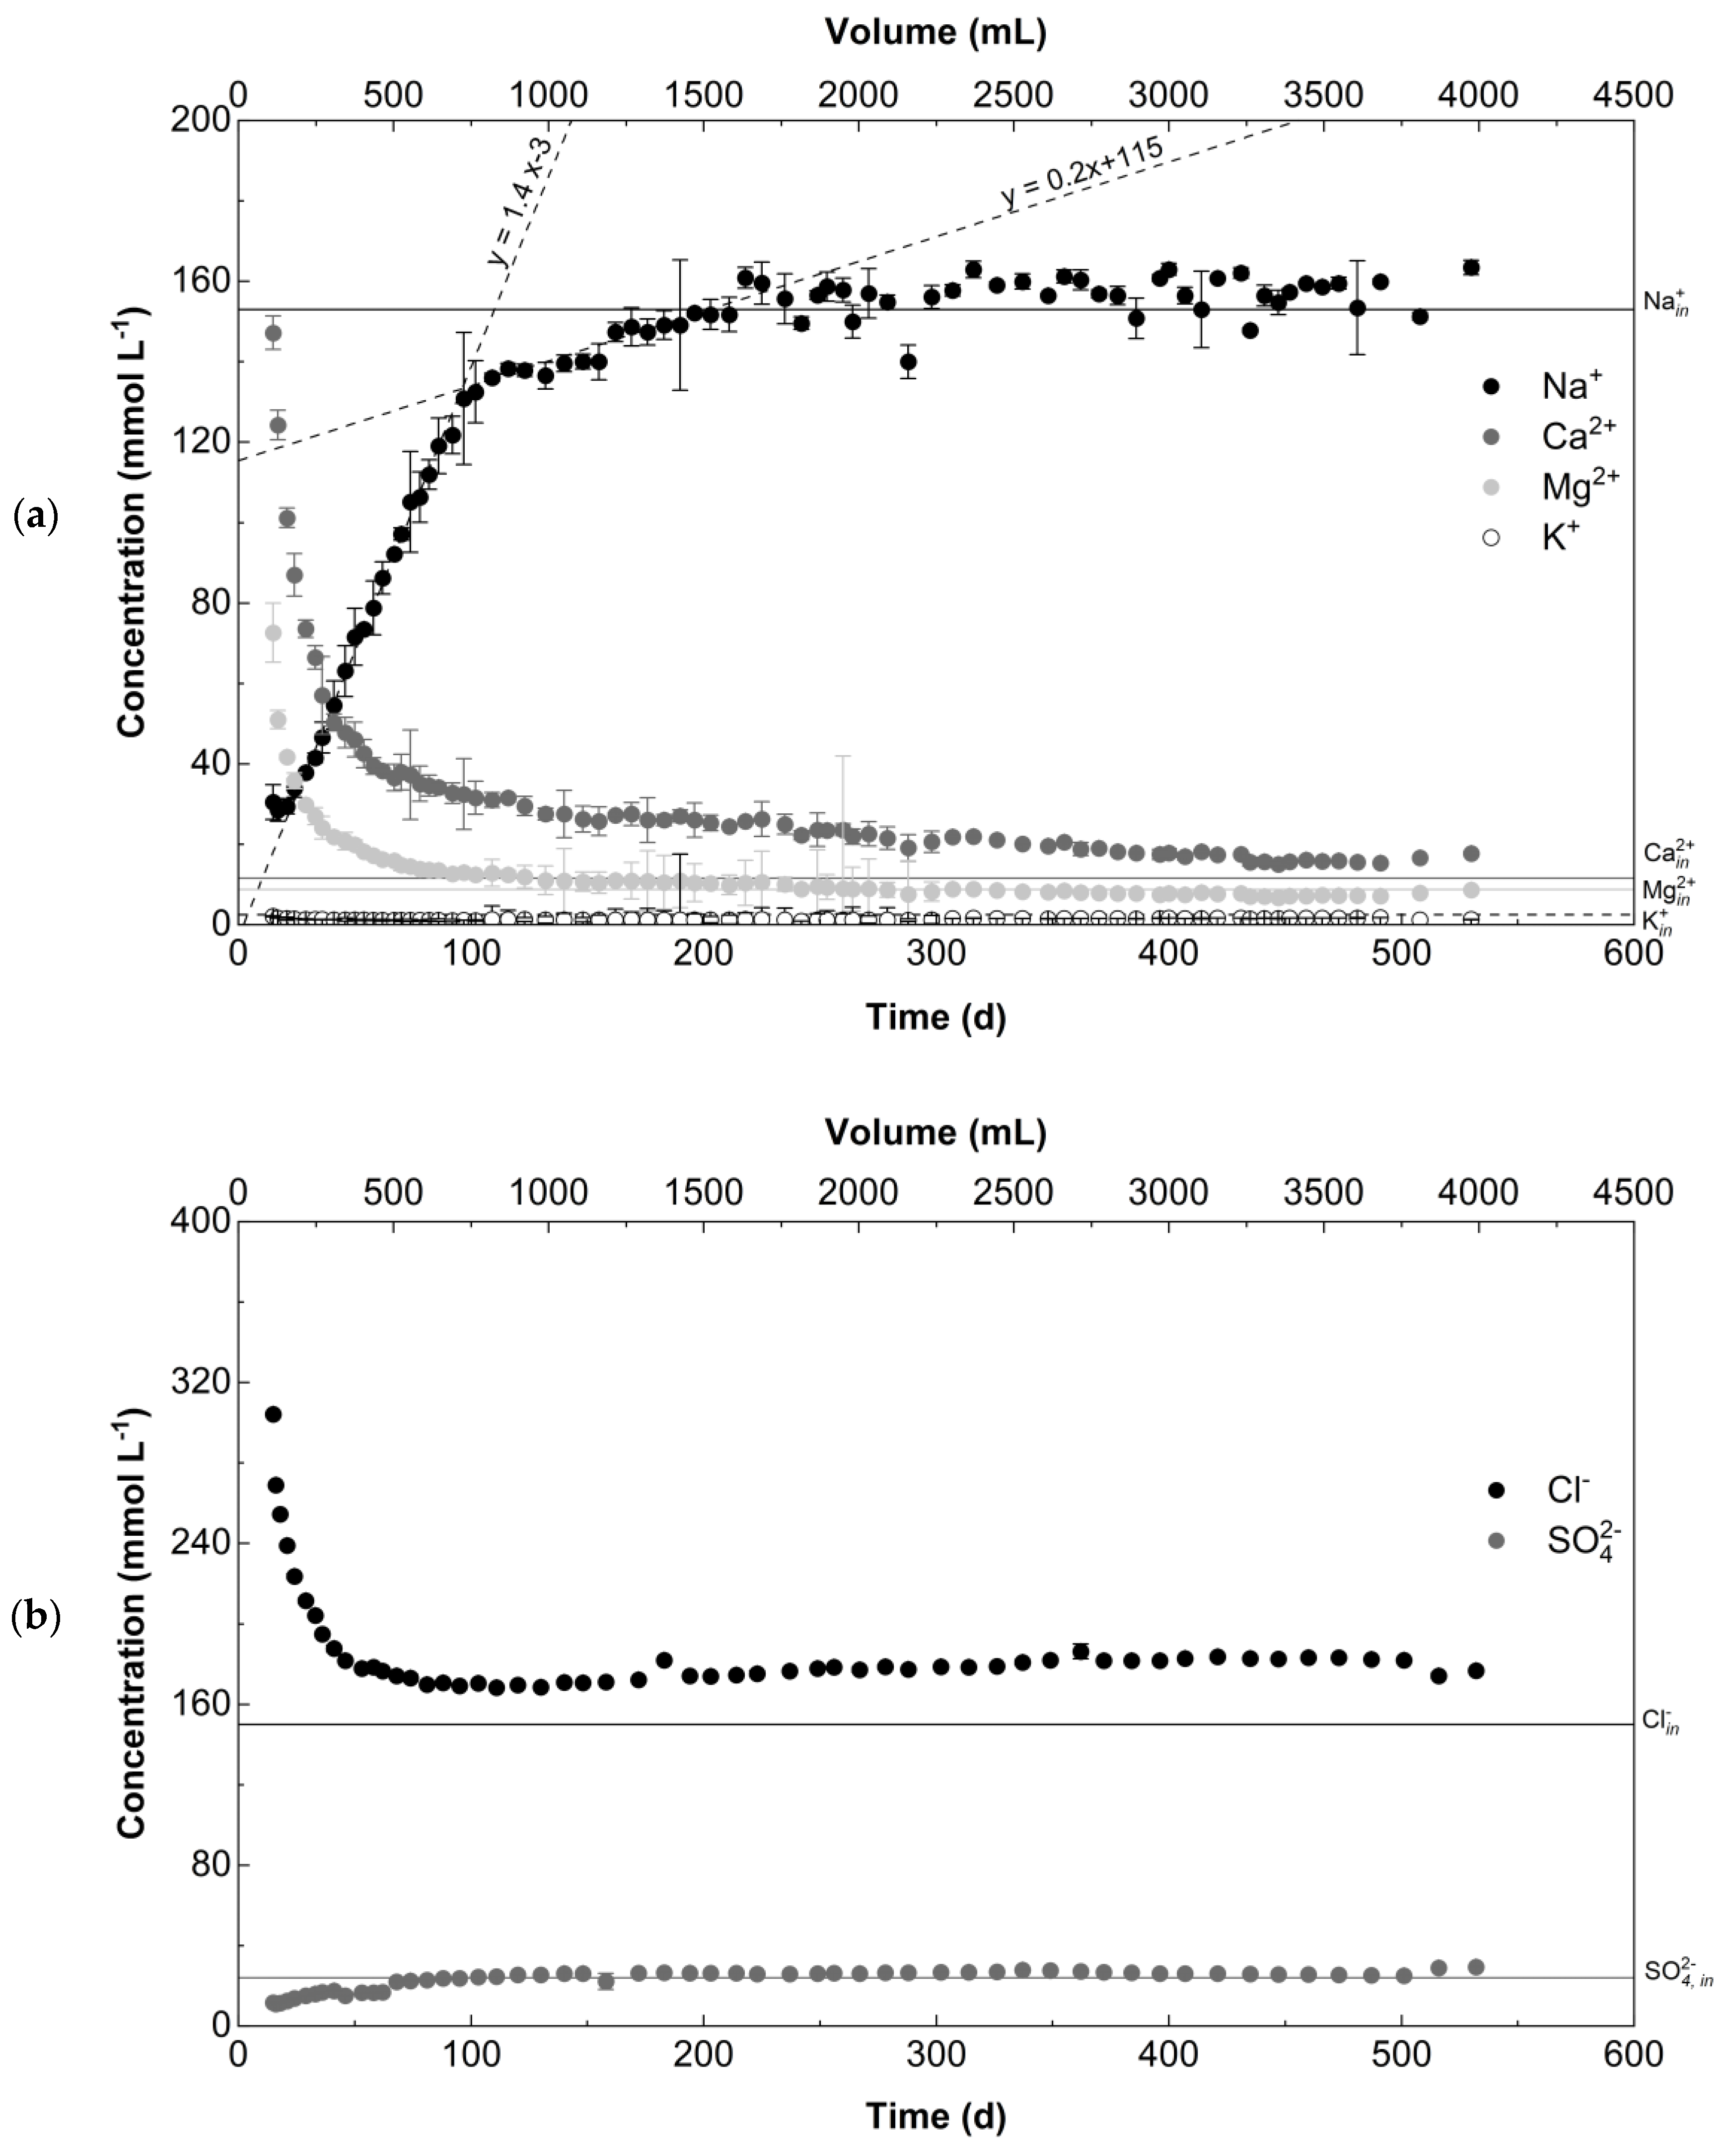
After installation, the initial gas permeability defined the starting conditions. It was determined with nitrogen by average of five measurements of the gas pressure difference to atmospheric pressure (0.12–0.18 MPa) at gas flow between 200 and 1000 mL/min (Bronkhorst F-231M flow controller). The injection pressure of Pearson water was 0.1 MPa and increased to 0.3 MPa after 4 days. After 543 days, the fluid inlet was closed and the experiments were run for another 142 days. During saturation, the development of the swelling pressure and the fluid volume balance (in- and outflow) were monitored and the stationary fluid permeability was calculated. After saturation and development of steady-state flow conditions, the outflow fluid was collected to determine its ion content for studying ion transport and cation exchange processes. Both columns were dismantled after 685 days and analyzed for water content and chemical/mineralogical changes.

2.2. Methods

2.2.1. Sampling

Immediately after unloading of the oedometer cells the upper pistons and filter plates were removed. In a stepwise dismantling procedure from top to bottom, each of the different sandwich segments was uncovered and probed. In both experiments, the upper filter plates were found to be nearly saturated with the fluid. Two samples were taken in each segment, one for determination of the water content (about 50–100 g each) and the other one for determination of the chemical and mineralogical composition/changes (about 50 g of each ES and about 250 g of each DS). Samples for determination of water content were immediately placed in the oven after initial weighing. Samples for chemical and mineralogical analyses were shrink-wrapped in foil until further analysis.
The fabric of the dismantled DS in both cells was still characterized by recognizable bentonite granules and fine sand grains. The following analyses were performed with homogenized material and separated bentonite granules were studied if additional information was expected.

2.2.2. Water Content

The water content and moisture of the materials were determined mostly in duplicate after heating at 105 °C and 200 °C for 24 h or until constant weight (Δm < 0.1%) was obtained [19]. Heating to 200 °C is necessary to dehydrate swellable clay minerals [20] in bentonites. The water content was calculated with respect to dry mass of the sample after heating, while moisture was calculated in relation to the initial mass of the sample.

2.2.3. X-ray Diffraction Analysis (XRD)

Mineralogical quantification of Secursol UHP was performed by X-ray diffraction (XRD) measurements on powder samples < 500 µm. Samples were milled using the McCrone Micronizing mill with zirconium oxide cylindrical grinding elements (McCrone Microscopes and Accessories, Westmont, IL, USA). A Bruker D8 Advance A25 diffractometer (Bruker AXS GmbH, Karlsruhe, Germany) equipped with a LYNXEYE XE Detector (opening degree 2.94° and 192 channels) was used. Patterns were recorded between 2 and 80° 2θ with CuKα radiation, a counting time of 2 s and a step size of 0.02° 2θ, a fixed slit of 0.18°, Soller collimator of 2.5° (primary and secondary side) and an automatic knife edge for powder samples. Rietveld software PROFEX 4.3.2 (Nicola Döbelin, Solothurn, Switzerland) was utilized for quantitative analysis [21]. Quantitative phase content was converted in chemical composition and compared with chemical composition from X-ray fluorescence analysis (Supplementary Materials).

2.2.4. Cation Exchange Capacity (CEC), Exchangeable Cations (EC) and Cations in Pearson Water and Outflow Liquid

CEC was measured by the modified Cu-trien method according to Meier and Kahr [22]. Approximately 50 mg of ground sample were dispersed in a 15 mL centrifuge tube after adding 10 mL of Millipore water and 5 mL of a copper-triethylenetetramine (Cu-trien) solution of 0.01 mol/L by shaking for 3 h on a vibrating table. After centrifugation at 4500 rpm for 10 min (Multifuge 3S-R, Heraeus Holding GmbH, Hanau, Germany), the absorbance of the supernatants was measured at a wavelength (λ) of 580 nm with a UV–Vis spectrophotometer (Genesys 10 UV, Thermo Electron Corporation, Waltham, MA, USA) using polystyrene microcuvettes (Lab logistics Groups GmbH, Meckenheim, Germany) with a path length of 1 cm. The concentrations of Cu-trien in the supernatants were determined from a calibration curve and CEC [cmol(+)/kg] was calculated on the basis of the depletion of the supernatant by uptake of Cu-Trien by the smectite. The concentrations of exchangeable cations were analyzed from supernatant after dilution (if required) and acidification with HNO3 (1M Suprapur) by inductively-coupled plasma–optical emission spectrometry (ICP-OES) (Optima 8300 DV, Perkin Elmer Inc., Waltham, MA, USA). Cations in Pearson water and outflow liquid were measured in the same way by ICP-OES.

2.2.5. Aqueous Leachate/Soluble Ions and Anions in Pearson Water and Outflow Liquid

Approximately 2 g of the sample were weighed into 50 mL centrifuge tube and dispersed in 40 mL of Millipore water by shaking for 24 h on a vibrating table. Thereafter, the samples were centrifuged at 4500 rpm for 10 min. Conductivity and temperature were measured in the supernatant using conductometer WTW LF 318 (Xylem Analytics Germany Sales GmbH and Co. KG, Weilheim in Oberbayern, Germany). The pH was measured with pH strips (Merck, pH 4.0–7.0 Special indicator).
The supernatant was filtered through a 0.45 µm filter (syringe filter, cellulose acetate, d = 25 mm, LLG-Labware GmbH, Meckenheim, Germany). Cations were analyzed by ICP-OES method and anions by ionic chromatography (Dionex Aquion IC System with Autosampler by Thermo Fisher Scientific GmbH, Dreieich, Germany). Anions in Pearson water and outflow liquid were measured in the same way by IC.

3. Results

3.1. Geotechnical Parameters

Both cells were installed with identical dry densities and thus resulting porosity (Table 3). Due to the different hydration state and water content of the DS material 5.3% of the total porosity and 7.7% of the porosity of both DS in cell 9 were filled with water, while 21.7% of the total porosity and 31.5% of the porosity of both DS in cell 10 were already filled with water after installation.
Right at the start of the hydration/re-saturation 44.2 mL of liquid entered cell 9, and 45.4 mL liquid went into cell 10 within 5 min of starting the hydration. Thereby, ES1 in both cells were saturated. Fluid uptake and inflow permeability decreased strongly in both cells (Figure 2 and Figure 3) until a fast breakthrough after 14 d was observed for both cells. The fluid breakthrough in cell 9 occurred after a fluid uptake (difference inflow/outflow fluid volume) of 359 mL, that corresponded to a saturation of 94.5%. The breakthrough in cell 10 was accompanied with a fluid uptake of 309 mL corresponding to a saturation of 98%. Actual fluid uptake was 4.5% and 2.5% higher than calculated (Table 3 and Table 5). After the breakthrough 4289 mL and 2984 mL, respectively, Pearson water passed the outflow of cell 9 and 10 until termination of the experiment.
Inflow permeability was higher in cell 9 than in cell 10 until breakthrough. Afterwards hydraulic permeability decreased very slowly to 2–2.7 × 10⁻¹⁷ m2 until the experiment was terminated (Figure 2 and Figure 3).
A pressure loss in the hydraulic storage medium and thus a power loss in the hydraulic cylinder that ensures the constant volume of the MiniSandwich occurred in cell 9 at day 258 and in cell 10 at day 72 which resulted in free swelling of the MiniSandwich. After compensation of the pressure loss the volume was constant again (axial strain 0%) and an increased swelling pressure was observed, which decreased only slightly during 200–250 d until it was close to constant in both cells. The total axial stress was slightly higher in cell 9 than in cell 10 (Table 4). Despite of the diameter/height ratio of 1:1.5 friction effects of the material at the cell walls were negligible because of the limited axial displacement (volume constancy). Thus, the measured total axial stress corresponds to the overall swelling pressure.

3.2. Volume Changes Due to Swelling of DS

Under the assumption of full saturation, the volume change and change in dry density of each DS and ES were calculated from the water content during dismantling (Table 5). DS in cell 9 and cell 10 expanded up to 7%, while expansion was equal in DS1 and DS2 of cell 9 and only DS1 expanded in cell 10. Thereby, the fine sand in all ES was compacted to a dry density of 1.66 g/cm3 which is slightly above its measured ρd,max (1.644 g/cm3) and in the range of measurement uncertainty.

3.3. Cation Exchange Capacity (CEC) and Exchangeable Cations (EC)

Secursol UHP is a Ca,Mg-bentonite with a CEC of 93 cmol(+)/kg (Table 6). By blending the bentonite the smectite content in DS was 58.6% and the CEC of the DS material was 73 cmol(+)/kg. The apparent pH of dispersed Secursol UHP was 4.7. After dismantling, a slightly lower average CEC was measured in DS of cell 9 and cell 10 (Table 7), but deviation is in the range of measurement uncertainty. The exchangeable Na+ strongly increased from 0.7 to 24–29 cmol(+)/kg while exchangeable Ca2+ decreased by about 1/3 from 42 to 25–30 cmol(+)/kg with lower values in DS1 of cell 9 and cell 10. Exchangeable Mg2+ was nearly constant in DS of both cells compared to the initial Mg2+ of the installed bentonite blend. Exchangeable K+ was very low in DS of both cells but increased slightly. Exchangeable Fe3+ was slightly higher in DS1 of cell 10 but in any other DS was close to the value of the initial blend. Sum of exchangeable cations now equaled the measured CEC (Table 7).

3.4. Cations in Outflow and Soluble Cations (SC)

Sodium concentration in the outflow of both cells increased with a steep linear slope during the first 100 days. Afterwards, the Na concentration increased further with a linear but less steep slope up to 200 days (cell 9) and 300 days (cell 10), respectively, until it reached a nearly constant value of about 157 and 150 mmol/L (Figure 4 and Figure 5) corresponding to the inflow concentration. For cell 10 a slight decrease in Na concentration was observed around day 100 and 300 of the experiment at the beginning of each change in slope of outflow concentration (Figure 5). The concentration of Ca, Mg and K decreased potentially (x−1/2) approaching asymptotically a concentration close to the concentration of each cation in the inflow Pearson water (Figure 4 and Figure 5). Thereby the calcium concentration was 16 and 20 mmol/L for cell 9 and 10, respectively, and thus slightly higher than 11.6 mmol/L in the inflow. The asymptotic concentrations of Mg and K were 7.2/8.7 mmol/L and 1.6/1.5 mmol/L, respectively, for cell 9 and 10.
The cumulative amount of Na in the volume of Pearson water that passed the MiniSandwich cells was 1.29 (cell 9) and 0.93 (cell 10) times of the initial CEC of the DS and the cumulative amount of Na in the outflow amounted 1.15 and 0.74 times the initial CEC of the DS, respectively, in cell 9 and cell 10. Corresponding values were 0.20/0.14 and 0.48/0.40 (Ca), 0.15/0.11 and 0.20/0.16 (Mg) and 0.02/0.02 and 0.01/0.01 (K). The resulting ratio of cations in the outflow to cation input into each MiniSandwich (cell 9/cell 10) to was 0.89/0.80 (Na), 2.44/2.88 (Ca), 1.36/1.50 (Mg) and 0.54/0.52 (K).
After dismantling, in ES of both cells 56–104% of the expected soluble Na was found with lowest values in the outer ES1 and ES3 of cell 9 and highest values in the outer ES1 and ES3 of cell 10. Both Ca and Mg showed a similar distribution pattern in ES of both cells (Table 8). In contrast, less than 56% of expected soluble K was found after dismantling in ES of both cells, but, again, the distribution pattern was the same as for the other cations. No soluble Fe3+ was measured in ES of both cells.
In contrast the soluble Na in the DS of both cells was twice as high as expected and the concentrations of soluble Ca, Mg and K were five to seven times higher than expected from water content (Table 8). About 0.02 to 0.04 mg/g Fe were found in DS of both cells. The molar ratio of soluble cations to soluble anions was about 3.7 (Table 7) in DS of both cells while it was about 6.4 in the raw Secursol UHP (Table 6) and 0.64–0.82 in the ES of both cells after dismantling.

3.5. Anions in Outflow and Soluble Anions (SA)

The Cl/SO42− weight ratio was 2.31 (molar ratio 6.25, Table 2) in the inflow Pearson water and 2.55 (molar ratio 6.9) in the outflow of cell 9 and 2.66 (molar ratio 7.2) in the outflow of cell 10 (Figure 4 and Figure 5). In contrast, the Cl/SO42− weight ratio in the DS was 0.51/0.47 in cell 9 and 0.50/0.43 in cell 10 (Table 9). In ES the Cl/SO42− weight ratio varied between 0.42 and 0.69 with the lowest ratio in ES3 of cell 9 and ES2 in cell 10 and the highest ratio in ES1 of both cells (Table 9). Thereby, the SO42− concentration was significantly higher than expected from water content and SO42− concentration in the Pearson water while the Cl concentration was only about 39–77% of the expected concentration in DS of both cells (Table 9).

3.6. Charge Balance of Cations and Anions in the Outflow

The nearly constant concentrations of ions in the outflow added up to 204 mmol(+)/L cations and 217 mmol(−)/L anions in cell 9 and 210 mmol(+)/L cations and 217 mmol(−)/L anions in cell 10. In contrast, the cumulative amount in the total outflow volume was 924 mmol(+) cations and 894 mmol(−) anions in cell 9 and 631 mmol(+) cations and 582 mmol(−) anions in cell 10.

3.7. Phase Content

No changes in the mineral phase content were observed by XRD, but changed hydration state of the air-dry bentonite in DS blend material was observed by decrease of the basal space from 14.9 Å to <14 Å prominently detectable from the d001 reflection (Figure S1, Supplementary Materials). Samples from ES showed no alteration to the original mineral phases of the N45 sand. Reflections corresponding to halite and gypsum appeared in ES samples from both cells, however, the amount was below the limit of quantification (Figure S2, Supplementary Materials).
STA curves of evolved water (Figure S3, Supplementary Materials) of air-dry bentonite in DS blend material showed a single dehydration peak compared to the characteristic dehydration peak with a shoulder at higher temperatures of the air-dry raw Secursol UHP with mainly exchangeable divalent Ca2+ and Mg2+. Only small changes were observed for the CO2/carbonate traces in the bentonite after dismantling, where the shoulder between 200 and 300 °C and a small peak between 850 and 950 °C disappeared for the bentonite granules (Figure S3, Supplementary Materials) but were still visible in the blended DS material (data not shown). MS curves of evolved SO2 of the bentonite granules showed decomposition of sulfates between 400 and 700 °C, 800 and 1000 °C and above 1000 °C, that precipitated during drying of the samples (Figure S3, Supplementary Materials) even more pronounced in the blended DS material (data not shown).
ES material showed evolved water between 100–200 °C which corresponded to dehydration of sorbed water, not present in the original N45 material. Limited changes occur to the carbonate peak centered on 370 °C in N45 material, which was broadened for all ES and shifted to around 350 °C in ES3 in both cells. A sharp carbonate peak also appeared at 607 °C in ES3 of cell 10. Several ES also showed sulfate decomposition occurring between close to 900 and 1000 °C and above 1000 °C (Figure S4, Supplementary Materials).

4. Discussion

4.1. Hydromechanical Behavior

Fast breakthrough in both cells occurred very quickly due to the low dry density in DS during installation and the fabric resulting from blending of bentonite granules with fine sand. Thereby breakthrough occurred at saturation slightly below 100%. Due to the low dry density and the reduced smectite content, the initial hydration state of the smectite had no influence on the breakthrough time and only a small influence on the axial stress (i.e., the swelling pressure). In cell 9, the smectite underwent a volume change by increasing of the unit cell in c direction of 26.5% due to the transition from 1W into 2W hydration. In cell 10, the bentonite in the DS was already in 2W hydration state and thus swelling lead only to small changes in the interlayer height (i.e., volume of unit cell). The swelling pressure in cell 9 was diminished by the larger inter-aggregate pores in the bentonite/sand blend in the DS where the swelling granules could expand.
The 1W hydration state of the DS in cell 9 resulted in larger inflow permittivity at the beginning of the experiments and about 45% higher volume of Pearson water that went through the MiniSandwich compared to cell 10 until both cells were terminated.
Permeability in cell 9 showed three separate increases of about a half order of magnitude in the course of the experiment while the underlying trend was a continuous slow decrease after saturation and breakthrough. First, the breakthrough might have enabled discrete flow paths that caused a temporary faster fluid flow. These paths slowly closed and the permeability decreased again. The second and third increase of the permeability might have been similarly caused by local changes in the discrete fluid pathways due to the more pronounced swelling of the bentonite granules in cell 9 and a rearrangement of the inter-aggregate pores in the DS as described for pure bentonites in Meleshyn, et al. [23].
Accurate determination of swelling pressures under consideration of the heterogeneity of the MiniSandwich setup with different material segments is a challenge, because the axial effect of swelling DS is partly compensated by compacting the sand in ES. However, the selected experimental MiniSandwich setup corresponds to the arrangement used in real shaft conditions, which facilitates a realistic upscaling. As already mentioned, the measured axial stress necessary to ensure volume constancy during the test corresponds to the swelling pressure of the whole sandwich. Thereby, it is worth to noting that the applied maximum hydraulic pressure to ensure saturation over the experimental time is about half of the maximum swelling pressure of the MiniSandwich (swelling pressure for cell 9: 0.7 MPa; for cell 10: 0.6 MPa). Only in the beginning of the experiment was a stepwise increase of the axial strain required to ensure the water access to the material (Figure 2a and Figure 3a). In the later state of the experiments, the axial load remained nearly constant, which indicated that stationary conditions for swelling and fluid flow were reached.
The initial gas permeability was also influenced by the hydration state of the bentonite and was slightly higher in cell 9 than in cell 10, while the resulting fluid permeability was similar in both cells after saturation at a very low value of 2.0 × 10⁻¹⁷ m2 (Table 4). The initial gas permeability was in the range of the gas permeability of pure Secursol UHP, around ×10−12 m2, installed with ρd = 1.31 g/cm3 [5]. Deviation is again explained by the blending of the bentonite in the DS with fine sand.

4.2. Mineralogical/Geochemical Behavior

No transformation of the smectite into another clay mineral in the DS of both cells in the course of the experiment could be detected by XRD, but XRD and STA measurements showed a different hydration behavior of the smectite equilibrated at ambient conditions (40–60% r.h. and 22–25 °C) after dismantling that was induced by the Na+ exchange into the smectite interlayer observed by the CEC/EC measurements.
Furthermore, no changes occurred in the carbonate traces of the bentonite in DS of both cells after dismantling but MS curves of evolved SO2 showed decomposition of sulfates, while the raw Secursol UHP did not contain any sulfate. No crystalline sulfates were detectable by XRD. Thus, their concentration was very low in the bentonite samples and, in addition, they were precipitates that are expected to have a very fine crystal/grain size. Both low concentrations and small size lower the decomposition temperature during STA strongly up to 200 K compared to tabulated values [24] which makes assignment of the observed peaks in the MS curves of the evolved SO2 tenuous. In any case, decomposition temperature would increase in the order Na2SO4 < MgSO4 < CaSO4 and thus, the three intervals observed for evolved SO2 indicate all three sulfates precipitated either in the course of the experiment and/or mainly during drying of the samples after dismantling. Both processes cannot be distinguished without geochemical modelling or microfluidic experiments, like those described by Poonoosamy, et al. [25,26]. It seemed that pores in bentonite granules and inter-granular pores in DS blended materials formed different microreactors for dissolution/precipitation reactions.
The deficit between the sum of exchangeable cations and the CEC of the raw Secursol UHP could be explained by protons as the pH of the dispersed bentonite was slightly acidic. Protons are not detectable by ICP-OES in the supernatant of the CEC measurement. In the course of the experiment, these protons are only partially replaced by cations of the through flowing Pearson water. The sum of exchangeable cations in DS of both cells after dismantling equaled the CEC but a strong increase of soluble cations (Table 8) added to the sum of exchangeable cations. The charge imbalance of soluble cations and anions is explained by HCO3.
Excess soluble sulfate in the DS and ES after dismantling indicate precipitation of sulfates in the course of the experiment and not only during drying of the samples after dismantling, although an enrichment in soluble cations was only observed in the DS of both cells. Thereby, Fe was observed only as soluble cation in DS but not in ES.
Imbalance of cation and anion concentrations in the solids and in the fluids indicate that neither ES nor DS materials were already in equilibrium with the Pearson water and observed ion concentration gradients in ES and DS of both cells have to be modelled for the throughflow experiment that was followed by a batch experiment with adapted numerical models for a mechanism-based description of the observed physical and geochemical processes.

5. Summary and Conclusions

The Sandwich sealing system, which consists of sealing segments (DS) of bentonite and equipotential segments (ES) of higher hydraulic conductivity, is a component in the German concept of shaft seals for nuclear waste deposits. Functionality was proved on semi-technical scale experiments. An in-situ large-scale demonstration experiment is running at the Mont Terri rock laboratory (Switzerland) that addresses the interaction between the Sandwich sealing system and the Opalinus clay. Prediction and evaluation of the in-situ behavior of the Sandwich sealing system require numerical models for a mechanism-based description of the observed physical and geochemical processes. These models can be validated with MiniSandwich experiments as performed in the current study.
Current MiniSandwich experiments were performed with blended Ca-bentonite (Secursol UHP) and Pearson water. Two experiments were run in parallel with DS installed at the same dry density but either in 1W hydration state or in air-dry (2W) state. Breakthrough and and almost complete saturation occurred at 0.3 MPa injection pressure very fast after 20 days due to the modified fabric of the compacted bentonite blend and a reduced EMDD in the DS. While the influence of the hydration state of the smectite on the break-through was masked by blending the bentonite with a coarser material 4289 mL and 2984 mL, respectively, passed the cell with DS installed in 1W and 2W state within 543 d. Influence of the hydration state of DS during installation on initial and final hydraulic permeability (2.0–2.7 × 10¹⁷ m2) was also masked by the blending of the DS material and hydraulic permeability in both cells was nearly constant, but still decreased slightly.
Swelling of DS resulted in slight compaction of ES, up to 7%. There were no changes in the mineralogy of the DS and ES material, despite precipitated halite and sulfates occurring, and no changes in CEC of the bentonite blend were observed. While halite precipitated during drying after dismantling sulfates also could have precipitated in the course of the experiments. Exchangeable Na+ strongly increased while exchangeable Ca2+ decreased. Exchangeable Mg2+ and K+ remained nearly constant. Sodium concentration in the outflow indicated two different exchange processes, while the concentration of calcium and magnesium decreased potentially. Concentration of sulfate- increased in the outflow until it reached a constant value, and concentration of chloride decreased to a minimum before it slightly increased to a constant value. While cations and anions in the outflow are nearly balanced with respect to their charge, the imbalance of cation and anion concentrations in the solids and in the cumulated outflow volume indicated that neither ES nor DS materials were already in equilibrium with the Pearson water.

Supplementary Materials

The following are available online at https://0-www-mdpi-com.brum.beds.ac.uk/article/10.3390/min11101061/s1, X-ray fluorescence (XRF), Table S1: Chemical composition of Secursol UHP, Simultaneous Thermal Analysis (STA), Figure S1: XRD pattern of powdered DS samples, Figure S2: XRD patterns of powdered ES samples, Figure S3: Mass spectrometer curves for DS; Figure S4: mass spectrometer curves for ES.

Author Contributions

Conceptualization, K.E., F.K., R.S., C.R. and T.P.; methodology, K.E., E.B. and C.R.; analysis, C.R., E.B. and K.E.; resources, S.H. and R.D.; data curation, K.E.; writing—original draft preparation, K.E. and E.B.; writing—review and editing, K.E., E.B., C.R., T.P., R.S., F.K., S.H. and R.D.; visualization, K.E., C.R. and E.B.; project administration, K.E. and R.S.; funding acquisition, K.E. and R.S. All authors have read and agreed to the published version of the manuscript.

Funding

This research was funded by the German Federal Ministry for Economic Affairs and Energy (BMWi) under 02 E 11587 and 02 E 11799.

Data Availability Statement

Not Applicable.

Acknowledgments

The authors would like to thank Laure Delavernhe, Peter Bohac (former members of CMM) and Nadja Werling (IMB-CMM, KIT) for preparation of Pearson water, preliminary bentonite characterization, analysis of ions in outflow liquid and STA measurements. We thank Maya Denker and Elisabeth Eiche (AGW, KIT) for several IC measurements while our equipment was broken, Marita Heinle (IFG, KIT) for ICP-OES measurements and Silke Berberich (IMB-CMM, KIT) for many IC and ICP-OES measurements. Thanks also to Thomas Wilsnack and his colleagues (IBeWa) for measurement of the specific density of the bentonite and Matthias Schellhorn (SSKG) who made us aware of the bentonite Secursol UHP. Wiebke Baille and Michael Skubisch (RUB) are thanked for the determination of maximum dry density of N45 according to DIN 18126. We acknowledge support by the KIT-Publication Fund of the Karlsruhe Institute of Technology.

Conflicts of Interest

The authors declare no conflict of interest. The funders had no role in the design of the study; in the collection, analyses, or interpretation of data; in the writing of the manuscript, or in the decision to publish the results.

References

  1. Gruner, M. Utilization of bentonite in wase disposal mining; Einsatz von Bentonit im Entsorgungsbergbau. Bergbau 2010, 61, 394–403. [Google Scholar]
  2. Kudla, W.; Herold, P. Zusammenfassender Abschlussbericht für das Verbundvorhaben Schachtverschlüsse für Endlager für Hochradio-Aktive Abfälle (ELSA—Phase 2): Konzeptentwicklung für Schachtverschlüsse und Test von Funktionselementen von Schachtverschlüssen; Technische Universität Bergakademie Freiberg; BGE Technology GmbH: Freiberg, Germany, 2021. [Google Scholar]
  3. Königer, F.; Emmerich, K.; Kemper, G.; Gruner, M.; Gaβner, W.; Nüesch, R.; Schuhmann, R. Moisture spreading in a multi-layer hydraulic sealing system (HTV-1). Eng. Geol. 2008, 98, 41–49. [Google Scholar] [CrossRef]
  4. Schuhmann, R.; Emmerich, K.; Kemper, G.; Königer, F. Verschlusssystem mit Äquipotenzialsegmenten für die Untertägige Entsorgung (UTD und ELA) Gefährlicher Abfälle zur Sicherherstellung der Homogenen Befeuchtung der Dichtelemente und zur Verbesserung der Langzeitstabilität: Schlussbericht; Karlsruher Institut für Technologie: Karlsruhe, Germany, 2009. [Google Scholar]
  5. Emmerich, K.; Schuhmann, R.; Königer, F.; Bohac, P.; Delavernhe, L.; Wieczorek, K.; Czaikowski, O.; Hesser, J.; Shao, H. Joint Project: Vertical Hydraulic Sealing System Based on the Sandwich Principle—Preproject (Sandwich-VP): Joint Final Report; Karlsruher Institut für Technologie: Karlsruhe, Germany, 2020. [Google Scholar]
  6. Jobmann, M.; Bebiolka, A.; Jahn, S.; Lommerzheim, A.; Maßmann, J.; Meleshyn, A.; Mrugalla, S.; Reinhold, K.; Rübel, A.; Stark, L.; et al. Sicherheits- und Nachweismethodik für ein Endlager im Tongestein in Deutschland—Synthesebericht; BGE Technology GmbH: Peine, Germany, 2017; p. 137. [Google Scholar]
  7. Roelke, C.; Emmerich, K.; Shao, H.; Popp, T.; Koeniger, F.; Schuhmann, R. The MiniSANDWICH: Fully Controlled Lab Testing and HM Modelling of a Bentonite Based SANDWICH Shaft Seal System; CMM: Karlsruhe, Germany, 2019; pp. 153–165. [Google Scholar]
  8. Pearson, F.J. Artificial Waters for Use in Laboratory and Field Experiments with Opalinus Clay: Status June 1998; Mont Terri Technical Note 99-31; Paul Scherrer Institut: Villigen, Switzerland, 1998. [Google Scholar]
  9. Pearson, F.J.; Arcos, D.; Bath, A.; Boisson, J.Y.; Fernández, A.M.; Gäbler, H.E.; Gaucher, E.; Gautschi, A.; Griffault, L.; Hernán, P.; et al. Mont Terri Project: Geochemistry of Water in the Opalinus Clay Formation at the Mont Terri Rock Laboratory; Office Fédéral des Eaux et de la Géologie OFEG: Bern, Switzerland, 2003; Volume 5. [Google Scholar]
  10. Van Loon, L.; Soler, J.; Bradbury, M. Diffusion of HTO, 36Cl and 125I in Opalinus Clay samples from Mont Terri: Effect of confining pressure. J. Contam. Hydrol. 2003, 61, 73–83. [Google Scholar] [CrossRef]
  11. Emmerich, K.; Kemper, G.; Königer, F.; Schlaeger, S.; Gruner, M.; Gaßner, W.; Hofmann, M.; Nüesch, R.; Schuhmann, R. Saturation Kinetics of a Vertical Multilayer Hydraulic Sealing System Exposed to Rock Salt Brine. Vadose Zone J. 2009, 8, 332–342. [Google Scholar] [CrossRef]
  12. Karnland, O.; Olsson, S.; Dueck, A.; Birgersson, M.; Nilsson, U.; Hernan-Håkansson, T.; Pedersen, K.; Nilsson, S.; Eriksen, T.E.; Rosborg, B. Long Term Test of Buffer Material at the Äspö Hard Rock Laboratory, LOT Project: Final Report on the A2 Test Parcel; TR-09-29; Svensk Kärnbränslehantering AB: Oskarshamn, Sweden, 2009. [Google Scholar]
  13. Dohrmann, R.; Kaufhold, S. Characterization of the Second Package of the Alternative Buffer Material (ABM) Experiment; II Exchangeable Cation Population Rearrangement. Clays Clay Miner. 2017, 65, 104–121. [Google Scholar] [CrossRef]
  14. Dohrmann, R.; Olsson, S.; Kaufhold, S.; Sellin, P. Mineralogical investigations of the first package of the alternative buffer material test—II. Exchangeable cation population rearrangement. Clay Miner. 2013, 48, 215–233. [Google Scholar] [CrossRef]
  15. Wallis, I.; Idiart, A.; Dohrmann, R.; Post, V. Reactive transport modelling of groundwater-bentonite interaction: Effects on exchangeable cations in an alternative buffer material in-situ test. Appl. Geochem. 2016, 73, 59–69. [Google Scholar] [CrossRef]
  16. Wersin, P.; Mazurek, M.; Waber, N.; Mäder, U.; Gimmi, T.; Rufer, D.; De Haller, A. Rock and Porewater Characterisation on Drillcores from the Schlattingen Borehole; NAGRA: Wettingen, Switzerland, 2013; p. 343. [Google Scholar]
  17. Pearson, F.J. Artificial Waters for Use in Laboratory and Field Experiments with Opalinus Clay; Internal Report; Paul Scherrer Institut: Villigen, Switzerland, 1998; pp. 44–98. [Google Scholar]
  18. Popp, T.; Rölke, C.; Salzer, K. Hydromechanical properties of bentonite–sand block assemblies with interfaces in engineered barrier systems. In Gas Generation and Migration in Radioactive Waste Repositories; Shaw, R., Ed.; Geological Society: London, UK, 2015; Volume 415, pp. 19–33. [Google Scholar]
  19. DIN52102. Test Methods for Aggregates—Determination of Dry Bulk Density by the Cylinder Method and Calculation of the Ratio of Density; German Institute for Standardization: Berlin, Germany, 2013. [Google Scholar]
  20. Emmerich, K.; Giraudo, N.; Schuhmann, R.; Schnetzer, F.; Kaden, H.; Thissen, P. On the Prediction of Water Contents in Na-Saturated Dioctahedral Smectites. J. Phys. Chem. C 2018, 122, 7484–7493. [Google Scholar] [CrossRef]
  21. Doebelin, N.; Kleeberg, R. Profex: A graphical user interface for the Rietveld refinement program BGMN. J. Appl. Crystallogr. 2015, 48, 1573–1580. [Google Scholar] [CrossRef] [PubMed] [Green Version]
  22. Meier, L.P.; Kahr, G. Determination of the cation exchange capacity (CEC) of clay minerals using the complexes of copper (II) ion with triethylenetetramine and tetraethylenepentamine. Clays Clay Miner. 1999, 47, 386–388. [Google Scholar] [CrossRef]
  23. Meleshyn, A.Y.; Zakusin, S.V.; Krupskaya, V.V. Swelling Pressure and Permeability of Compacted Bentonite from 10th Khutor Deposit (Russia). Minerals 2021, 11, 742. [Google Scholar] [CrossRef]
  24. Smykatz-Kloss, W. Differential Thermal Analysis, Application and Results in Mineralogy; Springer: Berlin, Germany, 1974; p. 188. [Google Scholar]
  25. Poonoosamy, J.; Klinkenberg, M.; Deissmann, G.; Brandt, F.; Bosbach, D.; Mäder, U.; Kosakowski, G. Effects of solution supersaturation on barite precipitation in porous media and consequences on permeability: Experiments and modelling. Geochim. Cosmochim. Acta 2020, 270, 43–60. [Google Scholar] [CrossRef]
  26. Poonoosamy, J.; Westerwalbesloh, C.; Deissmann, G.; Mahrous, M.; Curti, E.; Churakov, S.V.; Klinkenberg, M.; Kohlheyer, D.; von Lieres, E.; Bosbach, D. A microfluidic experiment and pore scale modelling diagnostics for assessing mineral precipitation and dissolution in confined spaces. Chem. Geol. 2019, 528, 119264. [Google Scholar] [CrossRef]
Figure 1. Experimental setup. (a) Hydraulic testing rig with oedometer cell. Note the three strain gauges, measuring the axial displacement over the sample lengths; (b) Schematic sketch of the oedometer cell.
Minerals 11 01061 g001
Figure 2. (a) Axial strain (grey) and axial stress (blue) and (b) inflow (blue) and outflow (grey) permeability cell 9.
Minerals 11 01061 g002
Figure 3. (a) Axial strain (grey) and axial stress (blue) and (b) inflow (blue) and outflow (grey) permeability cell 10.
Minerals 11 01061 g003
Figure 4. Cation concentration (a) and anion concentration in outflow (b) of cell 9.
Minerals 11 01061 g004
Figure 5. Cation concentration (a) and anion concentration in outflow (b) of cell 10.
Minerals 11 01061 g005
Table 1. Phase content determined by XRD and specific grain density * of Secursol UHP.
Phase[wt.%][wt.%]ρs [g/cm3] *
2W #AnhydrousAnhydrous
Smectite (di)79752.75
Quartz10122.66
Kaolinite222.6
Mica (di)342.75
Feldspar (orthoclase)222.61
Anatase343.78
Traces §113.16
Total1001002.77
Note: * ρs calculated based on crystal structure. # air dried at ambient conditions with a 2W hydration state and water content of about 15.4% (measured at 200 °C). § apatite, rutile, hematite, maghemite (all detectable by XRD) and carbonates (only detectable by STA).
Table 2. Pearson water composition at sandy facies of Opalinus Clay [8], pH and liquid density (ρl).
TitleNa+Ca2+Mg2+K+HCO3ClSO42−Cl/SO42−pHρl
[mmol/L][–][–][g/cm3]
Target 116411.99.22.550.54160246.677.91.01
Batch 1 215311.68.72.5n.d.150246.257.71.01
Batch 223015.911.374.06n.d.230 330 37.67n.d.n.d.
[mg/L][–]
Target 1377047722410033567223052.46
Batch 1 2351746521198n.d.531823052.31
Batch 25288637276159n.d.815428822.83
Note: 1 [9,16]. 2 [5]. 3 estimated from cation content. n.d. not determined.
Table 3. Installation bulk (ρb) and dry density (ρd), porosity (n), pore volume (Vp), volume of water in pores during installation (Vw,i i) and saturation water content (ws) of cells 9 and 10.
Cell 9mhρbρdnVpVw,iws
[g][mm][g/cm3][g/cm3][%][mL][mL][%]
ES3158.79161.561.5641.442.1026.77
DS2357.2421.341.3052.8141.110.641.33
ES2158.79161.561.5641.442.1026.77
DS1357.3411.371.3351.7134.710.639.25
ES1158.79161.561.5641.442.1026.77
Sum1190.87131 48.3402.221.2
Cell 10mhρbρdnVpVw,iws
[g][mm][g/cm3][g/cm3][%][mL][mL][%]
ES3158.80161.561.5641.342.1026.77
DS2370.31411.421.2654.3141.542.343.58
ES2158.80161.561.5641.342.1026.77
DS1391.42411.501.3351.7134.744.739.25
ES1158.80161.561.5641.342.1026.77
Sum1238.13130 48.7401.787.0
Table 4. Water content of DS, hydration state of smectite and gas permeability during installation and final swelling pressure and fluid permeability of cell 9 and cell 10.
ParameterUnitCell 9Cell 10
Water content, W (200 °C)[%]3.112.9
Hydration state of smectite 1W2W
Gas permeability[m2]8.7 × 10−125.6 × 10⁻¹²
Swelling pressure[MPa]0.70.6
Fluid permeability[m2]2.0 × 10−172.7 × 10⁻¹⁷
Table 5. Water content (200 °C) (we), volume of water (VW), dry density and volume (height) change after dismantling of cell 9 and 10.
Cell 9weVwρdΔV or Δh
[%][mL][g/cm3][%]
ES322.8136.21.66−6.5
DS244.15153.01.253.7
ES222.8136.21.66−6.5
DS144.65154.81.246.6
ES124.7739.31.61−3.2
sum 419.6
Cell 10weVwρdΔV or Δh
[%][mL][g/cm3][%]
ES322.2535.31.68−7.5
DS243.27141.91.26−0.4
ES223.7837.81.64−4.8
DS144.94155.81.247.0
ES125.1239.91.60−2.6
sum 410.7
Table 6. CEC, exchangeable cations, conductivity of suspension and soluble cations and anions of Secursol UHP (granular material HTV-6 [5]).
CECNa+Ca2+Mg2+K+Fe3+SumClSO42−
[cmol(+)/kg][cmol(-)/kg]
930.954191.30.0375--
[mg/g][mg/g][mg/g][mg/g][mg/g][mg/g][mg/g][mg/g]
0.212.92.80.60.0117--
ConductivityNa+Ca2+Mg2+K+Fe3+SumClSO42−
[µS/cm][cmol(+)/kg][cmol(-)/kg]
36.80.341.110.810.140.833.20.20.3
[mg/g][mg/g][mg/g][mg/g][mg/g][mg/g][mg/g][mg/g]
0.080.220.100.050.150.60.050.13
Table 7. CEC, exchangeable cations, electric conductivity of supernatant suspension and soluble cations and anions (granular material HTV-6 [5]).
CECNa+Ca2+Mg2+K+Fe3+Sum
[cmol(+)/kg][cmol(+)/kg]
Blend * 730.742151.00.0259
Cell 9DS2742930141.70.0175
DS1702825142.00.0169
Cell 10DS2712430121.30.0367
DS1702527141.90.0669
ConductivityNaCaMgKFeSum *ClSO42−
[mS/cm][cmol(+)/kg][cmol(−)/kg]
Blend * 0.02870.30.90.60.10.72.60.160.23
Cell 9DS2 14740.70.1252.64.1
DS1 15750.80.1272.94.2
Cell 10DS2 11530.50.2202.54.3
DS1 14750.80.2262.33.5
Note: * calculated.
Table 8. Cation concentration in DS and ES after dismantling.
Cell 91234567891011121314
NaCaMgKFeNaCaMgKFeNaCaMgK
[mg/g][mg/g][mg/g][mg/g][mg/g][mg/g][mg/g][mg/g][mg/g][mg/g]c1:c6c2:c7c3:c8c4:c9
ES30.6980.0960.0360.0100.0000.8040.1060.0480.0220.000.870.900.740.46
DS23.1821.3390.4960.2810.0221.5560.2060.0940.0430.002.046.515.306.50
ES20.8370.1140.0420.0120.0000.8040.1060.0480.0220.001.041.070.870.56
DS13.3841.3100.5640.3110.0231.5740.2080.0950.0440.002.156.305.967.12
ES10.8420.1020.0440.0130.0000.8730.1150.0520.0240.000.960.880.840.55
Cell 10NaCaMgKFeNaCaMgKFeNaCaMgK
[mg/g][mg/g][mg/g][mg/g][mg/g][mg/g][mg/g][mg/g][mg/g][mg/g]c1:c6c2:c7c3:c8c4:c9
ES30.6950.1320.0340.0080.0000.7840.1040.0470.0220.000.891.270.730.36
DS22.6191.0110.3560.2130.0401.5250.2020.0920.0420.001.725.023.895.03
ES20.4690.0710.0260.0070.0040.8380.1110.0500.0230.000.560.640.520.31
DS13.1911.3730.5760.3000.0301.5840.2090.0950.0440.002.016.566.056.81
ES10.7900.1060.0400.0120.0000.8850.1170.0530.0250.000.890.910.760.49
Note: Column 1–4: measured in supernatant of conductivity measurement (eluted). Column 5–6: calculated from water content after dismantling based on ion content of Pearson water batch 1; c: column.
Table 9. Anion concentration in DS and ES after dismantling.
Cell 9123456789
ClSO42−sumc1:c2ClSO42−Sumc1:c5c2:c6
[mg/g][mg/g][mg/g][mg/g][mg/g][mg/g]
ES30.781.322.100.591.220.531.740.642.51
DS20.931.972.890.472.351.023.370.391.93
ES20.931.412.340.661.220.531.740.772.67
DS11.012.013.020.512.381.033.410.431.94
ES10.961.392.360.691.320.571.890.732.44
Cell 10ClSO42−sumc1:c2ClSO42−Sumc1:c5c2:c6
[mg/g][mg/g][mg/g][mg/g][mg/g][mg/g]
ES30.781.282.060.611.190.511.700.662.49
DS20.952.233.180.432.311.003.300.412.23
ES20.531.271.800.421.270.551.820.422.31
DS10.921.862.780.502.391.043.430.391.79
ES10.891.332.220.671.340.581.920.662.29
Note: Column 1–4: measured in supernatant of conductivity measurement (eluted). Column 5–6: calculated from water content after dismantling based on ion content of Pearson water batch 1. c: column.
Publisher’s Note: MDPI stays neutral with regard to jurisdictional claims in published maps and institutional affiliations.

