
Low-Temperature Chlorite Geothermometry and Related Recent Analytical Advances: A Review


Univ. Lille, Institut Mines-Télécom, Univ. Artois, Junia, ULR 4515-LGCgE, Laboratoire de Génie Civil et Géo-Environnement, F-59000 Lille, France
Minerals 2021, 11(2), 130; https://0-doi-org.brum.beds.ac.uk/10.3390/min11020130
Submission received: 6 January 2021
/
Revised: 21 January 2021
/
Accepted: 25 January 2021
/
Published: 28 January 2021
(This article belongs to the Special Issue Advances in Low-Temperature Mineralogy and Geochemistry)
Abstract
:Chlorite, a 2:1:1 phyllosilicate, has all the required attributes to form the basis of a geothermometer: this mineral is ubiquitous in metamorphic, diagenetic, and hydrothermal systems with a broad field of stability and a chemical composition partly dependent on temperature (T) and pressure (P) conditions. These properties led to the development of a multitude of chlorite thermometers, ranging from those based on empirical calibrations (linking T to AlIV content) to thermodynamic or semi-empirical models (linking T to chlorite + quartz + water equilibrium constant). This present study provides an overview of these geothermometers proposed in the literature for low-temperature chlorite (T < 350 °C), specifying the advantages and limitations of each method. Recent analytical developments that allow for circumventing or responding to certain criticisms regarding the low-temperature application of thermometers are also presented. The emphasis is on micrometric and nanometric analysis, highlighting chemical intracrystalline zoning—which can be considered as evidence of a succession of local equilibria justifying a thermometric approach—and mapping ferric iron content. New perspectives in terms of analysis (e.g., Mn redox in Mn-chlorite) and geothermometer (molecular solid-solution model, oxychlorite end-member) are also addressed.
1. Introduction
Determining the pressure, temperature, and chemical paleo-conditions (P-T-X) that have prevailed in geological contexts has long been a major issue, especially in systems of low temperature (up to epizone, i.e., T < 350 °C). In fundamental research, this type of study contributes to the understanding of the Earth system, its evolution, and the interactions between its compartments. In applied research, the quantification of paleo-conditions has been useful in the exploration of new resources, such as hydrocarbons (“oil and gas windows”) for decades, or geothermal energy (deep geothermal energy) in the context of ecological transition. In this way, many thermobarometric tools have been developed that, in turn, use the properties of organic matter (reflectance of vitrinite, e.g., [1]), Raman spectroscopy of carbonaceous materials thermometry (RSCM, e.g., [2,3,4]), the microthermometric data of fluid inclusions trapped in neoformed crystals (e.g., [5,6,7]), isotopy (e.g., [8]), or even the crystallochemical characteristics of specific minerals, such as phyllosilicates (e.g., [9]).
Chlorite, a 2:1:1 phyllosilicate (also denoted as TOT O; [10]), is a mineral with all the required attributes to form the basis of a thermometer: it is present in all geological contexts, has a wide field of stability (from 80 °C to more than 700 °C), and its chemical composition is influenced by the chemistry of the system, the fugacity of oxygen, and temperature and pressure conditions (e.g., [11]). For decades (e.g., [12]), the chemical composition of chlorite has been studied and used as a marker of paleo-conditions and their evolution, in particular, in low-temperature–low-pressure contexts (LT and LP). However, LT–LP chlorite thermometry is open to debate [13,14]. First, the method employed for LT chlorite thermometer calibration is questioned: Which composition to use? Is an empirical approach sufficient? What is the resulting applicability? Second, the nature of LT chlorites is debatable. Like all clay minerals, chlorite can exhibit crystallochemical defects or interstratification with other phases, and slow transformation kinetics when the temperature is below 350 °C can lead to the formation of metastable phases. The question then arises of the relevance of chlorite thermometers, especially since the formation of chlorite does not follow a single process but, on the contrary, can follow several paths, from precipitation from a fluid to the progressive chloritization of a precursor mineral [15]. LT chlorite thermometry is, therefore, confronted with two challenges: to offer a reliable geothermometer with a wide field of applicability (in terms of chlorite compositions), and to be able to apply it to compositions where it is certain they represent thermodynamic equilibrium, i.e., that they have recorded a stage in the evolution of P-T-X conditions.
The present study provides an overview of the existing chlorite geothermometers, from the first empirical calibrations to the recent semi-empirical tools, specifying the scope, advantages, and inconveniences of each method. In addition, the most innovative analytical techniques, which modified the approach of chlorite thermometry during the last decade, and made it possible to reach the chemical compositions containing the thermometric information, are exposed.
2. Compositional Variability of Chlorites
Chlorite is a phyllosilicate consisting of a 2:1 layer (talc-like layer) in which two tetrahedral sheets (denoted as IV) surround an octahedral sheet (denoted as VI), associated with an interlayer octahedral sheet (brucite-like sheet). This structure, 14 Å thick, can be defined as follows [10]:
where M1 and M2 (three octahedral sites in the talc-like layer), and M3 and M4 (three octahedral sites in the brucite-like layer) sites are occupied by divalent (R2+) cations such as Fe2+, Mg2+, Mn2+, or trivalent cations (R3+) such as Al3+ and Fe3+, while T sites (four tetrahedral sites) are filled by Si4+, Al3+, and Ti4+, giving the formula:
These structural specificities favor cationic exchanges, which are carried out according to substitutions, making it possible to guarantee layer electroneutrality (i.e., 28+ charges corresponding to the standard O10(OH)8 anionic basis). Regarding this last point, it is often necessary to consider the presence of vacancies, i.e., of empty octahedral sites (usually denoted as □) in the structure. The most remarkable cationic substitutions occurring in chlorites are, therefore, as follows:
- Tschermak substitution (TK) as SiIV + (Fe2+,Mg2+)VI = AlIV + AlVI
- di/trioctahedral substitution (DT) as 2(Al3+,Fe3+)VI + □VI = 3(Fe2+,Mg2+)VI
- ferromagnesian substitution (FM) as Mg2+ = Fe2+
- trivalent cation substitution (AF) as Al3+ = Fe3+
All these cationic substitutions can be combined to form a multitude of exchange vectors. Additional substitutions can also be examined, such as the “hydroxyl” substitution and the deprotonation process, written Fe3+ + 2OH− = Fe3+ + O2− + OH− and Fe2+ + H+ = Fe3+, respectively [11,16] (see Section 5). Consequently, octahedral sheets can theoretically exhibit three out of three occupied cationic sites (tri-tri octahedral structure; clinochlore, daphnite), two out of three occupied cationic sites (di-dioctahedral structure; dombassite), or one or other combination of these configurations, i.e., two out of three sites occupied for M1(M2)2 and three out of three sites occupied for (M3)2M4 (di-trioctahedral structure, sudoite), or the opposite (tri-dioctahedral structure) [17,18]. The first structure is the most common in nature, while the fourth structure has never been observed.
This great compositional variability, the diversity of elements that can be received in the structure, and the large number of cationic substitutions that can occur, sometimes simultaneously, lead to a wide compositional field for chlorite. The chlorite structure can thus be defined by a solid-solution model (e.g., [19,20,21,22]), knowing that most natural chlorite composition is delimited by Fe,Mg-sudoite, Fe,Mg-amesite, and Al-free chlorite end-members [23] (Figure 1), to which some Fe3+-end-members can be added. Chlorites from LT systems, especially diagenesis contexts, display higher Si and lower R2+ contents than in metamorphic systems [24]. This supports the hypothesis that chlorite composition is, at least in part, linked to the temperature of formation.
Cathelineau and Nieva [12] and Cathelineau [25], studying chlorites from Los Azufres and Salton Sea, two geothermal systems, highlighted the increase in AlIV and the decrease in octahedral vacancies with increasing temperature. They consequently defined the Si−1AlVI−1□−1AlIV+1R2++2 cationic exchange vector, resulting from a combination of the TK and DT substitutions, and used it as the base for thermometric empirical calibration (see Section 3). The same compositional variation was also observed in diagenetic and low-grade metamorphism contexts [24,26,27,28,29] which, at first, could provide reassurance for the application of empirical thermometers. To better constrain the links between cationic substitution, temperature, and the chemical environment, Bourdelle and Cathelineau [23] compiled hundreds of analyses of LT chlorites from hydrothermal, diagenetic, and low-grade metamorphism systems [25,26,28,29,30,31,32,33,34,35,36,37,38,39,40] for which the formation temperature is known (i.e., determined using independent geothermometers). It appears that LT chlorite composition (with the exception of sudoite (e.g., [41]) which often remains close to its ideal composition) is mainly restricted to the 1.5 < R3+ < 3 range (apfu, atoms per formula unit) while showing Si contents up to 3.5 apfu. Regardless of the environment in which the chlorites were formed, each set of LT chlorite compositions—corresponding to all compositions of chlorites coming from the same geologic field—exhibits a deviation from the Al-free chlorite/amesite line to the pyrophyllite-gibbsite/Al-free chlorite line (representing the DT exchange line; Figure 1), like so many parallels with respect to the lines of constant R3+ values. This observation implies that (i) compositions of chlorites from the same geological field follow the Si−1□−1R2+2/Si−1.25□−0.75AlR2+ exchange vectors according to T, as a 1/1 and 5/3 combination of TK and DT substitutions, respectively; (ii) chlorites with different compositions and from different geological fields can be linked to a single temperature, forming several isotherms subparallel to the TK exchange line (higher T isotherm closest to the Al-free chlorite/amesite line; Figure 1). These compositional parallels to the constant R3+ value lines (corresponding to each dataset; led by a decrease in Si content/increase in AlIV content) are subperpendicular to defined isotherms and refer to the linear empirical thermometers established during the 1980s (see Section 3).
3. Concepts of Chlorite Thermometers
Here, only the geothermometers based on the chlorite composition in siliceous contexts will be discussed, excluding chlorite polytypism and chlorite-carbonate [44] geothermometry.
In the 1980s, Cathelineau and Nieva [12] demonstrated a close relationship between the AlIV content of chlorites in the Los Azufres geothermal system (Mexico) and the formation temperature determined by independent methods. Cathelineau [25] completed the study with a series of data acquired on chlorites from the Salton Sea hydrothermal system (United States) and confirmed this relationship, given in the following equation:
T(°C) = −61.92 + 321.98 AlIV
This first chlorite geothermometer, which was purely empirical, gained ground, leading to a multiplication of proposals for empirical equations of the same type. Indeed, all the compositional lines (in Figure 1), parallel to the constant R3+ value lines in the compositional field of LT chlorites and perpendicular to the isotherms, are all possible empirical equations. This empiricism could not account for the varying influences of TK and DT substitutions on the variation of AlIV content—some have tried to correct their proposed equation with a corrective factor based on the Fe/Mg ratio, i.e., on FM substitution. Thus, there are no less than five other empirical thermometric equations, in addition to that of Cathelineau (Table 1), proposed in the literature [24,38,45,46,47,48], in some cases being used as a thermometer when they had not been suggested by their authors for this [24].
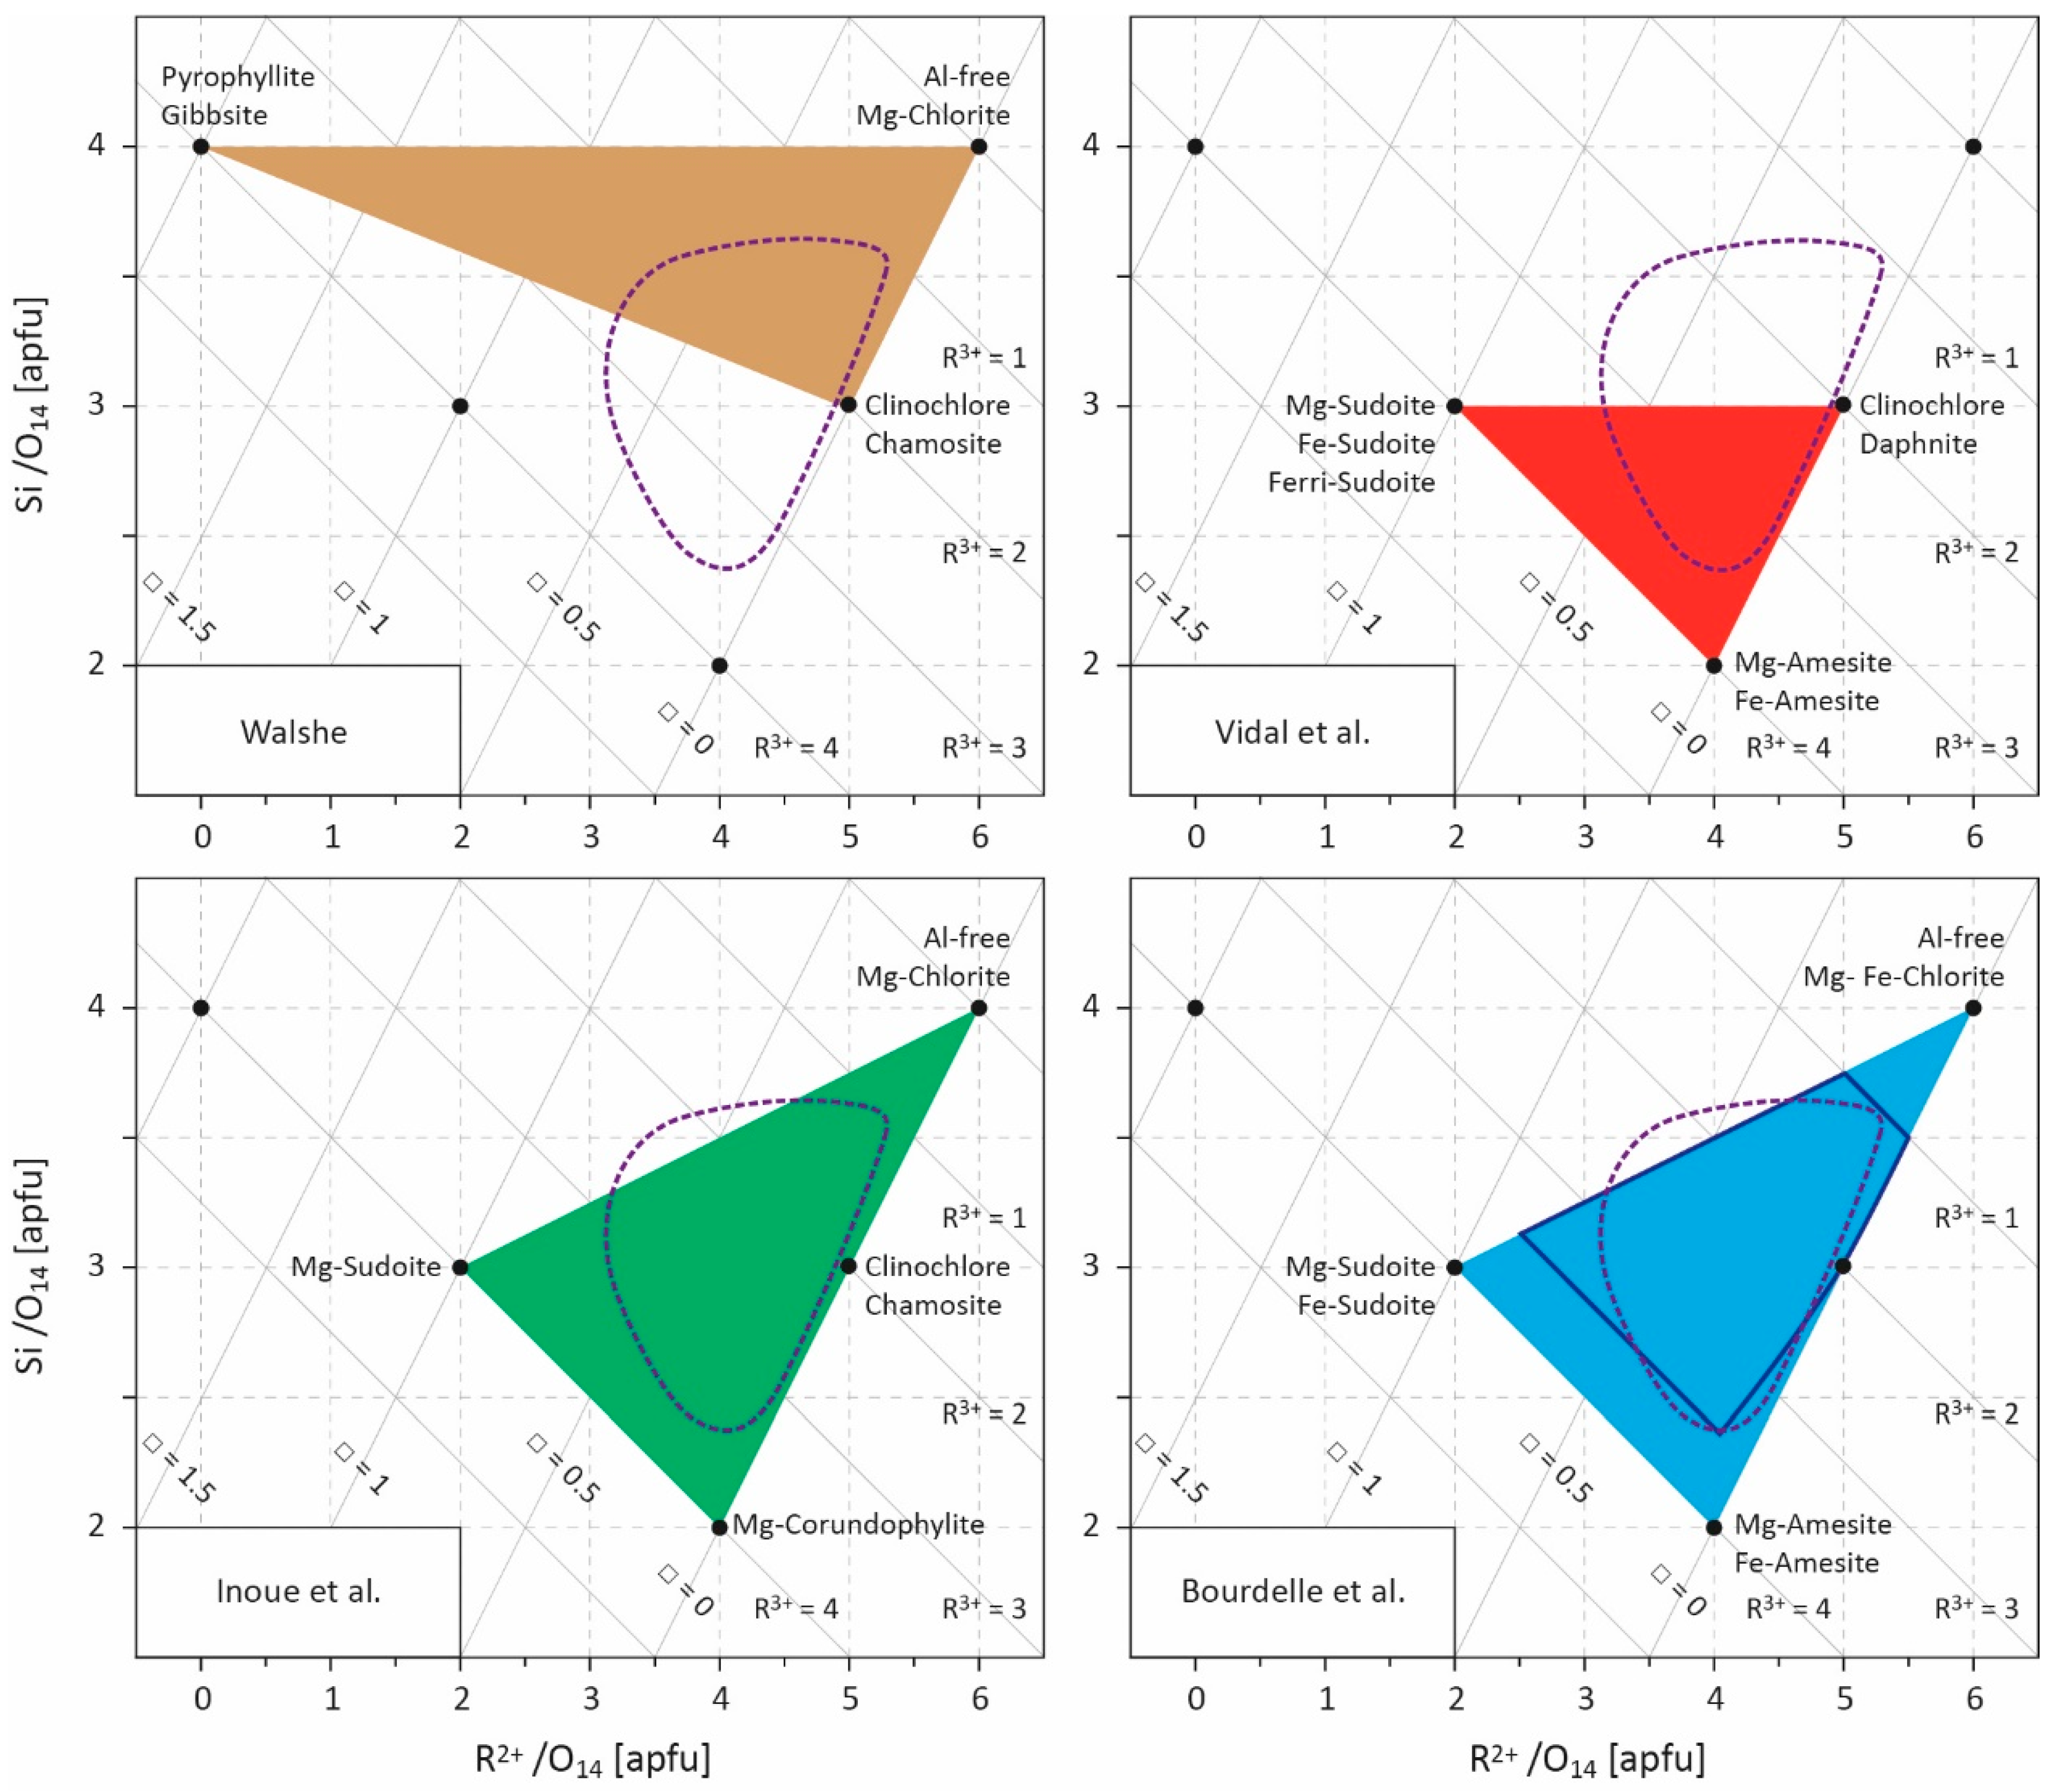
In the absence of constrained thermodynamic models capable of taking into account all the substitutions occurring in chlorites—with the exception of the attempt by [11] which excluded Si-poor (Si < 3.2 apfu) and/or Al-rich (Al > 2.5 apfu) chlorites (Figure 2) in spite of their common occurrence—these empirical thermometers were widely used during the 1990s to estimate T conditions in LT environments. However, their multiplicity shows that an empirical thermometer has an extremely limited field of application, i.e., being restricted to the context in which it has been calibrated, and that a new equation must be established for each new system studied. Indeed, an empirical simplification associates a temperature with one—and only one—possible composition of chlorite, contrary to what is observed in nature. As a result, their systematic application, without taking into account these specific conditions, has failed or led to erroneous geological interpretations in many cases [13,14,23,43].
At the turn of the 2000s, the development of empirical thermometers was stopped, though they were still in use, and a thermodynamic approach was favored for LT contexts. This approach is based on the fact that the equilibrium condition of any balanced chemical reaction can be expressed by
with as the Gibbs free energy of reaction, R the gas constant, and K the chlorite + quartz equilibrium constant, defined as
where is the stoichiometric reaction coefficient of end-member j, aideal is the ideal part of the end-member activity, and γm is the activity coefficient accounting for non-ideal contributions (which can be obtained from Margules parameters)—i.e., the influence of interactions between cations exchanged at the same site on enthalpy, entropy, and volume. In this way, Vidal et al. [9] proposed, through an experimental approach coupled with the study of natural samples, a thermodynamic model for aluminous chlorites between 100 and 600 °C, based on an ordered distribution of cations in the structure (in T2, M1, M2, M3, and M4 sites) [19] and on a four-thermodynamic-component solid-solution model (Mg-sudoite, Mg-amesite, clinochlore, and daphnite), which makes it possible to account for all the substitutions influencing the chlorite composition (Figure 2). Symmetric Margules parameters and standard state properties of defined end-members were calibrated, allowing estimation of the pressure and temperature of chlorite formation for a wide range of P, T, and geological contexts. Vidal et al. [49,50], and then Lanari et al. [51], improved this model by adding the Fe-rich Si-poor end-member Fe-amesite, on the basis of the work of [52]. The authors also suggest that the Fe3+ content should be considered because it strongly influences the structural formula of chlorites and, consequently, the P-T estimates; until then, this parameter was always neglected, with Fetotal always assumed to be Fe2+. To better take ferric iron into account, Vidal et al. [53] defined the thermodynamic properties of a Fe3+-end-member as ferri-sudoite (Table 1) [53,54].
Unlike empirical thermometers, the thermodynamic approach—based on the end-member properties determined experimentally and/or by the study of natural samples—is the most rigorous, but requires complex calculations and is dependent on the availability of thermodynamic data, which limits its field of application. As such, the lack of thermodynamic data on Si-rich end-members prevents taking into account chlorites whose Si content is greater than three atoms per formula unit (apfu), which is one of the characteristics of LT chlorites. Consequently, two studies [28,55] propose a trade-off between limited applicability/simplicity on one side, and rigor/complexity on the other by combining an empirical equation linking K equilibrium constant and T, and a multi-component solid-solution model. For this, Equation (5) is restricted to its ideal part as
given the rearranged Equation (4) as
where A and B are constants. aideal is calculated for each end-member j as follows:
where ns is the multiplicity of site s, rm and Xm are the number and the mole fraction of cation m on site s, respectively. This semi-empirical chlorite thermometry approach requires (i) the calibration of A and B constants of Equation (7) for chlorite + quartz equilibrium and (ii) to define the involved end-members and the cationic distribution in sites s (discussion on solid-solution models and cationic site occupancies can be found in [9,56]). Inoue et al. [28] chose the magnesian end-members of Al-free chlorite, of corundophilite (similar to amesite), and of sudoite, and the chamosite as the ferrous end-member, and assumed a random mixing of octahedral cations based on the fact that Fe-rich chlorites are commonly the Ib polytype for which details of the crystal structure are not clearly established. Bourdelle et al. [55] preferred the magnesian and ferrous end-members of Al-free chlorite, amesite, and sudoite, and an ordered cationic site repartition model, following the recommendations of [9,10,19]. In both cases, the choice of Al-free chlorite as an end-member (Table 1) allows accounting for Si-rich chlorites (Si > 3 apfu; Figure 2) which were not considered by [9,49,50,51,53]. Inoue et al. [28] and Bourdelle et al. [55] calibrated two Equation (7) for chlorite + quartz equilibrium (Table 1), i.e., defining A and B constants, from natural diagenetic and hydrothermal LT chlorite compositions, with a recommended upper limit of applicability around 250 and 350 °C, respectively. Therefore, and contrary to empirical equations, these two geothermometers predict that one chlorite composition corresponds to one temperature of formation, but that at any fixed temperature, a range of chlorite compositions exist and can be theoretically calculated, in agreement with observations of natural chlorites. These two geothermometers are easy to use, circumvent bulk rock composition effects, and perform well in diagenetic to low-grade metamorphic contexts (e.g., [55,57,58,59,60,61,62]), particularly in the T range where Si-rich chlorites are observed. They were later derived in a graphical way by [23] to estimate T only from Si and R2+ contents, making it as easy to use as empirical thermometers.
To achieve this, these geothermometers cannot dispense with simplifications. The effect of pressure is therefore neglected—the B constant being considered as a fixed ΔS—as well as the non-ideal part of the end-member activity. These assumptions are, however, acceptable within the restricted P-T range of diagenetic, hydrothermal, and low-grade metamorphism contexts [55]. Similarly, H2O activity is assumed to be equal to 1 as it is often unknown. If this hypothesis seems reasonable in LT systems, it may remain locally questionable, especially in the presence of carbonates. The activity of quartz is also assumed to be equal to 1, which implies that the application of these geothermometers is restricted to quartz-bearing rocks. Generally, the conditions of simplification validation are reached when simplifications are identified and their impact on the T estimate is quantified. Indeed, the choice of the chlorite geothermometer will be driven by the P-T window studied, compositional range of the targeted chlorite, host rock (nature, chemistry, etc.), data (i.e., scale of the compositional analysis; see Section 4), desired precision for T estimates, and acceptable simplifications (according to the geological context).
4. Chemical Heterogeneity, Achievement of Equilibrium, and Related Analytical Advances
Hydrothermal chlorites result from precipitation or rock alteration due to hydrothermal fluid circulation: either propylitic alteration linked to heat transfer from igneous intrusions, or phyllic alteration in open systems involving low-pH fluid fracture-controlled infiltration. In this context, chlorite can crystallize as discrete phases, or as mixed-layer minerals in which chlorite content increases with T. Three conversion paths can therefore be defined: a Mg series from saponite to Mg-rich chlorite via corrensite as an intermediate phase, an Fe series from berthierine to Fe-rich chlorite, and an Al(Mg) series from kaolinite to sudoite via tosudite. Diagenetic chlorites may crystallize as neoformed rims on grains, as pore-filling material, or by conversion of a precursor including berthierine, smectite, kaolinite (defining three conversion series similarly to hydrothermal chlorites), Fe-, Mg-rich detrital grains, and volcanic rock fragments. Mg-rich chlorites are usually observed in terrestrial and marine sandstones, whereas Fe-rich chlorites occur preferentially in coastal environments [63]. Fe-rich chlorites are also reported as a result of the interaction between Fe-rich host rocks (shale) and veins of kaolinite from Si–Al-rich meteoric-origin fluids. Regardless of the context or the reaction pathway, the mechanism involved in chlorite formation can be direct precipitation (DP), solid-state transformation (SST), dissolution–recrystallization (DC), or a mix of all three [64]. Due to the plurality of processes leading to chlorite formation, chlorite often exhibits (i) layers of another phase and/or (ii) a chemical heterogeneity, at the sample scale, where crystallites with different compositions coexist, or at the crystal scale, where crystallites present internal chemical zoning. From these observations, many criticisms have been formulated of the application and applicability of chlorite geothermometers [14,65,66,67]. Each of these criticisms must be treated independently because each heterogeneity refers to different phenomena.
Compositional variations observed in LT chlorites may be attributed to contamination of the chlorite by kaolinite, smectite, or berthierine [14,66]. Chlorite analysis contaminated by smectite can be discarded by applying chemical criteria: smectite contains Ca, K, or Na interlayered cations while chlorite does not; only analysis presenting Na2O + CaO + K2O < 0.5 wt% must be considered. The interstratification with 7Å-phases as kaolinite and berthierine is, however, difficult to identify chemically from a true chlorite, but several criteria can be used to verify that the chlorite composition corresponds to a combination of defined end-members [9], discarding some of the contaminated analyses. The method for geothermometer calibration can also be used to address this issue. Indeed, a large database for calibration [55], covering a wide field of geological parameters, such as lithology, temperature gradient, kinetics, fluid regimes, oxidation state, chlorite composition, chlorite precursors, impurities, and analytical contaminations, can be considered the best way to limit the impact of each parameter making the residual contamination without effects on the T estimate. Finally, the presence of smectite, berthierine, or kaolinite layers can be detected thanks to a high-resolution spatial control using transmission electron microscopy (TEM).
The chemical heterogeneity beyond analysis contamination often has a true significance in terms of paleo-condition record. Generally, it is considered that sluggish kinetics in LT contexts preclude the achievement of global equilibrium, leading to the crystallization of heterogeneous–metastable phases. In other words, the formation of LT chlorites would be more likely due to kinetic effects than to a re-equilibration process with conditions. In fact, chlorite formation occurs during reactions which are transient disequilibrium states governed by local chemical potential gradients and kinetic processes. A re-equilibration process may proceed through diffusion or, more probably, dissolution–recrystallization (DC) [68,69], but at a very small scale due to the slow kinetics of reaction and diffusivity at low temperatures. In high-grade metamorphic contexts, thermodynamic equilibrium can sometimes be approached not globally but locally at the micrometric scale, leading to large chemical zoning [50,70,71], but in diagenetic and hydrothermal domains, the equilibrium is almost always reached very locally. In this way, compositions in equilibrium with the P-T-X conditions in the system at a given time and, therefore, the only ones able to justify application of the thermometric approach, are found at very small spatial scales, probably coexisting with nonequilibrated compositions, as described by Ostwald ripening. This view explains the apparent heterogeneity observed in LT chlorites, each composition recording the evolution of a very local fluid–solid system, which can sometimes be interpreted as a part of the rock history. Discussions on local equilibrium, solid-state transformation, and chlorite formation processes can be found in [15,53,64,72].
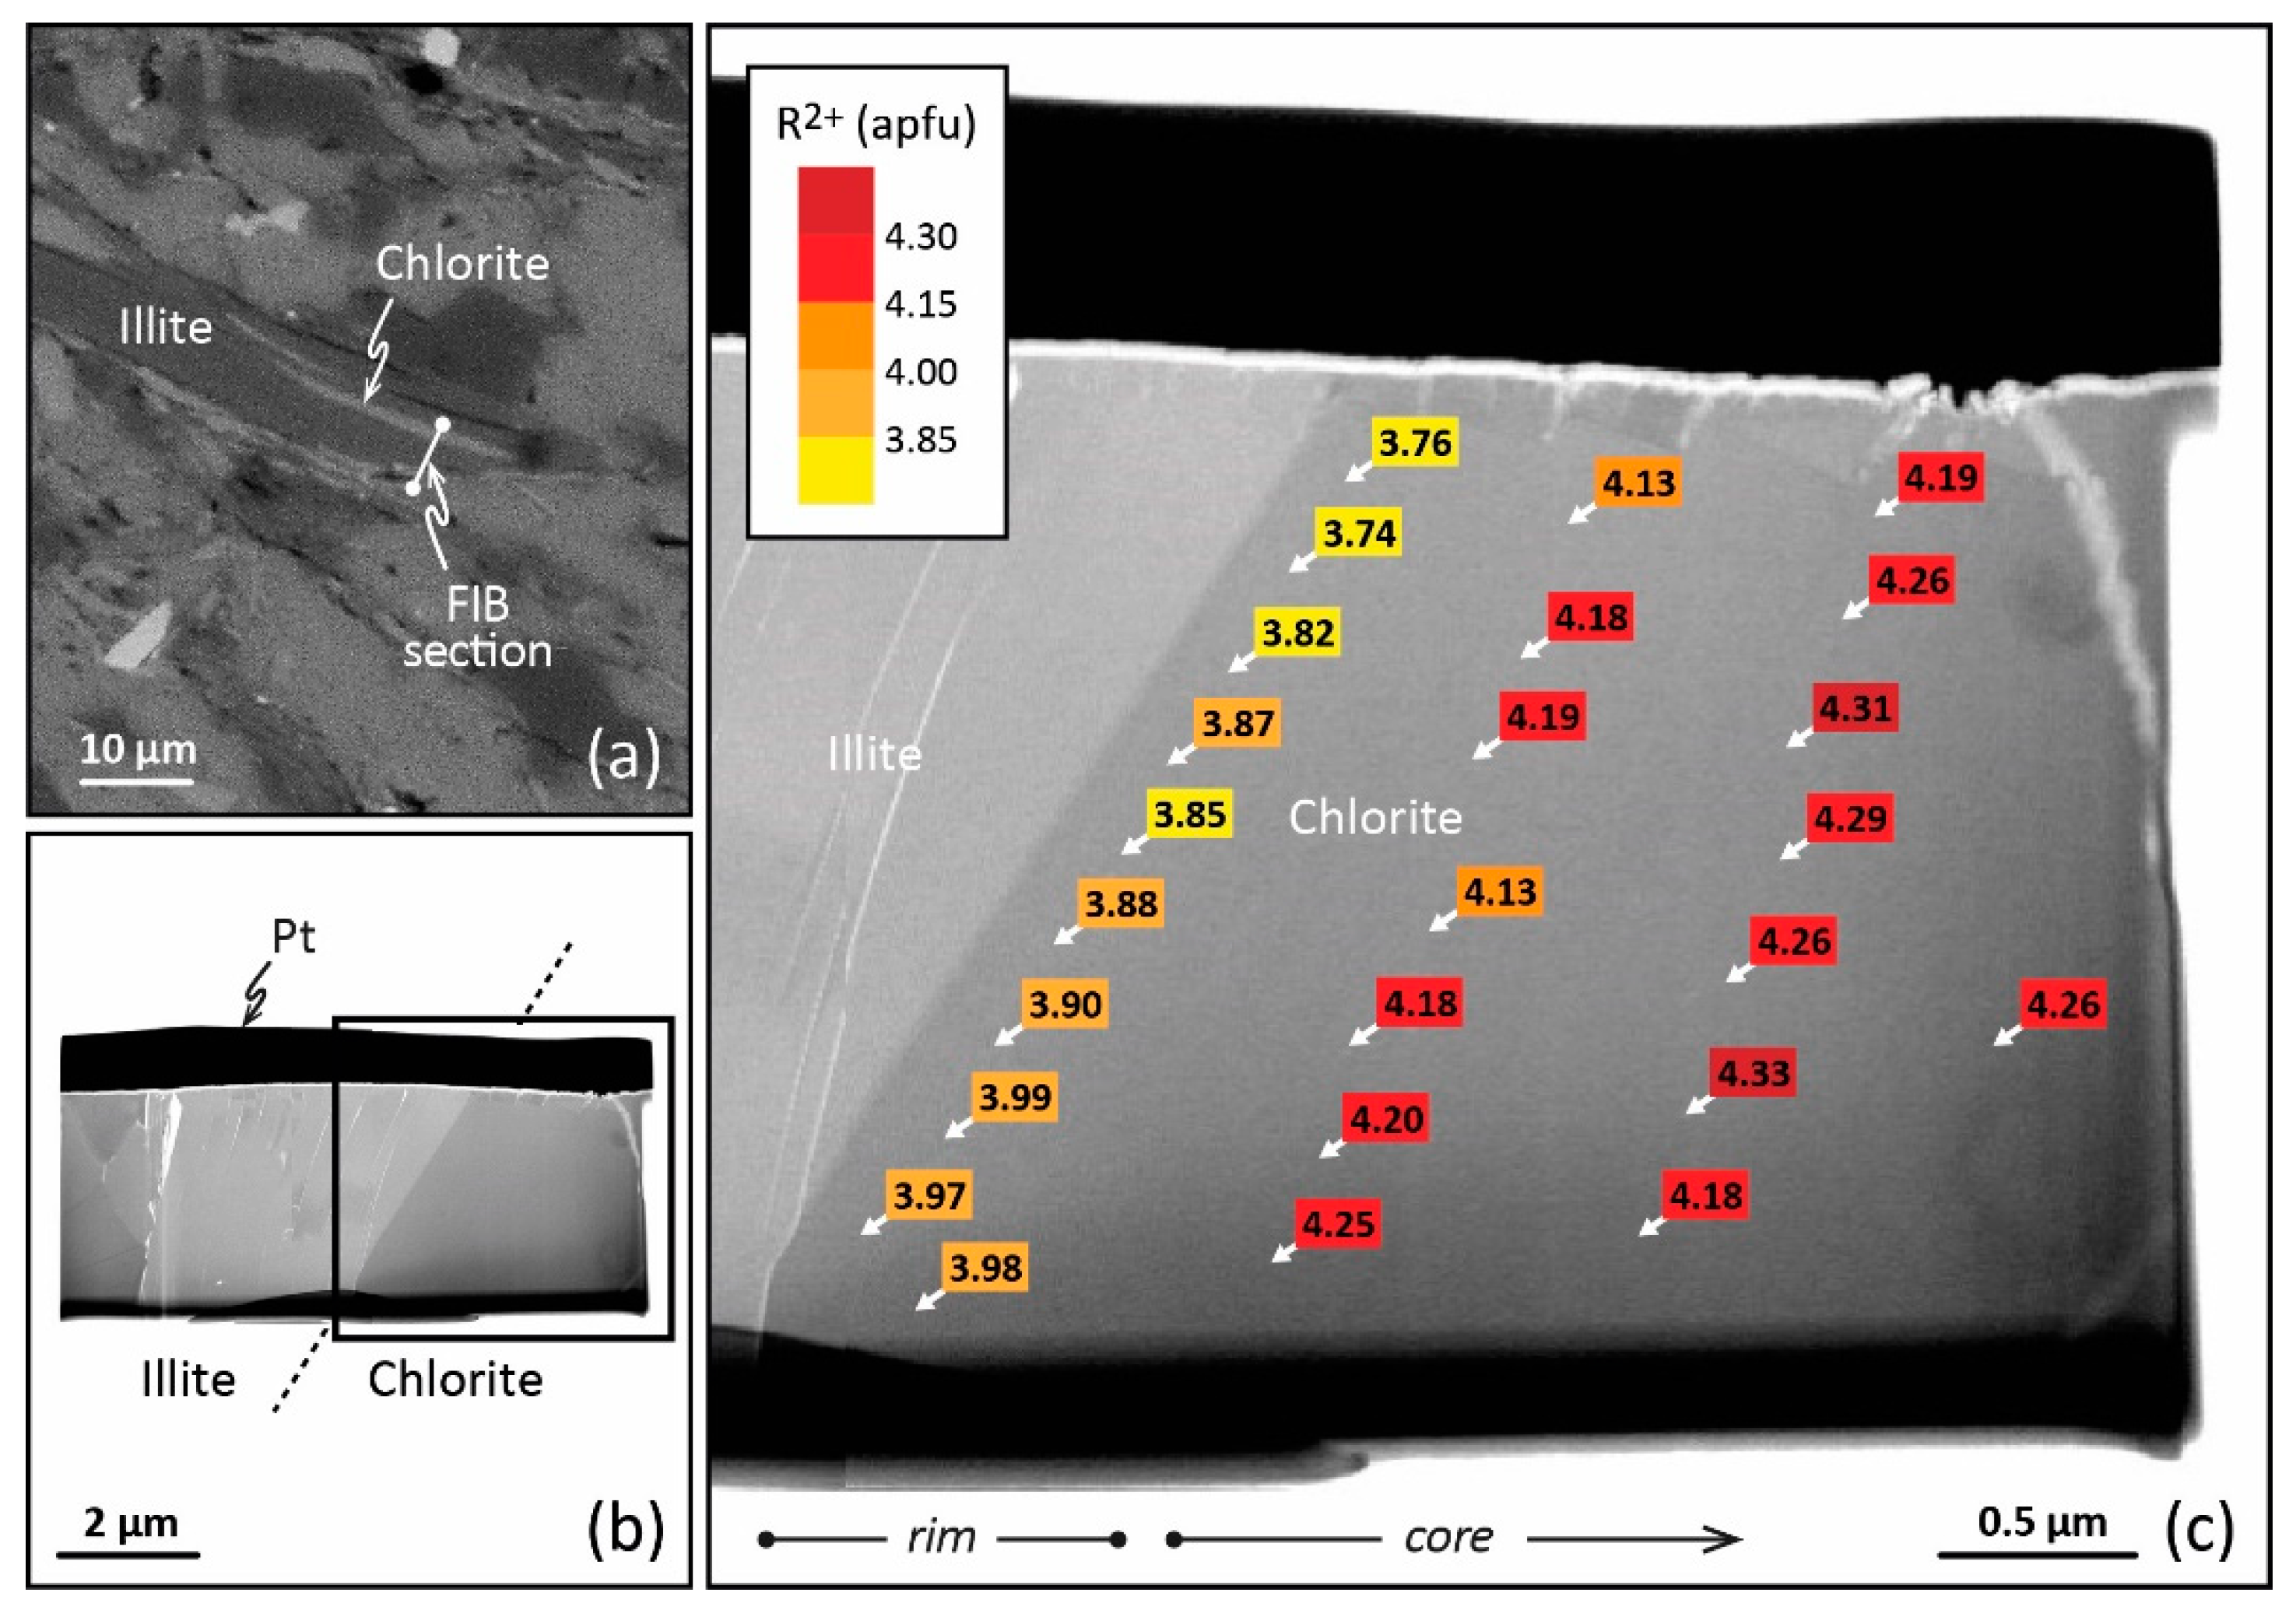
This local equilibrium, or the succession of local equilibria, requires high-resolution spatial analysis to be highlighted in LT domains and used in thermometric perspectives. In this respect, TEM equipped with energy dispersive X-ray spectroscopy (TEM–EDX) presents advantages. Jahren and Aagaard [27,32,73] have therefore observed lateral variation of the composition from crystal core and crystal rims for diagenetic illite–chlorite assemblages in arenites (Norway, 90–180 °C). For the first time, chemical zoning at the nanoscale was described for LT chlorites. However, the analysis of such a nanozoning is difficult as the texture of the crystallite must be preserved. Bourdelle et al. [74] proposed a protocol to couple TEM–EDX, providing the proper spatial resolution in analysis, with a focused ion beam (FIB), making the in situ preparation of TEM samples with high spatial control and preservation of mineral microtextures possible. FIB is a technique for ultrathin section milling [75] using a Ga+ ion beam which had been developed in the field of geosciences throughout the 2000s. Bourdelle et al. [29,43] have applied this analytical protocol to the diagenetic chlorites of the Gulf Coast (Texas) and to the low-grade metamorphism chlorites of Glarus (Switzerland), distinguishing between analyses made at the rims of nano- to micro-crystals and those made at the core. In the first case, TEM and FIB techniques highlight consistent within-grain patterns of major-element variations in chlorites sampled at different depths and locations of the Gulf Coast area (100–230 °C). Here, the nanozoning is due to various crystallization stages during burial, the crystal core composition referring to detrital chlorite and the crystal rim compositions to neo-formed chlorites. The chlorite rim compositions show a T dependence with depth and location, in agreement with the diagenetic history described at a regional scale [29]. In the second case, quantitative TEM–EDX analysis carried out on FIB sections cut in chlorites from Glarus (200–350 °C) displays a compositional trend from crystal core to crystal rim (Figure 3), consistently observed along a north–south transect through the Glarus area in all samples, with calculated rim temperatures systematically lower than core temperatures. This chlorite nanozoning is testament to the retrograde path of the system, with the crystal rims recording a later step of this exhumation than the crystal cores. In both cases, the temperature dependence of the chlorite rim and/or core compositions supports the idea that the chemical zoning of LT chlorites, observable only at the nanoscale, is not controlled by a kinetic effect but rather by the local equilibria themselves influenced by regional-scale processes. The thermodynamic/thermometric approach therefore makes sense on the condition of correctly identifying—i.e., on an appropriate spatial scale—the composition(s) that are in equilibrium, or have been, with the P-T-X conditions. The adapted nanoscale analytical protocol allows the application of an approach similar to that used for metamorphic rocks at the micro- to millimetric scale [50,76]. However, the TEM–EDX/FIB protocol is complex to implement routinely. The analytical protocol should be chosen according to the targeted chlorites: electron microprobe (EMP) for homogeneous, large grain chlorites (often formed via direct precipitation or long-term dissolution–recrystallization), TEM–EDX/FIB for heterogeneous, small grain chlorites (often formed via successive local equilibria). This choice of the micrometric or the nanometric approach will often be based on petrological indices, i.e., the shape of the crystallites, the size, the orientation with respect to foliation or fractures, and the preferred zones of crystallization. Thus, a chlorite exhibiting all the characteristics of a detrital phase will require a nanoscale analysis, as chlorites of small sizes, linked to another phase, or fitting closely the foliation. On the other hand, a large chlorite having all the characteristics of a phase neoformed from a fluid or from a recrystallization may be the subject of a micrometric analysis. It will be the same if the petrological criteria show that several generations of chlorites coexist in the rock: in this case, the information on a regional scale will be easy to obtain, and one could be satisfied with a micrometric analysis. In case of doubt, it will be necessary to couple the two approaches on a few selected chlorites, and to adapt the analytical methods for the following analyses. It should be noted that (i) the TEM–EDX/FIB protocol also enables checking the absence of smectite, kaolinite, or berthierine layers in chlorite, and (ii) the TEM–EDX spot size is around 50 nm, i.e., pointed analyses target between 30 and 40 chlorite layers, limiting undetectable interstratification with layers of other phases.
The Fe3+ content in LT chlorites, and its consideration for thermometric estimates, are also subjects of debate. If a part of Fetotal is considered as Fe3+ instead of Fe2+, the octahedral vacancy content in the structural formula will increase, influencing the calculation of end-member activities and, finally, leading to a decrease in the temperature estimates. In this respect, three approaches are conceivable: (i) to calibrate a thermometer intrinsically considering Fe3+ influence, making it unnecessary to quantify the Fe3+ content; (ii) to propose a model that predicts the Fe3+ content in parallel with the chlorite formation temperature; (iii) to develop analytical techniques able to determine the Fe3+ content for each chlorite analyses, accounting for chemical zoning.
The first approach was adopted by Bourdelle et al. [55], noting that Fe3+ content is rarely issued from direct analysis (e.g., by electron microprobe). This thermometer is calibrated on a large database to include the possible effects of Fe3+, knowing that Fe3+ content has even less influence the lower the temperature [23,53]. The effect of the non-consideration of Fe3+ has a subordinate role because temperature estimates are, in the first place, controlled by TK and DT substitutions [23,55], in particular at the Fetotal content and XFe3+ ranges usually observed for LT chlorites. Studies that compare T estimates from the thermometer of Bourdelle et al. [55] with those of Inoue et al. [28], Vidal et al. [49,50], or Lanari et al. [51], which require prior quantification of Fe3+ content, conclude at the convergence of the two approaches [23,59,60,62,77], especially when T < 250 °C.
The second approach was favored by Inoue et al. [28], Vidal et al. [49,50,53], and Lanari et al. [51]. Despite being a model without a ferric end-member, Inoue et al. [28] advised considering Fe3+ content in applying the proposed geothermometer to avoid T overestimates. In this respect, Fe3+ content must be quantified independently. On their side, the thermometers of Vidal et al. [44,45] and Lanari et al. [51] require integrating the Fe3+ content in the chlorite structural formula calculation but, for this, propose estimating the Fe3+/Fetotal ratio together with T by the convergence of Chl + Qz equilibria (Table 1) [78,79]. These models were completed by the addition of a ferric end-member, i.e., ferri-sudoite, by Vidal et al. [53]. Recently, by combining Inoue et al. [28] and Walshe [11] models, Inoue et al. [80] presented a method to estimate Fe3+ content and T, and evaluate redox conditions (fO2). Applied on chlorites from the hydrothermal system of Noboribetsu (Japan), this method gave promising results for qualitative discussion on redox condition variations.
The third approach therefore consists of the development of an analytical method to precisely quantify Fe3+ content and its variation through crystallites, either at the micrometric scale for metamorphic chlorite zoning, or at the nanoscale for LT chlorite zoning. Muñoz et al. [76] mapped the Fe3+/Fetotal ratio (XFe3+) in metamorphic chlorites for the first time using X-ray absorption near-edge structure spectroscopy data (XANES) acquired at the Fe K-edge (7100–7200 keV) in fluorescence mode (synchrotron light). A spot size of 10 µm allowed the authors to map an area 390 × 180 microns in size to highlight XFe3+ zoning in chlorite and to refine thermometric predictions [50]. This kind of map can be correlated to EMP maps given exhaustive characterization of the chlorite chemistry. This spectacular advance in the estimation of ferric iron in HT chlorites is, however, not suitable for LT chlorites due to the scale of XFe3+ variation. Several years later, Bourdelle et al. [81] developed an analytical procedure to quantify the Fe3+/Fetotal ratio in silicates using Fe L2,3-edge (700–730 eV) XANES spectra, i.e., at 10× less energy. This authorizes a spot size of 30 nm, an unequal spatial resolution. Data were acquired thanks to scanning transmission X-ray microscopy (STXM; in transmission mode), on FIB ultrathin sections already serving as a support for the TEM–EDX study. Admittedly, the mapped area is very small in size, but it was previously demonstrated that the chemical zoning in LT chlorites is restricted to small distances. Applied on chlorites from Glarus (Switzerland), Bourdelle et al. [81] exhibited the first quantitative redox maps at the nanoscale as evidence of the compositional zoning of LT chlorites. To prove the existence of this nanoscale zoning, to date not detected with classical methods such as EMPand SEM–EDX, the combination of this kind of map with TEM–EDX data should allow us to obtain all compositional data useful for applications of the Inoue et al. [28] and Vidal et al. [50,53] thermometers.
5. Perspectives of New Analytical and Thermometric Developments
The question of ferric iron in LT chlorites remains extensively studied. New ferric end-members could be envisaged to complete thermodynamic models, provided that their standard-state thermodynamic properties can be determined. Cationic substitutions where Fe3+ is implicated can also be redefined. Masci et al. [16] investigated a wide range of chlorite compositions by XANES and EMP, and claimed that the DT substitution implicating Fe3+ is an artefact. This substitution is usually considered as the result of the combination of the Al-DT substitution and AF exchange but without the intervention of Al. If the Al3+ = Fe3+ exchange is still considered by the authors for low-Fe systems, a new exchange vector, implying deprotonation, is envisaged for Fe-rich chlorites. Here, the structural formula is not calculated on a 14-oxygen basis but on a 15-oxygen basis, as R2+ + H+ = Fe3+, leading to a reduction of octahedral vacancies. Masci et al. [16] campaigned for the consideration of an oxychlorite member (or “oxidized chlorite”), close to tri-trioctahedral chlorite, and for a new cation site assignment as a part of a chlorite solid-solution accounting for proton loss in M1 and M2 sites. If the deprotonation becomes a verified process, the published data on Fe3+-rich chlorites with a high vacancy content will have to be reappraised, and the implications for chlorite thermometry are far-reaching.
Aja [56] proposed a new approach for solid-solution modeling by defining a molecular solid-solution model instead of the atomic site-mixing models conventionally used by chlorite geothermometers, such as in [9]. The author starts from the observation that regular-solution site-mixing models are, at least in part, speculative because they deduce a putative structural chemistry from the general chlorite stoichiometry and do not account for the true atomic site occupancy of each investigated sample. To circumvent this issue, a molecular model was developed in which each end-member contribution (mole fraction) is depicted by a single aggregate parameter, presuming that local charge remains balanced in the chlorite structure. The author advances that the molecular solid solution brings out insufficiencies in the thermodynamic database available for chlorite, and suggests new ternary solid-solution models, opening up new thermometric perspectives.
Currently, geothermometers are developed for the most common chlorites, i.e., Al-, Fe-, or Mg-rich chlorites. However, it could be worth considering extending these models to rarer—but characteristic of specific systems—chlorites, like Mn-rich chlorites. As an example, Sussenberger et al. [82] suggest that the Mn content in chlorite could be a proxy for chemo-stratigraphic conditions in a depositional environment. For their part, Bobos et al. [83] established a link between Mn-chlorite and wolframite, with the Mn content in chlorite becoming an indicator of W–Mo mineralization. In this way, geothermometers should include an Mn end-member like pennantite [84] (similar to clinochlore and daphnite). However, the question of the structural formula calculation, similarly to ferric iron, will arise without quantification of the Mn3+/Mntotal ratio. An STXM–XANES protocol investigating the Mn L2,3-edges (630–660 eV) could be contemplated for nanoscale mapping of the Mn redox, analogously to the Fe redox [81].
Other perspectives of development could be envisaged, like the extension of thermodynamic models toward Al-free chlorite, the comprehension of chloritization mechanisms according to the system and the precursor which, although very widely studied, may need to be reevaluated with new analysis techniques and new experiments, or the coupling of STEM–EDX maps (scanning transmission electron microscopy) with STXM–XANES maps. This latter development could facilitate the detection of compositional variations within chlorite crystals, knowing that it is currently difficult to understand whether the zoning is a progressive zoning from crystal core to rim resulting from a continuous evolution, or is the consequence of a clear juxtaposition of different independent compositions in the same chlorite.
6. Conclusions
Chlorite geothermometry has already shown its relevance and contribution in numerous studies of low-grade metamorphic, diagenetic, and hydrothermal contexts, especially when coupled with other thermometric tools, but it should only be used when also considering the recommendations of thermometer developers, choosing a suitable analysis scale/techniques, and being aware of possible deficiencies. A review of the chlorite geothermometers for LT contexts is inevitably at the center of an old debate on their relevance. With the intention of demonstrating the strong link between the evolution of thermometer concepts and development of new analytical tools, this study takes the view that chlorite geothermometry is appropriate for estimating the P-T-X paleo-conditions prevailing in low-temperature–low-pressure contexts. However, the debate, especially on the thermodynamic status of intermediate phases involved in chloritization processes, cannot be settled here and will require new data and new analytical or experimental advances, as in [64]. Beyond this debate, the highlighting of chemical zoning inside LT chlorites seems to lead in the direction of the local equilibrium model, justifying a thermodynamic/thermometric approach.
Funding
This research received no external funding.
Acknowledgments
The discussions and comments of the associate editor and of reviewers are gratefully acknowledged.
Conflicts of Interest
The author declares no conflict of interest.
References
- Okuyama-Kusunose, Y.; Itaya, T. Metamorphism of Carbonaceous Material in the Tono Contact Aureole, Kitakami Mountains, Japan. J. Metamorph. Geol. 1987, 5, 121–139. [Google Scholar] [CrossRef]
- Beyssac, O.; Pattison, D.R.M.; Bourdelle, F. Contrasting Degrees of Recrystallization of Carbonaceous Material in the Nelson Aureole, British Columbia and Ballachulish Aureole, Scotland, with Implications for Thermometry Based on Raman Spectroscopy of Carbonaceous Material. J. Metamorph. Geol. 2019, 37, 71–95. [Google Scholar] [CrossRef] [Green Version]
- Beyssac, O.; Rouzaud, J.N.; Goffe, B.; Brunet, F.; Chopin, C. Graphitization in a High-Pressure, Low-Temperature Metamorphic Gradient: A Raman Microspectroscopy and HRTEM Study. Contrib. Mineral. Petrol. 2002, 143, 19–31. [Google Scholar] [CrossRef]
- Lahfid, A.; Beyssac, O.; Deville, E.; Negro, F.; Chopin, C.; Goffe, B. Evolution of the Raman Spectrum of Carbonaceous Material in Low-Grade Metasediments of the Glarus Alps (Switzerland). Terra Nova 2010, 22, 354–360. [Google Scholar] [CrossRef]
- Dubois, M.; Ayt Ougougdal, M.; Meere, P.; Royer, J.-J.; Boiron, M.-C.; Cathelineau, M. Temperature of Paleo- to Modern Self-Sealing within a Continental Rift Basin; the Fluid Inclusion Data (Soultz-Sous-Forets, Rhine Graben, France). Eur. J. Mineral. 1996, 8, 1065–1080. [Google Scholar] [CrossRef]
- Roedder, E. Fluid Inclusions: An Introduction to Studies of All Types of Fluid Inclusions, Gas, Liquid, or Melt, Trapped in Materials from Earth and Space, and Their Application to the Understanding of Geologic Processes; Reviews in Mineralogy; Mineral Soc. of America: Washington, DC, USA, 1984; ISBN 978-0-939950-16-4. [Google Scholar]
- Samson, I. (Ed.) Fluid Inclusions: Analysis and Interpretation; Short Course Series; Mineralogical Association: Ottawa, ON, Canada, 2003; ISBN 978-0-921294-32-0. [Google Scholar]
- Burkhard, M.; Kerrich, R.; Maas, R.; Fyfe, W.S. Stable and Sr-Isotope Evidence for Fluid Advection during Thrusting of the Glarus Nappe (Swiss Alps). Contrib. Mineral. Petrol. 1992, 112, 293–311. [Google Scholar] [CrossRef]
- Vidal, O.; Parra, T.; Trotet, F. A Thermodynamic Model for Fe-Mg Aluminous Chlorite Using Data from Phase Equilibrium Experiments and Natural Pelitic Assemblages in the 100 Degrees to 600 Degrees C, 1 to 25 Kb Range. Am. J. Sci. 2001, 301, 557–592. [Google Scholar] [CrossRef] [Green Version]
- Bailey, S.W. (Ed.) Chlorites: Structures and Crystal Chemistry. In Hydrous Phyllosilicates; De Gruyter: Berlin, Germany; Boston, MA, USA, 1988; ISBN 978-1-5015-0899-8. [Google Scholar]
- Walshe, J.L. A Six-Component Chlorite Solid Solution Model and the Conditions of Chlorite Formation in Hydrothermal and Geothermal Systems. Econ. Geol. 1986, 81, 681–703. [Google Scholar] [CrossRef]
- Cathelineau, M.; Nieva, D. A Chlorite Solid Solution Geothermometer the Los Azufres (Mexico) Geothermal System. Contrib. Mineral. Petrol. 1985, 91, 235–244. [Google Scholar] [CrossRef]
- De Caritat, P.; Hutcheon, I.; Walshe, J. Chlorite Geothermometry—A Review. Clays Clay Miner. 1993, 41, 219–239. [Google Scholar] [CrossRef]
- Essene, E.J.; Peacor, D.R. Clay Mineral Thermometry—A Critical Perspective. Clays Clay Miner. 1995, 43, 540–553. [Google Scholar] [CrossRef]
- Beaufort, D.; Rigault, C.; Billon, S.; Billault, V.; Inoue, A.; Inoue, S.; Patrier, P. Chlorite and Chloritization Processes through Mixed-Layer Mineral Series in Low Temperature Geological Systems—A Review. Clay Miner. 2015, 50, 497–523. [Google Scholar] [CrossRef]
- Masci, L.; Dubacq, B.; Verlaguet, A.; Chopin, C.; De Andrade, V.; Herviou, C. A XANES and EPMA Study of Fe3+ in Chlorite: Importance of Oxychlorite and Implications for Cation Site Distribution and Thermobarometry. Am. Mineral. 2019, 104, 403–417. [Google Scholar] [CrossRef]
- Wiewiora, A.; Weiss, Z. Crystallochemical Classifications of Phyllosilicates Based on the Unified System of Projection of Chemical Composition; II, The Chlorite Group. Clay Miner. 1990, 25, 83–92. [Google Scholar] [CrossRef]
- Meunier, A. Clays; Springer: Berlin/Heidelberg, Germany; New York, NY, USA, 2005; ISBN 978-3-540-21667-4. [Google Scholar]
- Holland, T.; Baker, J.; Powell, R. Mixing Properties and Activity-Composition Relationships of Chlorites in the System MgO-FeO-Al2O3-SiO2-H2O. Eur. J. Mineral. 1998, 10, 395–406. [Google Scholar] [CrossRef]
- Helgeson, H.C.; Aagaard, P. Activity/Composition Relations among Silicates and Aqueous Solutions; I, Thermodynamics of Intrasite Mixing and Substitutional Order/Disorder in Minerals. Am. J. Sci. 1985, 285, 769–844. [Google Scholar] [CrossRef]
- Stoessell, R.K. Regular Solution Site-Mixing Model for Chlorites. Clays Clay Miner. 1984, 32, 205–212. [Google Scholar] [CrossRef]
- Vidal, O.; Parra, T. Exhumation Paths of High-Pressure Metapelites Obtained from Local Equilibria for Chlorite-Phengite Assemblages. Geol. J. 2000, 35, 139–161. [Google Scholar] [CrossRef]
- Bourdelle, F.; Cathelineau, M. Low-Temperature Chlorite Geothermometry: A Graphical Representation Based on a T-R2+-Si Diagram. Eur. J. Mineral. 2015, 27, 617–626. [Google Scholar] [CrossRef]
- Hillier, S.; Velde, B. Octahedral Occupancy and the Chemical-Composition of Diagenetic (Low-Temperature) Chlorites. Clay Miner. 1991, 26, 149–168. [Google Scholar] [CrossRef]
- Cathelineau, M. Cation Site Occupancy in Chlorites and Illites as a Function of Temperature. Clay Miner. 1988, 23, 471–485. [Google Scholar] [CrossRef]
- Velde, B.; Medhioub, M. Approach to Chemical Equilibrium in Diagenetic Chlorites. Contrib. Mineral. Petrol. 1988, 98, 122–127. [Google Scholar] [CrossRef]
- Jahren, J.S. Compositional Variations in Diagenetic Chlorites and Illites, and Relationships with Formation-Water Chemistry. Clay Miner. 1989, 24, 157–170. [Google Scholar] [CrossRef]
- Inoue, A.; Meunier, A.; Patrier-Mas, P.; Rigault, C.; Beaufort, D.; Vieillard, P. Application of Chemical Geothermometry to Low-Temperature Trioctahedral Chlorites. Clays Clay Miner. 2009, 57, 371–382. [Google Scholar] [CrossRef]
- Bourdelle, F.; Parra, T.; Beyssac, O.; Chopin, C.; Vidal, O. Clay Minerals as Geo-Thermometer: A Comparative Study Based on High Spatial Resolution Analyses of Illite and Chlorite in Gulf Coast Sandstones (Texas, USA). Am. Mineral. 2013, 98, 914–926. [Google Scholar] [CrossRef]
- McDowell, S.D.; Elders, W.A. Authigenic Layer Silicate Minerals in Borehole Elmore 1, Salton Sea Geothermal Field, California, USA. Contrib. Mineral. Petrol. 1980, 74, 293–310. [Google Scholar] [CrossRef]
- Bevins, R.; Robinson, D.; Rowbotham, G. Compositional Variations in Mafic Phyllosilicates from Regional Low-Grade Metabasites and Application of the Chlorite Geothermometer. J. Metamorph. Geol. 1991, 9, 711–721. [Google Scholar] [CrossRef]
- Jahren, J.; Aagaard, P. Diagenetic Illite-Chlorite Assemblages in Arenites. 1. Chemical Evolution. Clays Clay Miner. 1992, 40, 540–546. [Google Scholar] [CrossRef]
- Rahn, M.; Mullis, J.; Erdelbrock, K.; Frey, M. Very Low-Grade Metamorphism of the Taveyanne Greywacke, Glarus Alps, Switzerland. J. Metamorph. Geol. 1994, 12, 625–641. [Google Scholar] [CrossRef]
- Schmidt, D.; Livi, K.J.T.; Frey, M. Reaction Progress in Chloritic Material: An Electron Microbeam Study of the Taveyanne Greywacke, Switzerland. J. Metamorph. Geol. 1999, 17, 229–241. [Google Scholar] [CrossRef]
- Mas, A.; Guisseau, D.; Mas, P.P.; Beaufort, D.; Genter, A.; Sanjuan, B.; Girard, J.P. Clay Minerals Related to the Hydrothermal Activity of the Bouillante Geothermal Field (Guadeloupe). J. Volcanol. Geotherm. Res. 2006, 158, 380–400. [Google Scholar] [CrossRef]
- Koroknai, B.; Arkai, P.; Horvath, P.; Balogh, K. Anatomy of a Transitional Brittle-Ductile Shear Zone Developed in a Low-T Meta-Andesite Tuff: A Microstructural, Petrological and Geochronological Case Study from the Bukk Mts. (NE Hungary). J. Struct. Geol. 2008, 30, 159–176. [Google Scholar] [CrossRef]
- Beaufort, D.; Patrier, P.; Meunier, A.; Ottaviani, M. Chemical Variations in Assemblages Including Epidote and or Chlorite in the Fossil Hydrothermal System of Saint Martin (Lesser Antilles). J. Volcanol. Geotherm. Res. 1992, 51, 95–114. [Google Scholar] [CrossRef]
- Xie, X.G.; Byerly, G.R.; Ferrell, R.E. IIb Trioctahedral Chlorite from the Barberton Greenstone Belt: Crystal Structure and Rock Composition Constraints with Implications to Geothermometry. Contrib. Mineral. Petrol. 1997, 126, 275–291. [Google Scholar] [CrossRef]
- Lopez-Munguira, A.; Nieto, F.; Morata, D. Chlorite Composition and Geothermometry: A Comparative HRTEM/AEM-EMPA-XRD Study of Cambrian Basic Lavas from the Ossa Morena Zone, SW Spain. Clay Miner. 2002, 37, 267–281. [Google Scholar] [CrossRef] [Green Version]
- Potel, S. Very Low-Grade Metamorphic Study in the Pre-Late Cretaceous Terranes of New Caledonia (Southwest Pacific Ocean). Isl. Arc 2007, 16, 291–305. [Google Scholar] [CrossRef]
- Percival, J.B.; Kodama, H. Sudoite from Cigar Lake, Saskatchewan. Can. Mineral. 1989, 27, 633–641. [Google Scholar]
- Hutcheon, I. Clay Carbonate Reactions in the Venture Area, Scotian Shelf, Nova Scotia, Canada. Geochem. Soc. 1990, 2, 199–212. [Google Scholar]
- Bourdelle, F.; Beyssac, O.; Parra, T.; Chopin, C. Nanoscale Chemical Zoning of Chlorite and Implications for Low-Temperature Thermometry: Application to the Glarus Alps (Switzerland). Lithos 2018, 314, 551–561. [Google Scholar] [CrossRef]
- Hutcheon, I.; Oldershaw, A.; Ghent, E.D. Diagenesis of Cretaceous Sandstones of the Kootenay Formation at Elk Valley (Southeastern British Columbia) and Mt Allan (Southwestern Alberta). Geochim. Cosmochim. Acta 1980, 44, 1425–1435. [Google Scholar] [CrossRef]
- Zang, W.; Fyfe, W. Chloritization of the Hydrothermally Altered Bedrock at the Igarape-Bahia Gold Deposit, Carajas, Brazil. Miner. Depos. 1995, 30, 30–38. [Google Scholar] [CrossRef]
- Waldie, C.J.; Jowett, E.C.; Swinden, H.S. The Crescent Lake Copper Deposit, Central Newfoundland: Deep Levels of a Volcanogenic Hydrothermal System? Atl. Geol. 1991, 27. [Google Scholar] [CrossRef] [Green Version]
- Kranidiotis, P.; MacLean, W.H. Systematics of Chlorite Alteration at the Phelps Dodge Massive Sulfide Deposit, Matagami, Quebec. Econ. Geol. 1987, 82, 1898–1911. [Google Scholar] [CrossRef]
- Jowett, E.C. Fitting Iron and Magnesium into the Hydrothermal Chlorite Geothermometer. In Proceedings of the GAC/MAC/SEG Joint Annual Meeting, Toronto, ON, Canada, 27–29 May 1991. [Google Scholar]
- Vidal, O.; Parra, T.; Vieillard, P. Thermodynamic Properties of the Tschermak Solid Solution in Fe-Chlorite: Application to Natural Examples and Possible Role of Oxidation. Am. Mineral. 2005, 90, 347–358. [Google Scholar] [CrossRef]
- Vidal, O.; De Andrade, V.; Lewin, E.; Munoz, M.; Parra, T.; Pascarelli, S. P-T-Deformation-Fe3+/Fe2+ Mapping at the Thin Section Scale and Comparison with XANES Mapping: Application to a Garnet-Bearing Metapelite from the Sambagawa Metamorphic Belt (Japan). J. Metamorph. Geol. 2006, 24, 669–683. [Google Scholar] [CrossRef]
- Lanari, P.; Wagner, T.; Vidal, O. A Thermodynamic Model for Di-Trioctahedral Chlorite from Experimental and Natural Data in the System MgO-FeO-Al2O3- SiO2-H2O: Applications to P-T Sections and Geothermometry. Contrib. Mineral. Petrol. 2014, 167, 968. [Google Scholar] [CrossRef] [Green Version]
- Parra, T.; Vidal, O.; Theye, T. Experimental Data on the Tschermak Substitution in Fe-Chlorite. Am. Mineral. 2005, 90, 359–370. [Google Scholar] [CrossRef]
- Vidal, O.; Lanari, P.; Munoz, M.; Bourdelle, F.; De Andrade, V. Deciphering Temperature, Pressure and Oxygen-Activity Conditions of Chlorite Formation. Clay Miner. 2016, 51, 615–633. [Google Scholar] [CrossRef] [Green Version]
- Trincal, V.; Lanari, P. Al-Free Di-Trioctahedral Substitution in Chlorite and a Ferri-Sudoite End-Member. Clay Miner. 2016, 51, 675–689. [Google Scholar] [CrossRef]
- Bourdelle, F.; Parra, T.; Chopin, C.; Beyssac, O. A New Chlorite Geothermometer for Diagenetic to Low-Grade Metamorphic Conditions. Contrib. Mineral. Petrol. 2013, 165, 723–735. [Google Scholar] [CrossRef]
- Aja, S. Excess Functions of Chlorite Solid Solutions and Neoformation of Fe-Chlorites: Some Implications of Recent Thermochemical Measurements. Am. Mineral. 2019, 104, 232–243. [Google Scholar] [CrossRef]
- Inoue, A.; Kurokawa, K.; Hatta, T. Application of Chlorite Geothermometry to Hydrothermal Alteration in Toyoha Geothermal System, Southwestern Hokkaido, Japan. Resour. Geol. 2010, 60, 52–70. [Google Scholar] [CrossRef]
- Harbi, H.M.; Surour, A.A.; Davidson, G.J. Genesis of Neoproterozoic Au-Bearing Volcanogenic Sulfides and Quartz Veins in the Ar Rjum Goldfield, Saudi Arabia. Ore Geol. Rev. 2014, 58, 110–125. [Google Scholar] [CrossRef]
- Mamadou, M.M.; Cathelineau, M.; Bourdelle, F.; Boiron, M.-C.; Elmaleh, A.; Brouand, M. Hot Fluid Flows Around a Major Fault Identified by Paleothermometric Studies (Tim Mersoi Basin, Niger). J. Sediment. Res. 2016, 86, 914–928. [Google Scholar] [CrossRef]
- Perez-Caceres, I.; Martinez Poyatos, D.J.; Vidal, O.; Beyssac, O.; Nieto, F.; Simancas, J.F.; Azor, A.; Bourdelle, F. Deciphering the Metamorphic Evolution of the Pulo Do Lobo Metasedimentary Domain (SW Iberian Variscides). Solid Earth 2020, 11, 469–488. [Google Scholar] [CrossRef] [Green Version]
- Vazquez, M.; Nieto, F.; Morata, D.; Droguett, B.; Carrillo-Rosua, F.J.; Morales, S. Evolution of Clay Mineral Assemblages in the Tinguiririca Geothermal Field, Andean Cordillera of Central Chile: An XRD and HRTEM-AEM Study. J. Volcanol. Geotherm. Res. 2014, 282, 43–59. [Google Scholar] [CrossRef] [Green Version]
- Dolores Rodriguez-Ruiz, M.; Abad, I.; Bentabol, M.J. Permo-Triassic Clastic Rocks from the Ghomaride Complex and Federico Units (Rif Cordillera, N Morocco): An Example of Diagenetic-Metamorphic Transition. Minerals 2019, 9, 738. [Google Scholar] [CrossRef] [Green Version]
- Dowey, P.J.; Hodgson, D.M.; Worden, R.H. Pre-Requisites, Processes, and Prediction of Chlorite Grain Coatings in Petroleum Reservoirs: A Review of Subsurface Examples. Mar. Pet. Geol. 2012, 32, 63–75. [Google Scholar] [CrossRef]
- Mosser-Ruck, R.; Pignatelli, I.; Bourdelle, F.; Abdelmoula, M.; Barres, O.; Guillaume, D.; Charpentier, D.; Rousset, D.; Cathelineau, M.; Michau, N. Contribution of Long-Term Hydrothermal Experiments for Understanding the Smectite-to-Chlorite Conversion in Geological Environments. Contrib. Mineral. Petrol. 2016, 171, 97. [Google Scholar] [CrossRef]
- Jiang, W.; Peacor, D.; Buseck, P. Chlorite Geothermometry—Contamination and Apparent Octahedral Vacancies. Clays Clay Miner. 1994, 42, 593–605. [Google Scholar] [CrossRef]
- Hillier, S.; Velde, B. Chlorite Interstratified with a 7-a Mineral—An Example from Offshore Norway and Possible Implications for the Interpretation of the Composition of Diagenetic Chlorites. Clay Miner. 1992, 27, 475–486. [Google Scholar] [CrossRef]
- Curtis, C.D.; Ireland, B.J.; Whiteman, J.A.; Mulvaney, R.; Whittle, C.K. Authigenic Chlorites: Problems with Chemical Analysis and Structural Formula Calculations. Clay Miner. 1984, 19, 471–481. [Google Scholar] [CrossRef]
- Putnis, A. Mineral Replacement Reactions. In Thermodynamics and Kinetics of Water-Rock Interaction; Oelkers, E.H., Schott, J., Eds.; De Gruyter: Berlin, Germany, 2009; Volume 70, pp. 87–124. [Google Scholar]
- Putnis, C.V.; Geisler, T.; Schmid-Beurmann, P.; Stephan, T.; Giampaolo, C. An Experimental Study of the Replacement of Leucite by Analcime. Am. Mineral. 2007, 92, 19–26. [Google Scholar] [CrossRef]
- Trincal, V.; Lanari, P.; Buatier, M.; Lacroix, B.; Charpentier, D.; Labaume, P.; Munoz, M. Temperature Micro-Mapping in Oscillatory-Zoned Chlorite: Application to Study of a Green-Schist Facies Fault Zone in the Pyrenean Axial Zone (Spain). Am. Mineral. 2015, 100, 2468–2483. [Google Scholar] [CrossRef]
- Ganne, J.; De Andrade, V.; Weinberg, R.F.; Vidal, O.; Dubacq, B.; Kagambega, N.; Naba, S.; Baratoux, L.; Jessell, M.; Allibon, J. Modern-Style Plate Subduction Preserved in the Palaeoproterozoic West African Craton. Nat. Geosci. 2012, 5, 60–65. [Google Scholar] [CrossRef]
- Vidal, O.; Baldeyrou, A.; Beaufort, D.; Fritz, B.; Geoffroy, N.; Lanson, B. Experimental Study of the Stability and Phase Relations of Clays at High Temperature in a Thermal Gradient. Clays Clay Miner. 2012, 60, 200–225. [Google Scholar] [CrossRef]
- Jahren, J. Evidence of Ostwald Ripening Related Recrystallization of Diagenetic Chlorites from Reservoir Rocks Offshore Norway. Clay Miner. 1991, 26, 169–178. [Google Scholar] [CrossRef]
- Bourdelle, F.; Parra, T.; Beyssac, O.; Chopin, C.; Moreau, F. Ultrathin Section Preparation of Phyllosilicates by Focused Ion Beam Milling for Quantitative Analysis by TEM-EDX. Appl. Clay Sci. 2012, 59–60, 121–130. [Google Scholar] [CrossRef]
- Wirth, R. Focused Ion Beam (FIB): A Novel Technology for Advanced Application of Micro- and Nanoanalysis in Geosciences and Applied Mineralogy. Eur. J. Mineral. 2004, 16, 863–876. [Google Scholar] [CrossRef] [Green Version]
- Munoz, M.; De Andrade, V.; Vidal, O.; Lewin, E.; Pascarelli, S.; Susini, J. Redox and Speciation Micromapping Using Dispersive X-Ray Absorption Spectroscopy: Application to Iron Chlorite Mineral of a Metamorphic Rock Thin Section. Geochem. Geophys. Geosystems 2006, 7, Q11020. [Google Scholar] [CrossRef]
- Rat, J.; Mouthereau, F.; Brichau, S.; Cremades, A.; Bernet, M.; Balvay, M.; Ganne, J.; Lahfid, A.; Gautheron, C. Tectonothermal Evolution of the Cameros Basin: Implications for Tectonics of North Iberia. Tectonics 2019, 38, 440–469. [Google Scholar] [CrossRef]
- Grosch, E.G.; Vidal, O.; Abu-Alam, T.; McLoughlin, N. P-T Constraints on the Metamorphic Evolution of the Paleoarchean Kromberg Type-Section, Barberton Greenstone Belt, South Africa. J. Petrol. 2012, 53, 513–545. [Google Scholar] [CrossRef] [Green Version]
- Grosch, E.G.; McLoughlin, N.; Lanari, P.; Erambert, M.; Vidal, O. Microscale Mapping of Alteration Conditions and Potential Biosignatures in Basaltic-Ultramafic Rocks on Early Earth and Beyond. Astrobiology 2014, 14, 216–228. [Google Scholar] [CrossRef] [PubMed]
- Inoue, A.; Inoue, S.; Utada, M. Application of Chlorite Thermometry to Estimation of Formation Temperature and Redox Conditions. Clay Miner. 2018, 53, 143–158. [Google Scholar] [CrossRef]
- Bourdelle, F.; Benzerara, K.; Beyssac, O.; Cosmidis, J.; Neuville, D.R.; Brown, G.E.; Paineau, E. Quantification of the Ferric/Ferrous Iron Ratio in Silicates by Scanning Transmission X-Ray Microscopy at the Fe L-2,L-3 Edges. Contrib. Mineral. Petrol. 2013, 166, 423–434. [Google Scholar] [CrossRef]
- Sussenberger, A.; Pospiech, S.; Schmidt, S.T. [MnO Vertical Bar SiO2, Al2O3, FeO, MgO] Balanced Log-Ratio in Chlorites: A Tool for Chemo-Stratigraphic Mapping and Proxy for the Depositional Environment. Clay Miner. 2018, 53, 351–375. [Google Scholar] [CrossRef]
- Bobos, I.; Noronha, F.; Mateus, A. Fe-, Fe,Mn- and Fe,Mg-Chlorite: A Genetic Linkage to W, (Cu, Mo) Mineralization in the Magmatic-Hydrothermal System at Borralha, Northern Portugal. Mineral. Mag. 2018, 82, S259–S279. [Google Scholar] [CrossRef] [Green Version]
- Smith, W.C.; Bannister, F.A.; Hey, M.H. Pennantite, a New Manganese-Rich Chlorite from Benallt Mine, Rhiw, Carnarvonshire. Mineral. Mag. 1946, 27, 217–220. [Google Scholar]
Figure 1.
Representation of several compositional datasets of low-temperature chlorites from several geological settings ([25,26,29,30,31,32,33,34,35,36,42]; modified from [23]) in the R2+–Si diagram of [17]. Compositional trends drawn by each dataset were identified and are shown as qualitative lines (in blue). The compositions were also assembled according to their temperature of formation (chlorite compositions from [37,38,39,40,43] were also considered), which was determined by each author using several independent methods (e.g., RSCM, vitrinite reflectance, microthermometric data of fluid inclusions, bottom hole temperature, isotopy), allowing identification of several isotherms (dashed colored lines; see [23]). The field covered by LT chlorite compositional datasets is approximated by the area circled with a purple dotted line. All Fe is regarded as Fe2+. R2+ refers to divalent cations (Fe2+ and Mg2+), R3+ to trivalent cations (Al3+, Fe3+), and □ to vacancies. apfu—atoms per formula unit.

Figure 2.
Projection field (R2+–Si diagram) for chlorite compositions [17]. Values are given in atoms per formula unit (apfu) with a 14-oxygen basis. Several end-members are indicated and the compositional spaces defined by the models of Walshe [11], Vidal et al. [9,49,50,53], Inoue et al. [28], and Bourdelle et al. [55] are outlined. The field covered by LT chlorite compositional datasets (see Figure 1) is approximated by the area circled in purple dotted lines. R2+ refers to divalent cations (Fe2+ and Mg2+), R3+ to trivalent cations (Al3+, Fe3+), and □ to vacancies. The area of optimal reliability for Bourdelle’s thermometer is shown in dark blue [23].

Figure 3.
TEM–EDX analysis obtained on a FIB cross-section of a chlorite from Glarus. (a) Scanning electron microscopy image of the petrographic thin section showing the emplacement of the FIB foil to be cut across the chlorite. (b) Bright-field TEM image of the FIB foil extraction, with the platinum strap on top. (c) Enlargement of part b showing the R2+ (Fe2+ + Mg2+) contents of chlorite (apfu) and their variation from crystal core to crystal rim (TEM–EDX analysis). Reproduced with permission from [43], published by Elsevier B.V.


Table 1.
Chlorite geothermometers.
| Ref. | Year | Type | Equation (Oxygen Basis (14 or 28) in Brackets)/Equilibrium 1,2,3 | Elements/End-Members |
|---|---|---|---|---|
| Cathelineau and Nieva [12] | 1985 | empirical equation | T = 212.3AlIV + 17.5 (14) | AlIV content |
| Kranidiotis and McLean [47] | 1987 | empirical equation | T = 106(AlIV + 0.7XFe) + 18 (28) | AlIV, Fe, Mg contents |
| Cathelineau [25] | 1988 | empirical equation | T = 321.98AlIV − 61.92 (14) | AlIV content |
| Jowett [48] | 1991 | empirical equation | T = 319(AlIV + 0.1XFe) − 69 (14) | AlIV, Fe, Mg contents |
| Hillier and Velde [24] | 1991 | empirical equation | T = 249.56AlIV − 320.28 (28) | AlIV content |
| Zang and Fyfe [45] | 1995 | empirical equation | T = 106.2(AlIV − 0.88[XFe − 0.34]) + 17.5 (28) | AlIV, Fe, Mg contents |
| Xie et al. [38] | 1997 | empirical equation | T = 321.98(AlIV + 0.133[0.31 − XFe (<0.31)]) − 61.92 (14) | AlIV, Fe, Mg contents |
| Vidal et al. [9] | 2001 | thermodynamic model | 2 clinochlore + 3 Mg-sudoite = 4 Mg-amesite + 7 quartz + 4 H2O | clinochlore daphnite Mg-amesite Mg-sudoite |
| Vidal et al. [49,50] | 2005 2006 | thermodynamic model | + 5 Fe-amesite + 4 clinochlore = 5 Mg-amesite + 4 daphnite 4 16 daphnite + 15 Mg-sudoite = 20 Fe-amesite + 6 clinochlore + 35 quartz + 20 H2O 4 daphnite + 6 Mg-sudoite = 5 Fe-amesite + 3 Mg-amesite + 14 quartz + 8 H2O | + Fe-amesite |
| Lanari et al. [51] | 2014 | thermodynamic model | + 2 daphnite + 3 Fe-sudoite = 4 Fe-amesite + 7 quartz + 4 H2O Mg-amseite + 2 Fe-sudoite = Fe-amesite + 2 Mg-sudoite 2 clinochlore + 5 Fe-sudoite = 2 daphnite + 5 Mg-sudoite | + Fe-sudoite |
| Vidal et al. [53] | 2016 | thermodynamic model | + 14 equilibrium implying quartz, O2, and ferri-sudoite | + Ferri-sudoite |
| Walshe [11] | 1986 | semi-empirical model | T = 1626/(6.542 + 0.33(log K) − 273 5 Al-free Mg-chlorite + 3 pyrophyllite-gibbsite = 6 clinochlore + 14 quartz + 8 H2O | Al-free Mg-chlorite clinochlore chamosite (daphnite) pyrophyllite-gibbsite |
| Inoue et al. [28] | 2009 | semi-empirical model | T = 1/(0.00293 − 0.000513(log K) + 0.00003904(log K)²) − 273 Al-free Mg-chlorite + 3 Mg-sudoite = 3 Mg-amesite + 7 quartz + 4H2O | Al-free Mg-chlorite Mg-corundophilite (amesite) Mg-sudoitechamosite (daphnite) |
| Bourdelle et al. [55] | 2013 | semi-empirical model | T = −9400/(log K − 23.40) − 273 Al-free Mg-chlorite + 3 Mg-sudoite = 3 Mg-amesite + 7 quartz + 4H2O | Al-free Fe-, Mg-chlorite Fe-, Mg-amesite Fe-, Mg-sudoite |
1 XFe = Fe/(Fe + Mg). 2 T in °C. 3 K: chlorite + quartz equilibrium constant. 4 Only in particular P-T conditions.
Publisher’s Note: MDPI stays neutral with regard to jurisdictional claims in published maps and institutional affiliations. |
© 2021 by the author. Licensee MDPI, Basel, Switzerland. This article is an open access article distributed under the terms and conditions of the Creative Commons Attribution (CC BY) license (http://creativecommons.org/licenses/by/4.0/).
Share and Cite
MDPI and ACS Style
Bourdelle, F. Low-Temperature Chlorite Geothermometry and Related Recent Analytical Advances: A Review. Minerals 2021, 11, 130. https://0-doi-org.brum.beds.ac.uk/10.3390/min11020130
AMA Style
Bourdelle F. Low-Temperature Chlorite Geothermometry and Related Recent Analytical Advances: A Review. Minerals. 2021; 11(2):130. https://0-doi-org.brum.beds.ac.uk/10.3390/min11020130
Chicago/Turabian StyleBourdelle, Franck. 2021. "Low-Temperature Chlorite Geothermometry and Related Recent Analytical Advances: A Review" Minerals 11, no. 2: 130. https://0-doi-org.brum.beds.ac.uk/10.3390/min11020130
Note that from the first issue of 2016, this journal uses article numbers instead of page numbers. See further details here.