Article

Mineralogy and Geochemistry of Deep-Sea Sediments from the Ultraslow-Spreading Southwest Indian Ridge: Implications for Hydrothermal Input and Igneous Host Rock

1
School of Marine Sciences, Sun Yat-Sen University, Guangzhou 510006, China
2
Guangdong Provincial Key Laboratory of Marine Resources and Coastal Engineering, Guangzhou 510006, China
3
School of Earth Sciences and Engineering, Sun Yat-Sen University, Guangzhou 510275, China
4
South China Sea Institute of Planning and Environmental Research, Ministry of Natural Resources, Guangzhou 510300, China
*
Authors to whom correspondence should be addressed.
Submission received: 15 December 2020 / Revised: 14 January 2021 / Accepted: 25 January 2021 / Published: 29 January 2021
(This article belongs to the Special Issue Genesis and Exploration for Submarine Sulphide Deposits)

Abstract

:
Detailed mineralogical and geochemical characteristics of typical surface sediments and hydrothermal deposits collected from the ultraslow-spreading Southwest Indian Ridge (SWIR) were studied by high-resolution XRD, SEM-EDS, XRF, and ICP-MS. The SWIR marine samples can be generally classified into two main categories: surface sediment (biogenic, volcanic) and hydrothermal-derived deposit; moreover, the surface sediment can be further classified into metalliferous and non-metalliferous based on the metalliferous sediment index (MSI). The chemical composition of biogenic sediment (mainly biogenic calcite) was characterized by elevated contents of Ca, Ba, Rb, Sr, Th, and light rare earth elements (LREE), while volcanic sediment (mainly volcanogenic debris) was relatively enriched in Mn, Mg, Al, Si, Ni, Cr, and high field strength elements (HFSEs). By contrast, the hydrothermal-derived deposit (mainly pyrite-marcasite, chalcopyrite-isocubanite, and low-temperature cherts) contained significantly higher contents of Fe, Cu, Zn, Pb, Mn, Co, Mo, Ag, and U. In addition, the metalliferous surface sediment contained a higher content of Cu, Mn, Fe, Co, Mo, Ba, and As. Compared with their different host (source) rock, the basalt-hosted marine sediments contained higher contents of Ti–Al–Zr–Sc–Hf and/or Mo–Ba–Ag; In contrast, the peridotite-hosted marine sediments were typically characterized by elevated concentrations of Mg–Cu–Ni–Cr and/or Co–Sn–Au. The differences in element enrichment and mineral composition between these sediment types were closely related to their sedimentary environments (e.g., near/far away from the vent sites) and inherited from their host (source) rock. Together with combinations of certain characteristic elements (such as Al–Fe–Mn and Si–Al–Mg), relict hydrothermal products, and diagnostic mineral tracers (e.g., nontronite, SiO2(bio), olivine, serpentine, talc, sepiolite, pyroxene, zeolite, etc.), it would be more effective to differentiate the host rock of deep-sea sediments and to detect a possible hydrothermal input.

1. Introduction

The mid-ocean ridges are generally considered to lack sediments and to have minimal input of terrigenous materials. Peculiar topography, frequent volcanic activities, and faulting lead to an uneven distribution of sediments in these regions [1]. Seafloor hydrothermal processes, submarine volcanism, and the host rocks all play important roles in affecting the compositions of marine sediments [2]. The geochemical characteristics of the near-field sediments are different from those far away from a hydrothermal vent field [3]. Moreover, the geochemical characteristics of the sediments near a peridotite-hosted hydrothermal vent field are different from those near a basalt-hosted hydrothermal vent field [4,5]. The hydrothermal alteration of peridotite will release Fe, Cr, Ni, Co, Au, and Ag elements into the ambient environment [6]. This leads to their enrichment in hydrothermal sulfide deposits and surrounding marine sediments relative to basalt-hosted hydrothermal-sedimentary systems. Hydrothermal vent fields of basalt-hosted systems are common, but those of the peridotite-hosted systems are rare. Peridotite is an ultramafic host rock that usually occurs in slow-spreading ocean ridges (e.g., mid-Atlantic Ridge) and ultraslow-spreading ocean ridges (e.g., Southwest Indian Ridge). In these areas, a low magma supply and the development of detachment faults result in the exposure of mantle peridotite on the seafloor [7]. Research regarding peridotite-hosted hydrothermal-sedimentary systems mainly focuses on the slow-spreading mid-Atlantic Ridge (for example, Lost City Vent Field, Logatchev Vent Field, Rainbow Vent Field, and Saldanha Vent Field) [8,9,10,11]. However, it rarely focuses on ultraslow-spreading Southwest Indian Ridge (SWIR). Hence, there are still many details about this ultraslow-spreading ridge that remain to be discovered.
To date, on 46° E–52° E and 61° E–70° E SWIR, most studies have revolved around elemental analysis, mineral composition analysis [12,13,14,15,16,17,18], mineralization [19,20], Fe–Cu–Zn isotopes [21], sulfur isotopes [22,23], Sr–Pb isotopes of sulfides [19], nano-minerals, and enrichment characteristics. They also have focused on the mechanisms of noble metal [24], 230Th/238U dating of sulfides [25], carbon and oxygen isotopes of surface sediment and barnacle [12,26], the grain size distribution of surface sediments [27], and element diffusion from hydrothermal vent to ambient surface sediment [5,28,29]. Moreover, a few research attempts have focused on the organic geochemical characteristics of surface and hydrothermal deposits [30,31,32]. However, previous studies have focused mostly on one type or two types of samples. Furthermore, the study area was mostly constrained within a small area in the Indomed–Gallieni section. The lack of comprehensive and systematic research, the main focus on hydrothermal input to marine sediments, and the rare focus on submarine volcanism and the influence and comparison of the basalt-peridotite host rock are evident in the aforementioned studies. In addition, the detailed and comprehensive differences in geochemistry and mineralogy, when rock debris and bioclasts are mixed, are missing.
When applying the usually hydrothermal indicators to judge whether surface sediment is metalliferous sediment due to the input of hydrothermal activity, the presence of rock fragments can play a seriously misleading role, which involves the specific host rock [33,34]. Different rock fragments can cause different degrees of misleading results. They can be divided into basalt- and peridotite-hosted types. Without a comprehensive analysis and elimination of the impact of rock fragments, the judgment will be erroneous. Therefore, this study discusses the impact of hydrothermal input as well as the host rock fragments in sediments. Hence, this research will provide some valuable references for follow-up research attempts.
This paper focuses on the Indomed–Gallieni section (46° E–52° E) and part of the Melville–Rodrigues Triple Junction (MEL-RTJ) section (61° E–70° E), with an expanded study area. The samples include the richer samples of peridotite-hosted hydrothermal-derived deposits and surface sediments, basalt-hosted hydrothermal-derived deposits, and surface sediments. We aimed to evaluate and study the effects of submarine volcanism and basalt-peridotite host rocks on marine sediments comprehensively and systematically. We also tried to further summarize the element enrichment and mineralogical characteristics of marine sediments in different hydrothermal-sedimentary environments. This is beneficial for further prospecting, especially for the exploration of inactive and buried hydrothermal vents.

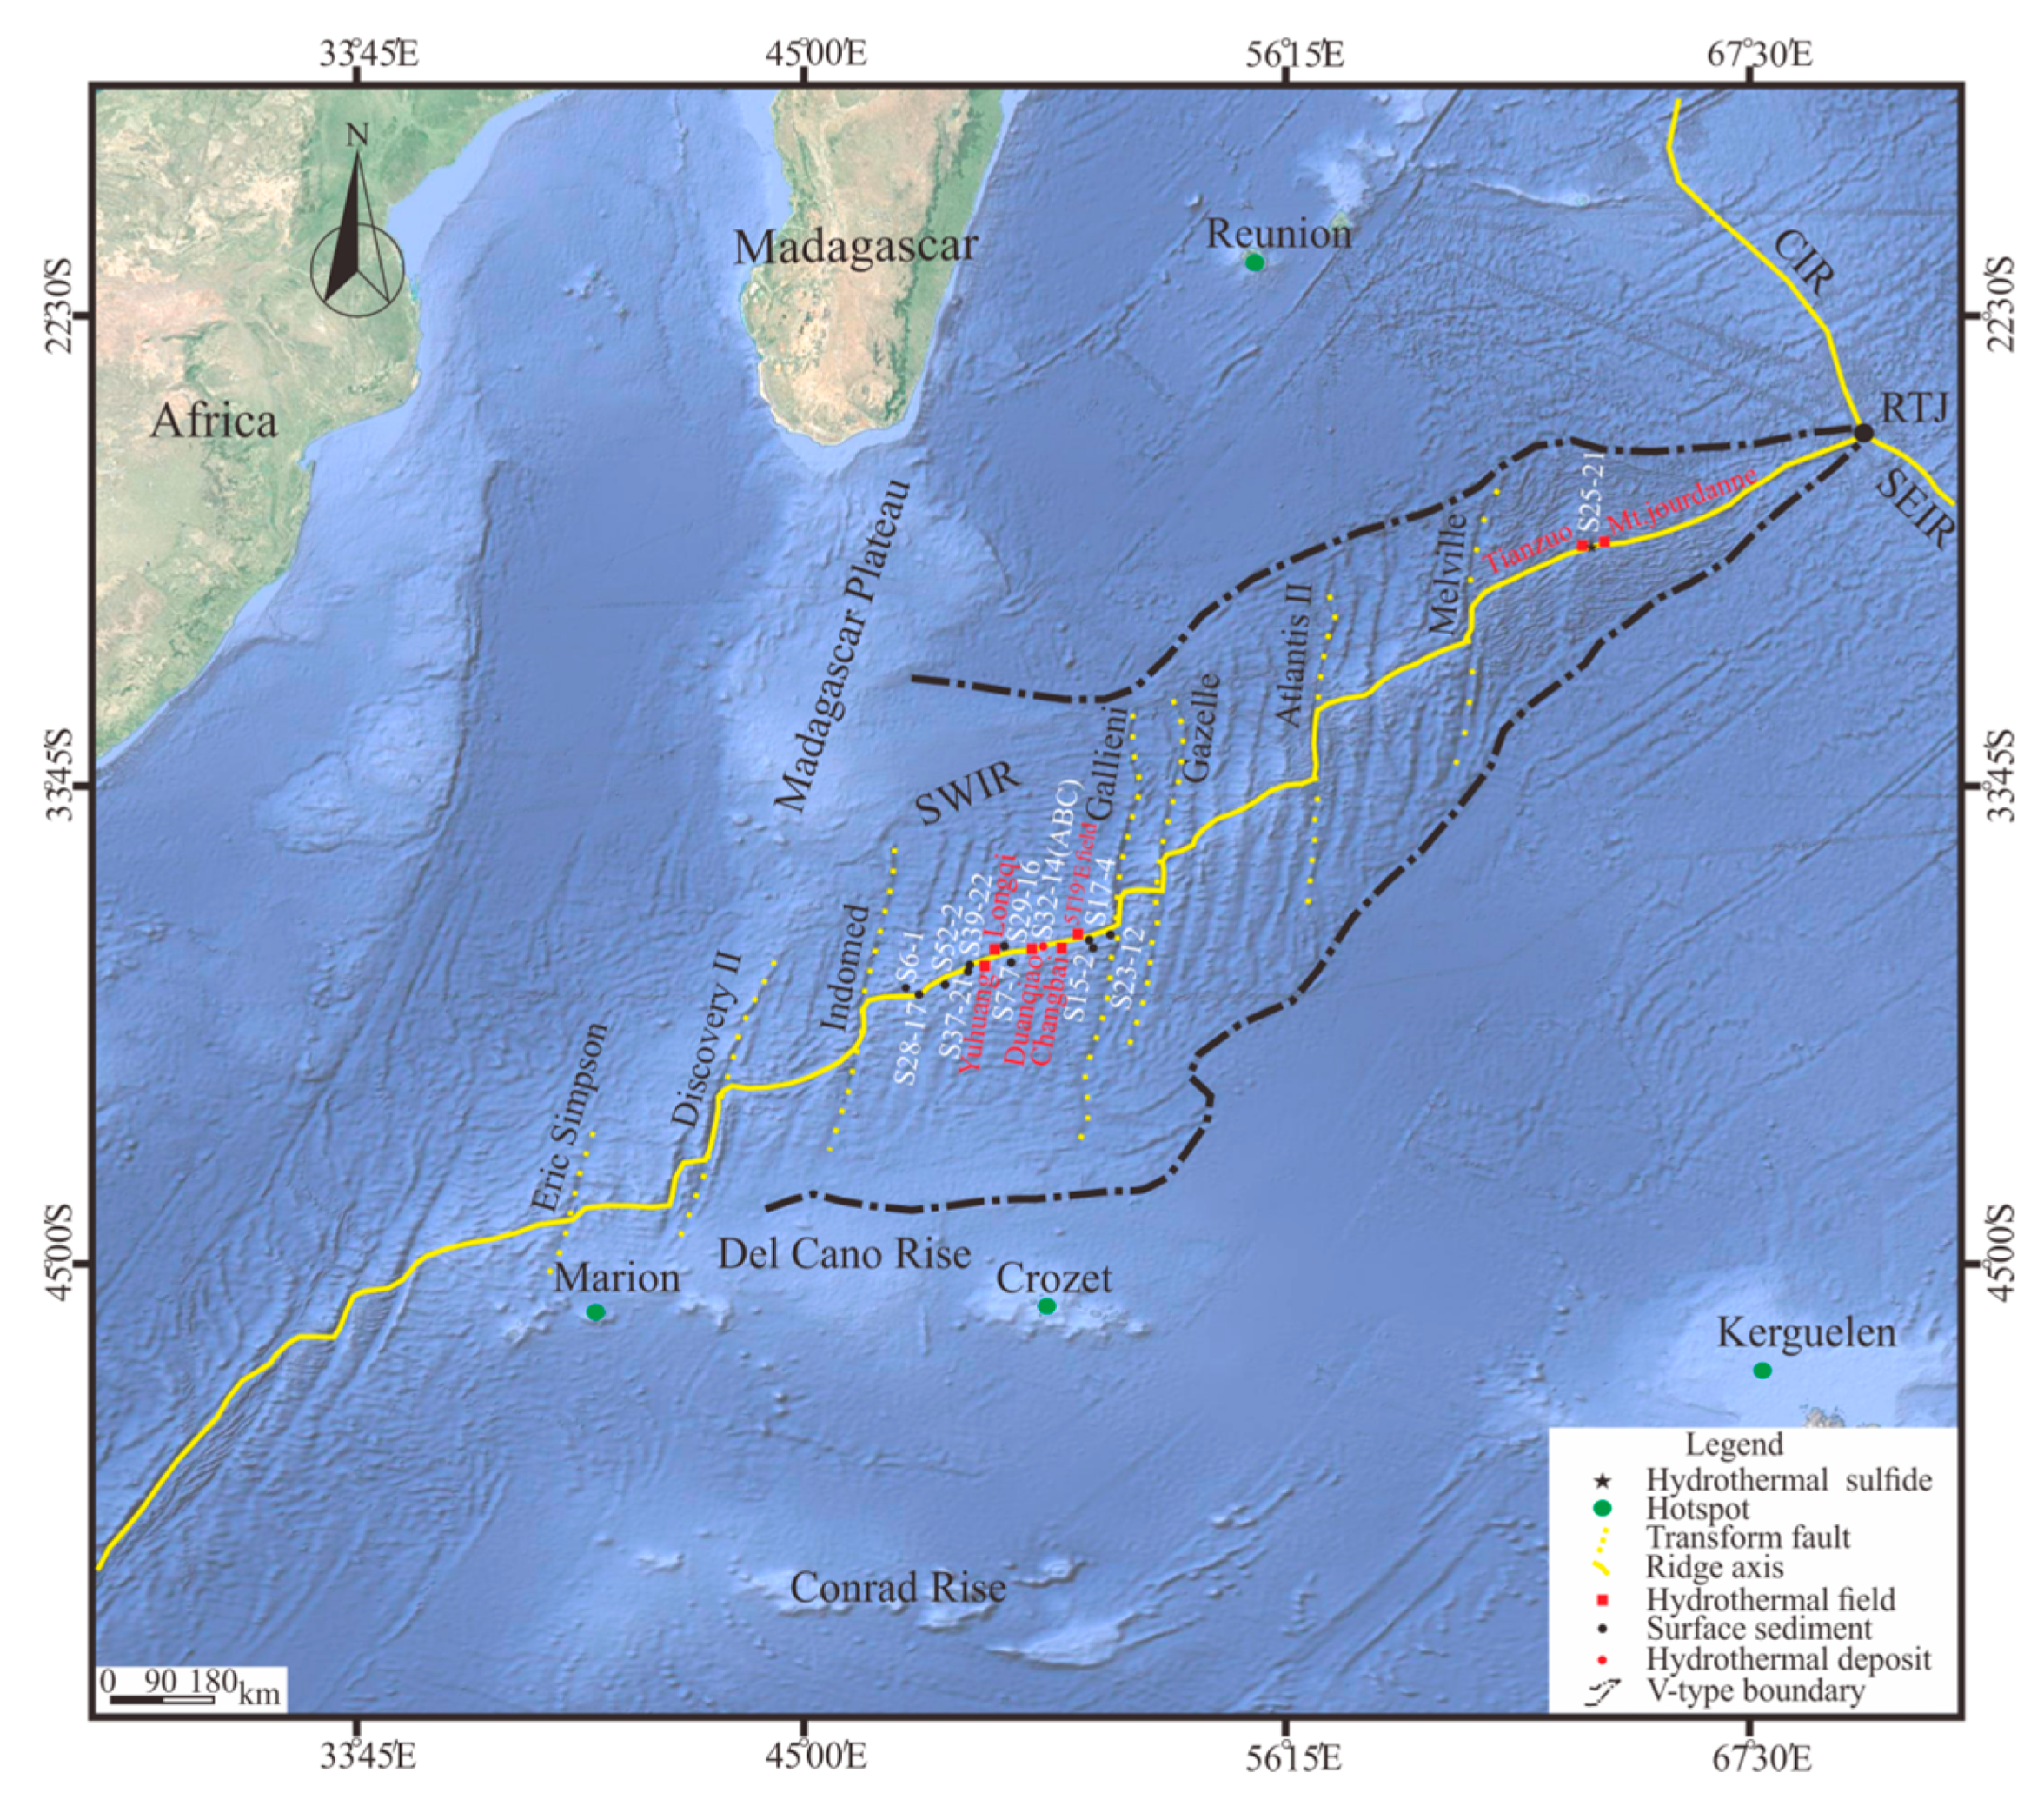
2. Geological Background

The mid-ocean ridge is one of the most active tectonic settings at the modern seafloor, where volcanic activity and earthquakes often occur. Mantle material is constantly gushing out of the mid-ocean ridge and expanding outward. As the ridge axis expands laterally, the oceanic crust separates, and many transform faults are formed [35]. The Southwest Indian Ridge presents a V-shaped outline (Figure 1), which is considered to be the result of the interaction between the mid-ocean ridge and the hot spots [36]. Between Indomed (IN) and Gallieni (GA) transform faults, the ridge is axially ENE-deflected, with rugged topography and different water depths ranging from 1500 to 4000 m [37]. It belongs to a sediment-covered ridge and mostly basaltic host rock system, and there are many rifts in the middle of the ridge. The north part of the rift has deeper water depth, but the south part is shallow [38]. The latest exploration results show that the magma supply in this section where hydrothermal mussels can be found in relatively high, and the mantle temperature is relatively high, too [39]. It is suspected that it is the influence caused by the neighboring hot spot “Crozet”, and the ocean crust there is thin and has suitable permeability [36,39]. Previous studies have discovered basalt, gabbro, diabase, serpentinized peridotite, and oceanic core complex in this ridge section, but the dominant lithology is basalt [40]. On the IN-GA ridge section, there are four active/inactive hydrothermal fields that have been discovered recently, including Longqi, Duanqiao, Yuhuang and Changbai [41]. Among them, the Longqi Vent Field is the first discovered active hydrothermal field on the ultraslow-spreading SWIR [42,43]. Previous studies have shown that local bottom water (near 37°–39° S) mainly flows toward the northwest direction, with a maximum velocity of 20–30 cm/s [44], which may be related to the existence of AABW [45]. The sampling stations on the MEL-RTJ ridge section are located between 27° S and 28° S within the southeast trade wind belt, and the average water depth can exceed 4730 m. Previous studies have shown that regional detachment faults are widespread in this ridge section. Thus, the crust there is thinner, and the mantle temperature is low [46,47]. On the other hand, the latest research shows that the hydrothermal activity in the Longqi field is actually controlled by detachment faults [48]. Moreover, an inactive hydrothermal field, named Tianzuo, has been newly discovered on the SWIR 63°32′ E in 2009, and it is regarded as the first peridotite-hosted hydrothermal system found on an ultra-slow spreading ridge. The inactive Mt. Jourdanne Field near Tianzuo was discovered on the MEL-RTJ ridge section in 1998, which may be related to the migration of hot spots but is far from the hot spot “Crozet” nowadays. Neovolcanic ridges extend laterally, lack volcanic construction, and the terrain is relatively flat, and the main lithology exposing on the seabed from this sediment-starved ridge is mantle-derived peridotite [49].

3. Materials and Methods

3.1. Samples

The surface sediments and hydrothermal-derived deposits were collected by TV-grab on SWIR during cruises DY20, DY21, DY22, DY30 and DY40, conducted by China Ocean Mineral Resource R&D Association (COMRA); after collection, the samples were packed in transparent plastic self-sealing bags and stored in a refrigerator (−30 °C). The depth had a range from 1739 m to 3879 m, and the sample types were somewhat complicated. Sites, water depths and brief descriptions of samples are summarized in Table 1. According to their different sedimentary environment and mineral composition, samples would be divided into hydrothermal-derived deposits, biogenic, and volcanic sediment. Then, according to their different host rock or the rock debris they contained, samples were further divided into basalt-hosted and peridotite-hosted; meanwhile, the classification of basalt-hosted and peridotite-hosted properties of biogenic sediments would be determined by the property of their nearby hydrothermal vent field.

3.2. Methods

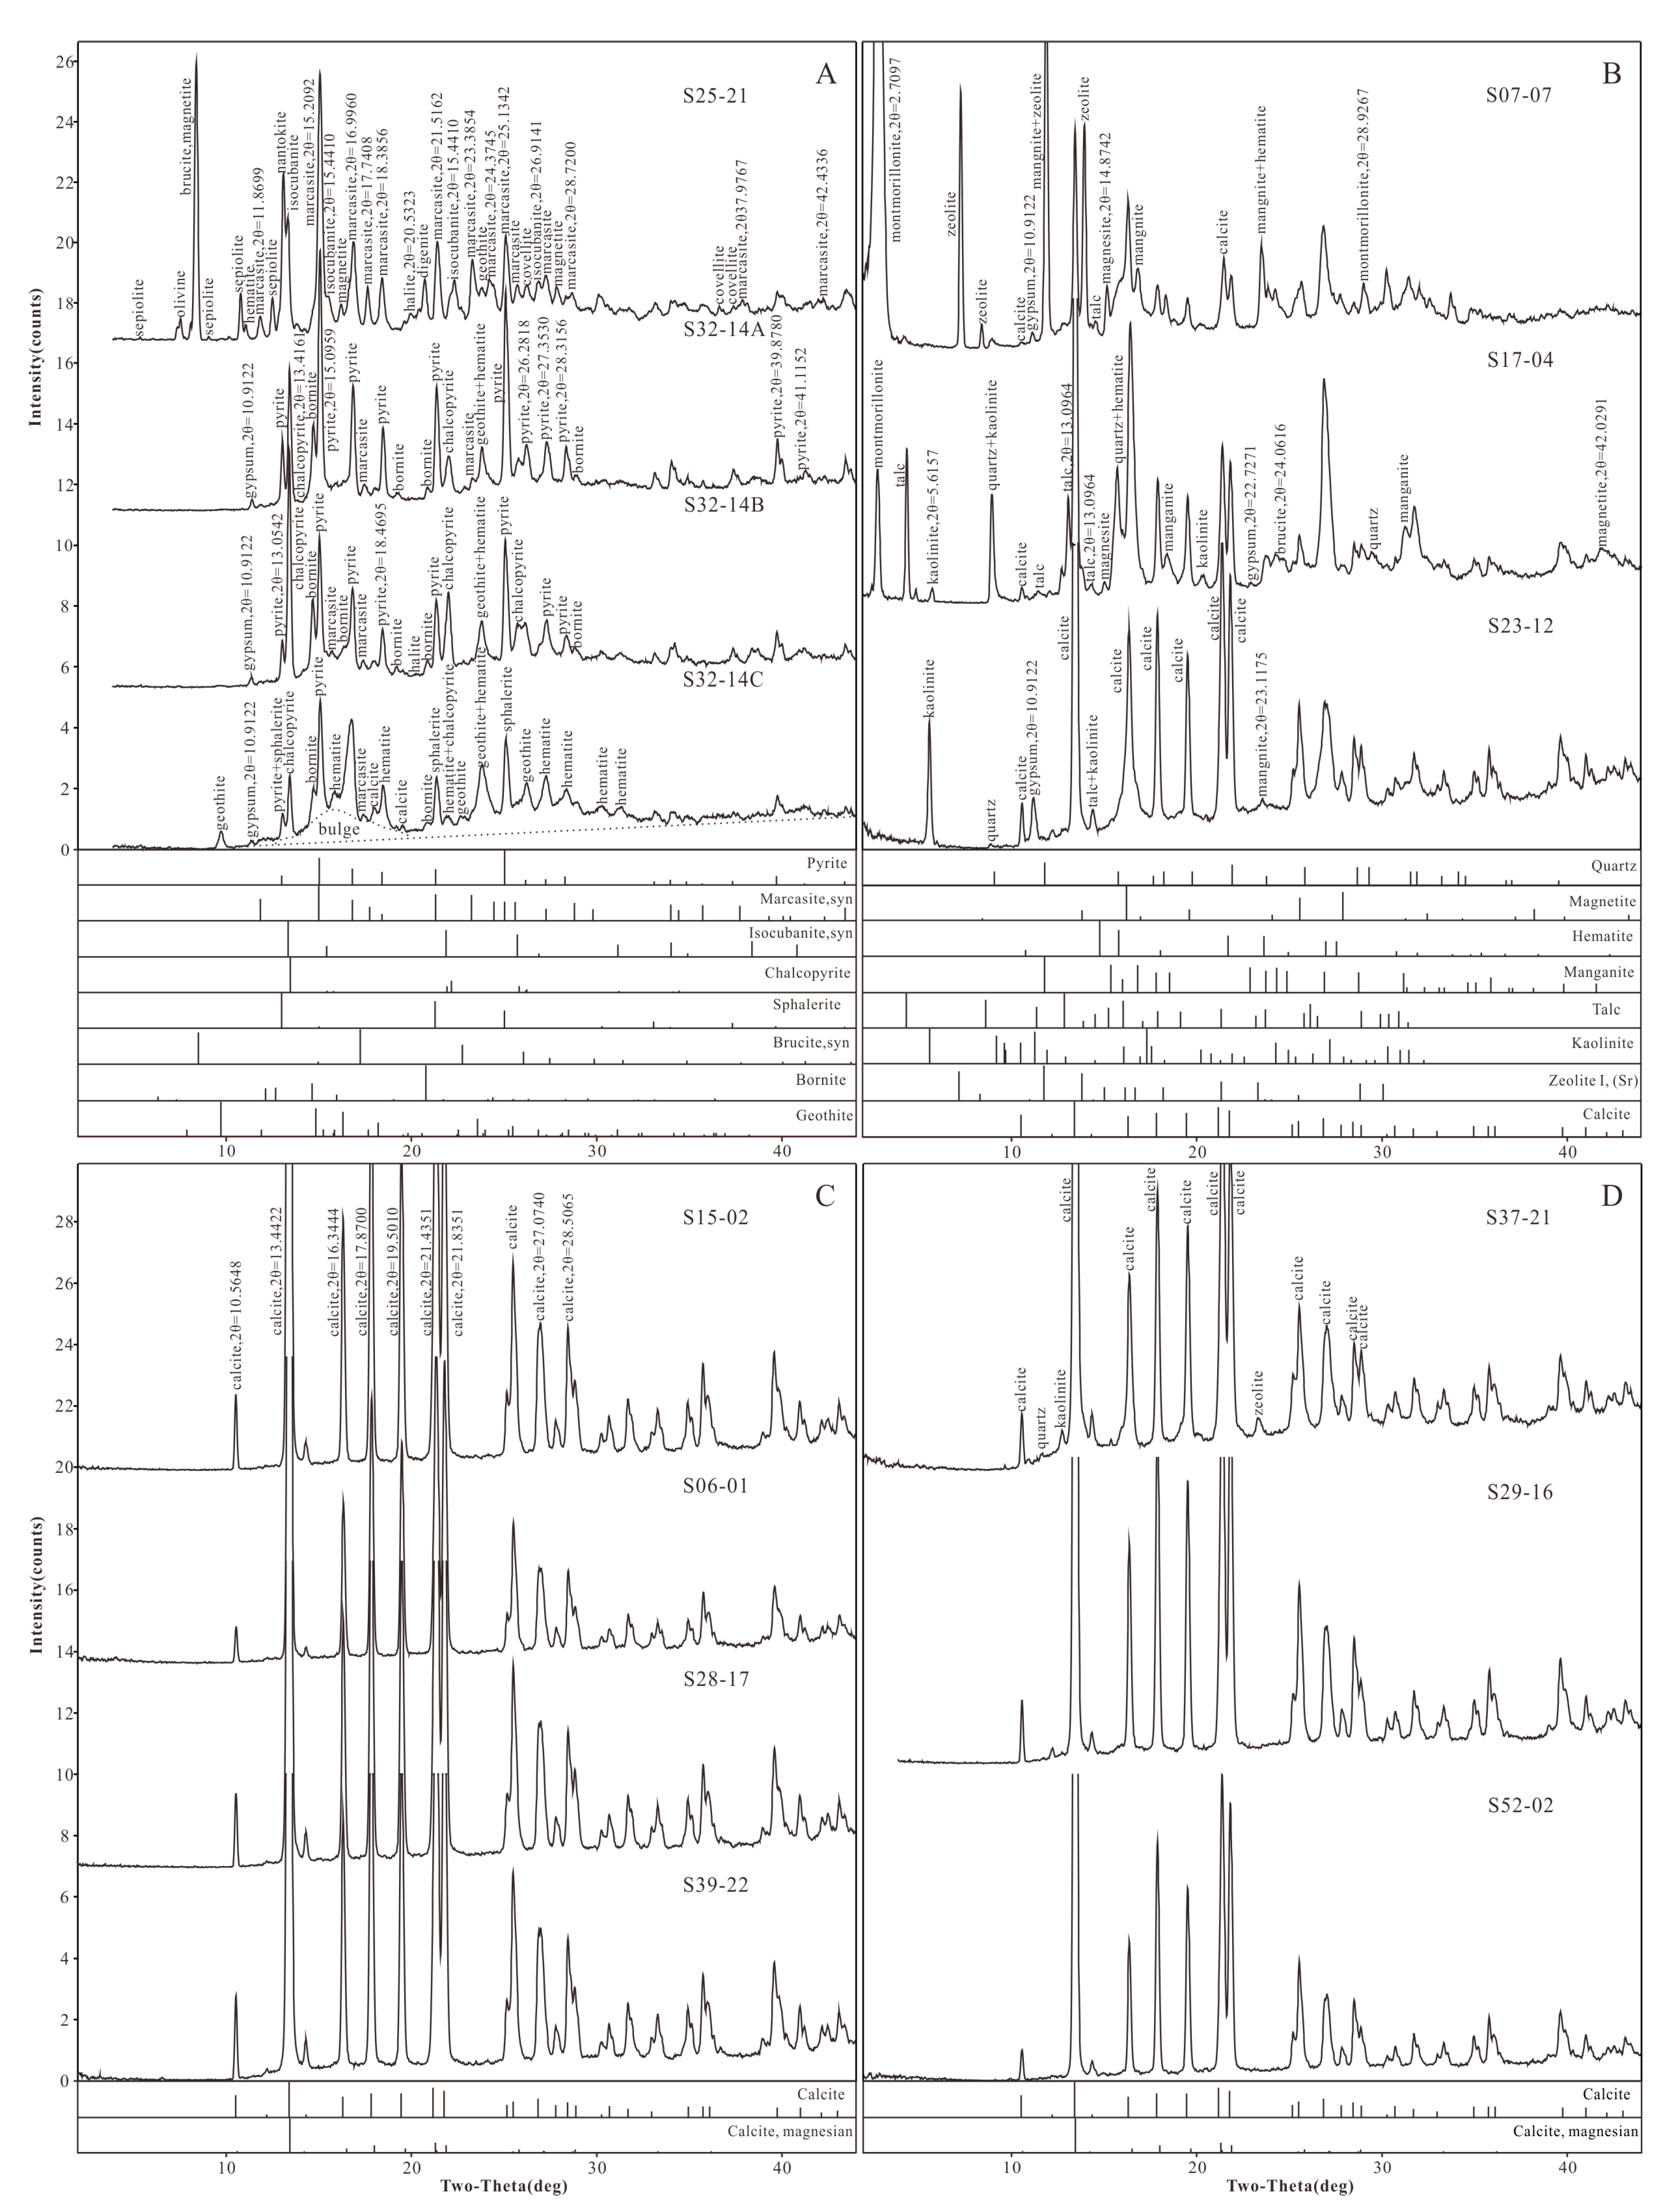
3.2.1. X-ray Diffraction (XRD)

To prevent oxidation during drying, all sediments were dried in a vacuum oven for 24 h at 50 °C. After drying, dried samples were ground into fine powders (~200 meshes) by using an agate mortar and pestle. The powder was loaded into a fiberglass pipe and analyzed on a Rigaku D/MAX RAPIDⅡX-ray diffractometer (Rigaku, Tokyo, Japan) with a Mo Kα X-ray source at 50 kV and 30 mA for 15 min. The XRD patterns of all sediments were recorded on a plate detector and then transformed into 0°–45° 2θ range by Rigaku’s 2DP software (version 1.1), with a 0.02° step size at a scan rate of 1°/sec for qualitative analysis. Major constituent minerals were identified by using the PDXL software (version 2.0).

3.2.2. Major and Trace Elements Analysis

Elements analysis was carried out at the ALS Chemex Co., Ltd. (Guangzhou, China) Before element testing, all samples were first tested for their sulfur contents. For sample preparation, samples were dried and crushed into 200 meshes. The powder samples were dissolved with HClO4, HNO3 and HF. The solutions were evaporated to dryness, and then the residue was leached and dissolved by dilute HCl. Major and trace element concentrations (including rare earth elements) were analyzed by an X-ray fluorescence spectrometer (XRF) and ICP-MS, respectively. The content of gold was analyzed by AAS with the fire-assaying method. The measurement error for major element analysis was within 5%, and the measurement error for trace element analysis was within 10%. Detailed experimental procedures were as described by [13,22].

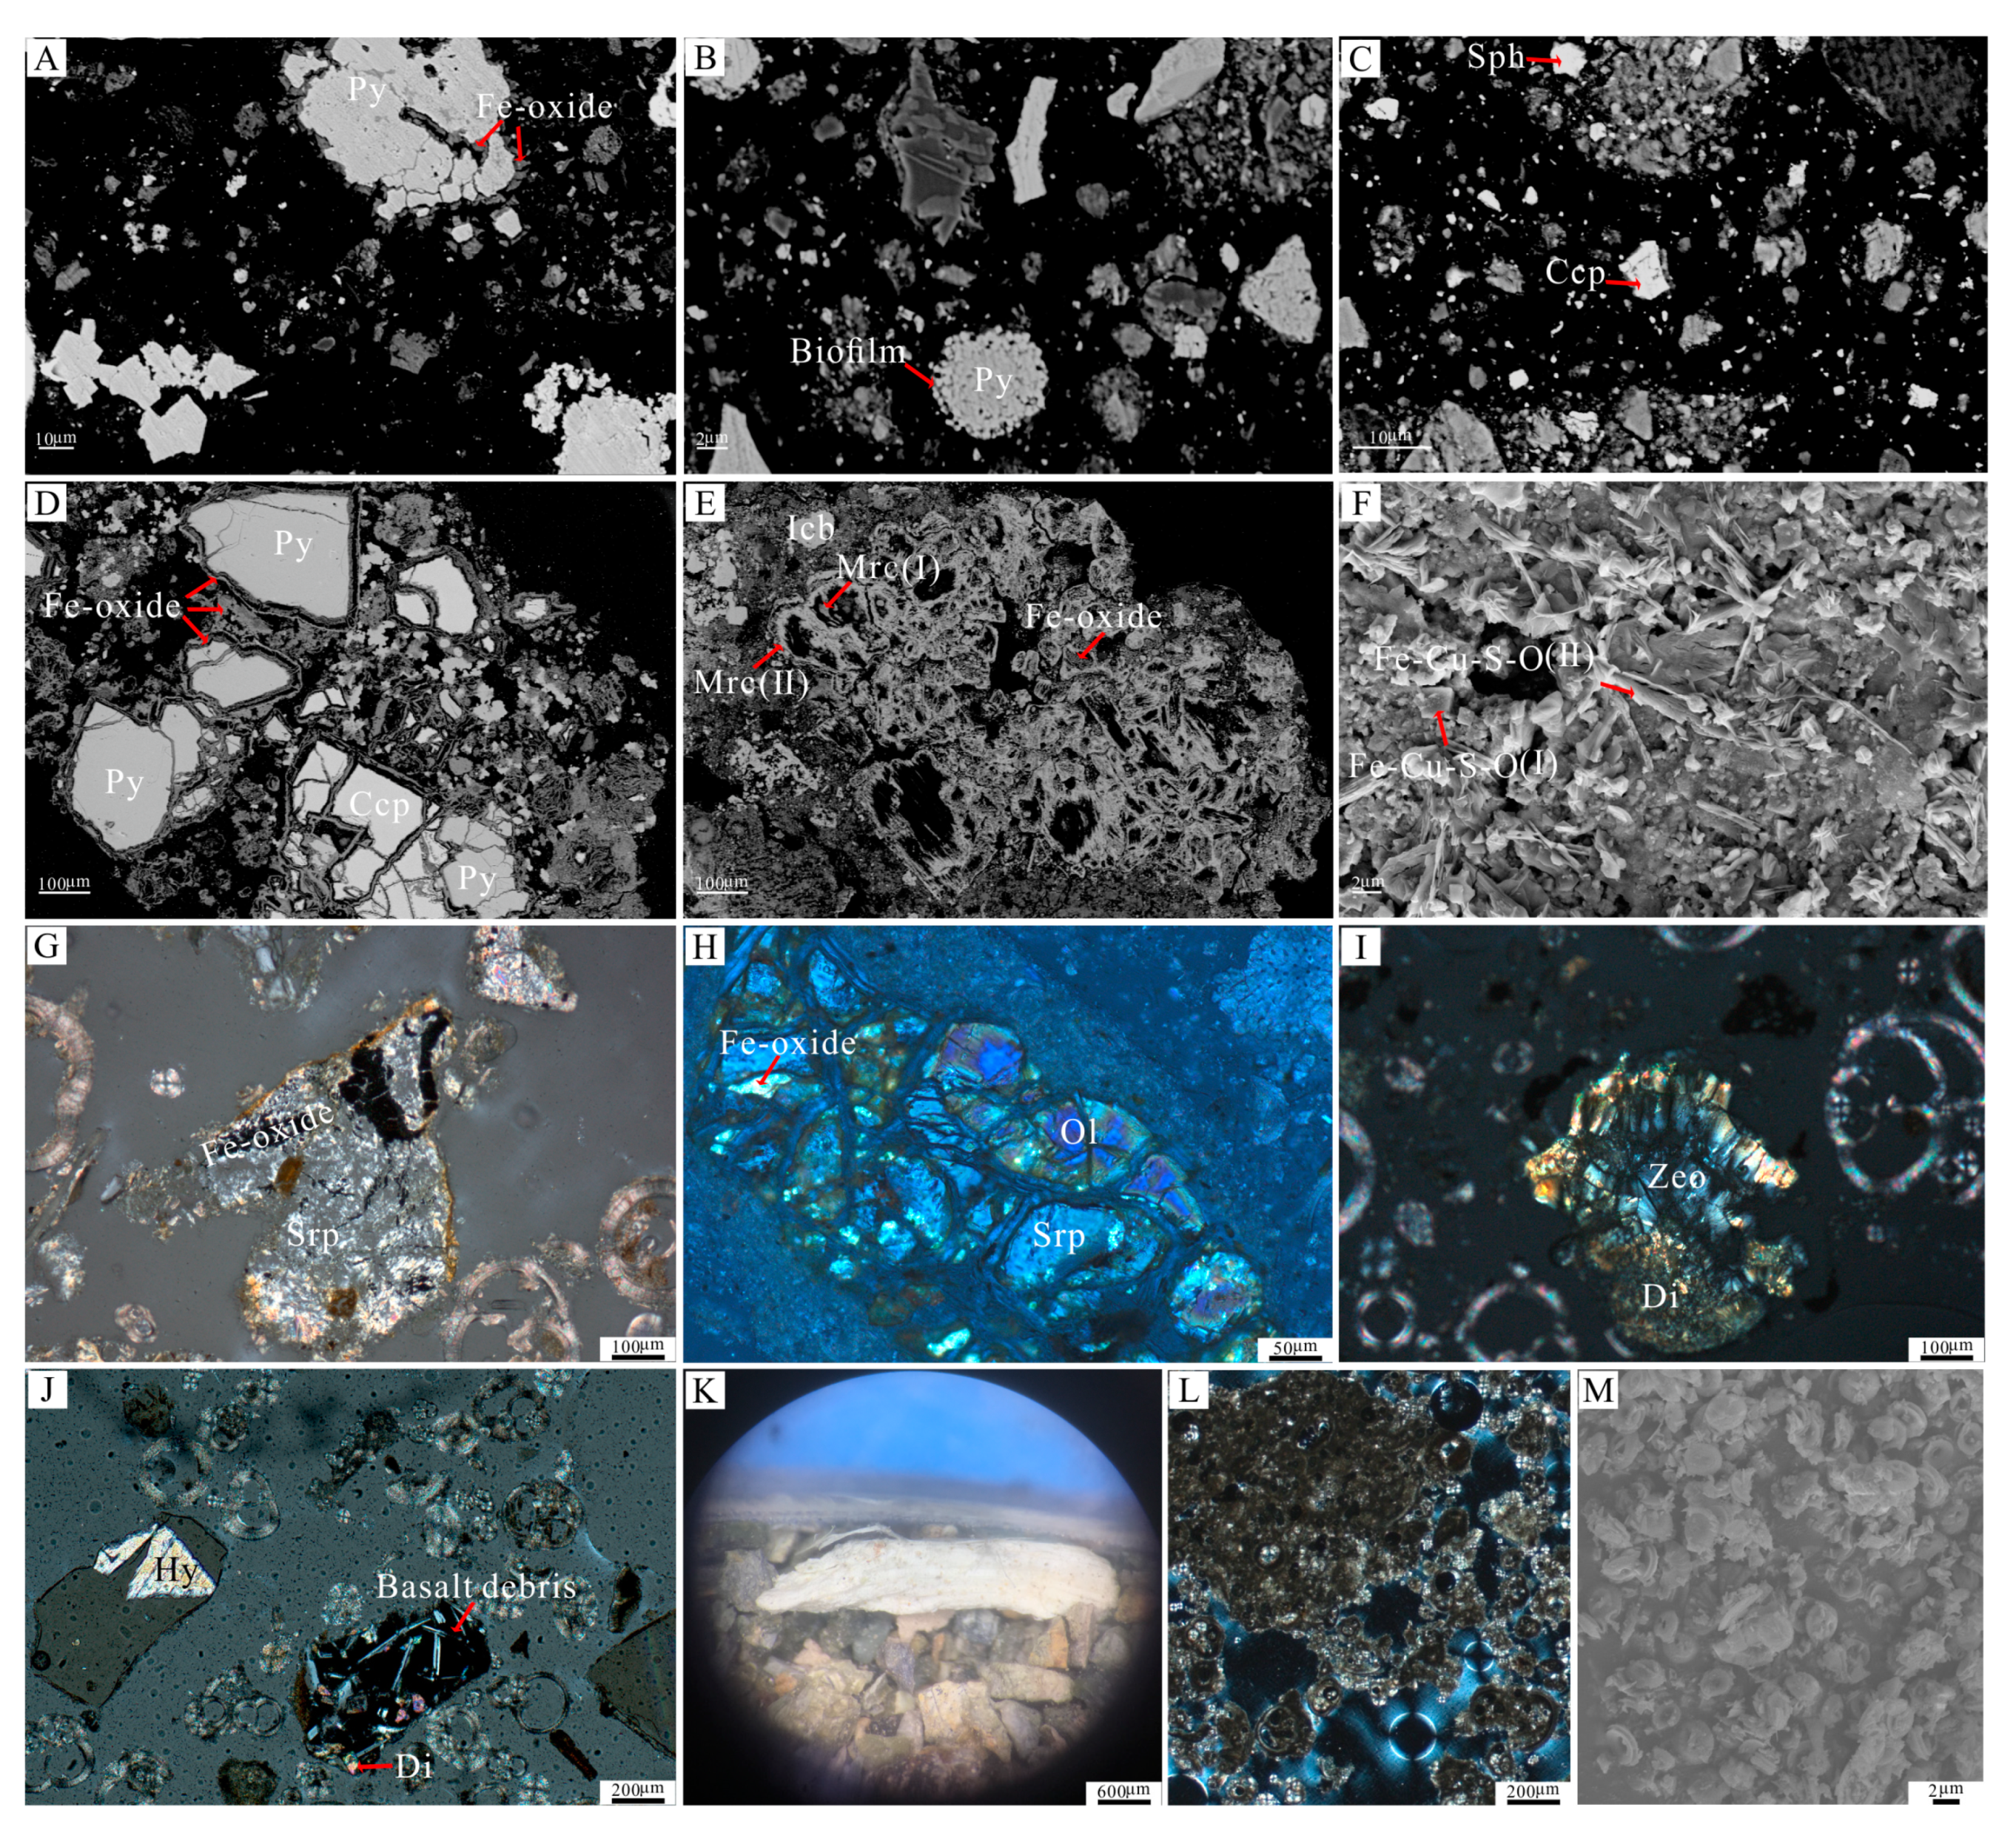
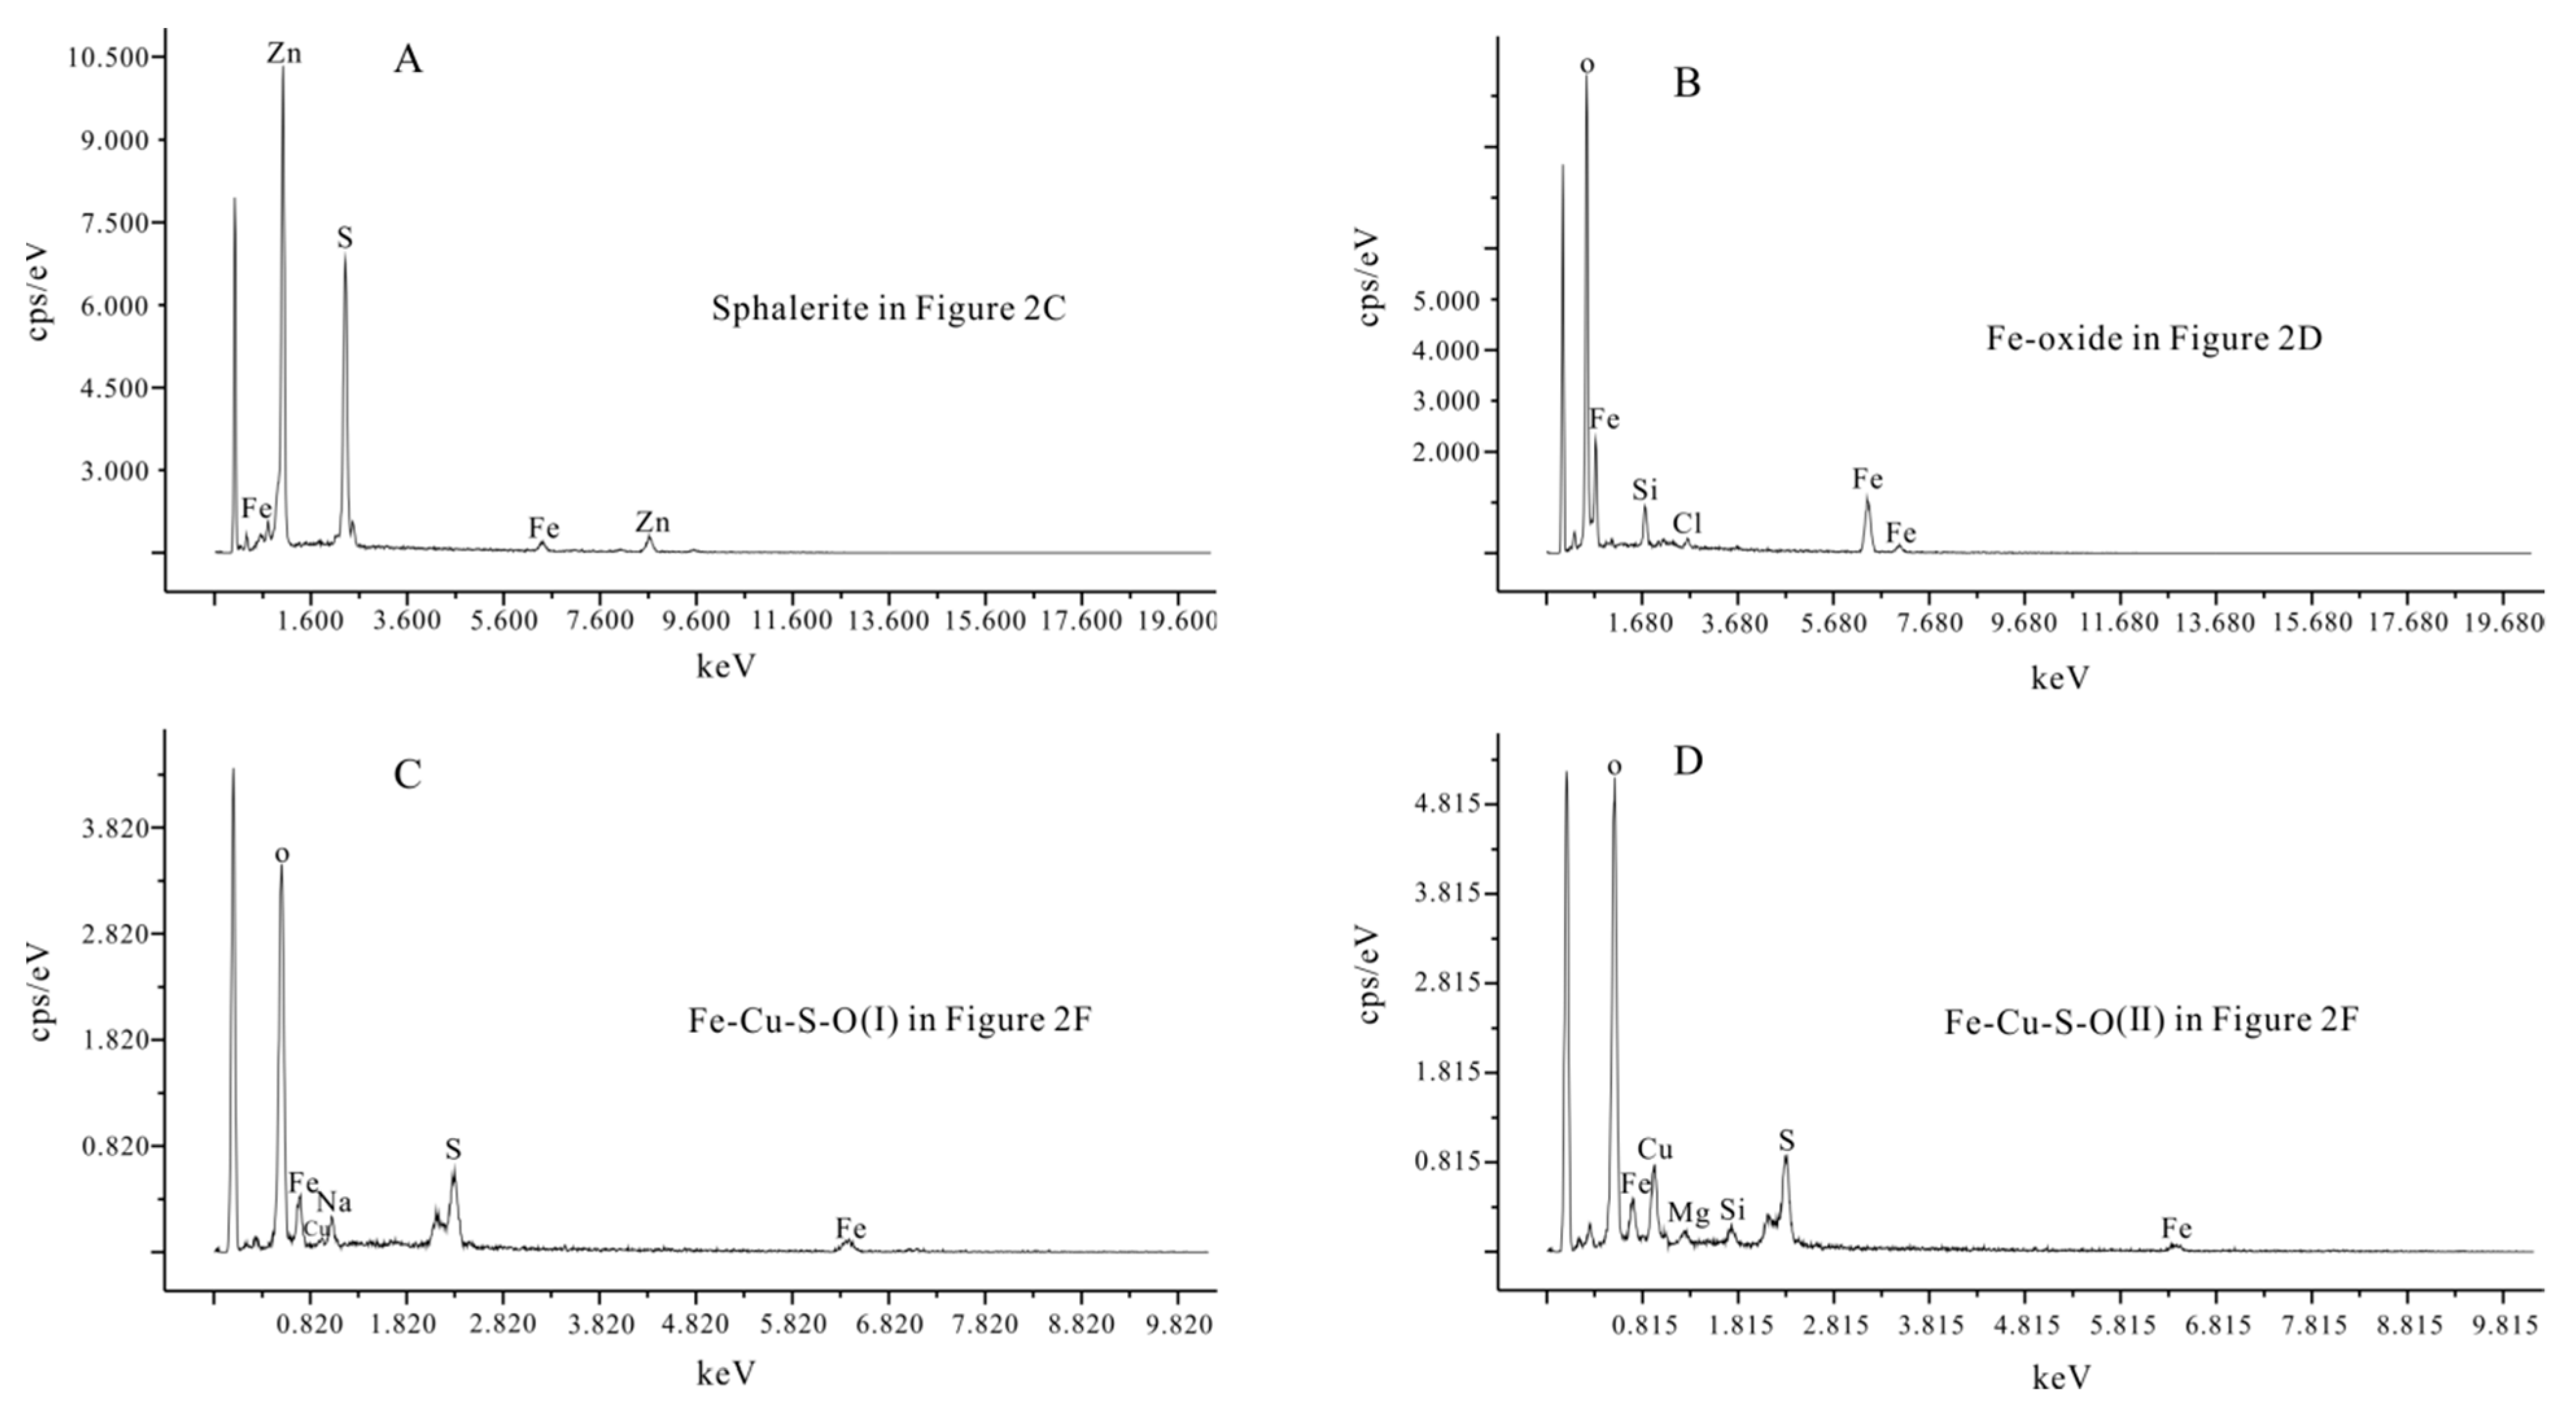
3.2.3. Scanning Electron Microscopy (SEM) and EDS Analysis

A thin layer of epoxy resin was coated on a frosted glass sheet; then, some sediments were sprinkled on it evenly, after slightly compacted, lightly blown with an airbag, and then polished. Before testing, the sediment specimens were coated with gold for 2 min and mounted onto aluminum stubs with double-sided adhesive tapes. After this, they were tested using a Carl Zeiss SIGMA 300 field emission scanning electron microscope (FE-SEM) (Carl Zeiss AG, Oberkochen, Germany) equipped with a Schottky thermal field emitter and an Oxford X-Max EDS (Oxford Instruments, Abingdon, UK) with a focused electron beam produced by a field emission gun (W-crystal) using a 20 kV acceleration voltage under high vacuum conditions (10−9 mbar) at the School of Earth Science and Geological Engineering, SYSU (Guangzhou, China). The FE-SEM had a beam size of approximately 1‒5 μm in diameter, with a maximum magnification of 250,000 times. Microscopic imaging was carried out in back-scattered electron (BSE) mode.

4. Results

4.1. Mineral Composition
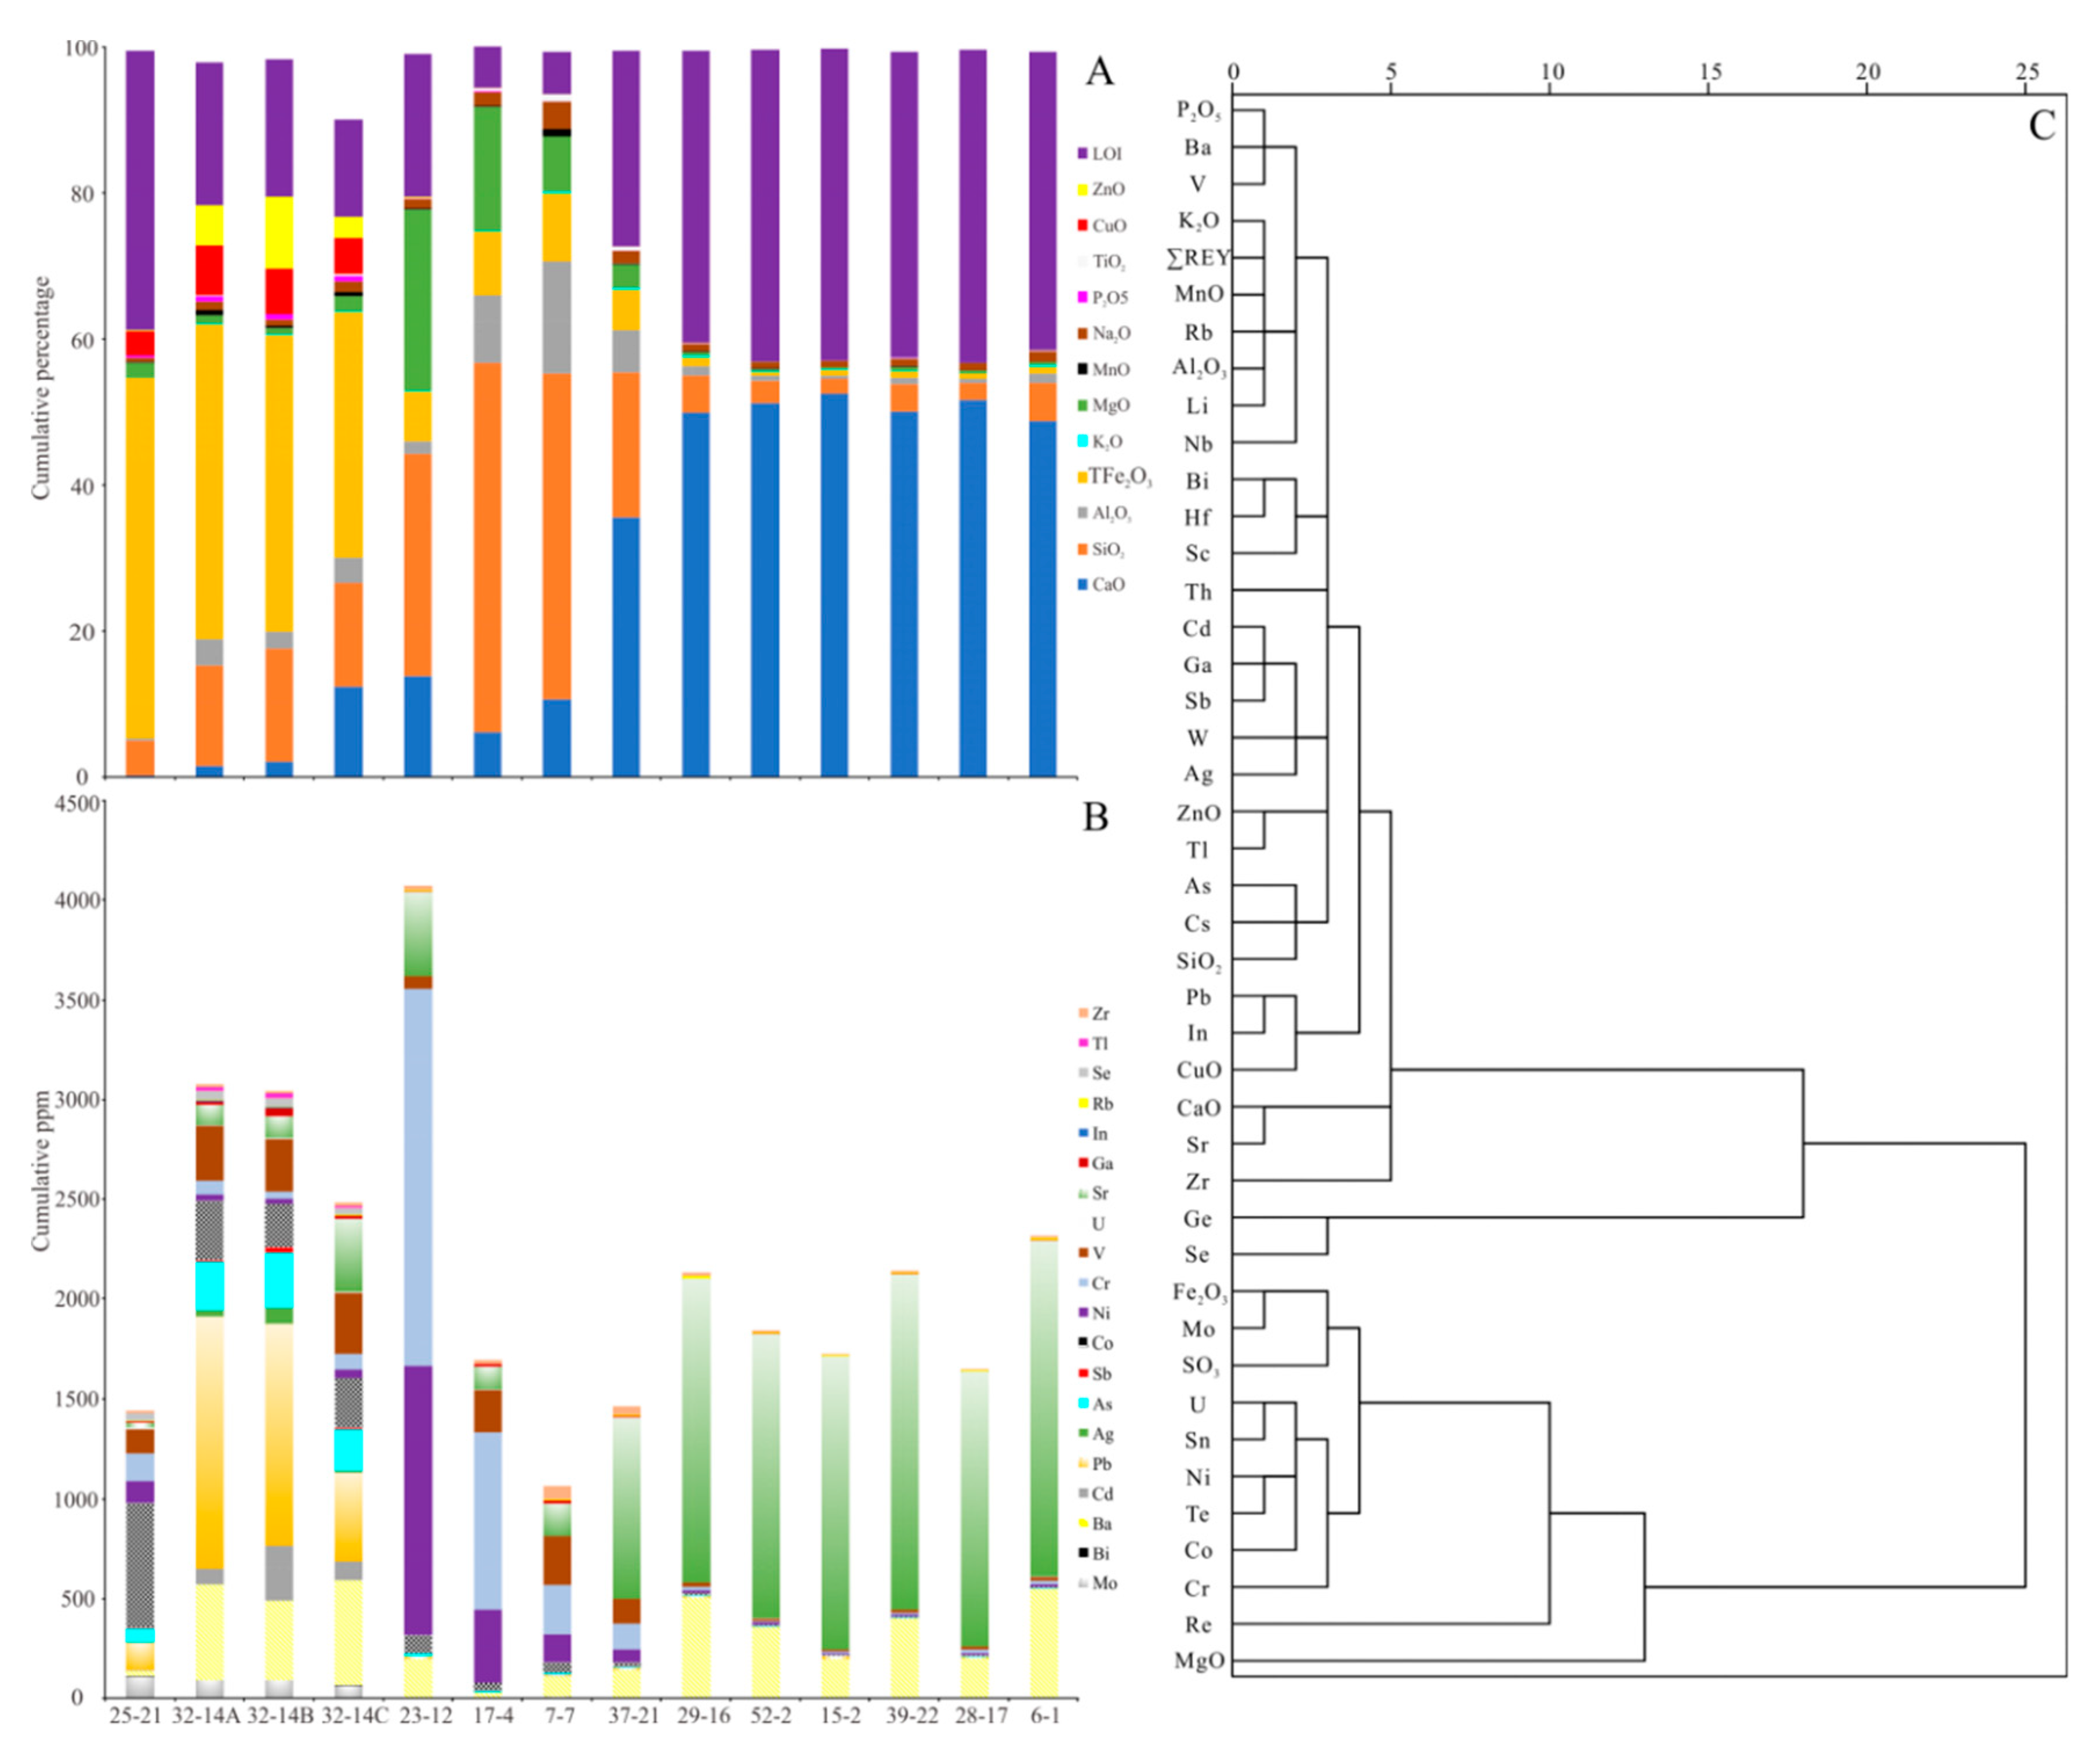
The minerals and their comparative abundances in samples were confirmed, as shown in Table 2. The X-ray powder analysis could only show the peaks of minerals with good crystallinity. The existence and amount of amorphous components could be observed by the bulge emerging under the baseline of sample S32-14C (Figure 3A). According to the statistical results, the main mineral of biogenic sediments was calcite (Figure 2L,M; Figure 3C,D). They also contained a small amount of quartz and other minerals. In addition to calcite, the volcanic sediments contained more iron oxide, clay minerals, products of water–rock interaction, volcanic minerals, and debris (Figure 2G–K). Sample S7-7 contained a considerable amount of montmorillonite and zeolite (Figure 3B), sample S17-4 contained a significant amount of montmorillonite and kaolinite (Figure 3B), and sample S23-12 mainly contained kaolinite (Figure 3B). The main minerals of red-brown hydrothermal-derived deposits were pyrite, chalcopyrite, sulfur, and amorphous silica. They also contained a small amount of calcite, basaltic volcanic glass, and other minerals such as sphalerite (Figure 2A–D; Figure 3A). However, the green hydrothermal-derived deposit predominantly consisted of marcasite and isocubanite as well as sulfur, amorphous silica, and Fe–Cu sulfate. It also contained some products of water–rock interaction (Figure 2E,F; Figure 3A).

4.2. Geochemistry

ZnO, CuO, P2O5, MnO, TFe2O, SO3, Mo, Bi, Ba, Cd, Pb, Ag, As, Sb, Sn, Co, and U, but none of REY (rare earth elements and Yttrium) are enriched in hydrothermal-derived deposits. TiO2, MnO, MgO, Al2O3, SiO2, Sc, Ni, Cr, Nb, Zr, Hf, REY, MREE (middle rare earth elements), and HREE (heavy rare earth elements) are enriched in volcanic sediments. While CaO, Cl, LOI, Ba, Th, Sr, Rb, and LREE are enriched in biogenic sediments (Table 3, Figure 4A,B).

5. Discussion

5.1. Mineral Differences and Implications

5.1.1. Clay Minerals and Ferromanganese Hydroxides

The appearance of clay minerals in samples S23-12, S17-4, S7-7, and S37-21 was the result of rock alteration. The rocks were exposed to low-temperature and weakly alkaline seawater. The types of clay minerals were related to the types of altered minerals and the degree of alteration. Samples S23-12 and S17-4 near the Gallieni (GA) transform fault had the same unique altered minerals (“sepiolite” and “talc”) compared to sample S25-21. Moreover, the host rock in the MEL-RTJ ridge section was largely peridotite. In addition, there was primarily abyssal peridotite besides gabbro and basalt dredged between Gallieni and Gazelle transform faults [6]. Thus, the appearance of “serpentine”, “sepiolite”, and “talc” could be a tracer for peridotite host rock system and so for Lost City Vent Field and Logatchev Vent Field [8,9]. Previous studies also reported the discovery of SWIR 10°–16° E hydrothermal deposits such that the presence of submarine sepiolite could be used as an indicator of deep serpentinization, presumably due to the interaction between seawater and peridotite rocks [51].
Thin Fe–Mn crusts were found in S29-16 and S23-12, but they existed in different forms. Thin Fe–Mn crusts wrapped around the outer surface of foraminifera aggregates in S29-16. They were attached to the surface of rock debris in S23-12. S29-16 was closer to the Longqi Vent Field, and their distance was within the migration range of hydrothermal-derived Mn [5]. The sampling depth of S29-16 was 2367 m, which was close to the evaluation depth range of the Oxygen Minimum Zone (1200–2200 m) in 33° S [52]. Previous studies had reported that the element release, including Fe during rock alteration, could provide parent material for Fe–Mn deposit formation on its surface [53]. Hence, the Fe–Mn deposit in S23-12 was intensely related to the serpentinization of peridotite.

5.1.2. Hematite, Magnetite and Pyrrhotite

Hematite or magnetite in the sample S23-12, S17-4, S7-7, and S37-21 was the result of iron precipitation from mineral alteration during the water–rock interaction. The appearance of magnetite suggests serious serpentinization. And when the alteration degree exceeds 75%, there would be much magnetite appearing. Meanwhile, H2 and energy were released, which was conducive to the survival of marine microorganisms and the potential for inorganic hydrocarbon genesis [54,55,56]. Hematite in sample S32-14ABC was the result of the oxidation of sulfide exposed with seawater, and hematite or magnetite in sample S25-21 seemed to be the result of both. Furthermore, the content of magnetite of S25-21 was much lower than S23-12 and S17-4. It was speculated that this was related to the instability of magnetite in a high SiO2 system. Moreover, it could react easily with SiO2 and transform into serpentine [57]. Previous studies had revealed that peridotite-hosted hydrothermal-sedimentary systems tend to have more reducing conditions and lower sulfur activity than in basalt-hosted hydrothermal-sedimentary systems. This leads to a more common crystallization of pyrrhotite in S25-21 than in S32-14ABC [58,59].

5.2. Geochemistry Differences and Implications

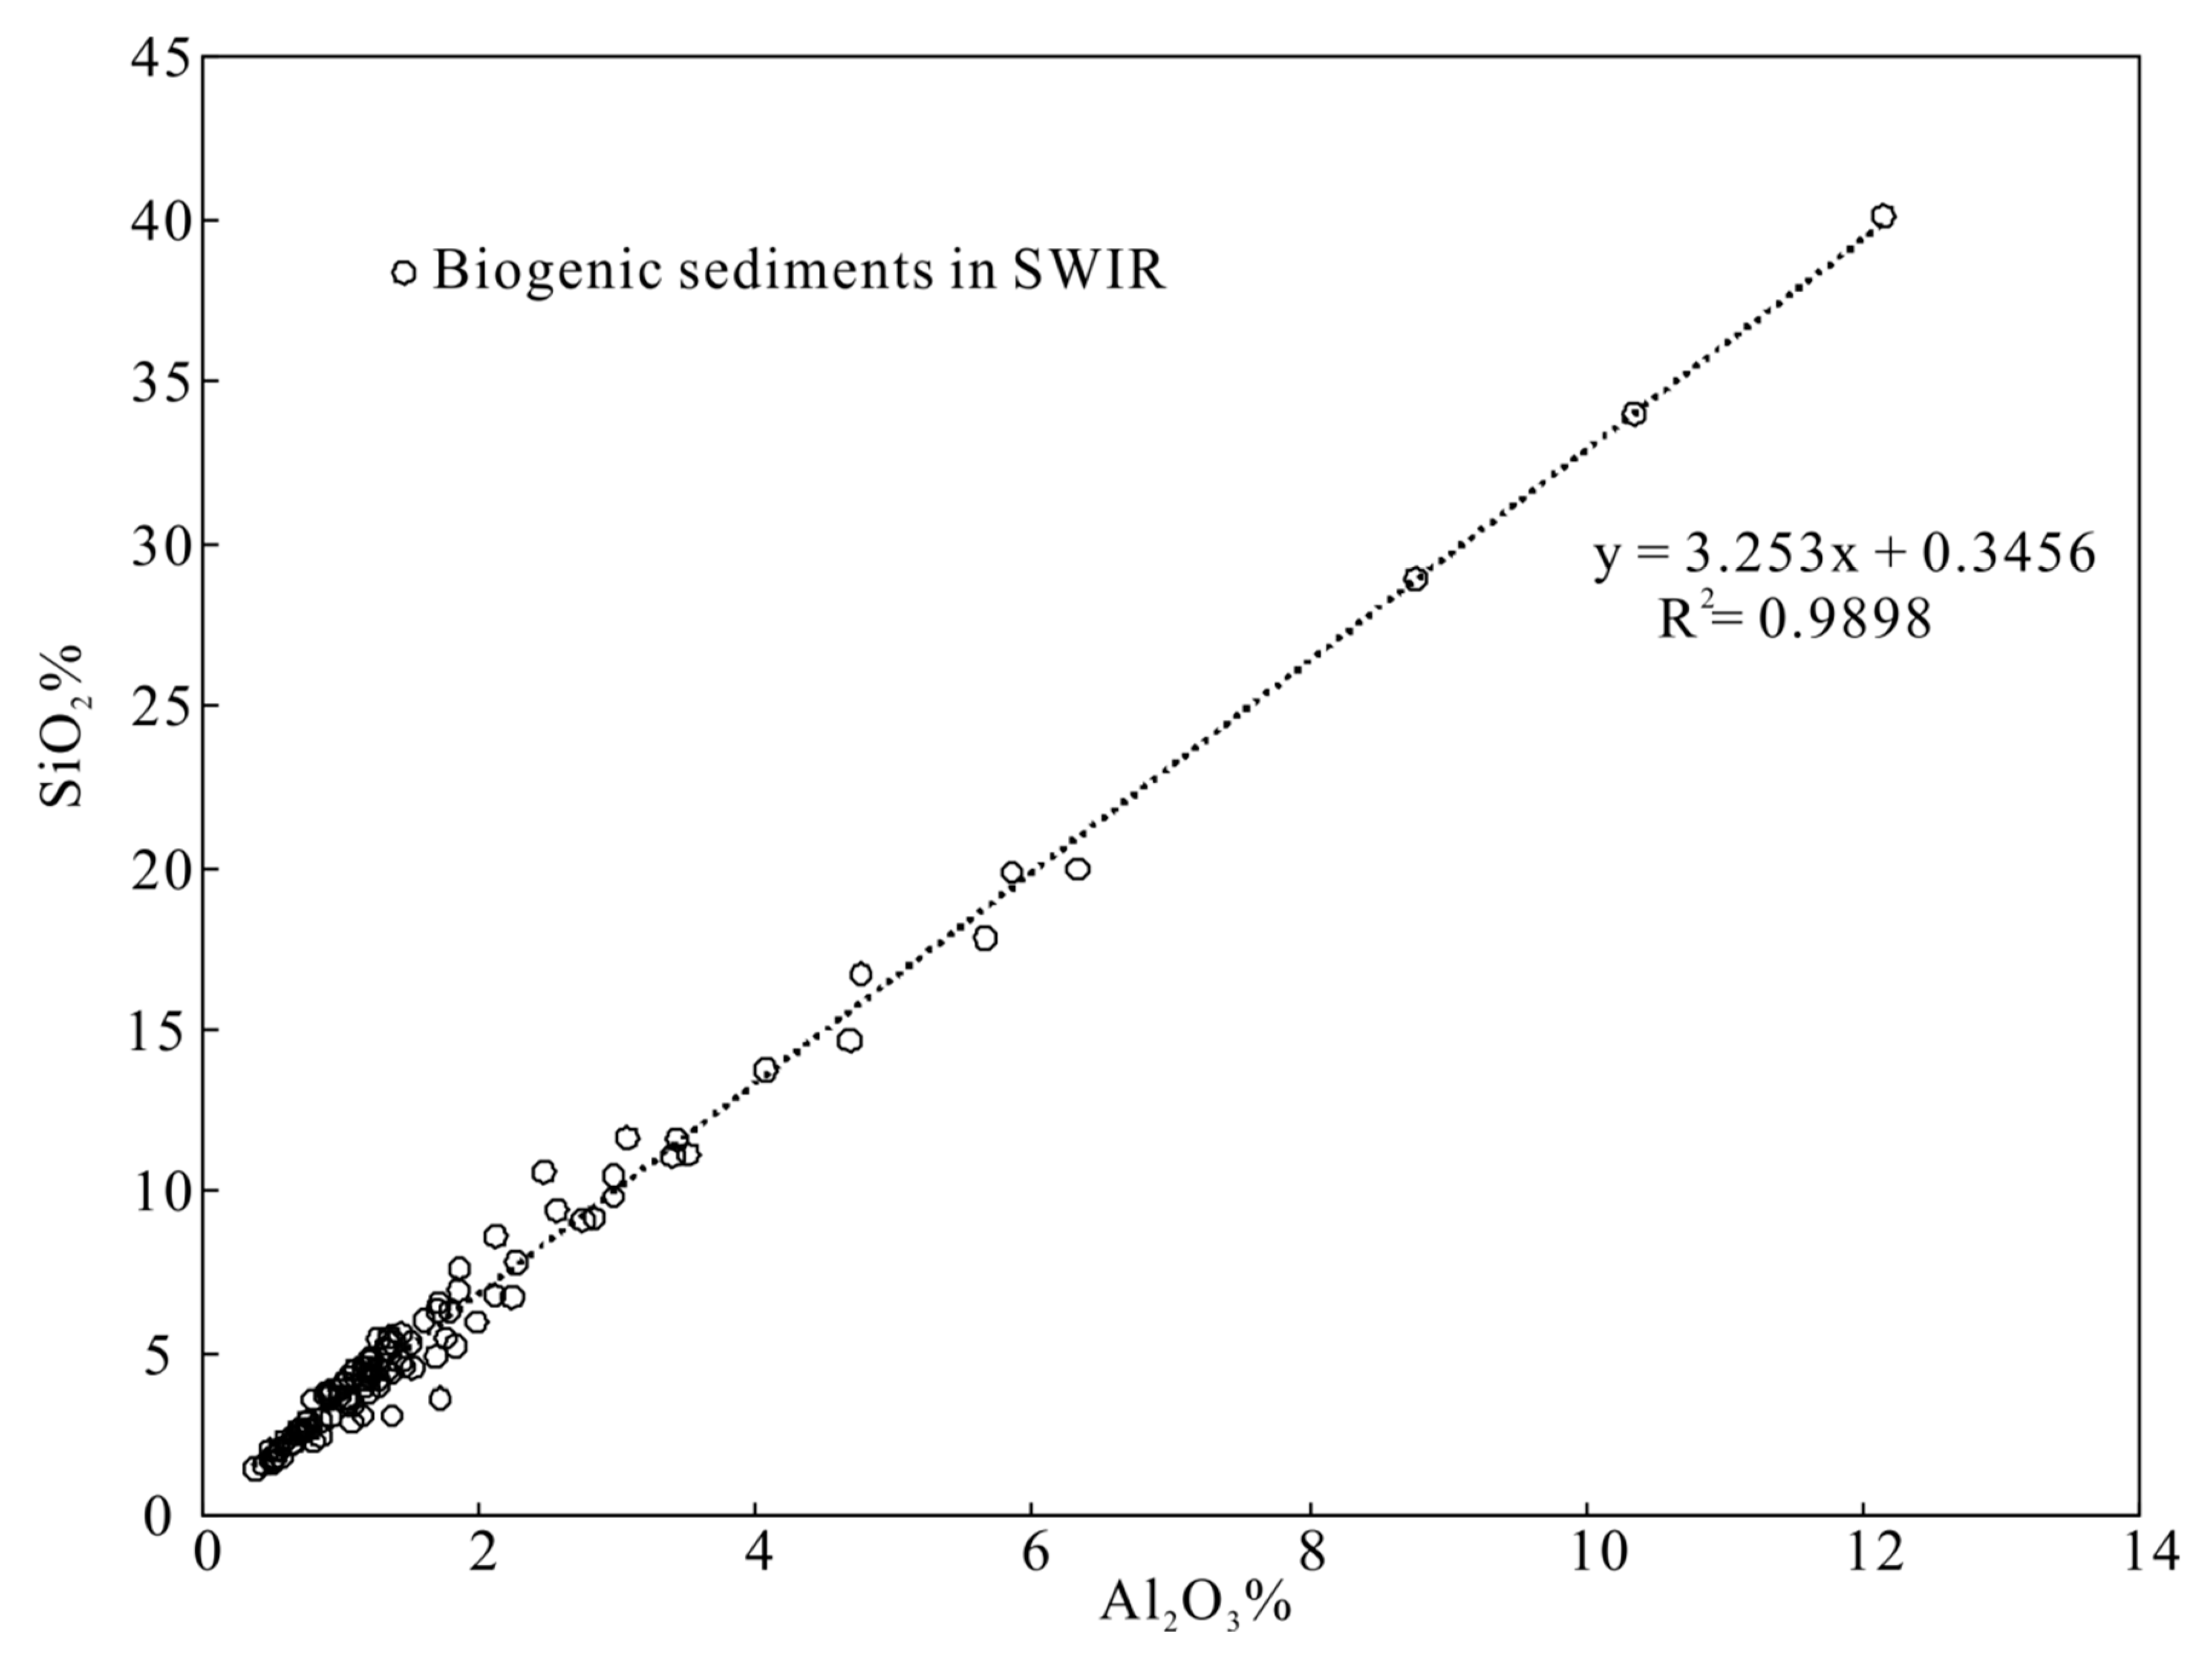
5.2.1. CaOcarbonate, SiO2(bio) Content Evaluation

All samples were dried thoroughly before element analysis. It was assumed that the LOI in biogenic sediments was almost CO2 as well as a little SO3. Based on the chemical formula of CaCO3, m(CaO)/m(CO2)=1.27. The m(CaOtotal)/m(LOI-SO3) value of biogenic sediment was 1.20–1.26, average 1.22, and all values were smaller than 1.27 (Table 4). In other words, m(CaOtotal) was not alone enough for the CaCO3 standard calculation because there were other forms of CaO suppliers in the sediments.
P2O5 content in biogenic sediments was 0.03–0.09%, with an average of 0.05% (Table 3). As a result, based on the calculation formula that molar (CaO)phosphate =10/3 × molar (P2O5) [60], CaO content contributed from phosphate was about 0.04–0.12%, average 0.07% (Table 4). Total Na2O content in biogenic sediments was 0.77–1.37%, an average of 1.02% (Table 3). It was assumed that the Cl content all comes from NaCl in biogenic sediments. The Na2O content contributed from NaCl was 0.41–0.81%, average 0.64%, and the Na2O content contributed from non-NaCl (Na2Ototal-Na2ONaCl) was 0.29–0.56%, average 0.38%. The previous studies had revealed a measure for evaluating the CaO content contributed from silicate [60]. According to the average composition of Na and Ca in silicate minerals in nature, and based on the molar ratio between CaO and Na2O in sediments, if the ratio was greater than 1, then the molar content of Na2O was utilized as the CaO molar content contributed from silicate. If the ratio was smaller than 1, then the molar content of CaO in sediments was directly used as the CaO molar content contributed from silicate. The molar content of CaO in biogenic sediments was certainly bigger than that of Na2O. Therefore, taking the molar content of Na2Onon-NaCl as the CaO molar content contributed from silicate was reasonable. In this way, the CaO content contributed from silicate was 0.26–0.50%, an average of 0.35% (Table 4).
Because CaOcarbonate% = CaOtotal% − CaOphosphate% − CaOsilicate%, the CaOcarbonate content in biogenic sediments was 48.20–52.14%, average 50.30%, the value of m(CaOcarbonate)/m(LOI-SO3) was 1.19–1.25, an average of 1.21. This range was almost unchanged compared to m(CaOtotal)/m(LOI-SO3) values (Table 4), but still smaller than 1.27.
S23-12 was peridotite-hosted sediment, and its serpentinization process could enrich volatile components [6]. S17-4 was a mixture of peridotite-hosted and basalt-hosted sediments. Hence, S7-7 and S37-21 could be calculated except for S23-12 and S17-4. m(CaOcarbonate)/m(LOI-SO3) value of S7-7 was 1.27, and for S37-21 was 1.30. This is to say, the carbonate in S7-7 was all CaCO3, 12.95%, and there should be other CaO suppliers except carbonate, silicate, and phosphate in S37-21. For example, considering calcium sulfate, the true CaCO3 content in S37-21 should be slightly smaller than 61.52%. It was not so successful in evaluating the carbonate content in all volcanic sediments by the aforementioned measure.
According to the formula: m[SiO2(bio)] = m[SiO2(total)] − K × m[Al2O3], K = m[SiO2(total)]/m[Al2O3] [63], and based on geochemical data of 120 biogenic sediments on SWIR, K ≈ 3.25 (Figure 5), the SiO2(bio) content of biogenic sediments plus S37-21 was 0.38–0.87%, average 0.66% (Table 4). Previous research works had indicated that the SiO2(bio) content could reflect the upper primary productivity [64]. S37-21 and S39-22 were closer to the “Yuhuang” Vent Field, and S29-16 was closer to the “Longqi” Vent Field. Their SiO2(bio) contents were all larger than 0.8%, average 0.848%. S28-17 and S52-2 were far away from Vent Fields, and their SiO2(bio) contents were close to 0.4%, an average of 0.425%. That was, the near-vent surface sediments had a higher content of SiO2(bio) than the far away-vent surface sediments. In addition, submarine hydrothermal activity may have influenced organisms in ambient surface seawater and may have enhanced productivity.

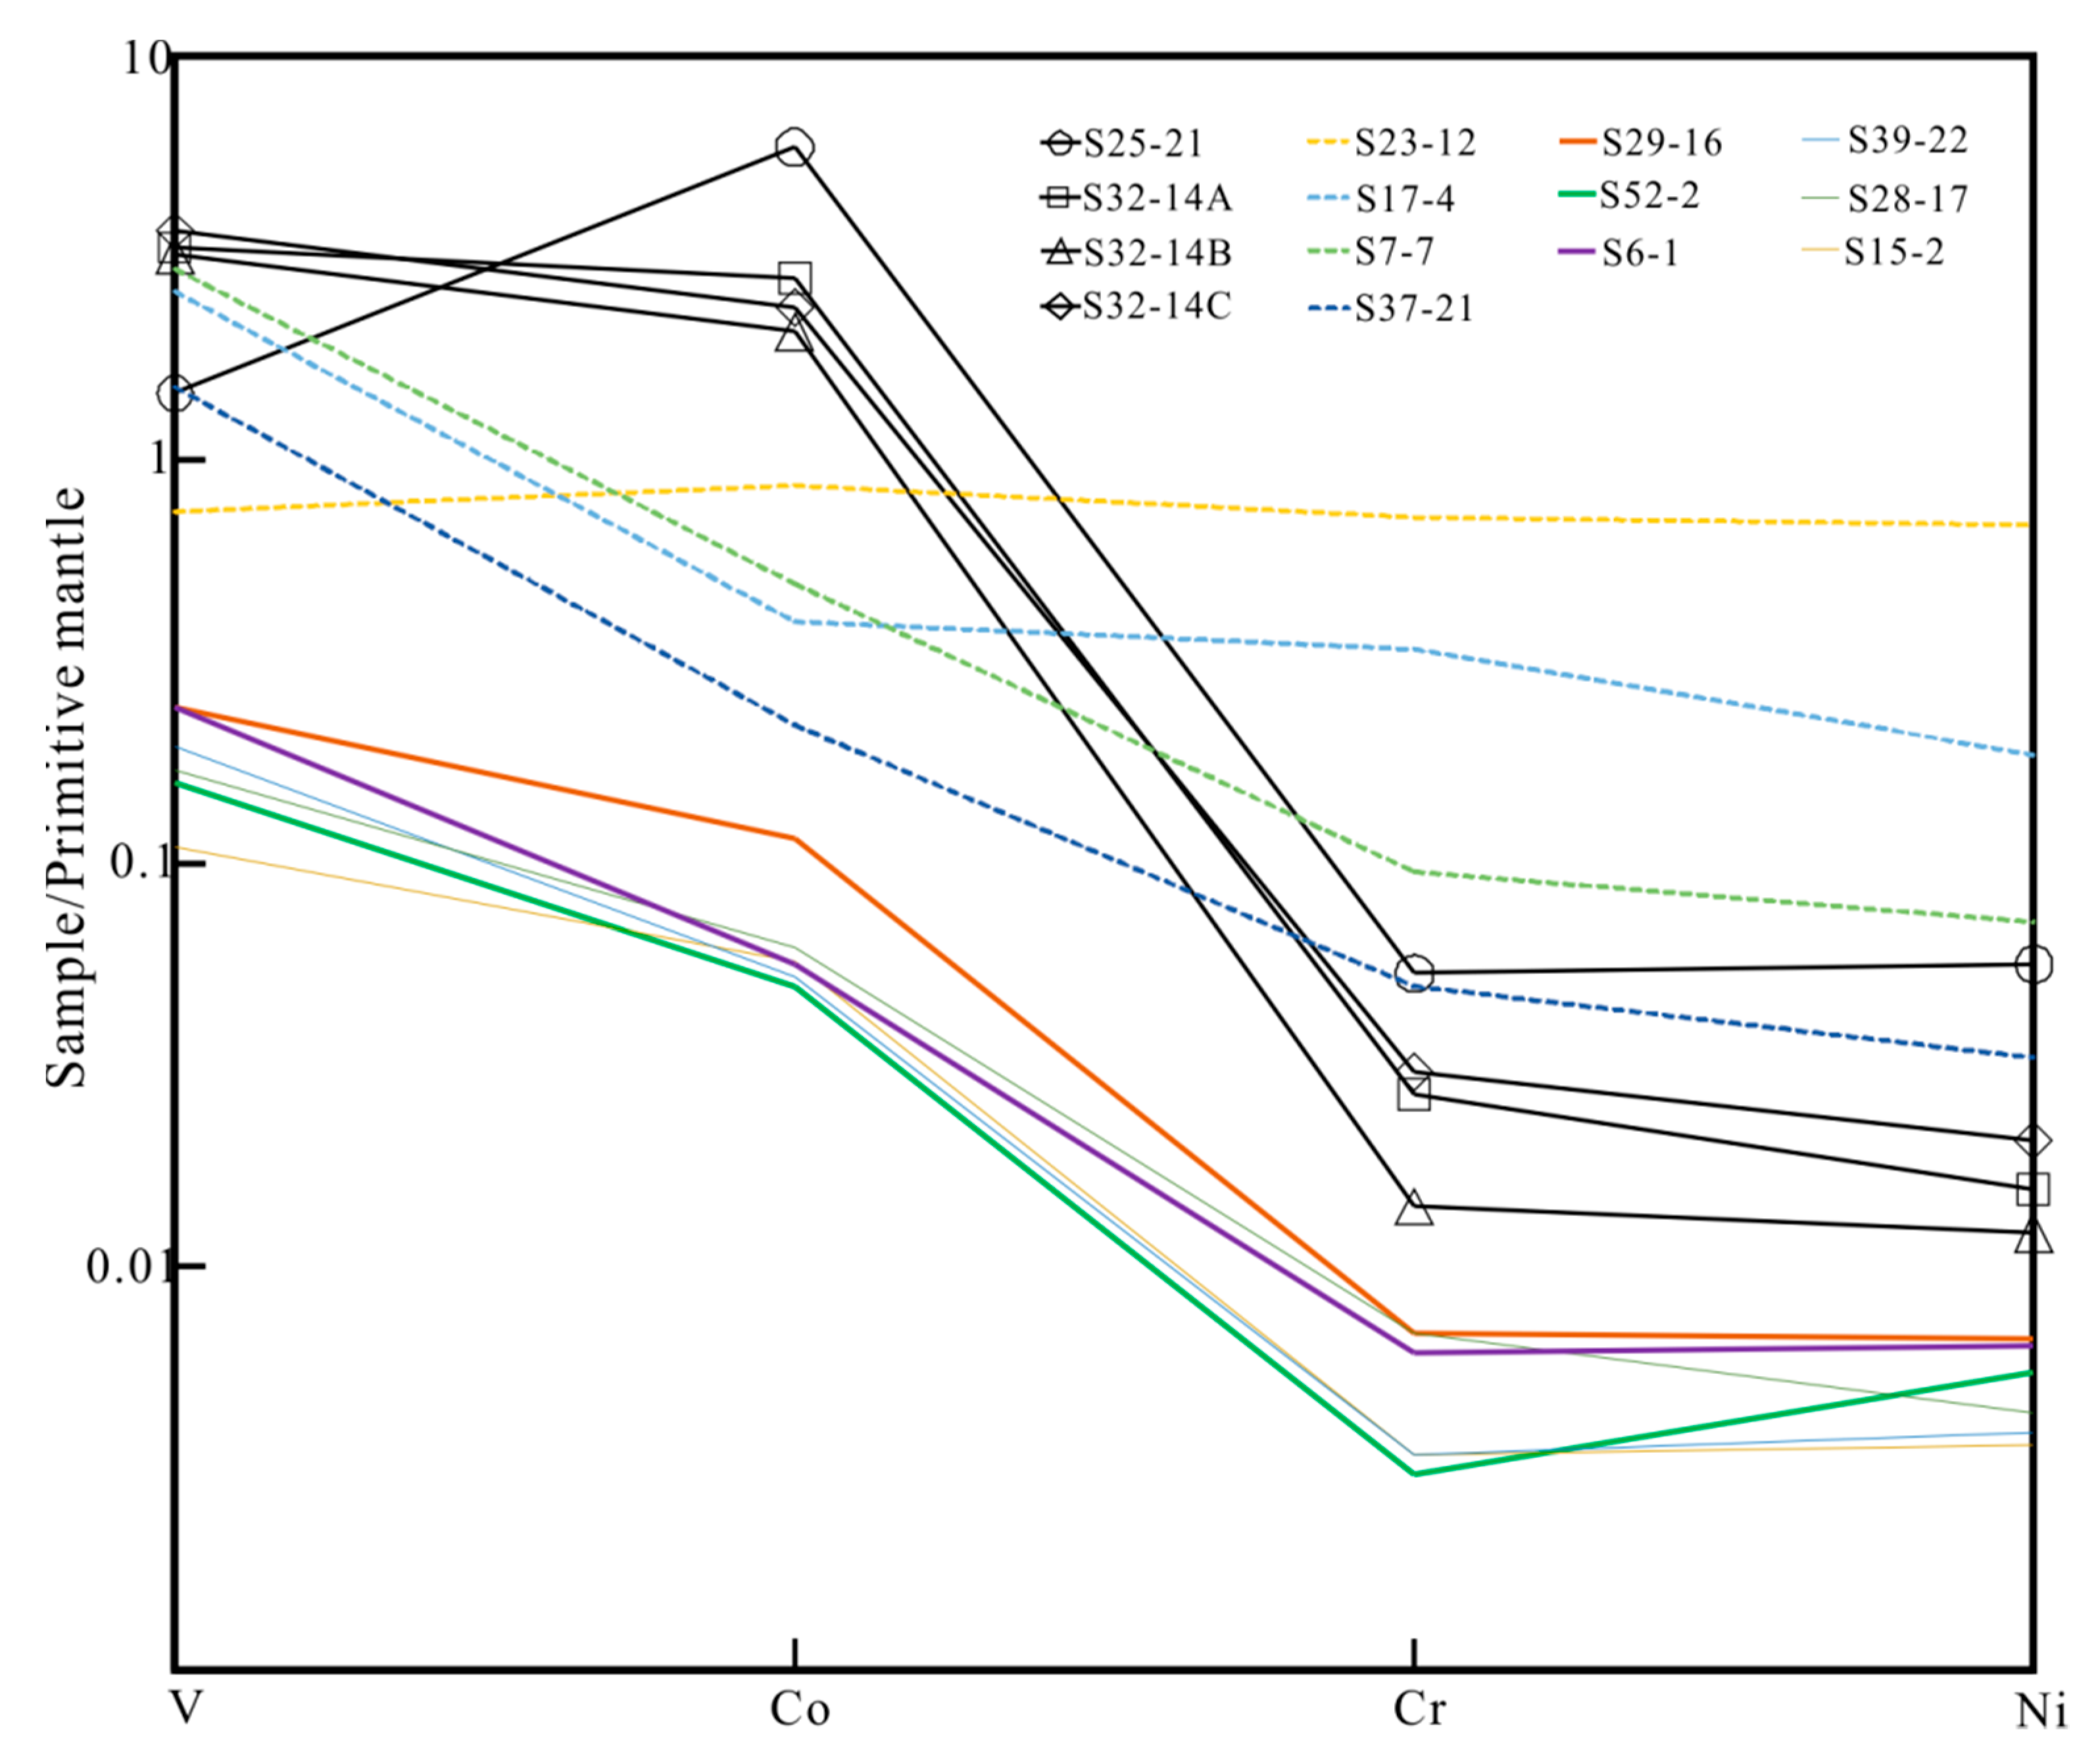
5.2.2. Trace Element Geochemistry and Their Significance

Hydrothermal indicative element (e.g., Mo, Pb, Co) contents varied significantly among three types of sediments. Cluster analysis demonstrated that Mo had an intense and direct correlation with TFe2O3 (Figure 4C), and their correlation coefficient was 0.986. Previous research attempts had manifested that Mo was present as Mo-bearing micro-inclusions in pyrite and marcasite from TAG hydrothermal deposits, and Mo2+ also could directly substitute Fe2+ in pyrite as lattice substitution [67]. The distribution of Pb content seemed to be very related to hydrothermal activities. However, it was not much related to rock debris or biological shells. Previous studies have revealed that Pb in massive sulfides from the Duanqiao Hydrothermal Field was chiefly leached from host rock (basalt), and the Pb contribution of seawater was negligible [19]. Through correlation analysis between Pb and HFSE and LILE (large ion lithophile element), in S25-21 plus S32-14ABC, r(Pb/Nb) = 0.427, r(Pb/Zr) = 0.012, r(Pb/Hf) = 0.056, r(Pb/Cs) = 0.872, r(Pb/Rb) = 0.616, and in S23-12, S17-4, S7-7 plus S37-21, r(Pb/Nb) = 0.880, r(Pb/Zr) = 0.008, r(Pb/Hf) = –0.019, r(Pb/Cs) = 0.259, r(Pb/Rb) = 0.437. This indicated that Pb enrichment in hydrothermal-derived deposits was principally caused by fluid alteration, and Pb enrichment in volcanic sediments was caused by both magmatism and fluid alteration (Figure 6B,D, Appendix A Figure A2B). The Pb content in sample S23-12 was much larger than the average content among volcanic sediments, and so was sample S15-2 among biogenic sediments (Figure 6D,F). This may provide further evidence that they were affected by hydrothermal activities, as mentioned earlier. Moreover, previous research works also had suggested that peridotite could enrich Pb in the process of water-rock interaction [68], which may also be one of the reasons for the larger Pb content in sample S23-12 among volcanic sediments (Figure 6D, Appendix A Figure A2C). However, basalt alteration into smectite will reduce its Pb content (Appendix A Figure A2C). It also had been discovered that the Pb content in hydrothermal fluids from peridotite-hosted hydrothermal systems like Logatchev and Rainbow was larger than that from basalt-hosted hydrothermal systems like TAG and Snake Pit [69]. Cluster analysis showed that Pb correlated with CuO and had an intense and direct correlation with In (Figure 4C), and their correlation coefficients were 0.958 and 0.994 in hydrothermal-derived deposits plus S32-14C, respectively. This indicated that Pb had a close relationship with the formation of copper deposits and may have a similar emplacement behavior as In. Previous studies have revealed that In was mainly present as a mineral lattice substitution for Cu in chalcopyrite [67]. Supporting evidence for this viewpoint was that none of the galena had been reported in both Duanqiao Hydrothermal Field and Tianzuo Hydrothermal Field [19,70]. The Co content in sample S25-21 was the largest among hydrothermal-derived deposits. Also, the Co content in sample S23-12 was the largest among volcanic sediments. Both samples were taken from peridotite-hosted deposits. This indicated that Co was more concentrated in peridotite-hosted hydrothermal fluids and peridotite rocks, as it had been demonstrated that peridotite was richer in Co than basalt [6]. Cluster analysis showed that Co correlated with Ni and U (Figure 4C). This may indicate that they co-enrich in Fe-bearing minerals, as previous studies had manifested that Co2+ and Ni2+ could directly substitute for Fe2+ in pyrite and marcasite [67]. This also supports the presumption that the enrichment of U was more related to Fe-bearing minerals. Finally, compared to peridotite, the serpentinization process seemed to change a little in terms of the Co and Ni contents, but the Co and Ni contents in talc change largely (Appendix A Figure A2C). The process during which basalt was weathered into smectite also changes a little with respect to its Co and Ni contents (Appendix A Figure A2C). Hydrothermal-derived deposits all had a positive Co anomaly and a negative Cr anomaly, just as all biogenic sediments (Figure 7). S29-16 had the largest V, Co, Cr, and Ni contents among biogenic sediments. This may be related to the existence of hydrogenetic Fe–Mn deposits and Fe–Si hydroxide flocs (Appendix A Figure A2D). And S52-2, the background sediment, had the largest MSI value and the purest mineral composition. It also had the smallest Co and Cr contents, which may indicate its lack of rock debris and hydrothermal input. However, volcanic sediments were different. S7-7 and S37-21 inherited the Co-flat and Cr-depleted features of basalt (Appendix A Figure A2C), and S17-4 inherited the Co-depleted and Cr-enriched features of peridotite (Appendix A Figure A2C). In other words, when peridotite debris, basalt debris, and biocomponent existed together, the mixture sample inherited the Co-depleted and Cr-enriched features of peridotite debris, for which peridotite had the largest Co and Cr contents. S23-12 was more different from the others because its V, Co, Cr, and Ni contents were close to primitive mantle values (Figure 7). This may be the result of the counteraction between peridotite debris, biocomponent, and hydrogenetic Fe–Mn deposit (Appendix A Figure A2B,D).
Volcanic indicative element (e.g., Sc, Ni, Cr) contents also varied substantially among three types of sediments. It could be observed that Sc predominantly exists in rock debris, and it had a larger content in basalt-hosted samples than peridotite-hosted samples. There were not many differences within hydrothermal-derived or biogenic sediments. In contrast, from the distribution of Ni and Cr contents, sample S23-12 had the largest Ni and Cr contents among volcanic sediments. Moreover, S25-21 had the largest Ni and Cr contents among hydrothermal-derived deposits (Figure 7). All of these indicate that Ni and Cr were first, more concentrated in peridotite rocks (minerals) and peridotite-hosted hydrothermal fluids, and second, in basaltic rock debris and basalt-hosted hydrothermal fluids. It had been revealed that serpentine formed by olivine alteration contains 0.28% NiO, and serpentine formed by pyroxene alteration contains 0.05% NiO [72]. Ni largely originated from olivine in peridotite. It could be enriched in serpentine and magnetite during serpentinization [6]. As previous research attempts had indicated that Te2- could substitute for sulfur [67], the cluster analysis also has demonstrated that Ni had an intense correlation with Te (Figure 4C). This may indicate that they co-exist in Fe-bearing sulfides. Moreover, previous research works had shown that Cr was more enriched in pyroxene than olivine, and serpentine formed by olivine alteration was poor in Al and Cr but rich in Ni. However, serpentine formed by pyroxene alteration was rich in Al and Cr [73]. Considering their Al contents together, it was speculated that the bigger Cr content in S25-21 and S23-12 should be related to the existence of chromite. Sample S23-12 and S25-21 were both poor in Al and Ti but rich in Mg, Cr, and Fe. According to previous studies, the activity of Cr could reflect the alteration of chromite or spinel in the serpentinization process [6]. In fact, chromite was detected in volcanic sediments, but no spinel was found. Thus, chromite produced during the serpentinization process may be the main existing form for Cr in sediments. Cluster analysis reveals that Cr correlated with Sn (Figure 4C). Finally, compared to peridotite, the serpentinization process appears to change considerably in terms of the Cr content. The Cr content in talc changes even more seriously (Appendix A Figure A2C), but the process during which basalt was weathered into smectite changed a little in terms of its Cr content (Appendix A Figure A2C). The primitive mantle-normalized trace element patterns of 65° E serpentinized peridotite were more similar to those of serpentine than talc (Appendix A Figure A2C). That is, we could use this feature to identify the main minerals formed in the serpentinization process of peridotite and to evaluate its serpentinization degree.
Biogenic indicative element (e.g., Sr) content varies greatly among three types of sediments. Based on the distribution of Sr content, it appears that Sr was more related to biogenic sediments. The cluster analysis also indicated that Sr correlated closely with CaO (Figure 4C). It also demonstrated that CaO primarily existed in the form of CaCO3 in biogenic sediments, and CaCO3 chiefly existed in foraminifera shells and coccolith shells in biogenic sediments. Hence, Sr predominantly existed in calcium biological shells. This relationship could also be found from the addition of biological shells in sample S32-14C, Sr content was increased. Moreover, as the rock debris was added into S37-21, Sr content was decreased. On one hand, these different changes were related to the small Sr content in basalt debris; on the other hand, it was also related to the leaching loss of Sr in basalt debris during the seafloor weathering process (Appendix A Figure A2C). There were no calcium biological shells in S25-21, and it had the smallest Sr content. Moreover, the dilution caused by the addition of rock debris seemed to be even more severe, as the Sr contents in both S17-4 and S7-7 were small compared to that of S32-14AB. Although S17-4 and S7-7 had much more biological shells than S32-14AB, hydrothermal sulfide could enrich Sr during the seafloor weathering process (Appendix A Figure A2D). Previous studies manifest that Sr enrichment ranged from 0.13 ppm to 23 ppm in serpentine during the serpentinization process of olivine [74]. This also could be one of the reasons apart from biological shells that why sample S23-12 had the biggest Sr content among volcanic sediments. However, obviously, it did not have a profound influence compared to biological shells. The previous studies had uncovered that Sr in massive sulfided from the Duanqiao Hydrothermal Field was largely derived from seawater and the contribution of hydrothermal input was negligible [19]. Normalized to the primitive mantle, the trace element patterns of S23-12, S7-7, and S17-4 were Sr-depleted (Figure 6D). This means that the existence of biocomponent still could not change the Sr-depleted characteristics of peridotite and basalt. However, the Sr content had clearly increased compared to pure peridotite and basalt on SWIR [75,76]. In addition, the Sr-depleted character was not very strong in S23-12 compared to S17-4 and S7-7 since there were more biocomponents in S23-12.

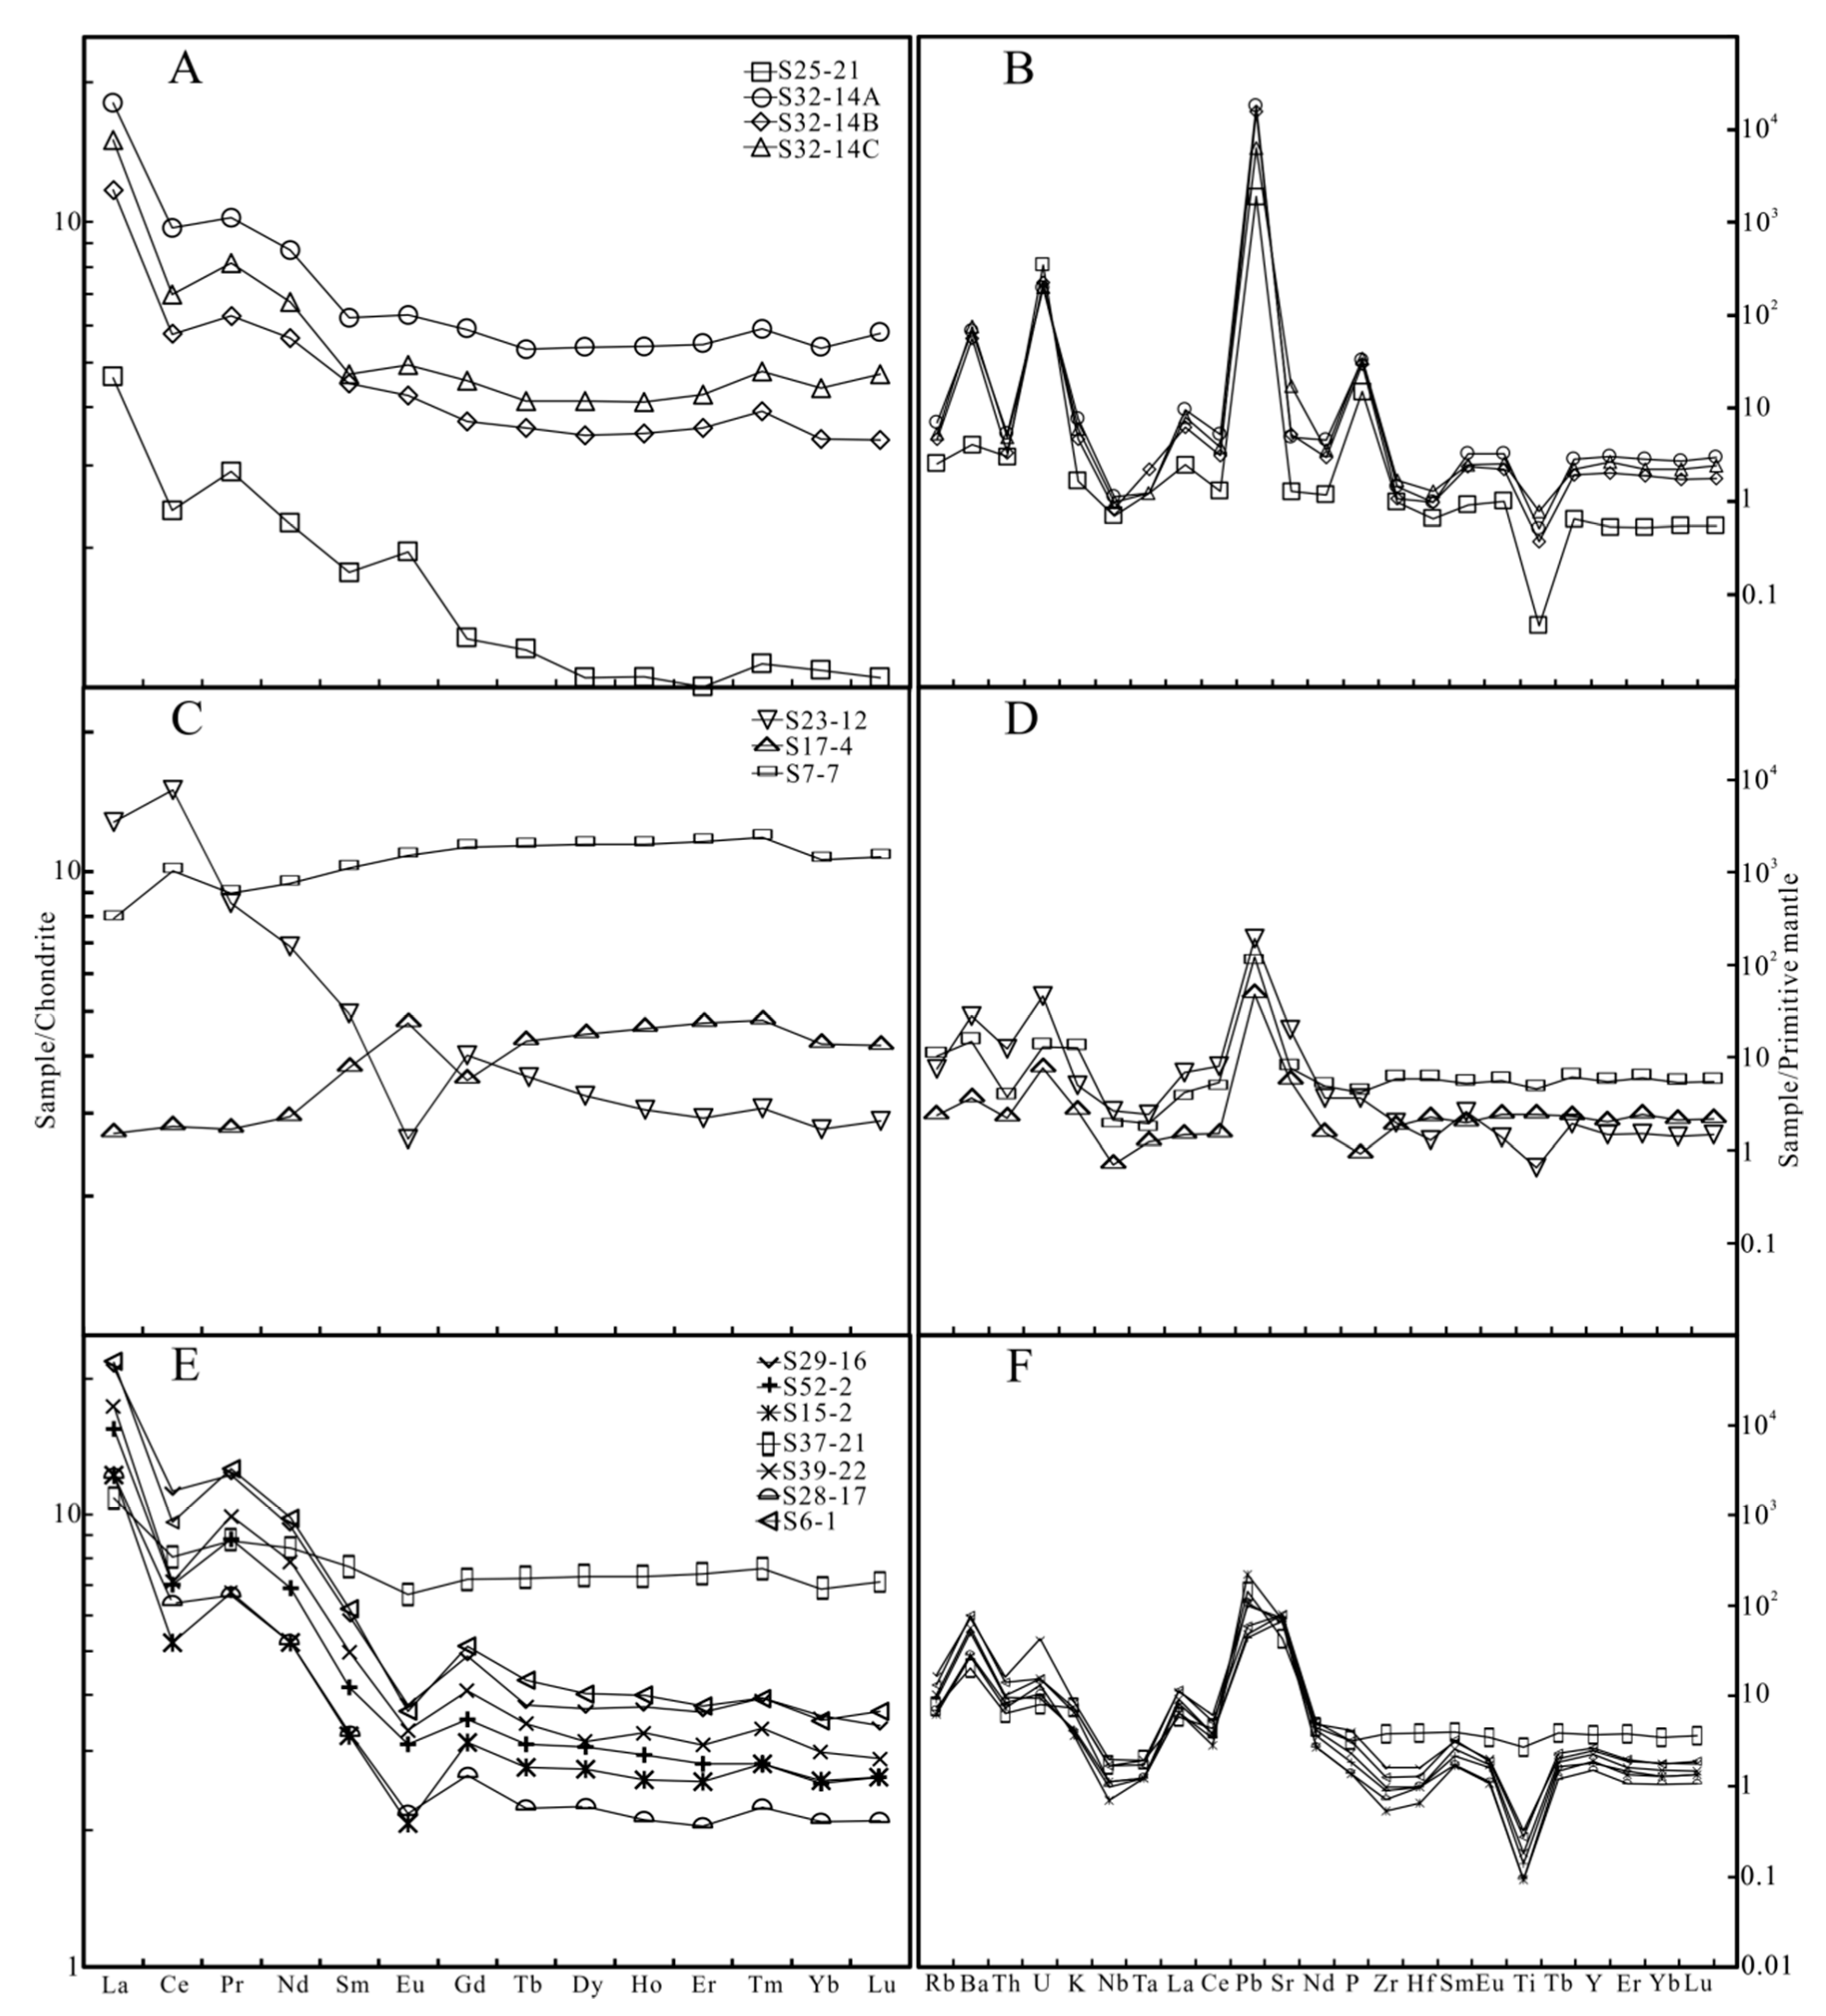
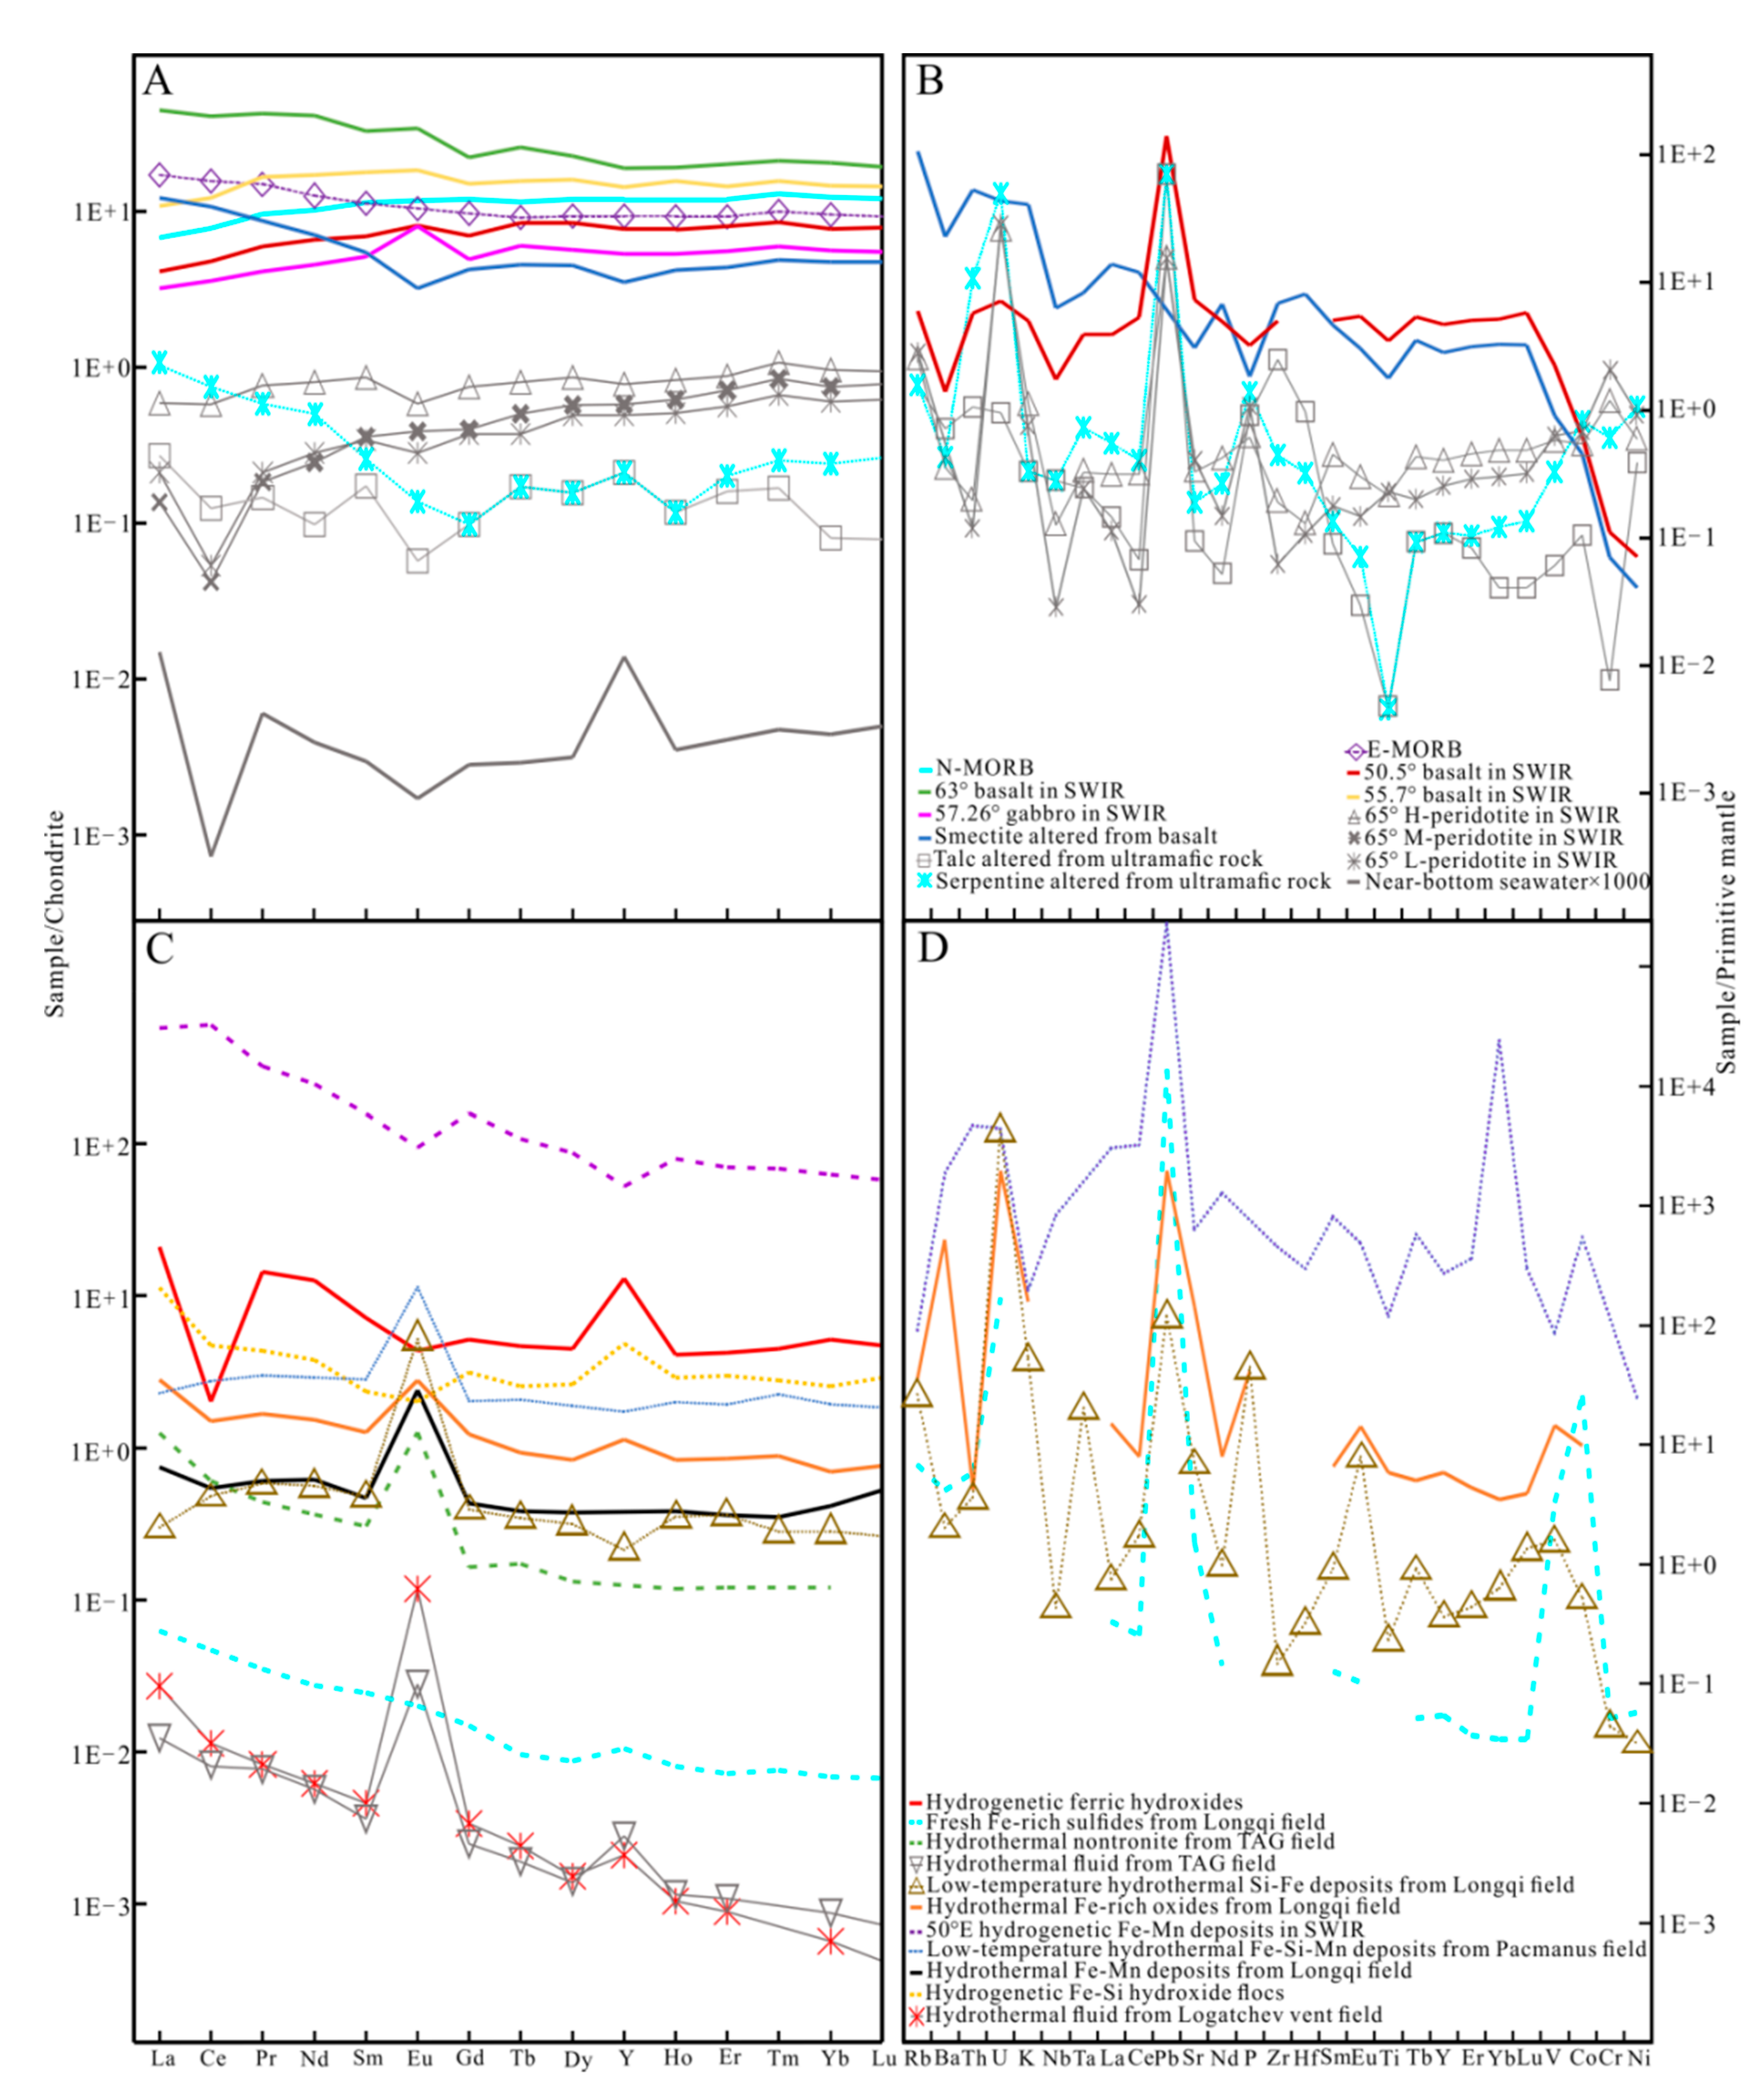
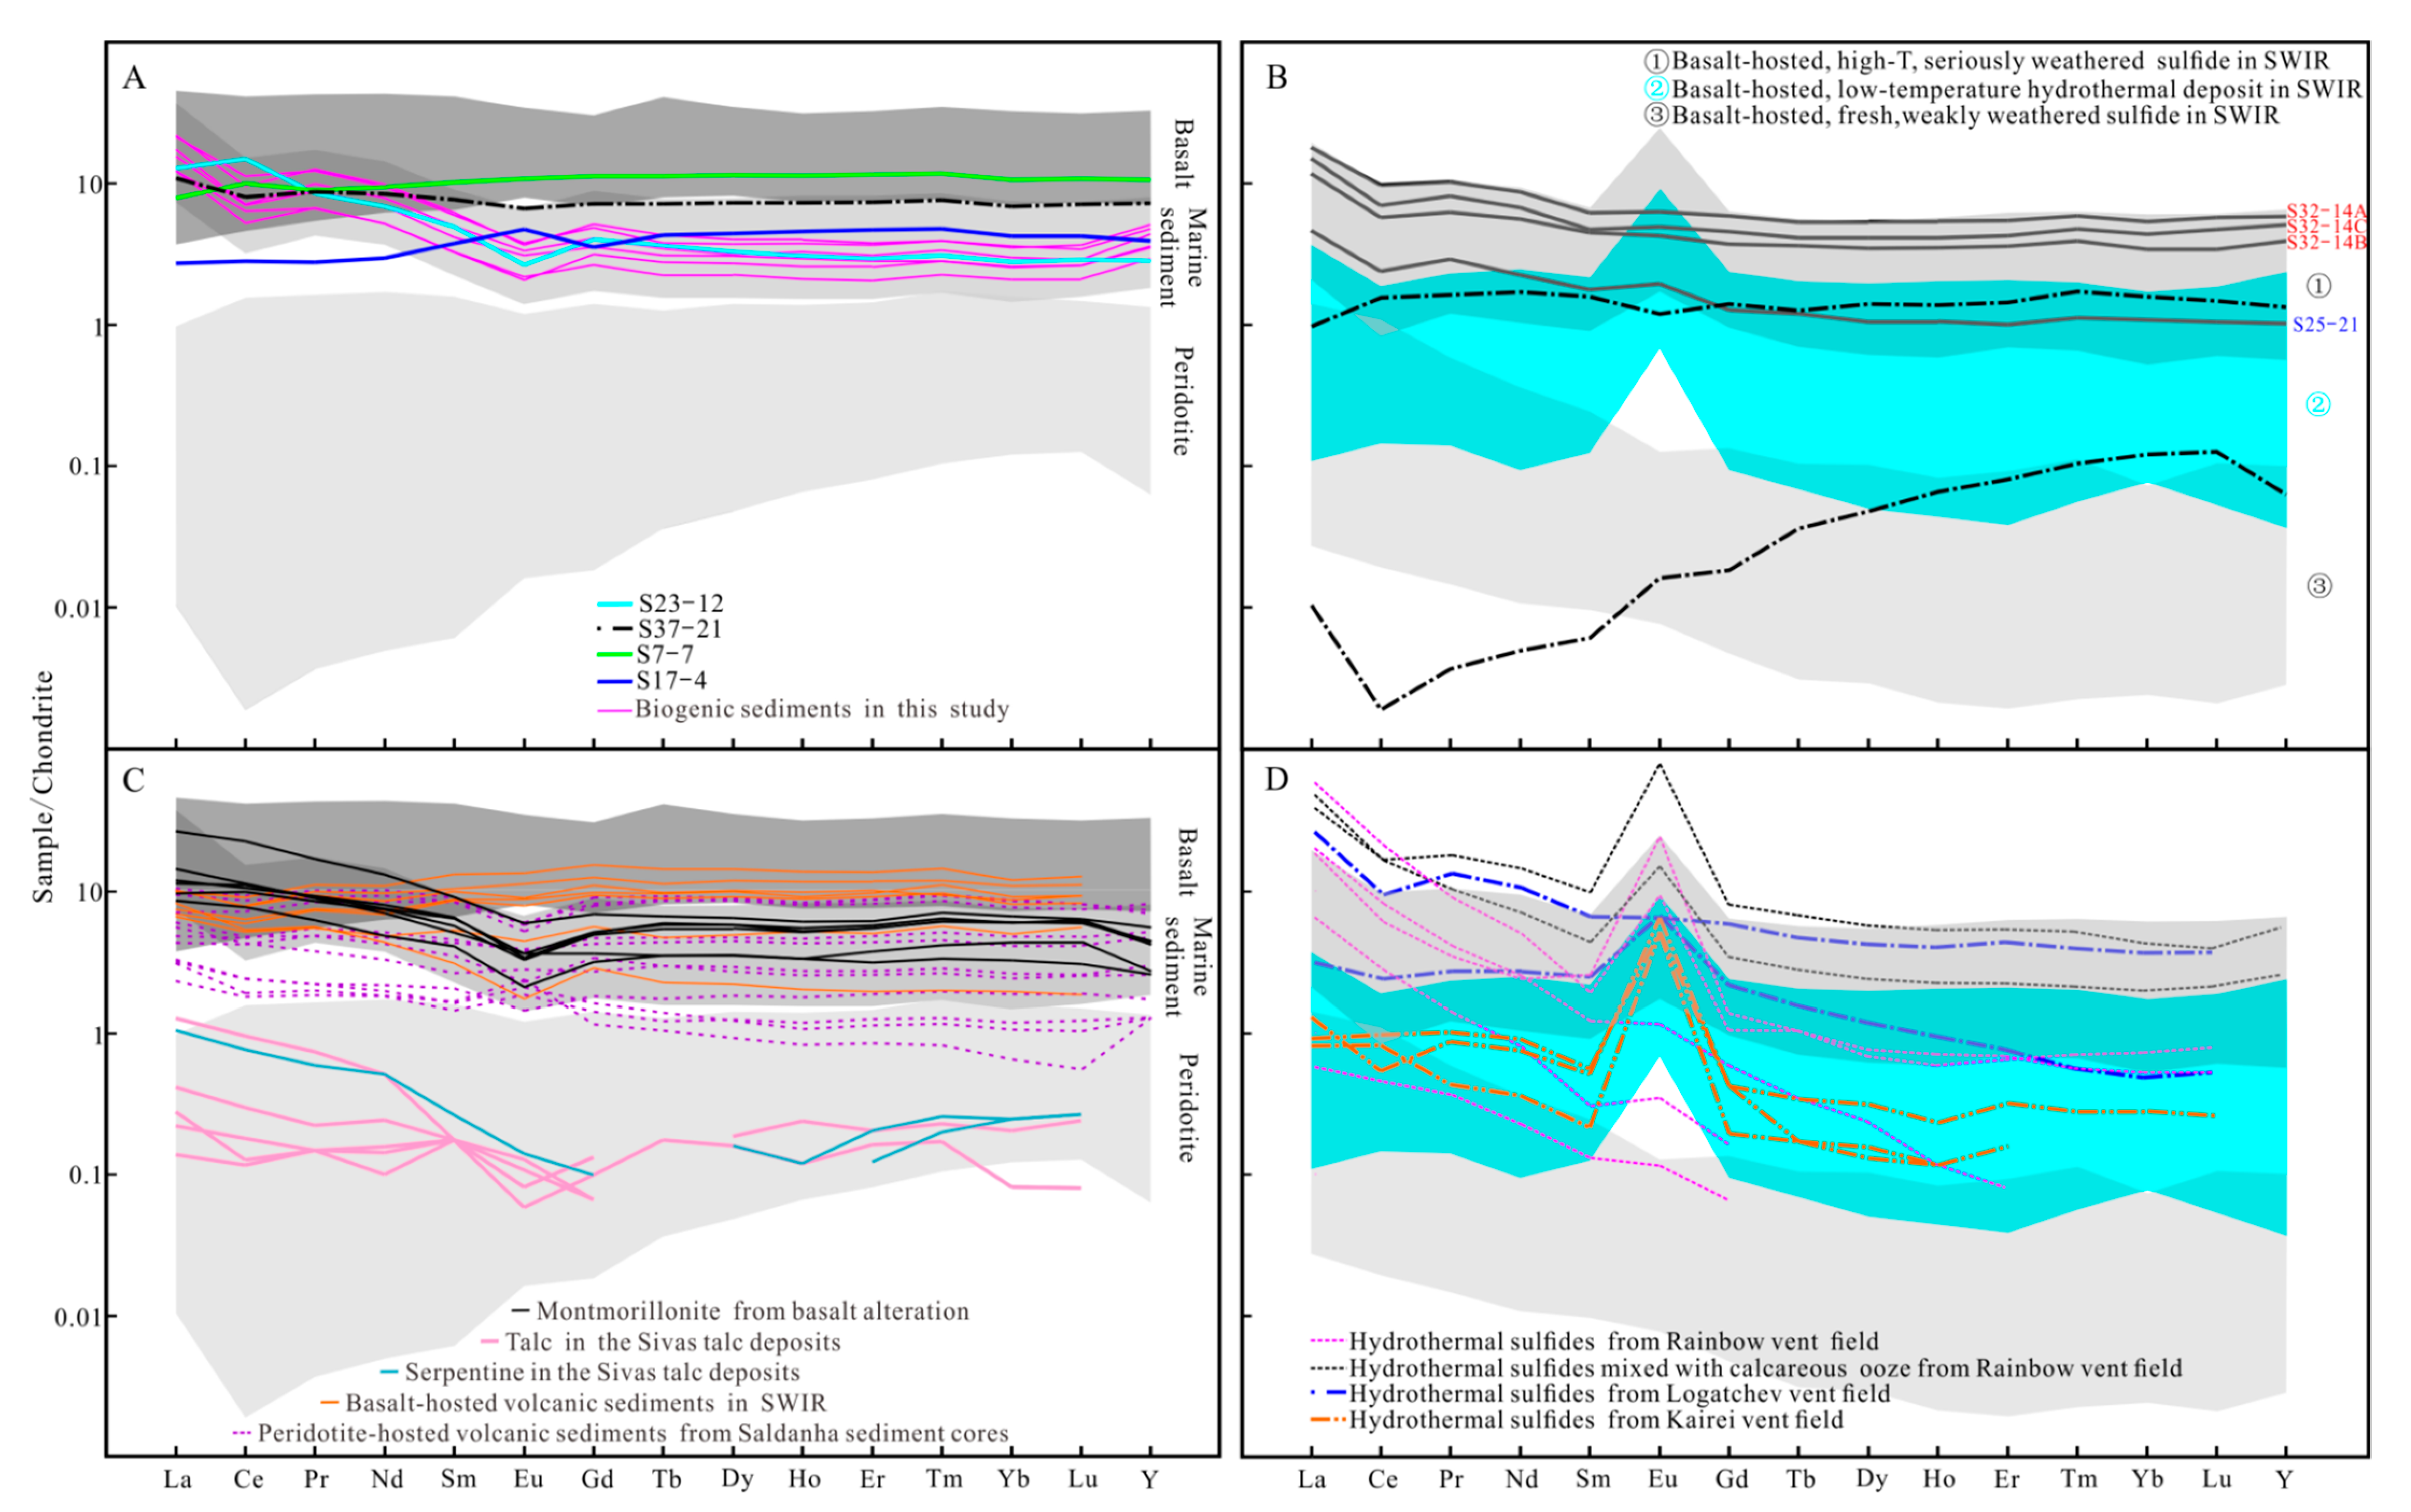
5.2.3. REY Element Geochemistry and Their Significances

Cluster analysis revealed that REY had a strong and direct correlation with MnO and Al2O3 (Figure 4C). Moreover, REE content in S32-14AB and S25-21 was much bigger than the average REE content in fresh hydrothermal sulfides from the active Longqi Vent Field (Table 4, Appendix A Table A1). These pieces of evidence indicate the enrichment of REE during the seafloor weathering process. REE in basalt > REE in gabbro ≫REE in peridotite on SWIR (Appendix A Table A1). Moreover, the sulfides formed under their corresponding backgrounds seem to inherit and strengthen this distinction after they all suffered seafloor weathering process. The initial REE content in fresh sulfides were all very small because their large ion radius compared to Zn, Fe, and Cu limits their entry into sulfide lattice [77]. Ultimately, the REE content of basalt in 63° E from SWIR was 131.5 ppm, close to OIB (199.0 ppm), and significantly different from N-MORB and other regional basalts on SWIR (Appendix A Table A1). This indicated that the basalt in 63° E had been re-fertilized and had experienced regional differences.
The LREE*/HREE* value of seawater in 3400 m depth in the Atlantic was 2.03, and that of monospecific planktonic foraminifera from the Atlantic Ocean was 4.43. It was evident that organisms tend to selectively absorb LREE* in their life activities and increase REE differentiation (Appendix A Table A1). Hydrothermal-derived deposits inherited the REE differentiation characteristic of original hydrothermal fluids. They were also strongly enriched with LREE* and strongly depleted of HREE* [78]. which was the result of the strong leaching and migration of LREE* during the fluid-rock interaction with basement rock [79]. However, the extent of differentiation had been much weaker (Figure 6, Appendix A Figure A2C, Table 4, Appendix A Table A1). The average LREE*/HREE* value of fresh Fe-rich sulfides in the active Longqi Vent Field was 8.13, closer to that of hydrothermal fluid of black smokers (Appendix A Table A1). On one hand, it may indicate that the Longqi Vent vent field is a black smoker, which would be consistent with the field report in [16]; on the other hand, it suggests that fresh sulfides remain the REE differentiation characteristic of the original vent fluid. There was no significant REE differentiation in their precipitation process, but as time goes by, the sediments were gradually transformed by seawater, especially when hydrothermal activity stops. Hence, all hydrothermal products will no longer be fresh and will be mixed with rock debris, biosediment, or hydrogenetic minerals; therefore, their REE features will change. The average LREE*/HREE* value of hydrothermal-derived deposits was close to that of hydrothermal Fe-rich oxides in the active Longqi Vent Field, quite different from fresh Fe-rich sulfides in the active Longqi Vent Field (Table 4, Appendix A Table A1). On one hand, it reveals that hydrothermal-derived deposits had almost been oxidized out; on the other hand, it also uncovers that HREE enriches significantly in the later seafloor weathering process. This was a process during which the LREE*/HREE* value gradually decreased. This is in line with the belief that the chondrite-normalized REE abundances increase as the ionic radius decreases in siderite [80]. However, the characteristic of LREE-enriched and HREE-depleted remains. The positive Eu anomaly tends to remain as well, and the negative Ce anomaly tends to be stronger than fresh sulfides. The REE differentiation characteristics of N-MORB and peridotite were LREE*-depleted and HREE*-enriched (Appendix A Figure 2A), however, the existence of biocomponent had changed the REE differentiation characteristic of volcanic sediments into LREE*-enriched and HREE*-depleted. It seemed to be more intense as the content of the biocomponent increased. It was also much more significant in peridotite-hosted samples, S23-12, than basalt-hosted samples, S37-21 (Figure 6). This was consistent with the result that peridotite was much more LREE*-depleted than basalt (Appendix A Figure A2A). The existence of biocomponent in S32-14C did not influence REE differentiation greatly compared to volcanic sediments. This may be related to the result that hydrothermal fluids had stronger REE differentiation than biocomponents (e.g., foraminifera) (Appendix A Table A1, Figure 6, Appendix A Figure A2C).
LREE*/HREE* value for S7-7 (49.7° E) was 1.50 and for S17-4 (51.7° E) was 1.25, close to the value of basalt in 49.6° E (1.36) and 50.5° E (1.26) from SWIR (Appendix A Table A1). This demonstrated that small amounts of biocomponents could not dramatically change the REE differentiation, and volcanic sediments still remain the REE differentiation characteristic of basalt debris though they all had suffered the later seafloor weathering process. LREE*/HREE* values of basalt in 49.6° E, 50.5° E, and 55.7° E from SWIR were close to N-MORB, but LREE*/HREE* value of basalt in 63° E was even bigger than E-MORB and close to lower continental crust (Appendix A Table A1). This may show that the magmatic processes in 63°E were re-fertilized by contamination with lower continental crust materials. This would be consistent with previous studies on the geochemical characteristics of basalts or peridotites in the Indian Ocean, suggesting that continental remnants associated with the continental lithosphere may be widely dispersed in the lithosphere and asthenosphere of the Indian Ocean [81,82,83,84]. LREE*/HREE* value of peridotite in 53° E was smaller than that of peridotite in 65° E. This suggests that: (1) the mantle in 53° E was more depleted than that in 65° E, (2) the mantle in 53° E was more depleted than 2σ-depleted DMM, and (3) the mantle in 65° E was as depleted as 2σ-depleted DMM (Appendix A Table A1). That was, magmatic activity was more active and frequent in 53° E than 65° E.
(La/Sm)N values of hydrothermal-derived deposits were closer to those of black smokers (Table 4, Appendix A Table A1). Taking fresh sulfides from the active Longqi Vent Field into consideration, it was noticeable that the LREE differentiation strengthened in sulfide precipitation from vent fluid. In addition, (La/Sm)N values of fresh Fe-rich and Zn-rich sulfides, just as their REE contents, were not too much different from each other. Moreover, (La/Sm)N values of sulfides seem to change a little during the seafloor weathering process. The average (La/Sm)N value of hydrothermal-derived deposits in this study was closer to that of fresh Fe-rich sulfides than Zn-rich sulfides from the active Longqi Vent Field (Table 4, Appendix A Table A1). This may indicate that the average (La/Sm)N value could be applied to identify whether or not sulfides belong to Fe-rich or Zn-rich sulfides. (La/Sm)N values of sulfides appear to slightly reduce when they had all weathered into Fe (hydro) oxides. This demonstrated that more MREE was enriched in iron (hydro) oxides. In other words, MREE enrichment was more significant than LREE during the weathering process. Hydrothermal-derived deposits obviously did not inherit the LREE differentiation feature of their host rocks. However, volcanic sediments seem to inherit the LREE differentiation feature of their host rock (e.g., S23-12 in 52° E ((La/Sm)N = 2.60), peridotite in 53° E ((La/Sm)N = 2.34); S17-4 in 51° E ((La/Sm)N = 0.72), S7-7 in 49° E ((La/Sm)N = 0.78), basalt in 50.5° E ((La/Sm)N = 0.59) (Appendix A Table A1)). It was clear that the existence of biocomponents enhances LREE differentiation, but the influence was small. Hence, volcanic sediments could still remain the general LREE differentiation feature of rock debris even though they all had suffered the later seafloor weathering process. Furthermore, (La/Sm)N values of basalt in 50.5° E and 55.7° E were close to N-MORB, but that of basalt in 63° E was close to E-MORB (Appendix A Table A1). This demonstrated that the re-fertilization process had already taken place in magmatic processes in 63° E, and it was much more related to the materials input from lower continental crust than biosediments. Meanwhile, this reveals that the re-fertilization process was regionally different on SWIR. Compared to average DMM, (La/Sm)N value of peridotite in 53° E was much bigger significantly, but (La/Sm)N value of peridotite in 65° E was close to average DMM (Appendix A Table A1). This was an indication that peridotite in 53° E had been re-fertilized substantially, and its LREE had been increased significantly. However, peridotite in 65° E remains normal. Previous studies have revealed that the re-fertilization process in 53° E peridotite was due to the melt-rock reaction with 0.02–2.7% basaltic melts [68,85].
Hydrothermal-derived deposits inherited the Eu-enriched characteristic of original vent fluids (Figure 6, Appendix A Figure A2C). The inheritance was minorly stronger than fresh sulfides from the active Longqi Vent Field and weaker than hydrothermal Fe-rich (hydro) oxides in the active Longqi Vent Field (Table 4, Appendix A Table A1). This suggests that Eu remains more in original vent fluid dispersing into seawater without precipitation with minerals, and the positive Eu anomaly was strengthened during the oxidized weathering process. This may stem from the addition and mixing with the hydrothermal products (e.g., hydrothermal Fe–Mn deposit and nontronite) formed at a later low-temperature period [14,86]. That also suggests that Eu was more likely to co-precipitate with minerals at low-temperature and high oxygen fugacity. As hydrothermal fluid dispersed and mixes with seawater, more Eu was present as Eu3+, and Eu3+ was closer in size to Ca2+ than Eu2+ [87]. Previous research works have also shown that the Eu contribution from hydrothermal fluids to bottom seawater in the Atlantic Ocean was at least one order of magnitude greater than the other REE [88].
Biogenic sediments obviously inherit the negative Eu anomaly of seawater, which is similar to the hydrogenetic Fe–Mn deposits on SWIR (Figure 6, Appendix A Figure A2A, Appendix A Figure A2C). Moreover, the δEu of biogenic sediments was much closer to that of seawater than δCe (Table 4, Appendix A Table A1). This demonstrated that the negative Ce anomaly was weakened in the process of biosediment formation, but the negative Eu anomaly remains almost unchanged. Finally, the Eu-depleted feature of basalt and peridotite on SWIR could come from the influence of seawater in the seafloor weathering process (Appendix A Figure A2B, Appendix A Table A1). The existence of basaltic debris in S37-21 appears to weaken the negative Eu anomaly (Figure 6). This uncovers that Eu content in basalt was greater than biocomponents. It also manifests that the basalt in S37-21 may have a positive Eu anomaly or a small negative Eu anomaly as 49.6° E basalt. A previous study inferred that positive Eu anomaly in 50.5° E basalt was caused by plagioclase accumulation in the magma evolution process or caused by the influence of plagioclase-rich gabbro [76]. Clearly, not all basalts have a positive Eu anomaly characteristic (Appendix A Figure A2A and Table A1). A positive Eu anomaly exists in S17-4 and S7-7, but they had no positive Sr anomaly even though the biocomponents existed in them. This suggests that the rock debris in S17-4 and S7-7 was Sr-depleted, and the positive Eu anomaly was not caused by the existence of plagioclase but because of other reasons. Ceanom could be employed as an indicator to judge the redox conditions of ambient seawater. Ceanom > −0.1 indicated the enrichment of Ce and reflected the anoxic environment of ambient seawater. However, Ceanom < −0.1 signified the negative Ce anomaly and reflected the oxidative environment of ambient seawater [89]. The Ceanom of hydrothermal-derived deposits and biogenic sediments were all smaller than −0.1 (Table 4), indicating that they were under an oxidative environment. However, the Ceanom values of volcanic sediments were all bigger than −0.1, suggesting that they all were under an anoxic environment. In addition, Ceanom of S23-12 > S7-7 > S17-4. This demonstrated that an anoxic environment was the most serious in S23-12, then in S7-7, and finally in S17-4. More fresh rock debris and reductant in S23-12 were under oxidation or were ready to be oxidized and consume ambient oxygen. Then much more rock debris or reductant in S7-7 and S17-4 had been already oxidized. S23-12 was under an anoxic environment, but it had Eu depletion, δEu = 0.59. It was revealed above that δEu of hydrogenetic Fe–Mn deposits in 50.38–55.71° E SWIR was 0.57–0.75 (average 0.62). Moreover, for peridotite in 53° E was 0.83, for Atlantic seawater in 3400 m depth was 0.63, and for biogenic sediments was 0.65–0.81 (average 0.71) (Table 4, Appendix A Table A1). Eu in S23-12 was more depleted than peridotite, biocomponents, and seawater. This may be related to the existence of hydrogenetic Fe–Mn deposits. Through correlation analysis among S17-4, S7-7 and S37-21, it was found that r(Eu/K) = 0.959, r(Eu/Na) = 0.890, r(Eu/Ti) = 0.969, r(Eu/Nb) = 0.825, r(Eu/Zr) = 0.959, r(Eu/Hf) = 0.977, r(Eu/Rb) = 0.868, r(Eu/Ba) = 0.256, and r(Eu/Sr) = –0.023. All of these numbers indicate that Eu in S17-4, S7-7, and S37-21 was first much-related to basaltic debris and second, related to fluid dispersal.
HREE concentration in hydrothermal fluids is one order of magnitude larger than that in seawater [78,90,91]. In addition, HREE content in fresh sulfide precipitation is two to three orders of magnitude larger than the HREE concentration in original vent fluids [78,92]. The weathering process is beneficial to increase HREE in hydrothermal-derived deposits, but it seems it is not the case in volcanic sediments. This is because HREE content in talc, serpentine, or smectite is smaller than original rock debris (Table 4, Appendix A Table A1). Note that the weathering process does not change the relative quantitative relationship of their parent rocks. HREE content in basalt-hosted hydrothermal-derived deposits or volcanic sediments was still higher than that in peridotite-hosted samples. The existence of biocomponent in S32-14C and S37-21 caused HREE content to slightly decrease relative to S32-14AB, S17-4, and S7-7, respectively. However, the existence of basaltic debris in S37-21 seemed to cause HREE content to greatly increase compared to biogenic sediments. More basaltic debris will tend to had a larger HREE content in S7-7 compared to S17-4 (Table 4, Figure 6). In terms of HREE content, hydrogenetic Fe–Mn deposits > hydrothermal anhydrite > basalt > gabbro > smectite > Fe–Si oxyhydroxide flocs > siderite > iron (hydro)oxides > peridotite > hydrothermal Fe–Mn deposits > serpentine > talc > hydrothermal barite > hydrothermal nontronite > planktonic foraminifera > fresh sulfides > hydrothermal galena (Appendix A Table A1). The HREE content in S29-16 was the largest among biogenic sediments (Table 4). This implies that the existence of hydrogenetic Fe–Mn deposits and the existence of iron Fe hydroxides flocs had made a difference in increasing HREE content in biogenic sediments. However, HREE content in S23-12 was close to the average HREE content of biogenic sediments, even just slightly higher than S52-2, the background sediment. That is, it indicated that rock debris and hydrogenetic Fe–Mn deposits in S23-12 did not make a big difference, and their contributions even were covered up by biocomponents. This may originate from rock debris alteration and the dilution effect of biocomponent.
The (Er/Lu)N values of basalt in 49.6° E, 50.5° E, 51.7° E, and 63° E from SWIR were almost normal relative to N-MORB, but the (Er/Lu)N value of basalt in 55.7° E was the same as gabbro in 57.26° E (Appendix A Table A1). This may reflect the fact that basalt in 55.7° E had been contaminated by underlying gabbro during its formation process. The peridotite in 65° E was normal, but peridotite in 53° E was seriously depleted in MREE compared to HREE (Appendix A Table A1). As for hydrothermal-derived deposits, compared to original hydrothermal fluids, their (Er/Lu)N values seem to slightly decrease, but still, keep the general feature that MREE content was bigger than HREE, so do fresh sulfides in other Vent Fields (Table 4, Appendix A Table A1). Compared with their host rocks, they appear to tend to inherited the (Er/Lu)N value of their host rocks. The HREE content in samples had changed, but the relative ratio did not change (Table 4, Appendix A Table A1). This was to say that the (Er/Lu)N feature had been preserved from sulfide precipitation to a later weathering process. The existence of biocomponents in S32-14C did not make a difference as its (Er/Lu)N value reduces rather than increased. In addition, the impact of the existence of biocomponents in S37-21 was unimportant compared to the average (Er/Lu)N value of S17-4 and S7-7. However, the existence of biocomponents in S23-12 seemed to noticeably increase its (Er/Lu)N value (Table 4). And the existence of biocomponents in S17-4 and S7-7 did not make any difference. In other words, the addition of biocomponents could influence the (Er/Lu)N feature of weathered peridotite-hosted samples but could cause little difference in weathered basalt-hosted samples. This was because of the larger HREE content and larger (Er/Lu)N value of hydrothermal Fe-rich (hydro) oxides (weathered sulfides) and basalt than planktonic foraminifera. It was also due to the smaller HREE content and smaller (Er/Lu)N value of peridotite than planktonic foraminifera (Appendix A Table A1). Accordingly, it could be speculated that the existence of biocomponents in fresh sulfides will cause sulfides to inherit the HREE content and (Er/Lu)N value of biocomponents. In this case, HREE content was larger even in the range of an order of magnitude, and (Er/Lu)N value of planktonic foraminifera were close or larger than that of fresh sulfides (Appendix A Table A1). As for biogenic sediments mainly composed of planktonic foraminifera, they primarily inherited the (Er/Lu)N feature of planktonic foraminifera (Table 4, Appendix A Table A1). The existence of hydrogenetic Fe–Mn deposits in S29-16 seemed to be a little influential. Its (Er/Lu)N value was the same as the background sediment, S52-2 (Table 4). The HREE content of hydrogenetic Fe–Mn deposit was about 1000 times greater than that of planktonic foraminifera, and the (Er/Lu)N value of hydrogenetic Fe–Mn deposit was greater than that of planktonic foraminifera, too (Appendix A Table A1). Hence, it could reveal that a really small content of hydrogenetic Fe–Mn deposits in S29-16.

5.3. Sediment Discrimination

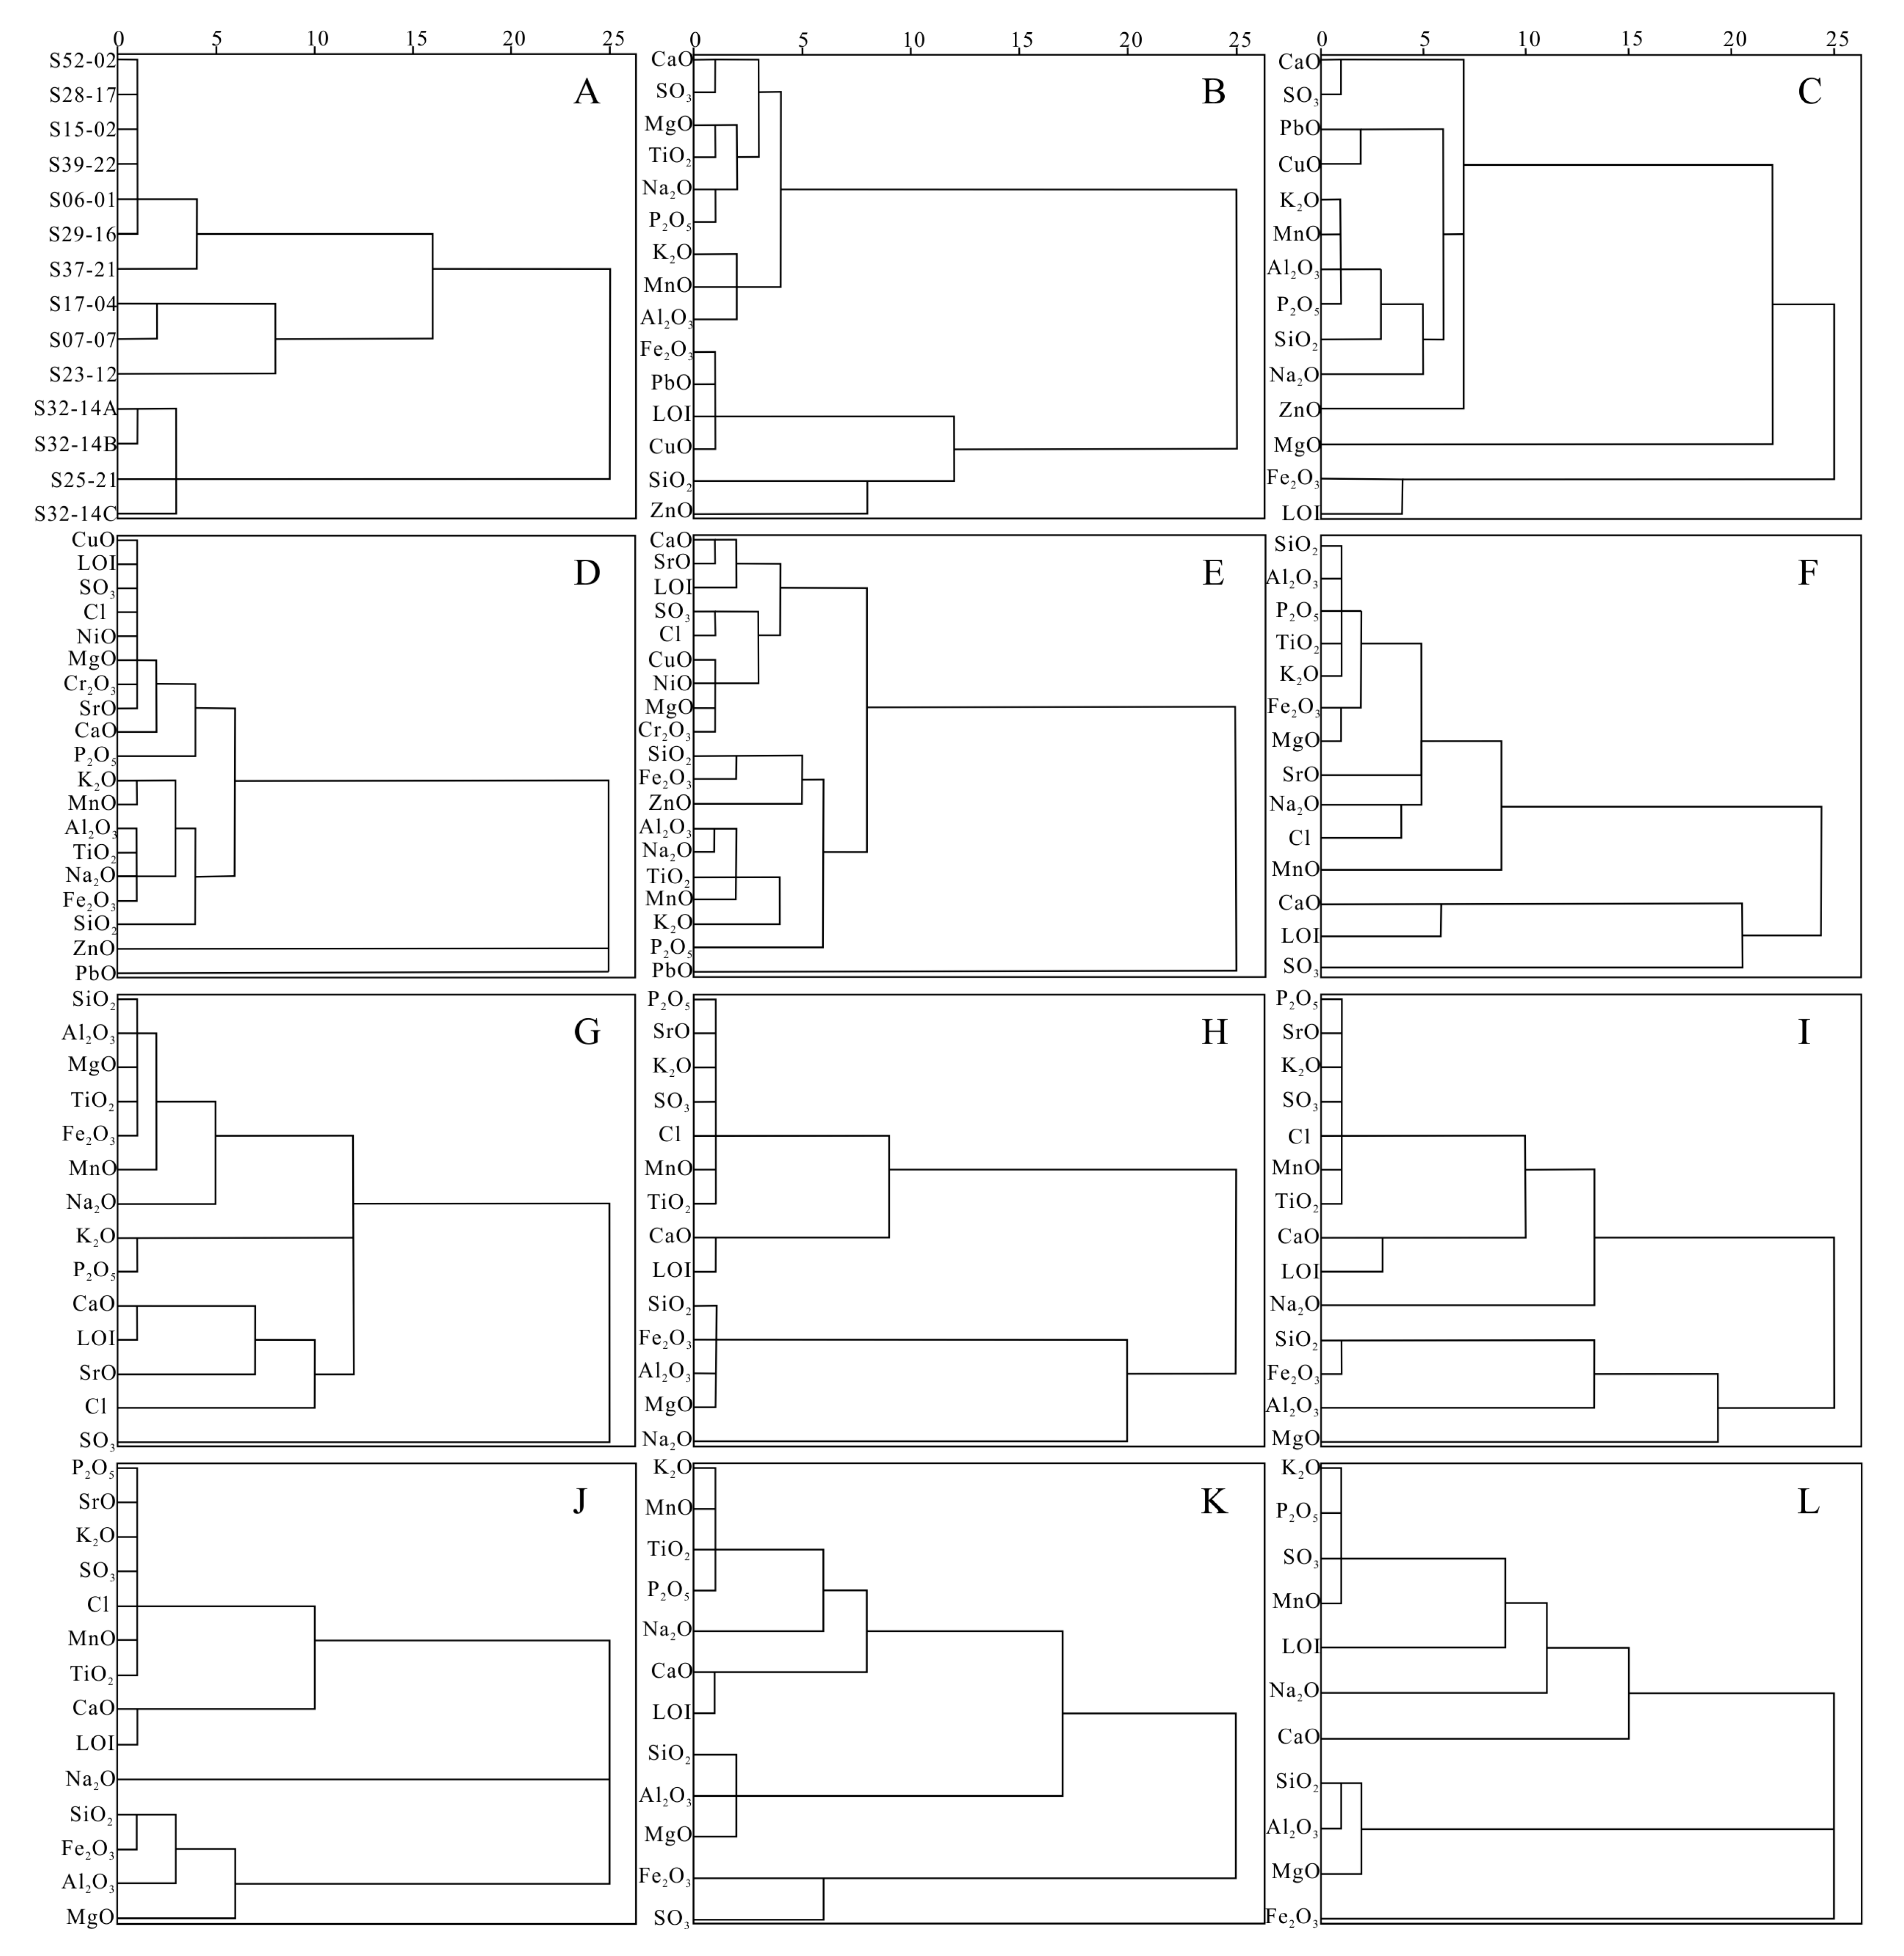
5.3.1. Cluster Analysis in Major Element

Through cluster analysis of the samples and their major elements on SWIR (Figure 8), and by using the method of “nearest neighbor element, Pearson’s correlation, and standardized Z-score” in SPSS software, it is found that S23-12 has differences with S17-4 and S7-7. S17-4 and S7-7 are similar, but their correlation was not very strong. It was also uncovered that S17-4 had differences with S7-7, and S17-4 had some correlation with S23-12. As already discussed, S17-4 had peridotite-hosted features like S23-12 and basalt-hosted features like S7-7. S32-14A was intensely correlated with S32-14B, but S32-14C was different from them because the existence of biocomponents in S32-14C weakened their correlation. S25-21 was different from S32-14ABC; however, it still could be classified into the same category as S32-14ABC for its hydrothermal composition.
The cluster analysis of S32-14ABC has revealed the intense correlation between CaO and SO3 (Figure 8B). In other words, there is CaSO3 (gypsum, anhydrite) in sediments. When taking S25-21 into the cluster analysis (Figure 8C), the correlation between Fe2O3 and LOI, SiO2, and Al2O3 is revealed. That is, it exhibited that S32-14ABC and S25-12 were iron sulfide-dominant samples, and aluminosilicate existed in their composition. The cluster analysis in S23-12, S17-4, and S7-7 showed a strong correlation between Al2O3, TiO2, Na2O, and Fe2O3, and between SiO2 and Al2O3 (Figure 8D). This means rock debris and clay minerals, and the correlation between CaO and MgO may indicate the presence of CaMg(CO3)2. When S37-21 was taken into the cluster analysis (Figure 8E), the intense correlation between CaO and SrO, LOI became noticeable. The correlations between Al2O3, TiO2, Na2O and MnO, SiO2, Fe2O3 were also noticeable. This is to say, CaO mainly existed in the form of CaCO3, and there was basalt debris.
The cluster analysis in biogenic sediments showed a strong correlation between SiO2, Al2O3, TiO2, K2O, and between P2O5, MgO, and Fe2O3 (Figure 8F), indicating the presence of basalt debris and clay mineral in biogenic sediments. When S37-21 was taken into the cluster analysis (Figure 8G), only the strong correlations between SiO2, Al2O3, TiO2, MgO, and Fe2O3, CaO, and LOI still existed, suggesting the existence of basalt debris and CaCO3 in the sediments. When S7-7 was added into the cluster analysis (Figure 8H), the intense correlations between SiO2, Al2O3, MgO, and Fe2O3, besides between CaO and LOI, were revealed, indicating basalt debris, clay minerals, and CaCO3. Moreover, the intense correlations between TiO2 and K2O, P2O5, SrO, and MnO indicate hydrogenetic Mn deposits. When peridotite-hosted S23-12 was added into the cluster analysis (Figure 8I), the strong correlation between SiO2 and Fe2O3 still existed, but the correlation between SiO2 and Al2O3, MgO was estranged, indicating the existence of peridotite debris, for example, fayalite. When S17-4 was added into the cluster analysis (Figure 8J), the strong correlation between SiO2 and Fe2O3 still existed, and the correlation between SiO2 and Al2O3, MgO becomes stronger than the addition of peridotite-hosted S23-12, but still not very close compared to the addition of S7-7 or S37-21. This means S17-4 was indeed a sediment mixture between peridotite-hosted and basalt-hosted. When S32-14C was added into the cluster analysis based on basalt-hosted samples (Figure 8K), the Mn deposits still could be revealed, so could CaCO3. The intense correlation between SiO2 and Al2O3, MgO also still existed, suggesting basalt debris and clay minerals. Except for Fe2O3, for the high content of iron sulfide in S32-14C, it weakened the correlation between SiO2 and Fe2O3, and Fe2O3 tends to be related to LOI and SO3. With the addition of peridotite-hosted S25-21 into cluster analysis based on basalt-hosted samples (Figure 8L), the Mn deposits still could be revealed, but the correlation between CaO and LOI and the correlation between MgO and Al2O3 become estranged. This was because there was no calcareous biocomponent in S25-21, and peridotite-hosted debris lacked enough Al. Ultimately, in summary, the cluster analysis based on basalt-hosted samples was valuable for evaluating whether or not the additional sample was basalt-hosted, besides assessing their mineral compositions.

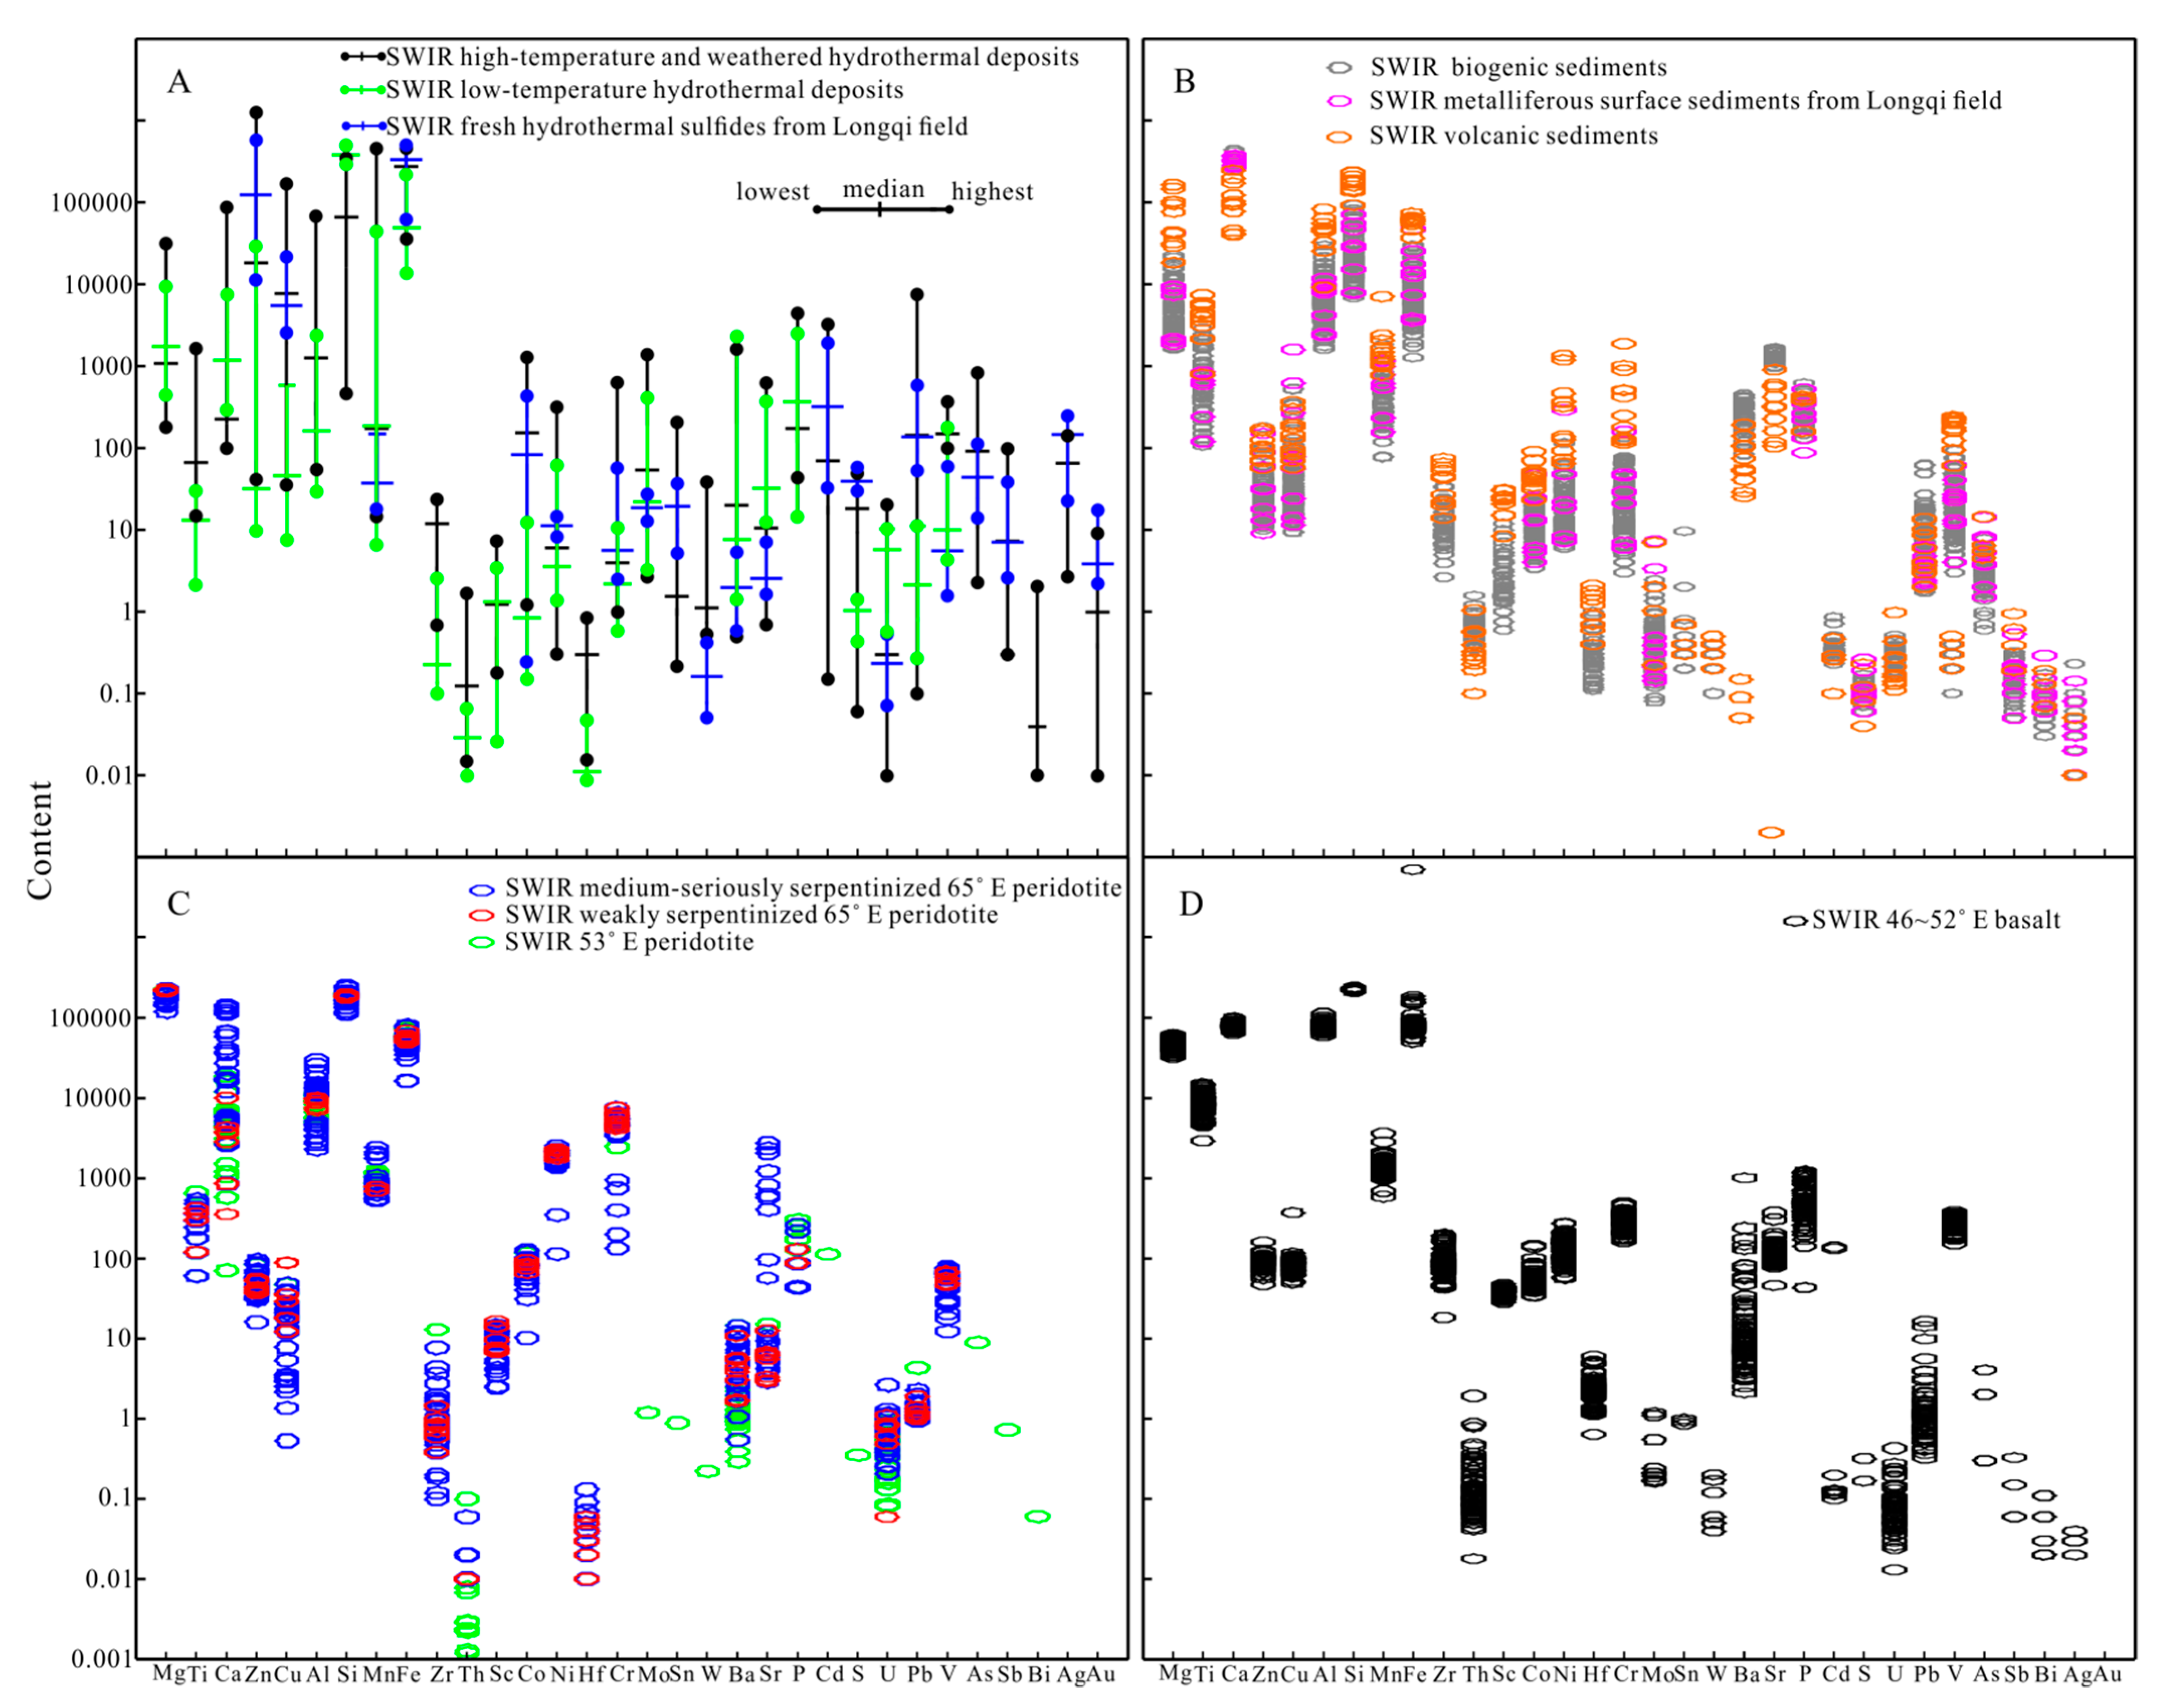
5.3.2. Element Differentiation for Sample Type on SWIR

The high-temperature hydrothermal deposits contain a higher content of Ti, Zn, Cu, Fe, Zr, Th, Co, Hf, Pb, and S, but a lower content of U and Si compared to the low-temperature hydrothermal deposits. The weathered sulfides contained a higher content of Mn, Th, Ba, and Sr, but a lower content of S in comparison to fresh sulfide deposits (Appendix A Figure A3A). The volcanic sediments contained a higher content of Mg, Ti, Zn, Si, Mn, Fe, Zr, Sc, Co, Ni, Hf, and Cr, but a lower content of Th, Ba, Sr, and U compared to the biogenic sediments. The metalliferous surface sediment from the Longqi Hydrothermal Field contained a higher content of Cu, but its other elements were distributed within the range of marine biogenic sediments. This indicated that the metalliferous surface sediment was biogenic indeed (Appendix A Figure A3B). The major and minor elements of basalt and peridotite were mostly distributed within the element distribution range of hydrothermal deposits. The exception was that Si, Ti, and Al were more enriched in basalt, and Si, Mg, Cr, and Ni were more enriched in peridotite, and serpentinization will cause Mg, Ti, Cu, Al, Fe, Sc, Co, Cr, Ni, U, and V content to decrease and Ca, Mn, Sr, and P content to increase in peridotite (Appendix A Figure A3C,D). The element distribution of basalt (including altered and unaltered) was concentrated, and the elements with large fluctuation range were Fe, Zr, Th, Hf, Mo, W, Ba, Sr, P, Cd, U, Pb, and As. While Ti, Zn, Cu, Co, Ni, Cr, and V remained almost stable, Mg, Ca, Al, Si, and Sc always remained stable (Appendix A Figure A3D). All element distributions of hydrothermal deposits and marine surface sediments were scattered (Appendix A Figure A3A,B), and except for Mg and Si, the other element distributions of peridotite were scattered as well (Appendix A Figure A3C).
Based on Appendix A Figure A4A, on the whole, basalt had the biggest REY content, followed by marine sediments and finally peridotite. However, marine sediments and basalt had a large overlap area in LREE. At the same time, there was a good boundary between their MREE and HREE, and there was a clear boundary between the REY of peridotite and marine sediments. The biogenic sediments in this study were all located in the REY range of marine sediments, even though there were a small amount of Fe–Mn deposits (S29-16) or rock debris (S6-1). However, the volcanic sediments in this study were different. S7-7 contained a high content of basalt debris, and its LREE was located in the REY range of marine sediments, but its MREE and HREE were located in the REY range of basalt. When basalt altered into montmorillonite, the REY of montmorillonite was largely located in the REY range of marine sediments, especially MREE and HREE. This means that there was still unaltered basalt debris in S7-7, and its content was clearly higher than that in S37-21. MREE and HREE of S37-21 were just close to the lower boundary of the REY range of basalt. S17-4 contained some peridotite debris, and its MREE and HREE were located in the REY range of marine sediment, but its LREE fell into the boundary interval between marine sediments REY range and peridotite REY range. The interesting thing was that S23-12 contained much peridotite debris, but its REY was completely located in the REY range of marine sediments. This may stem from its high content of Fe–Mn deposits and calcareous ooze. It had little relationship with serpentinization and talcization. Note that the REY of talc and serpentine were also extremely low and located in the REY range of peridotite (Appendix A Figure A4C). This implies that if there was enough peridotite debris in the sediment, whether they were fresh or had suffered serpentinization and talcization, the LREE of the sediment would decrease. In this case, the LREE of the sediment will locate in the boundary interval between the marine sediment REY range and peridotite REY range unless there were other minerals in the sediment that could compensate for this LREE shortage. Based on Appendix A Figure A4C, the LREE in most basalt-hosted volcanic sediments was located in the REY range of marine sediment. However, obviously, the content of their basalt debris determined whether or not their MREE and HREE could go up and locate into the REY range of basalt. The content of basalt debris should at least exceed the content of the basalt debris that existed in S37-21, m(SiO2)/m(CaO) ≈ 0.56, and m(Al2O3)/m(CaO) ≈ 0.17. As for peridotite-hosted volcanic sediments, the LREE in most of them was located in the REY range of marine sediment too. Similarly, the content of their peridotite debris determined whether their LREE, MREE, and HREE could go down and locate into the REY range of peridotite or the boundary interval between marine sediment REY range and peridotite REY range. The content of peridotite debris should at least exceed the content of the peridotite debris that existed in S17-4, m(MgO)/m(CaO) ≈ 2.76. From this viewpoint, it also could be seen that the content of peridotite debris in high-temperature and severely weathered sulfide determined whether their LREE, MREE, and HREE could go down and locate into the REY range of peridotite or the boundary interval between marine sediment REY range and peridotite REY range. However, it was hard to come up with a suitable evaluation index because the REY range of peridotite and hydrothermal deposits do not have a clear separation.
Based on Appendix A Figure A4B, overall, the REY content of high-temperature and severely weathered sulfide was the greatest, followed by low-temperature hydrothermal deposits, and finally, high-temperature and fresh (weakly weathered) sulfides. The positive Eu anomaly of seriously weathered and low-temperature hydrothermal deposits was more prominent than that of fresh (weakly weathered) sulfide. The REY of S32-14AB was located in the REY range of severely weathered sulfide. S32-14C contained some calcareous ooze, and its REY, LREE, MREE, HREE all increased in comparison to S32-14B, but its REY was still located in the REY range of severely weathered sulfide. S25-21 contained some peridotite debris, like S17-4, and its LREE fell into the boundary interval between marine sediment REY range and peridotite REY range. More seriously, the MREE and HREE of S25-21 fell into the REY range of peridotite, indicating that the existence of peridotite debris could affect all the REY of sulfide deposits. Based on Appendix A Figure A4D, the REY of most of the peridotite-hosted hydrothermal sulfide was located within the REY range of basalt-hosted hydrothermal deposits except for Eu. The Eu content in some peridotite-hosted hydrothermal sulfide samples was far beyond the REY range of basalt-hosted hydrothermal deposits. In addition, the existence of calcareous ooze could help to increase the REY of peridotite-hosted hydrothermal sulfide. Moreover, through comparison with the basalt-hosted hydrothermal deposit, it was found that the LREE*/HREE* ratio in the peridotite-hosted hydrothermal sulfide was larger, which means that peridotite-hosted hydrothermal sulfide appeared to be poorer in HREE. As mentioned above, during the seafloor weathering process of hydrothermal sulfides, their HREE would enrich from ambient seawater, and the enrichment behavior correlated strongly with iron (hydro) oxides. This may come from the relative enrichment of Cu and Zn in peridotite-hosted hydrothermal sulfide. Actually, some of the peridotite-hosted hydrothermal sulfides were even dominated by copper sulfides. As a result, they kept the high LREE*/HREE* ratio as their original hydrothermal fluid and lacked the REE smoothing influence from later seafloor weathering (Appendix A Figure A4B).

5.3.3. Element Differentiation for Peridotite- and Basalt-Hosted

Compared with samples from other regions together with SWIR samples, it was shown that peridotite contained a higher content of Mg, Ni, Cr, Mo, and U, while basalt contained a higher content of Ti, Ca, Al, Si, Mn, Fe, Zr, Th, Sc, Hf, Ba, and P (Appendix A Figure A5A). Basalt-hosted hydrothermal sulfide contained a higher content of Ti, Al, Mn, Zr, Sc, Hf, Mo, Ba, Sr, Cd, Pb, As, Sb, and Ag, while peridotite-hosted hydrothermal sulfide contained a higher content of Mg, Cu, Co, Ni, Sn, and Au (Appendix A Figure A5B). Peridotite-hosted volcanic sediment contained a higher content of Mg, Cu, Ni, and Cr, and a lower content of Ca, Th, Ba, and Sr, while the basalt-hosted volcanic sediment contained a higher content of Ti, Al, Zr, Sc, and Hf (Appendix A Figure A5C,D). The peridotite-hosted marine biogenic sediment contained a higher content of Mg, Ca, Mn, Fe, As, and Sb, and the basalt-hosted marine biogenic sediment contained a higher content of Si, Ba, and U. Finally, the basalt-hosted metalliferous surface sediment contained a higher content of Fe, and the peridotite-hosted metalliferous surface sediment contained a higher content of Cu, but their other elements were generally indistinguishable (Appendix A Figure A5C,D). Among the basalt-hosted marine sediments, the metalliferous surface sediment contained a higher content of Cu, Mn, Fe, Co, Mo, Ba, and As compared to the non-metalliferous surface sediment (Appendix A Figure A5C). Moreover, the high-temperature hydrothermal deposit contained a higher content of Zn, Cu, Fe, S, Pb, Sb, and Ag, and the low-temperature hydrothermal deposit contained a higher content of Mn, Th, and U (Appendix A Figure A6). In summary, it seemed that after the huge increase of sample amount, the differences between sample types and the distribution or enrichment of elements were still closely related to their sedimentary provenance or were inherited from the host rock.
According to the enrichment and distribution of elements in different samples and in connection with the previous classification methods, a series of parameters were designed to classify the igneous host rock (Table 4). Peridotite-hosted samples were richer in Mg, and basalt-hosted samples were richer in Al. The Al/Mg and Fe/Mg ratios in samples seemed to be capable of discriminating them. However, the Fe/Al ratio was only suitable to be applied for volcanic sediment. Note that the Fe/Al ratio cannot reflect the peridotite-hosted component in S17-4. Ultimately, the Ti/Al ratio was not successful in discriminating basalt-hosted and peridotite-hosted samples. Basalt-hosted samples had an Al/Mg ratio bigger than 1, peridotite-hosted samples had an Al/Mg ratio smaller than 0.1, and sample S17-4 had an Al/Mg ratio between them. Hence, it could be roughly estimated that there was about 37% basaltic component and 63% peridotite component in S17-4. S23-12 and S17-4 had Fe/Mg ratio smaller than 1. Unlike the basalt-hosted samples, however, it could not uncover that S17-4 also had a basaltic component. We usually tried to used Al/Si and Mg/Si ratios to estimate the main basaltic and peridotite minerals in sediments. According to the chemical formula of minerals, the Mg/Si ratio for fayalite is 2, for serpentine is 1.5, for talc is 0.75, for sepiolite is 0.67, for diopside is 0.5, and for glaucophane is 0.375. The Si content in hydrothermal-derived deposits was not only from the rock debris but also from hydrothermal fluids. However, the Mg/Si ratio of S25-21 was closer to that of sepiolite and talc, and it was consistent with the microscope observation results. The Mg/Si ratio of S23-12 was between those of serpentine and talc. The Mg/Si ratio of S17-4 was between those of sepiolite and diopside. The other samples could not be further distinguished by their Mg/Si ratio. The Al/Si ratio for augite was 2, for hornblende was 0.14, for titanaugite was 1.5, for omphacite was 0.5, for epidote was 0.67, for ptilolite was 0.2, for kaolinite was 1, for montmorillonite was 0.5, for phillipsite was 0.3, for heulandite was 0.285, for analcime was 0.5, for penninite was 0.67, and for clinochlore was 0.91. Thus, the Al/Si ratio for S32-14A was closer to that of omphacite, for S32-14B was closer to that of hornblende, for S32-14C was closer to that of omphacite, for S7-7 was closer to that of montmorillonite, and for S37-21 was between those of hornblende and omphacite.
We usually tried to use the Si/Ca ratio to estimate the existence of biocomponent or rock debris in the samples. The Si/Ca ratio of S32-14C was largely smaller than that of S32-14AB. This means that the hydrothermal sediment contained fewer calcium minerals. Comparing the Si/Ca ratio of S23-12, S17-4, and S7-7, it also could be revealed that S23-12 had the greatest content of biocomponents. Comparing the Si/Ca ratio of S37-21 and biogenic sediments, it was found that the existence of rock debris could cause the Si/Ca ratio to increase by a large amount. S29-16 and S6-1 had the largest Si/Ca ratio among biogenic sediments, and their Si/Ca ratio was close. However, the Si content in S29-16 increased with the existence of Fe–Si hydroxide floc alongside siliceous biological shells. The Si content in S6-1 increased with the existence of rock debris alongside siliceous biological shells. According to the Mg/Ca ratio of sediments and with comparing the Mg/Ca ratio in S32-14ABC, the existence of biocomponent in S32-14C played a role in dilution. In other words, hydrothermal sediment itself had some Mg-minerals, for example, clay minerals and basalt debris. S29-16 had the greatest Mg/Ca ratio among biogenic sediments. Its Mg/Ca ratio was close to that of S6-1. This was because of the Fe–Mn deposits in S29-16, which were also rich in Mg.

6. Conclusions

Based on the distinct mineralogical and geochemical characteristics, the SWIR hydrothermal-derived deposits, volcanic and biogenic sediments could be well-distinguished. However, when applying the usual indicators for hydrothermal input, the identification of the metalliferous surface sediment needs to be carried out with much caution because of the presence of rock debris. The high content of rock debris could cause the whole sediment to inherited its MSI value and REY characteristics. It was feasible to identify them in sediments through cluster analysis and comparison of the REY distribution range. However, the existence of host rock debris could substantially help to distinguish the sedimentary environment and the provenance of the sediment. It also could greatly affect its mineralogy and geochemistry even after the rock alteration that could release elements to the ambient environment and form new minerals. When these diagnostic elements or minerals that inherited the characteristics of the parent rock settle or mix in the sediment, the host rock signal were recorded and stored for later calculating, tracking, and separating from the hydrothermal activity signal. When it was compared with Ti, it was more effective for the differentiation of igneous host rock by using Al and Mg. Moreover, in addition to the usually geochemical and mineralogical indicators for tracing hydrothermal activity, the SiO2(bio) content in surface sediments may also be employed as one of the indicators. The hydrothermal activity could influence not only the ambient seafloor sediments but also the plankton living in the surface water. It could also promote primary productivity, which requires many detailed and comprehensive studies on a single hydrothermal vent field in the future.

Author Contributions

X.C., Z.W. and X.S. conceived and designed the experiments; X.C. analyzed the data and wrote this paper; X.S. and Z.W. have substantially revised the original manuscript; Y.W., X.L. and H.C. also made significant contributions to the sample preparation. All authors have read and agreed to the published version of the manuscript.

Funding

This research project was jointly funded by the National Key R and D Program of China (2018YFC0309902), National Natural Science Foundation of China (Grant Nos. 42072084, 41702066, 41503036 and 41273054), Guangdong Basic and Applied Basic Research Foundation (2019A1515011922), the Fundamental Research Funds for Central Universities (Nos. 20lgpy64 and 12lgjc05), Research Fund for the Doctoral Program of Higher Education of China (20120171130005), and the China Ocean Mineral Resources Research and Development Association (DYXM-115-02-1-11).

Acknowledgments

We thank the crews and scientists of the DY115-20, DY115-21, DY115-22, DY125-30 and DY125-40 cruises onboard the R/V Dayang Yihao, as well as the China Ocean Sample Repository for providing these hydrothermal samples and marine surface sediments. We thank two anonymous reviewers who have provided many helpful comments and suggestions and would like to express our gratitude to EditSprings (https://www.editsprings.com/) for their expert linguistic services provided.

Conflicts of Interest

The authors declare no conflict of interest.

Appendix A

Figure A1. EDS spectra of some specific minerals. (A) Sphalerite, S32-14A, (B) iron oxide, S32-14C, (C) iron sulfate, S25-21, (D) copper sulfate, S25-21.
Minerals 11 00138 g0a1
Figure A2. Chondrite-normalized REY patterns and primitive mantle-normalized trace element patterns of samples. (A,C) Basalt, peridotite, gabbro and their alteration minerals, H-peridotite = highly serpentinized peridotite, M-peridotite = medium serpentinized peridotite, L-peridotite = low serpentinized peridotite; (B,D) fresh sulfides and weathered sulfides, high-temperature and low-temperature hydrothermal deposits, hydrothermal fluid, hydrothermal and hydrogenetic Fe–Mn deposits; data come from the reference as Appendix A Figure A5. Chondrite-normalized values are given by [61], primitive mantle-normalized values are given by [71].
Minerals 11 00138 g0a2
Figure A3. Distribution range of major and trace elements on SWIR samples. (A) Distribution range of major and trace elements in high-temperature and weathered hydrothermal deposits on SWIR (89 samples), low-temperature hydrothermal deposits on SWIR (13 samples) and fresh hydrothermal sulfides on SWIR (13 samples), all elements are weighted in ppm, except S element in %; (B) distribution range of major and trace elements on SWIR metalliferous surface sediments (10 samples), SWIR biogenic sediments (120 samples) and SWIR volcanic sediments (11 samples), all elements are weighted in ppm, except S element in %; (C) distribution range of major and trace elements on SWIR 53° and 65° peridotite (58 samples), all elements are weighted in ppm, except S element in %; (D) distribution range of major and trace elements of basalt in 46°~52° E SWIR (165 samples). Data are from the reference as Appendix A Figure A5.
Minerals 11 00138 g0a3
Figure A4. Distribution range of REY in biogenesis-dominant sediments, host rocks, and hydrothermal deposits on SWIR. (A,C) The distribution range of REY in basalt is based on 211 samples from 46~52° E on SWIR, the distribution range of REY in biogenesis-dominant sediment is based on 130 samples from 46~52° E on SWIR, the distribution range of REY in peridotite is based on 58 samples from 53° E and 65° E on SWIR; (B,D) the distribution range of REY in basalt-hosted high-temperature hydrothermal deposits and seriously weathered sulfides is based on 18 samples from 46~52° E on SWIR, the distribution range of REY in basalt-hosted low-temperature hydrothermal deposits is based on 18 samples from 46~52° E on SWIR, the distribution range of REY in basalt-hosted fresh (weakly weathered) sulfides is based on 29 samples from 46~52° E on SWIR. Data are from the reference as Appendix A Figure A5. Chondrite-normalized values are given by [61].
Minerals 11 00138 g0a4
Figure A5. Distribution range of major and trace elements in samples besides SWIR samples. (A) Distribution range of major and trace elements in marine peridotite (133 samples) and basalt (225 samples), (B) distribution range of major and trace elements in basalt-hosted hydrothermal deposits (182 samples) and peridotite-hosted hydrothermal deposits (38 samples); (C) distribution range of major and trace elements in basalt-hosted biogenic sediment (142 samples), basalt-hosted volcanic sediments (9 samples), and basalt-hosted metalliferous surface sediments (64 samples); (D) distribution range of major and trace elements in peridotite-hosted biogenic sediment (152 samples), peridotite-hosted volcanic sediments (16 samples), and peridotite-hosted metalliferous surface sediments (10 samples).
Minerals 11 00138 g0a5
Figure A6. Distribution range of major and trace elements in basalt-hosted high-temperature hydrothermal deposits (177 samples) and basalt-hosted low-temperature hydrothermal deposits (182 samples). Data are from the reference as Appendix A Figure A5.
Minerals 11 00138 g0a6
Table A1. Collected REE data from other researchers.
Collected Data from Other Researchers⅀REE (ppm)LREE*/HREE*δCe(La/Sm)NδEuHREE (ppm)(Er/Lu)NReference
SWIR 49.6° E basalt60.61.360.980.500.929.041.07[14]
SWIR 50.5° E basalt25.01.260.950.591.174.531.03[93]
SWIR 51.7° E basalt42.561.040.960.400.968.421.09[76]
SWIR 55.7° E basalt57.11.690.890.611.128.361.01[76]
SWIR 63° E basalt131.53.360.941.371.2411.631.04[94]
N-MORB39.11.320.950.601.006.940.99[71]
E-MORB49.12.710.981.531.005.391.00[71]
OIB199.08.580.972.331.015.431.34[71]
Average continental crust86.95.490.962.880.975.021.12[61]
Lower continental crust-4.111.002.181.125.011.16[61]
Upper continental crust-9.540.954.200.635.151.10[61]
SWIR 57.26° E gabbro17.981.350.980.631.603.191.01[95]
SWIR 53° E peridotite0.670.54-2.340.830.250.68[75]
SWIR 65° E peridotite1.780.850.860.650.850.430.92[96]
Average depleted-MORB Mantle (DMM)-0.970.880.511.000.770.92[97]
2σ-depleted DMM-0.840.880.401.000.730.90[97]
2σ-enriched DMM-1.130.920.581.000.810.94[97]
Fresh Fe-rich sulfides in active Longqi Vent Field0.118.130.962.751.064 × 10−31.07[92]
Fresh Zn-rich sulfides in active Longqi Vent Field0.097.530.912.521.103.93 × 10−30.93[92]
Hydrothermal Fe–Mn deposits in active Longqi Vent Field2.182.990.801.615.450.230.74[14]
Hydrothermal Fe-rich oxides in active Longqi Vent Field5.583.410.662.232.340.441.12[92]
Hydrogenetic Fe–Mn deposits in 50.38–55.71°E SWIR1178.827.901.343.670.6237.5391.20[98]
Hydrothermal anhydrite from porphyry copper deposits in Sierrita Pit324.7912.950.753.83-15.29-[80]
Hydrothermal barite from Bulldog Mountain Vein in Creede1.3921.0---0.063-[80]
Hydrothermal galena from OH vein in Creede0.0542.07-6.29-0.016-[80]
Siderite from Tyrol in Austria0.9370.20-0.22-0.747-[80]
Fe–Si oxyhydroxide flocs (isolated from sulfides) from Lilliput Hydrothermal Field-0.820.60--1.58-[86]
Atlantic seawater in 3400 m depth-2.03-3.590.63-0.91[90]
Bottom seawater from Juan de Fuca Ridge------0.82[91]
Average hydrothermal fluid-15.190.823.4815.13--[78]
Hydrothermal fluid of TAG black smoker-9.111.001.919.13-1.71[78]
Hydrothermal fluid of TAG white smoker-40.510.825.98127.16-1.51[78]
Monospecific planktonic foraminifera from Atlantic Ocean-4.430.553.880.690.0471.05[99]
Hydrothermal nontronite from TAG-8.560.72-5.420.061.00[86]
Fresh sulfides (δCe = 0.96) in peridotite-hosted Rainbow Vent Field0.94-0.96-1.180.010.77[10]
Weathered sulfides (δCe = 0.63~0.70, average 0.67) in Rainbow Vent Field24.34-0.67-3.020.141.03[10]
Fresh sulfides (δCe = 0.95) in basalt-hosted TAG Vent Field1.51-0.95-1.400.020.57[100,101]
Weathered sulfides (δCe = 0.43~0.89, average 0.57) in TAG Vent Field1.43-0.57-2.030.0340.57[100,101]
Fresh sulfides (δCe = 1.01) in peridotite-hosted Kairei Vent Field-9.811.01--0.06-[102]
Weathered sulfides (δCe = 0.50) in peridotite-hosted Kairei Vent Field-5.110.50--0.17-[102]
Talc from peridotite-hosted talc deposits in the southern part of the Sivas Basin--0.60--0.0692.04[103]
Serpentine from peridotite-hosted talc deposits in the southern part of the Sivas Basin-2.180.93--0.1290.77[103]
Smectite derived from basaltic debris alteration in Ross Sea-1.551.03--2.6250.93[104]
Hydrothermal fluid from peridotite-hosted Logatchev Vent Field-5.260.65----[69]
Hydrothermal fluid from peridotite-hosted Rainbow Vent Field-8.520.35----[69]
Hydrothermal fluid from basalt-hosted Snake Pit Vent Field-2.371.01----[90]
Hydrothermal fluid from basalt-hosted TAG Vent Field-2.390.80----[90]
Note: chondrite-normalized values are given by [61].
References are as follows: basalt-hosted biogenic sediments (SWIR, [5,12,13,28,65]; peridotite-hosted biogenic sediments (Saldanha Vent Field, [11]; Rainbow Vent Field, [4,11,105,106]; basalt-hosted volcanic sediments (SWIR, [65]; peridotite-hosted volcanic sediments (Saldanha Vent Field, [11]; basalt-hosted metalliferous surface sediments (Eastern SWIR, [107]; Longqi Vent Field, [13]; Endeavour Segment, Juan de Fuca Ridge, [3]; East Pacific Rise, [50]; peridotite-hosted metalliferous surface sediments (Logatchev Vent Field, [108], Kairei Vent Field, [107]; Black Chimney (SWIR, [109,110]; Fresh hydrothermal sulfides (Longqi Vent Field Fe-rich sulfides, [92]; Longqi Vent Field Zn-rich sulfides, [92]; EPR 13° N Vent Field, [111]; basalt-hosted weathered hydrothermal sulfides (SWIR, [110,28]; Longqi Vent Field,[112,16]; Duanqiao Vent Field, [5,19,112]; Yuhuang Vent Field, [22]; Tianzuo Vent Field, [112]; Edmond Vent Field, [102,108,112]; EPR 13°N Vent Field, [112]; Mount Jourdanne Vent Field, [18,113]; Endeavour Segment, Juan de Fuca Ridge, [3]); peridotite-hosted weathered hydrothermal sulfides (Kairei Vent Field, [102,108,112]; Logatchev Vent Field, [108]; Rainbow Vent Field, [10,11,114]; Hydrothermal Fe-rich oxides (SWIR Longqi Vent Field, [92]; EPR 13° N, [115]; low-temperature hydrothermal deposits (SWIR, [28,92]; mid-Atlantic Ridge, [116]; Opal Chimney (SWIR, [109,110]; low-temperature hydrothermal Fe–Si–OH deposits (SWIR Longqi Vent Field, [117]; low-temperature hydrothermal Fe–Si–OH deposits (mid-Atlantic Ridge, [118]; low-temperature hydrothermal Fe–Si–Mn deposits (Pacmanus Hydrothermal Field, Eastern Manus Basin, [119]; Central and South Valu Fa Ridge, Lau Basin, [120]; low-temperature hydrothermal Fe–Si–Mn deposits (Pecos greenstone belt, New Mexico, [33]; peridotite (SWIR, [109]; Southern Mariana forearc, [121]; Logatchev Vent Field, [9]; SWIR 53° E, [68]; weakly serpentinized peridotite (SWIR 65° E, [96]; Medium serpentinized peridotite (SWIR 65° E, [96]; Seriously serpentinized peridotite (SWIR 65° E, [96]; Basalt (SWIR, [122,123,124,125]; Duanqiao Vent Field, [19,76,93,109,110]; Longqi Vent Field, [14,76,93,110,126,127]; Mount Jourdanne Vent Field, [113]; SWIR 63.9° E basalt, [110]; SAR, [126]; EPR, [122]; talc (Logatchev Vent Field, [9]; Rainbow Vent Field, [11]; southern part of the Sivas Basin, Turkey, [103]; serpentine (Logatchev Vent Field, [9]; Rainbow Vent Field, [11,4]; southern part of the Sivas Basin, Turkey, [103]; montmorillonite (smectite) altered from basalt (Ross Sea, Antarctica, [104]).

References

  1. Mitchell, N.C. Diffusion transport model for pelagic sediments on Mid-Atlantic Ridge. J. Geophys. Res. 1995, 100, 19991–20009. [Google Scholar] [CrossRef]
  2. Mascarenhas-Pereira, M.B.L.; Nath, B.N. Selective leaching studies of sediments from a seamount flank in the Central Indian Basin: Resolving hydrothermal, volcanogenic and terrigenous sources using major, trace and rare-earth elements. Mar. Chem. 2010, 121, 49–66. [Google Scholar] [CrossRef]
  3. Hrischeva, E.; Scott, S.D. Geochemistry and morphology of metalliferous sediments and oxyhydroxides from the Endeavour segment, Juan de Fuca Ridge. Geochim. Cosmochim. Acta 2007, 71, 3476–3497. [Google Scholar] [CrossRef]
  4. Cave, R.R.; German, C.R.; Thomson, J.; Nesbitt, R.W. Fluxes to sediments underlying the Rainbow hydrothermal plume at 36°14′ N on the Mid-Atlantic Ridge. Geochim. Cosmochim. Acta 2002, 66, 1905–1923. [Google Scholar] [CrossRef]
  5. Liao, S.; Tao, C.; Dias, Á.; Su, X.; Yang, Z.; Ni, J.; Liang, J.; Yang, W.; Liu, J.; Li, W.; et al. Surface sediment composition and distribution of hydrothermal derived elements at the Duanqiao-1 hydrothermal field, Southwest Indian Ridge. Mar. Geol. 2019, 416, 1–11. [Google Scholar] [CrossRef]
  6. Huang, R.; Sun, W.; Ding, X.; Wang, Y. Mechanism for serpentinization of mafic and ultramafic rocks and the potential of mineralization. Acta Petrol. Sin. 2013, 29, 4336–4348, (In Chinese with English abstract). [Google Scholar]
  7. Zhou, H.; Dick, H.J.B. Thin crust as evidence for depleted mantle supporting the Marion Rise. Nature 2013, 494, 195–200. [Google Scholar] [CrossRef] [PubMed]
  8. Delacour, A.; Früh-Green, G.L.; Bernasconi, S.M.; Kelley, D.S. Sulfur in peridotites and gabbros at Lost City (30° N, MAR): Implications for hydrothermal alteration and microbial activity during serpentinization. Geochim. Cosmochim. Acta 2008, 72, 5090–5110. [Google Scholar] [CrossRef]
  9. Augustin, N.; Paulick, H.; Lackschewitz, K.S.; Eisenhauer, A.; Garbe-Schönberg, D.; Kuhn, T.; Botz, R.; Schmidt, M. Alteration at the ultramafic-hosted Logatchev hydrothermal field: Constraints from trace element and Sr-O isotope data. Geochem. Geophys. Geosyst. 2012, 13, 1–20. [Google Scholar] [CrossRef]
  10. Marques, A.F.A.; Barriga, F.; Chavagnac, V.; Fouquet, Y. Mineralogy, geochemistry, and Nd isotope composition of the Rainbow hydrothermal field, Mid-Atlantic Ridge. Miner. Depos. 2006, 41, 52–67. [Google Scholar] [CrossRef] [Green Version]
  11. Dias, Á.S.; Barriga, F.J. Mineralogy and geochemistry of hydrothermal sediments from the serpentinite-hosted Saldanha hydrothermal field (36 34′ N; 33 26′ W) at MAR. Mar. Geol. 2006, 225, 157–175. [Google Scholar] [CrossRef]
  12. Chen, Y.; Yu, B.; Su, X.; Yu, M. Mineralogical and geochemical characteristics of the calcareous sediments in Southwest Indian ridge. Geol. Sci. Technol. Inf. 2013, 32, 107–113, (In Chinese with English abstract). [Google Scholar]
  13. Liao, S.; Tao, C.; Li, H.; Zhang, G.; Liang, J.; Yang, W.; Wang, Y. Surface sediment geochemistry and hydrothermal activity indicators in the Dragon Horn area on the Southwest Indian Ridge. Mar. Geol. 2018, 398, 22–34. [Google Scholar] [CrossRef]
  14. Wang, Z.; Wu, G.; Han, C. Geochemical characteristics of hydrothermal deposits and basalts at 49.6° E on the Southwest Indian Ridge. J. Mar. Sci. 2014, 32, 64–73, (In Chinese with English abstract). [Google Scholar]
  15. Cao, H.; Sun, Z.; Liu, C.; Jiang, X.; Huang, W.; Xu, C.; Liu, L.; He, Y. Mineralogical composition and its significance of hydrothermal sulfides from the Longqi hydrothermal field on the Southwest Indian Ridge. Mar. Geol. Quat. Geol. 2018, 38, 179–192. [Google Scholar]
  16. Tao, C.; Li, H.; Huang, W.; Han, X.; Wu, G.; Su, X.; Zhou, N.; Lin, J.; He, Y.; Zhou, J. Mineralogical and geochemical features of sulfide chimneys from the 49°39′ E hydrothermal field on the Southwest Indian Ridge and their geological inferences. Chin. Sci. Bull. 2011, 56, 2828–2838. [Google Scholar] [CrossRef] [Green Version]
  17. Cao, K.; Wu, Z.; Sun, X.; Lin, X. Mineralogical and Geochemical characteristics of Al-rich Clays from the Longqi Hydrothermal Field, Southwest Indian Ridge. Rock Miner. Anal. 2018, 37, 607–618, (In Chinese with English abstract). [Google Scholar]
  18. Münch, U.; Lalou, C.; Halbach, P.; Fujimoto, H. Relict hydrothermal events along the super-slow Southwest Indian spreading ridge near 63°56′ E—Mineralogy, chemistry and chronology of sulfide samples. Chem. Geol. 2001, 177, 341–349. [Google Scholar] [CrossRef]
  19. Yang, W. Study of Hydrothermal Mineralization of Duanqiao Hydrothermal Field in Southwest Indian Ridge. Ph.D. Thesis, Zhejiang University, Hangzhou, China, 2017; pp. 32–108, (In Chinese with English abstract). [Google Scholar]
  20. Münch, U.; Halbach, P.; Fujimoto, H. Sea-floor hydrothermal mineralization from the Mt. Jourdanne, Southwest Indian Ridge. JAMSTEC J. Deep Sea Res. 2000, 16, 125–132. [Google Scholar]
  21. Wang, Y.; Sun, X.; Wu, Z.; Deng, X.; Xu, L.; Liang, Y. A preliminary study on the characteristics of Fe-Cu-Zn isotopic composition of polymetallic sulfides from the hydrothermal field on SWIR. Acta Mineral. Sin. 2013, 2, 683. (In Chinese) [Google Scholar]
  22. Liao, S.; Tao, C.; Li, H.; Barrigac, F.J.A.S.; Liang, J.; Yang, W.; Yu, J.; Zhu, C. Bulk geochemistry, sulfur isotope characteristics of the Yuhuang-1 hydrothermal field on the ultraslow-spreading Southwest Indian Ridge. Ore Geol. Rev. 2018, 96, 13–27. [Google Scholar] [CrossRef]
  23. Wang, Y.; Wu, Z.; Sun, X.; Deng, X.; Guan, Y.; Xu, L.; Huang, Y.; Cao, K. He-Ar-S Isotopic compositions of polymetallic sulphides from hydrothermal vent fields along the ultraslow-spreading Southwest Indian Ridge and their geological implications. Minerals 2018, 8, 512. [Google Scholar] [CrossRef] [Green Version]
  24. Wang, Y.; Sun, X.; Wu, Z.; Deng, X.; Dai, Y.; Lin, Z. The enrichment characteristic and mechanism of gold-silver minerals in submarine hydrothermal sulfides from the ultra-slow spreading SWIR. Spectrosc. Spectr. Anal. 2014, 34, 3327–3332, (In Chinese with English abstract). [Google Scholar]
  25. Yang, W.; Zhang, X.; Chen, M.; Qiu, Y. Unusually low 234Th in a hydrothermal effluent plume over the Southwest Indian Ridge. Geochem. Geophys. Geosyst. 2016, 17, 3815–3824. [Google Scholar] [CrossRef]
  26. Zhou, J. Stable Carbon and Oxygen Isotopic Compositions of Biogenic Shells from the Southwest Indian Ridge and Santa Monica Basin. Master’s Thesis, Institute of Oceanology, Chinese Academy of Sciences, Qingdao, China, 2012; pp. 23–44, (In Chinese with English abstract). [Google Scholar]
  27. Zhang, X.; Zhang, W.; Tian, Y.; Sun, X.; Fan, D. Grain size composition of biogenic sediments in Southwest Indian Ridge and its influence factors. Trans. Oceanol. Limnol. 2016, 3, 39–45, (In Chinese with English abstract). [Google Scholar]
  28. Pan, A.; Yang, Q.; Zhou, H.; Ji, F.; Wang, H.; Pancost, R.D. Geochemical impacts of hydrothermal activity on surface deposits at the Southwest Indian Ridge. Deep Sea Res. Part I Oceanogr. Res. Pap. 2018, 139, 1–13. [Google Scholar] [CrossRef] [Green Version]
  29. Agarwal, D.; Roy, P.; Prakash, L.; Kurian, P.J. Hydrothermal signatures in sediments from eastern Southwest Indian Ridge 63° E to 68° E. Mar. Chem. 2020, 218, 103732. [Google Scholar] [CrossRef]
  30. Pan, A.; Yang, Q.; Zhou, H.; Ji, F.; Wang, H.; Pancost, R.D. A diagnostic GDGT signature for the impact of hydrothermal activity on surface deposits at the Southwest Indian Ridge. Org. Geochem. 2016, 99, 90–101. [Google Scholar] [CrossRef] [Green Version]
  31. Lei, J.; Chu, F.; Yu, X.; Li, X.; Tao, C. Lipid biomarkers reveal microbial communities in hydrothermal chimney structures from the 49.6°E hydrothermal vent field at the Southwest Indian Ocean Ridge. Geomicrobiol. J. 2016, 34, 557–566. [Google Scholar] [CrossRef]
  32. Lei, J.; Chu, F.; Yu, X.; Li, X.; Tao, C.; Ge, Q. Composition and genesis implications of hydrocarbons in 49.6°E hydrothermal area, Southwest Indian Ocean Ridge. Earth Sci. Front. 2015, 22, 281–290, (In Chinese with English abstract). [Google Scholar]
  33. Slack, J.F.; Grenne, T.; Bekker, A. Seafloor-hydrothermal Si-Fe-Mn exhalites in the Pecos greenstone belt, New Mexico, and the redox state of ca. 1720 Ma deep seawater. Geosphere 2009, 5, 302–314. [Google Scholar] [CrossRef] [Green Version]
  34. Hein, J.R.; Schulz, M.S.; Dunham, R.E.; Stern, R.J.; Bloomer, S.H. Diffuse flow hydrothermal manganese mineralization along the active Mariana and southern Izu-Bonin arc system, western Pacific. J. Geophys. Res. 2008, 113, B08S14. [Google Scholar] [CrossRef] [Green Version]
  35. Rubin, K.H. Mid-ocean ridge magmatism and volcanism. In Encyclopedia of Marine Geosciences; Harff, J., Meschede, M., Petersen, S., Thiede, J., Eds.; Springer: Dordrecht, The Netherlands, 2014; pp. 1–21. [Google Scholar]
  36. Sauter, D.; Cannat, M.; Meyzen, C.; Bezos, A.; Patriat, P.; Humler, E.; Debayle, E. Propagation of a melting anomaly along the ultraslow Southwest Indian Ridge between 46° E and 52°20′ E: Interaction with the Crozet hotspot? Geophys. J. Int. 2009, 179, 687–699. [Google Scholar] [CrossRef] [Green Version]
  37. Muller, M.R.; Minshull, T.A.; White, R.S. Segmentation and melt supply at the Southwest Indian Ridge. Geology 1999, 27, 867–870. [Google Scholar] [CrossRef]
  38. Zhang, T.; Lin, J.; Gao, J. Interactions between hotspots and the Southwest Indian Ridge during the last 90 Ma: Implications on the formation of oceanic plateaus and intra-plate seamounts. Sci. China Earth Sci. 2010, 54, 1177–1188. [Google Scholar]
  39. Zhang, T.; Lin, J.; Gao, J. Magmatism and tectonic processes in Area A hydrothermal vent on the Southwest Indian Ridge. Sci. China Earth Sci. 2013, 56, 2186–2197. [Google Scholar] [CrossRef]
  40. Bach, W.; Banerjee, N.R.; Dick, H.J.B.; Baker, E.T. Discovery of ancient and active hydrothermal systems along the ultra-slow spreading southwest Indian ridge 10°–16° E. Geochem. Geophys. Geosyst. 2002, 3, 1–14. [Google Scholar] [CrossRef]
  41. Tao, C.; Wu, G.; Ni, J.; Zhao, H.; Su, X.; Zhou, N.; Li, J.; Chen, Y.J.; Cui, R.; Deng, X.; et al. New hydrothermal fields found along the SWIR during the Legs 5–7 of the Chinese DY115-20 expedition. In Proceedings of the American Geophysical Union, Fall Meeting, San Francisco, CA, USA, 13–18 December 2009. [Google Scholar]
  42. Tao, C.; Lin, J.; Guo, S.; John Chen, Y.; Wu, G.; Han, X.; German, C.R.; Yoerger, D.R.; Zhou, N.; Li, H.; et al. First active hydrothermal vents on an ultraslow-spreading center: Southwest Indian Ridge. Geology 2012, 40, 47–50. [Google Scholar]
  43. Tao, C.; Li, H.; Jin, X.; Zhou, J.; Wu, T.; He, Y.; Deng, X.; Gu, C.; Zhang, G.; Liu, W. Seafloor hydrothermal activity and polymetallic sulfide exploration on the southwest Indian ridge. Chin. Sci. Bull. 2014, 59, 2266–2276. [Google Scholar] [CrossRef]
  44. Liao, G.; Zhou, B.; Liang, C.; Zhou, H.; Ding, T.; Yuan, W.; Dong, C. Moored observation of abyssal flow and temperature near a hydrothermal vent on the Southwest Indian Ridge. J. Geophys. Res. Oceans. 2015, 121, 836–860. [Google Scholar] [CrossRef] [Green Version]
  45. Mantyla, A.W.; Reid, J.L. On the origins of deep and bottom waters of the Indian Ocean. J. Geophy. Res. 1995, 100, 2417–2439. [Google Scholar] [CrossRef]
  46. Georgen, J.E.; Kurz, M.D.; Dick, H.J.B.; Lin, J. Low 3He/4He ratios in basalt glasses from the western Southwest Indian Ridge (10°–24° E). Earth Planet. Sci. Lett. 2003, 206, 509–528. [Google Scholar] [CrossRef]
  47. Mendel, V.; Sauter, D.; Parson, L.; Vanney, J.R. Segmentation and morphotectonic variations along a super slow-spreading center: The southwest Indian ridge (57° E–70° E). Mar. Geophys. Res. 1997, 19, 505–533. [Google Scholar] [CrossRef]
  48. Tao, C.; Seyfried, W.E.; Lowell, R.P.; Liu, Y.; Liang, J.; Guo, Z.; Ding, K.; Zhang, H.; Liu, J.; Qiu, L.; et al. Deep high-temperature hydrothermal circulation in a detachment faulting system on the ultra-slow spreading ridge. Nat. Commun. 2020, 11, 1300. [Google Scholar] [CrossRef] [Green Version]
  49. Cannat, M.; Sauter, D.; Mendel, V.; Ruellan, E.; Okino, K.; Escartin, J.; Combier, V.; Baala, M. Modes of seafloor generation at a melt-poor ultraslow-spreading ridge. Geology 2006, 34, 605–608. [Google Scholar] [CrossRef]
  50. Boström, K.; Peterson, M.N.A.; Joensuu, O.; Fisher, D.E. Aluminum-poor ferro-manganoan sediments on active oceanic ridges. J. Geophys. Res. Atmos. 1969, 74, 3261–3270. [Google Scholar] [CrossRef]
  51. Banerjee, R.; Dick, J.B.H.; Wolfgang, B.; Baker, E.T. Discovery of peridotite-hosted hydrothermal deposits along the ultraslow-spreading Southwest Indian Ridge. In Proceedings of the Geological Society of America Annual Meeting, Boston, MA, USA, 5–8 November 2001. [Google Scholar]
  52. Perritt, S.; Watkeys, M.K. The effect of environmental controls on the metal content in ferromanganese crusts and nodules from the Mozambique Ridge and in the Mozambique Basin, southwestern Indian Ocean. S. Afr. J. Geol. 2007, 110, 295–310. [Google Scholar]
  53. Templeton, A.S.; Knowles, E.J.; Eldridge, D.L.; Arey, B.W.; Dohnalkova, A.C.; Webb, S.M.; Bailey, B.E.; Tebo, B.M.; Staudigel, H. A seafloor microbial biome hosted within incipient ferromanganese crusts. Nat. Geosci. 2009, 2, 872–876. [Google Scholar]
  54. Oufi, O.; Cannat, M.; Horen, H. Magnetic properties of variably serpentinized abyssal peridotites. J. Geophys. Res. 2002, 107, 2095–2115. [Google Scholar] [CrossRef]
  55. Bach, W.; Paulick, H.; Garrido, C.J.; Ildefonse, B.; Meurer, W.P.; Humphris, S.E. Unraveling the sequence of serpentinization reactions: Petrography, mineral chemistry, and petrophysics of serpentinites from MAR 15° N (ODP Leg 209, Site 1274). Geophys. Res. Lett. 2006, 33, L13306. [Google Scholar] [CrossRef] [Green Version]
  56. Malvoisin, B.; Carlut, J.; Brunet, F. Serpentinization of oceanic peridotites: A high-sensitivity method to monitor magnetite production in hydrothermal experiments. J. Geophys. Res. 2012, 117, B01104. [Google Scholar] [CrossRef]
  57. Frost, B.R.; Beard, J.S. On silica activity and serpentinization. J. Petrol. 2007, 48, 1351–1368. [Google Scholar] [CrossRef] [Green Version]
  58. Melekestseva, I.Y.; Tret’Yakov, G.A.; Nimis, P.; Yuminov, A.M.; Maslennikov, V.V.; Maslennikova, S.P.; Kotlyarov, V.A.; Beltenev, V.E.; Danyushevsky, L.V.; Large, R. Barite-rich massive sulfifides from the Semenov-1 hydrothermal fifield (MidAtlantic Ridge, 13°30.87′ N): Evidence for phase separation and magmatic input. Mar. Geol. 2014, 349, 37–54. [Google Scholar] [CrossRef]
  59. Fouquet, Y.; Cambon, P.; Etoubleau, J.; Charlou, J.L.; OndréAs, H.; Barriga, F.J.A.S.; Cherkashov, G.; Semkova, T.; Poroshina, I.; Bohn, M.; et al. Geodiversity of hydrothermal processes along the MidAtlantic Ridge-Ultramafific-hosted mineralization: A new type of oceanic Cu-Zn-Co-Au volcanogenic massive sulfifide deposit. In Diversity of Hydrothermal Systems on Slow Spreading Ocean Ridges; Rona, P.A., Devey, C.W., Dyment, J., Murton, B.J., Eds.; American Geophysical Union: Washington, DC, USA, 2010; p. 440. [Google Scholar]
  60. McLennan, S.M. Weathering and global denudation. J. Geol. 1993, 101, 295–303. [Google Scholar] [CrossRef]
  61. Taylor, S.R.; McLennan, S.M. The Continental Crust: Its Composition and Evolution; Blackwell Scientific Publication: Oxford, UK, 1985; p. 312. [Google Scholar]
  62. Haskin, L.A.; Wildeman, T.R.; Haskin, M.A. An accurate procedure for the determination of the rare earths by neutron activation. J. Radioanal. Chem. 1968, 4, 337–348. [Google Scholar] [CrossRef]
  63. Bischoff, J.L.; Piper, D.Z. Marine Geology and Oceanography of the Pacific Manganese Nodule Province; Plenum Press: New York, NY, USA, 1979; pp. 397–436. [Google Scholar]
  64. Dugdale, R.C.; Wilkerson, F.P.; Minas, H.J. The role of a silicate pump in driving new production. Deep Sea Res. Part I Oceanogr. Res. Pap. 1995, 42, 697–719. [Google Scholar] [CrossRef]
  65. Huang, D.; Zhang, X.; Zhang, G.; Tao, C.; Li, H. Geochemical characteristics of sediments in southwest Indian ridge 48.6°–51.7°E. Geol. Sci. Technol. Inf. 2016, 35, 22–29, (In Chinese with English abstract). [Google Scholar]
  66. Li, Z.; Chu, F.; Jin, L.; Li, X.; Dong, Y.; Chen, L.; Zhu, J. Major and trace element composition of surface sediments from the Southwest Indian Ridge: Evidence for the incorporation of a hydrothermal component. Acta Oceanol. Sin. 2016, 35, 101–108. [Google Scholar]
  67. Grant, H.L.J.; Hannington, M.D.; Petersen, S.; Frische, M.; Fuchs, S.H. Constraints on the behavior of trace elements in the actively-forming TAG deposit, Mid-Atlantic Ridge, based on LA-ICP-MS analyses of pyrite. Chem. Geol. 2018, 498, 45–71. [Google Scholar]
  68. Chen, L.; Chu, F.; Zhu, J.; Dong, Y.; Yu, X.; Li, Z.; Tang, L. Major and trace elements of abyssal peridotites: Evidence for melt refertilization beneath the ultraslow-spreading Southwest Indian Ridge (53° E segment). Int. Geol. Rev. 2015, 57, 1715–1734. [Google Scholar] [CrossRef]
  69. Schmidt, K.; Koschinsky, A.; Garbe-Schönberg, D.; de Carvalho, L.M.; Seifert, R. Geochemistry of hydrothermal fluids from the ultramafic-hosted Logatchev hydrothermal field, 15° N on the Mid-Atlantic Ridge: Temporal and spatial investigation. Chem. Geol. 2007, 242, 1–21. [Google Scholar] [CrossRef]
  70. Cao, H.; Sun, Z.; Liu, C.; Jiang, X.; He, Y.; Huang, W.; Shang, L.; Wang, L.; Zhang, X.; Geng, W.; et al. The metallogenic mechanism and enlightenment of hydrothermal sulfide from the ultramafic-hosted hydrothermal systems at ultra-slow spreading ridge. Acta Oceanol. Sin. 2018, 90, 61–75. [Google Scholar]
  71. Sun, S.; McDonough, W.F. Chemical and isotopic systematics of oceanic basalts: Implications for mantle composition and processes. Geol. Soc. London Spec. Publ. 1989, 42, 313–345. [Google Scholar] [CrossRef]
  72. Golightly, J.P.; Arancibia, O.N. The chemical composition and infrared spectrum of nickel- and iron-substituted serpentine from a nickeliferous laterite profile, Soroako, Indonesia. Can. Mineral. 1979, 17, 719–728. [Google Scholar]
  73. Mével, C. Serpentinization of abyssal peridotites at mid-ocean ridges. Collect. C. R. Geosci. 2003, 335, 825–852. [Google Scholar]
  74. Kodolányi, J.; Pettke, T.; Spandler, C.; Kamber, B.S.; Gméling, K. Geochemistry of ocean floor and fore-arc serpentinites: Constraints on the ultramafic input to subduction zones. J. Petrol. 2012, 53, 235–270. [Google Scholar] [CrossRef] [Green Version]
  75. Chen, L. Element Geochemistry of Peridotite from the Southwest Indian Ridge: Implications for Mantle Dynamics. Ph.D. Thesis, Zhejiang University, Hangzhou, China, 2016; pp. 32–67, (In Chinese with English abstract). [Google Scholar]
  76. Li, W. Petrogeochemical Characteristics of Basalts from Southwest Indian Ridge: Implications for Magmatic Processes at Ultra-Slow Spreading Ridge. Ph.D. Thesis, China University of Geosciences, Wuhan, China, 2017; pp. 38–76, (In Chinese with English abstract). [Google Scholar]
  77. Alt, J.C. The chemistry and sulfur isotope composition of massive sulfide and associated deposits on Green Seamount, eastern Pacific. Econ. Geol. 1988, 83, 1026–1033. [Google Scholar] [CrossRef]
  78. Mitra, A.; Elderfield, H.; Greaves, M. Rare earth elements in submarine hydrothermal fluids and plumes from the Mid-Atlantic Ridge. Mar. Chem. 1994, 46, 217–235. [Google Scholar] [CrossRef]
  79. Terakado, Y.; Fujitani, T. Behavior of the rare earth elements and other trace elements during interactions between acidic hydrothermal solutions and silicic volcanic rocks, southwestern Japan. Geochim. Cosmochim. Acta 1998, 62, 1903–1917. [Google Scholar] [CrossRef]
  80. Morgan, J.W.; Wandless, G.A. Rare earth element distribution in some hydrothermal minerals: Evidence for crystallographic control. Geochim. Cosmochim. Acta 1980, 44, 973–980. [Google Scholar] [CrossRef]
  81. Seyler, M.; Lorand, J.P.; Toplis, M.J.; Godard, G. Asthenospheric metasomatism beneath the mid-ocean ridge: Evidence from depleted abyssal peridotites. Geology 2004, 32, 301–304. [Google Scholar] [CrossRef] [Green Version]
  82. Mahoney, J.; Roex, A.P.L.; Peng, Z.; Fisher, R.L.; Natland, J.H. Southwestern limits of Indian ocean ridge mantle and the origin of low 206Pb/204Pb mid-ocean ridge basalt: Isotope systematics of the central southwest Indian ridge (17°–50° E). J.Geophys. Res. Solid Earth 1992, 97, 19771–19790. [Google Scholar] [CrossRef]
  83. Escrig, S.; Capmas, F.; Dupré, B.; Allègre, C.J. Osmium isotopic constraints on the nature of the DUPAL anomaly from Indian mid-ocean-ridge basalts. Nature 2004, 431, 59–63. [Google Scholar] [CrossRef]
  84. Meyzen, C.M.; Ludden, J.N.; Humler, E.; Luais, B.; Toplis, M.J.; Mével, C.; Storey, M. New insights into the origin and distribution of the DUPAL isotope anomaly in the Indian Ocean mantle from MORB of the Southwest Indian Ridge. Geochem. Geophys. Geosyst. 2005, 6, 145–160. [Google Scholar] [CrossRef]
  85. Wang, W.; Chu, F.; Zhu, J.; Dong, Y.; Yu, X.; Chen, L.; Li, Z. Mantle melting beneath the Southwest Indian Ridge: Signals from clinopyroxene in abyssal peridotites. Acta Oceanol. Sin. 2013, 32, 50–59. [Google Scholar] [CrossRef]
  86. Dekov, V.M.; Kamenov, G.D.; Stummeyer, J.; Thiry, M.; Savelli, C.; Shanks, W.C.; Fortin, D.; Kuzmann, E.; Vértes, A. Hydrothermal nontronite formation at Eolo Seamount (Aeolian volcanic arc, Tyrrhenian Sea). Chem. Geol. 2007, 245, 103–119. [Google Scholar] [CrossRef]
  87. Humphris, S.E. Rare earth element composition of anhydrite: Implications for deposition and mobility within the TAG hydrothermal mound. Proc. ODP Sci. Results 1998, 158, 143–159. [Google Scholar]
  88. De Baar, H.J.W.; Bacon, M.P.; Brewer, P.G.; Bruland, K.W. Rare earth elements in the Pacific and Atlantic Oceans. Geochim. Cosmochim. Acta 1985, 49, 1943–1959. [Google Scholar]
  89. Elderfield, H.; Pagett, R. Rare earth elements in ichthyoliths: Variations with redox conditions and depositional environment. Sci. Total Environ. 1986, 49, 175–197. [Google Scholar] [CrossRef]
  90. Douville, E.; Bienvenu, P.; Charlou, J.L.; Donval, J.P.; Fouquet, Y.; Appriou, P.; Gamo, T. Yttrium and rare earth elements in fluids from various deep-sea hydrothermal systems. Geochim. Cosmochim. Acta 1999, 63, 627–643. [Google Scholar] [CrossRef]
  91. Wheat, C.G.; Mottl, M.J.; Rudnicki, M. Trace element and REE composition of a low-temperature ridge-flank hydrothermal spring. Geochim. Cosmochim. Acta 2002, 66, 3693–3705. [Google Scholar] [CrossRef]
  92. Ye, J. Mineralization of Polymetallic Sulfides on Ultra-Slow Spreading Southwest Indian Ridge at 49.6° E. Ph.D. Thesis, Graduate University of Chinese Academy of Sciences, Qingdao, China, 2010; pp. 47–63, (In Chinese with English abstract). [Google Scholar]
  93. Yu, M. Petrology and Geochemistry Differences of MORB and Their Significance between Fast and Slow Spreading Ridge. Ph.D. Thesis, China University of Geosciences, Beijing, China, 2013; pp. 26–85, (In Chinese with English abstract). [Google Scholar]
  94. Cao, H. Mineralization of Hydrothermal Sulfide on the Southwest and Central Indian Ridge. Ph.D. Thesis, China University of Ocean, Qingdao, China, 2015; pp. 27–89, (In Chinese with English abstract). [Google Scholar]
  95. Jin, Y. An Approach to the Gabbros from the Upper Part of ODP 735B Hole at the Southwest Indian Ridge. Ph.D. Thesis, China University of Geosciences, Beijing, China, 2013; pp. 54–79, (In Chinese with English abstract). [Google Scholar]
  96. Zeng, Z.; Wang, Q.; Wang, X.; Chen, S.; Yin, X.; Li, Z. Geochemistry of abyssal peridotites from the super slow-spreading Southwest Indian Ridge near 65° E: Implications for magma source and seawater alteration. J. Earth Syst. Sci. 2012, 121, 1317–1336. [Google Scholar] [CrossRef] [Green Version]
  97. Workman, R.K.; Hart, S.R. Major and trace element composition of the depleted MORB mantle (DMM). Earth Planet. Sci. Lett. 2005, 231, 53–72. [Google Scholar] [CrossRef]
  98. Yu, Z. Research on Geochemistry and Mineralogy of Co-rich crust from the Southwest Indian Ridge. Ph.D. Thesis, China University of Ocean, Qingdao, China, 2013; pp. 26–76, (In Chinese with English abstract). [Google Scholar]
  99. Palmer, M.R. Rare earth elements in foraminifera tests. Earth Planet. Sci. Lett. 1985, 73, 285–298. [Google Scholar]
  100. Zeng, Z.; Zhai, S.; Zhao, Y.; Qin, Y. Rare earth element geochemistry of hydrothermal sediment from the TAG hydrothermal field, mid-Atlantic Ridge. Mar. Geol. Quat. Geol. 1999, 19, 59–66, (In Chinese with English abstract). [Google Scholar]
  101. Mills, R.A.; Elderfield, H. Rare earth element geochemistry of hydrothermal deposits from the active TAG Mound, 26°N Mid-Atlantic Ridge. Geochim. Cosmochim. Acta 1995, 59, 3511–3524. [Google Scholar] [CrossRef]
  102. Wang, Y. Comparison study of mineralization of Kairei and Edmond active hydrothermal fields in Central Indian Ridge. Ph.D. Thesis, Zhejiang University, Hangzhou, China, 2012; pp. 21–50, (In Chinese with English abstract). [Google Scholar]
  103. Yalcin, H.; Bozkaya, O. Mineralogy and geochemistry of Paleocene ultramafic- and sedimentary-hosted talc deposits in the southern part of the Sivas Basin, Turkey. Clays Clay Miner. 2006, 54, 333–350. [Google Scholar] [CrossRef]
  104. Setti, M.; Marinoni, L.; Lopez-Galindo, A. Mineralogical and geochemical characteristics (major, minor, trace elements and REE) of detrital and authigenic clay minerals in a Cenozoic sequence from Ross Sea, Antarctica. Clay Miner. 2004, 39, 405–421. [Google Scholar] [CrossRef]
  105. Chavagnac, V.; German, C.R.; Milton, J.A.; Palmer, M.R. Sources of REE in sediment cores from the Rainbow vent site (36°14′ N, MAR). Chem. Geol. 2005, 216, 329–352. [Google Scholar] [CrossRef]
  106. Dias, Á.S.; Früh-Green, G.L.; Bernasconi, S.M.; Barriga, F.J.A.S. Geochemistry and stable isotope constraints on high-temperature activity from sediment cores of the Saldanha hydrothermal field. Mar. Geol. 2011, 279, 128–140. [Google Scholar]
  107. German, C.R. Hydrothermal activity on the eastern SWIR (50°–70° E): Evidence from core-top geochemistry, 1887 and 1998. Geochem. Geophys. Geosyst. 2003, 4, 9102. [Google Scholar] [CrossRef]
  108. Peng, X.; Li, J.; Zhou, H.; Wu, Z.; Li, J.; Chen, S.; Yao, H. Characteristics and source of inorganic and organic compounds in the sediments from two hydrothermal fields of the Central Indian and Mid-Atlantic Ridges. J. Asian Earth Sci. 2011, 41, 355–368. [Google Scholar] [CrossRef]
  109. He, Y. Geochemistry of Modern Seafloor Hydrothermal System of the Southwest Indian Ridge. Master’s Thesis, China University of Geosciences, Beijing, China, 2011; pp. 26–36, (In Chinese with English abstract). [Google Scholar]
  110. Cao, H. Hydrothermal Mineralization and Geological and Geochemical Characteristics of SWIR. Master’s Thesis, China University of Ocean, Qingdao, China, 2010; pp. 22–53, (In Chinese with English abstract). [Google Scholar]
  111. Zeng, Z.; Chen, D.; Yin, X.; Wang, X.; Zhang, G.; Wang, X. Elemental and isotopic compositions of the hydrothermal sulfide on the East Pacific Rise near 13ºN. Sci. China Ser. D Earth Sci. 2009, 39, 1780–1794, (In Chinese with English abstract). [Google Scholar]
  112. Wu, Z. A Comparative Study on the Mineralization and Enrichment Mechanisms of Precious Metals in Southwest and Central Indian Ridge Hydrothermal Fields. Ph.D. Dissertation, Sun Yat-sen University of China, Guangzhou, China, 2014; pp. 46–66, (In Chinese with English abstract). [Google Scholar]
  113. Nayak, B.; Halbach, P.; Pracejus, B.; Münch, U. Massive sulfides of Mount Jourdanne along the super-slow spreading Southwest Indian Ridge and their genesis. Ore Geol. Rev. 2014, 63, 115–128. [Google Scholar]
  114. Marques, A.F.A.; Barriga, F.; Scott, S.D. Sulfide mineralization in an ultramafic-rock hosted seafloor hydrothermal system: From serpentinization to the formation of Cu-Zn-(Co)-rich massive sulfides. Mar. Geol. 2007, 245, 20–39. [Google Scholar] [CrossRef]
  115. Zeng, Z.; Wang, X.; Zhang, G.; Yin, X.; Chen, D.; Wang, X. Formation of Fe-oxyhydroxides from the East Pacific Rise near latitude 13°N: Evidence from mineralogical and geochemical data. Sci. China Ser. D-Earth Sci. 2008, 51, 206–215. [Google Scholar] [CrossRef]
  116. Bogdanov, Y.A.; Vikent’ev, I.V.; Lein, A.Y.; Bogdanova, O.Y.; Sagalevich, A.M.; Sivtson, A.V. Low-temperature hydrothermal deposits in the rift zone of the Mid-Atlantic Ridge. Geol. Ore Depos. 2008, 50, 119–134. [Google Scholar] [CrossRef]
  117. Peng, X.; Chen, S.; Zhou, H.; Zhang, L.; Wu, Z.; Li, J.; Li, J.; Xu, H. Diversity of biogenic minerals in low-temperature Si-rich deposits from a newly discovered hydrothermal field on the ultraslow spreading Southwest Indian Ridge. J. Geophys. Res. 2011, 116, G03030. [Google Scholar] [CrossRef] [Green Version]
  118. Dekov, V.M.; Petersen, S.; Garbe-Schönberg, C.D.; Kamenov, G.D.; Perner, M.; Kuzmann, E.; Schmidt, M. Fe-Si-oxyhydroxide deposits at a slow-spreading centre with thickened oceanic crust: The Lilliput hydrothermal field (9°33′ S, Mid-Atlantic Ridge). Chem. Geol. 2010, 278, 186–200. [Google Scholar]
  119. Zeng, Z.; Ouyang, H.; Yin, X.; Chen, S.; Wang, X.; Wu, L. Formation of Fe-Si-Mn oxyhydroxides at the PACMANUS hydrothermal field, Eastern Manus Basin: Mineralogical and geochemical evidence. J. Asian Earth Sci. 2012, 60, 130–146. [Google Scholar] [CrossRef]
  120. Sun, Z.; Zhou, H.; Yang, Q.; Sun, Z.; Bao, S.; Yao, H. Hydrothermal Fe-Si-Mn oxide deposits from the Central and South Valu Fa Ridge, Lau Basin. Appl. Geochem. 2011, 26, 1192–1204. [Google Scholar] [CrossRef]
  121. Wang, X.; Zeng, Z.; Liu, C.; Chen, J.; Yin, X.; Wang, X.; Chen, D.; Zhang, G.; Chen, S.; Li, K.; et al. Talc-bearing serpentinized peridotites from the southern Mariana forearc: Implications for aseismic character within subduction zones. Chin. J. Ocean. Limnol. 2009, 27, 667–673. [Google Scholar] [CrossRef]
  122. Li, M. Petrogeochemical Characteristics Comparison and Implications for Magmatic Processes of the MORBs between EPR and SWIR. Ph.D. Thesis, China University of Ocean, Qingdao, China, 2014; pp. 30–52, (In Chinese with English abstract). [Google Scholar]
  123. Yang, A.; Zhou, M.; Zhao, T.; Deng, X.; Qi, L.; Xu, J. Chalcophile elemental compositions of MORBs from the ultraslow-spreading Southwest Indian Ridge and controls of lithospheric structure on S-saturated differentiation. Chem. Geol. 2014, 382, 1–13. [Google Scholar] [CrossRef]
  124. Yang, A.; Zhao, T.; Zhou, M.; Deng, X.; Wang, G.; Li, J. Os isotopic compositions of MORBs from the ultra-slow spreading Southwest Indian Ridge: Constraints on the assimilation and fractional crystallization (AFC) processes. Lithos 2013, 179, 28–35. [Google Scholar] [CrossRef]
  125. Yang, A.; Zhao, T.; Zhou, M.; Deng, X. Isotopically enriched N-MORB: A new geochemical signature of off-axis plume-ridge interaction-a case study at 50°28′ E, Southwest Indian Ridge. J. Geophys. Res. 2016, 122, 191–213. [Google Scholar]
  126. Qi, Q. Petrogeochemical characteristics comparison and implications for magmatic process of the MORBs between SAR and SWIR. Master’s Thesis, China University of Ocean, Qingdao, China, 2015; pp. 12–30, (In Chinese with English abstract). [Google Scholar]
  127. Yu, X.; Dick, H.J.B. Plate-driven micro-hotspots and the evolution of the Dragon Flag melting anomaly, Southwest Indian Ridge. Earth Planet. Sci. Lett. 2020, 531, 1–15. [Google Scholar] [CrossRef]
Figure 1. Geotectonic setting, topographic features and sample locations of the study area. Satellite data are taken from Google Earth software, shot in 2015.
Minerals 11 00138 g001
Figure 2. SEM (plus EDS) images and photomicrographs of minerals in the samples: (A) pyrite had pittings and was surrounded by iron oxides (S32-14B); (B) framboidal pyrite: 7 μm diameter and composed of particulate pyrite ranging from 0.12~0.5 μm width (S32-14A); (C) chalcopyrite had smooth and clean surface, sphalerite contained 6.49% Fe and its crystalline phase was not so obvious to be identified (S32-14A); (D) pyrite and chalcopyrite were surrounded by iron oxides (S32-14C); (E) there were two stages of marcasite, marcasite (I) had allotriomorphic granular texture and was mostly like irregular corrosion remnants, marcasite (II) grew around marcasite (I) as its banding (S25-21); (F) there were two types of Fe–Cu sulfate, their crystalline morphology and relative contents of Fe and Cu were different, type (I): granular, 2 μm width, Fe% >Na%> Cu%, type (II): fibrous, 1 μm width, Cu% > Fe% > Mg% (S25-21); (G) serpentinized olivine: 700 μm length, iron oxide emerged as bands or fissures (S17-4); (H) serpentinized olivine: 275 μm width, parting development and divided into several isolated parts, more serious serpentinization emerged in the middle part and sporadic occurrence of iron oxide (S23-12); (I) altered diopside: 550 μm length, diopside alters into zeolite and more serious alteration emerges in the middle part (S7-7); (J) basalt debris: 400 μm width, 775 μm length, porphyritic texture, no obvious mineral alteration and relatively fresh (S37-21); (K) sepiolite: 4.4 mm length, white color, fibrous aggregate, the high-degree alteration product of serpentine or talc (S17-4); (L) single composition and almost biological shells (S52-2); (M) coccoliths: spiral, double-disc or ring shape, calcareous shell, 2~4 μm diameter (S15-2). Mineral abbreviations: Py, pyrite; Ccp, chalcopyrite; Sph, sphalerite; Icb, isocubanite; Mrc, marcasite; Fe–Cu–S–O, Fe–Cu sulfate; Srp, serpentine; Ol, olivine; Di, diopside; Zeo, zeolite; Hy, hypersthenes. Specific EDS spectra can be seen in Appendix A Figure A1.
Minerals 11 00138 g002
Figure 3. X-ray powder diffraction patterns of samples. (A) Hydrothermal-derived deposit; (B) volcanic sediment; (C,D) biogenic sediment. Some peaks were truncated because they were too high.
Minerals 11 00138 g003
Figure 4. Element composition of sediments on SWIR. (A) Distribution of major elements in each sample; (B) distribution of trace elements in each sample; (C) cluster analysis of major and trace elements in all samples.
Minerals 11 00138 g004
Figure 5. Al2O3 versus SiO2 of 120 biogenic sediments, from 46° E to 52° E, on SWIR. Data are from [5,13,25,28,65,66] and reference therein.
Minerals 11 00138 g005
Figure 6. Chondrite-normalized REE (rare earth element) patterns and primitive mantle-normalized trace element patterns of samples on SWIR. (A,B) Hydrothermal-derived deposit; (C,D) volcanic sediment; (E,F) biogenic sediment, chondrite-normalized values are given by [61], primitive mantle-normalized values are given by [71].
Minerals 11 00138 g006
Figure 7. Primitive mantle-normalized compatible element patterns of samples on SWIR. Primitive mantle-normalized values are given by [71].
Minerals 11 00138 g007
Figure 8. Cluster analysis of the samples and their major elements on SWIR. (A) All samples; (B) S32-14ABC; (C) S32-14ABC and S25-21; (D) S23-12, S17-4, and S7-7; (E) S23-12, S17-4, S7-7, and S37-21; (F) S29-16, S52-2, S15-2, S39-22, S28-17, and S6-1; (G) S29-16, S52-2, S15-2, S39-22, S28-17, S6-1, and S37-21; (H) S37-21, S29-16, S52-2, S15-2, S39-22, S28-17, S6-1, and S7-7; (I) S7-7, S37-21, S29-16, S52-2, S15-2, S39-22, S28-17, S6-1, and S23-12; (J) S7-7, S37-21, S29-16, S52-2, S15-2, S39-22, S28-17, S6-1, and S17-4; (K) S7-7, S37-21, S29-16, S52-2, S15-2, S39-22, S28-17, S6-1, and S32-14C; (L) S7-7, S37-21, S29-16, S52-2, S15-2, S39-22, S28-17, S6-1, and S25-21.
Minerals 11 00138 g008
Table 1. Sample locations and principal characteristics.
SampleLongitude (East)Latitude (South)Depth (m)Host Rock SystemSediment TypePrincipal Characteristic
40III-S6-146°58.056′38°42.953′2969BasaltBiogenicGray-white calcareous ooze
40IV-S28-1747°25.279′38°45.596′2699BasaltBiogenicGray-white calcareous ooze
22I-S52-248°6.567′38°33.898′2734BasaltBiogenicGray calcareous ooze
30III-S37-2148°51.198′37°59.508′2327BasaltMixture, biogenic + volcanicGray calcareous ooze with pyroclastic
30III-S39-2248°51.606′37°58.476′2040BasaltBiogenicWhite calcareous ooze
21VII-S29-1649°39.720′37°37.206′2367BasaltBiogenicWhite calcareous ooze with black Fe–Mn deposits
40IV-S7-749°43.763′37°55.361′1990BasaltVolcanicYellow-brown pyroclastic with calcareous ooze
20V-S32-14A50°28.030′37°39.477′1739BasaltHydrothermal-derivedRed-brown polymetallic deposit
20V-S32-14B50°28.030′37°39.477′1739BasaltHydrothermal-derivedRed-brown polymetallic deposit
20V-S32-14C50°28.030′37°39.477′1739BasaltMixture, hydrothermal-derived + biogenicReddish-brown polymetallic deposit with calcareous ooze
30III-S17-451°41.808′37°26.352′2122Basalt + peridotiteVolcanicYellow-brown pyroclastic with calcareous ooze
30III-S15-251°44.742′37°29.424′1868BasaltBiogenicWhite calcareous ooze
21VII-S23-1252°10.002′37°13.374′3879PeridotiteVolcanicBrown pyroclastic with gray calcareous ooze
20VII-S25-2163°32.484′27°57.042′3666PeridotiteHydrothermal-derivedGreen polymetallic deposit
Table 2. Composition of samples on Southwest Indian Ridge (SWIR).
SampleS6-1S28-17S39-22S15-2S52-2S29-16S37-21S7-7S17-4S23-12S32-14CS32-14BS32-14AS25-21
CalciteIVIVIVIVIVIVIIIIIIIIIIIIII---
Quartz (chert)IIIIIIIIIIIIIIIIIIIIIIIIIIIIIIIIIII
ApatiteIIIIIIIIIIII--------
Barite------II-IIIIIIIIII-
Gypsum--IIII---IIII-IIIIIIII
Kaolinite------IIIIIIIIV----
Zeolite------IIIV------
Montmorillonite-------IVIII-----
Nontronite-----I----IIIIII-
Serpentine--------IIIII---III
Chlorite-------II------
Talc-------IIIIII---II
Sepiolite--------IIII---II
Brucite-------IIIIII---II
Olivine--------IIII----
DiopsideIIIIIIII--IIIIIIIIIIII----
Augite----------II-II-
Hypersthene------IIIIIIII----
AlbiteII------IIII-IIII-
Anorthite--II--II----IIIII-
Volcanic glass--I--IIII-II-IIIIII-
Element sulfur----------IIIIIIIIIIV
Pyrite----------IVIVIV-
Chalcopyrite----------IVIVIV-
Marcasite----------IIIIIIIV
Isocubanite----------IIIIIIIV
Sphalerite----------IIIIII-
Bornite----------IIIIIIII
Pyrrhotite-------------II
Covellite----------IIIIIIII
Hematite------IIIIIIIIIIIIIIIIIIII
Magnetite-------IIIIIII---II
Goethite----------IIIIIIII
Chromite------IIIIIII----
Ferromanganese hydroxide-----II-IIIIIIIIIIIIIII
Manganite------IIII-II----
Azurite-------------II
Nantokite----------IIIIIIII
Ferritic opalIIIIIIIIVIIIIIIIIIIIIIVIVIVIV
Jarosite----------IIIIIIIIIIII
Note: “IV” could be detected or seen under a microscope or SEM (plus EDS) and abundant content, “III” could be detected or seen under a microscope or SEM (plus EDS), and moderate content, “II” could be detected or seen under a microscope or SEM (plus EDS) and minor content, “I” could be detected or seen under a microscope or SEM (plus EDS) and trace content, “-” could not be detected or seen under a microscope or SEM (plus EDS).
Table 3. Bulk-sediment major (wt %), trace (µg/g) and REY (µg/g) element contents of samples on SWIR.
CategoryHydrothermal-Derived DepositSurface Sediment
Hydrothermal-DerivedMixtureVolcanicMixtureBiogenic
Metal-RichMetalliferousNon-MetalliferousMetalliferousNon-Metalliferous
Sample25-2132-14A32-14B32-14C23-1217-47-737-2129-1652-215-239-2228-176-1
CaO (%)0.191.522.0112.3013.856.1910.6535.6049.9051.3052.5050.1051.7048.80
SiO24.8013.8015.5514.2530.3950.6344.7119.855.132.942.053.762.335.12
Al2O30.223.592.293.461.789.2115.305.851.320.760.490.890.601.34
TFe2O349.5043.0040.7033.706.868.709.255.471.110.490.670.840.620.91
K2O0.050.230.140.180.150.080.380.220.260.130.110.200.120.22
MgO1.941.140.791.9424.7017.057.533.310.530.310.370.440.320.51
MnO0.140.680.400.580.250.140.960.110.050.040.010.020.040.05
Na2O0.621.250.841.551.211.953.761.660.990.860.771.101.041.37
P2O50.330.720.660.750.080.020.090.070.090.040.030.050.030.07
TiO2<0.010.110.080.170.140.520.990.590.070.030.020.040.020.06
PbO0.010.140.120.040.010.010.010.010.010.010.01<0.010.010.01
CuO3.346.876.264.960.030.010.010.010.01<0.010.01<0.01<0.01<0.01
ZnO0.085.499.832.890.020.020.020.010.010.010.01<0.01<0.010.01
ClNDNDNDND0.760.090.150.560.790.650.470.880.670.93
SO3NDNDNDND0.550.090.080.310.310.210.500.280.260.33
LOI38.3519.5718.7913.3819.655.655.7926.8440.0542.7942.7642.0142.8440.87
Mo (μg/g)10989.089.362.92.041.027.050.220.330.120.590.050.150.13
Ba28.7479399527194.025.6105.0141.5504356193.5398199.0545
Cu>10,000>10,000>10,000>10,000305129.597.657.548.422.3129.539.421.537.1
Pb1351260111044513.63.48.710.27.13.115.73.47.64.2
Zn531>10,000>10,000>10,0001637210457981622211620
As69.824627720914.56.55.54.54.63.22.33.13.93.7
Sc0.63.82.85.08.423.231.115.22.51.91.31.91.62.2
Co62529721825190.641.751.723.112.15.26.05.56.55.9
Ni11030.523.840.21350364140.064.613.010.77.17.68.512.5
Cr1407037801890890250130188991816
U7.354.094.744.210.980.160.270.170.900.200.280.330.220.33
P1340315027903270400160430380430220190260190350
Th0.260.460.280.421.050.190.320.551.390.830.630.850.711.21
Sr26.9103.0109.5368424117.5164.0910152014251470168013801685
Mn91346102650377016801000703077834325793141277335
Nb0.50.80.60.71.90.51.51.21.40.80.50.80.71.2
Ta0.050.050.090.050.100.050.080.080.080.050.050.050.050.07
Zr11161219222066431810611814
Hf0.20.30.30.40.40.71.81.20.50.30.20.30.30.4
V1202752643036121424312420139161420
Rb1.64.53.03.44.81.56.64.810.75.84.06.54.48.4
Au0.938NDND0.100NDNDNDNDNDNDNDNDNDND
La (μg/g)1.76.64.35.54.71.02.94.07.85.74.56.44.58.0
Ce2.39.35.56.714.32.79.67.710.86.75.06.86.19.2
Pr0.41.400.861.121.170.381.231.201.681.210.921.360.911.73
Nd1.66.24.04.84.92.16.76.06.74.93.75.63.77.0
Sm0.411.441.041.091.140.872.351.771.380.960.751.150.761.43
Eu0.170.550.370.430.230.410.940.580.330.270.180.290.190.32
Gd0.391.801.141.401.231.083.462.201.491.080.961.250.811.57
Tb0.070.310.210.240.210.250.660.420.220.180.160.200.130.25
Dy0.42.051.331.571.251.694.362.781.421.171.041.200.861.53
Ho0.090.460.300.350.260.390.970.620.320.250.220.280.180.34
Er0.251.360.901.060.731.172.881.840.910.700.640.770.510.94
Tm0.040.210.140.170.110.170.420.270.140.100.100.120.080.14
Yb0.271.330.851.090.691.052.631.700.890.630.640.740.520.87
Lu0.040.220.130.180.110.160.410.270.130.100.100.110.080.14
Y2.413.89.212.06.79.225.117.011.28.38.510.36.912.0
Note: “<” means lower than the minimum test threshold, “>” means higher than the maximum test threshold, “ND” means no data. According to the index MSI (metalliferous sediment index) [50], samples were divided into three types: metal-rich (MSI < 10), metalliferous (10 < MSI < 40) and non-metalliferous (MSI > 40).
Table 4. The REY contents (ppm), characteristic parameters of samples on SWIR.
SampleS25-21S32-14AS32-14BS32-14CS23-12S17-4S7-7S37-21S29-16S52-2S15-2S39-22S28-17S6-1
⅀REE8.1333.2321.0725.7031.0313.4239.5131.3534.2123.9518.9126.2719.3333.46
LREE*/HREE*4.253.293.213.245.761.251.502.105.204.693.904.635.104.79
MSI0.405.994.207.1916.0945.0254.1946.4047.8055.3039.2346.9944.7053.82
HREE0.603.122.022.501.642.556.344.082.071.531.481.741.192.09
(Eu/Eu*)N1.281.041.031.060.591.291.010.900.700.810.650.740.740.65
(Ce/Ce*)N0.640.690.640.601.401.031.190.820.670.570.550.520.670.56
CaOtotal/
(LOI-SO3)
----0.731.111.871.341.261.201.241.201.211.20
Al/Mg0.0902.4942.2961.4130.0570.4281.6091.401.9731.9421.0491.6021.4852.081
Al/Si0.0540.3090.1750.2880.0700.2160.4070.3500.3060.3070.2840.2810.3060.311
Si/Al18.3643.2355.7153.46614.3704.6272.4602.8563.2713.2563.5213.5563.2683.216
(La:Sm)N2.612.882.603.182.600.720.781.423.563.743.783.503.733.52
(Er:Lu)N0.960.951.060.901.021.121.071.041.071.070.981.070.981.03
Fe/Mg32.9949.3065.5022.900.310.571.441.992.521.832.322.292.392.18
Mn/Ca0.7610.4480.1980.0500.0180.0220.0900.00310.00110.00080.00030.00040.00080.001
Fe/Ca266.66727.28219.5522.7990.4821.2830.8070.1490.0230.0100.0130.0170.0120.018
Si/Ca16.5055.9325.0540.7571.4345.3442.7430.3640.0670.0370.0260.0490.0290.069
Fe/Mn350.49360.95498.86854.49927.56058.1008.93347.55821.28312.84147.31239.00715.52418.209
Mg/Ca8.0830.5530.2990.1221.5422.2520.5620.0750.0090.0050.0060.0070.0050.008
SiO2(bio)%--------0.840.470.460.870.380.77
CaO(carbonate)/
(LOI-SO3)
------1.271.301.251.201.231.191.201.19
Na2O(NaCl)%------0.130.490.690.570.410.770.590.81
Na2O(non_NaCl)%------3.631.170.300.290.360.330.450.56
CaO(silicate)%------3.281.060.270.260.320.300.410.50
CaO(carbonate)%------7.2534.4549.5150.9852.1449.7351.2548.20
CaO(phosphate)%-----0.030.120.090.120.050.040.070.040.09
Mg/Si0.6060.1240.0760.2041.2190.5050.2530.2500.1550.1580.2710.1760.2060.149
Fe/Al142.927.6111.296.192.450.600.380.590.530.410.870.600.660.43
Ti/Al0.030.020.020.030.050.040.040.060.030.030.030.030.020.03
Ceanom-0.214-0.196-0.237-0.2500.123-0.0560.011-0.135-0.192-0.263-0.282-0.309-0.196-0.275
Note: “-” means could not be calculated for no satisfying the specific condition, MSI = [Al/(Al + Fe + Mn)]weight × 100%, LREE* = ∑(La~Eu)(μg/g), HREE* = ∑(Gd~Lu) (μg/g), HREE = ∑(Er~Lu) (μg/g), (Eu/Eu*)N = 2EuN/(SmN + GdN), (Ce/Ce*)N = 2CeN/(LaN + PrN), (Gd/Gd*)N = 2GdN/(EuN + TbN), (La:Sm)N = LaN/SmN, (Er:Lu)N = ErN/LuN, chondrite-normalized values are given by [61]; Ceanom = log10[3Cen/(2Lan + Ndn)], NASC-normalized values are given by [62].
Publisher’s Note: MDPI stays neutral with regard to jurisdictional claims in published maps and institutional affiliations.

