
Diagenetic Trends of Synthetic Reservoir Sandstone Properties Assessed by Digital Rock Physics


1
GFZ German Research Centre for Geosciences, Fluid Systems Modelling, Telegrafenberg, 14473 Potsdam, Germany
2
Institute of Geosciences, University of Potsdam, Karl-Liebknecht-Str. 24/25, 14476 Potsdam, Germany
*
Author to whom correspondence should be addressed.
Minerals 2021, 11(2), 151; https://0-doi-org.brum.beds.ac.uk/10.3390/min11020151
Submission received: 5 January 2021
/
Revised: 25 January 2021
/
Accepted: 29 January 2021
/
Published: 31 January 2021
(This article belongs to the Section Crystallography and Physical Chemistry of Minerals & Nanominerals)
Abstract
:Quantifying interactions and dependencies among geometric, hydraulic and mechanical properties of reservoir sandstones is of particular importance for the exploration and utilisation of the geological subsurface and can be assessed by synthetic sandstones comprising the microstructural complexity of natural rocks. In the present study, three highly resolved samples of the Fontainebleau, Berea and Bentheim sandstones are generated by means of a process-based approach, which combines the gravity-driven deposition of irregularly shaped grains and their diagenetic cementation by three different schemes. The resulting evolution in porosity, permeability and rock stiffness is examined and compared to the respective micro-computer tomographic (micro-CT) scans. The grain contact-preferential scheme implies a progressive clogging of small throats and consequently produces considerably less connected and stiffer samples than the two other schemes. By contrast, uniform quartz overgrowth continuously alters the pore space and leads to the lowest elastic properties. The proposed stress-dependent cementation scheme combines both approaches of contact-cement and quartz overgrowth, resulting in granulometric, hydraulic and elastic properties equivalent to those of the respective micro-CT scans, where bulk moduli slightly deviate by 0.8%, 4.9% and 2.5% for the Fontainebleau, Berea and Bentheim sandstone, respectively. The synthetic samples can be further altered to examine the impact of mineral dissolution or precipitation as well as fracturing on various petrophysical correlations, which is of particular relevance for numerous aspects of a sustainable subsurface utilisation.
1. Introduction
Digital rock physics (DRP) provides a powerful and flexible approach to study macroscopic rock behaviour based on a micro-scale description of reservoir rocks. The numerical core analysis comprises the computation of effective physical properties based on a highly resolved three-dimensional representation of the rock, which is generally obtained by micro-computer tomographic (micro-CT) imaging. Various processes can be simulated to calculate hydraulic [1,2], mechanical [3,4], electrical [5,6] or thermal [7,8] properties. The accuracy of the property prediction is restricted by the quality of the scanned grey-scale images. Micro-CT techniques can not entirely resolve the complex microstructural features, such as small pores, micro-cracks and grain-to-grain contacts [9,10]. Moreover, the image segmentation, which includes spatial filtering, noise removal and thresholding, contributes to the uncertainty in perfectly distinguishing grains from pores, which is a problem especially in less porous rocks [11]. Besides that, highly resolving micro-CT scanners are still not widely available and imaging is costly and time consuming.
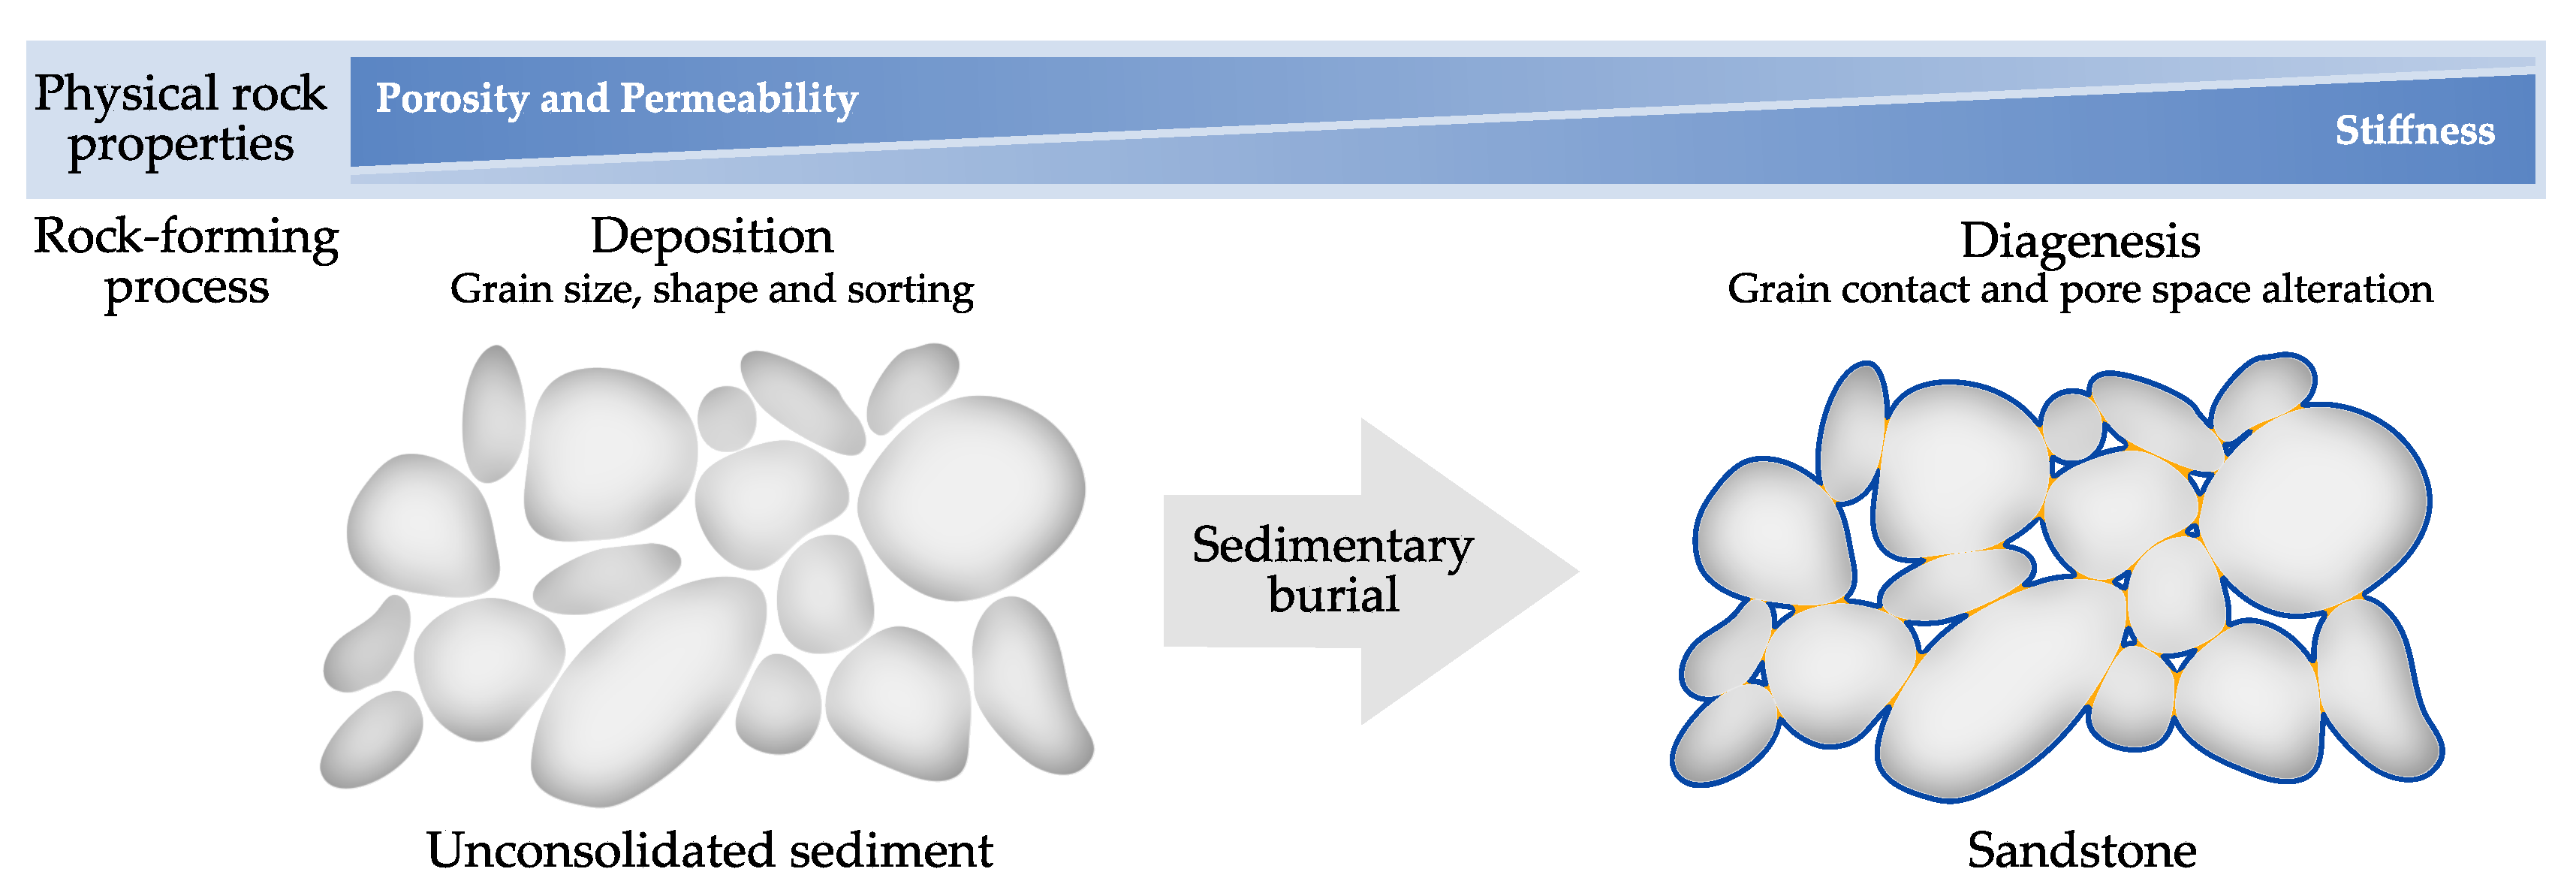
Generating synthetic granular rocks can overcome the aforementioned limitations at least for sandstones. In order to reconstruct a sample, which comprises the microstructural complexity of a natural sandstone, a process-based method can be applied. It includes the generation of an unconsolidated grain pack and its cementation, which geologically correspond to the processes of deposition and diagenesis (Figure 1).
Several analytical [12,13,14] and numerical [15,16,17] simulation approaches dealing with rock property prediction commonly simplify grains or pores by assuming spherical or ellipsoidal shapes. Nevertheless, idealised spherical particles do not depict the complex textural and structural characteristics of natural sediments regarding grain size, sorting and shape, reflecting the processes involved in sediment transport and deposition [18]. Only, a small number of pore-scale studies investigated the effect of non-spherical grain packs on permeability [19,20] or elastic properties [21,22]. Torksaya et al. [20] examined cemented sediments consisting of angular, ellipsoidal or spherical grains and found the best agreement with hydraulic laboratory measurements for angular grain shapes. Schneider et al. [22] modelled a sand core considering complex grain shapes and showed an excellent comparability with experimentally obtained P-wave moduli. Kerimov et al. [21] extensively investigated the effect of particle shapes on physical properties and demonstrated that the permeability reduces by up to 76% and bulk modulus increases by up to 66% for irregularly shaped particles compared to spherical grains. They applied a discrete element method (DEM) to simulate gravity-driven deposition of grains [23], which is also used in this study.
Post-depositional compaction and cementation result in successive lithification of unconsolidated sediments. These diagenetic processes systematically modify the microstructure of the rock due to pressure solution, quartz overgrowth or mineral alteration. Common computational diagenesis schemes comprise geometry-based algorithms: Uniform quartz overgrowth as well as grain contact or pore body preferential cementation have been examined for sandstones [17,20,24], whereas a syntaxial cement has been also investigated for granular carbonates [25,26]. The resulting microstructural changes produce qualitative and quantitative trends among the geometric, hydraulic, and mechanical rock properties (Figure 1).
Within the present study, three highly resolved synthetic sandstone samples are virtually constructed, which show comparable microstructural and physical properties to their natural equivalents: the Fontainebleau, Berea and Bentheim sandstones. The process-based approach includes gravity-driven deposition of irregular grains with specified sizes, whereby particle shapes and size distributions are initially extracted from micro-CT scans of the investigated sandstones. To analyse diagenetic effects on physical rock properties, the synthetic samples are consolidated by three different voxel-based cementation approaches: the uniform, grain contact-preferential and stress-dependent scheme. Aim of this study is to quantify resulting changes in grain and pore morphometry as well as the evolution of elastic moduli and permeabilities. Moreover, the results are discussed in the context of established analytical approaches estimating elastic and hydraulic sandstone properties as function of porosity. In view of a virtual laboratory, the generated sandstone samples could be further used for digital experiments to quantify the impact of mineral dissolution or precipitation as well as fractures on petrophysical correlations, which is of particular importance for numerous applications related to geological subsurface utilisation.
2. Material and Methods
2.1. Micro-CT Scans of the Sandstones
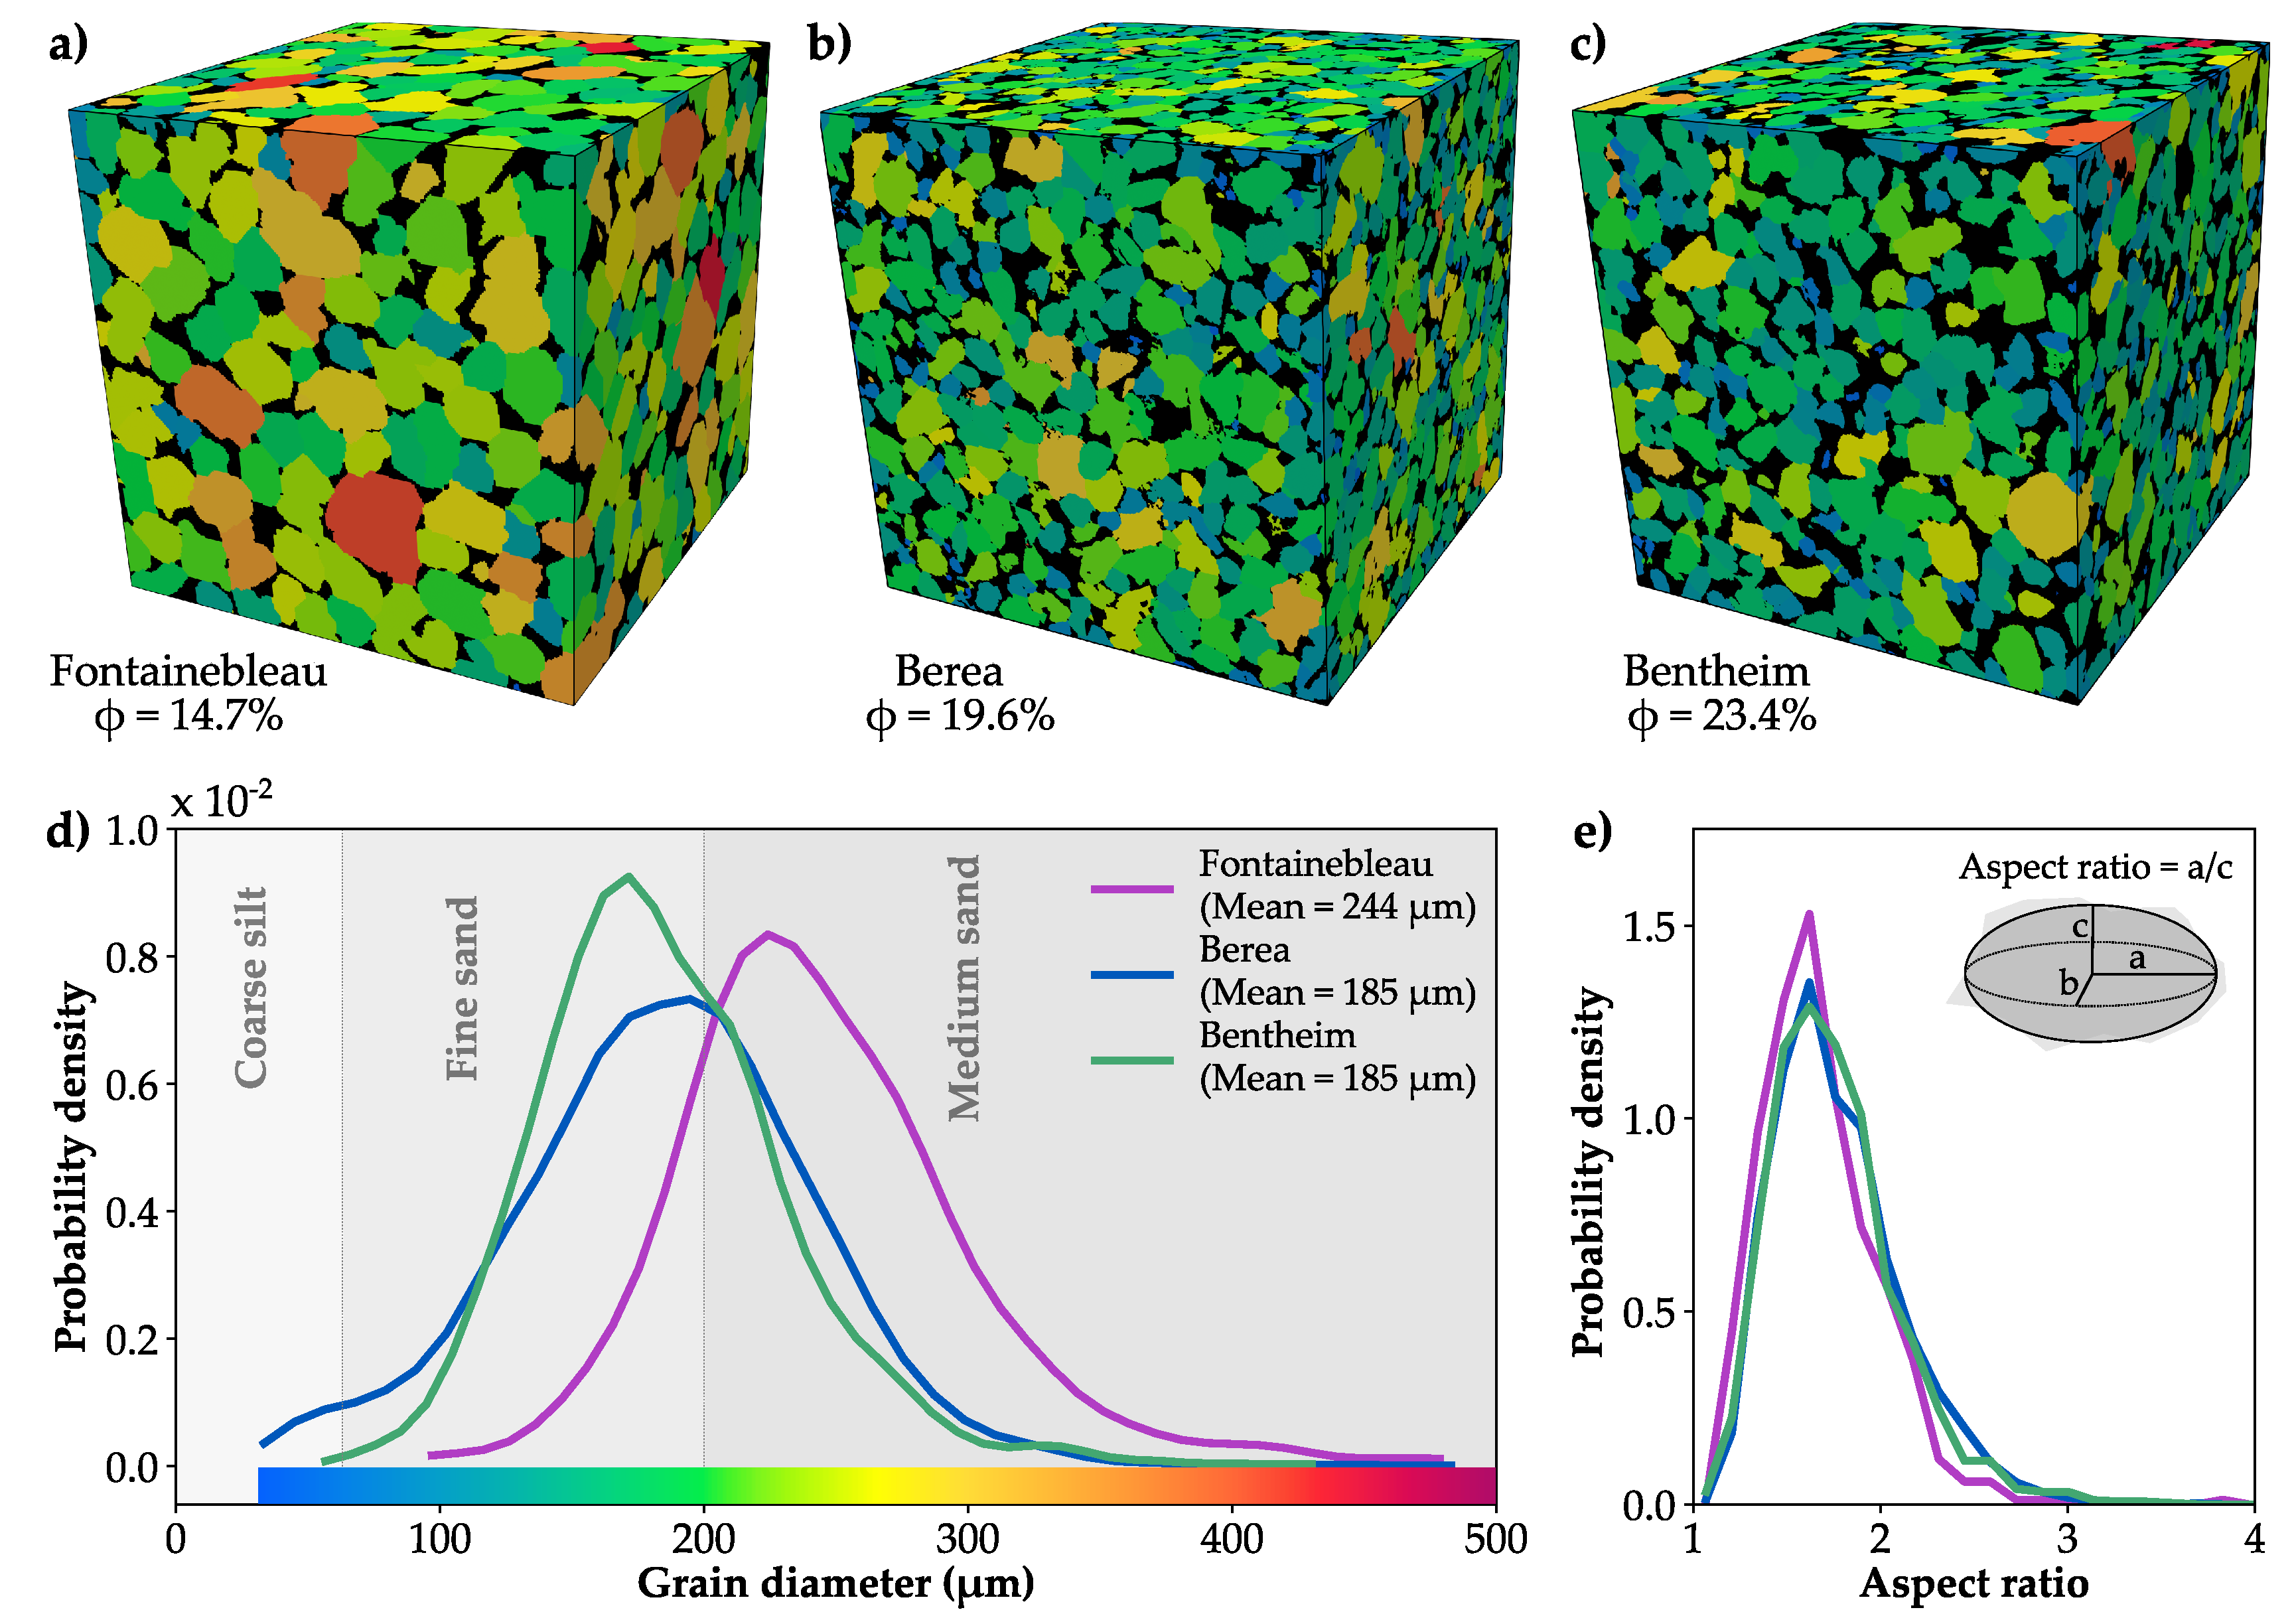
The synthetic sandstone samples should reflect the microstructural complexity of natural granular rocks regarding grain size and sorting as well as the pore morphology and connectivity. Therefore, the construction of the samples is based on granulometric parameters of three comprehensively investigated reservoir reference rocks: the Fontainebleau, Berea and Bentheim sandstones. Grain size distributions and shapes are extracted from micro-CT scans of these rocks and represent essential input properties to generate the synthetic samples (Section 2.3). The three sandstones are all homogeneous and have comparable ellipsoidal grain shapes with median aspect ratios ranging between 1.6 and 1.7 (Figure 2e). However, all three samples differ considerably in their porosity and granulometric properties (Table 1).
The micro-CT scan of the Fontainebleau sandstone (Figure 2a) is derived from the digital rock physics benchmark of Andrä et al. [27] and has a resolution of 288 × 288 × 300 voxels with an edge length of 7.5 m (Table 1). The medium-grained sandstone exhibits the lowest porosity with 14.7% and highest mean grain size with 244 m of the three investigated samples. With a sorting coefficient of 0.29, it is classified as very well sorted [28].
The digital rock samples of the Berea and Bentheim sandstones originate from a publicly available data set [29,30], whereby cubical subsets are extracted from the initially cylindrical micro-CT scans. The original grey-scale images are binarised using the Otsu algorithm [31] to separate pore space and grains, whereby minor components are neglected and considered as quartz due to their low volumetric ratio. The examined Berea sample comprises 6003 voxels with a resolution of 4.6 m (Figure 2b). This fine-grained sandstone has a mean grain size of 185 m and a porosity of 19.6% (Table 1). With a coefficient of 0.47, it is still well sorted, but shows a considerably broader grain size distribution than the two other rock samples (Figure 2d). The Berea sandstone generally contains minor amounts of feldspar, dolomite and clay [9,32].
The micro-CT scan of the Bentheim sandstone is composed of 5003 voxel with an edge length of 4.9 m (Figure 2c). The porosity of 23.2% represents the highest value of the three investigated samples. The digital Bentheim sample has a mean grain size comparable to the Berea sandstone, but exhibits a better sorting with a coefficient of 0.35 (Table 1). Besides the main constituent quartz, it consists of small amounts of clay and feldspar [33].
2.2. Computation of Granulometric and Physical Rock Properties
The granular microstructure of a sandstone can be characterised by several geometrical parameters, describing the size and shape of grains as well as the morphology of the pore space. The granulometric rock properties are directly derived from the digital samples using the open source software package ImageJ [34]. For the micro-CT scans, the individual grains are initially extracted using watershed partitioning, whereby the particles of the synthetic samples are originally labelled. The volume-equivalent diameter of the grains (dGrain), their sphericity and aspect ratios are calculated by means of the MorphoLibJ library [35]. The sphericity () is defined as the surface area ratio of an equal-volume sphere to the original grain [18], while the aspect ratio () describes the proportion of the major to the minor axis lengths of the inertia ellipsoid (Figure 2e). The sorting coefficient is calculated after Folk and Ward [28] based on the grain size distribution.
The pore morphology and network are calculated using the PoreSpy package [36], which in turn extracts individual pores by means of a watershed segmentation. The pore space is characterised by the volume-equivalent diameter of the pores (dPore), the diameter of their throats (dThroat) and connectivity, which describes the number of throats connected to a single pore. Similarly, the coordination number is defined as the number of contacts to neighbouring grains and dContact as the equivalent diameter of a contact. These parameters are calculated by the grain network using the grain-labelled images as input, since Cook et al. [37] found excellent correlations between elastic properties and the number and length of grain contacts. Unless otherwise stated, the given geometrical parameters are mean values considering all pores, throats or grains of the respective sample.
The effective elastic properties of the virtual sandstone samples are calculated using a parallel version [38] of the well-established static finite element method of Garboczi and Day [39]. This approach treats each voxel of the three-dimensional image as a trilinear element. A small uniform strain is imposed on all voxels, while periodic boundary conditions are applied at each boundary of the microstructure. The resulting strains and stresses are calculated by minimising the elastic energy using a fast conjugate-gradient method [38]. Finally, the effective bulk and shear moduli of the sample are computed based on the average stress tensor. The numerically simulated properties refer to a dry sandstone as in Andrä et al. [27]. Hence, the stiffness of quartz is assigned to the grains considering 37 GPa and 44 GPa for bulk and shear modulus [40], respectively, while both moduli are set to zero for pore voxels.
In order to determine the absolute permeabilities of the virtual sandstone samples, pore-scale fluid flow is simulated using the OpenFOAM software package [41]. The finite volume-based implementation solves the simplified Stokes equations, assuming a steady-state flow with dominating viscous forces and an incompressible fluid [42]. At the inlet and outlet, constant pressure boundaries are applied, whereas for the internal grain walls and the remaining model boundaries no-slip conditions are assumed as documented by Raeini et al. [43]. Based on the volume average of the velocity field, the permeability (k) is calculated in the direction of flow. The full permeability tensor is obtained by three simulation runs in the respective flow directions. Unless otherwise stated, all permeability values refer to the average of the three components kx, ky and kz. The presented approach is known to compute permeabilities, which are in the range of those determined by laboratory measurements at larger scales [44,45], presuming a sufficient resolution of the digital image. Saxena et al. [46] demonstrated that the ratio of sample length to dominant grain size should be ≥5 to provide reliable estimates for the permeability. For the investigated micro-CT samples, this criteria is fulfilled by ratios of 9, 15 and 13 for the Fontainebleau, Berea and Bentheim sandstones, respectively.
2.3. Construction of the Unconsolidated Synthetic Samples
In order to build realistic unconsolidated sediments, the deposition of grains with specified shape and size distributions is simulated by means of a discrete element method (DEM). This robust approach considers interactions between discrete objects [47] and is commonly used in the context of soil mechanics and geotechnical studies. Since the individual grains are successively deposited under the influence of gravity, the natural sedimentation process is simulated.
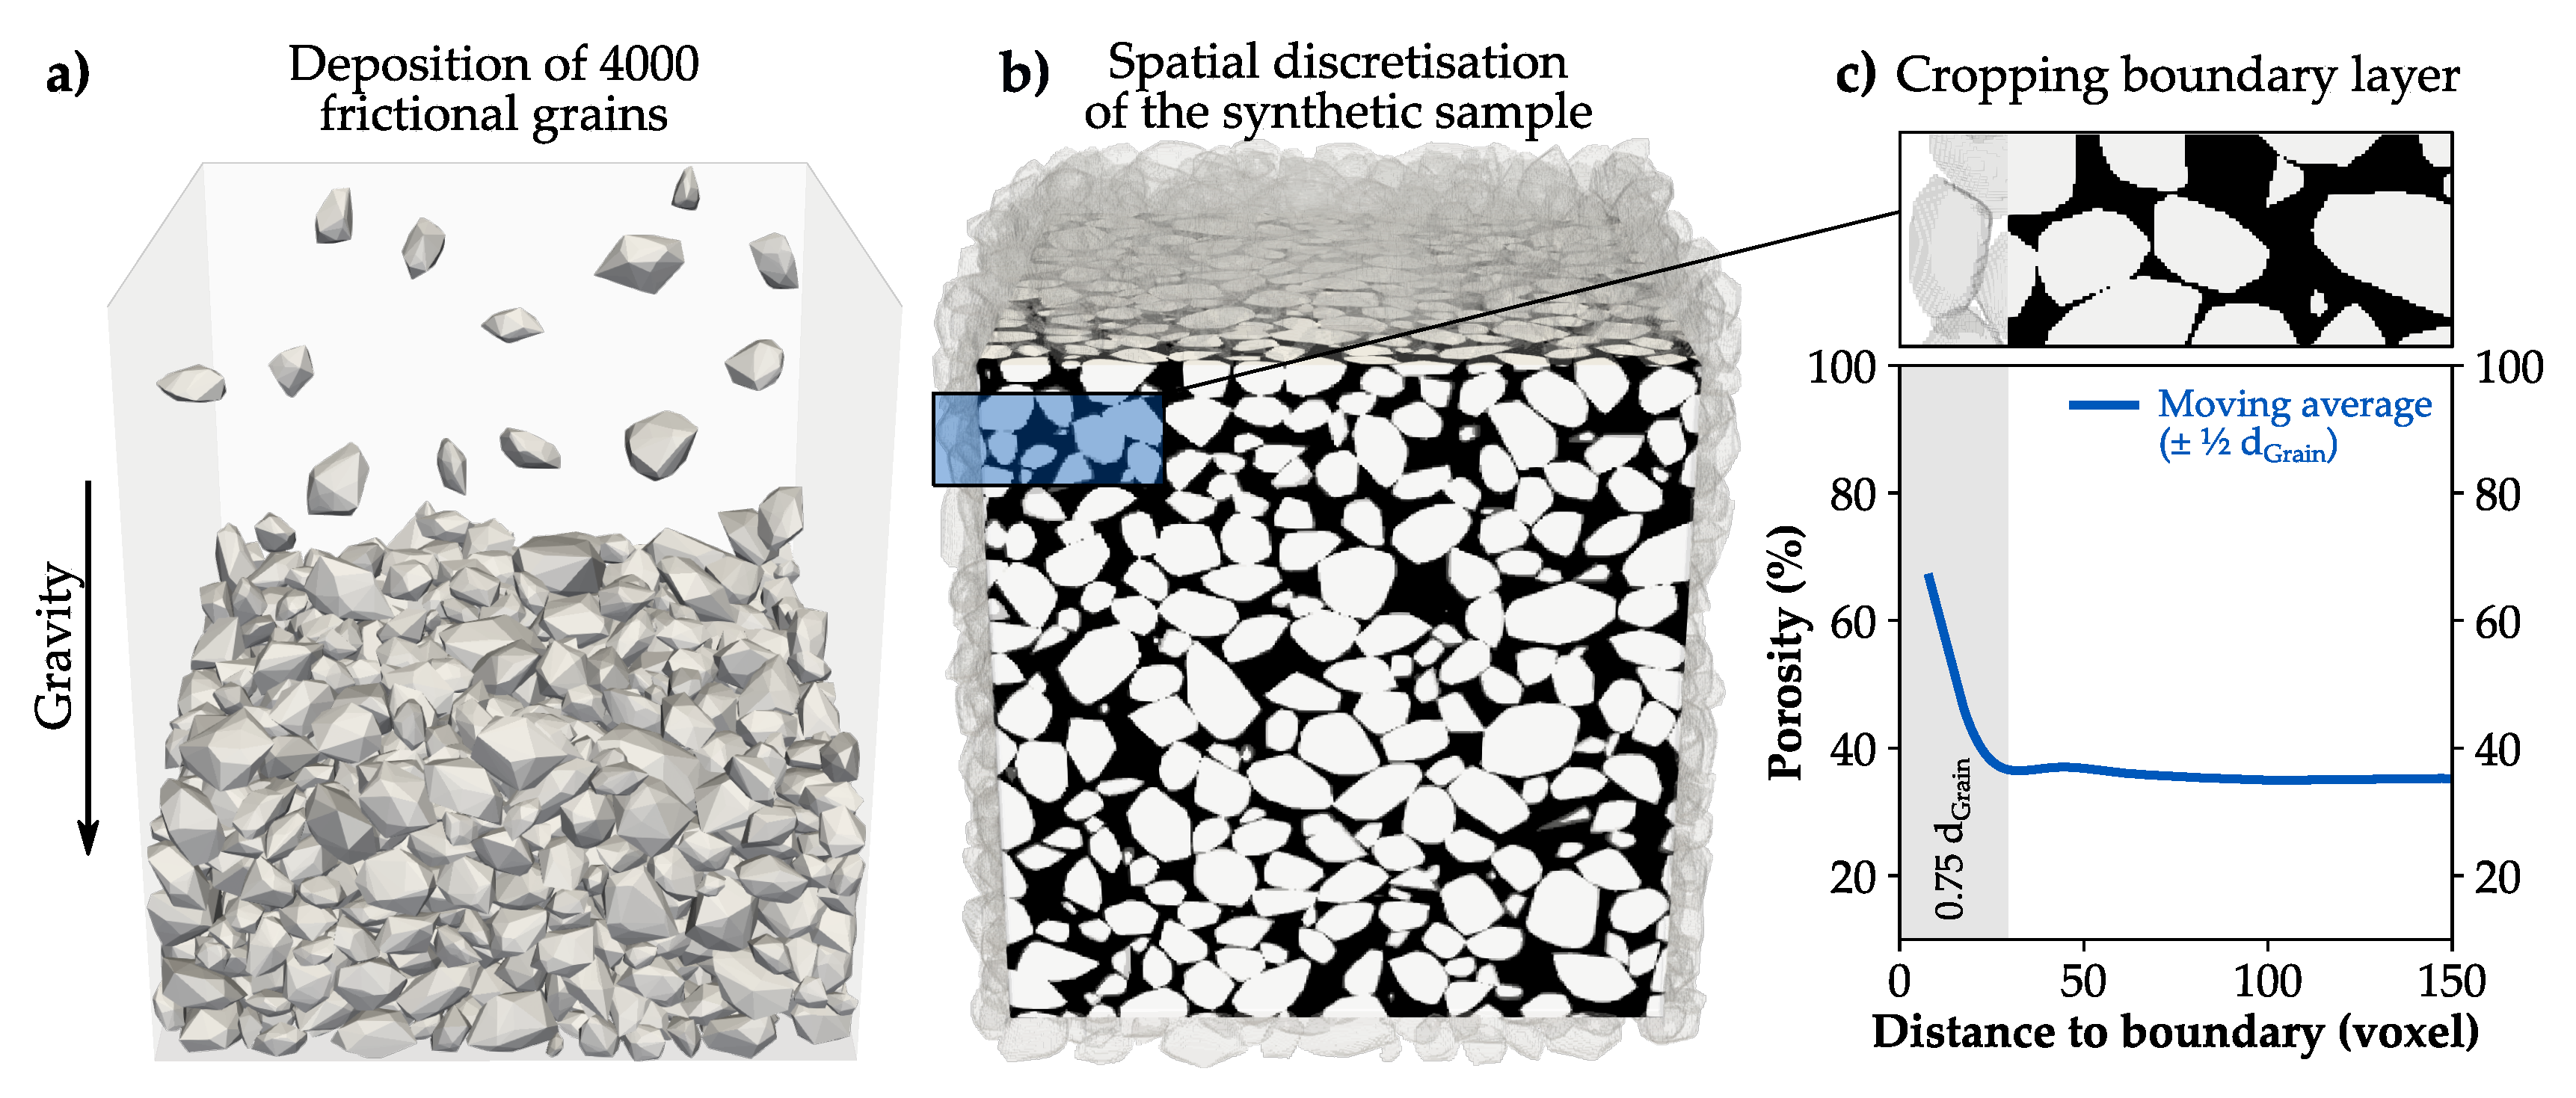
The DEM approach developed by Al Ibrahim et al. [23] is applied in this study, since it offers the possibility to implement irregularly shaped convex particles. This is a major advantage, because simplified spheres or ellipsoids generally do not reflect the granulometric characteristics of a natural sandstone. The irregularly shaped grains are generated by stochastically perturbing regular shapes by means of a three-dimensional correlated Perlin noise [48], whereby the volume of the underlying regular particles is conserved. Since each particle has a separate realization of Perlin noise, the individual grains all differ in shape. Moreover, the selected amplitude of the noise defines the strength of perturbation, and thus offers a good approximation for natural shapes of sub- to well-rounded grains. A detailed explanation of the sedimentation tool and the specific steps is given in Al Ibrahim et al. [23]. The basic input parameters to generate the synthetic sediments are the grain size distribution and aspect ratio, which determines the ellipsoidal grain shape. For the three investigated sandstones, these properties are introduced in Section 2.1 (Figure 2d,e). Moreover, a Perlin noise of 0.75 is used to generate irregularly shaped particles, since elastic and hydraulic parameters remain almost constant for higher amplitudes of Perlin noise [21]. In total 4000 quartz grains with a density of 2650 kg/m3 are deposited under influence of gravity into a rectangular box with a height to width ratio of 1.1 (Figure 3a). A friction coefficient of 0.3 is assumed between individual particles as in Sain et al. [15] or Zhang and Makse [49]. To determine the granulometric properties of the generated sediment and avoid an additional watershed grain separation, all grains are labelled.
In order to compute physical properties, the geometry of the sediment is converted to a rectangular, uniform grid representing the synthetic micro-CT scan (Figure 3b). For comparability purposes, image resolutions of the synthetic samples should be similar to those of the micro-CT scans. Therefore, the respective image sizes are estimated by the number of grains and their average voxel diameter. Finally, a buffer layer of 0.75 dGrain is cropped from the sample to reduce edge effects due to the significantly higher porosities near the boundaries (Figure 3c).
2.4. Cementation of the Synthetic Sandstone
The diagenetic lithification of unconsolidated sediments mainly comprises mechanical compaction and cementation most commonly by silica, carbonates or clay [50]. The diagenetic processes can be complex and generally depend on the respective geological conditions like rate of burial, heat flow, sediment composition, biological activity, chemistry of pore-fluids, and include dissolution, recrystallisation, mineral replacement or cracking [50,51]. However, compaction of the synthetic sediment is not considered, since Sain [24] demonstrated that the diagenetic trends in elastic rock properties depend less on initial compaction than on cementation. Moreover, the porosity loss through compaction alone is limited [51,52] and the unconsolidated samples are already densely packed, exhibiting porosities of around 35% (Table 2).
Hence, the three voxel-based lithifying schemes comprise a uniform, a grain contactpreferential and a stress-dependent cementation of the synthetic sediment. Uniform and grain contact-preferential cementation are implemented as purely geometrical concepts as in Torskaya et al. [20]. In order to determine grain contacts, an euclidean distance map, which defines the distance to the nearest grain voxel, is multiplied by a local thickness map, where narrow throat regions are found by maximum inscribed spheres [53]. The iterative stress-dependent scheme combines the cementation of grain contacts and uniform overgrowth (Figure 4a). At first, the stress distribution is calculated within the sample. Then, local stress peaks are defined as regions comprising the 10% highest stresses (≥90th percentile). The neighbouring grain-lining voxels of these stress peaks are converted from pore space to grains, which effectively cements grain contacts. The sediment is successively consolidated, whereby particularly during the first iterations the stress gets relatively evenly distributed (Figure 4b) and the threshold substantially increases. The stress-dependent cementation stops, when the stress peak-defining threshold (10% highest stresses) does not change by more than 5% relative to that of the previous iteration (Figure 4c). This ensures a more realistic distribution of the loads at grain contacts. This criterion is achieved after a porosity reduction of 2.4%, 2.5% and 2.8% by volume for the Fontainebleau, Berea and Bentheim samples, respectively. Afterwards, the synthetic sample is uniformly cemented until the target porosity is reached.
The samples of the Fontainebleau, Berea and Bentheim sandstones are successively consolidated by the three cementation schemes until the porosity of the respective sandstone is achieved. The cement is assumed to have the same properties as the grains, since the three investigated sandstones predominantly consist of quartz and the cemented phase is not separately resolved in the micro-CT scans. Moreover, silica is the most important porosity-reducing cement in sandstone reservoirs [54], and commonly occurs as grain rimming overgrowth [37].
3. Results
Synthetic samples of the Fontainebleau, Berea and Bentheim sandstones are generated by means of a process-based approach, which comprises the gravity-driven deposition of irregular grains and their consolidation by three different cementation schemes. In the following, the physical properties of the different unconsolidated grain packs are described. Moreover, evolving diagenetic trends in granulometric and elastic properties as well as pore morphologies and permeabilities are comprehensively examined.
3.1. Unconsolidated Sediments
The synthetic samples have different model sizes, which range between 4203 and 5503 voxels (Table 2), since resolutions of the respective micro-CT scans are assigned to the generated samples for comparability purposes. The porosities of the unconsolidated sediments are similar, but exhibit slightly higher values of 35.8% and 35.9% for the very-well sorted Fontainebleau and Bentheim samples, respectively. With a porosity of 35.1% the Berea model is somewhat denser packed due to the broader grain size distribution (Table 1). An average pore of the three synthetic sediments is connected by 7.5 up to 7.7 throats (Table 2). Despite the similar connectivities of the pore network, the Fontainebleau sample shows a higher permeability with 28.5 × 10⁻¹² m2, which is related to the higher mean grain size (Table 1). For all synthetic samples, the horizontal permeability (kh) is notably higher than the vertical one (kv), which is reduced by 9%, 12% and 11% for the Fontainebleau, Berea and Bentheim sandstones, respectively. This difference in vertical permeability is also observed for the micro-CT scans of the sandstones with around 12% for all of them.
A single grain of the unconsolidated sediments has on average between 6.1 and 6.2 contacts (Table 2). Bulk and shear moduli are almost identical for each particular synthetic sample. The Fontainebleau sediment has a bulk modulus of 6.1 GPa, whereby the Berea and Bentheim samples exhibit slightly lower moduli of 5.2 and 5.1 GPa, respectively.
3.2. Rock Stiffening and Granulometry
The grain size distributions of the synthetic samples are in good agreement with the respective micro-CT scans. Depending on the cementation scheme, the average grain diameter deviates in maximum only by 0.7%, 0.8% and 0.4% for the Fontainebleau, Berea and Bentheim samples, respectively (Table 3). The employed cementation schemes lead to contrasting spatial alteration patterns, whereby different diagenetic trends are established. These developments are comparable for the three investigated sandstones and only marginally affected by the porosities and stiffnesses of the unconsolidated sediments. Hence, the diagenetic trends for three cementation approaches are exemplarily described for the Fontainebleau sample, since it comprises the greatest reduction in porosity, and thus the largest data range.
The grain contact-preferential cementation scheme leads initially to a rapid stiffening of the sample with small changes in porosity due to the rigorous filling of contacts. This is indicated by the coordination number which increases to 7.4 at a porosity of 32.8% (Figure 5b). The mean diameter of the contacts is doubled from 35 m to 69 m (Figure 5c), which also results in a doubling of the bulk modulus to 12.6 GPa (Figure 5a). Subsequent cementation leads to a less steep linear increase in elastic properties. For the target porosity of the Fontainebleau sample
( = 14.7%), the contact-preferential cementation exhibits the greatest number of grain contacts and the highest bulk modulus of the three diagenetic schemes with 25.6 GPa (Table 3).
A uniform cementation around the grains evenly alters the pore space. For the compared porosity of 32.8%, an average grain has 6.6 contacts (Figure 5b) with a mean contact diameter of 48 m, only (Figure 5c). Hence, the bulk modulus of 8 GPa is considerably lower than for the contact-preferential cementation (Figure 5a). The almost linear increase in bulk moduli illustrates the uniform alteration of the sandstone (Figure 5d). At the final porosity of 14.7%, the coordination number as well as the contact diameter are lower than for the two other diagenetic schemes with 8.9 and 96 m, respectively. Consequently, the uniform cementation pattern produces the weakest synthetic sandstone sample with 23.6 GPa, only.
The stress-dependent approach leads to a strong initial stiffening, which coincides with the purely geometric contact cementation, since it also leads to a preferential mineral growth between grain contacts (Figure 5d). At the porosity of 32.8%, this scheme exhibits a lower coordination number of 7.0 (Figure 5b), but a higher average contact diameter of 74 m (Figure 5c) than the contact cementation approach. This indicates a more effective stiffening of the respective contacts, since the bulk modulus is also almost doubled to 12.1 GPa. The change from a stress-dependent contact cementation to a uniform mineral growth results in a suddenly reduced bulk moduli increase (Figure 5a). At the porosity of 14.7%, there are little differences in the spatial cement distribution of the uniform and stress-dependent consolidated samples, only (Figure 5e). Nevertheless, the stress-dependent scheme has a slightly higher coordination number of 9.0 and a substantially larger contact diameter of 101 m. The calculated bulk modulus of 24 GPa is in very good agreement with that determined for the micro-CT scan.
Only the stress-dependent cementation scheme produces synthetic sandstone samples with elastic properties comparable to the respective micro-CT scans of the Fontainebleau, Berea and Bentheim sandstones. A successive contact cementation considerably increases the coordination number and produces substantially stiffer samples, whereby bulk and shear moduli are up to 8.4% and 11.8% higher than those of their natural equivalents (Table 3). By contrast, uniform mineral growth leads to a lower number of grain contacts, and consequently to an underestimation particularly at higher porosities, which amount to 11.9% and 8.3% in maximum for bulk and shear moduli, respectively. The stress-dependent scheme combines both approaches resulting in comparable elastic properties of the synthetic samples and the micro-CT scans (Figure 5a), whereby bulk moduli only slightly deviate by 0.8%, 4.9% and 2.5% for the Fontainebleau, Berea and Bentheim sandstones, respectively (Table 3).
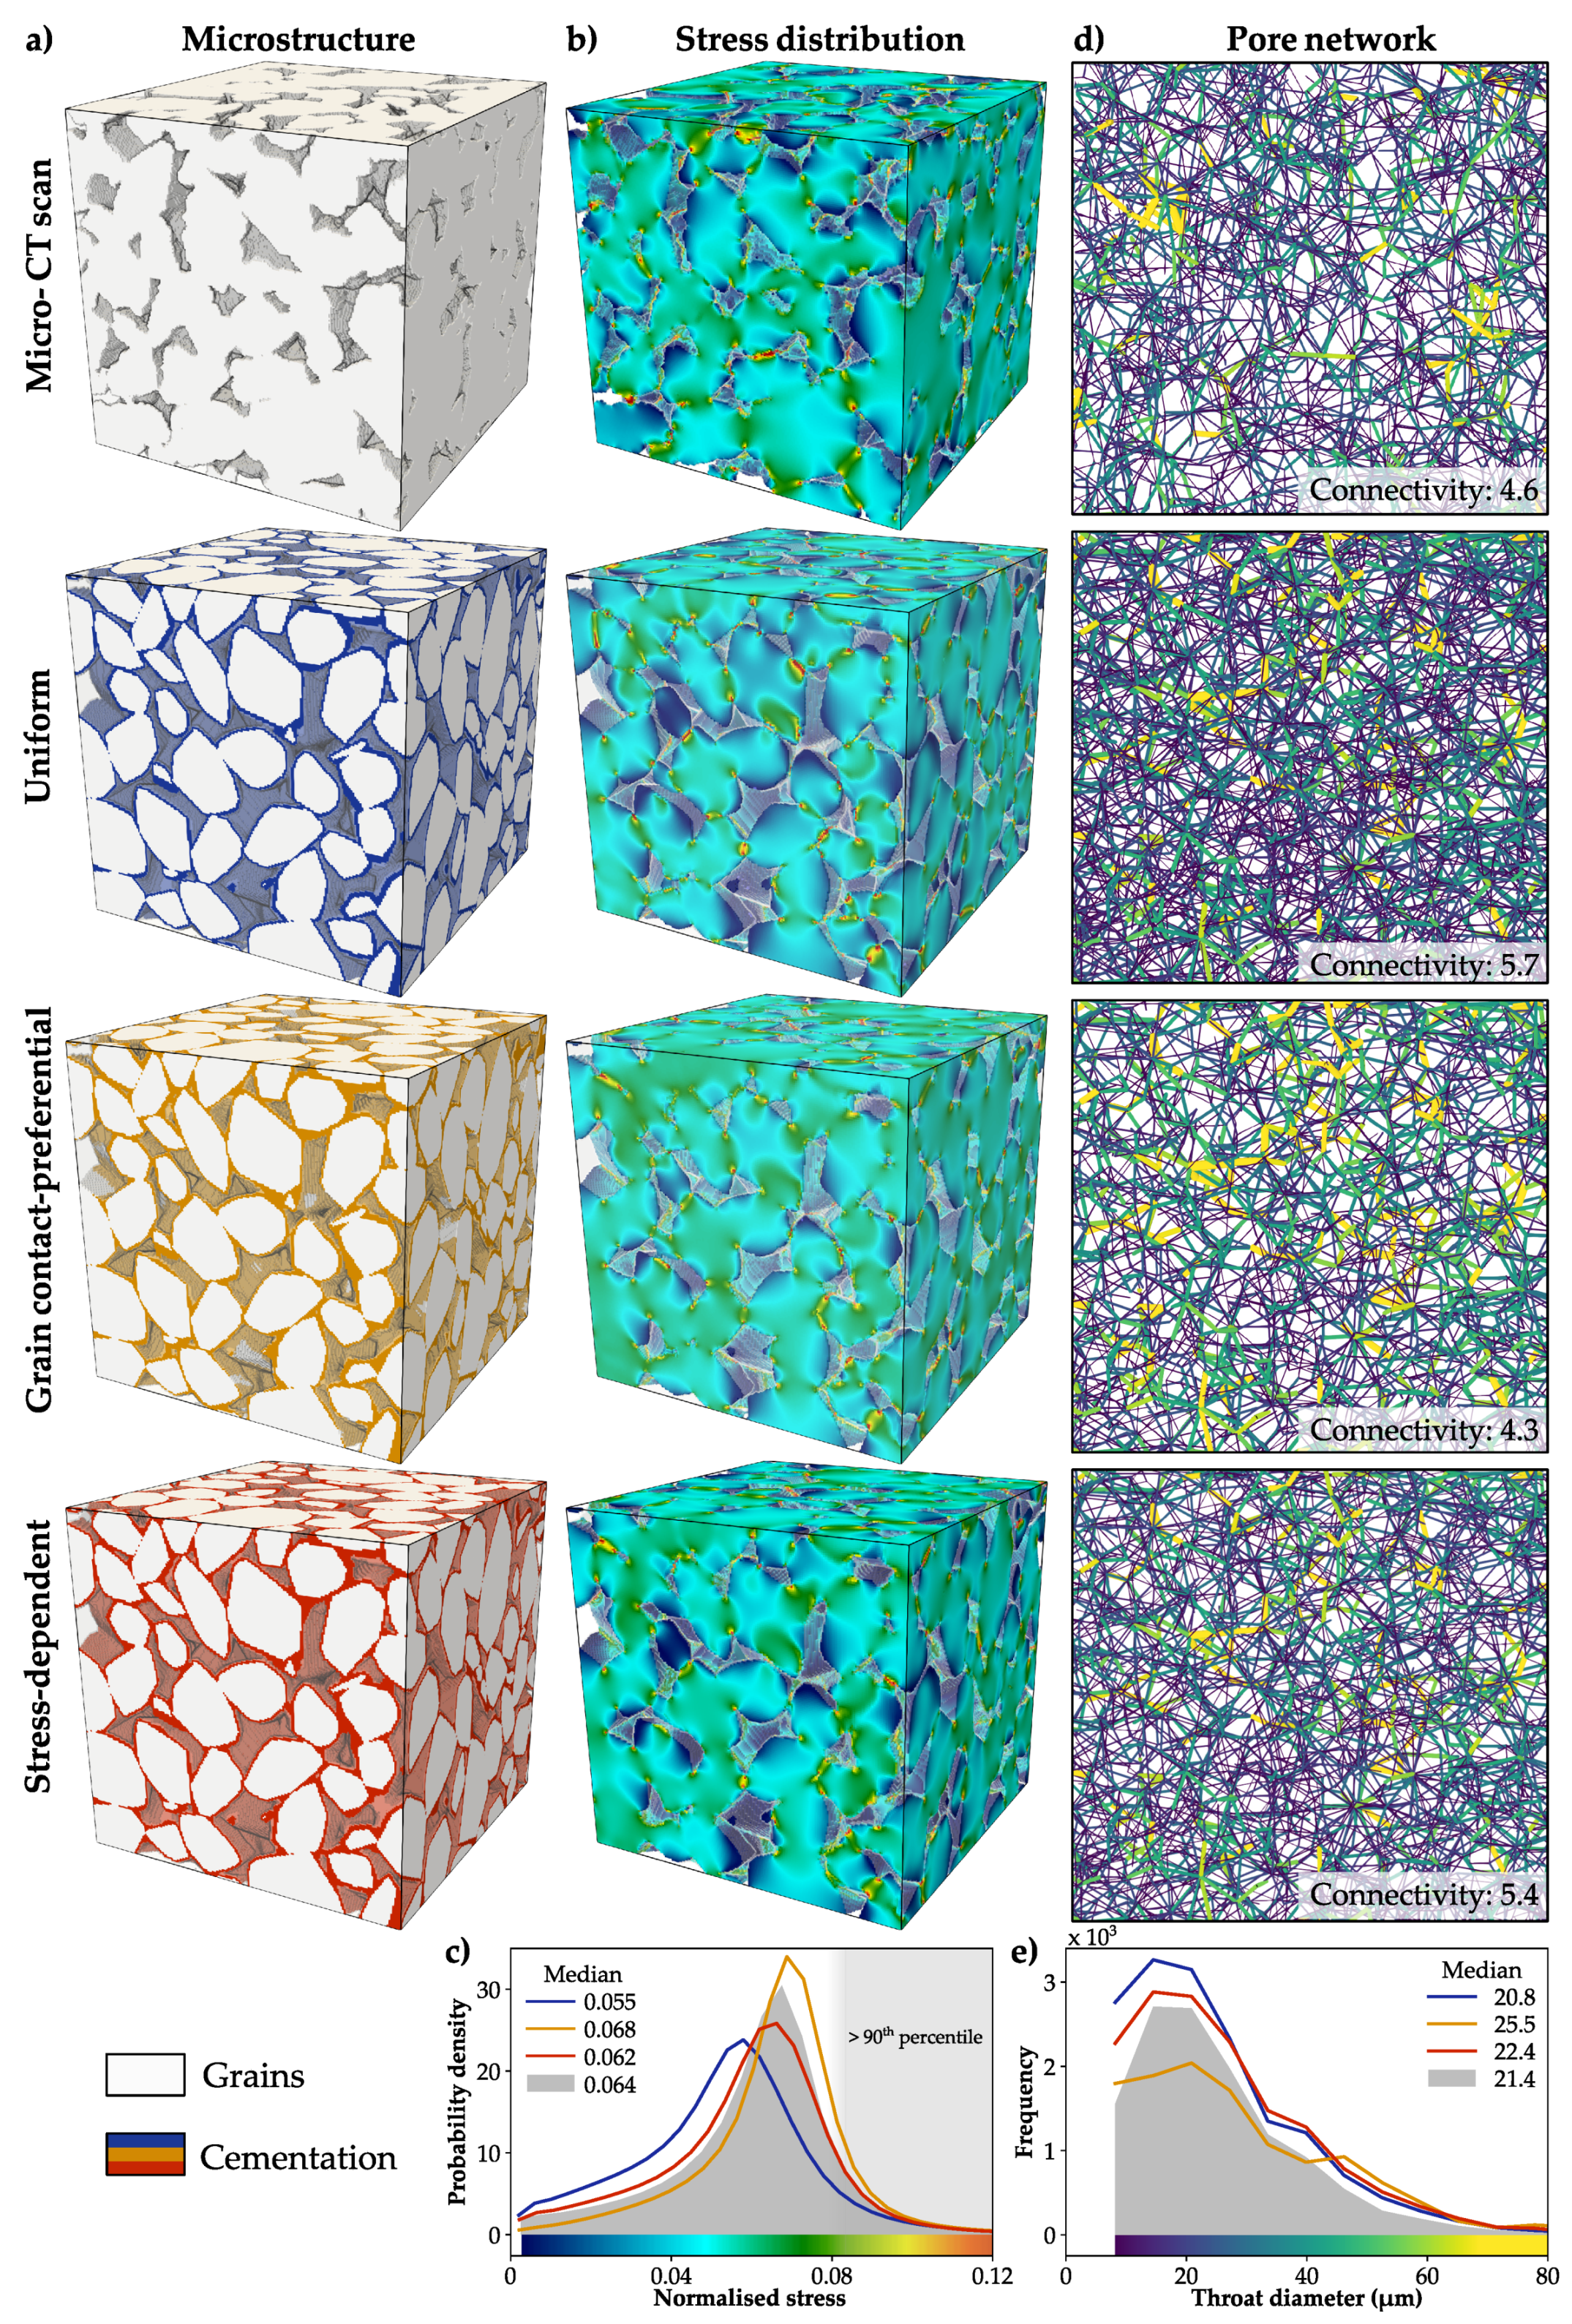
The spatial stress distributions within the sandstone samples visualise the differences between the three cementation schemes. Generally, high stresses occur very localised, since the 10% of the voxels comprising the highest stresses (>90th percentile) cover about 92% of the entire data range (Figure 6c). The contact-preferential cemented samples exhibit on average higher stresses than the micro-CT scans, since the grain contacts are enhanced (Figure 6a). Consequently, the loads at the contacts are more distributed, which results in a stiffer microstructure (Figure 6b). By contrast, the grain contacts are comparably less cemented and the stresses more localised in case of uniform mineral growth. Thus, the entire microstructure behaves weaker. The stress-dependent combination of contact-cement and quartz overgrowth produces a sample, for which the stress distribution is in good agreement with the micro-CT scan (Figure 6c).
3.3. Permeability Evolution and Pore Morphology
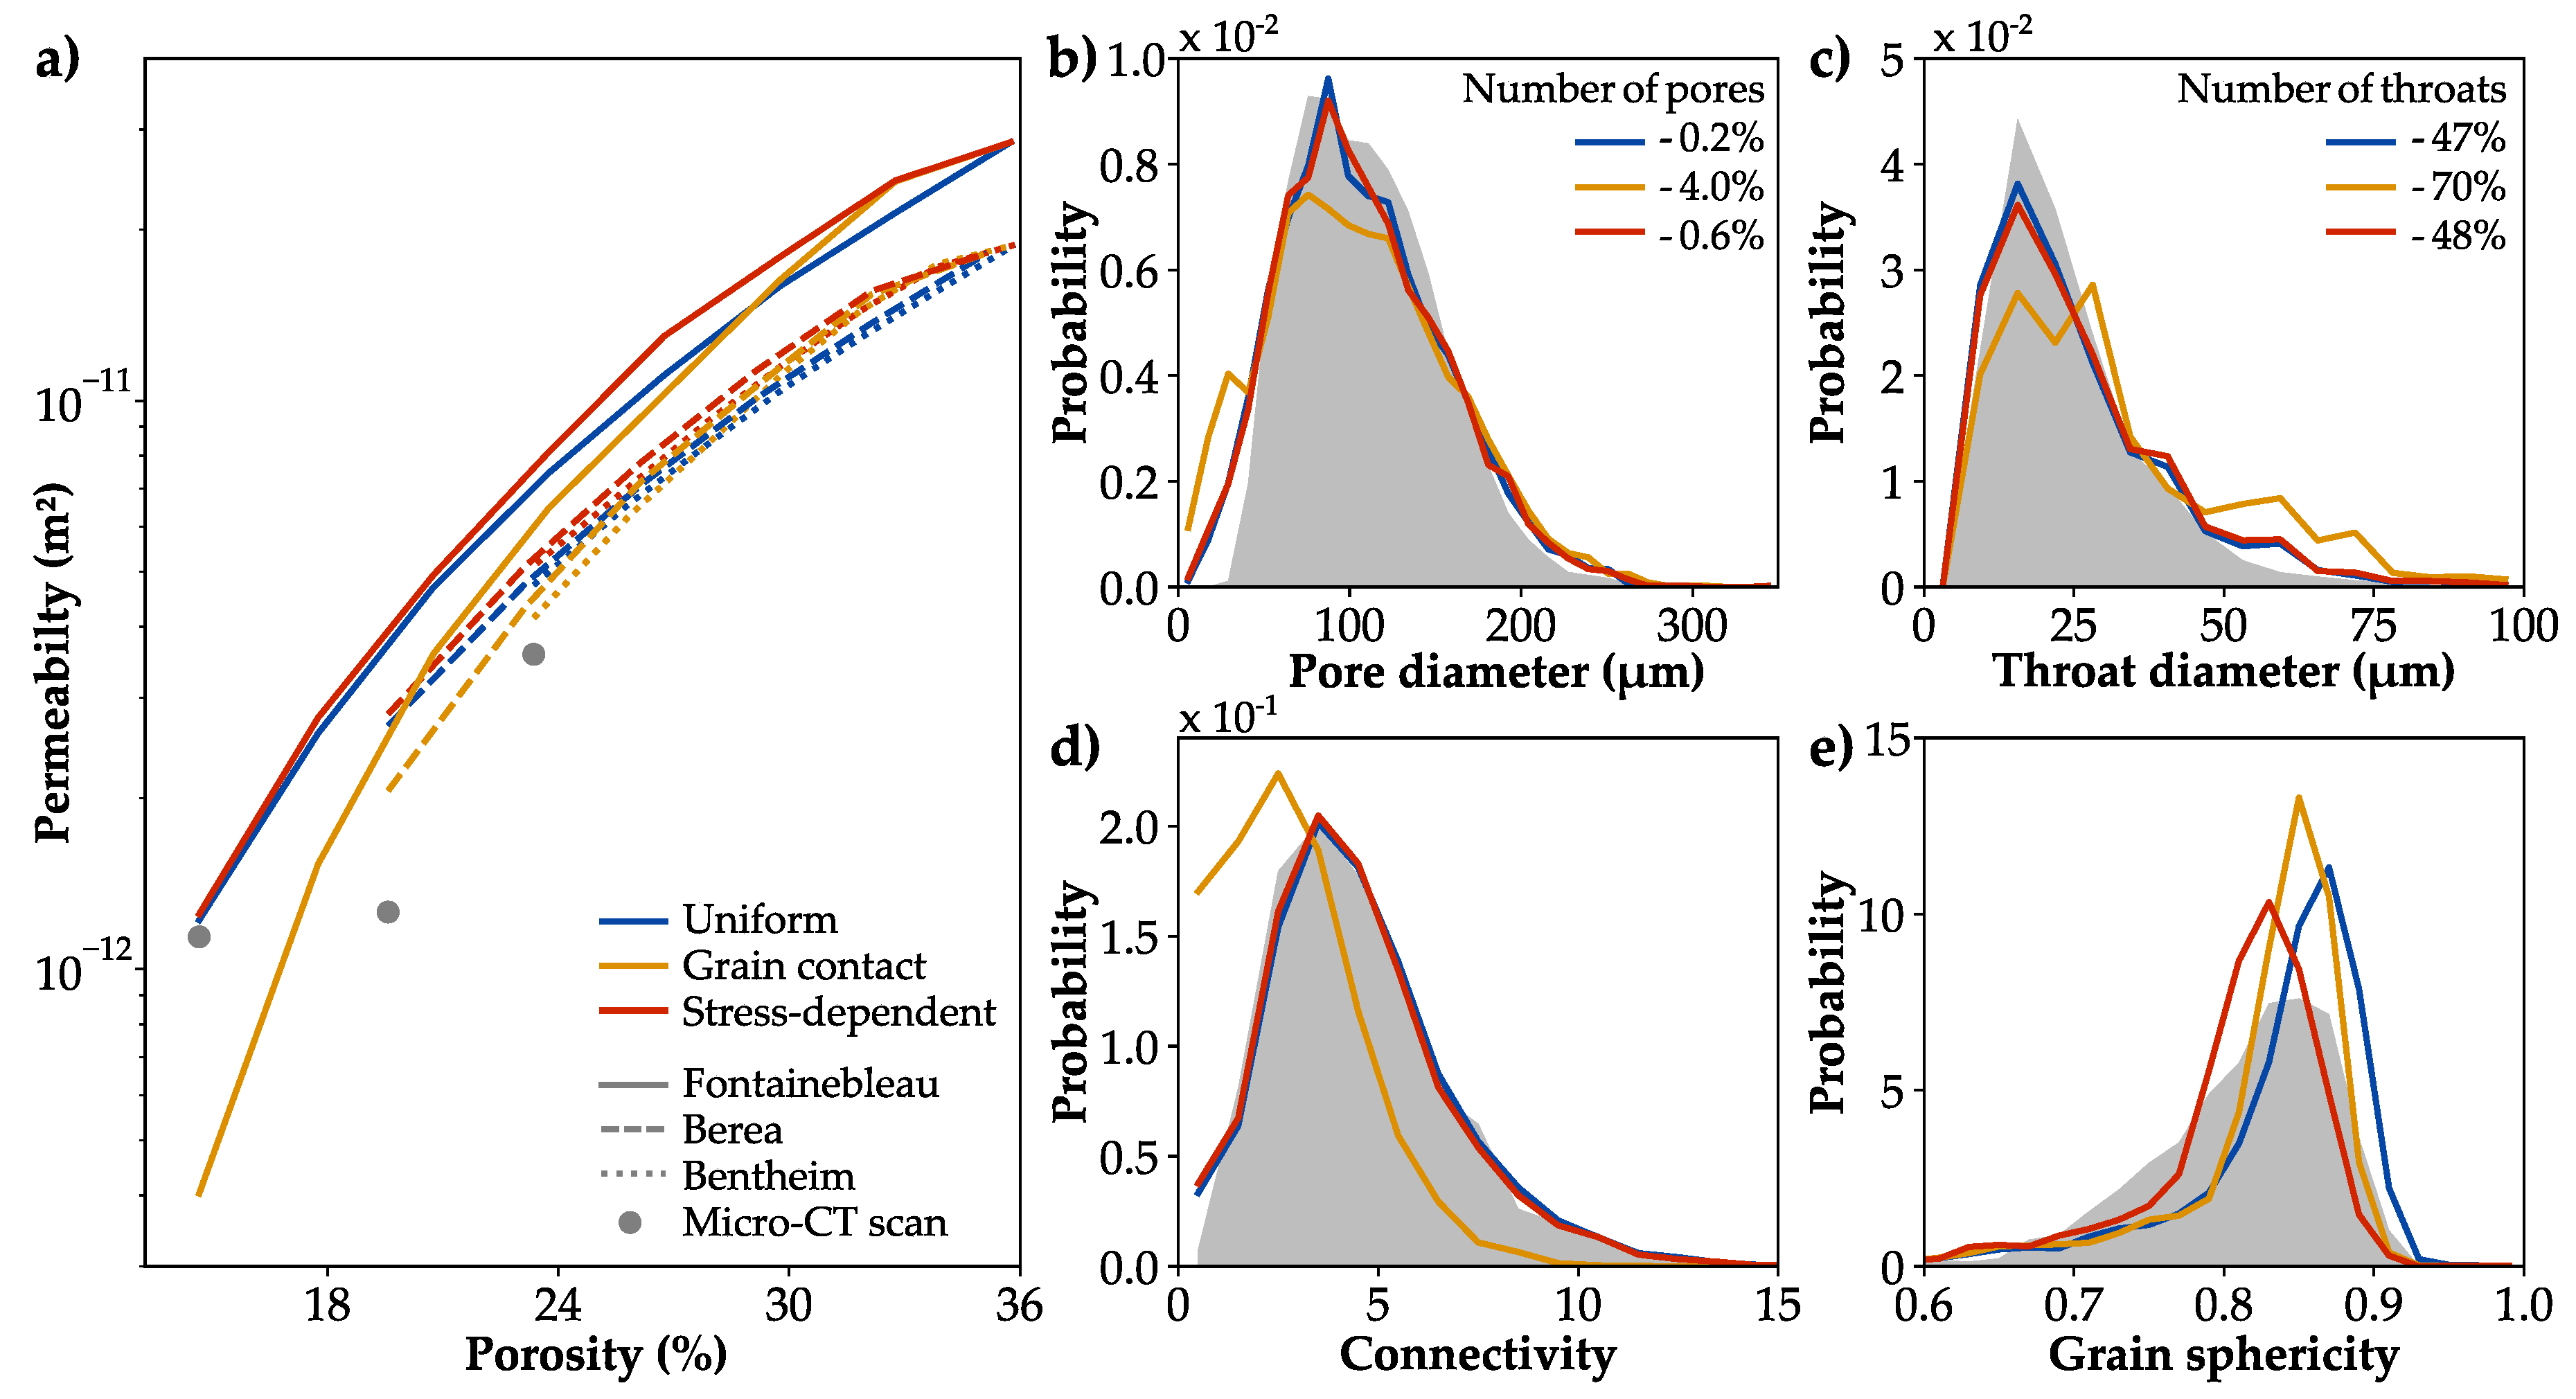
The three applied diagenetic schemes lead to particular trends in permeability, whereby the differences resulting from the cementation approaches are less pronounced, than those for the elastic rock properties. The calculated porosity-permeability relations are marginally affected by the initial porosities or hydraulic parameters of the unconsolidated sediments, even though the Fontainebleau sample exhibits higher permeabilities due to its larger grain size (Figure 7a). The diagenetic trends for three cementation approaches are exemplarily described for the Fontainebleau sample, since it comprises the highest reduction in porosity.
Contact-preferential cementation initially causes slightly higher permeabilities than uniform mineral growth. Nevertheless, the successive filling of grain contacts implies a progressive clogging of throats, resulting in the highest observed permeability decrease (Figure 7a). At the final porosity of 14.7%, the number of initial pores and throats decrease by 4% and 70%, respectively, which exhibits the highest reduction of all scenarios (Figure 7b). Particularly smaller throats are clogged, whereby throats larger than 50 m are unaffected by successive cementation (Figure 7c). Consequently, the contact-preferential cemented sample shows the highest median throat size of the investigated cementation schemes with 27.3 m (Table 4), but simultaneously the lowest connectivity of 2.3 (Figure 7d). The mean sphericity of 0.83 is slightly higher and less disperse than the one determined for the micro-CT scan of 0.81 (Figure 7e).
The uniform cementation of the synthetic sample leads to a continuous decrease in permeability (Figure 7a). At the porosity of 14.7%, the number of pores is slightly reduced by 0.2% (Figure 7b). Independent of their size, 47% of the initial throats are clogged (Figure 7c). This results in the lowest median throat size and highest pore network connectivity of all cementation scenarios (Figure 7d). Both the throat diameter of 19.9 m as well as the connectivity of 4.1 are in excellent agreement with the values extracted from the micro-CT scan (Table 4). However, the sphericity of the synthetic sample is considerably higher with 0.84 than that of its natural equivalent (Figure 7e).
The stress-dependent approach initially produces permeabilities, which are similar to the contact-preferential cementation scheme (Figure 7a). However, the successive porosity reduction leads to a permeability decrease equivalent to the uniform approach due to the respective change in the cementation pattern. Consequently, the geometric parameters of the stress-dependent cemented sample are comparable to that of the uniform pattern: the number of pores is reduced by 0.6% at a porosity of 14.7% (Figure 7b), while 48% of the initial throats are clogged (Figure 7c). The connectivity of the synthetic sample is slightly lower with 4.0 and the median throat diameter slightly higher with 20.6 m than that of the micro-CT scan. Moreover, it shows the best agreement in grain shape with a mean sphericity of 0.81 (Figure 7e).
Both the uniform and the stress-dependent scheme produce synthetic samples with equivalent pore morphologies as the respective micro-CT scan of the Fontainebleau sandstone, resulting in comparable permeabilities with a slight overestimation of 7% and 10%, respectively (Table 4). By contrast, the contact-preferential approach considerably underestimates the permeability by up to 65%. For the Bentheim sandstone, the synthetic samples exceed the permeability by 16% to 43% due to significant differences in the pore network: the pores of the uniformly cemented sample are notably better connected with an average connectivity of 5.7 compared to 4.6 (Figure 7d). Even tough a contact-preferential cementation exhibits a lower value than the respective micro-CT scan with 4.3 throats associated to a pore, the remaining throats have a substantially larger diameter of 25.5 m due to the progressive closure of smaller throats (Figure 7e). The stress-dependent scheme combines both approaches and results in a connectivity of 5.4 with an average throat diameter of 22.4 m.
Moreover, the pore space of the synthetic Berea sandstone samples is either better connected than those of the respective micro-CT scan (uniform and stress-dependent approach) or exhibit a significantly higher throat diameter (contact-preferential scheme). The resulting permeabilities are overestimated by up to a factor of 2.2 in case of the stress-dependent scheme (Table 4). Major differences further arise in grain sphericity, which is described by the surface area ratio of a regular sphere to the original grain and is thus an indicator for grain shape and surface roughness. The stress-dependent cemented samples are used in the following to compare the sphericities of three different sandstones, since these show the best agreement regarding the mean value and spread of the distribution (Figure 7e).
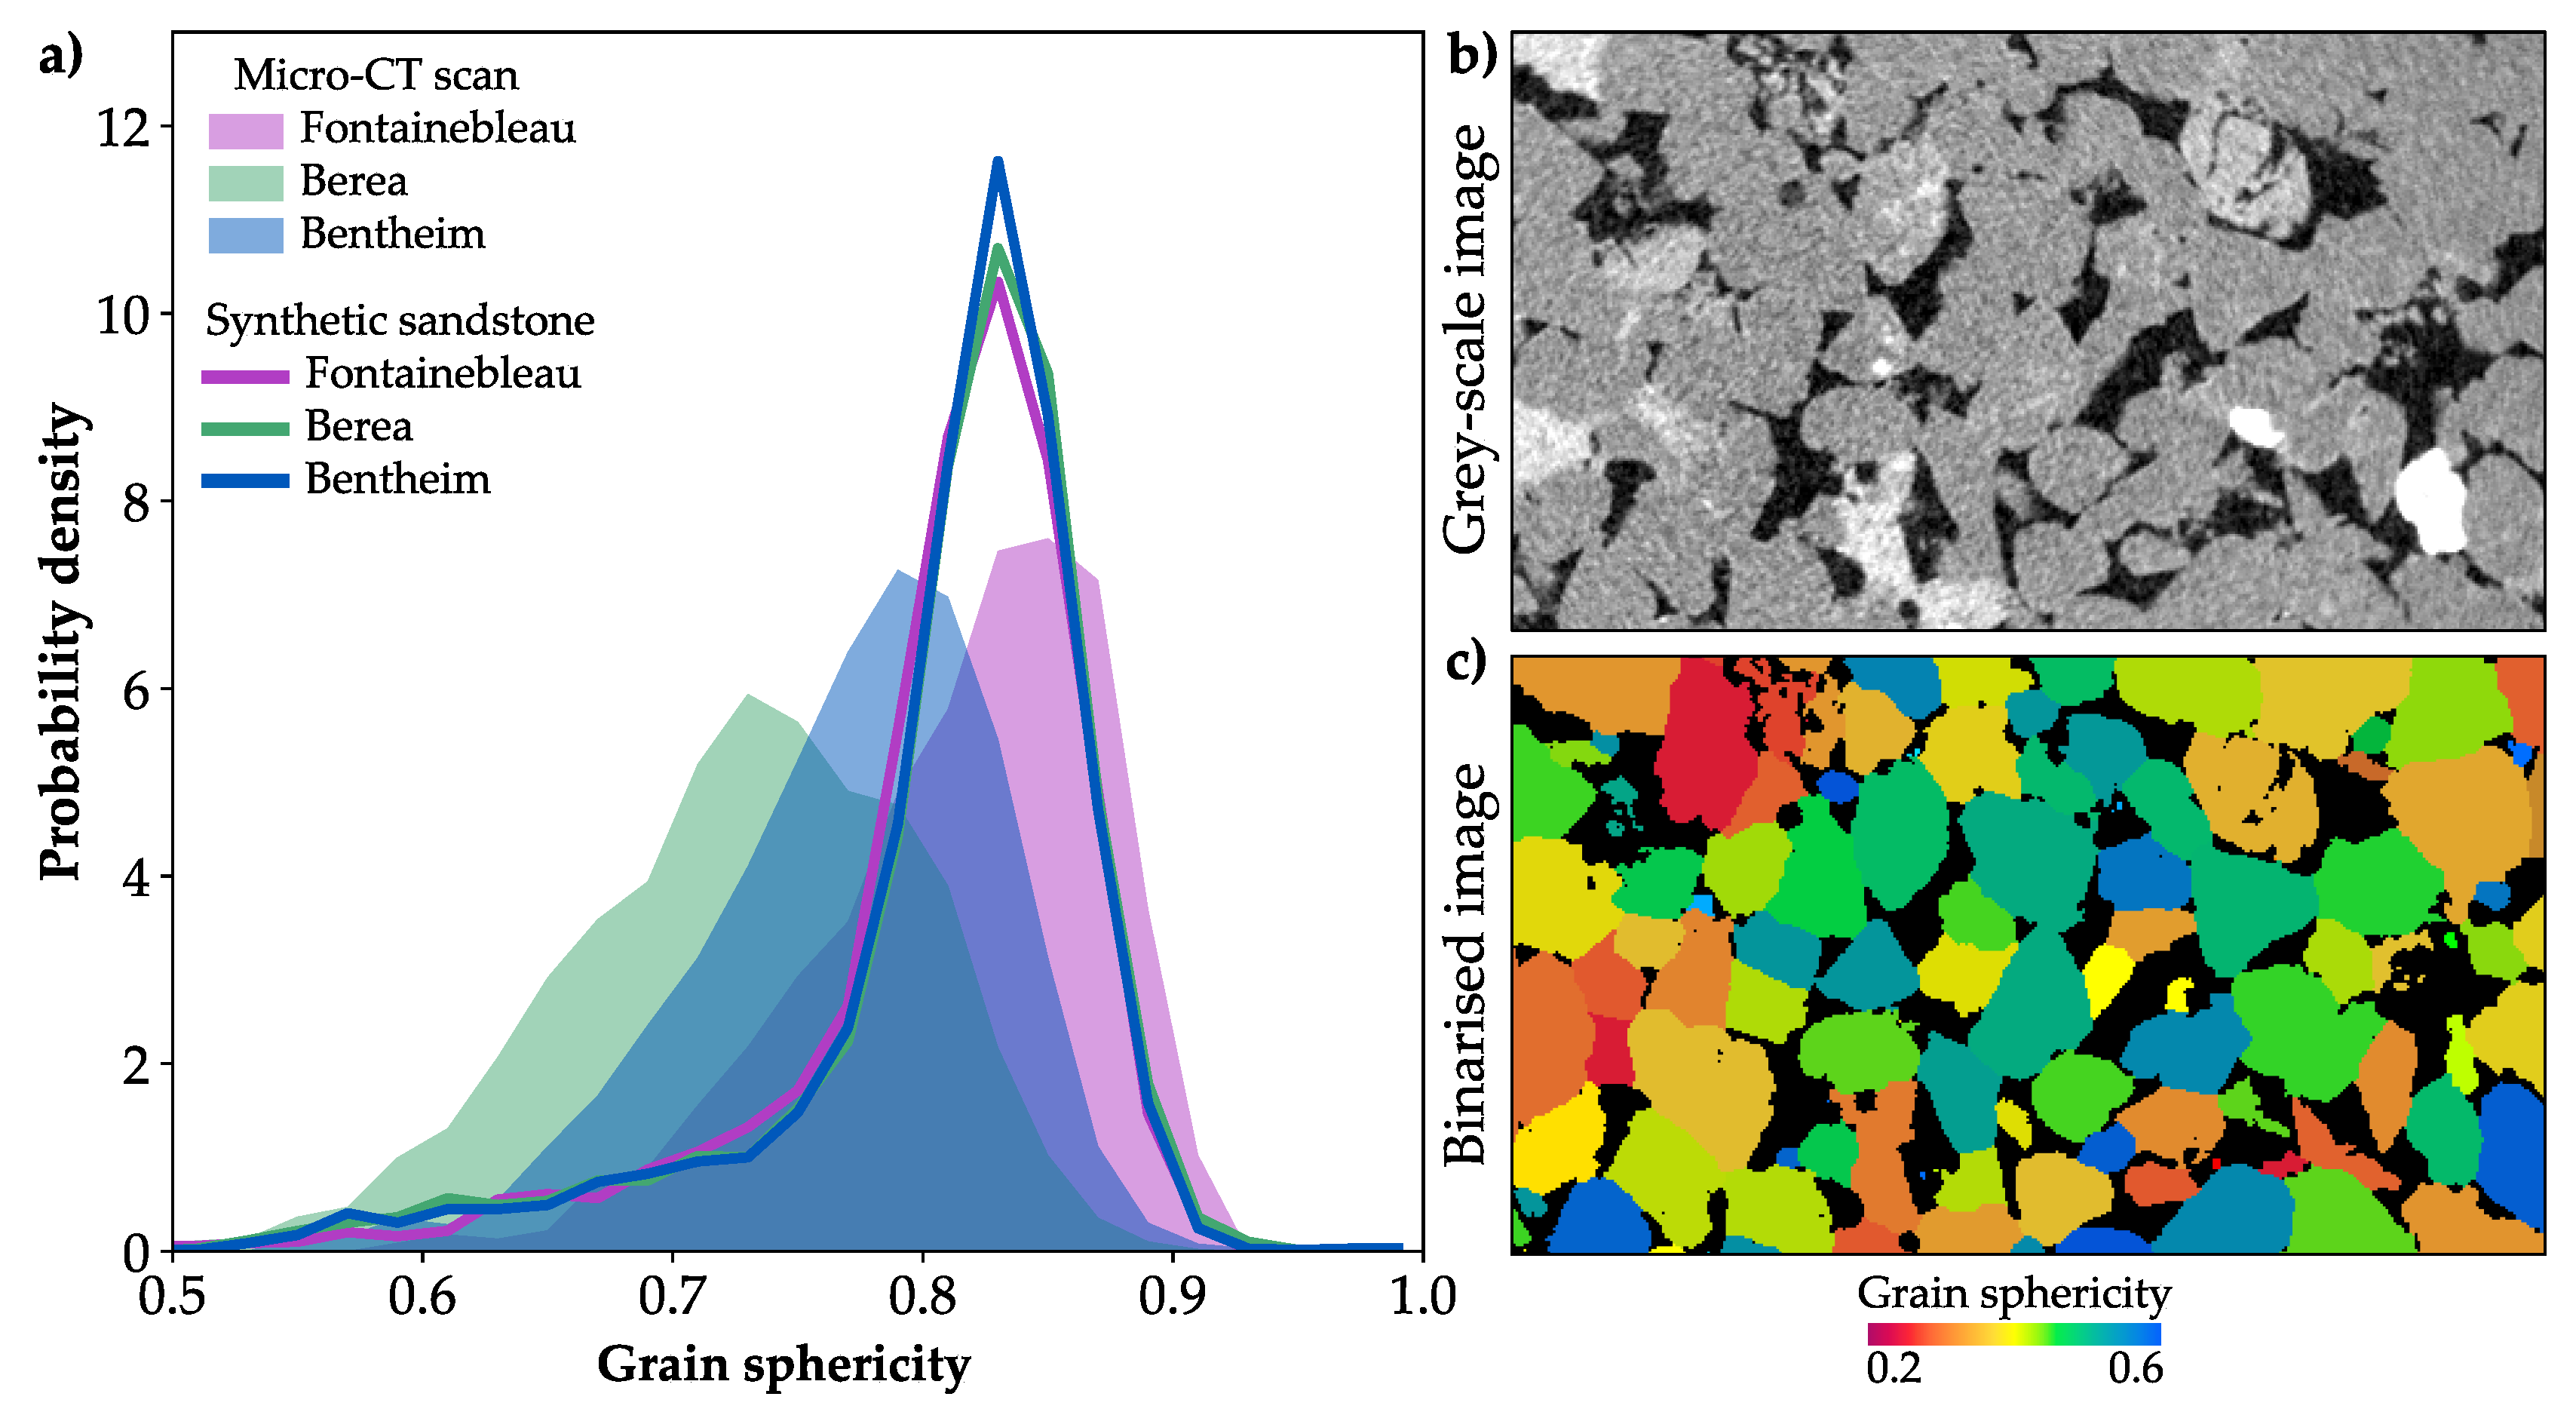
All stress-dependent synthetic sandstone samples exhibit a similar distribution in sphericity and have the same mean value of 0.81 (Table 4). For the Fontainebleau sandstone, this value matches that one of the micro-CT scan, whereas the sphericities of the natural Berea and Bentheim samples are considerably lower with 0.73 and 0.77, respectively (Figure 8a). Especially the Berea sample comprises several granulometric irregularities such as cracked grains, degraded feldspars or carbonate cement patches (Figure 8b), which produce lower grain sphericities (Figure 8c), and are not considered in the synthetic samples.
4. Discussion
4.1. Cementation Scheme to Construct a Synthetic Sandstone
The results clearly demonstrate that a purely uniform cementation does not reflect a natural sandstone evolution. It leads to systematically lower bulk and shear moduli compared to the micro-CT scans, which is particularly noticeable at higher porosities as for the Bentheim sample. The main reason for this discrepancy is the lack of a preferential contact stiffening. This is indicated by the number of grain contacts and their average diameter, which are lower here than for the other cementation scenarios (Section 3.2). Even though the evolving pore network and permeability decrease are similar to the stress-dependent approach, the resulting sphericity of the grains is comparatively high (Section 3.3).
The contact-preferential cementation scheme leads to considerably stiffer synthetic sandstones compared to their natural equivalents (Section 3.2), since it considers the initially strong increase in bulk and shear moduli due to successive filling of grain contacts. Moreover, the preferential contact cementation implies the progressive closure of throats, resulting in a strong decrease in permeability and an unrealistic pore network with fewer but larger throats (Section 3.3). Bearing in mind that this is a purely geometrical scheme, it still offers a good approximation for contact cementation at high porosities, which is comparable to the iteratively computed cementation around stress peaks.
The stress-dependent cemented samples exhibit granulometric and elastic rock properties, which are in good accordance with the respective micro-CT scans and show consistent permeabilities, at least for the Fontainebleau sandstone. This approach combines both: an initial grain contact cementation until the stress at the contacts is relatively evenly distributed, followed by a uniform quartz overgrowth. The overestimation of the permeabilities for the Berea and Bentheim samples can be related to granulometric irregularities as, e.g., cracked grains, degraded feldspars, carbonate patches or throat-clogging clays (Figure 8b), which considerably affect the morphology of the pore space. The successively lower sphericities of 0.77 for the Bentheim and 0.71 for the Berea sandstone can be associated to the permeability overestimation by a factor of 1.4 and 2.2, respectively (Table 4). The sphericities are at least an indicator for the granulometric heterogeneities, which are in turn the result of more complex diagenetic processes and beyond the scope of the present study.
For the synthetic samples, bulk and shear moduli can be associated with the number of grain contacts and their respective diameters. As demonstrated by Cook et al. [37], these parameters indicate that a greater number of long contacts effectively distributes stress and enhances the sample stiffness. However, especially the micro-CT scans of the Berea and Bentheim sandstones have considerably higher coordination numbers than the synthetic samples. Granulometric irregularities, which are not considered in the synthetic sandstones, can explain the difference in coordination number and contact diameter to the natural samples. Moreover, irregular shapes reduce the quality of watershed-based grain separation, and thereby can cause a higher number of grain contacts. By contrast, grains of the synthetic samples are initially labelled, therefore the calculated contact number is more reliable, since it does not depend on image quality.
4.2. Comparison to Analytical Approaches
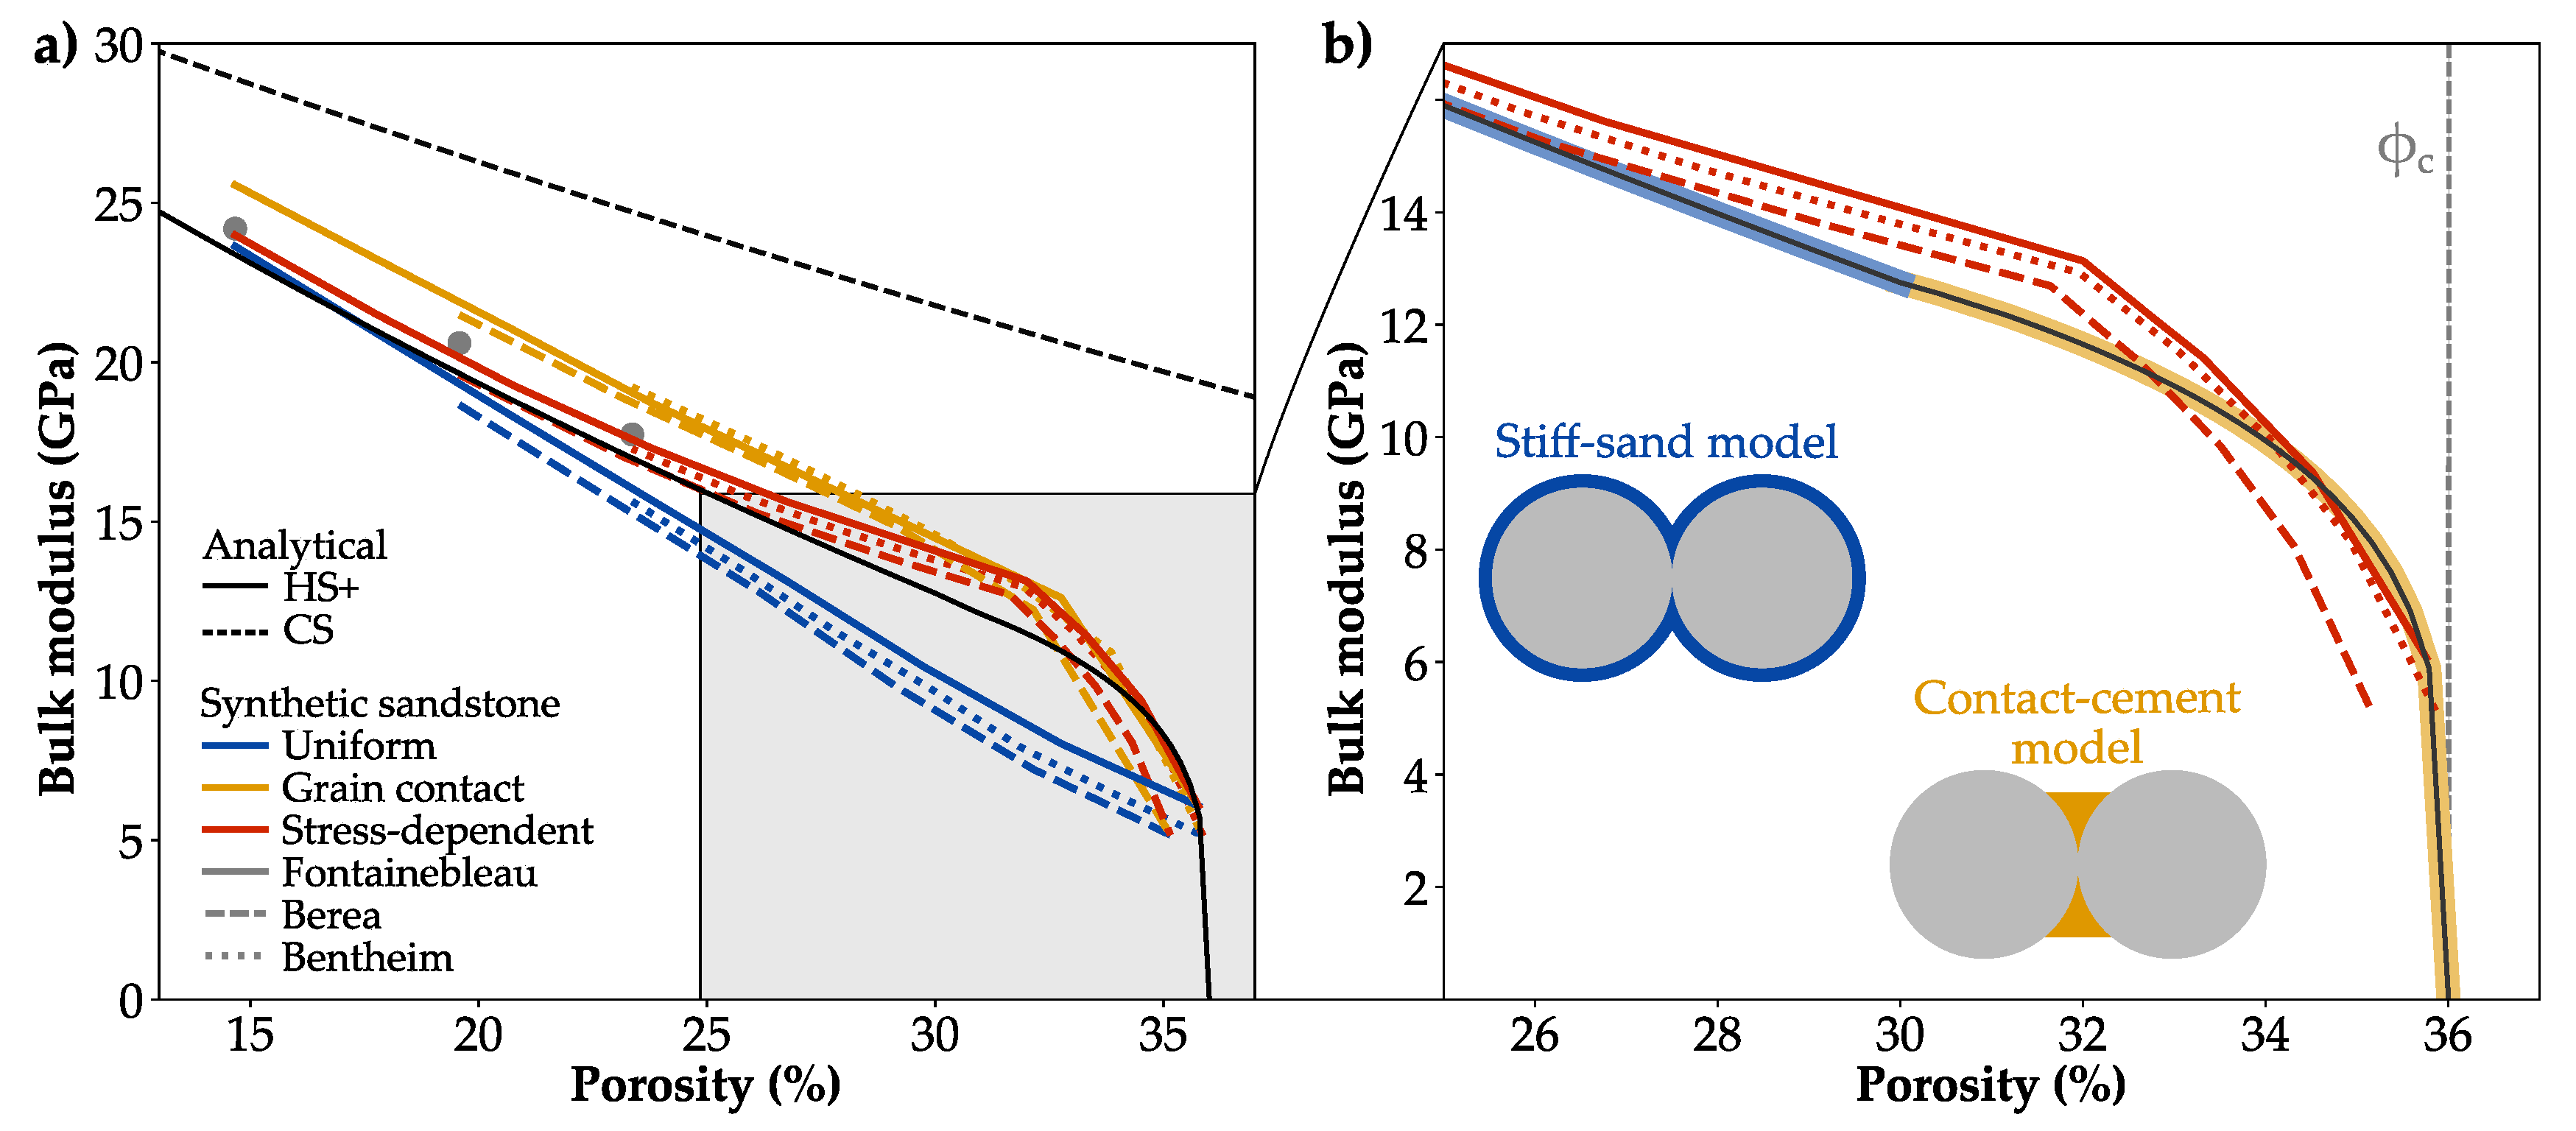
Digital rock physics is known to quantify changes in elastic rock moduli with an increased accuracy compared to effective medium approaches as, e.g., the Hashin-Shtrikman bounds [12], since these depict the microstructural complexity of the rock [55]. In order to improve the theoretical estimations, Dvorkin and Nur [56] introduced a contact-cement model, which captures the strong stiffness increase with small changes in porosity, as cement is added solely at the contacts of spherical particles. Their model is used to predict elastic properties of soft sediments and high-porosity sandstones [56,57]. To describe the diagenetic stiffening trend over a broad range of porosities, the contact-cement scheme is combined with the stiff-sand model [40,57], which represents a modified upper Hashin-Shtrikman bound [12] connecting the pure mineral endpoint with the cemented sand-pack. The effective bulk () and shear moduli () are calculated by Equations (1) and (2), respectively.
where and are the effective bulk and shear moduli, respectively, calculated by the contact-cement model assuming a random pack of identical spheres with nine grain contacts and a critical porosity () of 36%. Contact cementation is calculated up to a porosity of 30%, followed by the uniform grain enlargement determined by the stiff-sand model (Figure 9b).
As expected, the simple Hashin-Shtrikman upper bound clearly overestimates the bulk moduli by up to a factor of 4.2 for the unconsolidated sediments (Figure 9a). By contrast, the combination of the analytical contact-cement and stiff-sand models shows a diagenetic trend analogous to the simulated stress-dependent cementation scheme (Figure 9a). The slight differences of 13% in maximum can be explained by the variations in grain size, sorting and shape of the synthetic samples as well as the stress peaks definition of the voxel-based cementation scheme.
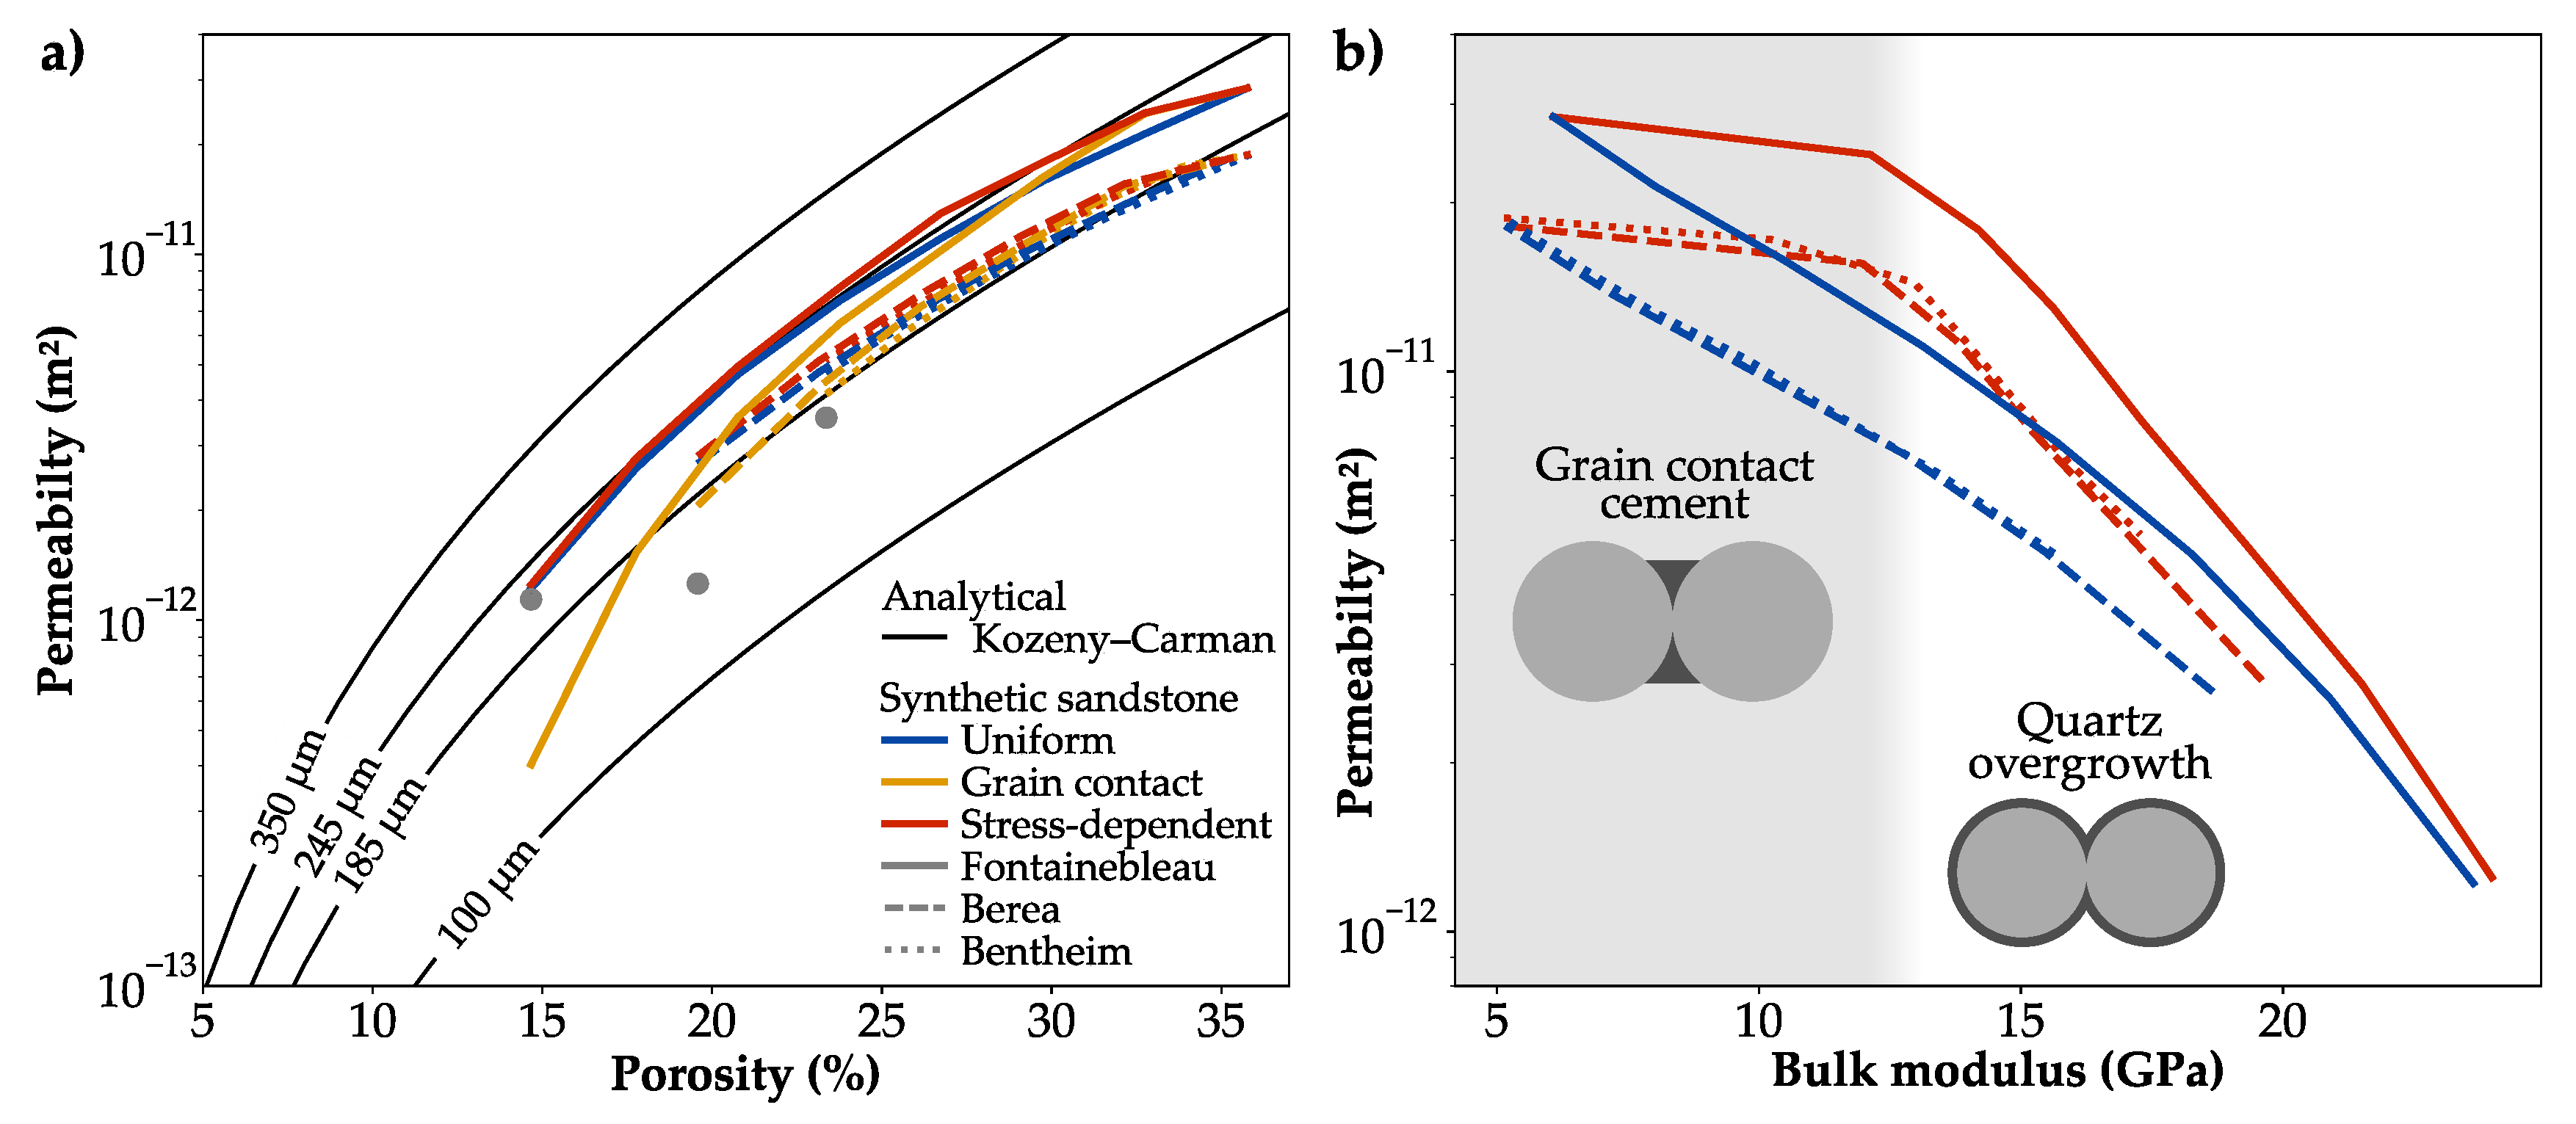
To estimate the permeability of a sediment depending on porosity and particle size, the Kozeny–Carman [58,59] relation is often used (Equation (3)).
where is the average grain diameter and the sphericity, which is assumed to be 1 for an ideal sphere pack. Generally, the uniform as well as the stress-dependent scheme produce a comparable trend of the porosity-permeability relation as the Kozeny–Carman approach with the same grain size (Figure 10a). Again, slight differences can be related to the microstructure of the analytical sphere pack and realistic variations in grain size, sorting and shape of the synthetic sample.
The general accordance with the analytical contact-cement model as well as the Kozeny–Carman approach confirms that the stress-dependent cementation scheme is able to produce realistic changes in microstructure and physical rock properties over a wide range of porosities. Plotting the cross-trends for permeability and bulk moduli clearly illustrates the fundamental differences in the diagenetic steps, captured by the stress-dependent scheme, only: the initial cementation of grain contacts strongly stiffens the sediment, but has only a limited effect on its hydraulic behaviour (Figure 10b). The subsequent quartz growth equally affects permeabilities as well as elastic properties.
4.3. Advantages and Opportunities of Synthetic Sandstones
The presented process-based approach offers the possibility to generate highly resolved synthetic sandstones by simulating the gravity-driven deposition of irregular grains as well as their diagenetic consolidation. The use of synthetic samples can overcome major limitations and common error sources of micro-CT scans, since the different rock components are initially labelled and do not need to be extracted by segmentation and image processing. In contrast to micro-CT images, the resolution of the synthetic sample is definable and can be increased to properly depict microstructural features such as small pores and grain contacts. This is of particular importance for an accurate computation of rock stiffness [60], which is often consistently higher than in laboratory-measurements [9], especially for more porous and less consolidated samples [61]. An improvement of the image resolution is limited by the computational power and requires a balance of benefits. Nevertheless, a subset of the synthetic sample can be used to quantify the effect of grain contact resolution [21]. Moreover, softer material moduli for the amorphous cemented phase [15] or solely the pressure sensitive grain contacts [62] can be used to further improve the elastic property prediction and reduce an overestimation.
In the field of digital rock physics, macroscopic rock properties are studied based on a microstructural representation of the granular rock. A direct upscaling to reservoir scale is still controversial, since larger scale heterogeneities as fissures, fractures or facies changes are not taken into account. Nevertheless, the synthetic sandstone samples have the potential to overcome the requirement to simplify pores or grains by spheres or ellipsoids. The latter is a common assumption in many analytical solutions predicting petrophysical properties, neglecting substantially mechanical aspects of natural grain shapes, sizes and arrangements.
The simulated diagenetic cementation systematically modifies the microstructure of rocks and allows to quantify trends among the geometric, hydraulic and mechanical rock properties, subsequently affecting the reservoir quality. Using a synthetic sample provides further the opportunity to investigate various compositions of the grains (e.g., quartz, feldspar, granular carbonates) or the cemented phase (e.g., silica, carbonate, clay) to assess their effect on physical rock properties. Moreover, the approach generally enables to alter the microstructure and focus on granulometric irregularities as cracked grains, carbonate patches or throat-clogging clays, which would additionally improve the permeability prediction of reservoir sandstones as the Berea or Bentheim samples.
The results clearly demonstrate that the granulometric, elastic and hydraulic properties of the synthetic sandstones are in good agreement with their natural equivalents, especially in case of the Fontainebleau sample. Hence, the presented approach allows to efficiently generate sandstone samples over a broad range of porosities with any desired size, sorting and shape of convex grains. In view of a virtual laboratory, these generated synthetic samples can be further altered to examine the impact of mineral dissolution [63,64] or precipitation [65,66] as well as synthetic fractures [67,68]. Hence, the understanding of various petrophysical correlations can be improved by this cost-effective digital approach. Quantifying the impact of different pore-scale processes on hydraulic and mechanical reservoir properties is of particular importance for numerous applications related to geological subsurface utilisation, including geothermal systems [69,70], energy storage [71,72], hydrocarbon reservoirs [73,74], nuclear waste disposal [75,76] or groundwater resources [77,78].
5. Conclusions
In the present study, micro-CT scans of three reservoir sandstones are reconstructed by a process-based method, which includes the gravity-driven deposition of irregular grains as well as their diagenetic cementation. Therefore, the shapes and size distributions of the grains are extracted from the respective micro-CT scans, whereby three voxel-based approaches are applied to consolidate the deposited synthetic sediments: a uniform, grain contact-preferential and stress-dependent scheme. The resulting highly resolved synthetic samples of the Fontainebleau, Berea and Bentheim sandstones comprise porosities of 14.7%, 19.6% and 23.4%, respectively.
The employed cementation schemes systematically alter the microstructure, which results in contrasting diagenetic trends in geometrical, transport and mechanical parameters. A uniform quartz overgrowth continuously alters the pore space resulting in systematically lower elastic properties compared to the natural samples. This is particularly noticeable for higher porosities, since grain contacts are comparably less cemented and the stresses are more localised. By contrast, a successive grain contact cementation initially leads to a rapid stiffening of the sample with small changes in porosity. The rigorous filling of contacts implies a progressive clogging of particularly smaller throats, resulting in an unrealistic low-connected pore network and a strong decrease in permeability. Moreover, contact-preferential cemented samples are considerably stiffer than the respective micro-CT scans. The stress-dependent scheme combines both approaches of contact-cement and quartz overgrowth. It comprises also a strong initial stiffening, since mineral growth around stress peaks effectively cements grain contacts. For the Fontainebleau sample, the bulk modulus is doubled to 12.1 GPa at a porosity reduction of 2.4%. This initial contact stiffening, followed by a uniform alteration of the microstructure, is essential to produce samples with equivalent granulometric and elastic properties as the respective micro-CT scans. Bulk moduli only slightly differ by 0.8%, 4.9% and 2.5% for the Fontainebleau, Berea and Bentheim sandstones, respectively. Moreover, with a deviation of 10% the permeability and pore network are in a good agreement at least for the Fontainebleau sandstone. The synthetic Berea and Bentheim samples are considerably better connected and exhibit higher permeabilities, since these are not considering granulometric irregularities of the respective micro-CT scans such as cracked grains, degraded feldspars or carbonate cement patches.
The presented process-based approach is able to produce highly resolved synthetic samples, comprising the microstructural complexity as well as hydraulic and elastic properties of representative natural sandstones. Thus, a variety of synthetic samples can be efficiently generated over a broad range of porosities, considering any desired size, sorting and shape of grains. The generation of sandstone samples can further overcome major limitations of micro-CT scans, such as the resolution of complex microstructural features, and further minimise common error sources related to image processing and filtering. Moreover, the synthetic samples can be altered by virtual experiments, offering a cost-effective way to examine the impact of, e.g., precipitation or dissolution as well as fracturing on various petrophysical correlations. Thereby, the evolution of physical properties can be determined for specific processes and granular rocks. Hence, the presented method has the potential to overcome the requirement of simplifying pores and grains to spheres or ellipsoids, which is the case for numerous analytical approaches. An accurate quantification of the evolving trends among geometric, hydraulic and mechanical rock properties is of particular importance to improve the predictive capabilities of reservoir models, and thereby contributes to a sustainable exploration and utilisation of the geological subsurface.
Author Contributions
M.W., T.K., and M.K. conceived and designed the simulations; M.W. performed the research; M.W. and T.K. analysed the data; M.W., T.K., and M.K. wrote the paper. All authors read and agreed to the published version of the manuscript.
Funding
The authors gratefully acknowledge the funding received for the Geo:N project GEOSMART (Grant 03G0867E) by the German Federal Ministry for Education and Research (BMBF).
Data Availability Statement
The underling microstructures of the sandstones are publicly available at the Digital Rocks Portal: https://0-doi-org.brum.beds.ac.uk/10.17612/P7MH3M [29].
Acknowledgments
The authors would like to thank Edward Garboczi for providing the parallel version of NISTIR 6269 and Mustafa Al Ibrahim for his helpful support in using the particle pack generator “Particula”.
Conflicts of Interest
The authors declare no conflict of interest.
References
- Herring, A.; Middleton, J.; Walsh, R.; Kingston, A.; Sheppard, A. Flow rate impacts on capillary pressure and interface curvature of connected and disconnected fluid phases during multiphase flow in sandstone. Adv. Water Resour. 2017, 107, 460–469. [Google Scholar] [CrossRef]
- Blunt, M.; Bijeljic, B.; Dong, H.; Gharbi, O.; Iglauer, S.; Mostaghimi, P.; Paluszny, A.; Pentland, C. Pore-scale imaging and modelling. Adv. Water Resour. 2013, 51, 197–216. [Google Scholar] [CrossRef] [Green Version]
- Saenger, E.; Vialle, S.; Lebedev, M.; Uribe, D.; Osorno, M.; Duda, M.; Steeb, H. Digital carbonate rock physics. Solid Earth 2016, 7, 1185–1197. [Google Scholar] [CrossRef] [Green Version]
- Shulakova, V.; Sarout, J.; Pimienta, L.; Lebedev, M.; Mayo, S.; Clennell, M.; Pervukhina, M. Effect of supercritical CO2 on carbonates: Savonnières sample case study. Geophys. Prospect. 2017, 65, 251–265. [Google Scholar] [CrossRef] [Green Version]
- Wu, Y.; Lin, C.; Yan, W.; Liu, Q.; Zhao, P.; Ren, L. Pore-scale simulations of electrical and elastic properties of shale samples based on multicomponent and multiscale digital rocks. Mar. Pet. Geol. 2020, 117, 104369. [Google Scholar] [CrossRef]
- Keehm, Y.; Mukerji, T.; Nur, A. Computational rock physics at the pore scale: Transport properties and diagenesis in realistic pore geometries. Lead. Edge 2001, 20, 180–183. [Google Scholar] [CrossRef]
- Schepp, L.; Ahrens, B.; Balcewicz, M.; Duda, M.; Nehler, M.; Osorno, M.; Uribe, D.; Steeb, H.; Nigon, B.; Stöckhert, F.; et al. Digital rock physics and laboratory considerations on a high-porosity volcanic rock. Sci. Rep. 2020, 10, 1–16. [Google Scholar] [CrossRef] [PubMed] [Green Version]
- Ettemeyer, F.; Lechner, P.; Hofmann, T.; Andrä, H.; Schneider, M.; Grund, D.; Volk, W.; Günther, D. Digital sand core physics: Predicting physical properties of sand cores by simulations on digital microstructures. Int. J. Solids Struct. 2020, 188, 155–168. [Google Scholar] [CrossRef]
- Madonna, C.; Almqvist, B.; Saenger, E. Digital rock physics: Numerical prediction of pressure-dependent ultrasonic velocities using micro-CT imaging. Geophys. J. Int. 2012, 189, 1475–1482. [Google Scholar] [CrossRef] [Green Version]
- Faisal, T.; Islam, A.; Jouini, M.; Devarapalli, R.; Jouiad, M.; Sassi, M. Numerical prediction of carbonate elastic properties based on multi-scale imaging. Geomech. Energy Environ. 2019, 20, 100125. [Google Scholar] [CrossRef]
- Saxena, N.; Hofmann, R.; Alpak, F.; Dietderich, J.; Hunter, S.; Day-Stirrat, R. Effect of image segmentation and voxel size on micro-CT computed effective transport and elastic properties. Mar. Pet. Geol. 2017, 86, 972–990. [Google Scholar] [CrossRef]
- Hashin, Z.; Shtrikman, S. A variational approach to the elastic behavior of multiphase materials. J. Mech. Phys. Solids 1963, 11, 127–140. [Google Scholar] [CrossRef]
- Kuster, G.; Toksöz, N. Velocity and attenuation of seismic waves in two-phase media: Part I—Theoretical formulations. Geophysics 1974, 39, 587–606. [Google Scholar] [CrossRef]
- Hill, R. A self-consistent mechanics of composite materials. J. Mech. Phys. Solids 1965, 13, 213–222. [Google Scholar] [CrossRef]
- Sain, R.; Mukerji, T.; Mavko, G. On microscale heterogeneity in granular media and its impact on elastic property estimation. Geophysics 2016, 81, D561–D571. [Google Scholar] [CrossRef]
- Mahmoodlu, M.; van Genuchten, M.; Sweijen, T.; Raoof, A. Unsaturated hydraulic properties of heterogeneously packed sands: A pore-scale computational study. J. Hydrol. 2018, 565, 570–580. [Google Scholar] [CrossRef]
- Øren, P.E.; Bakke, S. Process based reconstruction of sandstones and prediction of transport properties. Transp. Porous Media 2002, 46, 311–343. [Google Scholar] [CrossRef]
- Wadell, H. Volume, shape, and roundness of quartz particles. J. Geol. 1935, 43, 250–280. [Google Scholar] [CrossRef]
- Garcia, X.; Akanji, L.; Blunt, M.; Matthai, S.; Latham, J. Numerical study of the effects of particle shape and polydispersity on permeability. Phys. Rev. E Stat. Nonlinear Soft Matter Phys. 2009, 80, 021304. [Google Scholar] [CrossRef] [Green Version]
- Torskaya, T.; Shabro, V.; Torres-Verdín, C.; Salazar-Tio, R.; Revil, A. Grain shape effects on permeability, formation factor, and capillary pressure from pore-scale modeling. Transp. Porous Media 2014, 102, 71–90. [Google Scholar] [CrossRef]
- Kerimov, A.; Mavko, G.; Mukerji, T.; Dvorkin, J.; Al Ibrahim, M. The influence of convex particles’ irregular shape and varying size on porosity, permeability, and elastic bulk modulus of granular porous media: Insights from numerical simulations. J. Geophys. Res. Solid Earth 2018, 123, 10563–10582. [Google Scholar] [CrossRef]
- Schneider, M.; Hofmann, T.; Andrä, H.; Lechner, P.; Ettemeyer, F.; Volk, W.; Steeb, H. Modelling the microstructure and computing effective elastic properties of sand core materials. Int. J. Solids Struct. 2018, 143, 1–17. [Google Scholar] [CrossRef]
- Al Ibrahim, M.; Kerimov, A.; Mukerji, T.; Mavko, G. Particula: A simulator tool for computational rock physics of granular media. Geophysics 2019, 84, F85–F95. [Google Scholar] [CrossRef]
- Sain, R. Numerical Simulation of Pore-Scale Heterogeneity and Its Effects on Elastic, Electrical and Transport Properties. Ph.D. Thesis, Stanford University, Stanford, CA, USA, 2010. [Google Scholar]
- Hosa, A.; Wood, R. Order of diagenetic events controls evolution of porosity and permeability in carbonates. Sedimentology 2020, 67, 1–13. [Google Scholar] [CrossRef] [Green Version]
- Singh, J.; Cilli, P.; Hosa, A.; Main, I. Digital rock physics in four dimensions: Simulating cementation and its effect on seismic velocity. Geophys. J. Int. 2020, 222, 1606–1619. [Google Scholar] [CrossRef]
- Andrä, H.; Combaret, N.; Dvorkin, J.; Glatt, E.; Han, J.; Kabel, M.; Keehm, Y.; Krzikalla, F.; Lee, M.; Madonna, C.; et al. Digital rock physics benchmarks—Part II: Computing effective properties. Comput. Geosci. 2013, 50, 33–43. [Google Scholar] [CrossRef]
- Folk, R.; Ward, W. Brazos river bar: A study in the significance of grain size parameters. J. Sediment. Res. 1957, 3–26. [Google Scholar] [CrossRef]
- Herring, A.; Sheppard, A.; Turner, M.; Beeching, L. Multiphase flows in sandstones. Digit. Rocks Portal 2018. [Google Scholar] [CrossRef]
- Herring, A.; Robins, V.; Sheppard, A. Topological persistence for relating microstructure and capillary fluid trapping in sandstones. Water Resour. Res. 2019, 55, 555–573. [Google Scholar] [CrossRef] [Green Version]
- Otsu, N. A threshold selection method from gray-level histograms. IEEE Trans. Syst. Man Cybern. 1979, 9, 62–66. [Google Scholar] [CrossRef] [Green Version]
- Churcher, P.; French, P.; Shaw, J.; Schramm, L. Rock properties of Berea sandstone, Baker dolomite, and Indiana limestone. In Proceedings of the SPE International Symposium on Oilfield Chemistry, Anaheim, CA, USA, 20–22 February 1991; pp. 431–446. [Google Scholar] [CrossRef]
- Peksa, A.; Wolf, K.H.; Zitha, P. Bentheimer sandstone revisited for experimental purposes. Mar. Pet. Geol. 2015, 67, 701–719. [Google Scholar] [CrossRef]
- Schindelin, J.; Rueden, C.; Hiner, M.; Eliceiri, K. The ImageJ ecosystem: An open platform for biomedical image analysis. Mol. Reprod. Dev. 2015, 82, 518–529. [Google Scholar] [CrossRef] [PubMed] [Green Version]
- Legland, D.; Arganda-Carreras, I.; Andrey, P. MorphoLibJ: Integrated library and plugins for mathematical morphology with ImageJ. Bioinformatics 2016, 32, 3532–3534. [Google Scholar] [CrossRef] [Green Version]
- Gostick, J.; Khan, Z.; Tranter, T.; Kok, M.; Agnaou, M.; Sadeghi, M.; Jervis, R. PoreSpy: A python toolkit for quantitative analysis of porous media images. J. Open Source Softw. 2019, 4, 1296. [Google Scholar] [CrossRef]
- Cook, J.; Goodwin, L.; Boutt, D.; Tobin, H. The effect of systematic diagenetic changes on the mechanical behavior of a quartz-cemented sandstone. Geophysics 2015, 80, D145–D160. [Google Scholar] [CrossRef]
- Bohn, R.; Garboczi, E. User Manual for Finite Element and Finite Difference Programs: A Parallel Version of NISTIR 6269; National Institute of Standards and Technology: Gaithersburg, MD, USA, 2003. [Google Scholar]
- Garboczi, E.; Day, A. An algorithm for computing the effective linear elastic properties of heterogeneous materials: Three-dimensional results for composites with equal phase poisson ratios. J. Mech. Phys. Solids 1995, 43, 1349–1362. [Google Scholar] [CrossRef]
- Mavko, G.; Mukerji, T.; Dvorkin, J. The Rock Physics Handbook—Tools for Seismic Analysis of Porous Media; Cambridge University Press: Cambridge, UK, 2009; p. 524. [Google Scholar] [CrossRef]
- Weller, H.; Tabor, G.; Jasak, H.; Fureby, C. A tensorial approach to computational continuum mechanics using object-oriented techniques. Comput. Phys. 1998, 12, 620–631. [Google Scholar] [CrossRef]
- Bear, J. Dynamics of Fluids in Porous Media; Environmental Science Series; American Elsevier Publications: New York, NY, USA, 1972. [Google Scholar]
- Raeini, A.Q.; Blunt, M.; Bijeljic, B. Modelling two-phase flow in porous media at the pore scale using the volume-of-fluid method. J. Comput. Phys. 2012, 231, 5653–5668. [Google Scholar] [CrossRef]
- Mostaghimi, P.; Blunt, M.; Bijeljic, B. Computations of absolute permeability on micro-CT images. Math. Geosci. 2013, 45, 103–125. [Google Scholar] [CrossRef]
- Liu, Z.; Herring, A.; Arns, C.; Berg, S.; Armstrong, R. Pore-scale characterization of two-phase flow using integral geometry. Transp. Porous Media 2017, 118, 99–117. [Google Scholar] [CrossRef]
- Saxena, N.; Hows, A.; Hofmann, R.; Alpak, F.O.; Freeman, J.; Hunter, S.; Appel, M. Imaging and computational considerations for image computed permeability: Operating envelope of digital rock physics. Adv. Water Resour. 2018, 116, 127–144. [Google Scholar] [CrossRef]
- Cundall, P.; Strack, O. A discrete numerical model for granular assemblies. Géotechnique 1979, 29, 47–65. [Google Scholar] [CrossRef]
- Perlin, K. Improving noise. In Proceedings of the 29th Annual Conference on Computer Graphics and Interactive Techniques, San Antonio, TX, USA, 23–26 July 2002; pp. 681–682. [Google Scholar] [CrossRef]
- Zhang, H.; Makse, H. Jamming transition in emulsions and granular materials. Phys. Rev. E 2005, 72, 1–12. [Google Scholar] [CrossRef] [PubMed] [Green Version]
- Serra, O. Fundamentals of Well-Log Interpretation: The Interpretation of Logging Data; Elsevier Science: Amsterdam, The Netherlands, 1986; p. 684. [Google Scholar]
- Chapman, R. Petroleum Geology; Elsevier Science: Amsterdam, The Netherlands, 1983; p. 414. [Google Scholar]
- Beard, D.; Weyl, P. Influence of texture on porosity and permeability of unconsolidated sand. AAPG Bull. 1973, 57, 349–369. [Google Scholar] [CrossRef]
- Silin, D.; Patzek, T. Pore space morphology analysis using maximal inscribed spheres. Phys. A Stat. Mech. Its Appl. 2006, 371, 336–360. [Google Scholar] [CrossRef]
- Giles, M.; Indrelid, S.; Beynon, G.; Amthor, J. The origin of large-scale quartz cementation: Evidence from large data sets and coupled heat-fluid mass transport modelling. In Quartz Cementation in Sandstones; Worden, R., Morad, S., Eds.; John Wiley & Sons: New York, NY, USA, 2000; pp. 21–38. [Google Scholar] [CrossRef]
- Wetzel, M.; Kempka, T.; Kühn, M. Predicting macroscopic elastic rock properties requires detailed information on microstructure. Energy Procedia 2017, 125, 561–570. [Google Scholar] [CrossRef]
- Dvorkin, J.; Nur, A. Elasticity of high-porosity sandstones: Theory for two North Sea data sets. Geophysics 1996, 61, 890–893. [Google Scholar] [CrossRef]
- Avseth, P.; Mukerji, T.; Mavko, G.; Dvorkin, J. Rock-physics diagnostics of depositional texture, diagenetic alterations, and reservoir heterogeneity in high-porosity siliciclastic sediments and rocks—A review of selected models and suggested work flows. Geophysics 2010, 75, 75A31. [Google Scholar] [CrossRef]
- Kozeny, J. Über kapillare Leitung des Wassers im Boden. Sitzungsberichte Akad. Wiss. Wien 1927, 136, 271–306. [Google Scholar]
- Carman, P. Fluid flow through granular beds. Trans. Inst. Chem. Eng. 1937, 15, 150–166. [Google Scholar] [CrossRef]
- Saxena, N.; Hofmann, R.; Hows, A.; Saenger, E.; Duranti, L.; Stefani, J.; Wiegmann, A.; Kerimov, A.; Kabel, M. Rock compressibility from microcomputed tomography images: Controls on digital rock simulations. Geophysics 2019, 84, WA127–WA139. [Google Scholar] [CrossRef]
- Lee, M.; Keehm, Y.; Song, D. Quantitative analysis of resolution and smoothing effects of digital pore microstructures on numerical velocity estimation. Geosci. J. 2017, 21, 431–440. [Google Scholar] [CrossRef]
- Saenger, E.; Lebedev, M.; Uribe, D.; Osorno, M.; Vialle, S.; Duda, M.; Iglauer, S.; Steeb, H. Analysis of high-resolution X-ray computed tomography images of Bentheim sandstone under elevated confining pressures. Geophys. Prospect. 2016, 64, 848–859. [Google Scholar] [CrossRef]
- Miller, K.; Vanorio, T.; Keehm, Y. Evolution of permeability and microstructure of tight carbonates due to numerical simulation of calcite dissolution. J. Geophys. Res. Solid Earth 2017, 122, 4460–4474. [Google Scholar] [CrossRef]
- Lesueur, M.; Poulet, T.; Veveakis, M. Permeability hysteresis from microchannels opening during dissolution/reprecipitation cycle. Geophys. Res. Lett. 2020, 47, 1–8. [Google Scholar] [CrossRef]
- Wetzel, M.; Kempka, T.; Kühn, M. Hydraulic and mechanical impacts of pore space alterations within a sandstone quantified by a flow velocity-dependent precipitation approach. Materials 2020, 13, 3100. [Google Scholar] [CrossRef]
- Wetzel, M.; Kempka, T.; Kühn, M. Digital rock physics approach to simulate hydraulic effects of anhydrite cement in Bentheim sandstone. Adv. Geosci. 2020, 33–39. [Google Scholar] [CrossRef]
- Nie, X.; Zhang, C.; Wang, C.; Nie, S.; Zhang, J.; Zhang, C. Variable secondary porosity modeling of carbonate rocks based on μ-CT images. Open Geosci. 2019, 11, 617–626. [Google Scholar] [CrossRef]
- Buckman, J.; Higgins, S. A simple effective method for three-dimensional modelling of cementation, fracturing and dissolution of carbonate rocks: Illustrated through oolitic limestone. Geosciences 2019, 9, 246. [Google Scholar] [CrossRef] [Green Version]
- Tranter, M.; De Lucia, M.; Wolfgramm, M.; Kühn, M. Barite scale formation and injectivity loss models for geothermal systems. Water 2020, 12, 3078. [Google Scholar] [CrossRef]
- Tranter, M.; De Lucia, M.; Kühn, M. Numerical investigation of barite scaling kinetics in fractures. Geothermics 2021, 91, 102027. [Google Scholar] [CrossRef]
- Fischer, S.; Liebscher, A.; Zemke, K.; De Lucia, M.; KetzinTeam. Does injected CO2 affect (chemical) reservoir system integrity?—A comprehensive experimental approach. Energy Procedia 2013, 37, 4473–4482. [Google Scholar] [CrossRef] [Green Version]
- Hassannayebi, N.; Azizmohammadi, S.; De Lucia, M.; Ott, H. Underground hydrogen storage: Application of geochemical modelling in a case study in the Molasse Basin, Upper Austria. Environ. Earth Sci. 2019, 78, 1–14. [Google Scholar] [CrossRef] [Green Version]
- Zhang, B.; Okuno, R. Modeling of capacitance flow behavior in EOS compositional simulation. J. Pet. Sci. Eng. 2015, 131, 96–113. [Google Scholar] [CrossRef]
- Moghadasi, J.; Müller-Steinhagen, H.; Jamialahmadi, M.; Sharif, A. Model study on the kinetics of oil field formation damage due to salt precipitation from injection. J. Pet. Sci. Eng. 2004, 43, 201–217. [Google Scholar] [CrossRef]
- Hennig, T.; Kühn, M. Surrogate model for multi-component diffusion of uranium through opalinus clay on the host rock scale. Appl. Sci. 2021, 11, 786. [Google Scholar] [CrossRef]
- Dauzeres, A.; Le Bescop, P.; Sardini, P.; Cau Dit Coumes, C. Physico-chemical investigation of clayey/cement-based materials interaction in the context of geological waste disposal: Experimental approach and results. Cem. Concr. Res. 2010, 40, 1327–1340. [Google Scholar] [CrossRef]
- Koltzer, N.; Scheck-Wenderoth, M.; Bott, J.; Cacace, M.; Frick, M.; Sass, I.; Fritsche, J.; Bär, K. The effects of regional fluid flow on deep temperatures (Hesse, Germany). Energies 2019, 12, 2081. [Google Scholar] [CrossRef] [Green Version]
- Tillner, E.; Langer, M.; Kempka, T.; Kühn, M. Fault damage zone volume and initial salinity distribution determine intensity of shallow aquifer salinisation in subsurface storage. Hydrol. Earth Syst. Sci. 2016, 20, 1049–1067. [Google Scholar] [CrossRef] [Green Version]
Figure 1.
The microstructure of sandstones reflects the rock-forming processes involved in sediment deposition and diagenesis. While transport and deposition determine size, shape and sorting of the grains, diagenetic processes successively consolidate the sediment and alter its microstructure, e.g., by quartz overgrowth (blue) or grain contact cementation (orange).

Figure 2.
Micro-CT scans of the (a) Fontainebleau, (b) Berea, and (c) Bentheim sandstones. The individual grains are coloured by their volume-equivalent diameter. (d) Grain size distributions of the three sandstones exhibit different mean values and variances, and thus sorting. (e) Grain shape is described by the aspect ratio, which relates the major axis of an inertia ellipsoid to its minor axis.

Figure 3.
The workflow for constructing a synthetic sediment comprises (a) the gravity-driven deposition of 4000 grains, (b) the spatial discretisation of the sample for simulation purposes and (c) the removal of the highly porous boundary layer of 0.75 dGrain.
Figure 3.
The workflow for constructing a synthetic sediment comprises (a) the gravity-driven deposition of 4000 grains, (b) the spatial discretisation of the sample for simulation purposes and (c) the removal of the highly porous boundary layer of 0.75 dGrain.

Figure 4.
Schematic workflow of the stress-dependent cementation process: (a) Stress peaks (red) are determined by triaxial compression and the grain-lining voxels in their vicinity (yellow) are iteratively cemented until the stress criterion is met. Afterwards, the sample is uniformly cemented until the pre-defined porosity is achieved. (b) Evolution of the normalised stress distribution and (c) changes of the stress peak-defining threshold with decreasing porosity for the synthetic Fontainebleau sample. The stress criterion is met, when the threshold changes by less than 5% (red line).

Figure 5.
Evolution of mechanical and related granulometric properties for the micro-CT scans and the synthetic samples cemented by the uniform (blue), contact-preferential (orange) and stress-dependent scheme (red). (a) Diagenetic trends in bulk moduli for the three investigated sandstones. (b) Changes in coordination number and (c) grain contact diameter as well as (d) spatial cementation patterns at porosities of 32.8% and (e) 14.7% for the Fontainebleau sample.

Figure 6.
Microstructures and related changes in the stress distribution and pore network of the synthetic Bentheim samples compared to the respective micro-CT scan. (a) Cementation patterns of the uniform (blue), contact-preferential (orange) and stress-dependent scheme (red). (b) stress distribution. The grains of the 2003 voxel subsets are coloured by (c) normalised stress. (d) The connectivity is illustrated by the pore network of the 4003 voxel subsets, whereby the throats are coloured by (e) their respective diameters.

Figure 7.
Evolution of hydraulic and related geometric properties for the three synthetic samples cemented by the uniform (blue), contact-preferential (orange) and stress-dependent scheme (red). (a) Diagenetic trends in permeability for the three investigated sandstones. (b) Pore and (c) throat diameters, (d) connectivities as well as (e) grains sphericities for the three cementation scenarios (coloured lines), and the micro-CT scan of the Fontainebleau sandstone (grey-filled) at a porosity of 14.7%.

Figure 8.
(a) Distribution of grain sphericities for the Fontainebleau (magenta), Berea (green) and Bentheim sandstones (blue). (b) Micro-CT scan of the Berea sandstone shows granulometric irregularities such as cracked grains, degraded feldspars or carbonate cement patches, which affect the (c) sphericity of the watershed segmented grains and are not included in the synthetic samples.

Figure 9.
Evolution of the bulk modulus for the three synthetic samples cemented by the uniform (blue), contact-preferential (orange) and stress-dependent scheme (red) (a) compared to analytical solutions (black) as the Hashin-Shtrikman upper bound (HS+) and the combined contact-cement and stiff-sand model (CS). (b) Bulk moduli between porosities of 30% and 36% are calculated by the contact-cement model [56], while the stiff-sand model is applied for porosities below 30%.

Figure 10.
(a) Permeability evolution of the three synthetic samples cemented by the uniform (blue), contact-preferential (orange) and stress-dependent scheme (red) compared to the Kozeny–Carman approach (black) for different grain diameters. (b) Cross-trends for permeability and bulk modulus emphasise the requirement for the stress-dependent scheme combining initial contact cementation and subsequent quartz overgrowth.


Table 1.
Image size, resolution and granulometric properties of the investigated micro-CT scans (Fontainebleau, Berea and Bentheim sandstones).
Table 1.
Image size, resolution and granulometric properties of the investigated micro-CT scans (Fontainebleau, Berea and Bentheim sandstones).
| Samples | (%) | Image Size (Voxels) | Voxel Edge Length (m) | dGrain | Sorting (-) | Median (-) | |
|---|---|---|---|---|---|---|---|
| (Voxels) | (m) | ||||||
| Fontainebleau | 14.7 | 288 × 288 × 300 | 7.5 | 32.6 | 244 | 0.29 | 1.64 |
| Berea | 19.6 | 6003 | 4.6 | 39.9 | 185 | 0.47 | 1.72 |
| Bentheim | 23.4 | 5003 | 4.9 | 37.7 | 185 | 0.35 | 1.71 |
Table 2.
Granulometric, hydraulic and mechanical properties of the three unconsolidated synthetic sandstones (Fontainebleau, Berea and Bentheim).
Table 2.
Granulometric, hydraulic and mechanical properties of the three unconsolidated synthetic sandstones (Fontainebleau, Berea and Bentheim).
| Samples | Size (Voxel) | (%) | Connectivity (-) | k (10−12 m2) | kv/kh (-) | Coordination Number (-) | K (GPa) | G (GPa) |
|---|---|---|---|---|---|---|---|---|
| Fontainebleau | 4203 | 35.8 | 7.7 | 28.5 | 0.91 | 6.2 | 6.1 | 6.1 |
| Berea | 5503 | 35.1 | 7.5 | 18.2 | 0.88 | 6.1 | 5.2 | 5.1 |
| Bentheim | 5103 | 35.9 | 7.6 | 18.8 | 0.89 | 6.1 | 5.1 | 5.2 |
Table 3.
Mechanical and related granulometric properties of the micro-CT (CT) scans and the synthetic sandstone samples cemented by the three different schemes (U, C, S).
Table 3.
Mechanical and related granulometric properties of the micro-CT (CT) scans and the synthetic sandstone samples cemented by the three different schemes (U, C, S).
| Samples | K (GPa) | Deviation (%) | G (GPa) | Deviation (%) | dGrain (m) | Coordination Number (-) | dContact (m) | |
|---|---|---|---|---|---|---|---|---|
| Fontainebleau | CT | 24.2 | 26.6 | 244.5 | 9.3 | 90 | ||
| U | 23.6 | −2.3 | 25.9 | −2.6 | 246.3 | 8.9 | 96 | |
| C | 25.6 | +5.6 | 27.9 | +5.2 | 246.3 | 9.5 | 102 | |
| S | 24.0 | −0.8 | 26.2 | −1.4 | 246.2 | 9.0 | 101 | |
| Berea | CT | 20.6 | 21.8 | 184.7 | 10 | 66 | ||
| U | 18.7 | −9.4 | 20.0 | −8.3 | 186.0 | 8.2 | 66 | |
| C | 21.5 | +4.3 | 22.9 | +5.0 | 186.2 | 8.9 | 72 | |
| S | 19.6 | −4.9 | 20.7 | −4.7 | 186.1 | 8.3 | 73 | |
| Bentheim | CT | 17.7 | 17.9 | 184.6 | 8.6 | 64 | ||
| U | 15.6 | −11.9 | 16.5 | −8.0 | 185.2 | 7.8 | 60 | |
| C | 19.2 | +8.4 | 20.1 | +11.8 | 185.4 | 8.5 | 69 | |
| S | 17.3 | −2.5 | 17.9 | −0.6 | 185.4 | 7.9 | 71 |
CT—Micro-CT scan, U—Uniform cement, C—Grain contact cement, S—Stress-dependent cement.
Table 4.
Hydraulic and related geometric properties of the micro-CT scans (CT) and synthetic sandstone samples cemented by the three different schemes (U, C, S).
Table 4.
Hydraulic and related geometric properties of the micro-CT scans (CT) and synthetic sandstone samples cemented by the three different schemes (U, C, S).
| Samples | k (10−12 m2) | Deviation (%) | Median dThroat (m) | Connectivity (-) | (-) | |
|---|---|---|---|---|---|---|
| Fontainebleau | CT | 1.14 | 19.9 | 4.1 | 0.81 | |
| U | 1.22 | + 7 | 19.9 | 4.1 | 0.84 | |
| C | 0.40 | −65 | 27.3 | 2.3 | 0.83 | |
| S | 1.25 | +10 | 20.6 | 4.0 | 0.81 | |
| Berea | CT | 1.26 | 17.1 | 4.2 | 0.73 | |
| U | 2.68 | +113 | 18.9 | 5.0 | 0.84 | |
| C | 2.06 | +63 | 22.9 | 3.6 | 0.83 | |
| S | 2.75 | +118 | 19.6 | 4.9 | 0.81 | |
| Bentheim | CT | 3.58 | 21.4 | 4.6 | 0.77 | |
| U | 4.74 | +32 | 20.8 | 5.7 | 0.85 | |
| C | 4.15 | +16 | 25.5 | 4.3 | 0.83 | |
| S | 5.12 | +43 | 22.4 | 5.4 | 0.81 |
CT—Micro-CT scan, U—Uniform cement, C—Grain contact cement, S—Stress-dependent cement.
Publisher’s Note: MDPI stays neutral with regard to jurisdictional claims in published maps and institutional affiliations. |
© 2021 by the authors. Licensee MDPI, Basel, Switzerland. This article is an open access article distributed under the terms and conditions of the Creative Commons Attribution (CC BY) license (http://creativecommons.org/licenses/by/4.0/).
Share and Cite
MDPI and ACS Style
Wetzel, M.; Kempka, T.; Kühn, M. Diagenetic Trends of Synthetic Reservoir Sandstone Properties Assessed by Digital Rock Physics. Minerals 2021, 11, 151. https://0-doi-org.brum.beds.ac.uk/10.3390/min11020151
AMA Style
Wetzel M, Kempka T, Kühn M. Diagenetic Trends of Synthetic Reservoir Sandstone Properties Assessed by Digital Rock Physics. Minerals. 2021; 11(2):151. https://0-doi-org.brum.beds.ac.uk/10.3390/min11020151
Chicago/Turabian StyleWetzel, Maria, Thomas Kempka, and Michael Kühn. 2021. "Diagenetic Trends of Synthetic Reservoir Sandstone Properties Assessed by Digital Rock Physics" Minerals 11, no. 2: 151. https://0-doi-org.brum.beds.ac.uk/10.3390/min11020151
Note that from the first issue of 2016, this journal uses article numbers instead of page numbers. See further details here.