
Preliminary Study on Gold Recovery from High Grade E-Waste by Thiourea Leaching and Electrowinning


 ,
,
Abstract
:1. Introduction
2. Materials and Methods
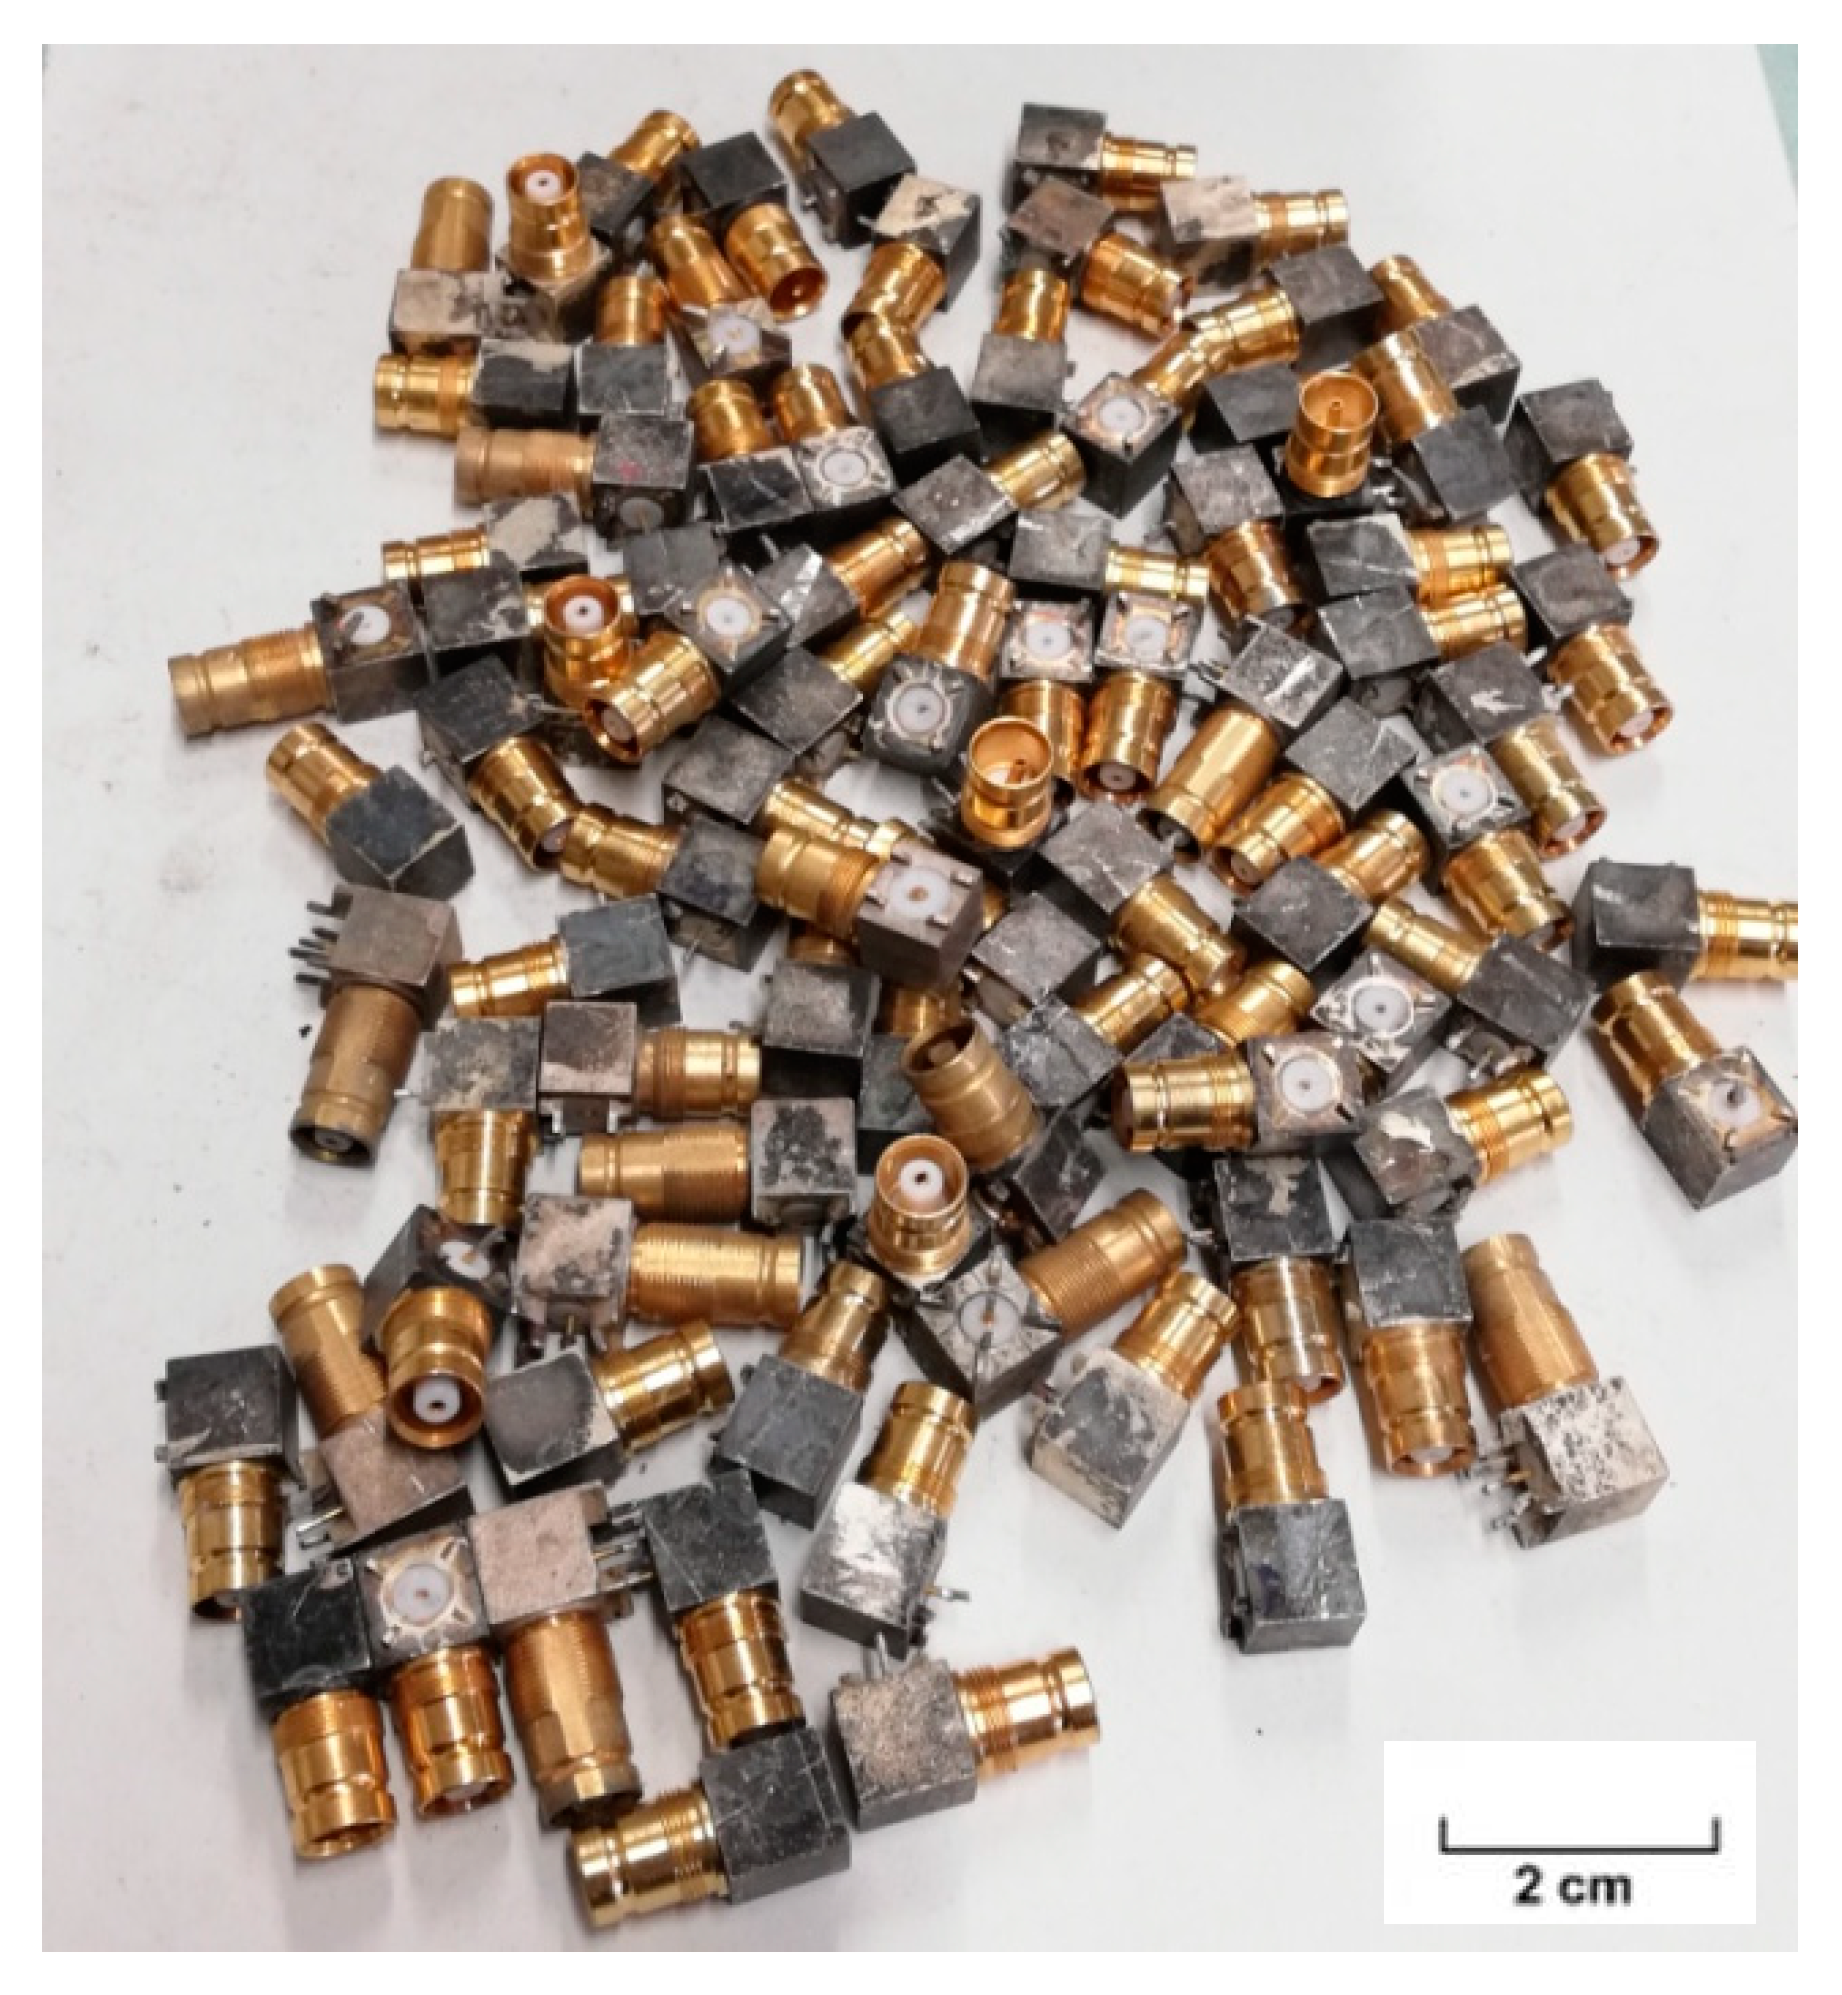
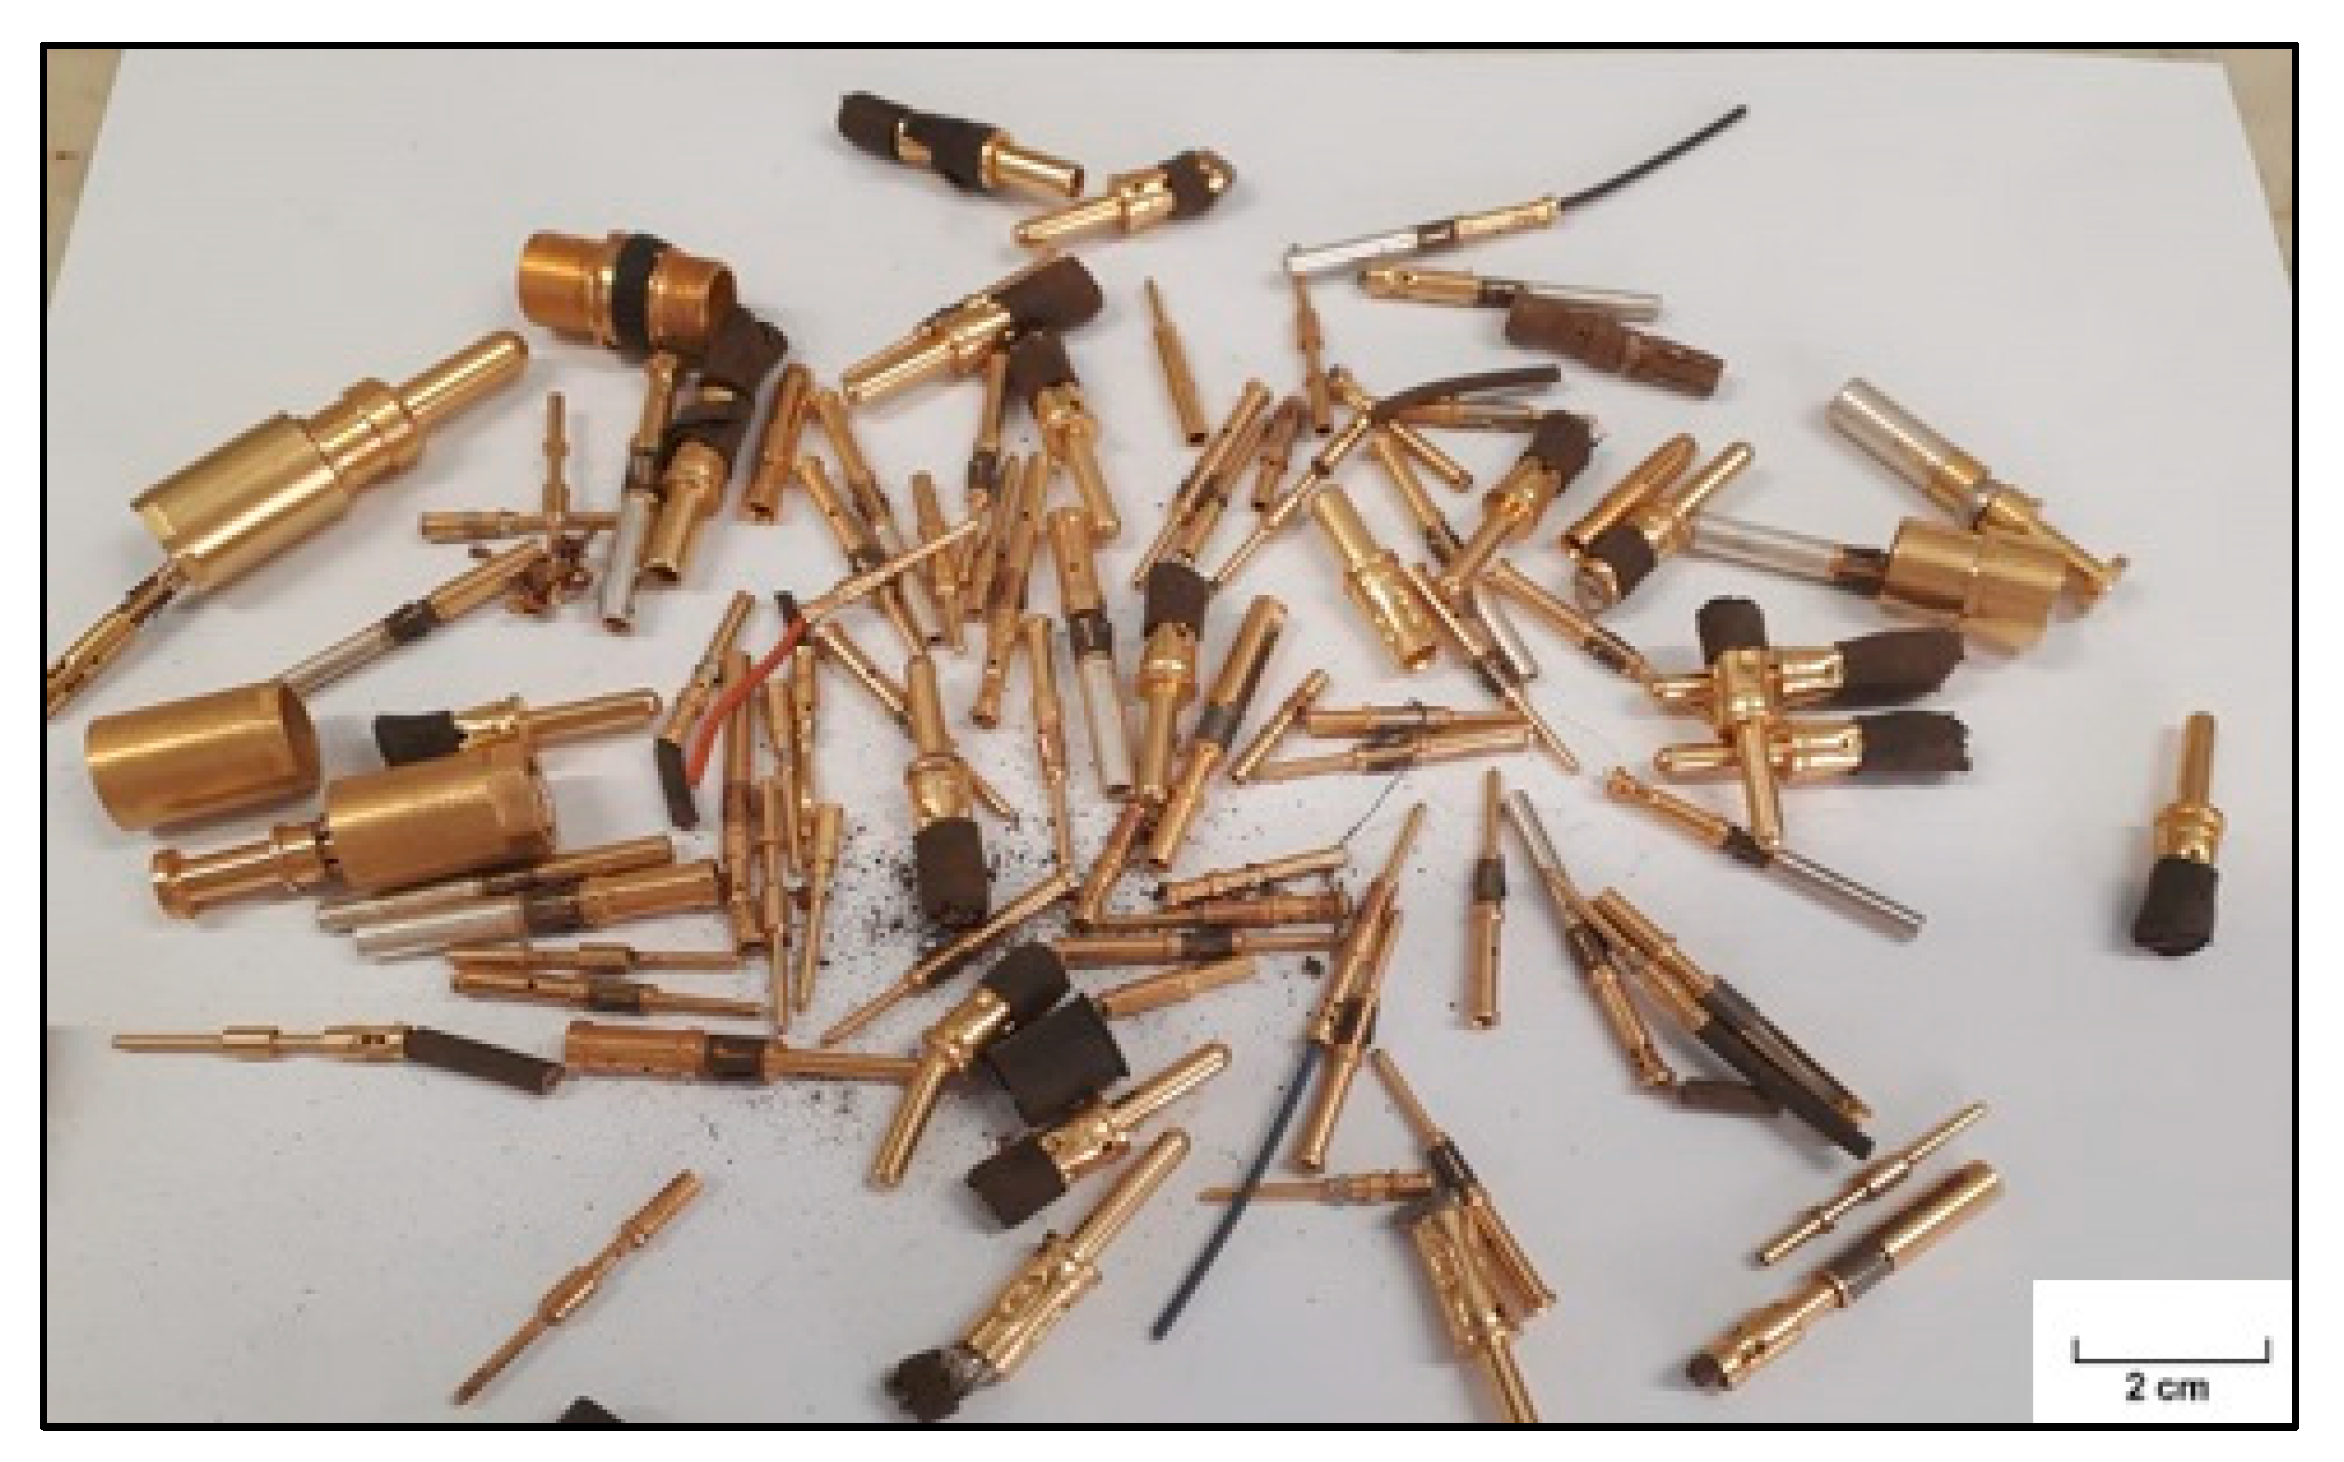
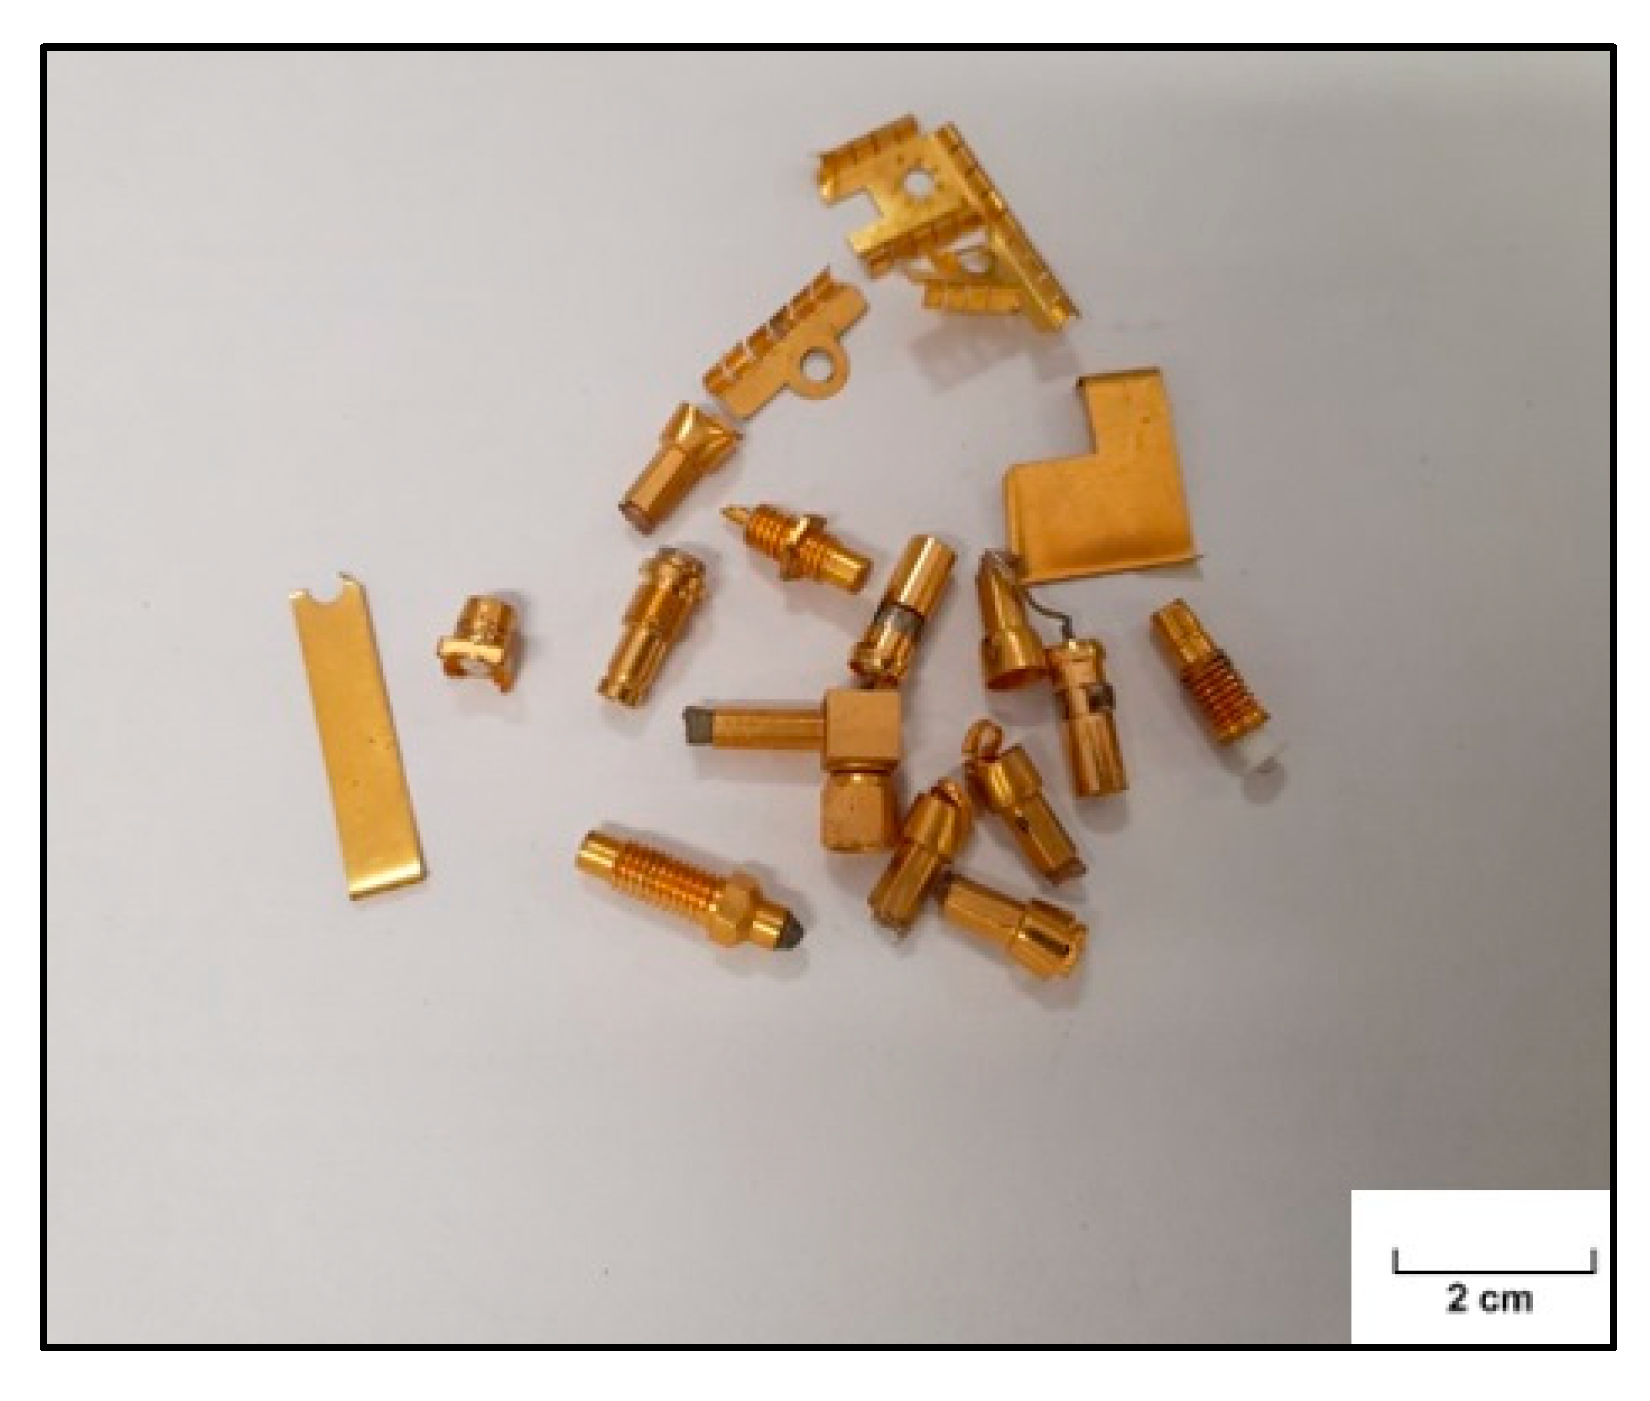
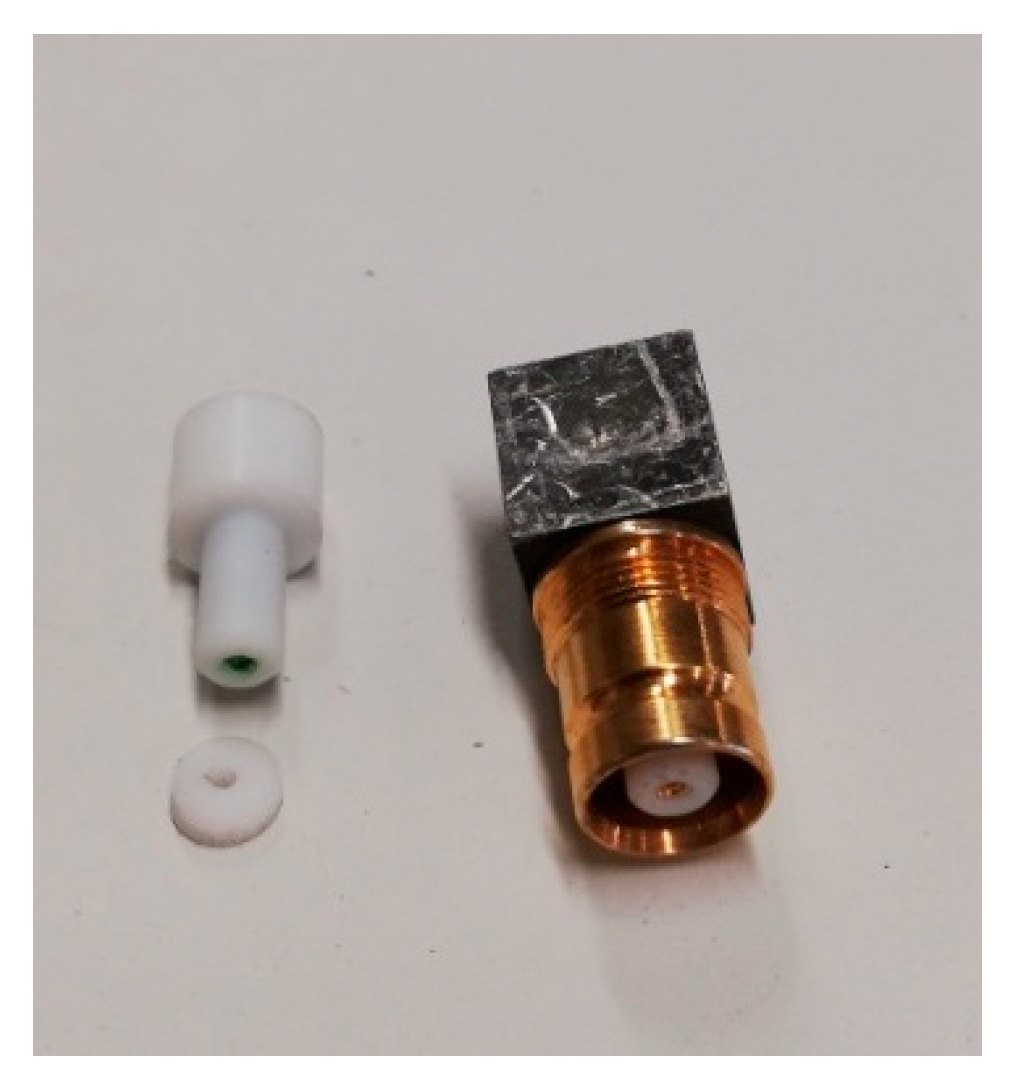
2.1. Characterization of the Connectors
2.2. Leaching Procedure
2.3. Electrowinning Procedure
3. Results and Discussion
3.1. Characterization of the Connectors
3.2. Thiourea Leaching of Gold from the First Sample
3.3. Thiourea Leaching of Gold from Second and Third Samples
3.4. Electrowinning
3.4.1. Electrowinning Test on Solution of First Sample Leaching
3.4.2. Electrowinning Tests on Solutions of Second and Third Samples Leaching
4. Conclusions
Author Contributions
Funding
Institutional Review Board Statement
Informed Consent Statement
Data Availability Statement
Conflicts of Interest
References
- Birloaga, I.; Coman, V.; Kopacek, B.; Vegliò, F. An advanced study on the hydrometallurgical processing of waste computer printed circuit boards to extract their valuable content of metals. Waste Manag. 2014, 34, 2581–2586. [Google Scholar] [CrossRef] [PubMed]
- Birloaga, I.; De Michelis, I.; Ferella, F.; Buzatu, M.; Vegliò, F. Study on the influence of various factors in the hydrometallurgical processing of waste printed circuit boards for copper and gold recovery. Waste Manag. 2013, 33, 935–941. [Google Scholar] [CrossRef] [PubMed]
- Birloaga, I.; Vegliò, F. Study of multi-step hydrometallurgical methods to extract the valuable content of gold, silver and copper from waste printed circuit boards. J. Environ. Chem. Eng. 2016, 4, 20–29. [Google Scholar] [CrossRef]
- Birloaga, I.; Vegliò, F.; De Michelis, I.; Ferella, F. Process for the Hydrometallurgical Treatment of Electronic Boards. WO2018215967A1, Priority Number IT201700057739 A (Gold-REC1), 26 May 2017. [Google Scholar]
- Birloaga, I.; Vegliò, F. Hydrometallurgical Method for the Recovery of Base Metals and Precious Metals from a Waste Material. WO2019229632A1, Priority Number—IT201800005826A (Gold-REC2), 29 May 2018. [Google Scholar]
- Cui, J.; Zhang, L. Metallurgical recovery of metals from electronic waste: A review. J. Hazard. Mater. 2008, 158, 228–256. [Google Scholar] [CrossRef] [PubMed]
- Sohaili, J.; Muniyandi, S.K.; Mohamad, S.S. A review on printed circuit boards waste recycling technologies and reuse of recovered nonmetallic materials. Int. J. Sci. Eng. Res. 2012, 3, 1–7. [Google Scholar] [CrossRef]
- Qiu, R.; Lin, M.; Ruan, J.; Fu, Y.; Hu, J.; Deng, M.; Tang, Y.; Qiu, R. Recovering full metallic resources from waste printed circuit boards: A refined review. J. Clean. Prod. 2020, 244, 118690. [Google Scholar] [CrossRef]
- Wang, R.; Zhang, C.; Zhao, Y.; Zhou, Y.; Ma, E.; Bai, J.; Wang, J. Recycling gold from printed circuit boards gold-plated layer of waste mobile phones in “mild aqua regia” system. J. Clean. Prod. 2021, 278, 123597. [Google Scholar] [CrossRef]
- Qiu, R.; Lin, M.; Qin, B.; Xu, Z.; Ruan, J. Environmental-friendly recovery of non-metallic resources from waste printed circuit boards: A review. J. Clean. Prod. 2021, 279, 123738. [Google Scholar] [CrossRef]
- Zhu, X.; Cui, T.; Li, B.; Nie, C.; Zhang, H.; Lyu, X.; Tao, Y.; Qiu, J.; Li, L.; Zhang, G. Metal recovery from waste printed circuit boards by flotation technology with non-ionic renewable collector. J. Clean. Prod. 2020, 255, 120289. [Google Scholar] [CrossRef]
- Barnwal, A.; Dhawan, N. Recycling of discarded mobile printed circuit boards for extraction of gold and copper. Sustain. Mater. Technol. 2020, 25, e00164. [Google Scholar] [CrossRef]
- Park, H.S.; Kim, Y.J. A novel process of extracting precious metals from waste printed circuit boards: Utilization of gold concentrate as a fluxing material. J. Hazard. Mater. 2019, 365, 659–664. [Google Scholar] [CrossRef] [PubMed]
- D’Adamo, I.; Ferella, F.; Gastaldi, M.; Maggiore, F.; Rosa, P.; Terzi, S. Towards sustainable recycling processes: Wasted printed circuit boards as a source of economic opportunities. Resour. Conserv. Recycl. 2019, 149, 455–467. [Google Scholar] [CrossRef]
- Nekouei, R.K.; Tudela, I.; Pahlevani, F.; Sahajwalla, V. Current trends in direct transformation of waste printed circuit boards (WPCBs) into value-added materials and products. Curr. Opin. Green Sustain. Chem. 2020, 24, 14–20. [Google Scholar] [CrossRef]
- Guanghan, S.; Zhu, X.; Wenyi, Y.; Chenglong, Z.; Wen, M. Recycling and Disposal Technology for Non-mentallic Materials from Waste Printed Circuit Boards (WPCBs) in China. Procedia Environ. Sci. 2016, 31, 935–940. [Google Scholar] [CrossRef] [Green Version]
- Grigorescu, R.M.; Ghioca, P.; Iancu, L.; David, M.E.; Andrei, E.R.; Filipescu, M.I.; Ion, R.M.; Vuluga, Z.; Anghel, I.; Sofran, I.E.; et al. Development of thermoplastic composites based on recycled polypropylene and waste printed circuit boards. Waste Manag. 2020, 118, 391–401. [Google Scholar] [CrossRef] [PubMed]
- Chen, Y.; Liang, S.; Xiao, K.; Hu, J.; Hou, H.; Liu, B.; Deng, H.; Yang, J. A cost-effective strategy for metal recovery from waste printed circuit boards via crushing pretreatment combined with pyrolysis: Effects of particle size and pyrolysis temperature. J. Clean. Prod. 2021, 280, 124505. [Google Scholar] [CrossRef]
- Belardi, G.; Lavecchia, R.; Ippolito, N.M.; Medici, F.; Piga, L.; Zuorro, A. Recovery of metals from zinc-carbon and alkaline spent batteries by using automotive shredder residues. J. Solid Waste Tech. Manag. 2015, 41, 270–274. [Google Scholar] [CrossRef]
- Zhan, L.; Jiang, L.; Zhang, Y.; Gao, B.; Xu, Z. Reduction, detoxification and recycling of solid waste by hydrothermal technology: A review. Chem. Eng. J. 2020, 390, 124651. [Google Scholar] [CrossRef]
- Karamanoğlu, P.; Aydin, S. An economic analysis of the recovery of gold from CPU, boards, and connectors using aqua regia. Desalin. Water Treat. 2016, 57, 2570–2575. [Google Scholar] [CrossRef]
- Jadhav, U.; Hocheng, H. Hydrometallurgical recovery of metals from large printed circuit board pieces. Sci. Rep. 2015, 5, 14574. [Google Scholar] [CrossRef] [Green Version]
- Arshadi, M.; Yaghmaei, S.; Mousavi, S.M. Optimal electronic waste combination for maximal recovery of Cu-Ni-Fe by Acidithiobacillusferrooxidans. J. Clean. Prod. 2019, 240, 118077. [Google Scholar] [CrossRef]
- Sheel, A.; Pant, D. Recovery of gold from electronic waste using chemical assisted microbial biosorption (Hybrid) technique. Bioresour. Technol. 2018, 247, 1189–1192. [Google Scholar] [CrossRef] [PubMed]
- Tan, Q.; Liu, L.; Yu, M.; Li, J. An innovative method of recycling metals in Printed Circuit Board (PCB) using solutions from PCB Production. J. Hazard. Mater. 2020, 390, 121892. [Google Scholar] [CrossRef]
- Panda, R.; Dinkar, O.S.; Jha, M.K.; Pathak, D.D. Recycling of gold from waste electronic components of devices. Korean J. Chem. Eng. 2020, 37, 111–119. [Google Scholar] [CrossRef]
- Maniganda, S.; Rajmohan, K.S.; Varjani, S. Current trends in gold recovery from electronic wastes. Curr. Dev. Biotech. Bioeng. 2020, 16, 307–325. [Google Scholar] [CrossRef]
- Li, J.; Miller, J.D. A review of gold leaching in acid thiourea solutions. Min. Proc. Ext. Met. Rev. 2006, 27, 177–214. [Google Scholar] [CrossRef]
- Ippolito, N.M.; Maffei, G.; Medici, F.; Piga, L. Adsorption and regeneration of fluoride ion on a high alumina content bauxite. Chem. Eng. Trans. 2016, 47, 217–222. [Google Scholar] [CrossRef]
- Ubaldini, S.; Fornari, P.; Massidda, R.; Abbruzzese, C. An innovative thiourea gold leaching process. Hydrometallurgy 1998, 48, 113–124. [Google Scholar] [CrossRef]
- Elena Poisot-Diaz, M.; Ignacio, G.; Gretchen, T.L. Electrodeposition of a silver-gold alloy (DORÉ) from thiourea solutions in the presence of other metallic ion impurities. Hydrometallurgy 2008, 93, 23–29. [Google Scholar] [CrossRef]
- Urbanski, T.S.; Fornari, P.; Abbruzzese, C. Gold electrowinning from aqueous-alcoholic thiourea solutions. Hydrometallurgy 2000, 55, 137–152. [Google Scholar] [CrossRef]
- Juarez, C.M.; Dutra, A.J.B. Gold electrowinning from thiourea solutions. Miner. Eng. 2000, 13, 1083–1096. [Google Scholar] [CrossRef]
- Deschênes, G.; Ghali, E. Leaching of gold from a chalcopyrite concentrate by thiourea. Hydrometallurgy 1988, 20, 179–202. [Google Scholar] [CrossRef]


| Metal Concentration | Au (mg/kg) | Ag (mg/kg) | Pd (mg/kg) | Cu (%wt) | Zn (%wt) | Pb (%wt) | Sn (mg/kg) |
|---|---|---|---|---|---|---|---|
| Avg. | 1139 | 2417 | 15.4 | 53.5 | 32.7 | 2.2 | 385 |
| Std. Dev. | 317 | 707 | 3.9 | 1.4 | 1.0 | 0.3 | 321 |
| Type of Connector and Its Weight | Photographic Aspect | Au Concentration (mg/kg) |
|---|---|---|
| 1—large round connector—13.22 g |  | 885 |
| 2—thin and long connector—2.06 g |  | 446.7 |
| 3—medium long and thin connector—1.77 g |  | 524.7 |
| 4—long and very thin connector—0.84 g |  | 726 |
| 5—squared connector—3.30 g |  | 440 |
| 6—round and medium long connector—2.05 g |  | 370 |
| 7—round and short connector—1.17 g |  | 370 |
| Stage Number | Au Extraction (%) | Ag Extraction (%) |
|---|---|---|
| 1 | 30.6 | 75.9 |
| 2 | 44.5 | 94.7 |
| 3 | 51.6 | 95.1 |
| 4 | 52.7 | 95.1 |
| Sample | Photographic Aspect of Solid Residue | Au Recovery (%) |
|---|---|---|
| 2nd sample |  | 93.9 |
| 3rd sample |  | 49.0 |
| Time of Reaction h | Au Recovery (%) | Ag Recovery (%) |
|---|---|---|
| 0.25 | 38.1 | 18.1 |
| 0.50 | 50.4 | 25.0 |
| 0.75 | 55.9 | 32.5 |
| 1.00 | 62.4 | 36.9 |
| 1.25 | 68.7 | 46.2 |
| 1.50 | 72.8 | 53.5 |
| 1.75 | 79.0 | 62.2 |
| 2.00 | 79.0 | 62.2 |
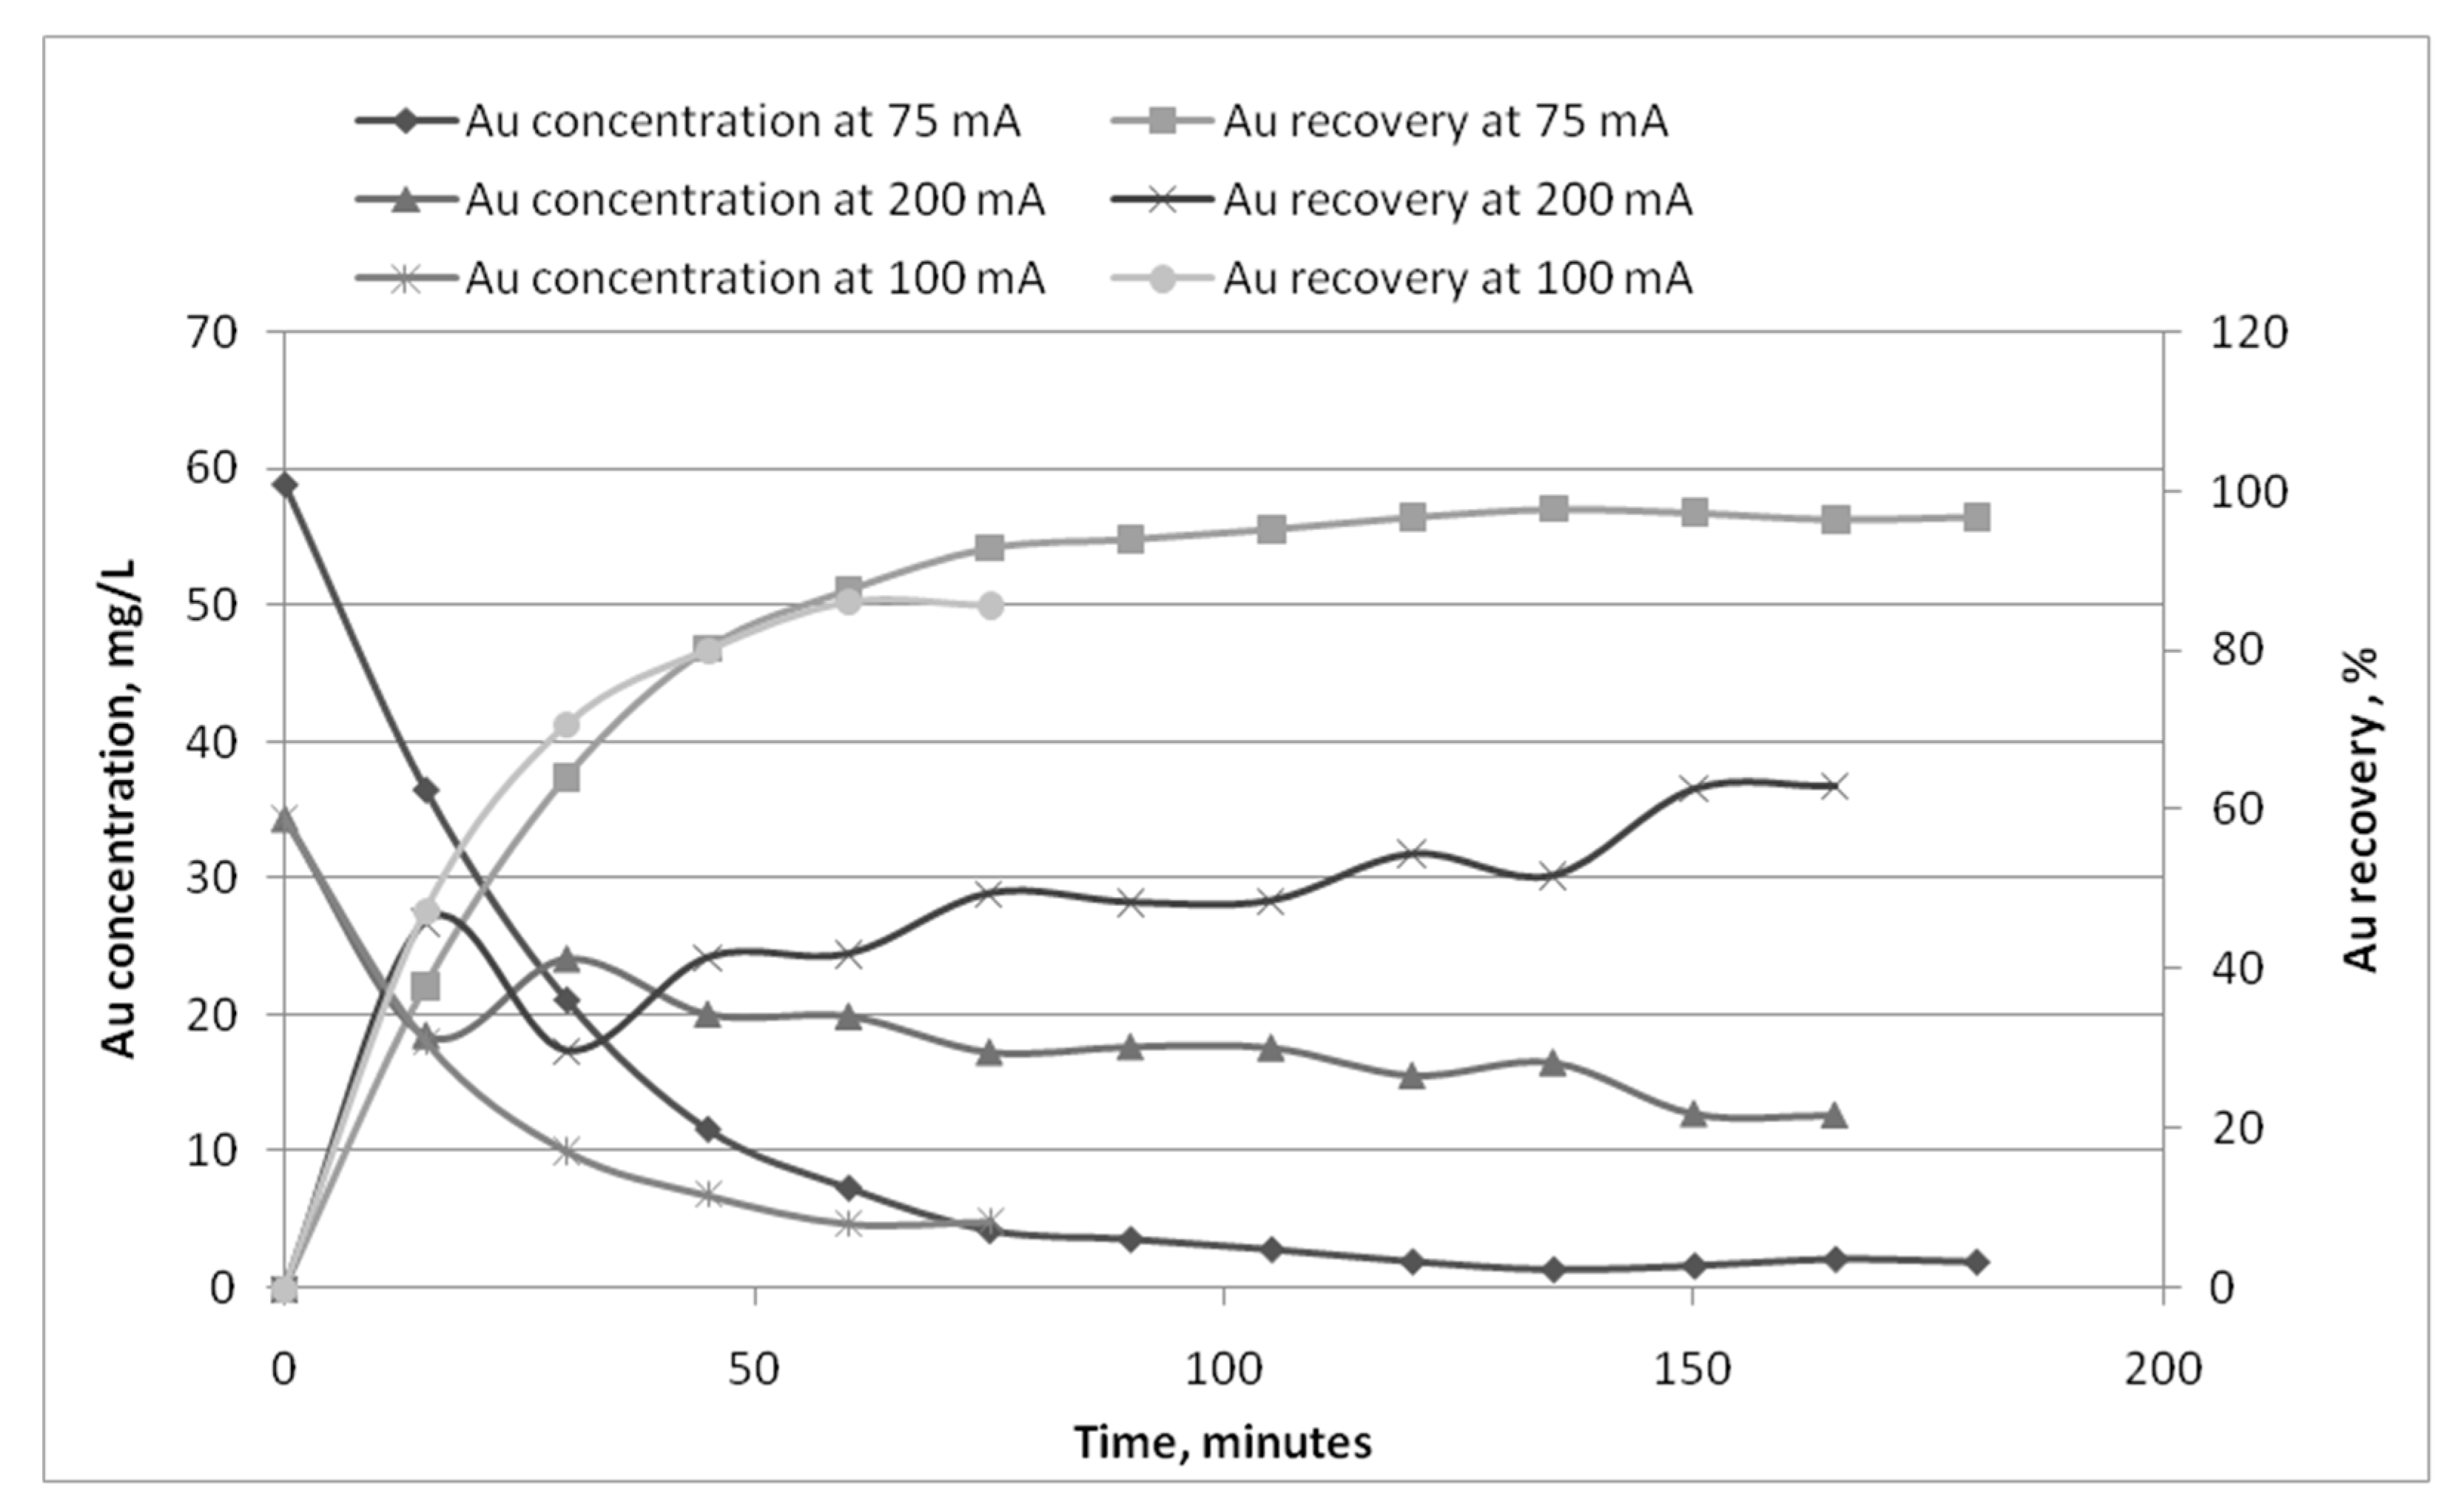
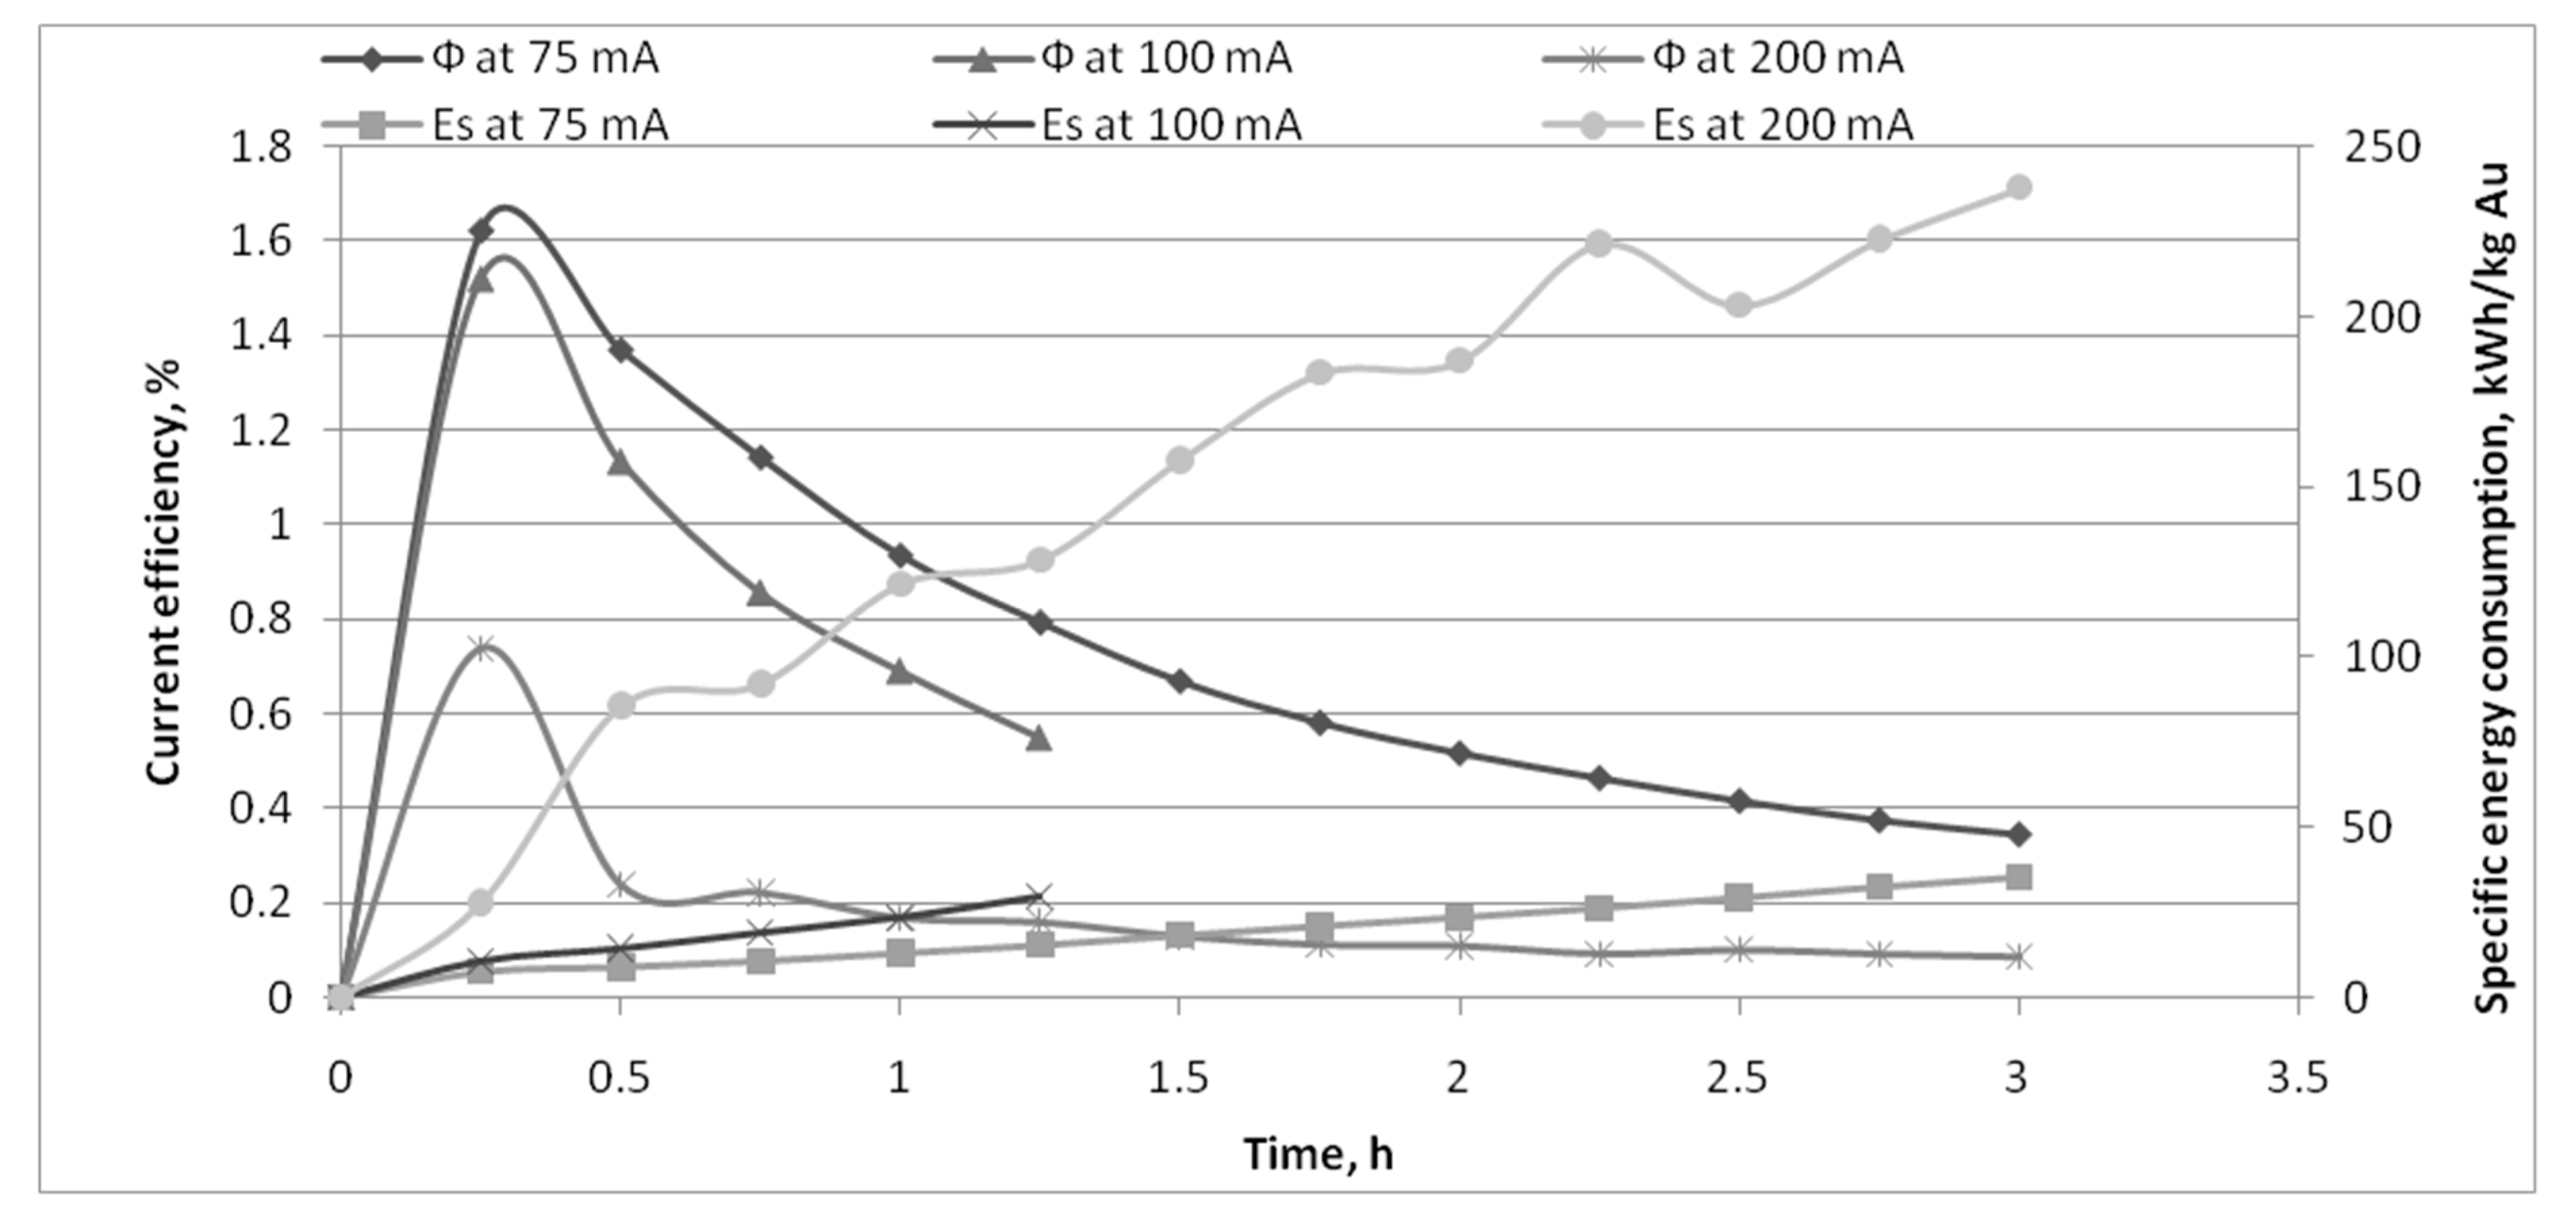
| Time of Reaction (h) | Concentration (mg/L) | Recovery (%) | Current Efficiency (%) | Energy Consumption (KWh/kg) |
|---|---|---|---|---|
| 0 | 58.9 | 0.00 | 0.00 | 0 |
| 0.25 | 38.0 | 35.40 | 1.51 | 8.10 |
| 0.50 | 22.7 | 61.50 | 1.31 | 9.32 |
| 0.75 | 14.1 | 75.98 | 1.08 | 11.32 |
| 1.00 | 9.3 | 84.26 | 0.90 | 13.61 |
| 1.25 | 5.9 | 89.93 | 0.77 | 15.94 |
| 1.50 | 5.9 | 89.95 | 0.64 | 19.12 |
| 1.75 | 4.2 | 92.86 | 0.57 | 21.61 |
| 2.00 | 12.3 | 79.14 | 0.42 | 28.98 |
| 2.25 | 10.4 | 82.36 | 0.39 | 31.33 |
| 2.50 | 9.6 | 83.77 | 0.36 | 34.22 |
| 2.75 | 11.6 | 80.37 | 0.31 | 39.24 |
| 3.00 | 12.6 | 78.55 | 0.28 | 43.80 |
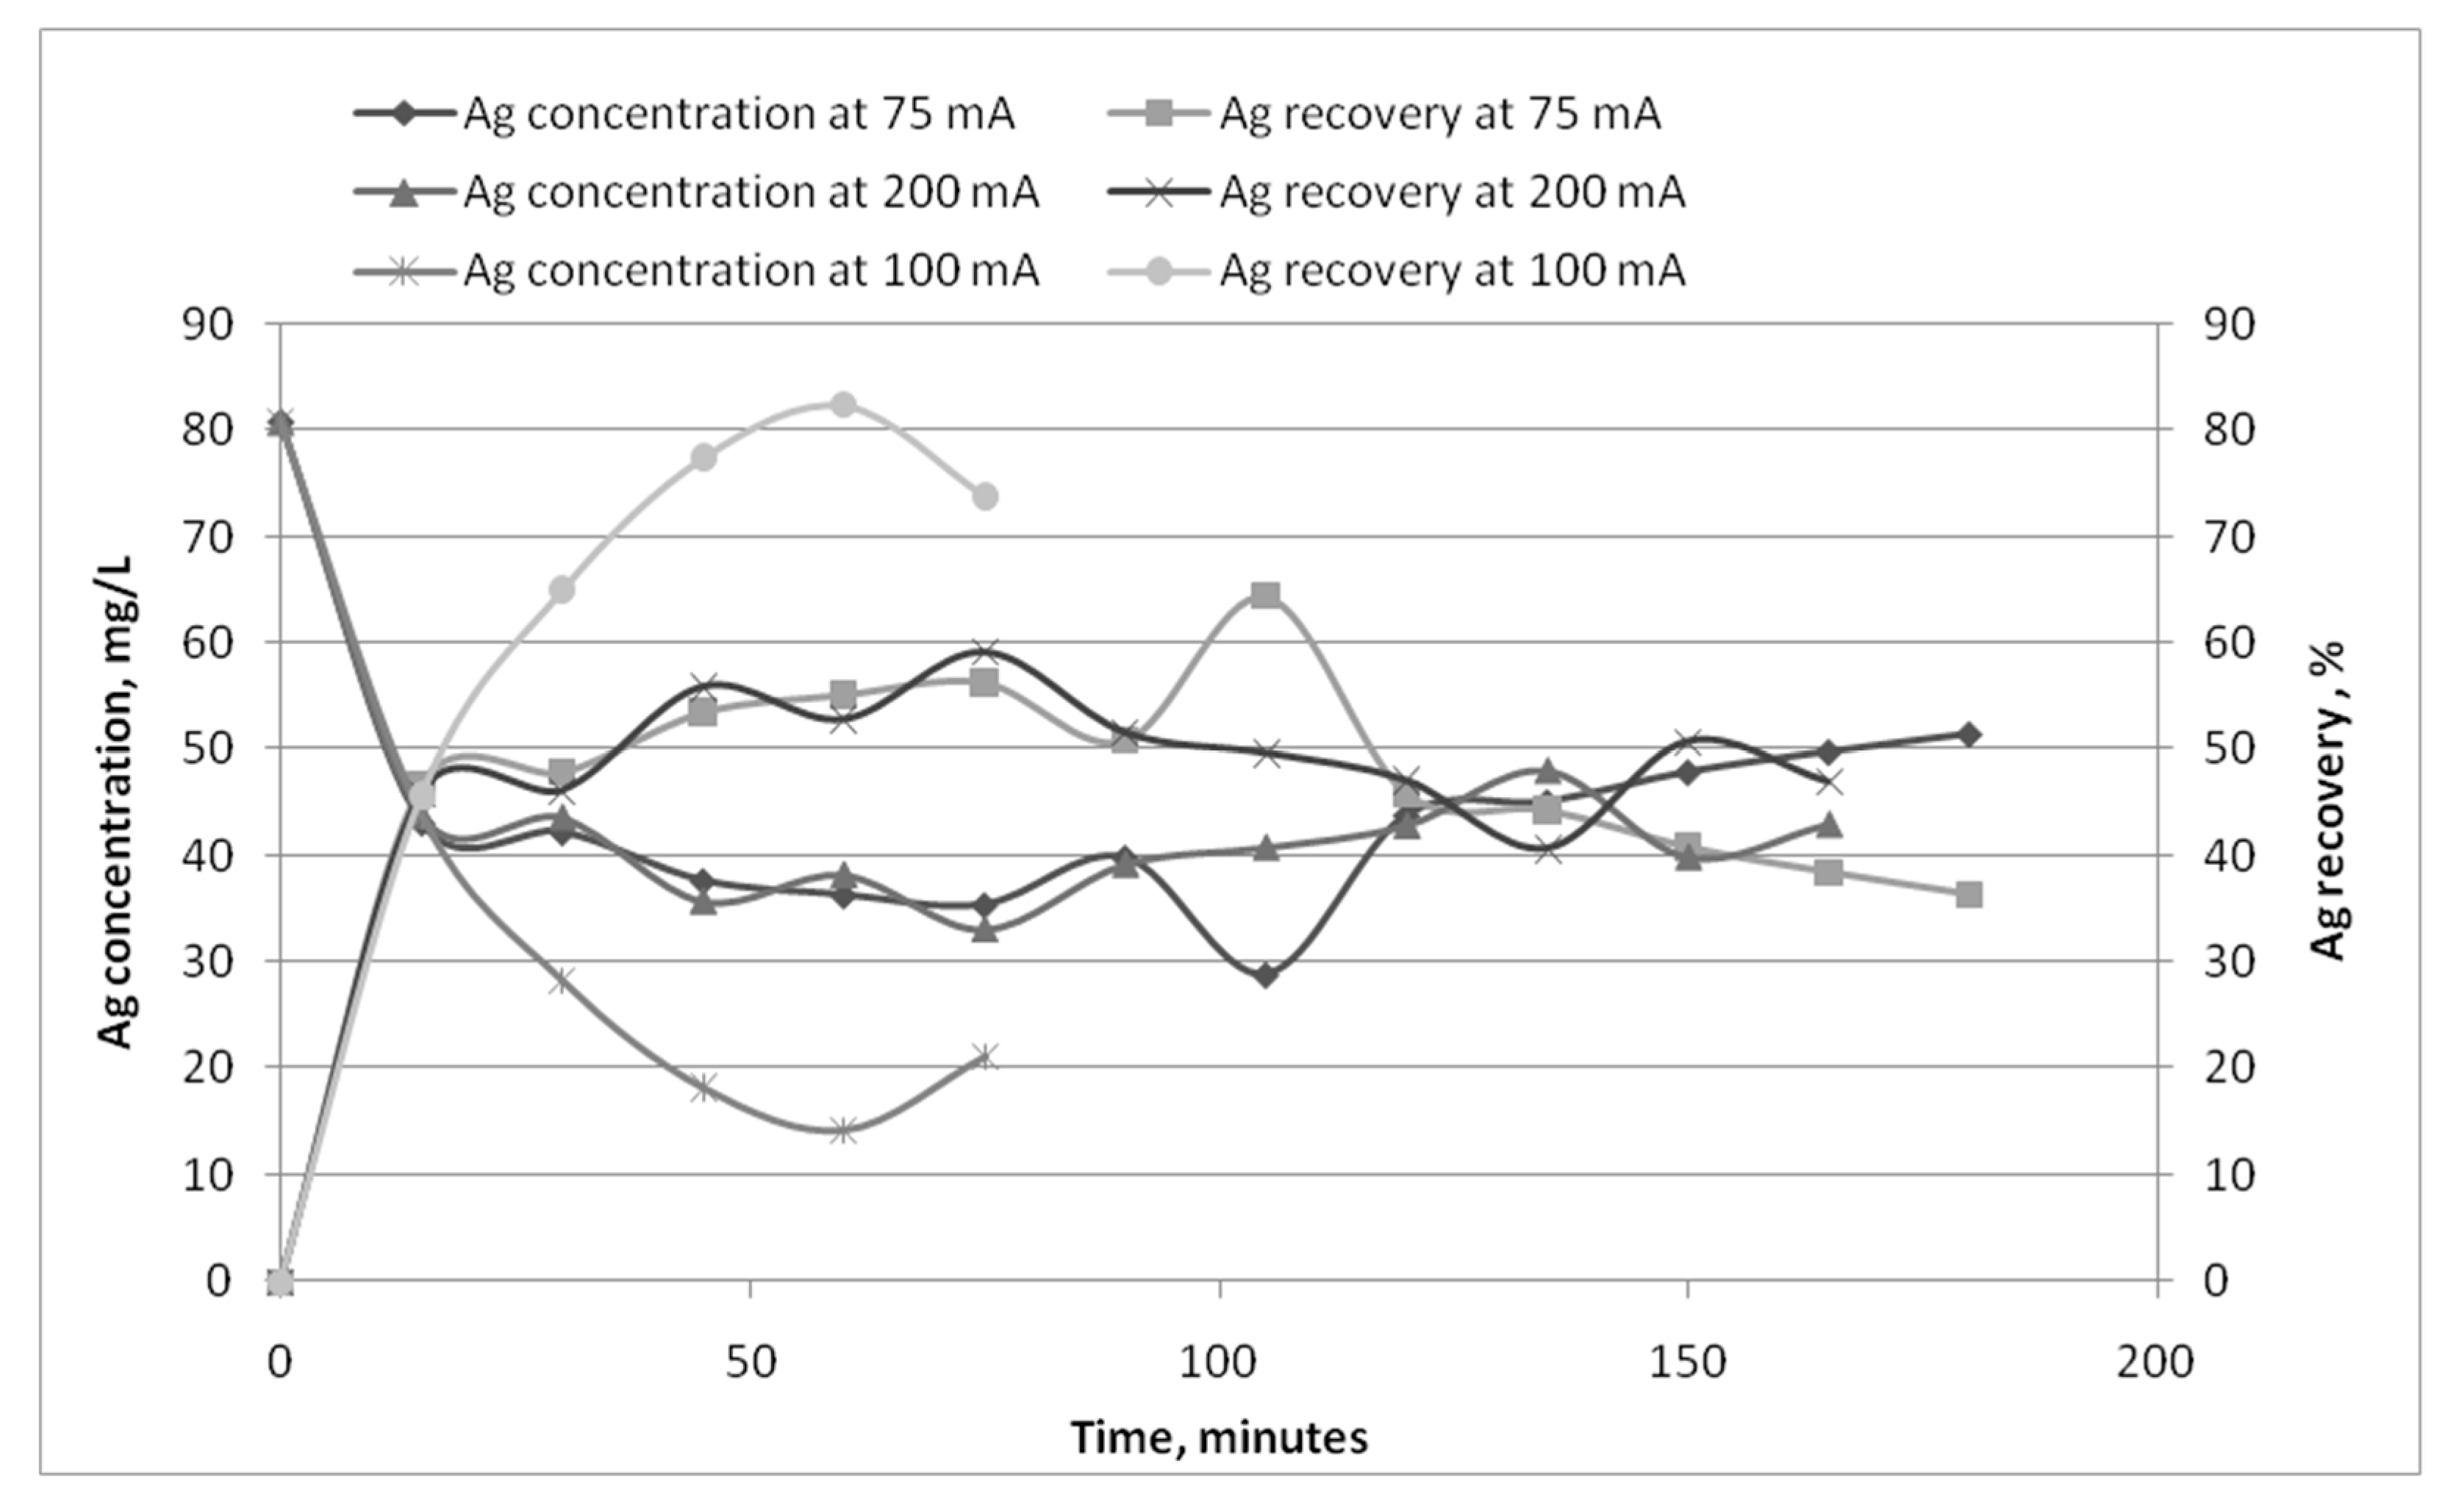
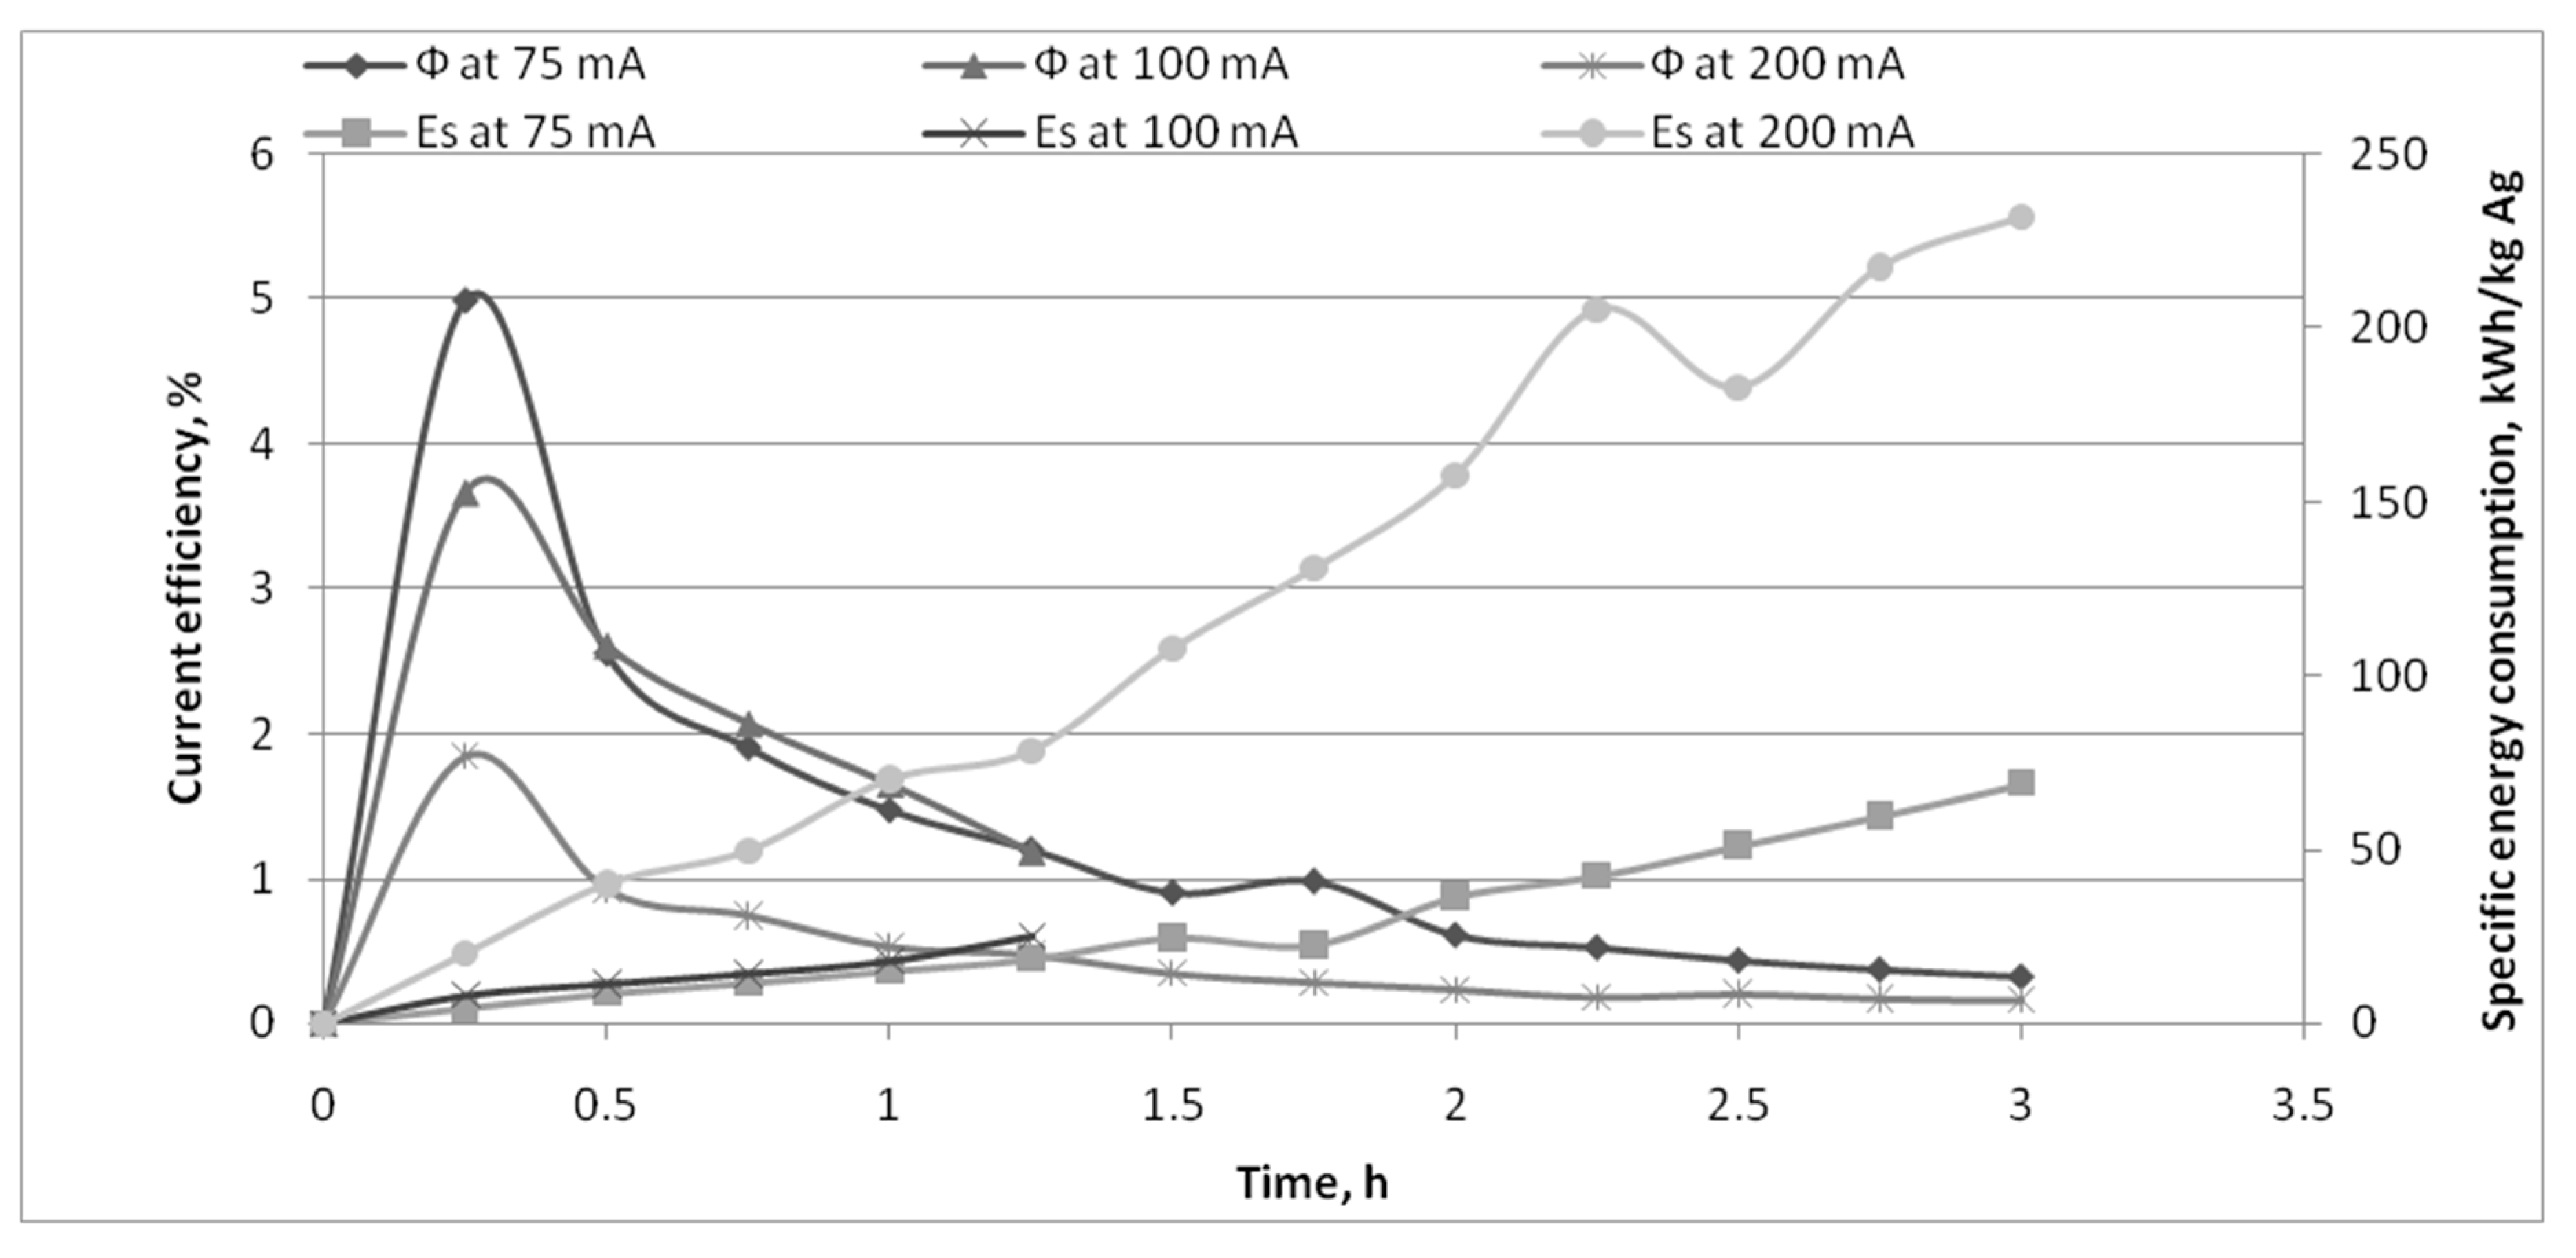
| Time of Reaction (h) | Concentration (mg/L) | Recovery (%) | Current Efficiency (%) | Energy Consumption (KWh/kg) |
|---|---|---|---|---|
| 0 | 80.8 | 0.00 | 0 | 0 |
| 0.25 | 53.8 | 33.37 | 3.57 | 6.26 |
| 0.50 | 33.7 | 58.30 | 3.12 | 7.16 |
| 0.75 | 24.4 | 69.79 | 2.49 | 8.98 |
| 1.00 | 18.6 | 76.93 | 2.06 | 10.86 |
| 1.25 | 15.2 | 81.23 | 1.74 | 12.86 |
| 1.50 | 9.7 | 87.98 | 1.57 | 14.24 |
| 1.75 | 33.5 | 58.58 | 0.90 | 24.95 |
| 2.00 | 32.5 | 59.72 | 0.80 | 27.98 |
| 2.25 | 33.5 | 58.54 | 0.70 | 32.11 |
| 2.50 | 38.8 | 51.93 | 0.56 | 40.22 |
| 2.75 | 40.5 | 49.85 | 0.49 | 46.08 |
| 3.00 | 42.2 | 47.77 | 0.43 | 52.46 |
| Cathode after Gold EW | Recovered Gold—58.9 mg | Purity |
|---|---|---|
 |  | 57% |
Publisher’s Note: MDPI stays neutral with regard to jurisdictional claims in published maps and institutional affiliations. |
© 2021 by the authors. Licensee MDPI, Basel, Switzerland. This article is an open access article distributed under the terms and conditions of the Creative Commons Attribution (CC BY) license (http://creativecommons.org/licenses/by/4.0/).
Share and Cite
Ippolito, N.M.; Birloaga, I.; Ferella, F.; Centofanti, M.; Vegliò, F. Preliminary Study on Gold Recovery from High Grade E-Waste by Thiourea Leaching and Electrowinning. Minerals 2021, 11, 235. https://0-doi-org.brum.beds.ac.uk/10.3390/min11030235
Ippolito NM, Birloaga I, Ferella F, Centofanti M, Vegliò F. Preliminary Study on Gold Recovery from High Grade E-Waste by Thiourea Leaching and Electrowinning. Minerals. 2021; 11(3):235. https://0-doi-org.brum.beds.ac.uk/10.3390/min11030235
Chicago/Turabian StyleIppolito, Nicolò Maria, Ionela Birloaga, Francesco Ferella, Marcello Centofanti, and Francesco Vegliò. 2021. "Preliminary Study on Gold Recovery from High Grade E-Waste by Thiourea Leaching and Electrowinning" Minerals 11, no. 3: 235. https://0-doi-org.brum.beds.ac.uk/10.3390/min11030235