
Equations of State of Ca-Silicates and Phase Diagram of the CaSiO3 System under Upper Mantle Conditions


Institute of the Earth’s Crust, Siberian Branch of the Russian Academy of Sciences, 664033 Irkutsk, Russia
*
Author to whom correspondence should be addressed.
Minerals 2021, 11(3), 322; https://0-doi-org.brum.beds.ac.uk/10.3390/min11030322
Submission received: 29 January 2021
/
Revised: 16 March 2021
/
Accepted: 16 March 2021
/
Published: 19 March 2021
(This article belongs to the Special Issue Minerals and Solids at High Temperature and High Pressure: Equations of State and Thermodynamics)
Abstract
:The equations of state of different phases in the CaSiO3 system (wollastonite, pseudowollastonite, breyite (walstromite), larnite (Ca2SiO4), titanite-structured CaSi2O5 and CaSiO3-perovskite) are constructed using a thermodynamic model based on the Helmholtz free energy. We used known experimental measurements of heat capacity, enthalpy, and thermal expansion at zero pressure and high temperatures, and volume measurements at different pressures and temperatures for calculation of parameters of equations of state of studied Ca-silicates. The used thermodynamic model has allowed us to calculate a full set of thermodynamic properties (entropy, heat capacity, bulk moduli, thermal expansion, Gibbs energy, etc.) of Ca-silicates in a wide range of pressures and temperatures. The phase diagram of the CaSiO3 system is constructed at pressures up to 20 GPa and temperatures up to 2000 K and clarifies the phase boundaries of Ca-silicates under upper mantle conditions. The calculated wollastonite–breyite equilibrium line corresponds to equation P(GPa) = −4.7 × T(K) + 3.14. The calculated density and adiabatic bulk modulus of CaSiO3-perovskite is compared with the PREM model. The calcium content in the perovskite composition will increase the density of mineral and it good agree with the density according to the PREM model at the lower mantle region.
1. Introduction
The thermodynamic description and phase equilibria in the CaSiO3 system are important for modern mineralogical research because Ca-silicates are common components of the Earth’s crust and mantle. The low-pressure CaSiO3 polymorphs (wollastonite and pseudowollastonite) are rock-forming minerals in the Earth’s crust and constitute cement substances [1,2], while the high-pressure Ca-silicate phases (breyite (walstromite), larnite, titanite-structured CaSi2O5 and CaSiO3-perovskite) are stable in the mantle P-T conditions and detected as solid-phase inclusions in natural diamonds [3,4,5,6,7]. The presence of CaSiO3 phase in diamonds indicates the possibility of transporting the substance from the lower mantle to the surface in an unchanged form and provides insights into the nature of diamond formation. Thus, the present study will expand the possibility for thermodynamic modeling of physicochemical processes in the Earth’s deep mantle.
It is well known that calcium metasilicate (CaSiO3) has a number of structural modifications at relevant pressures and temperatures. Wollastonite structure is stable under ambient conditions and transforms to pseudowollastonite phase at high temperatures above ~1400 K [8]. The transition of wollastonite to walstromite-structured CaSiO3 is detected at 3 GPa and 1173 K [9]. The name breyite for this phase is approved by IMA in 2018 [10], therefore it is used in the text below. The wollastonite–breyite equilibrium was studied by different authors [1,11,12]. The subsequent decomposition of breyite to association of larnite (Ca2SiO4) and titanite-structured CaSi2O5 was determined at higher pressures by Kanazaki’s study [13]. The CaSiO3-perovskite is formed at pressure ~14 GPa from (larnite + CaSi2O5) assemblage [14] and retains its structure until lower mantle conditions. The phase diagram of the CaSiO3 is well studied at low pressures up to 3–4 GPa and high temperatures by experimental methods in [11,15]. In the present calculation, we also used the phase diagram of the CaSiO3 system, which was proposed in [1,11].
The thermodynamics of Ca-silicates can be calculated from their equations of state (EoS). The equations of state of wollastonite, pseudowollastonite, breyite, larnite (Ca2SiO4), titanite-structured CaSi2O5 and CaSiO3-perovskite can be constructed based on the thermodynamic model, which was successfully used in our previous studies for the MgSiO3–MgO system [16,17]. We use a thermodynamic model based on the Helmholtz free energy, which allows us to calculate a full set of thermodynamic properties (entropy, heat capacity, bulk moduli, thermal expansion, Gibbs energy, etc.) at given P-T or V-T parameters. The proposed thermodynamic model is based on optimization of different experimental measurements (dilatometric, X-ray diffraction, ultrasonic interferometry, etc.) and theoretical data (calculations and reference) by analogy with our studies for metals [18,19,20] and compounds [21,22]. The proposed equations of state of studied Ca-silicates are constructed with a small number of fitting parameters. There are also other different forms of EoSes, which contain a small number of parameters and reliably describe the properties of metals and mixtures [23,24,25,26], but in this study, we will use our model that previously showed its versatility.
2. Thermodynamic Model
The equations of state of wollastonite, pseudowollastonite, breyite, larnite (Ca2SiO4), titanite-structured CaSi2O5 and CaSiO3-perovskite are constructed using the thermodynamic model based on the Helmholtz free energy. According to the proposed thermodynamic model, the Helmholtz free energy can be represented in general form as the sum [27]:
where U0 is the reference energy, FT0 is the potential part of the Helmholtz free energy at the reference isotherm T0 = 298.15 K, which depends only on volume; Fth is the thermal part of the Helmholtz free energy, which depends on volume and temperature; Fanh is an additional contribution to the Helmholtz free energy, which connects with intrinsic anharmonicity, as a function of temperature and volume.
The potential part of the Helmholtz free energy from Equation (1) is determined by the integration of the equation of pressure at the reference isotherm. Many different equations are known to express the equation of pressure at the reference isotherm, each of which has its advantages and limitations (review in [17]). We use the Kunc equation [28], which is flexible in calculations because it contains parameter k:
where X = (V/V0)1/3, η = 1.5K′ − k + 0.5, K0 is the isothermal bulk modulus under ambient conditions (P0 = 1 bar = 10−4 GPa, T0 = 298.15 K), K′ = ∂K0/∂P0 and k is an additional parameter.
When k = 2, the Kunc equation corresponds to the Vinet equation [29], which is often used in calculation of equations of state of metals in solid state physics. The values of k = 5 and k > 5 transform the Kunc equation into one of the forms of the Holzapfel equation (HO2) [30] and into the Birch–Murnaghan equation [31], respectively. We use k = 5 for all Ca-silicate phases in the present study.
Differentiating Equation (2) with respect to volume at constant temperature, we determine the isothermal bulk modulus at the reference isotherm and calculate of its derivation by pressure:
The thermal part of the Helmholtz free energy from Equation (1) can be calculated by Debye, Einstein, Bose–Einstein models, or their combinations [32,33]. A more simple approach is to use the Einstein model with two characteristic temperatures, which makes it possible to good approximate of the heat capacity in the temperature range from ~100 K to the melting point of the substance:
where mi is proportionality factor, which is calculated from the total number of atoms in the compound (i = 1, 2), m1 + m2 = 3n, n is the number of atoms in a chemical formula of the compound, Θi is the Einstein characteristic temperature, which depends only on volume, and R is the gas constant (R = 8.31451 Jmol−1K−1).
The volume dependence of characteristic temperature in Equation (5) is determined by Al’tshuler equation [34]:
where Θ0i is the characteristic temperature under ambient conditions (i = 1, 2), x = V/V0, γ0 is the Grüneisen parameter at ambient conditions, γ∞ is the Grüneisen parameter at infinite compression, when x → 0, and β is an additional fitting parameter.
The advantage of Equation (6) is that it can be explicitly differentiated in the simple form to determine the Grüneisen parameter:
where Θ is the characteristic temperature in general case.
We assume that the Grüneisen parameter will be the same for both characteristic temperatures (Θ1 and Θ2) in Equation (6). In addition, if γ∞ = 0, then Equation (7) transforms to the classical form γ = γ0xβ.
Differentiating Equation (5) with respect to temperature at constant volume, we determine entropy and then calculate internal energy:
Differentiating Equation (5) with respect to volume at constant temperature, we obtain the thermal part of pressure:
Differentiating Equation (9) with respect to temperature at constant volume and Equation (10) with respect to volume at constant temperature, we obtain the isochoric heat capacity and thermal part of isothermal bulk modulus:
where q is additional parameter, which is calculated from Equation (7) according to [34].
Differentiating Equation (10) with respect to temperature at constant volume, we determine the slope:
The additional contribution of the intrinsic anharmonicity to the Helmholtz free energy in Equation (1) can be expressed by classical equation from [27]:
The contribution of the intrinsic anharmonicity to entropy, internal energy, thermal part of pressure, isochoric heat capacity, thermal part of isothermal bulk modulus and slope can be obtained by analogy with Equations (8)–(13), respectively:
where a = a0xm, a0 is the intrinsic anharmonicity parameter and m is the anharmonic analogue of the Grüneisen parameter.
The Equation (10) for the thermal part of pressure and equation for anharmonicity part of pressure (Panh in Equation (15)), as can be seen, are very similar. The Grüneisen parameter in Equation (10) is the coefficient of proportionality between pressure and internal energy, just like the parameter m in Equation (15). Therefore, we use this name for the parameter m. The parameters a0 and m are fitting parameters in the general cause, but we use the fixed value for m (m = 1) in the present study.
The full equations of pressure and isothermal bulk modulus are calculated as the sum of potential, thermal, and anharmonicity components: P = PT0(V) + Pth(V,T) + Panh(V,T) and KT = KT0(V) + KTth(V,T) + KTanh(V,T). Further, it is easy to calculate the coefficient of thermal expansion α = (∂Pth/∂T)V / KT, the heat capacity at constant pressure CP = CV + α2TVKT, the adiabatic bulk modulus KS = KT + VT(αKT)2/CV, and the thermodynamic Grüneisen parameter γth = αVKT/CV = αVKS/CP. The enthalpy and Gibbs energy are determined from the linear relations H = Eth + PV − P0V0 and G = F(V,T) + PV − P0V0, respectively. The parameter U0 in Equation (1) define the Gibbs energy under ambient conditions, which also can be found from the simple relation: U0 = ∆Gf,298 = ΔHf,298 − S298T0, where ΔHf,298 and S298 are enthalpy and entropy at ambient conditions, respectively.
Thus, Equations (1)–(15) contain a group of fixed parameters (V0, k, mi) and a group of fitting parameters (K0, K’, Θ0i, γ0, γ∞, β, a0, m) derived by least squares method in Excel worksheet. Using the proposed approach, it is easy to calculate a full set of thermodynamic functions of Ca-silicates that depend on temperature, pressure, and volume.
3. Results
The equations of state of studied Ca-silicates were constructed using thermodynamic model described above. Table 1 shows parameters of equations of state for wollastonite (Wol), pseudowollastonite (PsWol), breyite (Brt), larnite (β-Lrn), titanite-structured CaSi2O5 (Ca-Tit) and CaSiO3-perovskite (Ca-Pv) obtained by simultaneous optimization of known thermochemical measurements of the heat capacity, enthalpy, thermal expansion, and numerous P-V-T data including modern X-ray diffraction measurements for the Ca-silicate minerals. The optimization procedure is described in detail in our previous works [16,20,33]. In the present study, we also offer the open working MS Excel spreadsheets for each of the studied Ca-silicates (Files S1–S6 in Supplementary Material). Detailed instructions and descriptions of worksheets are provided in [17,19]. Therefore, below we will focus on the features of calculating of equation of state for each of the phases.
Wollastonite (Wol). A review of the heat capacity measurements of wollastonite and other CaSiO3 phases can be found in [35]. The most reliable measurements we found of molar volume of wollastonite as a function of temperature are published in [36]. The only known measurement of the volume of wollastonite as a function of pressure in [37] shows the following values of K0 = 54.7 GPa and ∂K/∂P = 23.5. However, at these values, our equation of state of wollastonite becomes unstable at temperatures above 700 K (this is easily verified by substituting the parameters to the present Excel file for wollastonite). Therefore, we use measurements of volume, depending on pressure for pseudowollastonite from [38]. The simultaneous optimization of known experimental data for wollastonite at γ0 = 1, β = 1 and γ∞ = 0 determine the obtained parameters of its equation of state (Table 1). Figure 1a shows a comparison of the calculated isobaric (CP) and isochoric (CV) heat capacity of wollastonite with measurements from [39,40,41,42]; Figure 1c shows calculated molar volume at reference pressure (P0 = 1 bar = 10−4 GPa) with Swamy’s data [36]; and Figure 1e shows calculated compressibility as a function of pressure with measurements from [37]. It can be seen that calculated data are in good agreement with different reference and experimental data.
The calculated thermodynamic functions of wollastonite at different temperatures and pressures (0.0001 and 3 GPa) are presented in Table 2. The last column shows the Gibbs energy at given P-T parameters. The parameter U0 is calculated from the enthalpy at ambient conditions ΔHf,298 = −1633.750 kJmol−1 from [43] and entropy S298 = 81.358 Jmol−1 K−1 at ambient conditions from Table 2, then U0 = ∆Gf,298 = −1,633,750 − 81.358 × 298.15 = −1,658,007 Jmol−1. The same scheme was used for calculation of the Gibbs energy for Mg-silicates in the Mg2SiO4 system [16]. We have shown calculation thermodynamic functions for wollastonite in the Table 2. Further tabulated values of calculated thermodynamic functions for other Ca-silicates are presented in the Supplementary Material (Tables S1–S5).
Pseudowollastonite (PsWol). As follows from the review in [2], wollastonite at ambient conditions has a triclinic structure (space group P1). The crystal structure of a synthetic two-layer polytype of pseudowollastonite was studied using single-crystal X-ray diffraction data at pressures up to 10 GPa by Yang and Prewitt [38]. It is determined that such a polytype has monoclinic structure (space group C2/c) and molar volume at ambient condition (V0 = 796.9 A3 = 39.99 cm3mol−1) coincides with the volume of wollastonite (Table 2). The molar volume of pseudowollastonite was studied at temperature range 307–1793 K by Richet et al. [44]. There are two-, four-, and six-layer polytypes of CaSiO3-pseudowollastonite in this temperature range. The parameters of K0 and K’ for our calculation were extracted from [38]; parameters of Θ01 and Θ02 are calculated from the heat capacity and relative enthalpy measurements from [42,45,46,47]. The parameter U0 is calculated from the condition of equality of the Gibbs energy of wollastonite and pseudowollastonite at T = 1398 K and P = 0.0001 GPa. The difference of calculated entropy at 1398 K for wollastonite–pseudowollastonite transition is ∆S1398 = 1.586 Jmol−1K−1 (see Table 2 and Table S1), while in Richet’s study, it is ∆S1398 = 4.2 ± 2 Jmol−1K−1 [42]. However, taking into account ∆V1398 = 0.3036 cm3mol−1, we obtain the slope ∂P/∂T = ∆S/∆V = 52.2 × 10⁻⁴ GPa/K, which is in good agreement with data from [11,48].
The calculated thermodynamic functions of pseudowollastonite are compared with different reference and experimental data [38,44] by analogy with wollastonite on Figure 1b,d,f. The tabulated values of calculated thermodynamic functions of pseudowollastonite as a function of temperature at different pressures (0.0001 and 3 GPa) is presented in the Supplementary Material (Table S1).
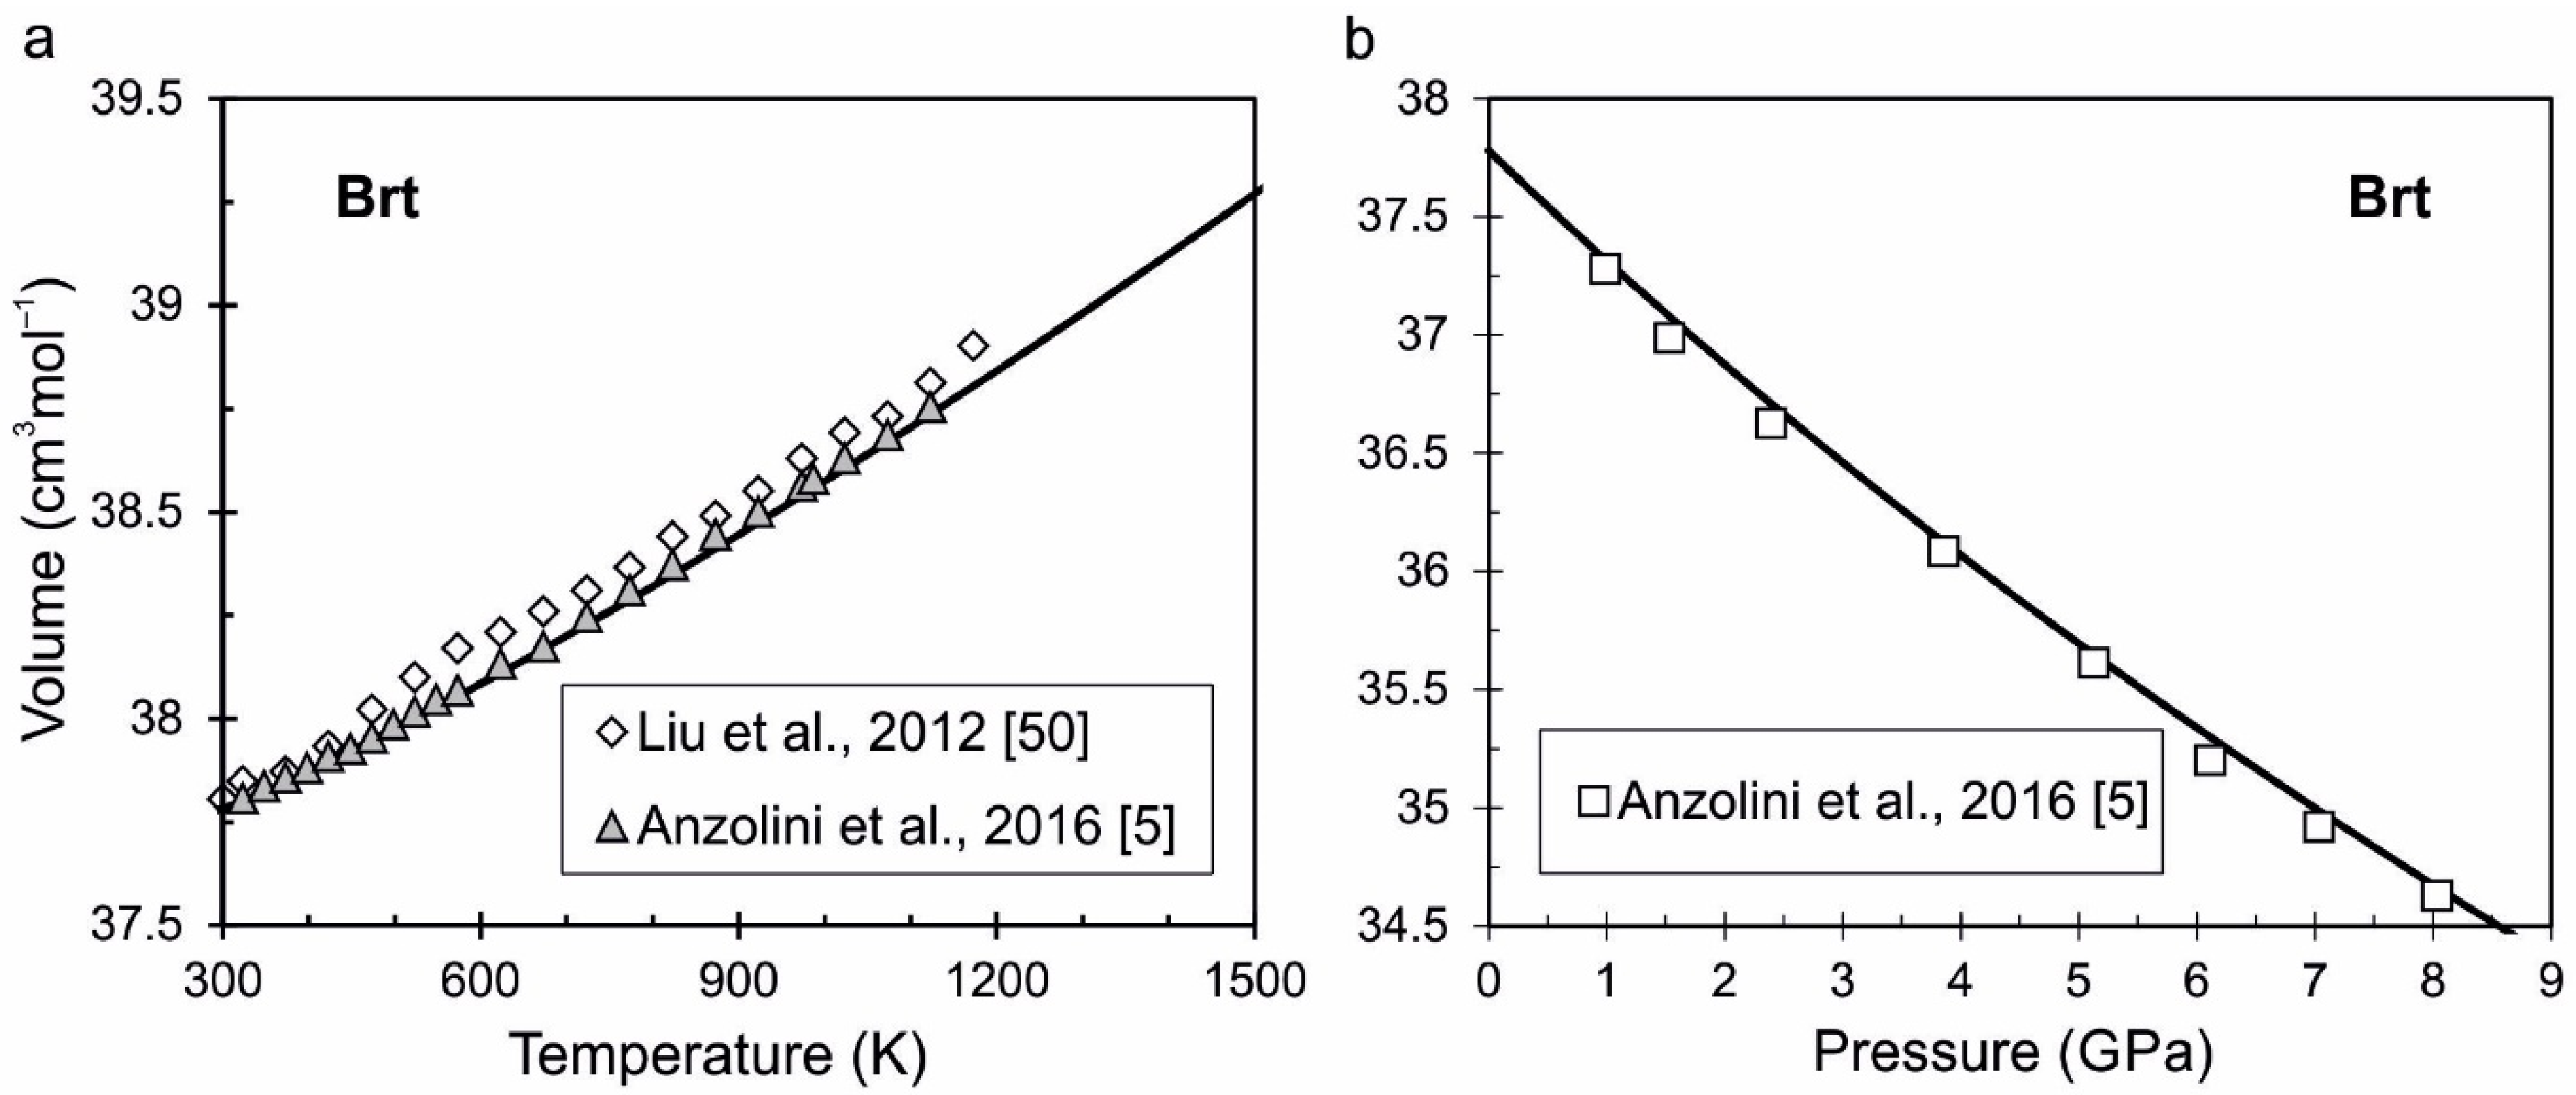
Breyite (Brt). Regarding of breyite, in the literature, we can find the different names of its structural isomorphs (Ca-walstromite, wollastonite-II, walstromite-like CaSiO3(III)). The crystal structures of breyite (or walstromite), CaSiO3-walstromite, and wollastonite-II are very similar. This issue is discussed in detail by Joswig et al. [49]. Breyite probably crystallizes in the triclinic structure (space group P1) and it is stable in the pressure range from ~3 GPa and above, since the remaining pressure of investigated inclusions of breyite in natural diamonds [3,4] was also estimated to be 3 GPa. The direct P-V-T measurements of breyite are carried out in [5,50]. The parameters of V0, K0 and K’ are taken from Anzolini et al. [5]. The parameter U0 is calculated from the phase transition of wollastonite–breyite. The calculated volume of breyite as a function of temperature and pressure is compared with experimental data on Figure 2a,b. The tabulated values of calculated thermodynamic functions of breyite depending on temperature at different pressures (0.0001, 5 and 10 GPa) is presented in the Supplementary Material (Table S2).
Larnite (β-Lrn). As temperature increases, the composition of Ca2SiO4 can form a series of polymorphs (γ-, β-, α′L-, α’H- and α). The review of crystal structures of Ca2SiO4 is presented for example in [51,52]. The β-larnite is formed as metastable monoclinic phase (space group P21/n11) in the stability field of γ-Ca2SiO4 by its cooling. We considered here only the beta modification, which is typical for natural larnite [53]. Larnite (β phase) has a wide stability field at high pressures and temperatures; therefore, this phase is used in the present study. The parameter V0 is taken from Remy et al. [51], and other parameters (K0, K’, Θ0i, γ0, γ∞ and β) are calculated from optimization of experimental measurements of heat capacity and P-V-T data from [51,54,55,56,57]. The parameter U0 is calculated from the enthalpy at ambient conditions ΔHf,298 = −2307.04 kJmol−1 from [43] and entropy at ambient conditions S298 = 124.047 Jmol−1K−1 from Table S3 (Supplementary Material). The other tabulated values of calculated thermodynamic functions of larnite depending on temperature at different pressures (0.0001, 10 and 15 GPa) is presented also in Table S3. The calculated volume of larnite as a function of pressure and temperature is compared with experimental data on Figure 3a,b.
Titanite-structured CaSi2O5 (Ca-Tit). The titanite-structured CaSi2O5 phase is identified by in situ XRD analyses in natural diamonds from Guinea and Brazil [3,4,5], but thermochemical data for this phase are not available. Therefore, the present equation of state of titanite-structured CaSi2O5 (space group C2/c) is constructed on the values of parameters of V0, K0 and K’ from [58], and other parameters (Θ0i, γ0, γ∞ and β) are calculated from optimization of experimental data from [2,58]. The parameter U0 for Ca-titanite is calculated from values of enthalpy and entropy at ambient conditions with analogy for wollastonite and larnite calculations. The tabulated values of calculated thermodynamic functions of titanite-structure CaSi2O5 as a function of temperature at different pressures (0.0001, 10 and 15 GPa) is presented in the Supplementary Material (Table S4).
Perovskite (Ca-Pv). CaSiO3-perovskite is considered as the one of the main Ca-bearing phase in the Earth’s lower mantle [59]. Therefore, findings of Ca-perovskite in natural diamond [6] may explain the mechanisms of diamond formation in general. The question of nature of “super-deep” diamond is discussed widely; however, the aim of this study is to reliably calculate the thermodynamic functions of CaSiO3-perovskite in a wide range of pressures and temperatures. CaSiO3-perovskite is stabilized in the cubic structure (space group Pm3m) at temperatures above 1000 K and pressures above 11–16 GPa, according to [1]. At low temperatures up to 500 K and high pressures up to 156 GPa, the CaSiO3-perovskite has a distorted cubic structure, which is identified in [60,61] as tetragonal modification (space group I4/mcm). The direct measurements of heat capacity and bulk modulus as a function of temperature at ambient pressure for cubic Ca-perovskite are not available [62]; therefore, all parameters (K0, K’, Θ0i, γ0, γ∞ and β) for proposed equation of state were calculated by authors. However, numerous experimental measurements of molar volume of Ca-perovskite at different pressures and temperatures are known (Table 3). The proposed equation of state of CaSiO3-perovskite is constructed on the modern P-V-T measurement from [60,61,63] and simultaneous sound velocities and density measurements at pressures up to 23 GPa and temperatures up to 1700 K from [64]. The pressure measurements in [63] were recalculated based on the equation of state of Pt from [65]; the pressure from [60] was calculated using a self-consistent pressure scale of Pt from [66]; and pressure from [64] was monitored during the experiment by the unit-cell volume of NaCl [67].
The differences in measurements of volume in Table 3 are significant, so the proposed equation of state of Ca-perovskite here is important. Figure 4a,b shows the deviations of the experimental measured pressure in [60,63] and calculated pressure from the proposed equation of state. It can be seen that the most differences are observed at pressure over 100 GPa. Figure 5a,b shows a difference between calculated pressure and adiabatic bulk modulus and experimental data from [64]. The tabulated values of calculated thermodynamic functions of cubic CaSiO3-perovskite as a function of temperature at different pressures (0.0001, 10, 15 and 100 GPa) are presented in the Supplementary Material (Table S5).
4. Discussion
The proposed equations of state of wollastonite, pseudowollastonite, breyite (walstromite), larnite, titanite-structured CaSi2O5 and CaSiO3-perovskite allow us to calculate the phase diagram of the CaSiO3 system (Figure 6). The wollastonite–pseudowollastonite equilibrium corresponds to the data from [11,48], which were used for calibration of the Gibbs energy of pseudowollastonite. At a pressure of about 3 GPa and temperature of about 1100 K wollastonite transforms to breyite (walstromite). The Gibbs energy of breyite is calibrated based on measurements from [11,15]. The calculated wollastonite–breyite equilibrium line coincides with the line P(GPa) = −4.7 × T(K) + 3.14, that was recommended by Essene [11] (Figure 6). At higher pressures, breyite transforms to the two-phase assembly of larnite (Ca2SiO4) and CaSi2O5 [1]. Based on this phase transition, the sum of the Gibbs energy of both phases is calculated. The phase boundary of breyite–(larnite + CaSi2O5) is calculated from equation 3Brt = β-Lrn + CaSi2O5 [12,57], using equilibrium of the Gibbs energy of breyite, larnite and Ca-titanite. After that, we can estimate the Gibbs energy of Ca-perovskite and calculate the line of phase transition from equation β-Lrn + CaSi2O5 = 3Ca-Pv [12,57]. It should be noted that the position of the calculated equilibrium lines (breyite–(larnite + CaSi2O5) and (larnite + CaSi2O5)–Ca-perovskite) depends entirely on the choice of the primary experimental data, which have a very significant scatter (see Figure 6). We performed a calibration of the Gibbs energy of Ca-perovskite based on the thermochemical data from [12], because we consider these data to be the most reliable. The stability field of high-pressure Ca-silicates were studied by [71,72] and significant deviations were determined. Thus, the obtained phase diagram of the CaSiO3 system is based on modern P-V-T measurements for Ca-silicates and clarifies the phase boundaries under upper mantle conditions at the depth up to ~600 km.
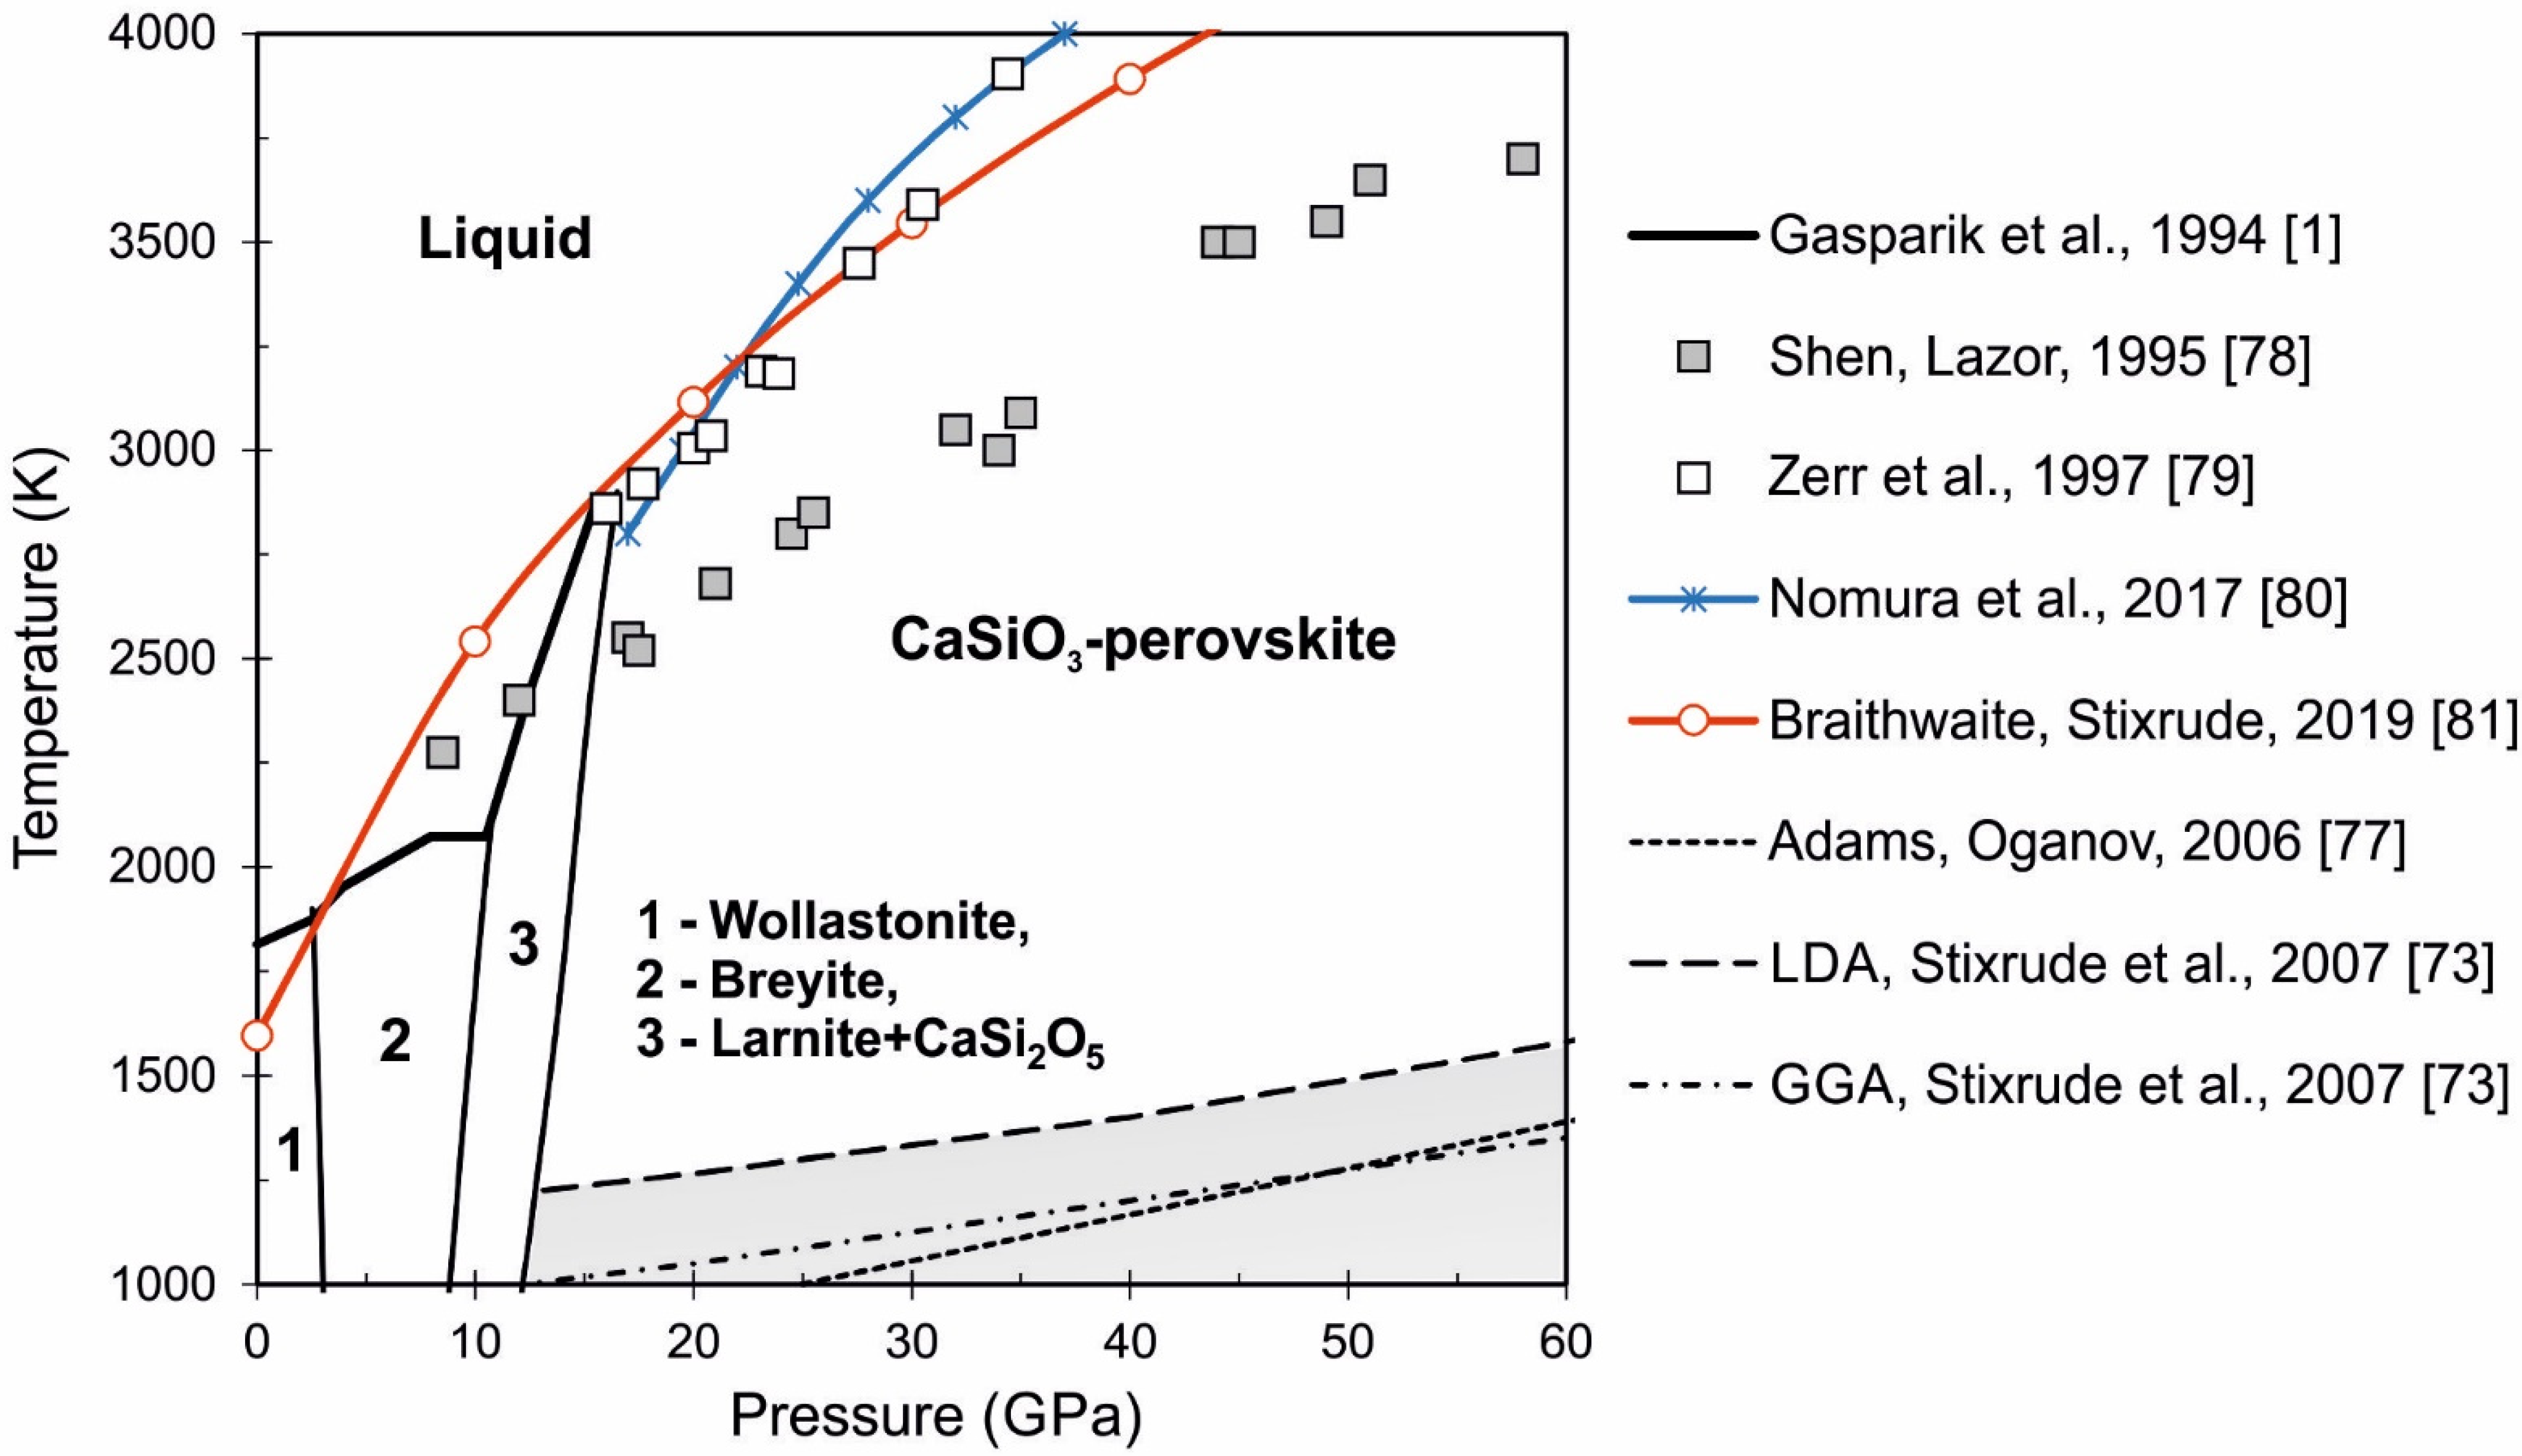
There are many first-principles calculations based on density functional theory (DFT) for CaSiO3-perovskite [73,74,75,76], however some of these were made at zero temperature [75,76]. The equation of state of CaSiO3-perovskite based on ab initio molecular dynamic (AIMD) simulations was constructed in [74]. The authors believe that tetragonal structure of Ca-perovskite is stable at temperature range 1000–4000 K and pressure range 15–130 GPa. However, this assumption does not agree well with the melting line calculations in the CaSiO3 system (see Figure 7). First-principle molecular dynamics calculations to investigate the structure of Ca-perovskite at high temperatures and pressures were made in [77]. The cubic structure of CaSiO3-perovskite was found to be stable at temperatures higher 1000 K and at all pressures according to [77]. The phase boundaries in Ca-perovskite based on LDA and GGA approximations were calculated by Stixrude et al. [73]. The location of the phase transition from tetragonal to cubic structure in Ca-perovskite is shown in Figure 7. The gray area indicates the stability field of the tetragonal structure of Ca-perovskite according to [73,77].
The melting line in the CaSiO3 system was studied experimentally at pressure up to 58 GPa in [1,78,79] and based on first-principles calculations in [80,81]. Figure 7 shows the comparison of the experimental data and different calculations. As can be seen, the experimental data from [79] are in good agreement with calculations [80,81] at the temperature range 2750–3500 K and at the pressure range 15–30 GPa. The melting line from [78] is lower than other estimates and difference increases at high pressures. The melting of CaSiO3-perovskite is predicted in the range of very high temperatures and pressures up to 6400 K and 300 GPa, respectively, according to the recent study [81]. The melting temperature of CaSiO3-perovskite significantly increases with pressure and is higher than that of MgSiO3-perovskite.
The proposed equation of state of Ca-perovskite is of great interest for deep mineralogy. The thermodynamic parameters of the Earth’s lower mantle can be estimated using the equation of state of Ca-perovskite. Table 4 shows the parameters of the Earth’s lower mantle according to the PREM model (Preliminary Reference Earth Model) [82], where temperature is calculated from [83]. We calculated the density and adiabatic bulk modulus of CaSiO3-perovskite at these P-T parameters (from Table 4) and compared it with the PREM model and with the density and adiabatic bulk modulus of MgSiO3-perovskite from our previous study [16] (Figure 8). It can be seen that the density of Ca-perovskite is higher than the density of Mg-perovskite by about 0.1–0.15 gcm−3 and almost coincides with the density according to the PREM model (Figure 8a). The adiabatic bulk moduli of Ca-perovskite and Mg-perovskite differs slightly. However, with increasing pressure, adiabatic bulk modulus of CaSiO3-perovskite exceeds the PREM model by 40 GPa at pressures of 120–130 GPa (Figure 8b). Moreover, we added the first-principle calculated data for the density and adiabatic bulk modulus of Ca-perovskite according to Li et al. [74]. The calculated density from [74] and calculated density from our equation of state for CaSiO3-perovskite are very similar, especially in the high pressure range above 80 GPa (Figure 8a). The calculated values of the adiabatic bulk modulus are in less agreement (Figure 8b).
Thus, the obtained results of the present study can be used to interpret of the phase and seismic boundaries in the Earth’s upper mantle. Since calcium is one of the main components of the Earth’s mantle, it has its influence on the location of the observed seismic boundaries. At a depth of about ~350 km, CaSiO3 phase is contained as a component of clinopyroxene minerals, whereas below 350 km, it is concentrated as a component of complex garnet solid solutions (majorite garnet) [9,59]. The phase of CaSiO3-perovskite is stabilized at increasing pressure and is considered one of the main minerals of the lower mantle, comprising up to 7 wt.% of peridotitic mantle, according to the modern geophysical data [84]. There is the view that the transition of the CaSiO3 component in the garnet solid solution to form denser of Ca-perovskite is associated with seismic discontinuity at a depth of 520 km [59]. The phase transition of wadsleyite–ringwoodite in the Mg2SiO4 system also occurs at this depth at pressure 17–18 GPa, but it is characterized by a slight increase in density and adiabatic bulk modulus as was calculated and shown in our earlier study [16]. Accordingly, the phase transition in olivine cannot fully explain the seismic boundary at 520 km. Moreover, the olivine–wadsleyite transition at the depth 410 km at 14–15 GPa calculated in [16] corresponded to a temperature of ~1700 K [16], but according to the estimations in [85], the temperature in this depth is 1790 to 1830 K. The calculated phase transition of (larnite + CaSi2O5)–Ca-perovskite occurs at a depth of 410 km at temperatures 1700–1800 K (Figure 6). Although the phase transitions in the CaSiO3 system cannot be directly responsible for the seismic boundaries in the upper mantle, they have an effect on the location of discontinuities and point to the role of calcium-containing minerals in the upper mantle.
It is well known that magnesium is the most abundant element in mantle minerals, but the ratios of main elements Mg, Fe, Ca, and Al remain an open question. The calculated density of MgSiO3-perovskite from the mantle geotherm [83] is too low with respect to the PREM model. However, the calculated density of CaSiO3-perovskite is in good agreement with the density by the PREM model (Figure 8a). The calcium content in the perovskite composition will increase the density of mineral, as well as the presence of iron. Such a composition will obviously be close to the real composition of the mantle material. The obtained thermodynamic data in the present study can be used in the calculation of silicate mixtures of different compositions, as was done for example in [86]. Thus, the possibilities of thermodynamic modeling for future calculations and investigation of deep mineralogy in the area that is not available for direct experimentation are opened.
5. Conclusions
We have constructed the equations of state of wollastonite, pseudowollastonite, breyite, larnite (Ca2SiO4), titanite-structured CaSi2O5 and CaSiO3-perovskite using a thermodynamic model based on the Helmholtz free energy. The proposed equations of state are developed based on optimization of different experimental measurements at ambient conditions and to a high temperatures and pressures. The full set of thermodynamic properties (volume, thermal expansion, entropy, isobaric and isochoric heat capacity, bulk moduli, Gibbs energy, etc.) of studied Ca-silicates is calculated at given pressures and temperatures and is presented in the form of Tables to the present article. The calculated properties are compared with reference and experimental data. It is shown that the proposed equations of state reliably describe properties of studied Ca-silicates in a wide range of pressures and temperatures.
The phase diagram of the CaSiO3 system is constructed at pressures up to 20 GPa and temperatures up to 2000 K. The calculated phase diagram are compared with experimental data for different phases and clarifies the phase boundaries in the CaSiO3 system under upper mantle conditions. The phase transition of majorite garnet, which contains CaSiO3 phase in its composition, to Ca-perovskite is associated with seismic boundary at the depth 520 km; therefore, it points to the role of calcium-containing minerals in the upper mantle region. The calculated density of CaSiO3-perovskite is in good agreement with the density according to the PREM model at the lower-mantle region. The calculated thermodynamic data for Ca-perovskite open the possibilities of thermodynamic modeling at high pressures and temperatures.
Supplementary Materials
The following are available online at https://0-www-mdpi-com.brum.beds.ac.uk/2075-163X/11/3/322/s1, File S1: MS Excel spreadsheet for wollastonite (Wol.xls), File S2: MS Excel spreadsheet for pseudowollastonite (PsWol.xls), File S3: MS Excel spreadsheet for breyite (Brt.xls), File S4: MS Excel spreadsheet for larnite (Lrn.xls), File S5: MS Excel spreadsheet for titanite-structured CaSi2O5 (CaTit.xls), File S6: MS Excel spreadsheet for CaSiO3-perovskite (CaPv.xls); Table S1: Thermodynamic functions of pseudowollastonite at different pressures and temperatures, Table S2: Thermodynamic functions of breyite at different pressures and temperatures, Table S3: Thermodynamic functions of larnite (Ca2SiO4) at different pressures and temperatures, Table S4: Thermodynamic functions of titanite-structured CaSi2O5 at different pressures and temperatures, Table S5: Thermodynamic functions of cubic CaSiO3-perovskite at different pressures and temperatures.
Author Contributions
Conceptualization, T.S.S. and P.I.D.; methodology, P.I.D.; software, T.S.S.; writing—review and editing, T.S.S. and P.I.D.; visualization, T.S.S. and P.I.D.; supervision, P.I.D. All authors have read and agreed to the published version of the manuscript.
Funding
The study was supported by the Russian Science Foundation, grant No. 19-77-00031. The program used for calculation of thermodynamic functions of Ca-silicates in the present study was registered in the Russian Federation (certificate No. 2019610474).
Data Availability Statement
Data is contained within the article or supplementary material.
Acknowledgments
We would like to thank Igor S. Sharygin for valuable comments and the Reviewers for their constructive comments on this study. A detailed analysis of the present article by one of the Reviewers allowed us to significantly improve this manuscript.
Conflicts of Interest
The authors declare no conflict of interest.
References
- Gasparik, T.; Wolf, K.; Smith, C.M. Experimental determination of phase relations in the CaSiO3 system from 8 to 15 GPa. Am. Mineral. 1994, 79, 1219–1222. [Google Scholar]
- Swamy, V.; Dubrovinsky, L.S. Thermodynamic data for the phases in the CaSiO3 system. Geochim. Cosmochim. Acta 1997, 61, 1181–1191. [Google Scholar] [CrossRef]
- Joswig, W.; Stachel, T.; Harris, J.W.; Baur, W.H.; Brey, G.P. New Ca-silicate inclusions in diamonds—Tracers from the lower mantle. Earth Planet. Sci. Lett. 1999, 173, 1–6. [Google Scholar] [CrossRef]
- Stachel, T.; Harris, J.W.; Brey, G.P.; Joswig, W. Kankan diamonds (Guinea) II: Lower mantle inclusion parageneses. Contrib. Mineral. Petrol. 2000, 140, 16–27. [Google Scholar] [CrossRef]
- Anzolini, C.; Angel, R.J.; Merlini, M.; Derzsi, M.; Tokar, K.; Milani, S.; Krebs, M.Y.; Brenker, F.E.; Nestola, F.; Harris, J.W. Depth of formation of CaSiO3-walstromite included in super-deep diamonds. Lithos 2016, 265, 138–147. [Google Scholar] [CrossRef]
- Nestola, F.; Korolev, N.; Kopylova, M.; Rotiroti, N.; Pearson, D.G.; Pamato, M.G.; Alvaro, M.; Peruzzo, L.; Gurney, J.J.; Moore, A.E.; et al. CaSiO3 perovskite in diamond indicates the recycling of oceanic crust into the lower mantle. Nature 2018, 555, 237–241. [Google Scholar] [CrossRef] [Green Version]
- Woodland, A.B.; Girnis, A.V.; Bulatov, V.K.; Brey, G.P.; Hofer, H.E. Breyite inclusions in diamond: Experimental evidence for possible dual origin. Eur. J. Mineral. 2020, 32, 171–185. [Google Scholar] [CrossRef] [Green Version]
- Yang, H.; Prewitt, C.T. On the crystal structure of pseudowollastonite (CaSiO3). Am. Mineral. 1999, 84, 929–932. [Google Scholar] [CrossRef]
- Ringwood, A.E.; Major, A. Some high-pressure transformations of geophysical significance. Earth Planet. Sci. Lett. 1967, 2, 106–110. [Google Scholar] [CrossRef]
- Brenker, F.; Nestola, F.; Brenker, L.; Peruzzo, L.; Secco, L.; Harris, J.W. Breyite, IMA 2018-062, CNMNC Newsletter. Mineral. Mag. 2018, 82, 1225–1232. [Google Scholar]
- Essene, E. High-Pressure transformations in CaSiO3. Contrib. Mineral. Petrol. 1974, 45, 247–250. [Google Scholar] [CrossRef]
- Akaogi, M.; Yano, M.; Tejima, Y.; Iijima, M.; Kojitani, H. High-pressure transitions of diopside and wollastonite: Phase equilibria and thermochemistry of CaMgSi2O6, CaSiO3 and CaSi2O5–CaTiSiO5 system. Phys. Earth Planet. Inter. 2004, 143–144, 145–156. [Google Scholar] [CrossRef]
- Kanazaki, M.; Stebbins, J.F.; Xue, X. Characterization of quenched high pressure phase in CaSiO3 system by XRD and 29Si NMR. Geophys. Res. Lett. 1991, 18, 463–466. [Google Scholar] [CrossRef]
- Sueda, Y.; Irifune, T.; Yamada, A.; Inoue, T.; Liu, X.; Funakoshi, K. The phase boundary between CaSiO3 perovskite and Ca2SiO4+CaSi2O5 determined by in situ X-ray observations. Geophys. Res. Lett. 2006, 33, L10307. [Google Scholar] [CrossRef]
- Chatterjee, N.D.; Johannes, W.; Leistner, H. The system CaO-Al2O3-SiO2-H2O: New phase equilibria data, some calculated phase relations, and their petrological applications. Contrib. Mineral. Petrol. 1984, 88, 1–13. [Google Scholar] [CrossRef]
- Dorogokupets, P.I.; Dymshits, A.M.; Sokolova, T.S.; Danilov, B.S.; Litasov, K.D. The equations of state of forsterite, wadsleyite, ringwoodite, akimotoite, MgSiO3-perovskite, and postperovskite and phase diagram for the Mg2SiO4 system at pressures of up to 130 GPa. Russ. Geol. Geophys. 2015, 56, 172–189. [Google Scholar] [CrossRef]
- Sokolova, T.S.; Dorogokupets, P.I.; Litasov, K.D.; Danilov, B.S.; Dymshits, A.M. Spreadsheets to calculate P-V-T relations, thermodynamic and thermoelastic properties of silicates in the MgSiO3–MgO system. High Press. Res. 2018, 38, 193–211. [Google Scholar] [CrossRef]
- Sokolova, T.S.; Dorogokupets, P.I.; Litasov, K.D. Self-consistent pressure scales based on the equations of state for ruby, diamond, MgO, B2–NaCl as well as Au, Pt, and other metals to 4 Mbar and 3000 K. Russ. Geol. Geophys. 2013, 54, 181–199. [Google Scholar] [CrossRef]
- Sokolova, T.S.; Dorogokupets, P.I.; Dymshits, A.M.; Danilov, B.S.; Litasov, K.D. Microsoft excel spreadsheets to calculate P-V-T relations and thermodynamic properties from equations of state of nine metals, MgO and diamond used as pressure markers in high-pressure and high-temperature experiments. Comput. Geosci. 2016, 94, 162–169. [Google Scholar] [CrossRef]
- Dorogokupets, P.I.; Dymshits, A.M.; Litasov, K.D.; Sokolova, T.S. Thermodynamics and equations of state of iron to 350 GPa and 6000 K. Sci. Rep. 2017, 7, 1–11. [Google Scholar] [CrossRef] [Green Version]
- Litasov, K.D.; Sharygin, I.S.; Shatskii, A.F.; Gavryushkin, P.N.; Dorogokupets, P.I.; Sokolova, T.S.; Ohtani, E.; Dymshits, A.M.; Alifirova, T.A. P–V–T Equations of state for iron carbides Fe3C and Fe7C3 and their relationships under the conditions of the Earth’s mantle and core. Dokl. Earth Sci. 2013, 453, 1269–1273. [Google Scholar] [CrossRef]
- Dorogokupets, P.I.; Sokolova, T.S.; Dymshits, A.M.; Litasov, K.D. Thermodynamic properties of rock-forming oxides, α-Al2O3, Cr2O3, α-Fe2O3, and Fe3O4 at high temperatures and pressures. Geodynam. Tectonophys. 2016, 7, 459–476. [Google Scholar] [CrossRef] [Green Version]
- Magomedov, M.N. Variations in thermal properties of diamond under isothermal compression. Tech. Phys. 2017, 62, 661–668. [Google Scholar]
- Angel, R.J.; Miozzi, F.; Alvaro, M. Limits to the validity of thermal-pressure equations of state. Minerals 2019, 9, 562. [Google Scholar] [CrossRef] [Green Version]
- Katsura, T.; Tange, Y. A simple derivation of the Birch–Murnaghan equations of state (EOSs) and comparison with EOSs derived from other definitions of finite strain. Minerals 2019, 9, 745. [Google Scholar] [CrossRef] [Green Version]
- Khishchenko, K.V. Equation of state for rhenium at high pressures. J. Phys. Conf. Ser. 2020, 1556, 012041. [Google Scholar] [CrossRef]
- Zharkov, V.N.; Kalinin, V.A. Equations of State for Solids at High Pressures and Temperatures; Consuitants Bureau: New York, NY, USA, 1971. [Google Scholar]
- Kunc, K.; Loa, I.; Syassen, K. Equation of state and phonon frequency calculations of diamond at high pressures. Phys. Rev. B 2003, 68, 094107. [Google Scholar] [CrossRef] [Green Version]
- Vinet, P.; Ferrante, J.; Rose, J.H.; Smith, J.R. Compressibility of solids. J. Geophys. Res. 1987, 92, 9319–9325. [Google Scholar] [CrossRef]
- Holzapfel, W.B. Physics of solids under strong compression. Rep. Prog. Phys. 1996, 59, 29–90. [Google Scholar] [CrossRef]
- Birch, F. Finite strain isotherm and velocities for single-crystal and polycrystalline NaCl at high pressures and 300 K. J. Geophys. Res. Solid Earth 1978, 83, 1257–1268. [Google Scholar] [CrossRef]
- Dorogokupets, P.I.; Oganov, A.R. Equations of state of Al, Au, Cu, Pt, Ta, and W and revised ruby pressure scale. Dokl. Earth Sci. 2006, 410, 1091–1095. [Google Scholar] [CrossRef]
- Dorogokupets, P.I.; Oganov, A.R. Ruby, metals, and MgO as alternative pressure scales: A semiempirical description of shock-wave, ultrasonic, X-ray, and thermochemical data at high temperatures and pressures. Phys. Rev. B 2007, 75, 024115. [Google Scholar] [CrossRef]
- Al’tshuler, L.V.; Brusnikin, S.E.; Kuz’menkov, E.A. Isotherms and Gruneisen functions of 25 metals. J. Appl. Mech. Tech. Phys. 1987, 28, 129–141. [Google Scholar] [CrossRef]
- Schmetterer, C.; Masset, P.J. Heat capacity of compounds in the CaO-SiO2 System—A Review. J. Phase Equilib. Diffus. 2012, 33, 261–275. [Google Scholar] [CrossRef]
- Swamy, V.; Dubrovinsky, L.S.; Tutti, F. High-temperature Raman spectra and thermal expansion of wollastonite. J. Am. Ceram. Soc. 1997, 80, 2237–2247. [Google Scholar] [CrossRef]
- Vaiday, S.N.; Bailey, S.; Pasternack, T.; Kennedy, G.C. Compressibility of fifteen minerals to 45 kilobars. J. Geophys. Res. 1973, 78, 6893–6898. [Google Scholar] [CrossRef]
- Yang, H.; Prewitt, C.T. Crystal structure and compressibility of a two-layer polytype of pseudowollastonite (CaSiO3). Am. Mineral. 1999, 84, 1902–1905. [Google Scholar] [CrossRef]
- Southard, J.C. A modified calorimeter for high temperatures. The heat content of silica, wollastonite and thorium dioxide above 25°. J. Am. Chem. Soc. 1941, 63, 3142–3146. [Google Scholar] [CrossRef]
- Krupka, K.M.; Robie, R.A.; Hemingway, B.S.; Kerrick, D.M. Low-temperature heat capacities an derived thermodynamic properties of anthophyllite, diopside, enstatite, bronzite, and wollastonite. Am. Mineral. 1985, 70, 249–260. [Google Scholar]
- Krupka, K.M.; Robie, R.A.; Hemingway, B.S.; Kerrick, D.M. High-temperature heat capacities and derived thermodynamic properties of anthophyllite, diopside, dolomite, enstatite, bronzite, talc, tremolite, and wollastonite. Am. Mineral. 1985, 70, 261–271. [Google Scholar]
- Richet, P.; Fiquet, G. High-Temperature heat capacity and premelting of minerals in the system MgO-CaO-Al2O3-SiO2. J. Geophys. Res. 1991, 96, 445–456. [Google Scholar] [CrossRef]
- Holland, T.J.B.; Powell, R. An improved and extended internally consistent thermodynamic dataset for phases of petrological interest, involving a new equation of state for solids. J. Metamorph. Geol. 2011, 29, 333–383. [Google Scholar] [CrossRef]
- Richet, P.; Mysen, B.O.; Ingrib, J. High-temperature X-ray diffraction and Raman spectroscopy of diopside and pseudowollastonite. Phys. Chem. Miner. 1998, 25, 401–414. [Google Scholar] [CrossRef]
- White, W.P. Silicate specific heats, Second series. Am. J. Sci. 1919, 47, 1–44. [Google Scholar] [CrossRef]
- Parks, G.S.; Kelley, K.K. The heat capacity of calcium silicate. J. Phys. Chem. 1926, 30, 1175–1178. [Google Scholar] [CrossRef]
- Berman, R.G.; Brown, T.H. Heat capacity of minerals in the system Na2O-K2O-CaO-MgO-FeO-Fe2O3-A12O3-SiO2-TiO2-H2O-CO2: Representation, estimation, and high temperature extrapolation. Contrib. Mineral. Petrol. 1985, 89, 168–183. [Google Scholar] [CrossRef]
- Huang, W.-L.; Wyllie, P.J. Melting and subsolidus phase relationships for CaSiO3 to 35 kilobars pressure. Am. Mineral. 1975, 60, 213–217. [Google Scholar]
- Joswig, W.; Paulus, E.F.; Winkler, B.; Milman, V. The crystal structure of CaSiO3-walstromite, a special isomorph of wollastonite-II. Z. Krist. 2003, 218, 811–818. [Google Scholar] [CrossRef]
- Liu, X.; Wang, S.; He, Q.; Chen, J.; Wang, H.; Li, S.; Peng, F.; Zhang, L.; Fei, Y. Thermal elastic behavior of CaSiO3-walstromite: A powder X-ray diffraction study up to 900 °C. Am. Mineral. 2012, 97, 262–267. [Google Scholar] [CrossRef]
- Remy, C.; Andrault, D.; Madon, M. High-temperature, high-pressure X-ray investigation of dicalcium silicate. J. Am. Ceram. Soc. 1997, 80, 851–860. [Google Scholar] [CrossRef]
- Yamnova, N.A.; Zubkova, N.V.; Eremin, N.N.; Zadov, A.E.; Gazeev, V.M. Crystal structure of larnite β-Ca2SiO4 and specific features of polymorphic transitions in dicalcium orthosilicate. Crystallogr. Rep. 2011, 56, 210–220. [Google Scholar] [CrossRef]
- Tilley, C.E. On larnite (calcium orthosilicate, a new mineral) and its associated minerals from the limestone contact-zone of Scawt Hill, Co. Antrim. Mineral. Mag. 1929, 22, 77–86. [Google Scholar] [CrossRef]
- Todd, S.S. Low-temperature heat capacities and entropies at 298.16 °K of crystalline calcium orthosilicate, zinc orthosilicate and tricalcium silicate. J. Am. Chem. Soc. 1951, 73, 3277–3278. [Google Scholar] [CrossRef]
- Coughlin, J.P.; O’Brien, C.J. High temperature heat contents of calcium orthosilicate. J. Phys. Chem. 1957, 61, 767–769. [Google Scholar] [CrossRef]
- Fukuda, K.; Maki, I.; Ito, S. Anisotropic thermal expansion of β-Ca2SiO4 monoclinic crystal. J. Am. Ceram. Soc. 1997, 80, 1595–1598. [Google Scholar] [CrossRef]
- Xiong, Z.; Liu, X.; Shieh, S.R.; Wang, S.; Chang, L.; Tang, J.; Hong, X.; Zhang, Z.; Wang, H. Some thermodynamic properties of larnite (β-Ca2SiO4) constrained by high T/P experiment and/or theoretical simulation. Am. Miner. 2016, 101, 277–288. [Google Scholar] [CrossRef]
- Angel, R.J.; Kunz, M.; Miletich, R.; Woodland, A.B.; Koch, M.; Knoche, R.L. Effect of isovalent Si, Ti substitution on the bulk moduli of Ca(Ti1-xSix)SiO5 titanites. Am. Miner. 1999, 84, 282–287. [Google Scholar] [CrossRef]
- Ringwood, A.E.; Major, A. Synthesis of majorite and other high pressure garnets and perovskites. Earth Planet. Sci. Lett. 1971, 12, 411–418. [Google Scholar] [CrossRef]
- Sun, N.; Mao, Z.; Yan, S.; Wu, X.; Prakapenka, V.B.; Lin, J.-F. Confirming a pyrolitic lower mantle using self-consistent pressure scales and new constraints on CaSiO3 perovskite. Phys. Res. Solid Earth 2016, 121, 4876–4894. [Google Scholar] [CrossRef] [Green Version]
- Chen, H.; Shim, S.-H.; Leinenweber, K.; Prakapenka, V.; Meng, Y.; Prescher, C. Crystal structure of CaSiO3 perovskite at 28–62 GPa and 300 K under quasi-hydrostatic stress conditions. Am. Miner. 2018, 103, 462–468. [Google Scholar] [CrossRef]
- Kojitani, H.; Navrotsky, A.; Akaogi, M. Calorimetric study of perovskite solid solutions in the CaSiO3-CaGeO3 system. Phys. Chem. Miner. 2001, 28, 413–420. [Google Scholar] [CrossRef]
- Noguchi, M.; Komabayashi, T.; Hirose, K.; Ohishi, Y. High-temperature compression experiments of CaSiO3 perovskite to lowermost mantle conditions and its thermal equation of state. Phys. Chem. Miner. 2013, 40, 81–91. [Google Scholar] [CrossRef]
- Greaux, S.; Irifune, T.; Higo, Y.; Tange, Y.; Arimoto, T.; Liu, Z.; Yamada, A. Sound velocity of CaSiO3 perovskite suggests the presence of basaltic crust in the Earth’s lower mantle. Nature 2019, 565, 218–221. [Google Scholar] [CrossRef]
- Dorogokupets, P.I.; Dewaele, A. Equations of state of MgO, Au, Pt, NaCl-B1, and NaCl-B2: Internally consistent high-temperature pressure scales. High Press. Res. 2007, 27, 431–446. [Google Scholar] [CrossRef]
- Fei, Y.W.; Ricolleau, A.; Frank, M.; Mibe, K.; Shen, G.Y.; Prakapenka, V. Toward an internally consistent pressure scale. Proc. Natl. Acad. Sci. USA 2007, 104, 9182–9186. [Google Scholar] [CrossRef] [PubMed] [Green Version]
- Matsui, M.; Higo, Y.; Okamoto, Y.; Irifune, T.; Funakoshi, K.I. Simultaneous sound velocity and density measurements of NaCl at high temperatures and pressures: Application as a primary pressure standard. Am. Miner. 2012, 97, 1670–1675. [Google Scholar] [CrossRef]
- Mao, H.K.; Chen, L.C.; Hemley, R.J.; Jephcoat, A.P.; Wu, Y. Stability and equation of state of CaSiO3-perovskite to 134 GPa. J. Geophys. Res. 1989, 94, 17889–17894. [Google Scholar] [CrossRef]
- Shim, S.-H.; Duffy, T.S.; Shen, G. The equation of state of CaSiO3 perovskite to 108 GPa at 300 K. Phys. Earth Planet. Inter. 2000, 120, 327–338. [Google Scholar] [CrossRef]
- Wang, Y.; Weidner, D.J.; Guyot, F. Thermal equation of state of CaSiO3 perovskite. J. Geophys. Res. 1996, 101, 661–672. [Google Scholar] [CrossRef]
- Shim, S.-H.; Duffy, T.; Shen, G. The stability and P-V-T equation of state of CaSiO3 perovskite in the Earth’s lower mantle. J. Geophys. Res. 2000, 105, 25955–25968. [Google Scholar] [CrossRef]
- Wang, Y.; Weidner, D.J. Thermoelasticity of CaSiO3 perovskite and implications for the lower mantle. Geophys. Res. Lett. 1994, 21, 895–898. [Google Scholar] [CrossRef]
- Stixrude, L.; Lithgow-Bertelloni, C.; Kiefer, B.; Fumagalli, P. Phase stability and shear softening in CaSiO3 perovskite at high pressure. Phys. Rew. B 2007, 75, 024108. [Google Scholar] [CrossRef] [Green Version]
- Li, L.; Weidner, D.J.; Brodholt, J.; Alfe, D.; Price, G.D.; Caracas, R.; Wentzcovitch, R. Elasticity of CaSiO3 perovskite at high pressure and high temperature. Phys. Earth Planet. Inter. 2006, 155, 249–259. [Google Scholar] [CrossRef]
- Caracas, R.; Wentzcovitch, R.; Price, G.D.; Brodholt, J. CaSiO3 perovskite at lower mantle pressures. Geophys. Res. Lett. 2005, 32, L06306. [Google Scholar] [CrossRef] [Green Version]
- Karki, B.B.; Crain, J. First-principles determination of elastic properties of CaSiO3 perovskite at lower mantle pressures. Geophys. Res. Lett. 1998, 25, 2741–2744. [Google Scholar] [CrossRef]
- Adams, D.J.; Oganov, A. Ab initio molecular dynamics study of CaSiO3 perovskite at P-T conditions of Earth’s lower mantle. Phys. Rev. B 2006, 73, 184106. [Google Scholar] [CrossRef]
- Shen, G.; Lazor, P. Measurement of melting temperatures of some minerals under lower mantle pressures. J. Geophys. Res. 1995, 100, 17699–17713. [Google Scholar] [CrossRef]
- Zerr, A.; Serghiou, G.; Boehler, R. Melting of CaSiO3 perovskite to 430 kbar and first in-situ measurements of lower mantle eutectic temperatures. Geophys. Res. Lett. 1997, 24, 909–912. [Google Scholar] [CrossRef]
- Nomura, R.; Zhou, Y.; Irifune, T. Melting phase relations in the MgSiO3–CaSiO3 system at 24 GPa. Prog. Earth Planet. Sci. 2017, 4, 1–11. [Google Scholar] [CrossRef] [Green Version]
- Braithwaite, J.; Stixrude, L. Melting of CaSiO3 perovskite at high pressure. Geophys. Res. Lett. 2019, 46, 2037–2044. [Google Scholar] [CrossRef] [PubMed] [Green Version]
- Dziewonski, A.; Anderson, D. Preliminary reference Earth model. Phys. Earth Planet. Inter. 1981, 25, 297–356. [Google Scholar] [CrossRef]
- Stacey, F.D.; Davis, P.M. High pressure equations of state with applications to the lower mantle and core. Phys. Earth Planet. Inter. 2004, 142, 137–184. [Google Scholar] [CrossRef]
- Irifune, T.; Shinmei, T.; McCammon, C.A.; Miyajima, N.; Rubie, D.C.; Frost, D.J. Iron partitioning and density changes of pyrolite in Earth’s lower mantle. Science 2010, 327, 193–195. [Google Scholar] [CrossRef] [PubMed]
- Katsura, T.; Yoneda, A.; Yamazaki, D.; Yoshino, T.; Ito, E. Adiabatic temperature profile in the mantle. Phys. Earth Planet. Inter. 2010, 183, 212–218. [Google Scholar] [CrossRef]
- Sokolova, T.S.; Seredkina, A.I.; Dorogokupets, P.I. Density patterns of the upper mantle under Asia and the Arctic: Comparison of thermodynamic modeling and geophysical data. Pure Appl. Geophys. 2020, 177, 4289–4307. [Google Scholar] [CrossRef]
Figure 1.
The calculated heat capacity (a,b), molar volume at reference pressure (c,d) and compressibility as a function of pressure (e,f) of wollastonite (Wol) and pseudowollastonite (PsWol) in comparison with different reference and experimental data from [36,37,39,40,41,42] for Wol and from [38,42,44,45,46,47] for PsWol.

Figure 2.
The calculated volume of breyite as a function of temperature (a) and pressure (b) is compared with experimental data from [5,50].

Figure 3.
The calculated volume of larnite (β phase) as a function of temperature (a) and pressure (b) is compared with experimental data from [51,56,57].

Figure 4.
Difference between experimental measured pressure in [63] (a) and in [60] (b) and calculated pressure from the proposed equation of state of Ca-perovskite at different isotherms. The pressure in [63] is recalculated from the equation of state of Pt [65]; pressure in [60] is determined using the equation of state of Pt [66].

Figure 5.
Difference between experimental measured pressure (a) and adiabatic bulk modulus (b) from [64] and calculated pressure and adiabatic bulk modulus from the proposed equation of state of Ca-perovskite. The pressure in [64] is calculated from the equation of state of NaCl [67].

Figure 6.
Calculated phase diagram of the CaSiO3 system under upper mantle P-T conditions. Thick black lines are our calculations, symbols show the different experimental studies. The phase equilibria in the CaSiO3 system were studied in [1,12,15,62] and stability field of mineral association (Lrn + CaSi2O5) and Ca-perovskite in [71,72].

Figure 7.
Phase diagram of the CaSiO3 system under lower mantle P-T conditions. Thick black line, symbols, and color lines show melting line calculations from [1,78,79,80,81]; different dotted lines represent first-principle calculations of the phase boundaries in Ca-perovskite [73,77]. The gray area indicates the stability field of the tetragonal structure of Ca-perovskite.

Figure 8.
Densities (a) and adiabatic bulk moduli (b) of MgSiO3-perovskite from [16] and CaSiO3-perovskite from the present equation of state are calculated from the mantle geotherm in comparison with the density and adiabatic bulk modulus according to the PREM model [82] and calculation from [74].


Table 1.
Parameters of equations of state of Ca-silicates at ambient conditions.
| Parameters | Wol CaSiO3 | PsWol CaSiO3 | Brt CaSiO3 | β-Lrn Ca2SiO4 | Ca-Tit CaSi2O5 | Ca-Pv CaSiO3 |
|---|---|---|---|---|---|---|
| 𝓤0, kJmol−1 | −1658.007 | −1655.531 | −1651.400 | −2344.025 | −2524.000 | −1567.400 |
| V0, cm3mol−1 | 39.9 | 40.3 | 37.78 | 51.88 | 48.19 | 27.403 |
| K0, GPa | 81.5 | 86 | 78.6 | 105 | 178 | 239 |
| K’ | 3.28 | 3.8 | 4 | 6.27 | 4 | 4.13 |
| k | 5 | 5 | 5 | 5 | 5 | 5 |
| Θ01, K | 966 | 1039 | 952 | 838 | 975 | 935 |
| m1 | 7.5 | 7.5 | 7.5 | 10.5 | 12 | 7.5 |
| Θ02, K | 270 | 244 | 280 | 257 | 370 | 388 |
| m2 | 7.5 | 7.5 | 7.5 | 10.5 | 12 | 7.5 |
| γ0 | 1 | 1 | 0.745 | 1.263 | 1.3 | 1.913 |
| γ∞ | 0 | 0 | 0 | 0 | 0 | 0 |
| β | 1 | 1 | 1 | 1.041 | 1 | 0.486 |
| a0, 10−6 K−1 | 20.8 | |||||
| m | 1 |
Table 2.
Thermodynamic functions of wollastonite at different pressures and temperatures.
| P, GPa | T, K | V, cm3 mol−1 | α × 106, K−1 | S, Jmol−1 K−1 | CP, Jmol−1 K−1 | CV, Jmol−1 K−1 | KT, GPa | KS, GPa | ΔG, kJmol−1 |
|---|---|---|---|---|---|---|---|---|---|
| 0.0001 | 298.15 | 39.900 | 26.458 | 81.358 | 86.715 | 86.037 | 81.50 | 82.14 | −1658.007 |
| 0.0001 | 500 | 40.147 | 33.714 | 132.366 | 108.976 | 107.159 | 79.66 | 81.01 | −1679.826 |
| 0.0001 | 1000 | 40.907 | 40.288 | 214.108 | 124.900 | 119.946 | 74.62 | 77.70 | −1768.341 |
| 0.0001 | 1398 | 41.596 | 43.519 | 256.827 | 130.068 | 122.310 | 70.44 | 74.91 | −1862.474 |
| 0.0001 | 2000 | 42.763 | 48.446 | 304.482 | 136.431 | 123.596 | 63.94 | 70.58 | −2032.169 |
| 3 | 298.15 | 38.536 | 23.175 | 78.447 | 84.890 | 84.327 | 91.20 | 91.81 | −1540.406 |
| 3 | 500 | 38.746 | 29.732 | 128.623 | 107.621 | 106.089 | 89.43 | 90.72 | −1561.542 |
| 3 | 1000 | 39.393 | 35.446 | 209.562 | 123.771 | 119.586 | 84.55 | 87.51 | −1647.956 |
| 3 | 1500 | 40.130 | 38.619 | 260.949 | 129.599 | 122.464 | 79.48 | 84.11 | −1766.352 |
| 3 | 2000 | 40.944 | 41.668 | 298.850 | 134.050 | 123.490 | 74.28 | 80.63 | −1906.702 |
Table 3.
Direct experimental measurements of molar volume of CaSiO3-perovskite.
| Pressure Range, GPa | Temperature Range, K | Method | Reference |
|---|---|---|---|
| 0–134 | 300 | XRD | [68] |
| 16.8–108 | 300 | XRD | [69] |
| 28–62 | 300 | XRD | [61] |
| 0.59–13 | 301–1600 | XRD | [70] |
| 18–96 | 1238–2419 | XRD | [71] |
| 51–130 | 700–2300 | XRD | [63] |
| 21.2–156 | 1200–2600 | XRD | [60] |
| 12–23 | 700–1700 | XRD | [64] |
Table 4.
Density and adiabatic bulk modulus of cubic CaSiO3-perovskite at temperature, pressure, and depth of the lower mantle from the Preliminary Reference Earth Model (PREM) model.
Table 4.
Density and adiabatic bulk modulus of cubic CaSiO3-perovskite at temperature, pressure, and depth of the lower mantle from the Preliminary Reference Earth Model (PREM) model.
| Depth, km | P, GPa | T, K | Density, gcm−3 | Ks, GPa |
|---|---|---|---|---|
| 2891 | 135.75 | 3739 | 5.483 | 686.56 |
| 2771 | 128.71 | 2838 | 5.499 | 673.01 |
| 2741 | 126.97 | 2740 | 5.492 | 668.35 |
| 2571 | 117.35 | 2668 | 5.412 | 637.46 |
| 2371 | 106.39 | 2596 | 5.317 | 601.82 |
| 2171 | 95.76 | 2525 | 5.220 | 566.86 |
| 1971 | 85.43 | 2452 | 5.122 | 532.51 |
| 1771 | 75.36 | 2379 | 5.022 | 498.60 |
| 1571 | 65.52 | 2302 | 4.920 | 465.04 |
| 1371 | 55.9 | 2227 | 4.814 | 431.71 |
| 1171 | 46.46 | 2144 | 4.705 | 398.53 |
| 971 | 37.29 | 2060 | 4.592 | 365.70 |
| 771 | 28.29 | 1974 | 4.474 | 332.80 |
| 670 | 23.83 | 1931 | 4.412 | 316.19 |
Publisher’s Note: MDPI stays neutral with regard to jurisdictional claims in published maps and institutional affiliations. |
© 2021 by the authors. Licensee MDPI, Basel, Switzerland. This article is an open access article distributed under the terms and conditions of the Creative Commons Attribution (CC BY) license (http://creativecommons.org/licenses/by/4.0/).
Share and Cite
MDPI and ACS Style
Sokolova, T.S.; Dorogokupets, P.I. Equations of State of Ca-Silicates and Phase Diagram of the CaSiO3 System under Upper Mantle Conditions. Minerals 2021, 11, 322. https://0-doi-org.brum.beds.ac.uk/10.3390/min11030322
AMA Style
Sokolova TS, Dorogokupets PI. Equations of State of Ca-Silicates and Phase Diagram of the CaSiO3 System under Upper Mantle Conditions. Minerals. 2021; 11(3):322. https://0-doi-org.brum.beds.ac.uk/10.3390/min11030322
Chicago/Turabian StyleSokolova, Tatiana S., and Peter I. Dorogokupets. 2021. "Equations of State of Ca-Silicates and Phase Diagram of the CaSiO3 System under Upper Mantle Conditions" Minerals 11, no. 3: 322. https://0-doi-org.brum.beds.ac.uk/10.3390/min11030322
Note that from the first issue of 2016, this journal uses article numbers instead of page numbers. See further details here.