
Linear Structural Trends and Multi-Phase Intergrowths in Helvine-Group Minerals, (Zn,Fe,Mn)8[Be6Si6O24]S2


Department of Geoscience, University of Calgary, Calgary, AB T2N 1N4, Canada
Minerals 2021, 11(3), 325; https://0-doi-org.brum.beds.ac.uk/10.3390/min11030325
Submission received: 1 March 2021
/
Revised: 17 March 2021
/
Accepted: 18 March 2021
/
Published: 20 March 2021
(This article belongs to the Section Crystallography and Physical Chemistry of Minerals & Nanominerals)
Abstract
:Synchrotron high-resolution powder X-ray diffraction (HRPXRD) and Rietveld structure refinements were used to examine the crystal structure of single phases and intergrowths (either two or three phases) in 13 samples of the helvine-group minerals, (Zn,Fe,Mn)8[Be6Si6O24]S2. The helvine structure was refined in the cubic space group . For the intergrowths, simultaneous refinements were carried out for each phase. The structural parameters for each phase in an intergrowth are only slightly different from each other. Each phase in an intergrowth has well-defined unit-cell and structural parameters that are significantly different from the three endmembers and these do not represent exsolution or immiscibility gaps in the ternary solid-solution series. The reason for the intergrowths in the helvine-group minerals is not clear considering the similar radii, identical charge, and diffusion among the interstitial M cations (Zn2+, Fe2+, and Mn2+) that are characteristic of elongated tetrahedral coordination. The difference between the radii of Zn2+ and Mn2+ cations is 10%. Depending on the availability of the M cations, intergrowths may occur as the temperature, pressure, fugacity fS2, and fluid composition change on crystallization. The Be–Si atoms are fully ordered. The Be–O and Si–O distances are nearly constant. Several structural parameters (Be–O–Si bridging angle, M–O, M–S, average <M–O/S>[4] distances, and TO4 rotational angles) vary linearly with the a unit-cell parameter across the series because of the size of the M cation.
1. Introduction
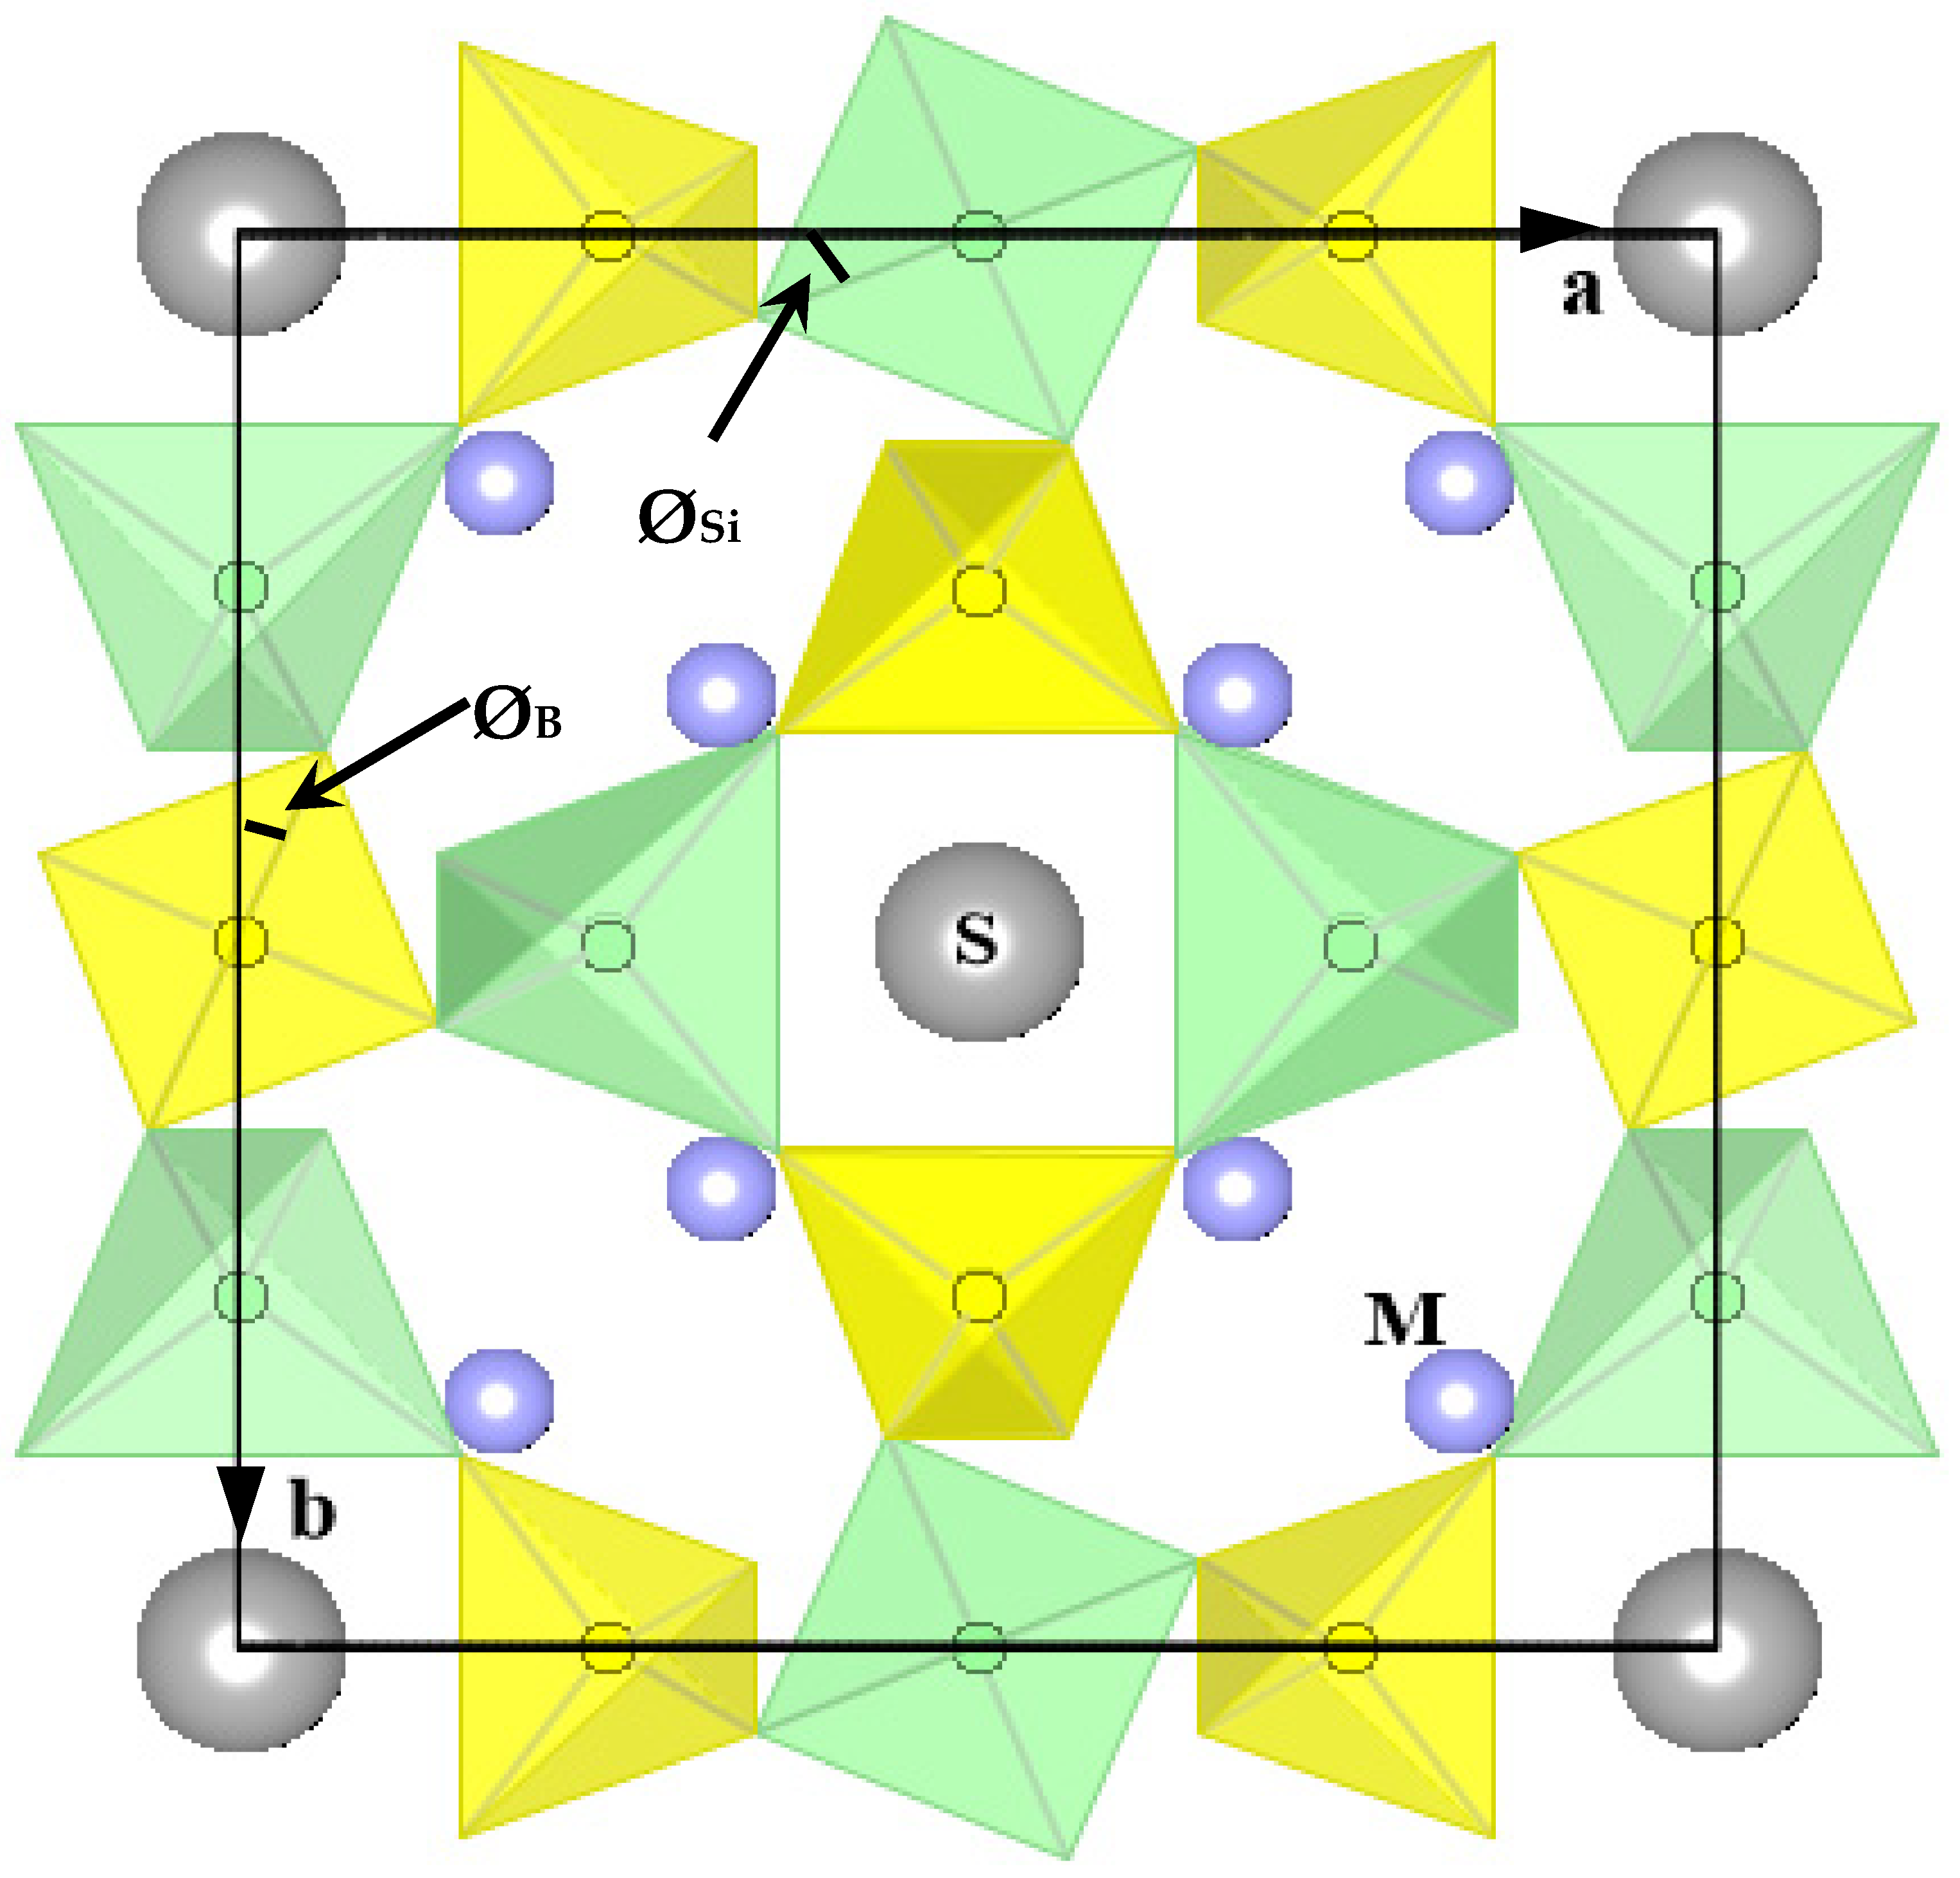
The helvine-group minerals with the general formula (Mn,Fe,Zn)8[Be6Si6O24]S2 occur in granites, pegmatites, contact metamorphic rocks, and skarns. The endmembers have interstitial M cations where M = Zn2+ (genthelvite), Fe2+ (danalite), and Mn2+ (helvine). The latter was formerly called helvite. Helvine is the most common, follow by danalite, and genthelvite is by far the rarest. Helvine-group minerals form an isomorphous series that is isostructural with sodalite, Na8[Al6Si6O24]Cl2 [1,2]. The Al atom in sodalite corresponds to the Be atom in helvine-group minerals, the Na to the M atom, and the Cl to the S atom. The crystal structure of the helvine-group minerals is known [1,2,3,4,5,6]. Reports on the high-temperature behavior of some sodalite-group minerals are available [7,8,9,10,11]. The framework structure of the helvine-group minerals consists of an ordered distribution of BeO4 and SiO4 tetrahedra that are linked to form four- and six-membered rings that create the sodalite or zeolite β cage, which contains tetrahedral SM4 clusters (Figure 1). The M cation is coordinated by three framework O atoms and one S atom in an elongated tetrahedral configuration.
Oscillatory zoning is common in garnet and plagioclase and is based on repetitious compositional variations that result from cyclical changes in the chemical environment during crystal growth. A zoned genthelvite sample from the Cairngorm Mountains, Scotland, has been reported [12]. Marked line splitting in a large diameter (11.46 cm) was observed with an X-ray camera, not detectable on films taken with a small diameter (6 cm) camera, indicating the presence of more than one helvine-group phase in the powder. The oscillatory zoning varies in composition from a central region of G79D16H5 (G = genthelvite, D = danalite, and H = helvine) to a crustal coating around G29D38H33. Zoned genthelvite samples from the Aïr Mountains, Niger, have also reported [13]. Oscillatory zoning in helvine-group minerals was also reported by other researchers [14,15,16,17,18,19]. For excellent images of oscillatory zoning in helvine, see Figure 3 in Raade [19]. Powder X-ray diffraction has detected intergrowths in several other minerals [20,21,22].
A geometrical model for a structure based on the sodalite framework topology is available [23], with the assumption that the interframework ions (Na, K, Ca, Cl, OH, H2O, SO4, etc.) have no effect on the Si–O and Al–O distances. The helvine-group minerals provide an ideal opportunity to examine the isolated effect of only interframework M cations on analogous Be–O and Si–O distances, together with the use of the sodalite model to explain variations in structural parameters.
Complete miscibility occurs between the Fe2+ and Mn members and between the Fe2+ and Zn members, but an immiscibility gap exists between the Mn and Zn members [14]. The pure endmembers helvine and genthelvite occur naturally, but danalite is about 86% of the Fe2+ endmember. Danalite is the only endmember that could not be synthesized in an early study [24], but was later synthesized [25]. Based on the crystal structure, the radii of the M atoms, and the sodalite model, complete miscibility should exist among the three endmembers [1,23]. The lack of pure danalite in nature may indicate that another phase may be more stable relative to danalite. Pure danalite (a = 8.203(1) Å) has been synthesized, as well as the mixed M cation varieties, (Mn4Fe4)[Be6Si6O24]S2 with a = 8.223(1) Å, and (Fe4Zn4)[Be6Si6O24]S2 with a = 8.097(1) Å [25]. Mössbauer studies of these samples showed quadrupole splitting, especially for the mixed M cation varieties. A zero-quadrupole splitting is expected if the anions surrounding the Fe2+ ion are identical. However, quadrupole splitting may also be explained by zoned intergrowths with slightly different compositions.
The sodalite structure has also been modeled by several researchers [26,27,28,29,30]. These models have been used to analyze the structural and thermal-expansion behavior of aluminosilicate sodalite [23]. The sodalite framework topology is in a partially-collapsed state because of the relatively small non-framework interstitial ions [6]. Heating (or substitution) causes the framework tetrahedra to rotate in a cooperative manner. This rotational mechanism is described in terms of the angles ØSi and ØAl through which the distinct TO4 tetrahedra are rotated relative to their position in the fully expanded state (see Figure 2 in Hassan and Grundy [23]).
Linear trends in structural parameters are expected for the helvine-group minerals, but only general trends were observed in a previous single-crystal study [1]. This study re-examined the trends of the structural parameters. In addition, this study shows that intergrowths (two or three phases) with slightly different compositional and structural parameters occur in helvine-group minerals, in addition to single phases. The crystal structures of the phases in intergrowths were refined simultaneously using the Rietveld method and synchrotron high-resolution powder X-ray diffraction (HRPXRD) data.
2. Materials and Methods
2.1. Electron-Probe Microanalysis
The samples used in this study were from various localities and were obtained from the Royal Ontario Museum (ROM; Table 1). Single-crystal structures of six samples are available [1]. Quantification of Be is not possible with electron-probe microanalysis (EPMA) because of the low atomic number of 4, so the Be amount was calculated from stoichiometry, assuming Si = 6 and Si + Be = 12 (Table 2).
The chemical analyses of the helvine-group samples (using small crystals encapsulated in epoxy resin, polished, and carbon coated) was obtained using a JEOL JXA-8200WD-ED electron-probe microanalyzer (JEOL Ltd., Tokyo, Japan). The JEOL operating program on a Solaris platform was used for ZAF (atomic number, absorption, and fluorescence) correction and data reduction. The wavelength-dispersive (WD) analysis was conducted quantitatively using an accelerated voltage of 15 kV, a beam current of 20 nA, and a beam diameter of 5 μm. Various minerals were used as standards (sphalerite (SKα), almandine (FeKα, AlKα, SiKα), rhodonite (MnKα), hornblende (CaKα), and zincite (ZnKα)). The average oxide weight percentage (wt. %) from about ten spots for each sample was used (Table 2). Sample 1 was from the same general locality as samples 2 and 3. The chemical compositions of the samples are shown in a ternary plot (Figure 2).
2.2. Synchrotron High-Resolution Powder X-ray Diffraction
Single crystals, about 0.2 × 0.2 × 0.2 mm3 in size, were handpicked under a stereomicroscope and finely ground in an agate mortar and pestle for HRPXRD experiments, which were performed at beamline 11-BM, Advanced Photon Source, Argonne National Laboratory (Lemont, IL, USA). The samples were loaded into kapton capillaries and rotated during the experiment at a rate of 90 rotations per second. Data were collected to a maximum 2θ of about 50° with a step size of 0.0005° and a step time of 0.1 s/step. The data were collected using 12 silicon crystal analyzers that allowed for high angular resolution, high precision, and accurate diffraction peak positions. A silicon (NIST 640c) and alumina (NIST 676a) standard (ratio of ⅓Si to ⅔Al2O3 by weight) was used to calibrate the instrument and refine the monochromatic wavelength (0.41416(1) Å) used in the experiment (Table 3). Technical aspects of the experimental setup are given elsewhere [32,33,34]. The experimental techniques used in this study are well-established [9,35,36,37,38,39,40].
2.3. Rietveld Structural Refinement
The HRPXRD trace was modeled using the Rietveld method [41], as implemented in the GSAS program [42], and using the EXPGUI interface [43]. Scattering curves for neutral atoms were used. The starting atom coordinates, cell parameter, and space group were taken from Hassan and Grundy [1]. The background was modeled using a Chebyschev polynomial (eight terms). The peak profiles were fitted with the pseudo-Voigt function (profile type 3) in the GSAS program [44]. A full matrix least-squares refinement was carried out by varying the parameters in the following sequence: scale factor, background, cell, zero offset, profile terms, atom positions, and isotropic displacement. The occupancy for the three interstitial M cations was refined in terms of the dominant M cation. In samples that contained two or three phases, the refinements were carried out simultaneously for each phase and their weight percentages were obtained. At the end of the refinement, all parameters were allowed to vary simultaneously, and the refinement proceeded to convergence. The cell parameters and other information regarding the Rietveld refinement are given in Table 3. The atom coordinates and displacement parameters are given in Table 4. The bond distances and angles are given in Table 5.
3. Results
3.1. Chemical Composition of Helvine-Group Minerals
The average chemical compositions given in Table 2 are shown in a ternary plot (Figure 2). Sample 13 was close to the genthelvite endmember. Three samples were close to the helvine endmember. Sample 12 was intermediate between danalite and genthelvite. The other samples were (Fe,Mn)-rich (Figure 2). We had too few samples to determine whether there were chemical miscibility gaps. Structurally, no miscibility gap should occur in helvine-group minerals [1].
3.2. Intergrowths in Helvine-Group Minerals
Several helvine-group minerals occurred as a single phase with sharp and narrow diffraction peaks (without splitting) in HRPXRD traces (Figure 3 and Figure 4). However, some samples had HRPXRD traces where each reflection peak was a doublet and the separation of each split peak increased with the 2θ angle (Figure 5 and Figure 6). This splitting or doublet of each reflection indicates two slightly different phases. The structural parameters obtained for the two phases were slightly different from each other (Table 3 to Table 5), and were similar to those obtained previously [1]. Another sample showed triplet splitting, indicating three separate phases (Figure 7). These intergrowths of two or three phases occurred in a single crystal of about 0.2 × 0.2 × 0.2 mm3 in size.
Intergrowths occur in helvine-group minerals with interstitial M cations of similar sizes and the same charge. The reason for the intergrowths, the scale, and their orientation relation cannot be answered by powder diffraction. The intergrowths in helvine-group minerals may occur as oscillatory zoning based on different M cation contents in each zone. Such oscillatory zoning is common in garnets where a few slightly different cubic phases occur in a sample [45,46,47,48,49,50,51,52]. Based on a previous single-crystal study [1], the helvine-group crystals were treated as single phases, and indeed single phases do occur in the series (Table 3; samples 1, 4, and 8 to 12). However, this study shows that many samples are an intergrowth of two or three phases. The single-crystal method is not appropriate to examine a multi-phase sample.
In the multi-phase samples, the structural parameters were only slightly different. For example, for the two phases in genthelvite (sample 13), the unit-cell parameters were 8.11920(1) Å (51% phase 1) and 8.12892(1) Å (49% phase 2). These similar cell parameters for the two genthelvite phases were quite different from those of either danalite or helvine [1]. The site occupancy factors (sof) for the interstitial cation M site in terms of Zn atoms were 0.987(1) for phase 1 and 0.965(2) for phase 2 [31]. These occupancy deficiencies indicate substitution of Zn by Mn, as Fe2+ was negligible according to the chemical analyses (Figure 2).
3.3. Framework Tetrahedral T–O Distances and O–T–O Angles
The general features of the structure of helvine-group minerals are similar to those of sodalite [23] and basic sodalite [53]. In this study, the average Be–O and Si–O distances were found to be 1.630 and 1.628 Å, respectively (Table 5), compared to those of 1.634(2) and 1.629(2) Å, respectively, from six single-crystal structure refinements [1]. These T–O distances appeared as constant within experimental errors because of the rigidity of the TO4 group.
Previous single-crystal studies have shown that the BeO4 and SiO4 tetrahedra are completely ordered in the helvine-group minerals [1,2,4]. In the present study, no trends were observed for the T–O distances, but they varied within narrow limits from about 1.62 to 1.64 Å (Table 5).
Throughout the helvine series, the T–O and tetrahedral O–O distances were nearly constant within error (Table 5). These are important features of the geometrical sodalite model [23]. The constancy of the framework tetrahedra dimensions show that they are not significantly affected by the different M cations. Although Mn and Fe2+ cations show very similar chemical behavior, they are usually dissimilar to Zn cations. However, in the helvine-group minerals, the M cations behave as hard spheres, the two distinct framework tetrahedra behave as rigid bodies and their interactions are purely geometrical. This effect arises from the rotational freedom of the framework tetrahedra, as discussed below.
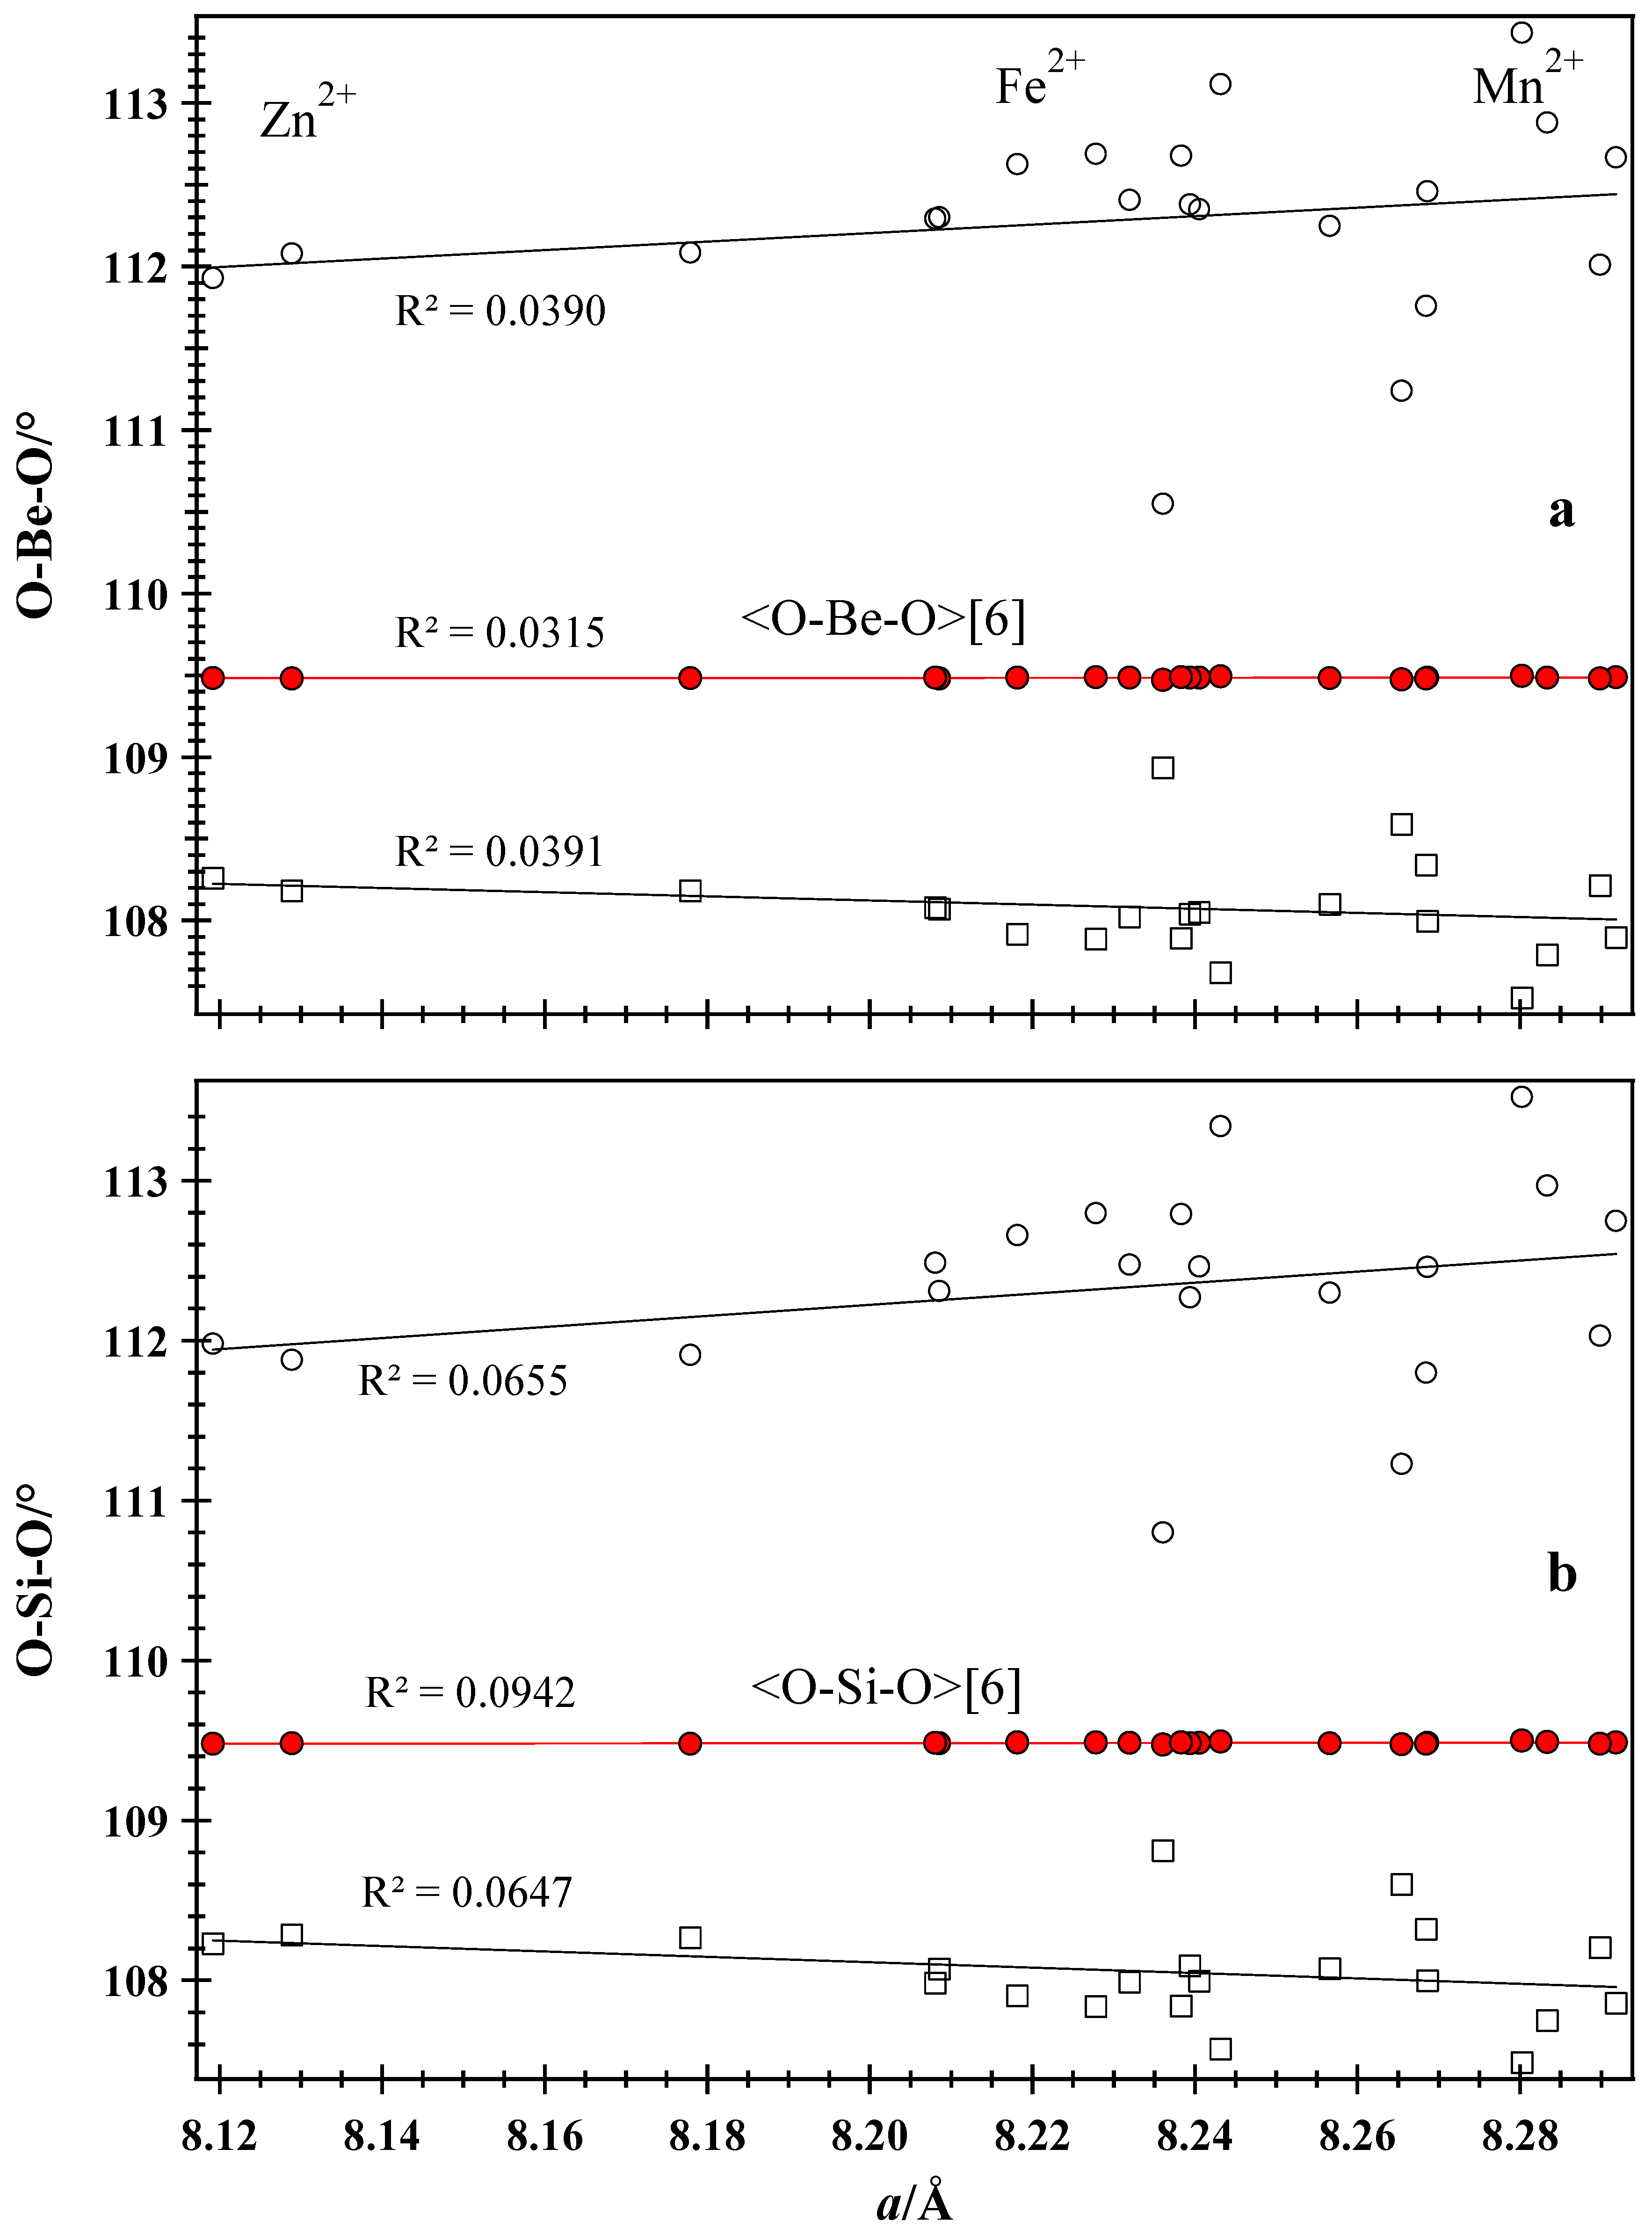
The tetrahedral O–T–O angles also vary within a narrow limit. The large O–T–O angle seems to increase, whereas the small angle seems to decrease with increasing a, the unit-cell parameter (Figure 8a,b). However, the average <O–T–O>[6] angle is constant at about 109.5°.
3.4. Be–O–Si Bridging Angle
The Be–O–Si bridging angle varied linearly with the a unit-cell parameter (Figure 9). Data from the literature are included in Figure 9 for comparison. The Be–O–Si angle was smallest for the Zn-rich species and largest for the Mn-rich species. Therefore, the larger M atom causes an increase in the Be–O–Si bridging angle because of the loss in polarizing power (attraction between the M and O atoms) associated with the larger M atom. The Si–O–Be angle varied from about 128.1 to 123.9° from endmembers helvine to genthelvite (Table 5).
3.5. TO4 Rotational Angles
The TO4 rotation angles decreased linearly with the a unit-cell parameter (Figure 10). This decrease paralleled the increase in the effective size of the interstitial cations and caused a more expanded framework. These rotational angles are indicated in Figure 1 and are defined elsewhere [1,23].
In sodalite, the difference in rotation angles between the two distinct framework tetrahedra was large (ØSi − ØAl = 1.6°) because of the significant difference in dimensions of the SiO4 (Si–O = 1.6100(2) Å) and AlO4 (Al–O = 1.7435(2) Å) tetrahedra [23,34]; this contrasted with the similar rotational angles (ØSi − ØBe ≈ 0°) between the similar dimensions of the SiO4 (Si–O = 1.628 Å) and BeO4 (Be–O = 1.630 Å) tetrahedra in the helvine-group minerals (calculated from values in Table 5). Moreover, for a given change in Ø, there was a larger change in unit-cell edge for the beryllosilicate framework than the aluminosilicate framework. Therefore, the framework tetrahedra in the helvine-group minerals have greater rotational freedom than in the aluminosilicate sodalite. The average rotation angle, Ø, varied from about 30.5 to 33.8° from pure helvine to pure genthelvite (Table 5). This variation was related to the size of the M cation.
3.6. Interstitial MO3S Elongated Tetrahedral Geometry
The M–O distances increased linearly with the a unit-cell parameter (Figure 11a), showing a good comparison with the data obtained from the literature. The increase in M–O distance paralleled the increase in size of the M cation.
The M–S distances also increased linearly with the a cell parameter (Figure 11b). The increase in M–S distance also paralleled the increase in size of the M cation. The O–M–O tetrahedral angle varied randomly between narrow limits from about 102 to 103°, whereas the O–M–S angle varied randomly between narrow limits from about 115 to 116° (Table 5).
The average <M–O/S>[4] tetrahedral distances increased with the increasing a cell parameter and the size of the M cation (Figure 11c). As the M cations radii decreased, their effective charge increased, so the M–O distance contracted and the following trends were observed: (1) the angle of rotation, Ø, increased, that is, the framework moved towards a more collapsed state and the Be–O–Si bridging angle decreased; (2) the dimensions of the interframework (MO3S) trigonal pyramid decreased; (3) the dimensions of the interframework (SM4) tetrahedron decreased. The same trends held for the intermediate members of the helvine-group minerals using a weighted average M cation radius.
Due to the small difference in radii among the M cations and the small difference in TO4 rotation angle among the three endmembers, coupled with the rotational freedom of the TO4 tetrahedra, pure danalite exists and it was recently synthesized [25], so there should be no miscibility gap in the ternary system. The Mn member is more common than the Fe member, whereas the Zn member is the rarest. This frequency of occurrence may be related to the chalcophile-lithophile tendencies of the elements [54,55], and may explain the miscibility gap between natural Mn and Zn members, as has been observed [14].
3.7. Unit-Cell Parameters and M Cations Radii
The helvine-group minerals form a complete solid solution among the three ternary endmembers because of the rotational freedom of the TO4 tetrahedra and the similar sizes among the three interstitial M cations [1]. The radii of the tetrahedrally-coordinated M cations are Mn2+ (HS) = 0.66, Fe2+ (HS) = 0.63, and Zn2+ = 0.60 Å [56]. The difference between the radii of Mn2+ and Zn2+ is about 10%. Based on the similar size and the identical charge among the M cations, a complete ternary solid solution should exist for the helvine-group minerals.
The samples in this study covered the full range of cell dimensions: endmember helvine (8.29180(1) Å) to endmember genthelvite (8.11919(1) Å) with a mean of 8.2055 Å, which corresponds to a pure endmember danalite (Table 3). Endmember danalite had a cell edge that was midway between the other two endmembers, as the radius of Fe2+ was the mean of Mn2+ and Zn2+. Therefore, pure danalite should have a cell edge of 8.2055 Å and a mean Ø = 32º. This compares well with a = 8.203(1) Å for pure synthetic danalite [25]. The decrease in the cell edge paralleled the decrease in the radii of the M cations (Figure 12). The same trends held for the intermediate members of the helvine-group minerals using a weighted average M cation radius.
4. Conclusions
HRPXRD data and Rietveld structure refinement indicate that two- or three-phase intergrowths and single phases occur in helvine-group minerals. The Be–Si atoms were fully ordered, and the Be–O and Si–O distances were nearly constant. The structural parameters for each phase in an intergrowth were only slightly different from each other. The reason for the intergrowths was unclear considering the similar size and identical charge among the interstitial M cations, where the difference between the radii of Zn and Mn is only 10%. Diffusion among the M cations was probably hindered and gave rise to oscillatory zoning due to possible changes in pressure, temperature, fS2, fO2, and the availability of M cations on crystallization. Several structural parameters (Be–O–Si angle, M–O and S–C distances, and TO4 rotational angles ØSi and ØBe) varied linearly with the a unit-cell parameter across the series and are were to the size of the M cation.
Funding
This research was funded by a NSERC Discovery Grant to SMA, grant number 10013896.
Acknowledgments
We thank the two anonymous reviewers for comments that helped improve this manuscript. The samples used in this study were obtained from the Royal Ontario Museum. We thank Robert Marr for his help with EPMA data collection. The HRPXRD data were collected at the X-ray Operations and Research beamline 11-BM, Advanced Photon Source (APS), Argonne National Laboratory (ANL). Use of the APS was supported by the U.S. Dept. of Energy, Office of Science, Office of Basic Energy Sciences, under Contract No. DE-AC02-06CH11357.
Conflicts of Interest
The author declares no conflict of interest.
References
- Hassan, I.; Grundy, H.D. The crystal structures of helvite group minerals, (Mn,Fe,Zn)8(Be6Si6O24)S2. Am. Mineral. 1985, 70, 186–192. [Google Scholar]
- Holloway, W.M., Jr.; Giordano, T.J.; Peacor, D.R. Refinement of the crystal structure of helvite, Mn4(BeSiO4)3S. Acta Crystallogr. 1972, B28, 114–117. [Google Scholar] [CrossRef]
- Barth, T.F.W. Die kristallographische beziehung zwischen helvin and sodalit. Nor. Geol. Tidsskr. 1926, 9, 40–42. [Google Scholar]
- Nimis, P.; Molin, G.; Visoná, D. Crystal chemistry of danalite from Daba Shabeli Complex (N Somalia). Mineral. Mag. 1996, 60, 375–379. [Google Scholar] [CrossRef]
- Gottfried, C. Die raumgruppe des helvins. Z. Krist. 1927, 65, 425–427. [Google Scholar]
- Pauling, L. The structure of sodalite and helvite. Z. Krist. 1930, 74, 213–225. [Google Scholar]
- Antao, S.M.; Hassan, I. Thermal analyses of sodalite, tugtupite, danalite, and helvite. Can. Mineral. 2002, 40, 163–172. [Google Scholar] [CrossRef] [Green Version]
- Antao, S.M.; Hassan, I.; Parise, J.B. The structure of danalite at high temperature obtained from synchrotron radiation and Rietveld refinements. Can. Mineral. 2003, 41, 1413–1422. [Google Scholar] [CrossRef]
- Hassan, I.; Antao, S.M.; Parise, J.B. Haüyne: Phase transition and high-temperature structures obtained from synchrotron radiation and Rietveld refinements. Mineral. Mag. 2004, 68, 499–513. [Google Scholar] [CrossRef]
- Antao, S.M.; Hassan, I.; Parise, J.B. Tugtupite: High-temperature structures obtained from in situ synchrotron diffraction and Rietveld refinements. Am. Mineral. 2004, 89, 492–497. [Google Scholar] [CrossRef]
- Hassan, I.; Antao, S.M.; Parise, J.B. Sodalite: High temperature structures obtained from synchrotron radiation and Rietveld refinements. Am. Mineral. 2004, 89, 359–364. [Google Scholar] [CrossRef]
- Clark, A.M.; Fejer, E.E. Zoned genthelvite from the Cairngorm Mountains, Scotland. Mineral. Mag. 1976, 40, 637–639. [Google Scholar] [CrossRef] [Green Version]
- Perez, J.-B.; Dusausoy, Y.; Babkine, J.; Pagel, M. Mn zonation and fluid inclusions in genthelvite from the Taghouaji complex (Aïr Mountains, Niger). Am. Mineral. 1990, 75, 909–914. [Google Scholar]
- Dunn, P.J. Genthelvite and the helvine group. Mineral. Mag. 1976, 40, 627–636. [Google Scholar] [CrossRef]
- Haapala, I.; Ojanperä, P. Genthelvite-bearing greisens in southern Finland. Bull. Geol. Surv. Finl. 1972, 259, 22. [Google Scholar]
- Langhof, J.; Holstam, D.; Gustafsson, L. Chiavennite and zoned genthelvite–helvite as late-stage minerals of the Proterozoic LCT pegmatites at Utö, Stockholm, Sweden. GFF 2000, 122, 207–212. [Google Scholar] [CrossRef]
- Zito, G.; Hanson, S.L. Genthelvite overgrowths on danalite cores from a pegmatite miarolitic cavity in Cheyenne Canyon, El Paso County, Colorado. Can. Mineral. 2017, 55, 195–206. [Google Scholar] [CrossRef]
- Kwak, T.A.P.; Jackson, P.G. The compositional variation and genesis of danalite in Sn–F–W skarns, NW Tasmania, Australia. Neues Jahrb. Mineral. Mon. 1986, 10, 452–462. [Google Scholar]
- Raade, G. Helvine-group minerals from Norwegian granitic pegmatites and some other granitic rocks: Cases of significant Sc and Sn contents. Can. Mineral. 2020, 58, 367–379. [Google Scholar] [CrossRef]
- Antao, S.M.; Nicholls, J.W. Crystal chemistry of three volcanic K-rich nepheline samples from Oldoinyo Lengai, Tanzania and Mount Nyiragongo, Eastern Congo, Africa. Front. Earth Sci. 2018, 6, 155. [Google Scholar] [CrossRef]
- Antao, S.M.; Hovis, G.L. Structural variations across the nepheline (NaAlSiO4)-kalsilite (KAlSiO4) series. Am. Mineral. 2020, in press. [Google Scholar] [CrossRef]
- Zaman, M.M.; Antao, S.M. A Possible Radiation-Induced Transition from Monazite-(Ce) to Xenotime-(Y). Minerals 2021, 11, 16. [Google Scholar] [CrossRef]
- Hassan, I.; Grundy, H.D. The crystal structures of sodalite-group minerals. Acta Crystallogr. 1984, 40, 6–13. [Google Scholar] [CrossRef]
- Mel’nikov, O.K.; Latvin, B.M.; Fedosova, S.P. Production of helvite-group compounds. In Gidrotermal’nyi Sintez Kristallov; Lobacher, A.M., Ed.; Nauka Press: Moscow, Russia, 1968; pp. 167–174. (In Russian) [Google Scholar]
- Armstrong, J.A.; Dann, S.E.; Neumann, K.; Marco, J.F. Synthesis, structure and magnetic behaviour of the danalite family of minerals, Fe8[BeSiO4]6X2 (X = S, Se, Te). J. Mater. Chem. 2003, 13, 1229–1233. [Google Scholar] [CrossRef]
- Taylor, D. The thermal expansion of the sodalite group of minerals. Mineral. Mag. 1968, 36, 761–769. [Google Scholar] [CrossRef] [Green Version]
- Taylor, D. The thermal expansion behaviour of the framework silicates. Mineral. Mag. 1972, 38, 593–604. [Google Scholar] [CrossRef] [Green Version]
- Taylor, D.; Henderson, C.M.B. A computer model for the cubic sodalite structure. Phys. Chem. Miner. 1978, 2, 325–336. [Google Scholar] [CrossRef]
- Dempsey, M.J.; Taylor, D. Distance least squares modelling of the cubic sodalite structure and of the thermal expansion of Na8(Al6Si6O24)I2. Phys. Chem. Miner. 1980, 6, 197–208. [Google Scholar] [CrossRef]
- Beaghley, B.; Henderson, C.M.B.; Taylor, D. The crystal structures of aluminosilicate-sodalites: X -ray diffraction studies and computer modelling. Mineral. Mag. 1982, 46, 459–464. [Google Scholar] [CrossRef]
- Antao, S.M.; Hassan, I. A two-phase intergrowth of genthelvite from Mont Saint-Hilaire, Quebec. Can. Mineral. 2010, 48, 1217–1223. [Google Scholar] [CrossRef]
- Lee, P.L.; Shu, D.; Ramanathan, M.; Preissner, C.; Wang, J.; Beno, M.A.; Von Dreele, R.B.; Ribaud, L.; Kurtz, C.; Antao, S.M.; et al. A twelve-analyzer detector system for high-resolution powder diffraction. J. Synchrotron Radiat. 2008, 15, 427–432. [Google Scholar] [CrossRef] [PubMed]
- Wang, J.; Toby, B.H.; Lee, P.L.; Ribaud, L.; Antao, S.M.; Kurtz, C.; Ramanathan, M.; Von Dreele, R.B.; Beno, M.A. A dedicated powder diffraction beamline at the advanced photon source: Commissioning and early operational results. Rev. Sci. Instrum. 2008, 79, 085105. [Google Scholar] [CrossRef] [PubMed]
- Antao, S.M.; Hassan, I.; Wang, J.; Lee, P.L.; Toby, B.H. State-of-the-art high-resolution powder X-ray diffraction (HRPXRD) illustrated with Rietveld structure refinement of quartz, sodalite, tremolite, and meionite. Can. Mineral. 2008, 46, 1501–1509. [Google Scholar] [CrossRef]
- Antao, S.M.; Dhaliwal, I. Growth Oscillatory Zoning in Erythrite, Ideally Co3(AsO4)2·8H2O: Structural Variations in Vivianite-Group Minerals. Minerals 2017, 7, 136. [Google Scholar] [CrossRef]
- Antao, S.M.; Hassan, I.; Crichton, W.A.; Parise, J.B. Effects of high pressure and temperature on cation ordering in magnesioferrite, MgFe2O4, using in situ synchrotron X-ray powder diffraction up to 1430 K and 6 GPa. Am. Mineral. 2005, 90, 1500–1505. [Google Scholar] [CrossRef]
- Antao, S.M.; Hassan, I.; Mulder, W.H.; Lee, P.L. The R-3c→R-3m transition in nitratine, NaNO3, and implications for calcite, CaCO3. Phys. Chem. Miner. 2008, 35, 545–557. [Google Scholar] [CrossRef]
- Ehm, L.; Michel, F.M.; Antao, S.M.; Martin, C.D.; Lee, P.L.; Shastri, S.D.; Chupas, P.J.; Parise, J.B. Structural changes in nanocrystalline mackinawaite (FeS) at high pressure. J. Appl. Crystallogr. 2009, 42, 15–21. [Google Scholar] [CrossRef]
- Hassan, I.; Antao, S.M.; Hersi, A.A. Single-crystal XRD, TEM, and thermal studies of the satellite reflections in nepheline. Can. Mineral. 2003, 41, 759–783. [Google Scholar] [CrossRef]
- Parise, J.B.; Antao, S.M.; Michel, F.M.; Martin, C.D.; Chupas, P.J.; Shastri, S.; Lee, P.L. Quantitative high-pressure pair distribution function analysis. J. Synchrotron Radiat. 2005, 12, 554–559. [Google Scholar] [CrossRef]
- Rietveld, H.M. A profile refinement method for nuclear and magnetic structures. J. Appl. Crystallogr. 1969, 2, 65–71. [Google Scholar] [CrossRef]
- Larson, A.C.; Von Dreele, R.B. General Structure Analysis System (GSAS). Los Alamos National Laboratory Report, LAUR 86-748; LAUR 86-748; 2000. [Google Scholar]
- Toby, B.H. EXPGUI, a graphical user interface for GSAS. J. Appl. Crystallogr. 2001, 34, 210–213. [Google Scholar] [CrossRef] [Green Version]
- Finger, L.W.; Cox, D.E.; Jephcoat, A.P. A correction for powder diffraction peak asymmetry due to axial divergence. J. Appl. Crystallogr. 1994, 27, 892–900. [Google Scholar] [CrossRef]
- Antao, S.M.; Salvador, J.J. Crystal Chemistry of Birefringent Uvarovite Solid Solutions. Minerals 2019, 9, 395. [Google Scholar] [CrossRef] [Green Version]
- Antao, S.M.; Zaman, M.; Gontijo, V.L.; Camargo, E.S.; Marr, R.A. Optical anisotropy, zoning, and coexistence of two cubic phases in andradites from Quebec and New York. Contrib. Mineral. Petrol. 2015, 169, 10. [Google Scholar] [CrossRef]
- Antao, S.M. Three cubic phases intergrown in a birefringent andradite-grossular garnet and their implications. Phys. Chem. Miner. 2013, 40, 705–716. [Google Scholar] [CrossRef]
- Antao, S.M.; Klincker, A.M. Origin of birefringence in andradite from Arizona, Madagascar, and Iran. Phys. Chem. Miner. 2013, 40, 575–586. [Google Scholar] [CrossRef]
- Antao, S.M. The mystery of birefringent garnet: Is the symmetry lower than cubic? Powder Diffr. 2013, 28, 281–288. [Google Scholar] [CrossRef]
- Antao, S.M.; Mohib, S.; Zaman, M.; Marr, R.A. Ti-rich andradites: Chemistry, structure, multi-phases, optical anisotropy, and oscillatory zoning. Can. Mineral. 2015, 53, 133–158. [Google Scholar] [CrossRef]
- Antao, S.M. Is near-endmember birefringent grossular non-cubic? New evidence from synchrotron diffraction. Can. Mineral. 2013, 51, 771–784. [Google Scholar] [CrossRef]
- Antao, S.M.; Klincker, A.M. Crystal structure of a birefringent andradite-grossular from Crowsnest Pass, Alberta, Canada. Powder Diffr. 2014, 29, 20–27. [Google Scholar] [CrossRef]
- Hassan, I.; Grundy, H.D. Structure of basic sodalite, Na8Al6Si6O24(OF)2. 2H2O. Acta Crystallogr. 1983, 39, 3–5. [Google Scholar]
- Burt, D.M. Concepts of acidity and basicity in petrology—The exchange operator approach. Geol. Soc. Am. Abstr. Programs 1974, 6, 674–676. [Google Scholar]
- Burt, D.M. The stability of danalite, Fe3Be3(SiO4)3S. Am. Mineral. 1980, 65, 355–360. [Google Scholar]
- Shannon, R.D. Revised effective ionic radii and systematic studies of interatomic distances in halides and chalcogenides. Acta Crystallogr. 1976, 32, 751–767. [Google Scholar] [CrossRef]
Figure 1.
Projection of the structure of helvine-group minerals down [001] showing the lower half of the unit cell. The BeO4 (yellow) and SiO4 (green) tetrahedra alternate in the four- and six-membered rings. The angles of rotation of these TO4 tetrahedra from the fully expanded to the partially collapsed structure are indicated by ØBe and ØSi. The S atom is shown with large circles (grey), and the M (= Mn, Fe, Zn) cations (violet) are on the body diagonals. The unit-cell edges are shown (black lines).

Figure 2.
Ternary plot of the compositions of the helvine-group minerals used in this study. Sample 13 was nearly the genthelvite endmember. Three samples were Mn-rich and the others were (Fe,Mn)-rich.
Figure 2.
Ternary plot of the compositions of the helvine-group minerals used in this study. Sample 13 was nearly the genthelvite endmember. Three samples were Mn-rich and the others were (Fe,Mn)-rich.

Figure 3.
A single-phase sample (sample 4) from Japan. (a) High-resolution powder X-ray diffraction (HRPXRD) trace together with the calculated (continuous line) and observed (crosses) profiles. The difference curve (Iobs–Icalc) is shown at the bottom. The short vertical lines indicate the positions of allowed reflections. The intensity and difference curves of the high-angle region beyond 25° 2θ are multiplied by 40. (b) Part of an expanded view showing a sharp single peak in each of the three reflections, indicating a single-phase sample. However, a slight asymmetry in the peak shape may indicate a minor second phase, which was not modeled. Similar HRPXRD traces and indices (521; 440; 433; and 530) are given below with only their main features highlighted.

Figure 4.
A single-phase sample (sample 12) from Massachusetts. (a) The complete HRPXRD trace; (b) part of an expanded view showing a sharp single peak in each of the three reflections, indicating a single-phase sample.
Figure 4.
A single-phase sample (sample 12) from Massachusetts. (a) The complete HRPXRD trace; (b) part of an expanded view showing a sharp single peak in each of the three reflections, indicating a single-phase sample.

Figure 5.
A two-phase sample (sample 2) from Germany. (a) The complete HRPXRD trace; (b) part of an expanded view showing a doublet in each of the three reflections, indicating a two-phase intergrowth. The weight % of the phase with the smaller unit-cell parameter was slightly more than the other phase (Table 3).

Figure 6.
A two-phase sample (sample 6) from Colorado. (a) The complete HRPXRD trace; (b) part of an expanded view showing two well-separated peaks for each of the three main reflections, indicating a two-phase intergrowth.
Figure 6.
A two-phase sample (sample 6) from Colorado. (a) The complete HRPXRD trace; (b) part of an expanded view showing two well-separated peaks for each of the three main reflections, indicating a two-phase intergrowth.

Figure 7.
A triple-phase sample (sample 7) from Idaho. (a) The complete HRPXRD trace; (b) part of an expanded view showing a triplet in each of the three reflections, indicating a three-phase intergrowth.
Figure 7.
A triple-phase sample (sample 7) from Idaho. (a) The complete HRPXRD trace; (b) part of an expanded view showing a triplet in each of the three reflections, indicating a three-phase intergrowth.

Figure 8.
Individual (open black symbols) and average (red) tetrahedral angles vs. a unit-cell parameter: (a) O–Be–O and (b) O–Si–O angles. The individual O–T–O angles varied within narrow limits, but their average values were constant (109.5°). In each case, the larger tetrahedral angle seemed to increase whereas the smaller tetrahedral angle seemed to decrease with the a unit-cell parameter. The least-squares R2 values are given as inserts. Two data points (smallest a) for genthelvite are from [31].

Figure 9.
The Be–O–Si bridging angle increased linearly with the a unit-cell parameter. The large M cation had the largest bridging angle and a unit-cell parameter because the structure was more expanded.
Figure 9.
The Be–O–Si bridging angle increased linearly with the a unit-cell parameter. The large M cation had the largest bridging angle and a unit-cell parameter because the structure was more expanded.

Figure 10.
The TO4 tetrahedral rotational angles (see ∅ in Figure 1) decreased linearly with the a unit-cell parameter. When ∅ = 0°, the crystal structure was in a fully expanded state.
Figure 10.
The TO4 tetrahedral rotational angles (see ∅ in Figure 1) decreased linearly with the a unit-cell parameter. When ∅ = 0°, the crystal structure was in a fully expanded state.

Figure 11.
The (a) M–O, (b) M–S, and (c) average <M–O/S>[4] distances increased linearly with the a unit-cell parameter and the size of the M cation. The highest R2 value was for the average <M-O/S>[4] distance. Red circles represent HRPXRD from this study and those for genthelvite (lowest two a values) from elsewhere [31].

Figure 12.
Variation of weighted M cation radii vs. the a unit-cell parameter. The three pure endmembers (red squares) occurred along a straight line, showing the relationship between the unit-cell parameter and cation radii. For the intermediate members, a weighted average radius was used and deviations from the straight line were attributed to the less precise chemical analyses. Only data for single-phase samples are displayed (red solid circles).


Table 1.
Helvine-group minerals: sample localities and numbers.
| Sample | Mineral † | Locality | ROM # |
|---|---|---|---|
| 1 | Helvine | Saxony, Germany | M16941 |
| 2 | Helvine | Breitenbrunn, Saxony, Germany | E4152 |
| 3 | Helvine | Saxony, Germany | M5286 |
| 4 | Helvine | Kanuma, Oashi Mine, Tochigi Prefecture, Japan | M36756 |
| 5 | Danalite | Iron Mountain, New Mexico, USA | M29008 |
| 6 | Danalite | Sunnyside, San Juan Co., Colorado, USA | M36390 |
| 7 | Helvine | Sawtooth Range, Idaho, USA | M36514 |
| 8 | Helvine | Hortekollen, Norway | M35618 |
| 9 | Helvine | Mt. Francisco Pegmatite, Ribawa Area, W. Australia | M37261 |
| 10 | Danalite | McDame, BC, Canada | M22312 |
| 11 | Danalite | Government Pits, Conway, New Hampshire, USA | M34769 |
| 12 | Danalite | Rockport, Cape Ann, Granite Quary, Massachussetts, USA | M5287 |
| 13 * | Genthelvite | Mt. St. Hilaire, Rouville Co, Quebec, Canada | M32727 |
Table 2.
Helvine-group minerals: electron-probe microanalyses (EPMA).
| Sample | 2 | 3 | 4 | 5 | 7 | 8 | 9 | 10 | 11 | 12 | 13 |
|---|---|---|---|---|---|---|---|---|---|---|---|
| ZnO Wt. % | 2.34 | 5.42 | 1.45 | 2.17 | 8.69 | 6.69 | 4.13 | 3.05 | 9.68 | 19.96 | 48.37 |
| FeO | 2.87 | 4.23 | 8.81 | 29.31 | 21.41 | 16.91 | 24.00 | 33.74 | 32.07 | 23.95 | 0.01 |
| MnO | 45.72 | 40.92 | 39.88 | 19.54 | 21.77 | 26.36 | 24.97 | 13.39 | 10.65 | 6.80 | 1.47 |
| CaO | 0.31 | 0.09 | 0.09 | 0.01 | 0.02 | 0.07 | 0.05 | 0.00 | 0.04 | 0.02 | 0.01 |
| BeO | 13.21 | 13.16 | 13.11 | 12.66 | 12.86 | 12.62 | 12.72 | 13.18 | 12.78 | 13.17 | 12.84 |
| SiO2 | 31.74 | 31.62 | 31.50 | 30.41 | 30.90 | 30.31 | 30.56 | 31.67 | 30.71 | 31.63 | 30.85 |
| Al2O3 | 0.17 | 0.28 | 0.11 | 0.04 | 0.20 | 0.12 | 0.10 | 0.09 | 0.02 | 0.00 | 0.15 |
| S | 5.32 | 5.34 | 5.37 | 5.64 | 5.44 | 5.56 | 5.73 | 5.28 | 5.54 | 5.27 | 5.64 |
| – O ≡ S | 2.65 | 2.66 | 2.68 | 2.81 | 2.72 | 2.77 | 2.86 | 2.64 | 2.76 | 2.63 | 2.81 |
| Total | 99.02 | 98.39 | 97.65 | 96.97 | 98.58 | 95.86 | 99.40 | 97.76 | 98.73 | 98.17 | 96.53 |
| * Zn apfu | 0.33 | 0.76 | 0.20 | 0.32 | 1.25 | 0.98 | 0.60 | 0.43 | 1.40 | 2.79 | 6.94 |
| Fe | 0.45 | 0.67 | 1.40 | 4.84 | 3.48 | 2.80 | 3.94 | 5.35 | 5.24 | 3.80 | 0.00 |
| Mn | 7.32 | 6.58 | 6.43 | 3.26 | 3.58 | 4.42 | 4.15 | 2.15 | 1.76 | 1.09 | 0.24 |
| Ca | 0.06 | 0.02 | 0.02 | 0.00 | 0.00 | 0.01 | 0.01 | 0.00 | 0.01 | 0.00 | 0.00 |
| ƩM | 8.10 | 8.01 | 8.04 | 8.42 | 8.30 | 8.20 | 8.69 | 7.92 | 8.40 | 7.69 | 7.19 |
| Be | 6.00 | 6.00 | 6.00 | 6.00 | 6.00 | 6.00 | 6.00 | 6.00 | 6.00 | 6.00 | 6.00 |
| Si | 6.00 | 6.00 | 6.00 | 6.00 | 6.00 | 6.00 | 6.00 | 6.00 | 6.00 | 6.00 | 6.00 |
| Al | 0.02 | 0.03 | 0.01 | 0.00 | 0.02 | 0.01 | 0.01 | 0.01 | 0.00 | 0.00 | 0.02 |
| S | 1.88 | 1.90 | 1.92 | 2.08 | 1.98 | 2.06 | 2.11 | 1.88 | 2.03 | 1.87 | 2.06 |
* Number of ions on the basis of Si = 6; Be content was calculated (Si + Be = 12); samples 2, 9, 11, and 13 were previously studied, from which the EPMA for 9 and 11 were taken [1]. Analyses for samples 1 and 6 were not carried out because all the material was used up. The apfu (atom per formula unit) numbers in bold represents the dominant endmember.
Table 3.
Helvine-group minerals: unit-cell and Rietveld refinement parameters.
| Sample Number | a/Å | χ2 | * RF2 | Nobs | Mineral | Wt. % |
|---|---|---|---|---|---|---|
| 1 | 8.29180(1) | 2.726 | 0.0741 | 505 | Helvine | 100 |
| 2a | 8.28986(5) | 1.353 | 0.0453 | 1018 | Helvine 1 | 59.3(2) |
| 2b | 8.28022(2) | Helvine 2 | 40.7(2) | |||
| 3a | 8.26862(1) | 1.795 | 0.0524 | 999 | Helvine 1 | 88.9(2) |
| 3b | 8.28332(1) | Helvine 2 | 11.1(1) | |||
| 4 | 8.26844(1) | 2.944 | 0.0668 | 509 | Helvine | 100 |
| 5a | 8.24316(1) | 3.495 | 0.0726 | 1465 | Danalite 1 | 69.4(1) |
| 5b | 8.25658(2) | Danalite 2 | 9.6(1) | |||
| 5c | 8.23607(2) | Danalite 3 | 21.0(2) | |||
| 6a | 8.26544(2) | 1.765 | 0.0554 | 983 | Helvine 1 | 3.9(1) |
| 6b | 8.24052(1) | Danalite 2 | 96.1(1) | |||
| 7a | 8.23939(1) | 1.527 | 0.0393 | 1475 | Helvine 1 | 19.0(1) |
| 7b | 8.23197(2) | Helvine 2 | 77.1(1) | |||
| 7c | 8.20856(3) | Helvine 3 | 3.9(1) | |||
| 8 | 8.23829(1) | 2.100 | 0.0389 | 487 | Helvine | 100 |
| 9 | 8.22785(1) | 2.137 | 0.0464 | 487 | Helvine | 100 |
| 10 | 8.21817(1) | 1.784 | 0.0511 | 483 | Danalite | 100 |
| 11 | 8.20808(1) | 1.63 | 0.0437 | 480 | Danalite | 100 |
| 12 | 8.17792(1) | 1.581 | 0.0349 | 484 | Danalite | 100 |
| 13a | 8.12892(1) | 1.426 | 0.0293 | 944 | Genthelvite 1 | 49.4(1) |
| 13b | 8.11920(1) | Genthelvite 2 | 50.6(1) |
* RF2 = structure factor based on observed and calculated structure amplitudes = [∑(Fo2 − Fc2)/∑(Fo2)]1/2. * Structural data for genthelvite was published [31]. The 2θ range = 3.5–50° and λ = 0.41416(1) Å. For a single-phase sample, the number of data points was 92,996 and the number of variables was 29, so the data/variable ≈ 3207.
Table 4.
Helvine-group minerals: atom positions †, Uiso (×100), and site occupancy factor (sof) for the M site *.
Table 4.
Helvine-group minerals: atom positions †, Uiso (×100), and site occupancy factor (sof) for the M site *.
| Sample Number | 1 | 2a | 2b | 3a | 3b | 4 | 5a | 5b | 5c | 6a | 6b | |
| Be | U | 0.44(1) | 0.484(7) | 0.484(7) | 0.439(9) | 0.439(9) | 0.367(9) | 0.377(9) | 0.377(9) | 0.377(9) | 0.446(8) | 0.446(8) |
| Si | U | 0.44(1) | 0.484(7) | 0.484(7) | 0.439(9) | 0.439(9) | 0.367(9) | 0.377(9) | 0.377(9) | 0.377(9) | 0.446(8) | 0.446(8) |
| O | x | 0.14081(7) | 0.14004(8) | 0.1416(1) | 0.14032(7) | 0.1412(2) | 0.13954(9) | 0.14055(6) | 0.13990(7) | 0.13716(7) | 0.1389(2) | 0.13977(7) |
| y | 0.14119(6) | 0.14013(8) | 0.1420(1) | 0.14028(7) | 0.1416(2) | 0.13972(8) | 0.14163(5) | 0.14014(7) | 0.13841(7) | 0.1388(2) | 0.14033(6) | |
| z | 0.41670(6) | 0.41661(8) | 0.4158(1) | 0.41497(7) | 0.4170(2) | 0.41602(7) | 0.41395(6) | 0.41480(9) | 0.41426(9) | 0.4156(3) | 0.41416(6) | |
| U | 0.47(1) | 0.69(1) | 0.69(1) | 0.61(1) | 0.61(1) | 0.39(1) | 0.55(1) | 0.55(1) | 0.55(1) | 0.64(1) | 0.64(1) | |
| S | U | 1.45(1) | 1.54(2) | 0.80(2) | 1.24(2) | 0.92(5) | 1.37(2) | 1.37(2) | 1.17(8) | 1.43(5) | 1.31(9) | 1.35(1) |
| M | x | 0.16954(2) | 0.16960(3) | 0.17088(4) | 0.16967(2) | 0.17067(8) | 0.16991(2) | 0.16901(3) | 0.1692(1) | 0.16804(7) | 0.1703(2) | 0.1692(1) |
| U | 1.038(4) | 1.079(8) | 0.579(9) | 0.814(5) | 0.67(2) | 0.834(5) | 0.834(7) | 1.31(3) | 0.83(2) | 0.99(4) | 0.907(4) | |
| * sof | 1.038(1)Mn | 1.023(2)Mn | 0.995(2)Mn | 1.036(2)Mn | 1.005(5)Mn | 1.050(2)Mn | 1.000(2)Fe | 1.003(6)Fe | 0.966(5)Fe | 1.067(11)Mn | 0.999(1)Fe | |
| Sample Number | 7a | 7b | 7c | 8 | 9 | 10 | 11 | 12 | 13a | 13b | ||
| Be | U | 0.439(6) | 0.439(6) | 0.439(6) | 0.459(6) | 0.483(8) | 0.574(7) | 0.425(4) | 0.519(6) | 0.400(6) | 0.400(6) | |
| Si | U | 0.439(6) | 0.439(6) | 0.439(6) | 0.459(6) | 0.483(8) | 0.574(7) | 0.425(4) | 0.519(6) | 0.400(6) | 0.400(6) | |
| O | x | 0.1403(1) | 0.13988(7) | 0.1394(2) | 0.14014(6) | 0.14005(7) | 0.14007(6) | 0.13916(4) | 0.13900(5) | 0.13858(9) | 0.13779(8) | |
| y | 0.1397(1) | 0.14020(6) | 0.1395(2) | 0.14067(5) | 0.14056(6) | 0.14022(6) | 0.14009(4) | 0.13815(5) | 0.13758(9) | 0.13806(8) | ||
| z | 0.4144(1) | 0.41391(6) | 0.4119(2) | 0.41381(5) | 0.41330(6) | 0.41318(5) | 0.41239(4) | 0.41008(5) | 0.40811(8) | 0.40759(7) | ||
| U | 0.67(1) | 0.67(1) | 0.67(1) | 0.76(1) | 0.73(1) | 0.89(1) | 0.70(1) | 0.84(1) | 0.58(1) | 0.58(1) | ||
| S | U | 1.32(1) | 1.32(1) | 1.32(1) | 1.22(1) | 1.22(1) | 1.13(1) | 1.06(1) | 1.01(1) | 0.88(1) | 0.68(1) | |
| M | x | 0.16976(5) | 0.16909(2) | 0.1694(1) | 0.16950(2) | 0.16943(2) | 0.16912(2) | 0.16876(1) | 0.16825(1) | 0.16719(2) | 0.16700(2) | |
| U | 0.813(3) | 0.813(3) | 0.813(3) | 0.775(3) | 0.731(3) | 0.874(3) | 0.745(2) | 0.690(3) | 0.598(4) | 0.602(4) | ||
| sof | 0.997(3)Fe | 1.009(1)Fe | 1.070(7)Fe | 0.996(1)Fe | 1.010(1)Fe | 0.994(1)Fe | 1.017(1)Fe | 1.075(1)Fe | 0.857(6)Zn | 0.983(6)Zn |
† Be was at (¼, 0, ½), Si was at (¼, ½, 0), S was at (0,0, 0), and M was at (x, x, x). * sof in terms of the dominant M (= Mn, Zn, Fe) cation. For sample 13, the constraint used was Zn + Mn = 1.
Table 5.
Helvine-group minerals: bond distances (Å), angles (°), and rotation of TO4 tetrahedra (ØBe, ØSi).
Table 5.
Helvine-group minerals: bond distances (Å), angles (°), and rotation of TO4 tetrahedra (ØBe, ØSi).
| Sample Number | 1 | 2a | 2b | 3a | 3b | 4 | 5a | 5b | 5c | 6a | 6b | |
| Be–O | × 4 | 1.6333(6) | 1.6304(7) | 1.6355(8) | 1.6317(6) | 1.6311(9) | 1.6282(8) | 1.6371(4) | 1.6310(4) | 1.6315(4) | 1.627(1) | 1.6318(6) |
| O–Be–O | × 4 | 107.90(2) | 108.22(2) | 107.53(3) | 100.00(2) | 107.79(5) | 108.34(2) | 107.68(2) | 108.10(2) | 108.93(2) | 108.59(6) | 108.05(2) |
| O–Be–O | × 2 | 112.67(3) | 112.01(5) | 113.43(6) | 112.46(4) | 112.88(9) | 111.76(4) | 113.12(3) | 112.25(4) | 110.55(4) | 111.24(9) | 112.35(3) |
| <O–Be–O>[6] | 109.49 | 109.48 | 109.50 | 109.48 | 109.49 | 109.48 | 109.49 | 109.48 | 109.47 | 109.47 | 109.48 | |
| Si–O | × 4 | 1.6292(6) | 1.6295(7) | 1.6312(9) | 1.6320(6) | 1.627(2) | 1.6263(8) | 1.6259(5) | 1.6285(7) | 1.6185(7) | 1.628(2) | 1.6260(6) |
| O–Si–O | × 4 | 107.86(2) | 108.21(2) | 107.49(3) | 108.00(2) | 107.75(4) | 108.32(2) | 107.57(2) | 108.07(2) | 108.81(2) | 108.60(5) | 108.00(2) |
| O–Si–O | × 2 | 112.75(3) | 112.03(4) | 113.52(6) | 112.46(4) | 112.97(9) | 111.80(4) | 113.34(3) | 112.30(4) | 110.80(4) | 111.23(9) | 112.46(3) |
| <O–Si–O>[6] | 109.49 | 109.48 | 109.50 | 109.49 | 109.49 | 109.48 | 109.50 | 109.48 | 109.48 | 109.48 | 109.49 | |
| Be–O–Si | × 1 | 127.95(3) | 128.07(4) | 127.32(5) | 127.21(3) | 128.03(9) | 127.86(4) | 126.55(3) | 127.17(5) | 127.27(4) | 127.79(9) | 126.84(3) |
| M–O | × 3 | 2.0766(5) | 2.0767(7) | 2.0561(9) | 2.0572(6) | 2.0692(9) | 2.0655(6) | 2.0452(6) | 2.0565(9) | 2.0583(9) | 2.061(2) | 2.0470(5) |
| M–S | × 1 | 2.4349(3) | 2.4352(4) | 2.4507(5) | 2.4299(3) | 2.4486(9) | 2.4333(3) | 2.4131(4) | 2.4191(9) | 2.3971(9) | 2.438(3) | 2.4150(3) |
| <M–O/S>[4] | 2.1662 | 2.1663 | 2.1548 | 2.1504 | 2.1641 | 2.1575 | 2.1372 | 2.1472 | 2.1430 | 2.1551 | 2.1390 | |
| O–M–O | × 3 | 102.24(2) | 102.62(3) | 102.55(3) | 102.64(2) | 102.57(6) | 102.95(2) | 102.10(2) | 102.54(5) | 102.94(4) | 103.44(10) | 102.57(2) |
| O–M–S | × 3 | 115.99(2) | 115.67(2) | 115.73(3) | 115.66(2) | 115.71(5) | 115.40(2) | 116.11(2) | 115.74(4) | 115.41(3) | 114.99(8) | 115.71(2) |
| <O–M–O/S>[6] | 109.11 | 109.15 | 109.14 | 109.15 | 109.14 | 109.17 | 109.10 | 109.14 | 109.17 | 109.22 | 109.14 | |
| ØBe (°) | 30.54 | 30.76 | 30.68 | 31.22 | 30.38 | 31.01 | 31.28 | 31.30 | 31.78 | 31.30 | 31.45 | |
| ØSi | 30.61 | 30.77 | 30.75 | 31.21 | 30.45 | 31.04 | 31.48 | 31.34 | 32.01 | 31.29 | 31.56 | |
| <ØBe/Si> | 30.57 | 30.76 | 30.71 | 31.22 | 30.42 | 31.02 | 31.38 | 31.32 | 31.89 | 31.29 | 31.51 | |
| Sample Number | 7a | 7b | 7c | 8 | 9 | 10 | 11 | 12 | 13a | 13b | ||
| Be–O | × 4 | 1.6250(9) | 1.6297(5) | 1.6301(9) | 1.6329(5) | 1.6324(6) | 1.6289(5) | 1.6331(4) | 1.6252(4) | 1.6215(7) | 1.6277(7) | |
| O–Be–O | × 4 | 108.04(4) | 108.02(2) | 108.07(5) | 107.89(1) | 107.89(2) | 107.92(2) | 108.08(1) | 108.18(1) | 108.18(2) | 108.26(2) | |
| O–Be–O | × 2 | 112.38(8) | 112.41(4) | 112.30(9) | 112.68(3) | 112.69(3) | 112.63(3) | 112.29(2) | 112.09(3) | 112.08(4) | 111.93(4) | |
| <O–Be–O>[6] | 109.49 | 109.49 | 109.48 | 109.49 | 109.49 | 109.49 | 109.48 | 109.48 | 109.48 | 109.48 | ||
| Si–O | × 4 | 1.6306(9) | 1.6264(6) | 1.6295(9) | 1.6274(5) | 1.6271(6) | 1.6273(5) | 1.6235(4) | 1.6339(5) | 1.6316(8) | 1.6250(7) | |
| O–Si–O | × 4 | 108.09(3) | 107.99(2) | 108.07(5) | 107.84(1) | 107.84(2) | 107.90(2) | 107.99(1) | 108.27(1) | 108.28(2) | 108.23(2) | |
| O–Si–O | × 2 | 112.27(7) | 112.47(3) | 112.31(9) | 112.79(3) | 112.80(3) | 112.66(3) | 112.49(2) | 111.91(3) | 111.88(4) | 111.98(4) | |
| <O–Si–O>[6] | 109.48 | 109.49 | 109.48 | 109.49 | 109.49 | 109.49 | 109.49 | 109.48 | 109.48 | 109.48 | ||
| Be–O–Si | × 1 | 126.96(7) | 126.72(3) | 125.84(9) | 126.60(3) | 126.37(3) | 126.33(3) | 126.03(2) | 125.04(2) | 124.13(4) | 123.90(4) | |
| M–O | × 3 | 2.0451(9) | 2.0435(5) | 2.021(2) | 2.0410(4) | 2.0350(5) | 2.0338(5) | 2.0281(3) | 2.0073(4) | 1.9869(6) | 1.9818(6) | |
| M–S | × 1 | 2.4226(7) | 2.4109(3) | 2.408(2) | 2.4186(2) | 2.4145(3) | 2.4073(2) | 2.3993(2) | 2.3831(2) | 2.3538(3) | 2.3484(3) | |
| <M–O/S>[4] | 2.1395 | 2.1353 | 2.1180 | 2.1354 | 2.1299 | 2.1272 | 2.1209 | 2.1013 | 2.0786 | 2.0735 | ||
| O–M–O | × 3 | 102.83(4) | 102.54(2) | 102.98(8) | 102.58(2) | 102.61(2) | 102.55(2) | 102.63(1) | 102.92(2) | 102.74(2) | 102.75(2) | |
| O–M–S | × 3 | 115.50(4) | 115.74(2) | 115.37(7) | 115.71(1) | 115.68(2) | 115.73(1) | 115.67(1) | 115.42(1) | 115.57(2) | 115.57(2) | |
| <O–M–O/S>[6] | 109.17 | 109.14 | 109.18 | 109.14 | 109.15 | 109.14 | 109.15 | 109.17 | 109.16 | 109.16 | ||
| ØBe (°) | 31.50 | 31.55 | 32.27 | 31.50 | 31.67 | 31.76 | 32.02 | 33.06 | 33.74 | 33.80 | ||
| ØSi | 31.40 | 31.61 | 32.28 | 31.59 | 31.76 | 31.79 | 32.19 | 32.90 | 33.55 | 33.85 | ||
| <ØBe/Si> | 31.45 | 31.58 | 32.28 | 31.54 | 31.71 | 31.78 | 32.11 | 32.98 | 33.64 | 33.82 |
Publisher’s Note: MDPI stays neutral with regard to jurisdictional claims in published maps and institutional affiliations. |
© 2021 by the author. Licensee MDPI, Basel, Switzerland. This article is an open access article distributed under the terms and conditions of the Creative Commons Attribution (CC BY) license (http://creativecommons.org/licenses/by/4.0/).
Share and Cite
MDPI and ACS Style
Antao, S.M. Linear Structural Trends and Multi-Phase Intergrowths in Helvine-Group Minerals, (Zn,Fe,Mn)8[Be6Si6O24]S2. Minerals 2021, 11, 325. https://0-doi-org.brum.beds.ac.uk/10.3390/min11030325
AMA Style
Antao SM. Linear Structural Trends and Multi-Phase Intergrowths in Helvine-Group Minerals, (Zn,Fe,Mn)8[Be6Si6O24]S2. Minerals. 2021; 11(3):325. https://0-doi-org.brum.beds.ac.uk/10.3390/min11030325
Chicago/Turabian StyleAntao, Sytle M. 2021. "Linear Structural Trends and Multi-Phase Intergrowths in Helvine-Group Minerals, (Zn,Fe,Mn)8[Be6Si6O24]S2" Minerals 11, no. 3: 325. https://0-doi-org.brum.beds.ac.uk/10.3390/min11030325
Note that from the first issue of 2016, this journal uses article numbers instead of page numbers. See further details here.