
Prediction of Postflotation Tailings Behavior in a Large Storage Facility


Department of Construction and Geoengineering, Poznań University of Life Sciences, Wojska Polskiego 28, 60-637 Poznań, Poland
Minerals 2021, 11(4), 362; https://0-doi-org.brum.beds.ac.uk/10.3390/min11040362
Submission received: 3 March 2021
/
Revised: 24 March 2021
/
Accepted: 28 March 2021
/
Published: 30 March 2021
(This article belongs to the Special Issue Innovative Strategies for Solid Waste Minimisation in the Mining and Minerals Industry)
Abstract
:Extracting and copper production on a large scale generates large volumes of postflotation mine tailings. The scale of operation and development of tailings storage facilities (TSFs) forces the use of innovative solutions enabling safe storage now and in the future. Any changes to the operation require multi-directional monitoring of the impact of these changes on storage safety. The ongoing exploitation will be ensured by expansion of the TSF and a change in tailings storage technology. This approach will preclude the need for changes to the new location, such as changes of land use, and will minimise the volume of mine waste. The paper presents the results of pilot studies carried out to implement the change in postflotation tailings storage technology at Żelazny Most TSF (Poland) in the future. The aim of the paper was settlements prediction of tailings and comparison of deformations with observed settlements. Settlements prediction of tailings was made on the basis of the results of the DMT (Marchetti Dilatometer Test), recommended for the prediction of natural soil settlement. Depending on the analysed zone of the TSF, settlements ranged from a few centimetres to over 1.5 m. Despite the difference shown, the results of DMT and geodetic measurements indicate a convergent trend of settlement.
1. Introduction
The tailings storage facility (TSF) is one of the key links in the production of copper concentrate, without which manufacturing raw material would be impossible. The issues of the currently exploited TSF are extensive and complicated, from engineering problems and challenges, through economic to environmental and social aspects [1,2,3,4]. In Poland, since 1977, there has been only one storage facility for tailings from copper ore flotation for all three active mines of KGHM Polska Miedź SA (Polish Copper). The feature of such a large tailings storage facility, which enables comprehensive waste management, is the low efficiency of utilizing the facility’s capacity in relation to the amount of deposited waste, which currently accounts for about 95% of the excavated mining waste. The reason for the unfavourable balance is the low density of the material deposited in the form of sludge, ranging from 1.11 and 1.15 Mg/m3. Further deposition with such large discharges of waste will lead to exhaustion of the operational possibilities of the storage facility. One of the solutions to this problem may be the construction of another tailings storage facility. Another more rational solution seems to be the implementation of a more effective method of depositing waste, e.g., pre-thickened paste. A third approach combining the two previous solutions can also be considered. As far as this solution is concerned, the simultaneous expansion of the existing storage facility and change in the technology used for depositing postflotation tailings would exclude the need to build another facility in a new location. This would also increase the operational capability of the currently used facility and would extend its operation time. However, the implementation of the third solution requires prior assessment of the suitability of the deposited tailings as a subsoil on which higher density waste (paste) will be stored. Such an analysis is indispensable in predicting the behaviour of the massif of tailings loaded with paste and can be additionally used to assess the overall stability of the entire tailings storage facility.
An experimental embankment was built in order to determine the real reaction of the subsoil made of tailings to the additional load. However, due to the fact that the storage facility is an earth structure, which is diverse and spatially variable in terms of grain size and physical and mechanical properties, the settlement process in these conditions depends on many local factors. In order to learn about the impact of these factors, a number of studies and observations of loaded tailings were carried out as part of a three-year monitoring. Geotechnical monitoring consisted of a series of in situ tests and laboratory tests of extracted tailings samples, among others Marchetti Dilatometer Tests (DMTs), cone penetration tests (CPTUs), and field vane tests (FVTs). Measurements of real displacements covered by geodetic monitoring were also carried out throughout the observation three-year period.
Many researchers and world experts attempted to predict natural soil settlement based on the results of CPTUs and DMTs, indicating both the advantages and disadvantages of these tests [5]. Predicting the settlement of natural soil on the basis of CPTUs is well recognized and widely used [6,7,8,9,10,11,12,13,14,15,16]. In order to estimate the settlement of natural soil based on CPTUs, a constrained modulus MCPTU needs to be determined [11,17,18,19,20,21,22,23]. The research conducted by Robertson et al. [24] proves that the estimation of MCPTU only on the basis of the cone resistance value may be inaccurate and even burdened with a large error, especially in the case of pre-consolidated soils. The collapse mechanism under the cone, resulting in large soil deformations during the test, poorly corresponds to MCPTU. According to Jamiolkowski et al. [25], it is impossible to estimate the exact value of MCPTU only on the basis of cone resistance without knowing the stress history. The selection of a reliable empirical factor α, a parameter necessary to calculate MCPTU based on the cone resistance [26], may also pose a difficulty. Due to the abovementioned limitations, CPTU results should be calibrated based on the results of laboratory tests or other in situ tests [27]. Greater accuracy of estimated settlements in relation to the possibilities offered by CPTU can be obtained from the DMT [28,29]. The advantage of the DMT over CPTU that is commonly emphasized in the literature is its advantage in assessing soil deformation parameters [30]. This is due to the test conditions, where in the CPTU the measurement performed with the cone is related to the bearing capacity of the subsoil, while in the DMT, the dilatometer measurement is related to the subsoil deformability. Available research results from many authors clearly indicate that the DMT is meaningful and reliable in estimating natural soil settlement [31,32,33,34,35,36,37,38,39,40,41,42,43,44,45,46,47,48,49,50]. In order to estimate natural soil settlement based on DMT, the constrained modulus MDMT needs to be determined. The authors of [35] recommend the estimation of settlements based on DMT in accordance with the classic uniaxial deformation method, analogously to the CPTU method. According to Marchetti [34], the results of settlements estimated using the 1-D elasticity formula do not significantly differ from the results estimated with the 3-D formula (triaxial deformations) and differences do not exceed 10%. From an engineering point of view, the 1-D model seems less problematic and more practical in this situation (e.g., it does not require the knowledge of Poisson’s ratio ). Determining and comparing settlements predicted with DMT with real observations (geodetic measurements), possibly with the results of tests other than DMT, was implemented by many authors. The high compatibility of the settlements predicted by DMT with the observed settlements for natural soils of different grain sizes was confirmed by [32,51]. The authors of [33,52] also recommend a procedure for estimating settlements based on DMT results. According to Monaco et al. [46], the Marchetti flat dilatometer is currently the most practical device for settlements prediction.
In terms of the purpose of the work indicating the possibility of continuing to exploit the TSF without having to build a new facility while not making changes to the new location (e.g., land use and land management change), the aims of the present research were settlements prediction (1) of tailings loaded with an experimental embankment using DMT, used for settlements prediction of natural soils; determination of observed settlements (2) based on the results of geodetic measurements; and, additionally, comparison of (3) predicted and observed settlements of tailings. In addition, the validity of using the DMT recommended for testing natural soils for general trend estimation of tailings settlement was confirmed.
2. Materials and Methods
2.1. Study Site
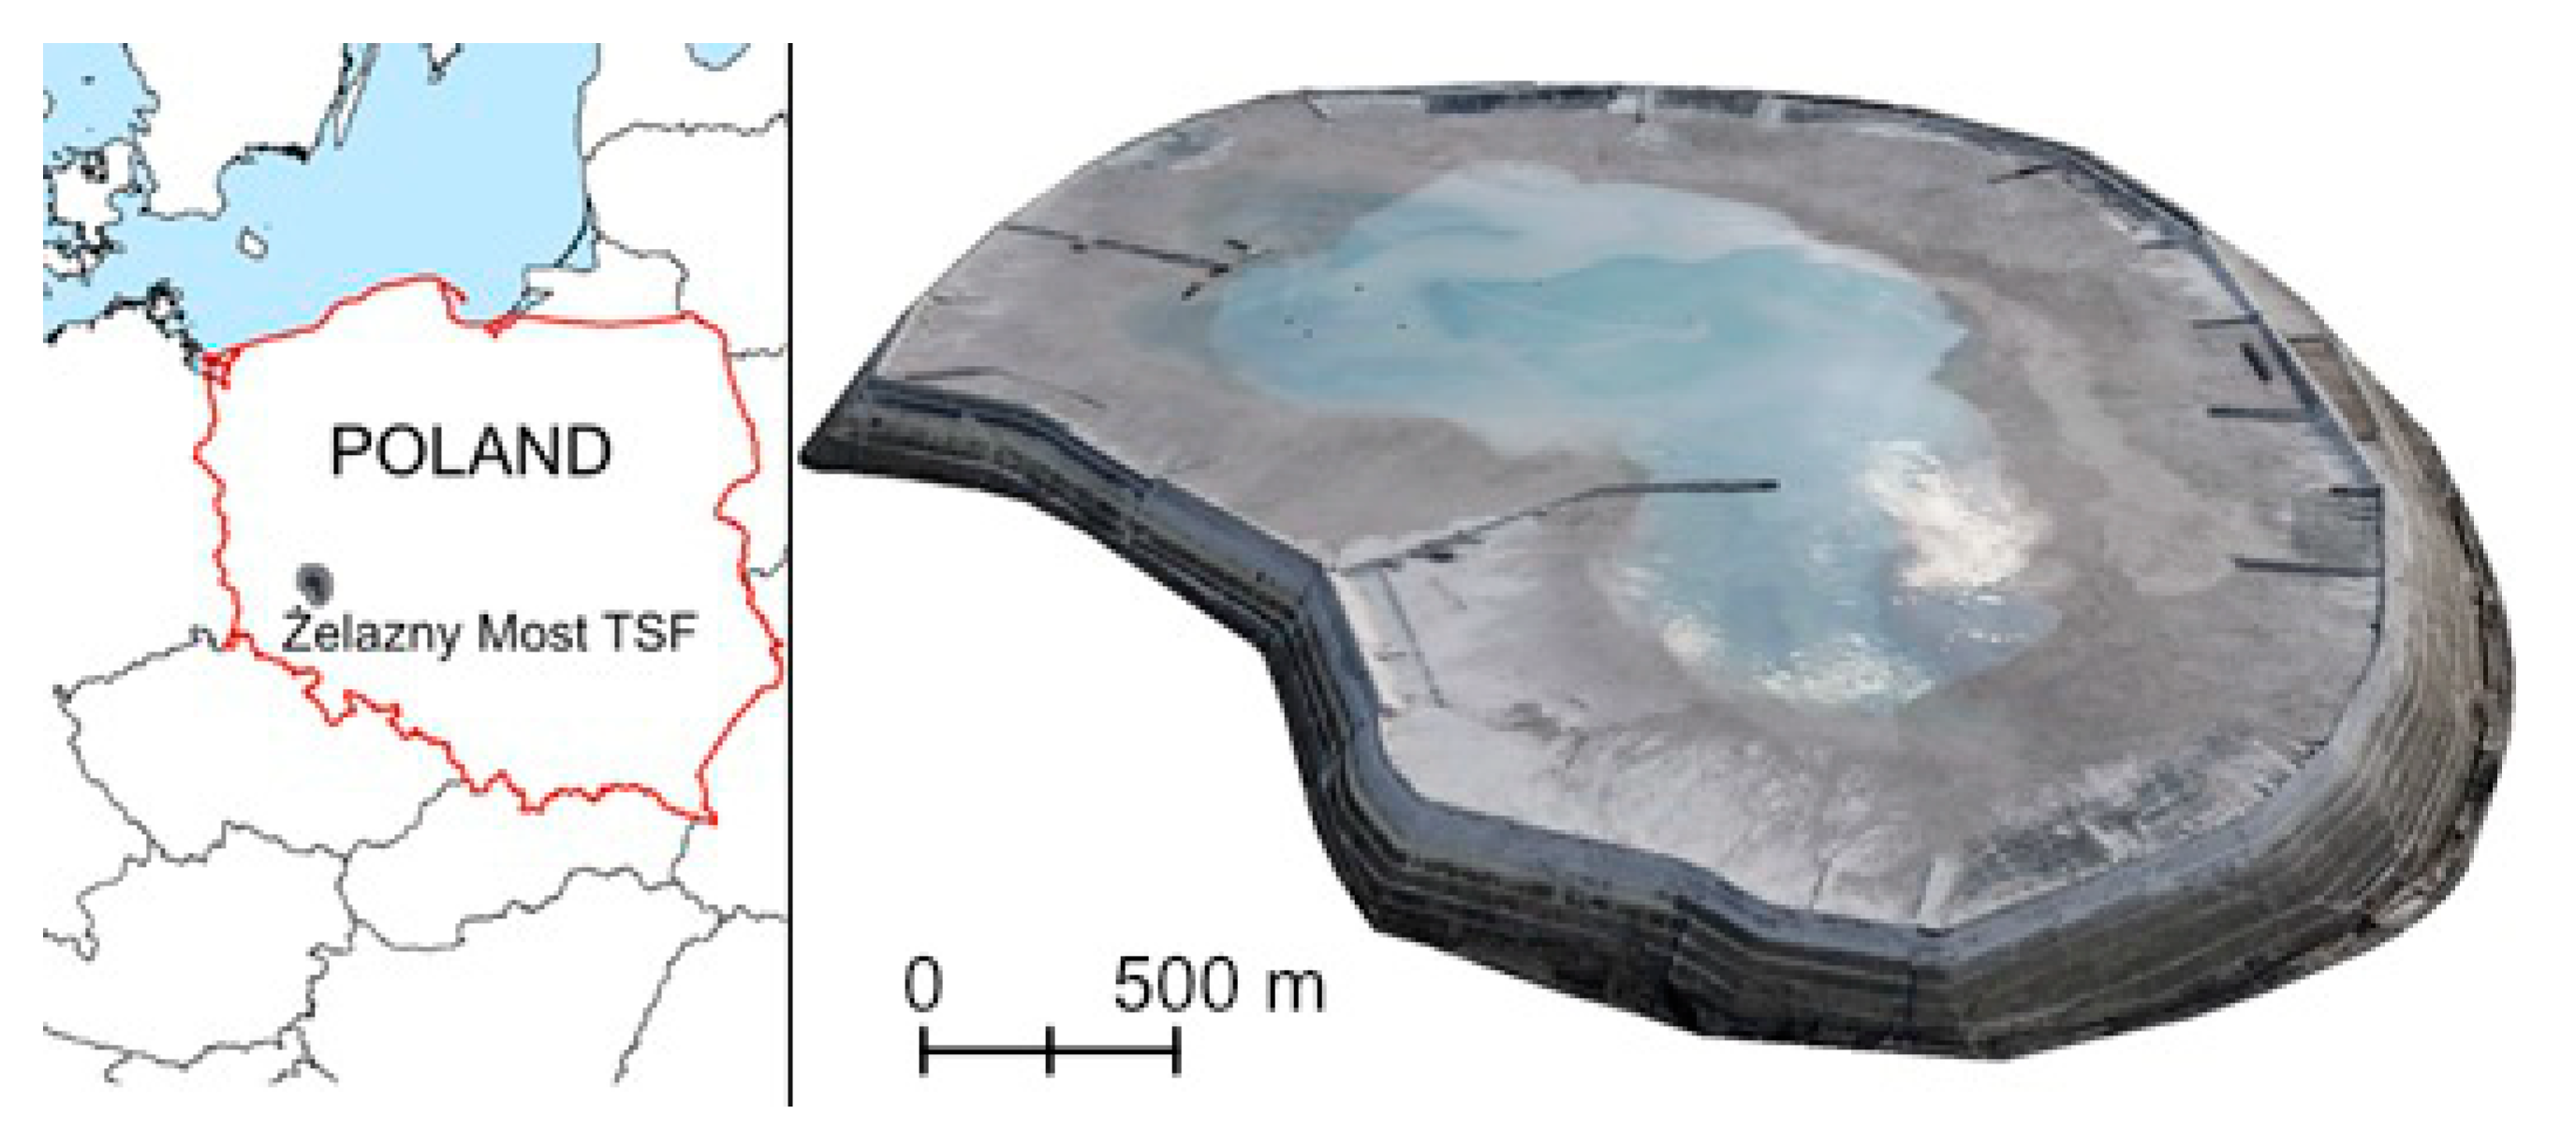
KGHM Polska Miedź SA is the main domestic copper manufacturer in Poland. During over 50 years of operation, over 18 million tons of copper were produced from extracted rock output, with a mass of 1 billion tons. Based on the estimated recognition of the deposit resources, copper ore can be exploited for the next 30 years. For annual production of approximately 2 million tons of concentrate with an average content of 23% of copper, from 4% to 6% of the extracted mining mass is utilised. The remaining 94–96% are postflotation tailings that require safe management. An important problem arising from such a significant scale of production of the raw materials, whose average content is 1.52% of copper in the deposits exploited in Poland, is the management of huge masses of postflotation tailings. These tailings are generated as a result of the following operations and processes: sifting, grinding, classification, flotation, densification, filtration, and drying. As a result of flotation, about 25 million Mg of waste is transported by the hydraulic method to the storage facility each year and it is rising. At present, the only active receiver of all postflotation tailings from Legnica-Głogów Copper District is Żelazny Most Tailings Storage Facility (Figure 1).
The storage facility is located in the Lower Silesia Voivodeship, the south-western part of Poland; a natural land depression in the south-eastern part of the Dalkowskie Hills, which is part of the Trzebnickie Hills, was used for its positioning. This depression is in the form of a natural kettle hole surrounded by frontal moraine-dammed hills of the Riss glaciation [4]. Żelazny Most TSF is an earth above-ground hydrotechnical construction, currently the largest in Europe and second largest in the world [2,53]. The construction of TSF took place between 1974 and 1977. Since the commissioning on 12 February 1977, the storage facility has been subjected to continuous and simultaneous operation and expansion, because of which it is described as “atypical” [3]. Superstructuring of the facility’s dams is carried out with the upstream method. The facility’s extension module is 2.5 m, which results in an average annual increase in dam height of about 1.3 m [54]. For the continuous superstructuring of dams surrounding the facility, waste of the coarse grains, previously deposited within the so-called beaches, is used. Due to favourable strength and filtration characteristics, meeting the criteria of grain size and ultimately density, sandy postflotation tailings is a full-fledged building material in this place [55,56]. TSF is currently in the process of forming dams up to 190 m above sea level, which results in the possibility of storing postflotation tailings of a volume of 780 million m3. At the current stage of TSF expansion, one of the important factors limiting its further development in the technology implemented so far is the complex geological structure of the natural subsoil of the facility. The superstructure of the existing dams to the crown’s ordinate of 195 m above sea level along with the extension of the facility by an additional effective area, the so-called “Southern Section” with an area of over 600 ha, would allow for the deposit of 950 million m3 of postflotation tailings. In the long run, this provides the possibility of storing tailings until 2037. Operation of the facility after expansion can be continued using the existing deposition method (“wet deposition”) or the mixed method. The latter combines the wet deposition method with the method of depositing tailings densified to the consistency of paste. The application of the paste deposition method requires the design and construction of technical infrastructure for densifying tailings. The parallel method may be to collect dehydrated and pre-thickened tailings in a natural way that was previously deposited inside the storage facility. For the first time, an industrial depositing method was used at the Kidd Creek mine in Canada in 1973, although research had already been carried out earlier [57,58]. This method can definitely compete with the currently used method of depositing in Żelazny Most TSF. The implementation of a new method of depositing tailings masses of higher density than before on a highly deformable subsoil must be preceded by a series of tests and observations of the behaviour of TSF under the influence of an additional load.
2.2. Experimental Embankment Characteristics
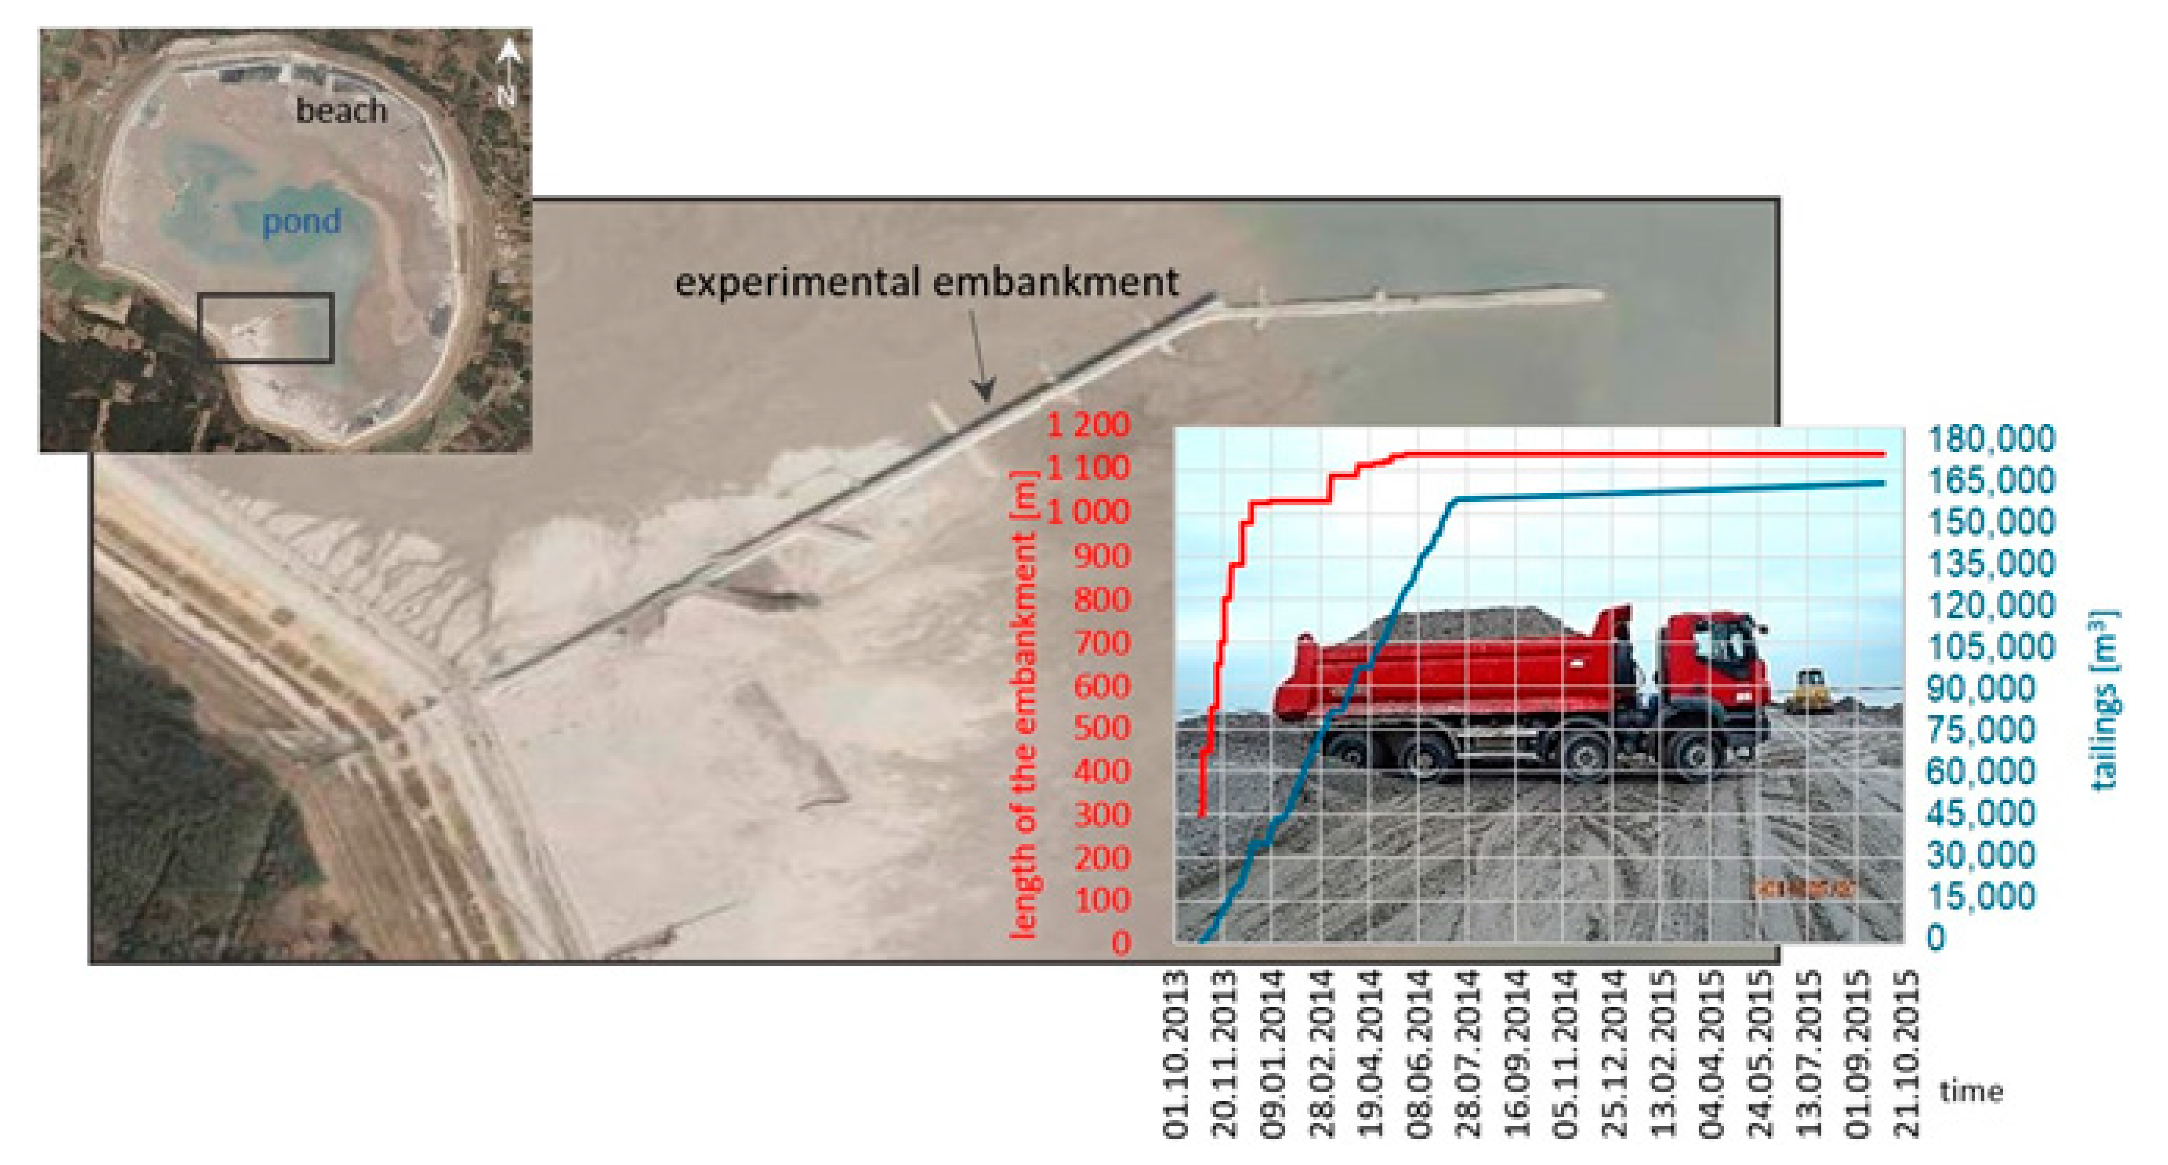
Different conditions for depositing tailings in Żelazny Most TSF result in a spatially variable bearing capacity of tailings. The overall prognosis of the subsoil response to the additional load required the construction of a real loading structure. The experimental embankment was formed in the southern part of the Żelazny Most TSF (Figure 2). The construction began at the beginning of 2013 and continued with intervals until June 2014.
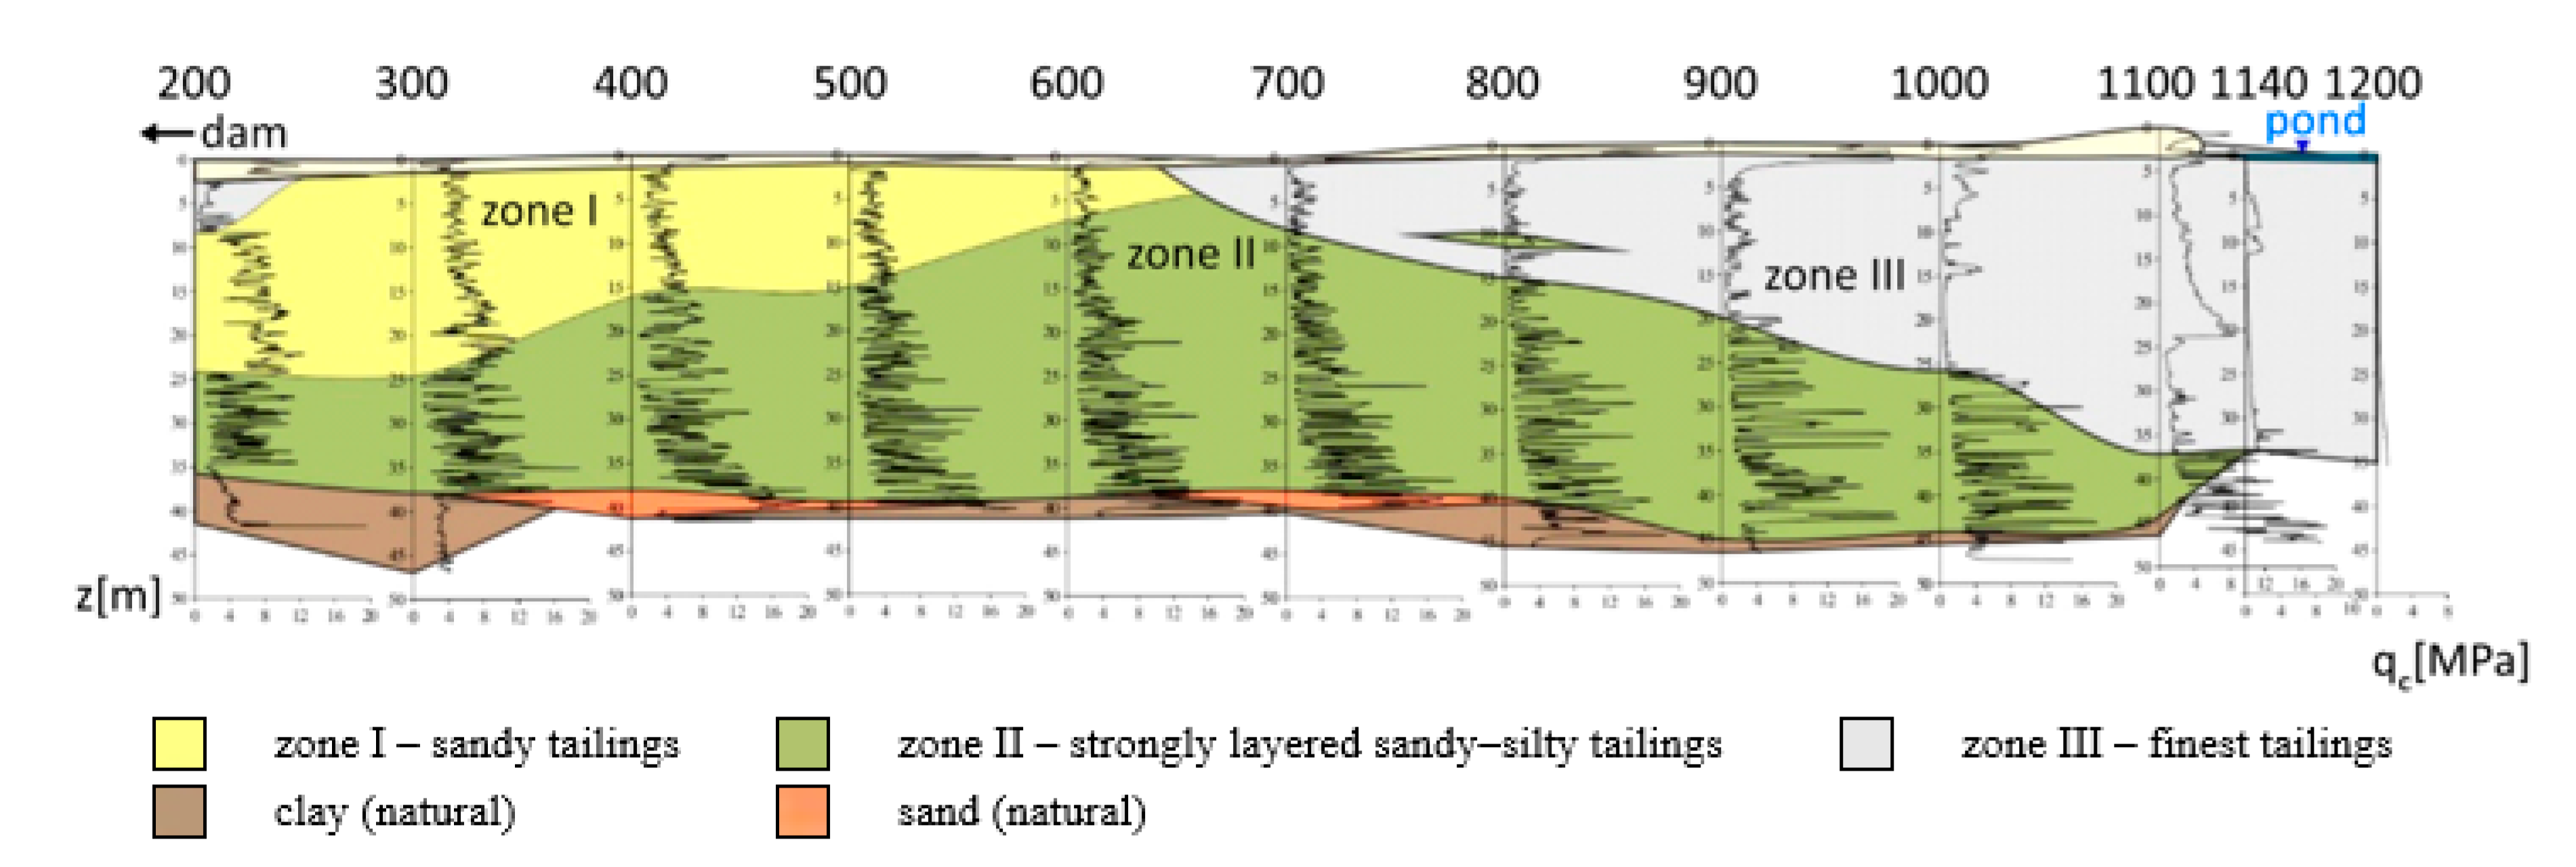
About 165,000 m3 of building material were used to build the embankment. This material was selected out of postflotation tailings, generally of sandy grain size, previously deposited on the beach of the storage facility. The tailings were delivered to the construction site by road. The embankment was formed in the direction from its top part forward. The embankment, with a total length of 1140 m and a crest width of 15 m, was formed in a direction perpendicular to the axis of the facility’s dam, which resulted in part of the embankment being constructed on the beach, and part within the pond, which is located in the central part of the facility (Figure 2). Analysis of Figure 2 shows that about 35,000 m3 of waste were used to build a 1000-m-long fragment of the embankment, whereas disproportionally more waste, i.e., c. 130,000 m3, was used to build the final 140-m-long fragment. The result of such a location was extremely variable foundation conditions and the varying bearing capacity of the embankment subsoil. Due to the location, the subsoil of the embankment was divided into 3 zones according to the scheme shown in Table 1 and in Figure 3.
2.3. Data Collection
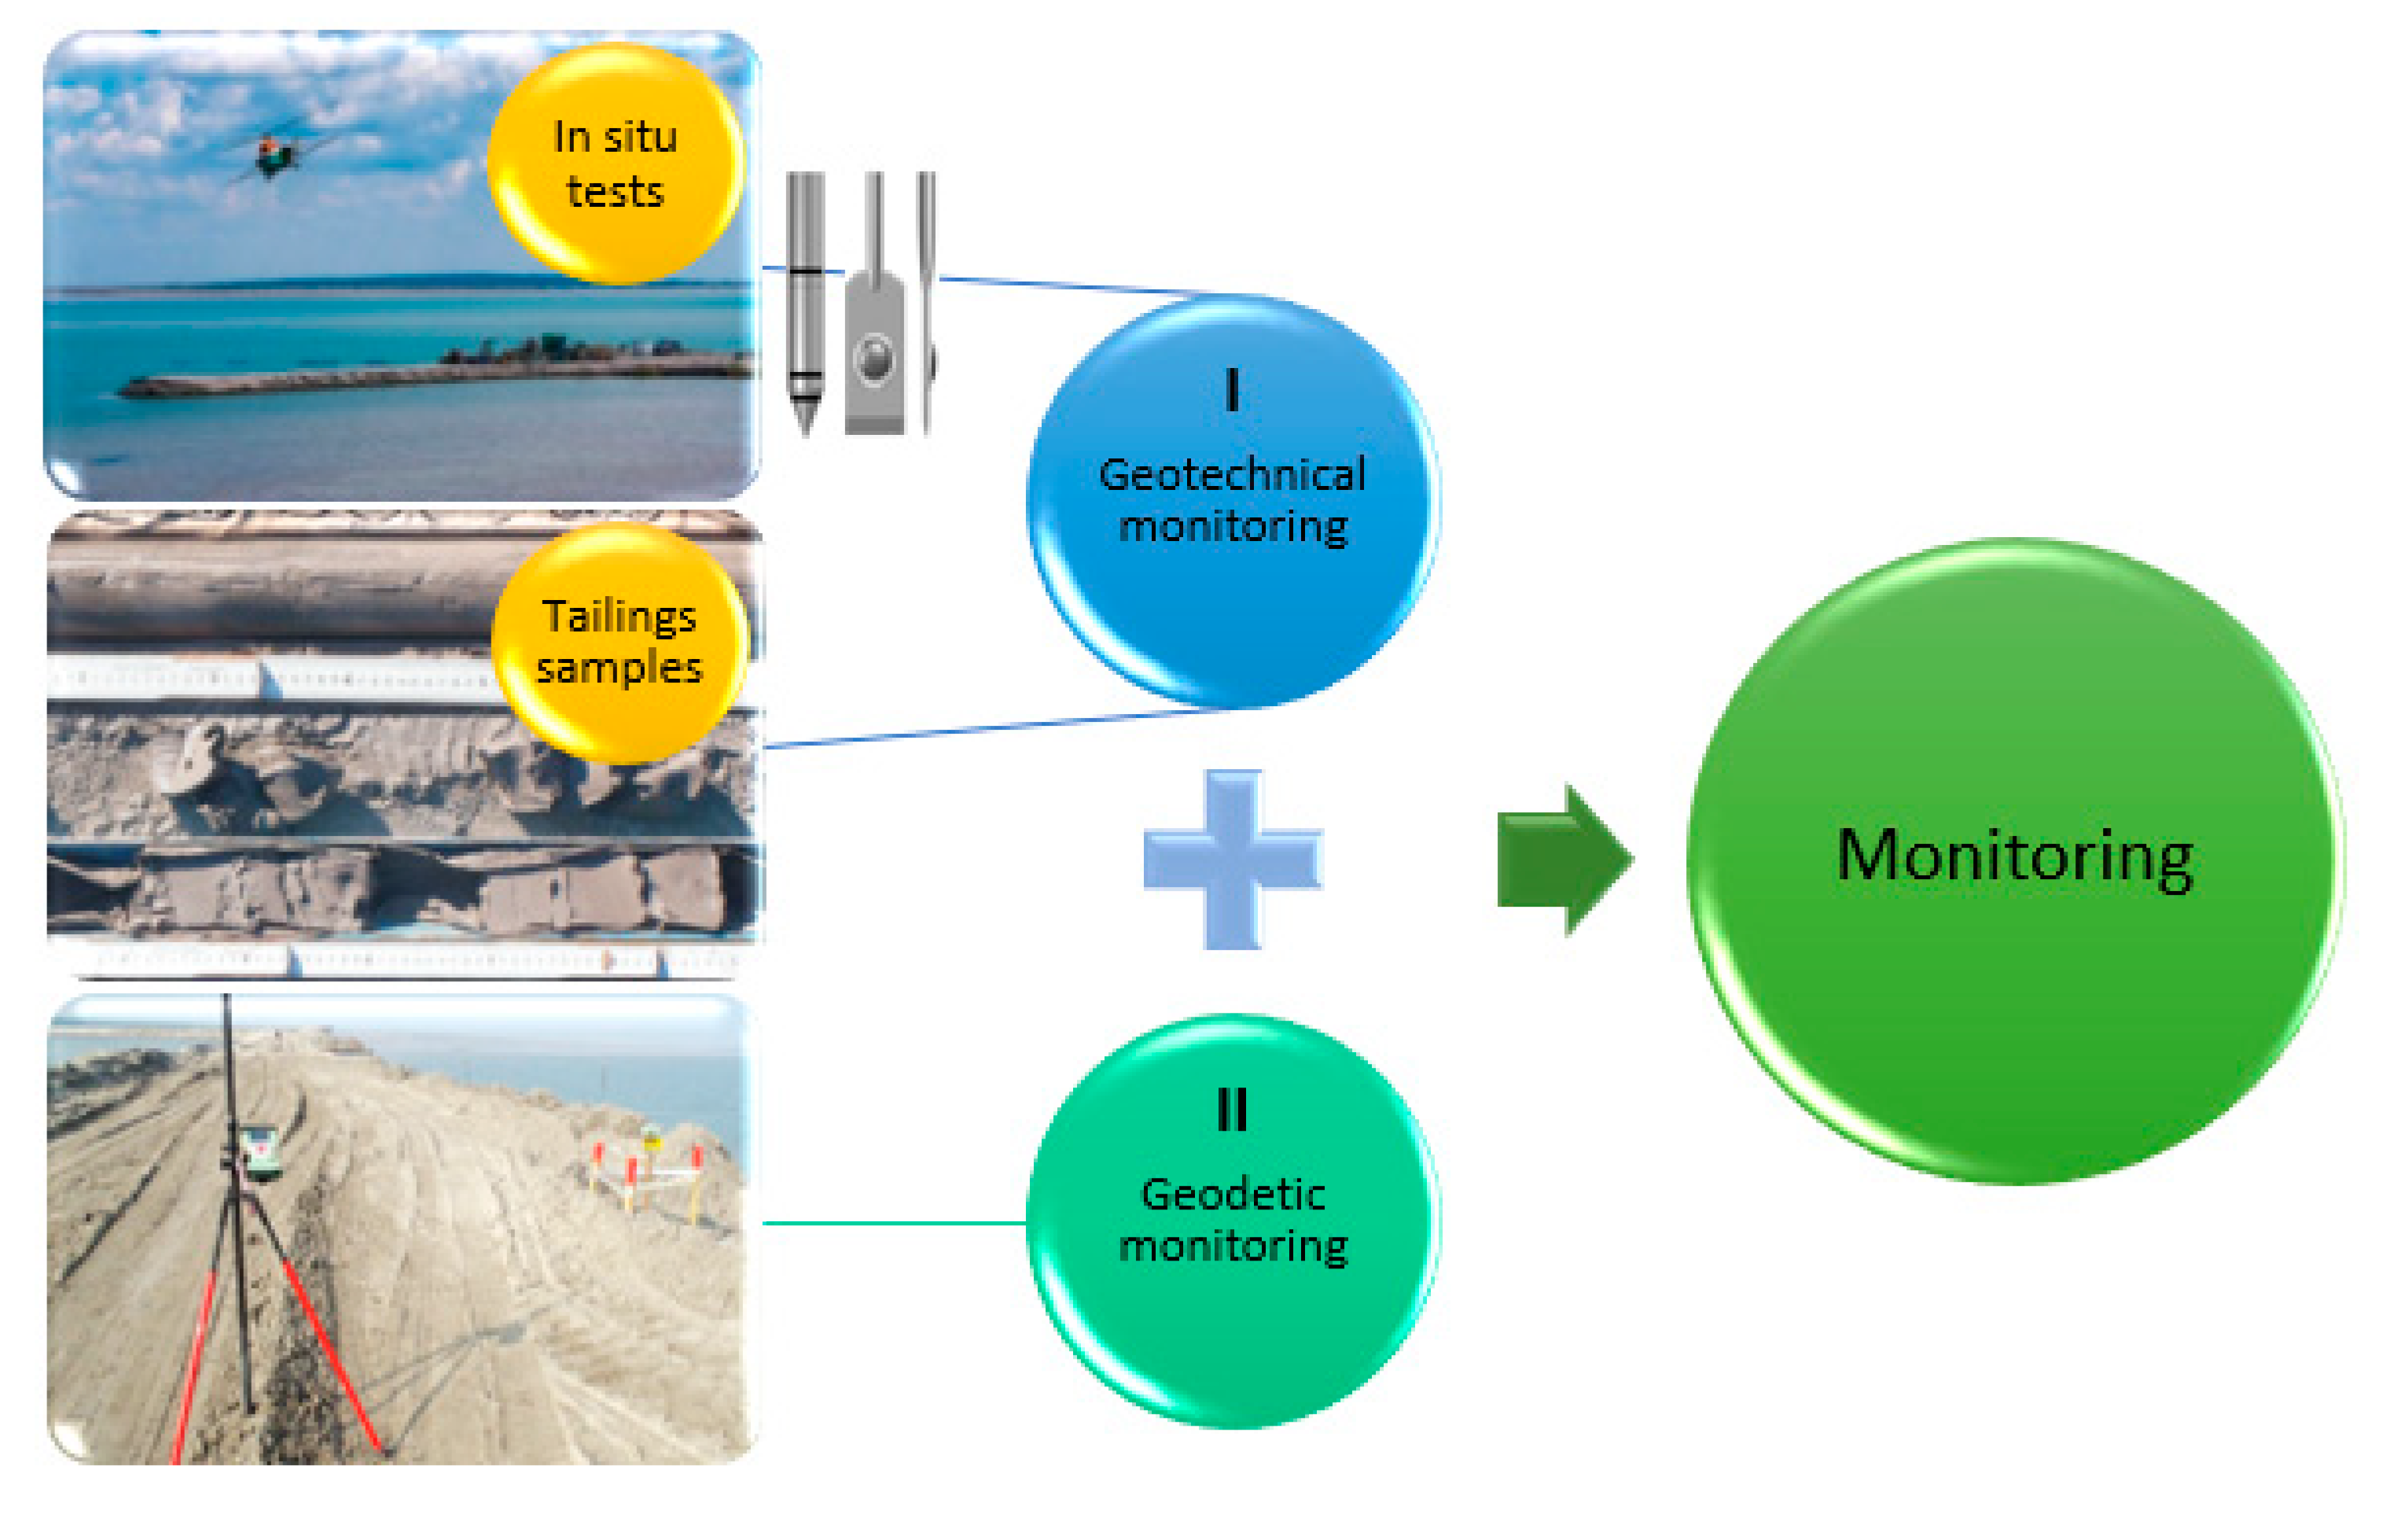
Research and observations carried out as part of the monitoring were divided into two groups (Figure 4). In situ tests included in the geotechnical monitoring (I) and geodetic monitoring (II) of real displacements of the subsoil loaded with an embankment were carried out at selected test points. Simultaneously, samples of tailings were taken for laboratory testing.
I Geotechnical monitoring—DMT
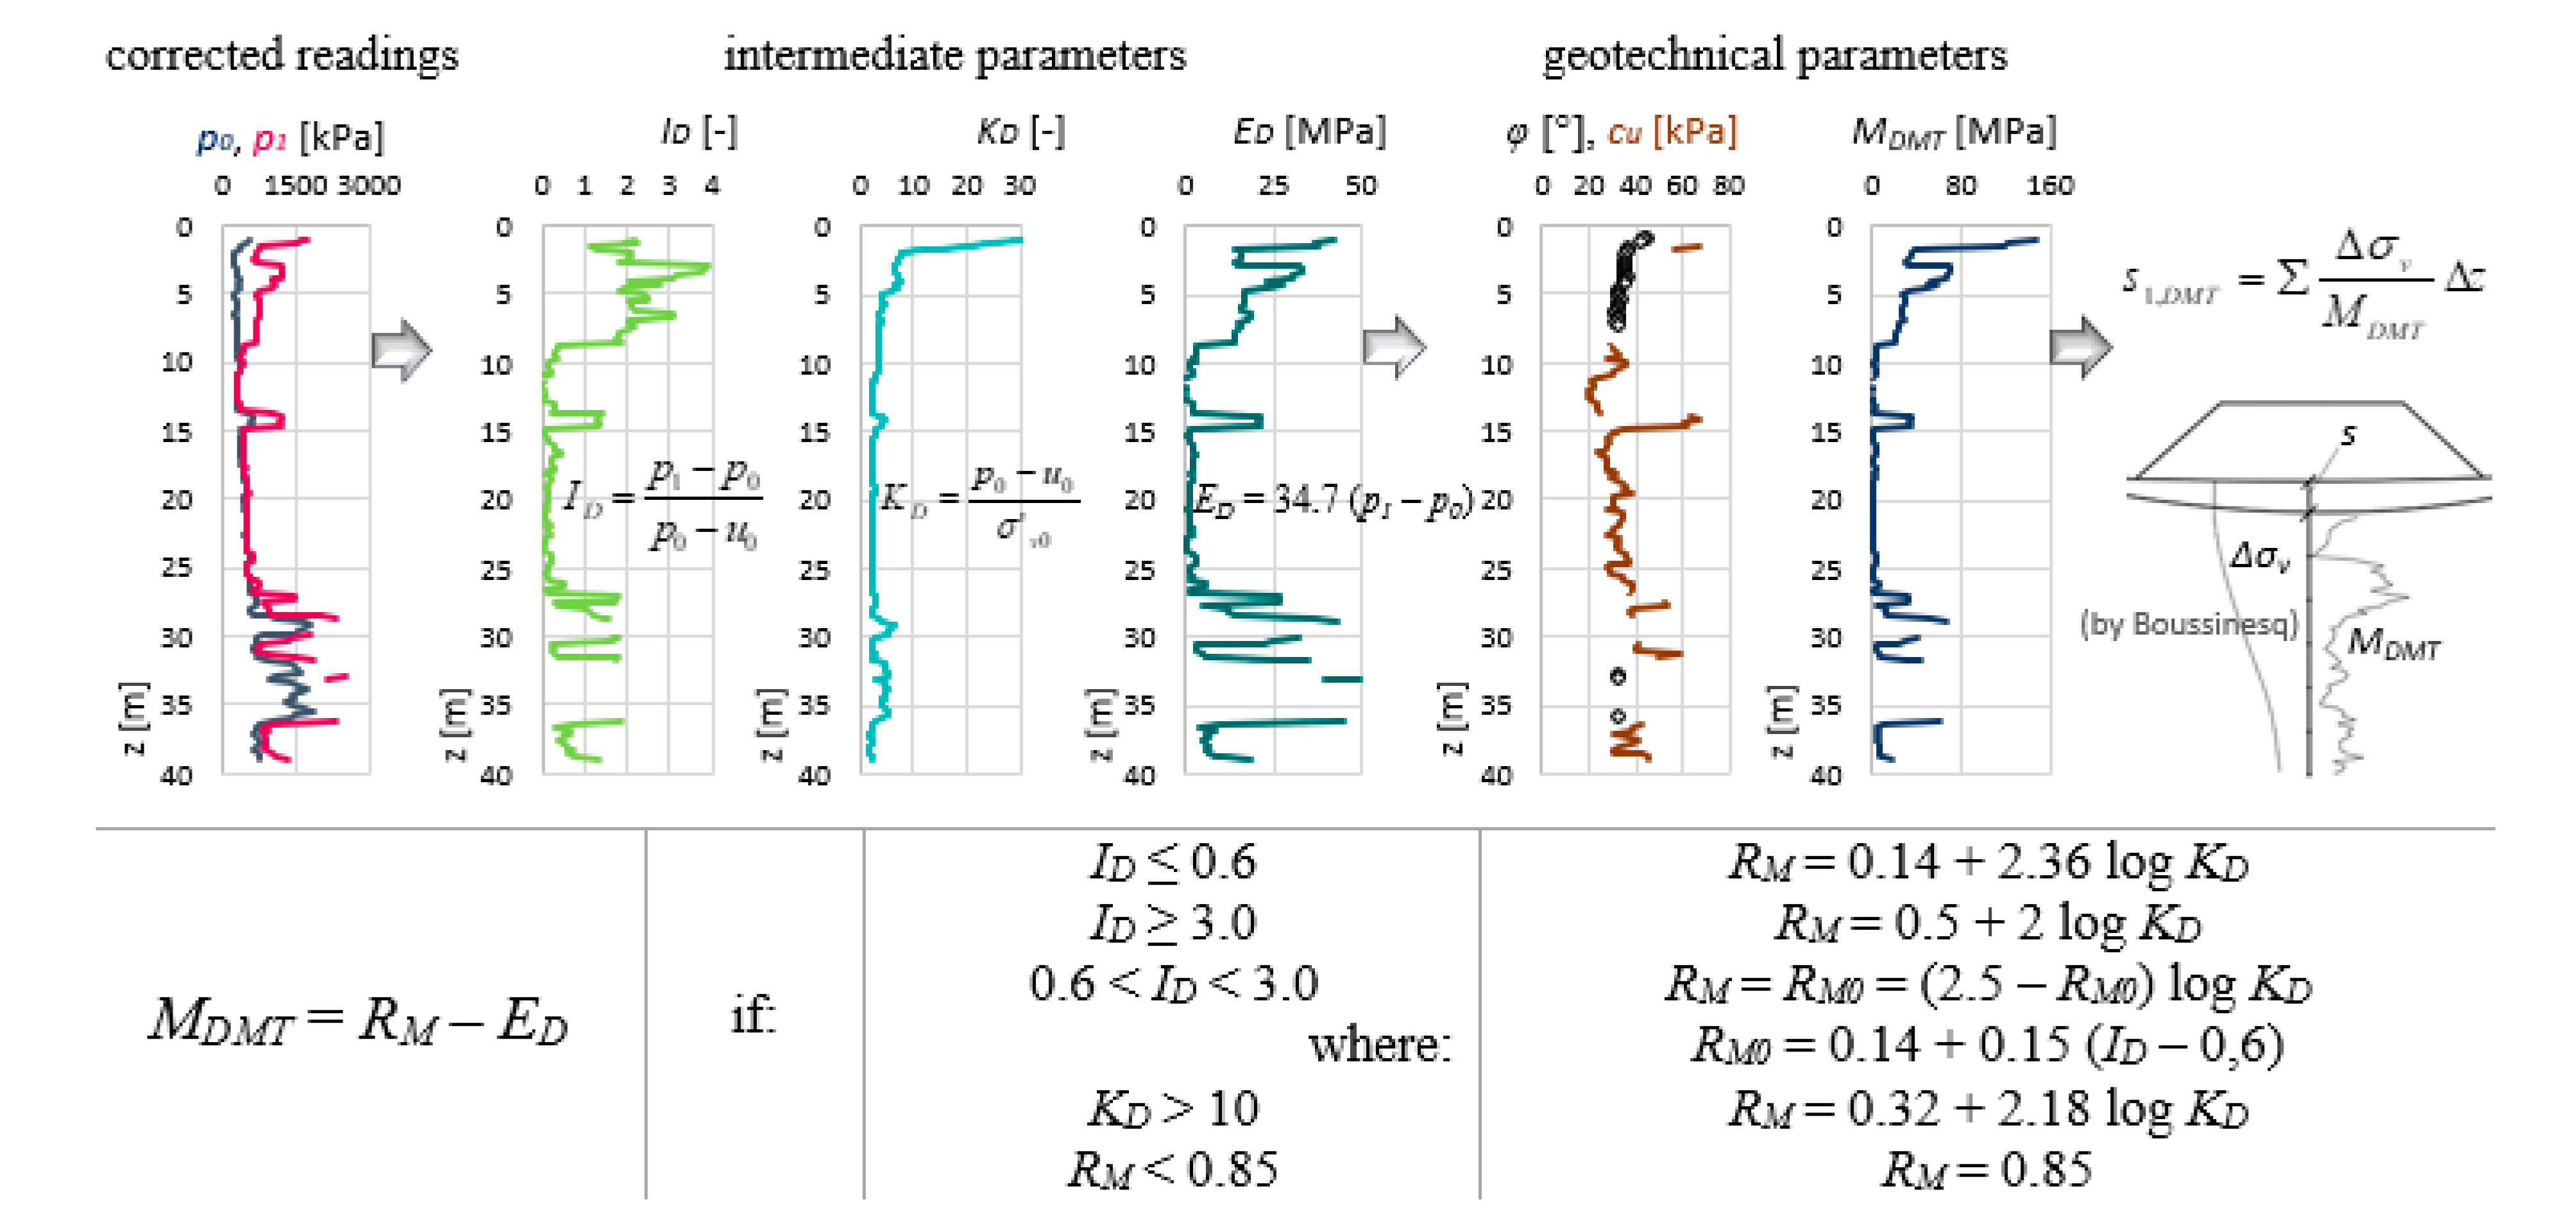
The DMTs [60] included in the first group of tests were carried out both at the embankment crest and at a floating platform. Depending on the location of the test point, the penetration depth ranged between 12 and 42 m. DMT tests were carried out in accordance with the test standard in which two characteristic pressures, ∆A and ∆B, are determined with a frequency of 20 cm every 20-cm increase in the penetration depth. According to Marchetti [36], external pressure ∆A and internal pressure ∆B are used to correct the A and B readings (positions of the dilatometer membrane) into corrected readings, the corrected first reading p0 and corrected second reading p1. In the next step, intermediate parameters are determined, the material index ID, horizontal stress index KD, and Dilatometer modulus ED. Then, intermediate parameters are converted by means of commonly used correlations to geotechnical parameters, e.g., constrained modulus MDMT, cohesion cu, and friction angle φ (Figure 5). M and cu are generally the most useful and accurate parameters by DMT [61,62]. According to Marchetti [36], predicting settlements of shallow foundations is probably the number one application of the DMT. This statement applies in particular to sands where undisturbed samples cannot be retrieved. Based on MDMT, settlements of the tailings loaded with an embankment were estimated. Settlements were calculated by means of the one-dimensional formula (s1,DMT) according to the diagram shown in Figure 5. Settlements of postflotation tailings were calculated using DMT Settlements Software (v 1.0.1.16, Studio Prof. Marchetti, Rome, Italy). According to the description, the DMT Settlements Software computes the one-dimensional conventional settlements calculation below uniformly loaded surface areas of flexible loads using the DMT results. The software is designed to import from .uni files the constrained modulus of the soil and the vertical effective stress from the DMT. To perform a settlements calculation, the following input must be given: loaded area (defines the load in terms of weight and geometry), soil parameters (define the soil in terms of modulus and vertical effective stress), and calculation options (define specific parameters and criteria used in the calculation). Vertical stress increments are evaluated according to the Boussinesq theory of elasticity for homogeneous elastic half space.
II Geodetic monitoring
Observed settlements were determined on the basis of data obtained from geodetic monitoring (Figure 4). In order to carry out displacement measurements, a geodetic network was established. It consists of 62 control points installed both at the top and in the immediate vicinity of the embankment. Measurements were made using Global Navigation Satellite System (GNSS), in Real Time Kinematic (RTK) and Real Time Network (RTN) measurement modes using the ASG-EUPOS system. Control measurements were carried out every two weeks throughout the entire embankment construction period and for one year after its completion. In total, 1382 geodetic measurements were carried out.
3. Results
The results of the conducted DMT and geodetic measurements enabled assessment of the settlement of tailings. Two limitations were applied while selecting test points at which the settlements were examined. First, the analysis was restricted to the results of a section of 600 m, at which test points were located every 100 m. The analysis was performed for an embankment section from the point located 400 m away from the TSF dam to the point located 1000 m from the dam. Because of minor settlement values for the stiff sandy beach of the facility, the fragment located between the dam of the TSF, and a point located 400 m away from the dam were excluded. The second limitation applied to the selection of test points which would provide credible DMT results and geodetic measurements.
3.1. Predicted Tailings Settlements—DMT
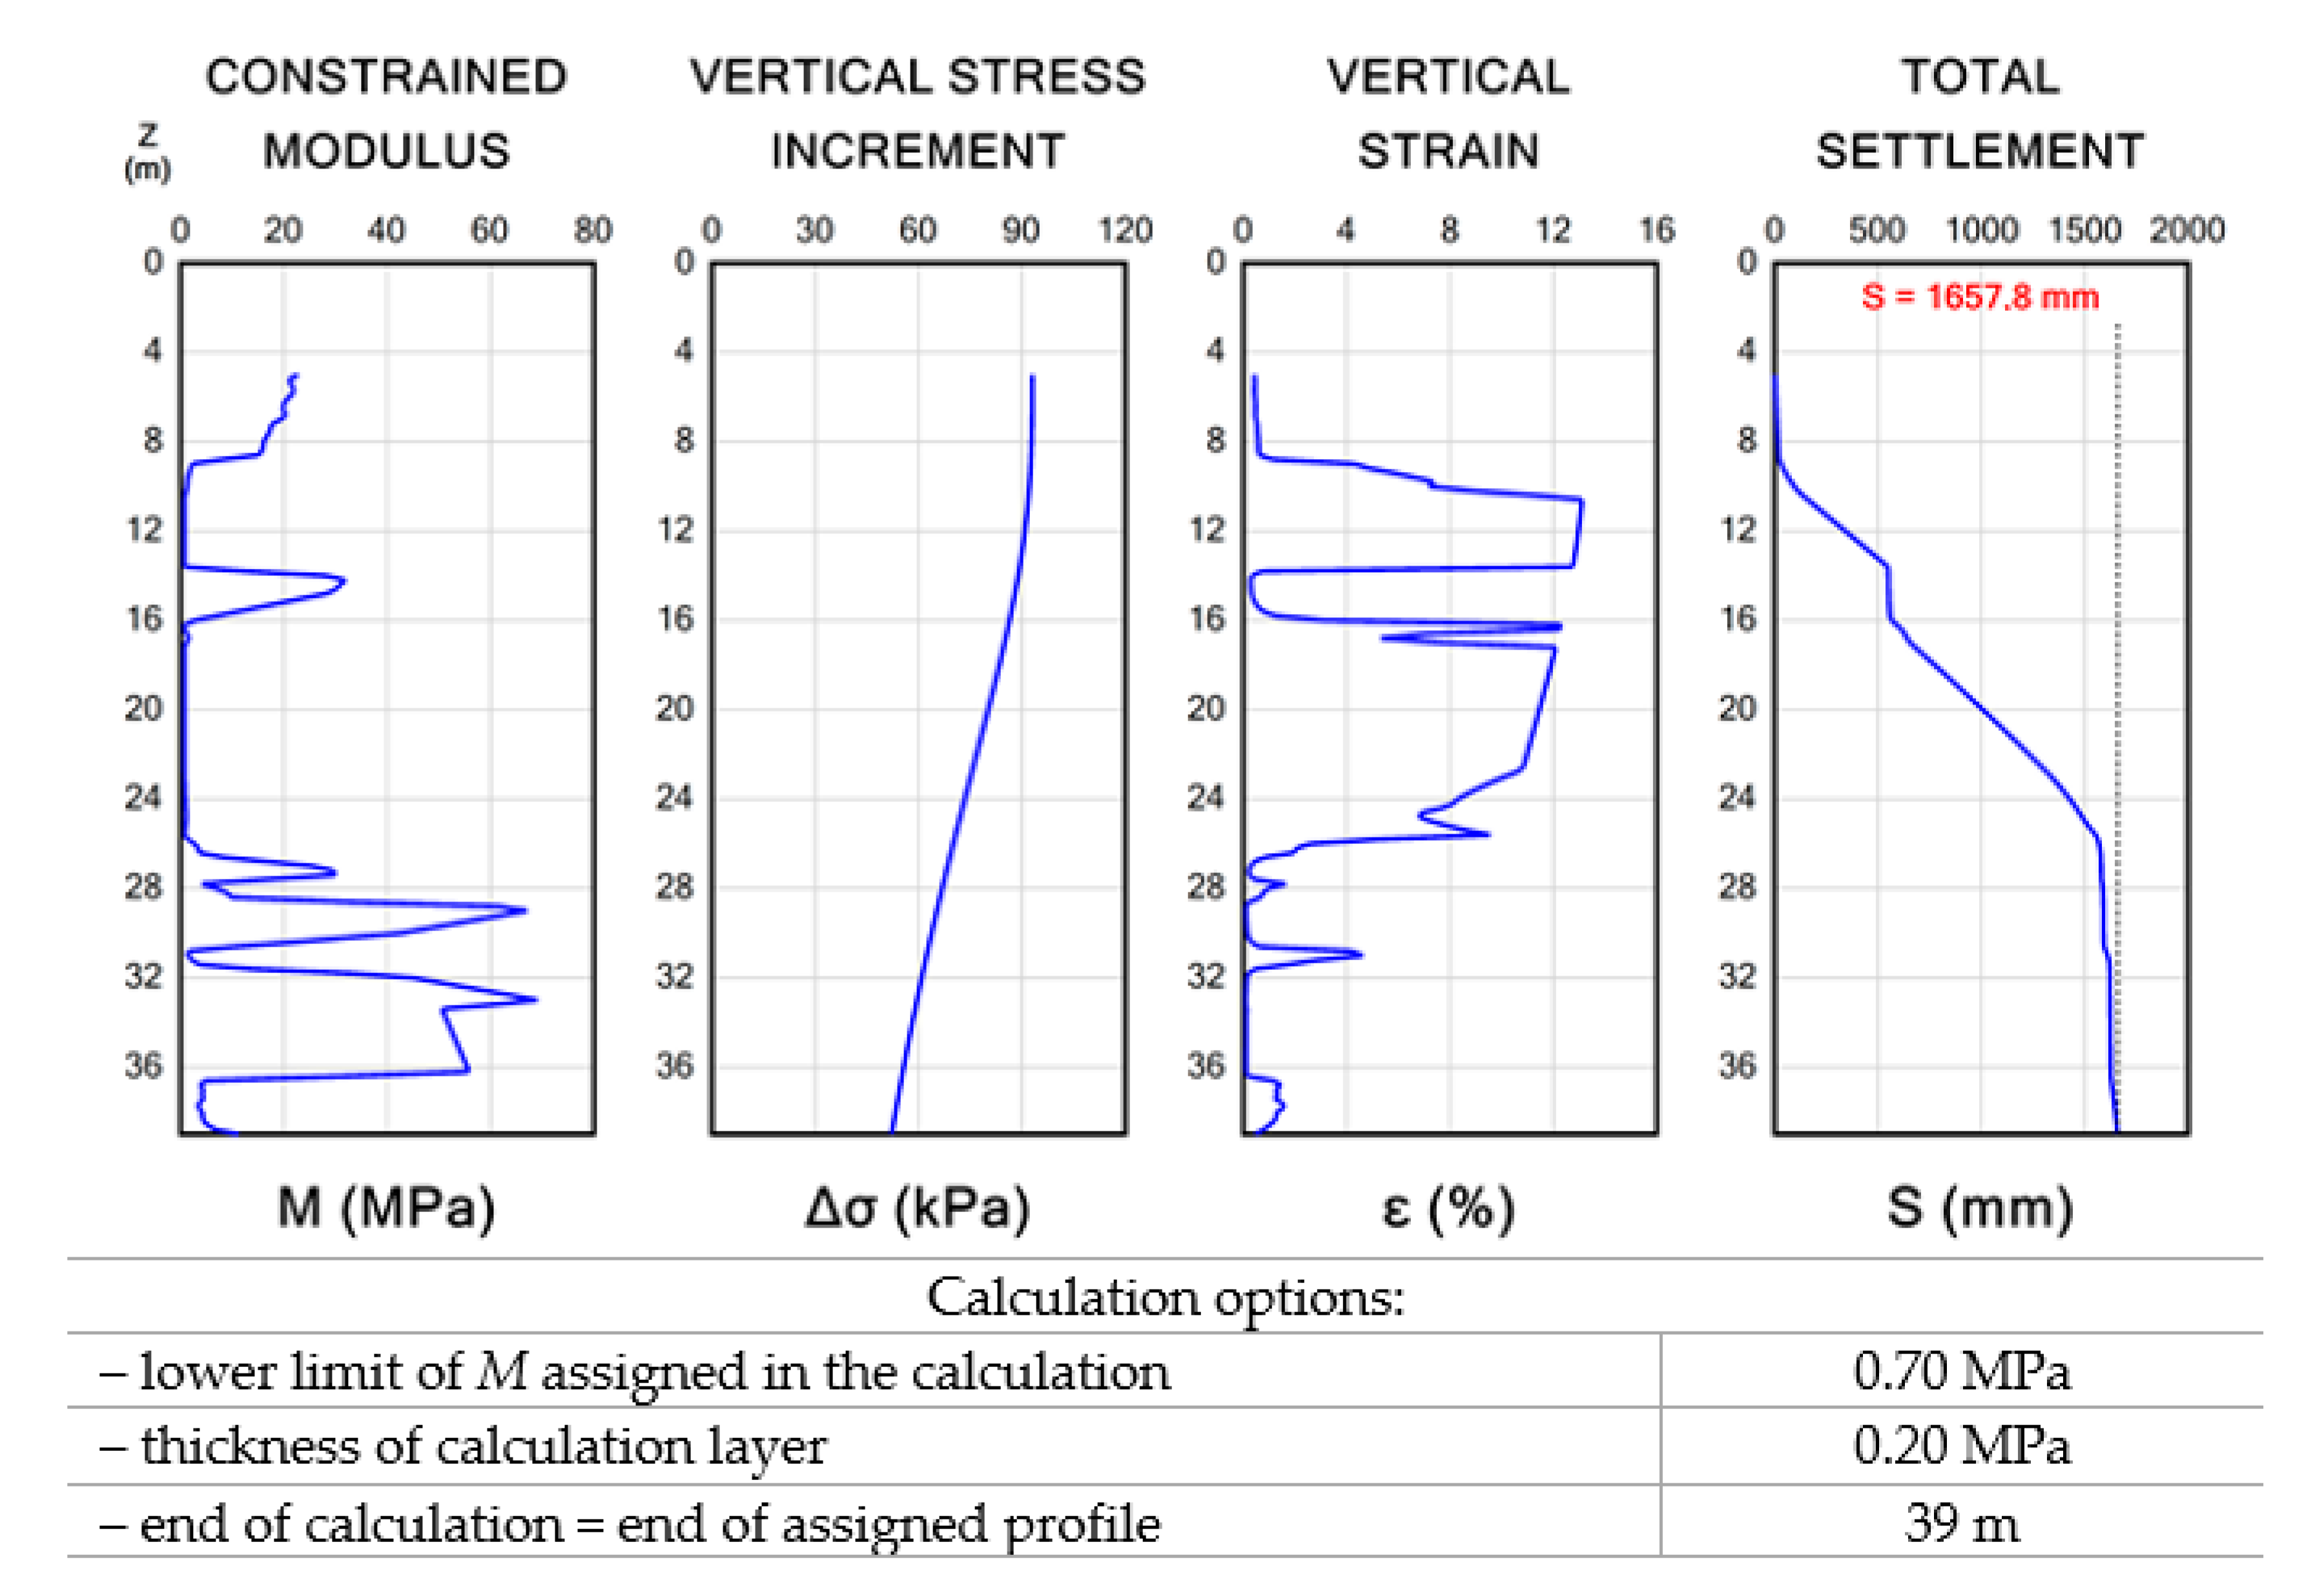
The calculated settlements are obtained using the interpretation formulae and the calculation method recommended in [45]. Cumulative settlement results are summarized in Table 2. The analysis of settlements calculation indicates that the smallest settlements are found in zone I (Table 1), where the embankment was placed on the sandy TSF beach. The settlement values in zone I are between 7.69 cm at 0+400 and 8.13 cm at point 0+500 (Table 2). At the point located 100 m away (0+600), the settlement values are already twice as large and exceed 16 cm (zone II in Table 1 and Table 2). At the next point from zone II (0+700), the settlement values are reduced, reaching 5.54 cm. Lower settlement values can be explained by the fact that the embankment height at point 0+700 was lower, which resulted in lower subsoil load than in adjacent points (Table 2). At three consecutive points (zone III), settlement values increased from 56.54 cm (0+800), through 62.81 cm (0+900), reaching the highest value of 165.78 cm at point 1000 m from the TSF dam (zone III in Table 1 and Table 2). At point 1+000, the largest settlement was to be expected due to the identification of a layer of very weak silty deposits, which build an unstable subsoil of the embankment at the bottom of the pond. Figure 6 shows the result sheet from the program DMT Settlements Software for the test point where the largest settlements were determined.
3.2. Observed Tailings Settlements—Geodetic Measurements
The results of the geodetic measurements enabled the determination of the actual settlement values of the loaded subsoil. The measurements at points analogous to the DMT were performed at the control points located in the embankment’s axis at its top. The same part of the 600-m-long embankment was analysed starting from a point located 400 m from the TSF dam. Cumulative settlement results are summarized in Table 3. Observed settlements in zone I (Table 3) reach values from 21.60 cm (0+500) to 30.03 cm (0+400). At the first point of zone II (0+600), the settlement value is exactly the same as in the first test point in zone I (0+400). At the second point (0+700), a decrease in the settlement value to 19.70 cm is noted. At subsequent research points (zone III), settlement values regularly increase with the distance from the TSF dam towards the pond. At a point 800 m away from the TSF dam, the settlements reach a value almost double that of the previous point, amounting to 37.51 cm, while at 0+900 they exceed 0.5 m. The highest settlement values were observed at the last analysed point: the measurement value was almost twice as high as at the previous point and equalled 92.25 cm (Table 3).
3.3. The Comparison of the Predicted and Observed Settlements of Tailings
Based on the analysis of the results, it was found that settlements, both predicted by DMT and observed (geodetic measurements), in overall terms, progressively increase as they move away from the beach towards the centre of the storage facility where the pond is located. Because of the central location of the pond, which is in the zone more susceptible to deformation of the subsoil (zone III), settlements in this place reach the highest values, which are several times higher than in zone I and II (Table 4).
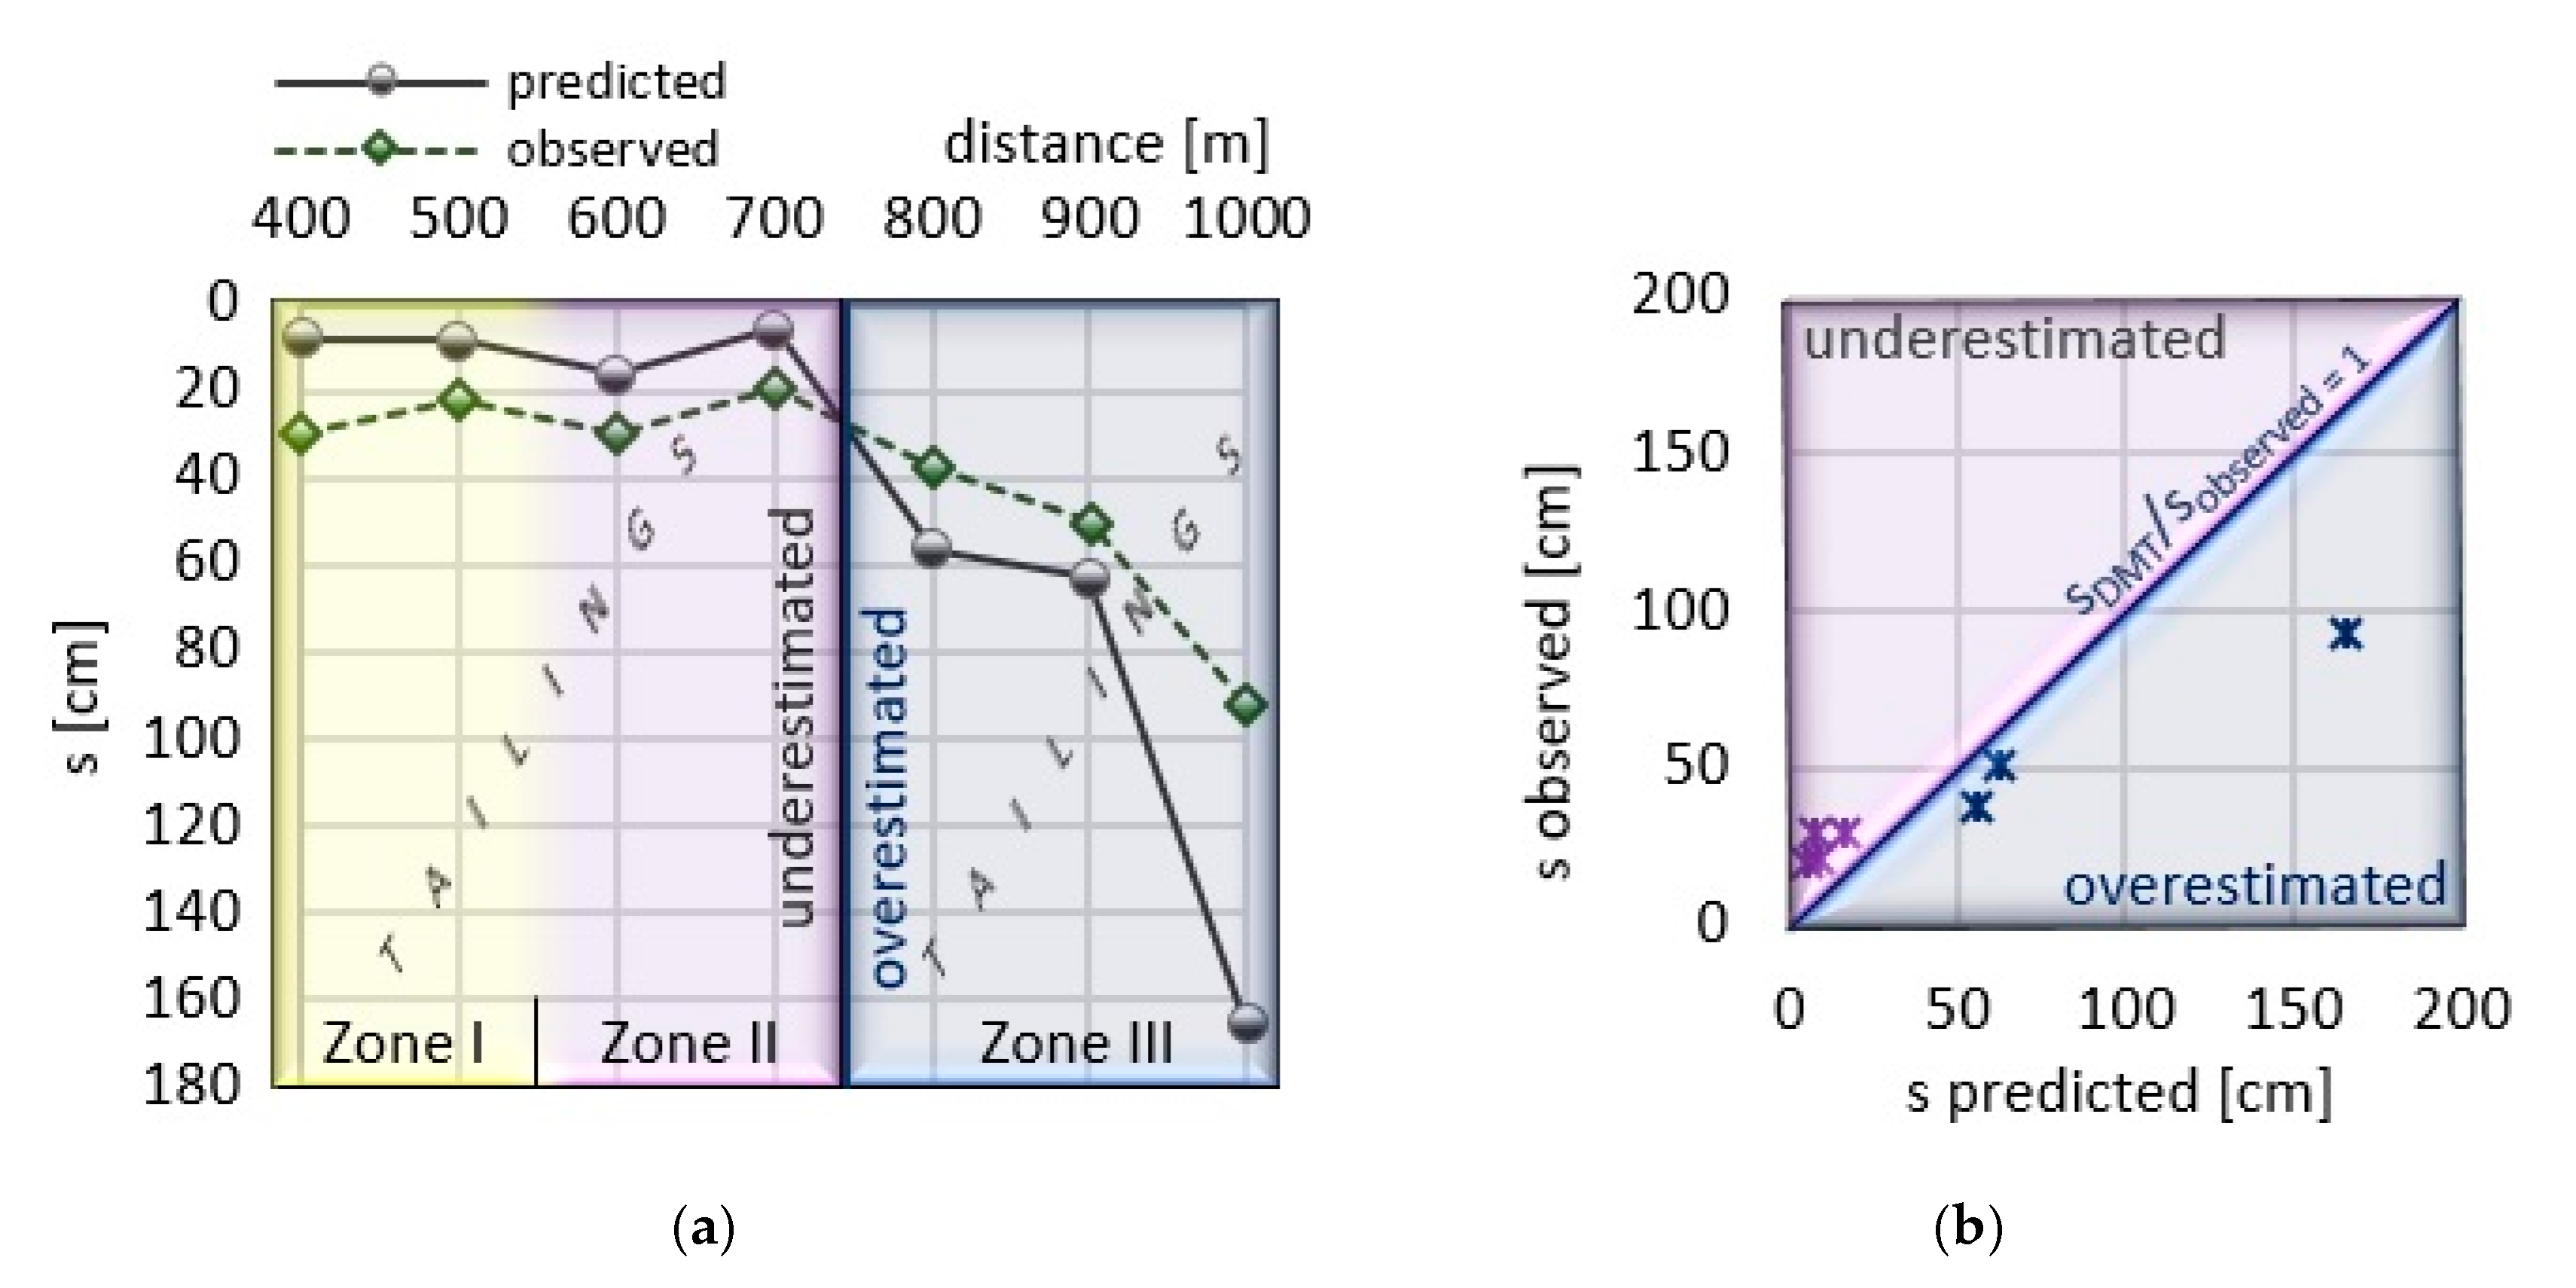
When analysing settlements divided into individual zones, it should be stated that predicted and observed settlements differ in each of these zones. With definitely different means of the predicted and observed settlements in zone I, respectively 7.91 cm and 25.82 cm, settlement ratios (sDMT/sobserved) equalled 0.26 and 0.38 (Table 4). A slightly greater settlement compliance was demonstrated in zone II, as the average settlements predicted by DMT are 10.80 cm, while the average observed settlements is 24.87 cm, while at 0+600 predicted settlements were twice smaller than the observed settlements, sDMT/sobserved = 0.53 (Table 4). In the next point in zone II (0+700), predicted settlements were 5.54 cm with four times the observed settlements, sDMT/sobserved = 0.28. The lower settlement value at test point 0+700, which was explained in 3.1, locally contradicts the overall trend of an increase in the settlement value towards the pond. Although the settlements determined using both methods differ significantly, it can be seen that the lower settlement values at a point 700 m away from the TSF dam were obtained both on the basis of the results of DMT and geodetic measurements. This fact confirms that a lower load (smaller embankment height) had a direct impact on the lower settlement value at point 0+700. At the next three test points (zone III), both predicted and observed settlements increase in line with the overall trend (Table 4, Figure 7a). At point 0+800, the settlement ratio is 1.5, which is also the average value of this ratio for the entire zone III. The settlement ratio at the 0+900 test point equals 1.25. This value indicates the highest convergence in the value of settlements obtained by the two methods considered. At the last test point (1+000) sDMT/sobserved is already 1.80. The main impact on the average settlements in zone III of 95.04 cm (predicted) and 59.95 cm (observed) was due to the large discrepancy of results at the last analysed point 1+000, where predicted settlements amounted to 165.78 cm, while observed equalled 92.25 cm. At this point, tailings are characterized by the largest anisotropy resulting from the cyclic spigotting of postflotation sediments migrating to the pond, where the accumulation of postflotation sediments of the finest grain structure is increased. In addition, it should be noted that 30 m further from the last analysed test point, the observed settlements were already 156.63 cm, i.e., comparable to the predicted settlements (165.78 cm) at 1+000 (sDMT(1+030)/sobserved(1+1000) = 1.06). However, there is no direct possibility to compare the results due to the fact that the 1+030 point is an intermediate point where the DMT test was not performed. A comparison of the predicted and observed settlements and settlements agreement is shown in Figure 7.
4. Discussion
Unstructured postflotation tailings, after entering the facility, are subject to the deposition process. By analogy to the natural deposition process that occurs as a result of energy being lost by the stream carrying the hydrated material, postflotation sediments begin to freely sediment inside the storage facility. As a result of tailings particle sedimentation, postflotation sediments are formed. Close to the outlets of the spigotting pipes (beach = zone I) are the thickest particles, most often of sandy grain size, which potentially exhibit the properties of fine-grained non-cohesive soil. The further from the place of waste dumping, the more layered the sediment is, and individual layers are characterized by a smaller thickness. The volume of waste of finer grain size dominated by the silty fraction also increases. Particles with the finest grain size (silt and clay) migrate to the pond. Postflotation sediments, which freely sediment in the salty water environment, combine into porous aggregates with a strongly layered structure. The effects of natural sedimentation segregation are changes in the physical and mechanical properties of the waste as a function of the distance from the place of discharge. These changes directly affect the response of tailings to additional load in individual zones (Table 1).
The most reliable way to assess the actual response seems to be geodetic measurements of settlements. However, these are long-term measurements on the basis of which total settlements cannot be estimated as a result of a single measurement. Geotechnical in situ tests, such as DMTs, are successfully used to predict the settlement of natural soils [36,40,43,49]. In the case under consideration, the values of tailings settlements predicted by DMTs differ from the observed settlements. Some results are overestimated, while some are underestimated. A clear underestimation of settlements takes place in zone I, where the subsoil is built of sandy layers (beach) characterized by a higher value of constrained moduli. Settlements calculated based on overestimated constrained moduli should be underestimated [63]. A slightly better fit is observed in zone II, separating the sandy beach from the pond. In zone III, on the other hand, where the embankment subsoil, which is also the bottom of the pond, is built of low-bearing postflotation sediments, predicted settlements are overestimated. A similar problem is very common. Settlement values of natural soils for the Barcelona airport terminal determined based on CPTU and DMT results showed an overestimation of settlements by 28% compared to measured settlements [29]. However, the authors argued that the method used supplemented by a local correlation (MCPTU and MDMT) can be successfully used to estimate settlements. According to Schmertmann [32], the average ratio of natural soils settlement predicted by DMT to actual observations was 1.18, ranging from 0.7 to 1.3. [38], also obtained high agreement between settlements predicted by DMT and measured settlements. The average ratio of settlement results determined from DMT tests to actual observations equalled 1.87, ranging from about 1.0 to 2.5. In the case of an embankment built within the Żelazny Most TSF, the settlement ratio is in the range of 0.26 to 1.8, with an average value of 0.86. However, using the average settlement ratio is not justified in this case. Consequently, this leads to far-reaching average values. The use of average settlement values predicted by DMT and observed (46.08 cm and 40.17 cm, respectively) looks similar. It should be remembered that the loaded subsoil is built of postflotation tailings, not natural soil. Characteristics of the latter are much better recognized, and in addition, they do not have such specific zoning, unlike tailings. Therefore, it will be more appropriate, if at all, to use average values within separate zones (Table 1), where the average settlement ratio is 0.31 in zone I, 0.43 in zone II, and 1.59 in zone III. This approach clearly indicates underestimation of settlements in the first two zones and overestimation in the last zone (Figure 7). The discrepancy of results can be explained in two ways: first of all, paying attention to the DMT test interval, which may result in an increased frequency of random soil parameters registration, with higher stiffness (heavily layered sand and silt tailings of zones I and II, underestimated settlements) and weak zone III waste (overestimated settlements). Despite this, the literature emphasizes that the measurement interval along with the speed of the DMT test results in the fact that, in addition to determining soil parameters, predicting settlements is the number one application of the DMT, as mentioned earlier [41,47]. The results of other geotechnical tests at a larger interval, performed to assess settlements (e.g., SPT, standard penetration test, generally performed at 1.5-m intervals), are considered to be unreliable and not credible [37,42]. Settlements predicted by SPT can be overestimated against settlements predicted by DMT [64,65]. Other tests, such as PMT (pressuremeter test) and SBPM (self-boring pressuremeter), are time-consuming and less economical [43,46]; secondly, the results of the DMT do not include immediate and secondary settlements, which could partly be included in the results of geodetic measurements (zone I and II). It should be noted that the predicted settlements are meant to be “the settlement in working conditions”. According to Monaco et al. [46], the DMT-calculated settlement is the primary settlement. A similar situation occurred in the case of the experimental embankment at Treporti (Venice, Italy) [41,46,47,66]. According to Marchetti et al. [41], measured settlements amounted to 360 mm (including secondary), while settlements predicted by DMT reached 290 mm (net of secondary). The discrepancy of the results was explained by not including part of the secondary settlements (70 mm, which is less than 20%). The adulators of [30,35,38,42,44,49,67] also indicate high agreement of values predicted by DMT and observed settlements. In Żelazny Most TSF, more similar results of settlement tailings predicted by DMT in relation to the results determined on the basis of geodetic measurements may be obtained in the future by introducing local correlations to determine the constrained modulus M (e.g., correlations based on the results of DMT and CPTU).
5. Conclusions
Considering the results of the conducted research and the results available in the literature, it can be stated that the DMT test, widely recommended for determining settlement of natural soils, can also be used to estimate the settlement trend of tailings. The results of the DMT tests allow the determination of approximate tailings settlement values. In addition, they allow determination of the overall trend of settlement of weak tailings in line with the trend determined on the basis of geodetic observations. The conducted analyses led to the following general conclusions being drawn:
- Settlement of the postflotation tailings, depending on the facility zone, range from a few cm within the beach of the facility to over 1.5 m within the supernatant pond;
- Based on linear elasticity, DMT tests provide a settlement proportional to the load (Table 2); the results of the DMT test obtained after applying the load allow an approximate determination of the actual response of the tailings to the additional load; they indicate the trend of settlement consistent with the trend determined on the basis of geodetic measurements (Figure 7a);
- The results of DMT and geodetic measurements document the general correctness of the increase in the value of tailings settlement as they move away from the facility’s dam towards the pond; predicted and observed settlements in zone I and II < predicted and observed settlements in zone III (Table 4, Figure 7a);
- The weakness of DMT in the context of strongly layered tailings may be the aspect of discontinuous measurement, which in turn may lead to random measurements; the choice of a dilatometer membrane with appropriate stiffness, tailored to the tailings characteristics, may also affect the recorded test parameters. Omission of this element may directly affect the credibility of results obtained from the DMT test. The weakness of geodetic measurements is the time in which measurements are made and their cyclicality, which is next to the unification of methodology and interpretation of results, one of the three principles of monitoring.
Funding
The publication was co-financed within the framework of Ministry of Science and Higher Education programme as “Regional Initiative Excellence” in years 2019–2022, Project No. 005/RID/2018/19.
Data Availability Statement
Data sharing is not applicable to this article.
Conflicts of Interest
The authors declare no conflict of interest.
References
- Jamiolkowski, M.; Carrier, W.D.; Chandler, R.J.; Høeg, K.; Świerczyński, W.; Wolski, W. The geotechnical problems of the second world largest copper tailings pond at Zelazny Most, Poland. In 1st Za Chieh-Moh Distinguished Lecture keynote speech, Proceedings of the 17th SEAGC South East Asian Geotechnical Conference, Taipei, Taiwan, 10–13 May 2010; Li, J.C.C., Lin, M.L., Eds.; Taiwan Geotechnical Society: Taipei, Taiwan, 2010; Volume 2, pp. 12–27. [Google Scholar]
- Jamiolkowski, M. Soil mechanics and the observational method: Challenges at the Zelazny Most copper tailings disposal facility. Geotechnique 2014, 64, 590–618. [Google Scholar] [CrossRef] [Green Version]
- Świdziński, W.; Tschuschke, W.; Świerczyński, W.; Wolski, W. Tailings Storage Facility Żelazny Most—Significant geotechnical challenge. Mar. Eng. Geotech. 2015, 36, 186–193. [Google Scholar]
- Stefaniak, K.; Wróżyńska, M. On possibilities of using global monitoring in effective prevention of tailings storage facilities failures. Environ. Sci. Pollut. Res. 2018, 25, 5280–5297. [Google Scholar] [CrossRef] [PubMed]
- Lambrechts, J.R.; Leonards, G.A. Effects of stress history on deformation of sand. J. Geotech. Geoenviron. 1978, 104, 1371–1387. [Google Scholar]
- Abbiss, C.P. Calculation of elasticities and settlements for long periods of time and high strains from seismic measurements. Geotechnique 2014, 33, 397–405. [Google Scholar] [CrossRef]
- Campanella, R.G.; Robertson, P.K. A seismic cone penetrometer to measure engineering properties of soil. In Proceedings of the 54th Annual International Meeting and Exposition of the Society of Exploration Geophysics, Atlanta, GA, USA, 6–7 December 1984; pp. 138–141. [Google Scholar]
- Kaggwa, W.S.; Jha, R.K.; Jaksa, M.B. Use of Dilatometer and Cone Penetration Tests to Estimate Settlements of Footings on Calcareous Sand. In Proceedings of the 7th Australia New Zealand Conference on Geomechanics: Geomechanics in a Changing World, Adelaide, Australia, 1–5 July 1996; pp. 909–914. [Google Scholar]
- Tezcan, S.S.; Keceli, A.; Ozdemir, Z. Allowable bearing capacity of shallow foundations based on shear wave velocity. Geotech Geol. Eng. 2006, 24, 203–218. [Google Scholar] [CrossRef]
- Mayne, P.W. Georgia Institute of Technology. In Cone Penetration Testing State-of-Practice; NCHRP Project; Transportation Research Board, National Academies Press: Washington, DC, USA, 2007. [Google Scholar]
- Robertson, P.K. Interpretation of cone penetration tests—A unified approach. Can. Geotech. J. 2009, 46, 1337–1355. [Google Scholar] [CrossRef] [Green Version]
- Liu, S.; Cai, G.; Puppala, A.J.; Tu, Q. Prediction of embankment settlements over marine clay using piezocone penetration tests. Bull. Eng. Geol. Environ. 2011, 70, 401–409. [Google Scholar] [CrossRef]
- Omar, M.N.; Abbiss, C.P.; Taha, M.R.; Nayan, K.A.M. Prediction of long-term settlement on soft clay using shear wave velocity and damping characteristics. Eng. Geol. 2011, 123, 259–270. [Google Scholar] [CrossRef]
- L’Heureux, J.S.; Long, M.; Vanneste, M.; Sauvin, G.; Hansen, L.; Polom, U.; Lecomte, I.; Dehls, J.; Janbu, N. On the prediction of settlement from high-resolution shear-wave reflection seismic data: The Trondheim harbour case study, mid Norway. Eng. Geol. 2013, 167, 72–83. [Google Scholar] [CrossRef]
- Tonni, L.; Gottard, G. Assessing compressibility characteristics of silty soils from CPTU: Lessons learnt from the Treporti Test Site, Venetian Lagoon (Italy). AIMS Geosci. 2019, 5, 117–144. [Google Scholar] [CrossRef]
- Li, Y.; Shen, Y.; Wang, X.; Li, S.; Li, T.; Zhao, Q. Theoretical Studies and Implementation on the Temporary Data Storage Method for Cone Penetration Test. Sensors 2021, 21, 575. [Google Scholar] [CrossRef]
- Mayne, P.W. In-situ test calibrations for evaluating soil parameters. In Characterization and Engineering Properties of Natural Soils; Tan, T.S., Phoon, K.K., Hight, D.W., Leroueil, S., Eds.; Taylor & Francis Group: London, UK, 2007; Volume 3, pp. 1601–1652. [Google Scholar]
- Abu-Farsakh, M.; Yu, X. Comparison of predicted embankment settlement from piezocone penetration test with field measurement and laboratory estimated. In Geotechnical and Geophysical Site Characterization 4; Coutinho, R.Q., Mayne, P.W., Eds.; Taylor & Francis Group: London, UK, 2013; pp. 349–355. [Google Scholar]
- Drevininkas, A.; Creer, G.; Nkemitag, M. Comparison of estimated settlements from CPTu and SDMT in organic soils. In Geotechnical and Geophysical Site Characterization 4; Coutinho, R.Q., Mayne, P.W., Eds.; Taylor & Francis Group: London, UK, 2013; pp. 1839–1846. [Google Scholar]
- Bastani, S.A.; Silver, G.P.; Atkinson, D.R. CPT based settlement prediction over California soft rock. In Proceedings of the 3rd International Symposium on Cone Penetrometer Testing, CPT’14, Las Vegas, NV, USA, 12–14 May 2014; pp. 1113–1120. [Google Scholar]
- Long, M.; Carrol, R. Application of CPTU and SDMT to the characterization of Irish silts. In 5th International Workshop CPTU and DMT in Soft Clays and Organic Soils; Młynarek, Z., Wierzbicki, J., Eds.; Polish Committee on Geotechnics: Poznan, Poland, 2014; pp. 45–63. [Google Scholar]
- Shkodrani, N.; Anamali, E.; Dhimitri, L.; Gashi, S. In Situ Tests—Predicted vs. Observed Settlements: A Comparative Case Study. J. Civil Eng. Archit. 2014, 8, 824–832. [Google Scholar] [CrossRef] [Green Version]
- Tschuschke, W.; Kumor, M.K.; Walczak, M.; Tschuschke, M. Cone penetration test in assessment of soil stiffness. Geol. Q. 2015, 59, 419–425. [Google Scholar] [CrossRef] [Green Version]
- Robertson, P.K.; Campanella, R.G.; Gillespie, D.; Greig, J. Use of Piezometer Cone data. In Use of In-Situ Testing in Geotechnical Engineering; In-Situ’86, GSP 6; ASCE: Reston, VA, USA, 1986; pp. 1263–1280. [Google Scholar]
- Jamiolkowski, M.; Ghionna, V.; Lancellotta, R.; Pasqualini, E. New corrections of penetration tests for design practice. In Proceedings of the 1st International Symposium on Penetration Testing, ISOPT I, Orlando, FL, USA, 20–24 March 1988; Balkema: Orlando, FL, USA, 1988; Volume 1, pp. 263–296. [Google Scholar]
- Robertson, P.K.; Cabal Robertson, K.L. Guide to Cone Penetration Testing for Geotechnical Engineering, 6th ed.; Gregg Drilling & Testing: Signal Hill, CA, USA, 2015. [Google Scholar]
- Been, K.; Quiñonez, A.; Sancio, R.B. Interpretation of the CPT in engineering practices. Key note lecture 2. In Proceedings of the 2nd International Symposium on Cone Penetration Testing, Huntington Beach, CA, USA, 9–11 May 2010; Robertson, P.K., Ed.; Omnipress: Huntington Beach, CA, USA, 2010. [Google Scholar]
- Lunne, T.; Robertson, P.K.; Powell, J. Cone Penetration Testing in Geotechnical Practice; Blackie Academic and Professional, CRC Press: London, UK, 1997. [Google Scholar]
- Arroyo, M.M.; Mateos, M.T.; Devincenzi, M.; Gómez-Escoubès, R.; Martínez, J.M. CPTu-DMT performance-based correlation for settlement design. In 2nd International Conference on Geotechnical Site Characterization ISC’2; Viana da Fonseca, A., Ed.; Millpress: Porto, Portugal, 2004; pp. 1605–1611. [Google Scholar]
- Mayne, P.W. Lateral drilled shaft response from dilatometer tests. In GeoSupport Conference 2004: Drilled Shafts, Micropiling, Deep Mixing, Remedial Methods and Specialty Foundation Systems; Geotechnical Special Publication; Turner, J.P., Mayne, P.W., Eds.; American Society of Civil Engineers: Orlando, FL, USA, 2004. [Google Scholar] [CrossRef]
- Lacasse, S.; Lunne, T. Dilatometer Tests in Sand. In In Situ ‘86, ASCE Spec. Conf. on Use of In Situ Tests in Geotechnical Engineering; ASCE Geotech. Spec. Publ.; Virginia Tech.: Blacksburg, VA, USA, 1986; Volume 6, pp. 686–699. [Google Scholar]
- Schmertmann, J.H. Dilatometer Tests in Sand. In In Situ ‘86, ASCE Spec. Conf. on Use of In Situ Tests in Geotechnical Engineering; ASCE Geotech. Spec. Publ.; Virginia Tech.: Blacksburg, VA, USA, 1986; Volume 6, pp. 303–321. [Google Scholar]
- Leonards, G.A.; Frost, J.D. Settlements of Shallow Foundations on Granular Soils. J. Geotech. Eng. 1988, 114, 791–809. [Google Scholar] [CrossRef]
- Marchetti, S. Discussion to Leonards, G.A. & Frost, J.D. Settlements of Shallow Foundations on Granular Soils (ASCE Jnl GE, 1988, 114). ASCE J. Geotech. Eng. 1991, 117, 174–179. [Google Scholar]
- Marchetti, S. The Flat Dilatometer: Design Applications. Keynote Lecture. In Proceedings of the 3rd Third International Geotechnical Engineering Conference, Cairo, Egypt, 5–8 January 1997; pp. 421–448. [Google Scholar]
- Marchetti, S. Flat Dilatometer (DMT). Applications and Recent Developments. In Proceedings of the 50th Indian Geotechnical Conference IGC-2015, Pune, India, 16–19 December 2015; pp. 83–92. [Google Scholar]
- Woodward, M.B.; McIntosh, K.A. Case history: Shallow Foundation Settlement Prediction Using the Marchetti Dilatometer. In Proceedings of the ASCE Annual Florida Section Meeting, Orlando, FL, USA, 7–9 June 1993. [Google Scholar]
- Skiles, D.L.; Townsend, F.C. Predicting Shallow Foundation Settlement in Sands from DMT. In Vertical and Horizontal Deformations of Foundations and Embankments; ASCE: Austin, TX, USA, 1994; Volume 40, pp. 132–142. [Google Scholar]
- Steiner, W. Settlement Behavior of an Avalanche Protection Gallery Founded on Loose Sandy Silt. In Vertical and Horizontal Deformations of Foundations and Embankments; ASCE: Austin, TX, USA, 1994; Volume 40, pp. 207–221. [Google Scholar]
- Sawada, S.; Sugawara, N. Evaluation of densification of loose sand by SBP and DMT. In Proceedings of the 4th International Symposium: Pressuremeter and its New Avenues, Sherbrooke, QC, Canada, 17–19 May 1995; pp. 101–107. [Google Scholar]
- Marchetti, S.; Monaco, P.; Calabrese, M.; Totani, G. DMT-predicted vs measured settlements under a full-scale instrumented embankment at Treporti (Venice, Italy). In Proceedings of the 2nd International Conference on Site Characterization ISC’2, Porto, Portugal, 19 September 2004; Volume 2, pp. 1511–1518. [Google Scholar]
- Mayne, P.W. Unexpected but foreseeable mat settlements of Piedmont residuum. J. Geoeng. Case Hist. 2005, 1, 5–17. [Google Scholar]
- Schnaid, F.; Ortigao, J.A.R.; Mántaras, F.M.; Cunha, R.P.; MacGregor, I. Analysis of self-boring pressuremeter (SBPM) and Marchetti dilatometer (DMT) tests in granite saprolites. Can. Geotech. J. 2000, 37, 796–810. [Google Scholar] [CrossRef]
- Tice, J.A.; Knott, R.A. Geotechnical Planning, Design and Construction for the Cape Hatteras Light Station Relocation. Geo-Strat. Geo-Inst. ASCE 2000, 3, 18–23. [Google Scholar]
- Marchetti, S.; Monaco, P.; Totani, G.; Calabrese, M. The Flat Dilatometer Test (DMT) in Soil Investigations. A Report by the ISSMGE Committee TC16. Ground Property Characterisation from In–situ Testing; Proc. In Situ; 2001, p. 41. Reprinted in Proc. DMT; 2006, Washington, DC, USA. Available online: https://www.marchetti-dmt.it/conference/dmt15/papers%20DMT%202015%20(pdf)/TC16%20DMT%20Report%202001.pdf (accessed on 29 March 2021).
- Monaco, P.; Totani, G.; Calabrese, M. DMT—Predicted vs observed settlements: A review of the available experience. In Proceedings of the 2nd International Conference on the Flat Dilatometer, Flat Dilatometer Testing, Washington, DC, USA, 2–5 April 2006; pp. 244–252. [Google Scholar]
- Amoroso, S. DMT—Predicted vs. observed settlements: Treporti test embankment. In Proceedings of the 2nd International Balkans Conference on Challenges of Civil Engineering, BCCCE, Tirana, Albania, 17 May 2013; pp. 793–801. [Google Scholar]
- Buselli, F. Use of DMT to predict settlement of shallow foundations. In Geotechnics for Sustainable Development; Phung, D.L., Ed.; Construction Publishing House: Hanoi, Vietnam, 2013; pp. 531–536. [Google Scholar]
- Failmezger, R.; Till, P.; Frizzell, J.; Kight, S. Redesign of shallow foundations using dilatometer tests-more case studies after DMT’06 conference. In Proceedings of the 3rd International Conference on the Flat Dilatometer, Rome, Italy, 15–17 June 2015; pp. 83–91. [Google Scholar]
- Santos, R.; Rocha, B.; Giacheti, H. DMT for Load-Settlement Curve Prediction in a Tropical Sandy Soil Compared to Plate Load Tests. Geotech. Test. J. 2020, 43, 113–131. [Google Scholar] [CrossRef]
- Hayes, J.A. The Marchetti Dilatometer and Compressibility. In In Situ Testing and Monitoring; Southern Ontario Section of Canad. Geotech. Society: Toronto, ON, Canada, 1990; pp. 1–23. [Google Scholar]
- Massarsch, K.R. Settlement analysis of compacted granular fil. In International Conference on Soil Mechanics and Foundation Engineering—XIII ICSMFE; Balkema: New Delhi, India, 1994; Volume 1, pp. 325–328. [Google Scholar]
- Tschuschke, W.; Gogolik, S.; Wróżyńska, M.; Kroll, M.; Stefanek, P. The Application of the Seismic Cone Penetration Test (SCPTU) in Tailings Water Conditions Monitoring. Water 2020, 12, 737. [Google Scholar] [CrossRef] [Green Version]
- Tschuschke, W.; Wróżyńska, M.; Wierzbicki, J. Quality control for the construction of a tailings dam. Acta Geotech. Slov. 2017, 14, 3–9. [Google Scholar]
- Stefaniak, K.; Wróżyńska, M.; Kroll, M. Application of postflotation tailings in hydroengineering structures. J. Ecol. Eng. 2017, 18, 113–118. [Google Scholar] [CrossRef]
- Li, S.; Guo, Z.; Pan, J.; Zhu, D.; Dong, T.; Lu, S. Stepwise Utilization Process to Recover Valuable Components from Copper Slag. Minerals 2021, 11, 211. [Google Scholar] [CrossRef]
- Robinsky, E.I. Thickened discharge—A new approach to tailings disposal. CIM Bull. 1975, 68, 47–53. [Google Scholar]
- Robinsky, E.I. Tailings disposal by the thickened discharge method for improve economy and environmental control. Tailing Dispos. Today 1979, 2, 75–91. [Google Scholar]
- Kroll, M.; Stefaniak, K.; Walczak, M. Determination of efficiency of the circumferential drainage system. J. Ecol. Eng. 2015, 45, 68–74. [Google Scholar] [CrossRef] [Green Version]
- ISO TS 22476-11 Geotechnical Investigation and Testing—Field Testing—Part 11: Flat Dilatometer Test. 2017. Available online: https://www.iso.org/standard/66434.html (accessed on 29 March 2021).
- Marchetti, S. Some 2015 Updates to the TC16 DMT Report 2001. In Proceedings of the 3rd International Conference on the Flat Dilatometer, Rome, Italy, 14–17 June 2015; pp. 43–68. [Google Scholar]
- Marchetti, S.; Monaco, P. Short course on Flat Dilatometer (DMT). ISSMGE Committee TC16: DMT in soil investigation. In Proceedings of the Bali, Indonesia Insitu Conference, Bali, Indonesia, 21–24 May 2001; pp. 1–77. [Google Scholar]
- Maček, M.; Smolar, J.; Petkovšek, A. The reliability of CPTu and DMT for the mechanical characterization of soft tailings. Bull. Eng. Geol. Environ. 2019, 78, 2237–2252. [Google Scholar] [CrossRef]
- Failmezger, R.A.; Rom, D.; Ziegler, S.B. Behavioral characteristics of residual soils. SPT?—A better approach to site characterization of residual soils using other in-situ tests. In ASCE Geotech. Special Publication; Edelen, B., Ed.; ASCE: Reston, VA, USA, 1999; Volume 92, pp. 158–175. [Google Scholar]
- Failmezger, R.A. Discussion to Duncan, J.M., Factor of safety and reliability in geotechnical engineering. ASCE J. Geotech. Geoenviron. Eng. 2001, 127, 703–704. [Google Scholar] [CrossRef]
- McGillivray, A.; Mayne, P.W. Seismic piezocone and seismic flat dilatometer tests at Treporti. In Proc. ISC-2 on Geotechnical and Geophysical Site Characterization; Viana da Fonseca, A., Mayne, P.W., Eds.; Millpress: Rotterdam, The Netherlands, 2004; Volume 2, pp. 1695–1700. [Google Scholar]
- Failmezger, R.A.; Bullock, P.J. Owner Involvement—Choosing Risk Factors for Shallow Foundations. In Georisk 2011; ASCE: Atlanta, GA, USA, 2012. [Google Scholar] [CrossRef]
Figure 1.
Location (left) and 3-D visualisation (right) of Żelazny Most tailings storage facility (TSF), Poland.
Figure 1.
Location (left) and 3-D visualisation (right) of Żelazny Most tailings storage facility (TSF), Poland.

Figure 2.
Experimental embankment location within the TSF and distribution of earth masses for embankment construction in time.
Figure 2.
Experimental embankment location within the TSF and distribution of earth masses for embankment construction in time.

Figure 3.
The embankment’s subsoil (cross-section obtained on the basis of cone penetration test (CPTU) results and laboratory analysis of tailings grain size; zones as indicated in Table 1).
Figure 3.
The embankment’s subsoil (cross-section obtained on the basis of cone penetration test (CPTU) results and laboratory analysis of tailings grain size; zones as indicated in Table 1).

Figure 4.
Monitoring components of the embankment and its subsoil.

Figure 5.
Scheme for settlement prediction by DMT (where: p0 and p1—corrected first and corrected second reading, ID—material index, KD—horizontal stress index, ED—dilatometer modulus, φ—friction angle, u0—equilibrium pore pressure, MDMT—constrained modulus, σv—vertical stress, σ′v0—effective overburden stress, z—depth, RM—correction factor, s—settlements; data comes from the DMT performed on the embankment axis at a distance of 1 km from the TSF dam).

Figure 6.
Results sheet of settlements calculation, below the centre (test point 1+000).

Figure 7.
(a) Predicted and observed settlements comparison; (b) settlements agreement of tailings.


Table 1.
Three-zone characteristics of the subsoil of the experimental embankment.
| Zone | Location | Characteristics of Embankment Subsoil |
|---|---|---|
| I | Beach | Zone with the highest bearing capacity and rigidity: – a direct subsoil of the embankment in the area of the dam is built with a layer of sandy tailings and a thickness of 25 m; towards the pond, the layer gets shallower until it completely disappears in the shoreline; sandy grains and the beach drainage system excludes the generation of pore water pressure excess in tailings [59], – below the profile there is a zone with a characteristic, strongly layered sandy-silty structure with varying thickness of interlayers; sandy interlayers are a filtration path that limits the formation of pore water pressure excess in silty tailings. |
| II | Between the beach and the pond | Transition zone: – shallowing of the sandy tailings layer towards the pond, – a visible tendency of increasing of the thickness of silty interlayers; in the area of the shoreline, the zone of strongly layered tailings reaches the highest thickness equal to the entire profile of the deposited tailings. |
| III | Pond | Most problematic zone: – after crossing the shoreline, the top of the silty layer is lowered creating a space that is filled by the accumulation space of tailings with grains corresponding to the finest cohesive sediments; under the bottom of the pond, the layer of the finest (silty) tailings covers the entire recognized profile, i.e., over 35 m, – a zone in a state of full saturation and with the greatest susceptibility to deformation. |
Table 2.
Summary of results of settlements calculation, below the centre of embankment.
| Zone | Location 1 (km) | Layers 2 (–) | σv (kPa) | sDMT (cm) | Settlements Below the Centre |
|---|---|---|---|---|---|
| I | 0+400 | 183 | 70 | 7.69 |  |
| 0+500 | 190 | 75 | 8.13 | ||
| II | 0+600 | 184 | 80 | 16.06 | |
| 0+700 | 193 | 75 | 5.54 | ||
| III | 0+800 | 160 | 80 | 56.54 | |
| 0+900 | 169 | 85 | 62.81 | ||
| 1+000 | 171 | 93 | 165.78 |
1 Location (km) = km from the TSF dam. 2 Number of layers, where thickness of one calculation layer = 0.20 m.
Table 3.
Summary of the results of the observed settlements.
| Zone | Location 1 (km) | sobserved (cm) | Settlements Below the Centre |
|---|---|---|---|
| I | 0+400 | 30.03 |  |
| 0+500 | 21.60 | ||
| II | 0+600 | 30.03 | |
| 0+700 | 19.70 | ||
| III | 0+800 | 37.51 | |
| 0+900 | 50.09 | ||
| 1+000 | 92.25 |
1 Location (km) = km from the TSF dam.
Table 4.
Comparison of settlements.
| Zone | Location 1 (km) | Settlements (cm) | Settlement Ratio sDMT/sobserved | |||
|---|---|---|---|---|---|---|
| DMTpredict. | Avg. DMTpredict. | Observed | Avg. Observed | |||
| I | 0+400 | 7.69 | 7.91 | 30.03 | 25.82 | 0.26 |
| 0+500 | 8.13 | 21.60 | 0.38 | |||
| II | 0+600 | 16.06 | 10.80 | 30.03 | 24.87 | 0.53 |
| 0+700 | 5.54 | 19.70 | 0.28 | |||
| III | 0+800 | 56.54 | 95.04 | 37.51 | 59.95 | 1.51 |
| 0+900 | 62.81 | 50.09 | 1.25 | |||
| 1+000 | 165.78 | 92.25 | 1.80 | |||
1 Location (km) = km from the TSF dam.
Publisher’s Note: MDPI stays neutral with regard to jurisdictional claims in published maps and institutional affiliations. |
© 2021 by the author. Licensee MDPI, Basel, Switzerland. This article is an open access article distributed under the terms and conditions of the Creative Commons Attribution (CC BY) license (https://creativecommons.org/licenses/by/4.0/).
Share and Cite
MDPI and ACS Style
Wróżyńska, M. Prediction of Postflotation Tailings Behavior in a Large Storage Facility. Minerals 2021, 11, 362. https://0-doi-org.brum.beds.ac.uk/10.3390/min11040362
AMA Style
Wróżyńska M. Prediction of Postflotation Tailings Behavior in a Large Storage Facility. Minerals. 2021; 11(4):362. https://0-doi-org.brum.beds.ac.uk/10.3390/min11040362
Chicago/Turabian StyleWróżyńska, Magdalena. 2021. "Prediction of Postflotation Tailings Behavior in a Large Storage Facility" Minerals 11, no. 4: 362. https://0-doi-org.brum.beds.ac.uk/10.3390/min11040362
Note that from the first issue of 2016, this journal uses article numbers instead of page numbers. See further details here.