Article

Using Multigrain Crystallography to Explore the Microstructural Evolution of the α-Olivine to γ-Ringwoodite Transformation and ε-Mg2SiO4 at High Pressure and Temperature

1
Department of Earth and Planetary Science, University of California Berkeley, Berkeley, CA 94720, USA
2
The Advanced Light Source, Lawrence Berkeley National Laboratory, Berkeley, CA 94720, USA
*
Author to whom correspondence should be addressed.
Submission received: 5 March 2021 / Revised: 10 April 2021 / Accepted: 11 April 2021 / Published: 16 April 2021
(This article belongs to the Special Issue Structural Characterization of Earth Materials at Extreme Conditions)

Abstract

:
The introduction of multigrain crystallography (MGC) applied in a laser-heated diamond anvil cell (LH-DAC) using synchrotron X-rays has provided a new path to investigate the microstructural evolution of materials at extreme conditions, allowing for simultaneous investigations of phase identification, strain state determination, and orientation relations across phase transitions in a single experiment. Here, we applied this method to a sample of San Carlos olivine beginning at ambient conditions and through the α-olivine → γ-ringwoodite phase transition. At ambient temperatures, by measuring the evolution of individual Bragg reflections, olivine shows profuse angular streaking consistent with the onset of yielding at a measured stress of ~1.5 GPa, considerably lower than previously reported, which may have implications for mantle evolution. Furthermore, γ-ringwoodite phase was found to nucleate as micron to sub-micron grains imbedded with small amounts of a secondary phase at 15 GPa and 1000 °C. Using MGC, we were able to extract and refine individual crystallites of the secondary unknown phase where it was found to have a structure consistent with the ε-phase previously described in chondritic meteorites.

1. Introduction

The strength and phase transformations of Earth’s mantle minerals are key components for understanding mantle evolution including the behavior of subducting slabs and deep seismicity patterns. The mineral olivine (Mg,Fe)2SiO4 is volumetrically the most abundant material in the upper mantle contributing ~40–60% to its total composition. Several studies have aimed at experimentally determining the rheological behavior of olivine at elevated temperatures and pressures to simulate conditions within the mantle (i.e., >1000 °C) [1,2,3,4,5,6,7], which have also been aided by atomistic calculations to determine the needed stress to initiate dislocation movement [8,9]. Low temperature data, on the other hand, are sparse but have been revisited recently [10] due to the wide fluctuation in the experimentally determined yield strength of olivine under lithospheric conditions at 2–6 GPa which places strong limitations on the scalability of room temperature flow laws to conditions of the upper mantle. For instance, original studies performed by Evans and Goetze (1979) [11] predicted a very high differential yield stress of ~5.4 GPa at 27 °C using hardness indentation tests on olivine single crystals, which led to a flow law for olivine at temperatures <800 °C while experiments performed at room temperature and 3–7 GPa using powder samples in a diamond anvil cell found yield stresses of only 2–3 GPa [12,13,14].
Olivine acts as the precursor for the remaining bulk lower mantle through two high P-T structural phase transitions within 13–18 GPa representing the 410–660 km depth range within the Earth known as the mantle transition zone (MTZ): α-olivine (orthorhombic) → β-wadsleyite (orthorhombic) → γ-ringwoodite (spinel; cubic) [15,16,17]. Finally, at roughly 23 GPa, γ-ringwoodite undergoes the dissociative transition to orthorhombic (Mg,Fe)SiO3 bridgmanite and cubic (Mg,Fe)O ferropericlase, a pair that is anticipated to comprise the remaining bulk mantle material down to a depth of 2500 km. Within the interior of subducting slabs, where colder temperatures are retained, it has long been speculated that these transformations may be kinetically hindered [18], pushing metastable olivine and its structural transformations to occur at greater depths which could have strong effects on the slab’s mechanical behavior; for instance, it is anticipated that the occurrence of deep earthquakes may be due to shear localization that occurs during the α → γ pathway [19,20]. Grain size reduction may also occur across phase transitions which can greatly impact the strength evolution within subducting slabs. Furthermore, when there are changes in the relative sizes of hard and soft phases coupled with the spatial distribution of phases [21,22], unequal strain partitioning can occur, which can impact the local viscosity [23].
The multigrain crystallography (MGC) technique [24,25] applied in a diamond anvil cell (DAC) combined with high energy synchrotron X-rays has been used for in-situ monitoring of microstructural evolution and mineral characterization under various conditions [26,27,28,29,30,31] allowing the extraction of individual grain orientations, grain stress and strain, and the spatial distribution of phases in an aggregate sample, characteristics that were only accessible statistically previously using powder techniques. Furthermore, MGC has the unique ability to track the evolution of diffraction spots assigned to individual grains which enables identification of subtle phenomena such as appearance of sub-domains and new grain nucleation.
In this study, we utilized MGC to track the behavioral evolution of a San Carlos olivine sample in-situ over a range of pressure conditions at low temperature. We took advantage of MGC’s ability to measure the elastic strain within individual grains in an attempt to capture the stress state in the sample at the onset of plastic deformation where constraints on the room temperature yield stress, and possible mechanisms are discussed. We then tracked the intergranular microstructural evolution across the αγ phase transformation at high P-T conditions, a key transformation in understanding the mantle transition zone.

2. Materials and Methods

2.1. Experimental Details

A standard thin section of 50 μm thickness was prepared from naturally occurring San Carlos olivine [(Mg0.88Fe0.12)2SiO4]. A single grain was identified and isolated using cross-polarized microscopy and the tabulated birefringence values for olivine. The composition was estimated from scanning electron microscopy energy dispersive spectroscopy (SEM-EDS). A cylindrical section with dimensions 50 μm height × 100 μm diameter was removed using the laser milling system provided by the sample preparation lab at the Advanced Light Source (ALS), Lawrence Berkeley National Lab, California, USA. The cylindrical sample was then loaded into a pre-indented steel gasket along with a ~5 μm diameter ruby sphere (SRM 1990) inside a BX90 diamond anvil cell [32] between two 300 μm culet Boehler–Almax diamonds. The ruby sphere was placed in a position from the center of the sample chamber and away from the potential scanning area to avoid any direct contact with the heating laser which may introduce aluminum into the sample at high temperature. The cell was then placed in a gas-actuated pressure membrane canister used to remotely manipulate sample pressure during the experiment.
When performing MGC, two calibrations must be performed: one to refine the sample–detector distance and detector non-orthogonality to ensure accurate measurement of lattice parameters and the other to refine the non-axisymmetric tilt of the detector about the incident beam axis so that the sample’s rotational axis is aligned with the X-ray beam axis. The general experimental geometry when using a DAC is depicted in Figure 1 showing the relevant reference frames used by this technique. Prior to placing the DAC containing the sample in the X-ray path, the sample–detector distance and detector non-orthogonality (tilt parameters) were determined using a National Institute of Standards and Technology (NIST) CeO2 powder standard irradiated with an X-ray wavelength of 0.41343 Å and spot size of 15 μm (FWHM) for 60 s while rotating through δω of 20° (see Figure 1). Images were collected on a Pilatus3 S 1M detector (Product of Dectris, Switzerland) at a distance of 217 mm. The Pilatus3 S 1M detector is composed of 10 distinct collection panels with a pixel size of 172 μm × 172 μm and a total sensitive area of 168.7 × 198.4 mm2. This detector provides particular advantages for MGC in that the increased dynamic range prevents weak diffraction signals from being “washed out” by nearby strong scattering, allowing reflections from smaller, weakly scattering grains to be detected. The images were analyzed, and initial detector parameters determined using the Dioptas software package [33]. The two-dimensional (2D) parameters from the CeO2 calibration were used as initial inputs into the HEXRD software to calibrate the detector in three dimensions (3D). Using a 150 μm diameter NIST ruby sphere loaded onto the sample stage, which will hold the DAC during the experiment, the sample stage was aligned on its rotational axis in the X-ray beam (Figure 1) and the detector calibration parameters were refined, including the tilt about the detector normal which cannot be accomplished using the powder method due to the image symmetry. The NIST ruby sphere was irradiated while the sample stage was rotated at a constant velocity through a δω of 320° [−100° to +220°] with an image captured at every 0.25° step with an exposure time of 0.25 s resulting in 1260 individual diffraction images.
The pressure canister containing the DAC was then loaded into the beam path in axial configuration, centered and aligned on the X-ray beam using a photo diode placed between the sample and the detector. This procedure also allows the determination of where the cell body does not block the X-ray beam, providing the angular range δω that diffraction from the sample is collectible. Furthermore, this configuration conveniently places the DAC compression axis parallel to the incident beam direction, i.e., ZS parallel to the beam direction. Once the sample’s rotational axis was found to deviate by less than 5 μm, the sample was irradiated with 0.41343 Å wavelength X-rays collimated to a 15 μm spot size (FWHM) through a δω 60° rotation [−30° to +30°] at ambient P-T conditions with a diffraction pattern with 0.25 s exposures. Two scans with 0.125° and 0.25° angular step sizes, respectively, were collected. This described scanning procedure is applied throughout the experiment for use in MGC analysis and is referred to as a “rotational series”. The pressure was increased in a stepwise fashion with single images collected through a rotation of 20° and 60 s constant exposure after each pressure increment to check for noticeable changes to diffraction spot morphology. When noticeable changes indicative of grain evolution were observed, such as change in Bragg peak size or location, a full rotational series was conducted at that pressure step. The pressure inside the DAC was measured using the online beamline assisted ruby florescence (BARF) system provided at beamline 12.2.2 which was also compared to the equation of state (EOS) for corundum and olivine [34] at each step. Once extensive diffraction spot streaking occurred in the sample and rendered the diffraction spots unusable for MGC, the pressure was directly increased into the γ stability zone (20 ± 1.5 GPa) and heated using a double-sided laser heating approach [35] to a temperature of 800–1000 °C with a heating spot size of 20 μm to induce the α → γ phase transition. Figure 2 depicts the experimental path in P-T space.

2.2. Data Analysis with MGC

First, an understanding of the methodology behind MGC is in order. In general, diffraction relies on the satisfaction of Bragg’s law:
= 2dhklsinθ,
where λ represents the incident X-ray wavelength, n represents an integer value phase shift between scattered waves, dhkl is the lattice plane spacing, and θ is the angle between the reflecting lattice plane and the incident wavelength. Only when this equation is satisfied does coherent diffraction from a given set of planes in the direct lattice (or points in the reciprocal lattice) occur. It is more appropriate to discuss diffraction in terms of reciprocal space, where a general scattering vector Q is defined as the difference between the incident (kincident) and scattered (kscattered) wave vectors of the incoming X-ray beam. In the instance of monochromatic X-rays, the plane wave description leads to
kscattered − kincident = Q,
and scattering events are characterized by reciprocal lattice vectors Ghkl where
Ghkl = hb1 + kb2 + lb3,
and h, k, and l represent the reciprocal lattice vector (Miller indices) and bi (i = 1,2,3) are derived from the basis vectors of the crystal lattice. It follows that diffraction, or visualization of a diffraction “spot”, will occur when a reciprocal lattice vector is equivalent to the scattering vector, i.e.,
Ghkl = kscattered − kincident = Q,
Or
Ghkl − Q = 0,
The far-field variant of MGC analysis used here was performed with the HEXRD software package [37,38]. When using this technique, a rotation series of diffraction images over a pre-determined angular range in ω is performed (Figure 1). Special care must be taken to determine this range since the incident X-rays can be blocked by both the cell body and the gasket which can also diffract if incident to the beam, resulting in extraneous Bragg reflections in the resulting diffractogram, the aggregate image of all diffraction patterns collected in a rotational series. Each recorded intensity is labeled with its respective coordinates on the detector face in (2θ, η, ω) (Figure 3) with ω associated with the image number in which the reflection was located. The image series is then aggregated into a single image by taking the max intensity at each pixel through the entire image stack collected during the rotational series (Figure 3). Generally, an intensity threshold set as the minimum allowable intensity must be added to the resulting aggregate diffractogram to remove or minimize background intensity, gasket reflections, and Bragg reflection oversaturation and to filter intense reflections from the diamonds. If the oversaturation is too great or there are too many extraneous reflections from the gasket material, the scan may need to be retaken varying the X-ray spot size and angular range used in collecting the images. Furthermore, over thresholding can lead to losing intensities that belong to smaller, more weakly diffracting crystals which may be useful in post analysis to generate estimates on number, orientation, and spatial distribution of recently nucleated crystals. Once complete, to minimize the data storage which can occur from aggregating 102–103 diffractograms, the aggregate image is written as a sparse matrix of intensities reducing the file size from Gb to Mb.
When performing the technique with this approach, prior knowledge of the expected crystal geometry, such as the crystal symmetry and rough estimates of lattice parameters as well as the 2D detector calibration, are required to populate the complete set of Ghkl detectable for a given detector size and incident wavelength. Orientation space is then searched for orientations that strictly obey angular tolerances set on the intensity location as well as a user defined completeness threshold which is defined on a hit:miss ratio. i.e., if 5 Ghkl are input for the initial search 4:5 peaks found within the tolerances would institute a completeness of 80%. When a multiphase sample is being used, it is necessary to choose Ghkl unique to each phase to prevent any overlap when the candidate grain orientations are generated. This becomes more complicated when phases of similar symmetry are present. Once the initial orientation indexing is complete, the remaining intensities in the diffraction images are allowed to enter a grain fitting algorithm performed internally by the HEXRD software.
Below, we describe the experimental considerations when performing MGC and for consistency the same nomenclature will be used in this description. We illustrate this process through the initial analysis performed on the NIST ruby sphere, the results of which act as the reference and resolution on parameters such as grain position and strain tensor components.
In the current formalism using HEXRD software, an orientation (termed “grain”) is considered “fit” once a minimum of 11 reflections can be assigned within the user provided tolerances. Theoretically, only three principal diffraction vectors would be needed to constrain a grain’s orientation, but full fitting of a grain requires refining 12 parameters: three components of mean grain orientation, three spatial components of the grain centroid, and six strain components of each grain. Therefore, the higher is the number of reflections that can be unambiguously assigned to an orientation the better constrained the parameters such as grain centroid position and elastic strain tensor components can become. A “goodness of fit” through a completeness percentage value is assigned to each fit grain and compared to the NIST ruby calibration result. It should be noted that, while a grain’s orientation may be well constrained with a small number of reflections, fitting the minimum threshold number of peaks provides poorer constraints on centroid position and elastic strain tensor components. Orientation information for each grain is provided using the three-component exponential map parameterization. This information can then be imported into custom post-processing software which utilizes the MATLAB software package MTEX [39,40] to calculate the orientation distribution function (ODF), plot pole figures, and perform any needed tensor/matrix operations.

3. Results and Discussion

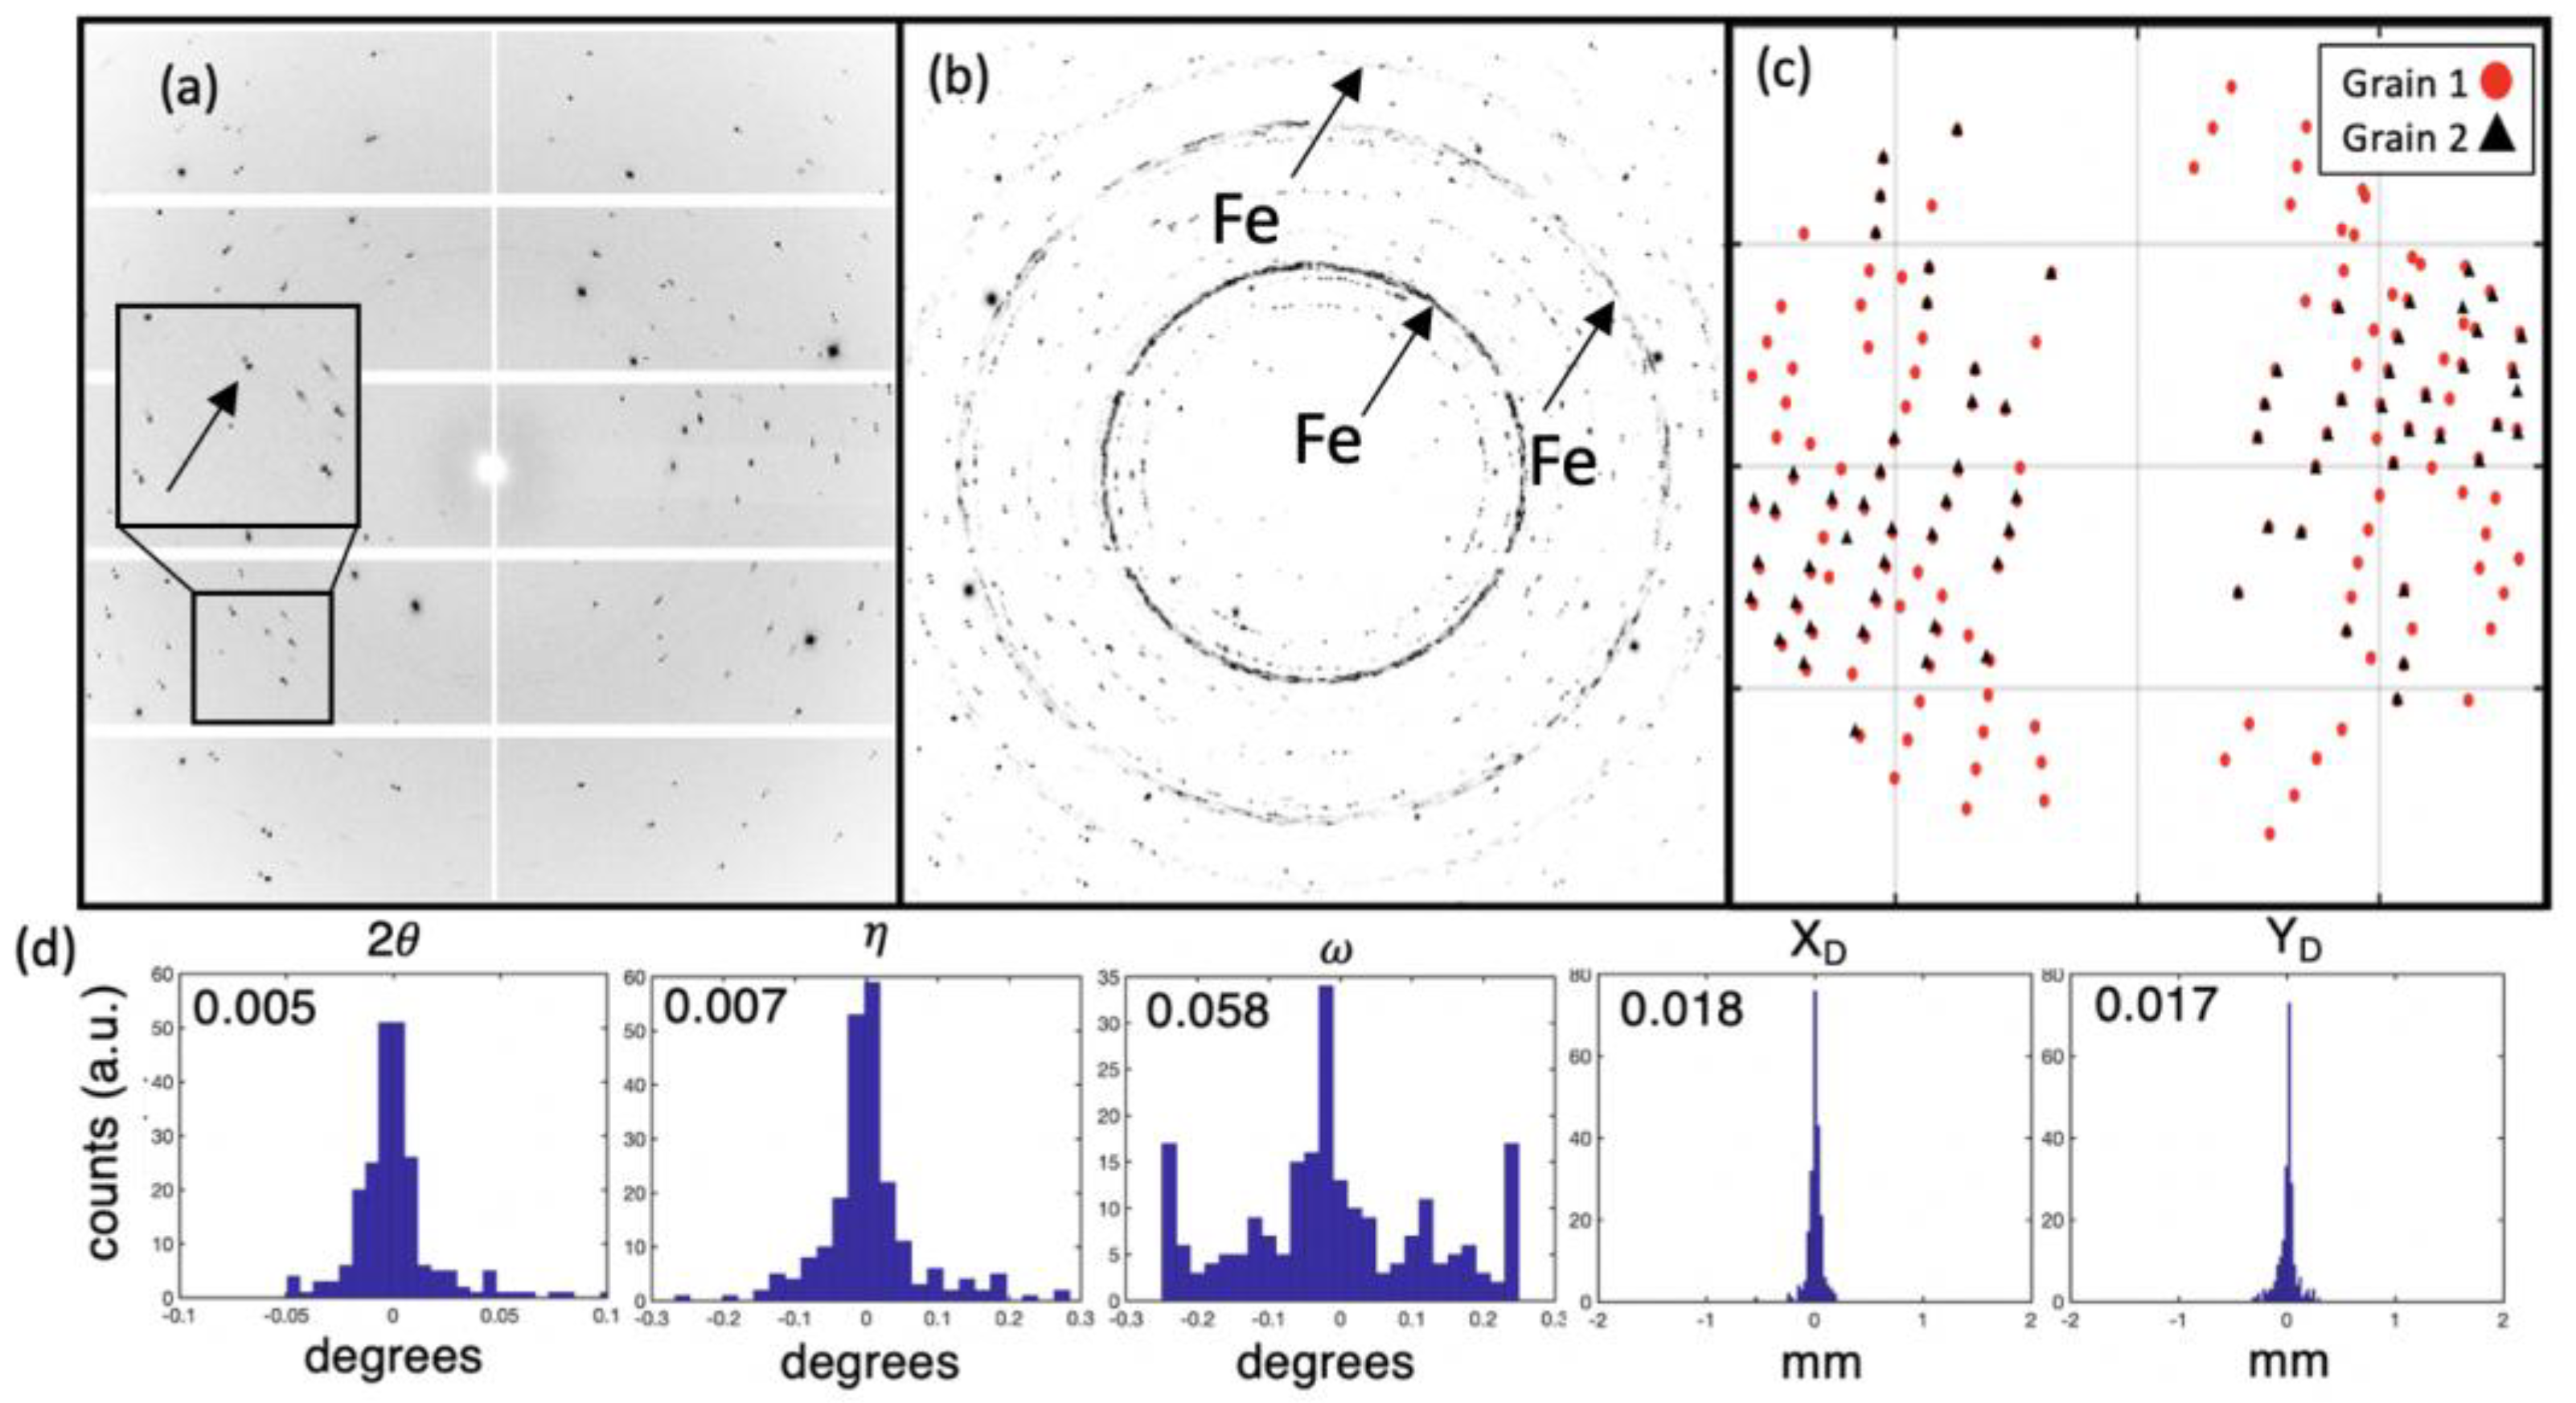
3.1. Ruby Single Crystal

Analysis of the NIST ruby sphere using HEXRD identified and assigned 209 diffraction spots to a single orientation with lattice parameters a = 4.7608 Å and c = 12.9957 Å with strains on the order of 10−5, indicating a virtually unstrained sample. The 100 μm diameter NIST ruby yielded a χ2 value of 5.95 × 10⁻⁴ with 90.8% of all anticipated reflections within the 20° 2θ search area being accounted for allowing for constraints on the grain centroid location which was found to be located at coordinates (6.39, 1.11, −3.37) μm in the sample frame (Xs,Ys,Zs) with (0,0,0) representing the determined beam center. Initial analysis thresholds set for orientation search completeness was 70%, and thresholds on (δ2θ, δη, δω) for spot assignment were 0.2, 0.3, and 0.25, respectively. Comparisons between the predicted and measured diffraction spot locations are shown as histograms in Figure 4.

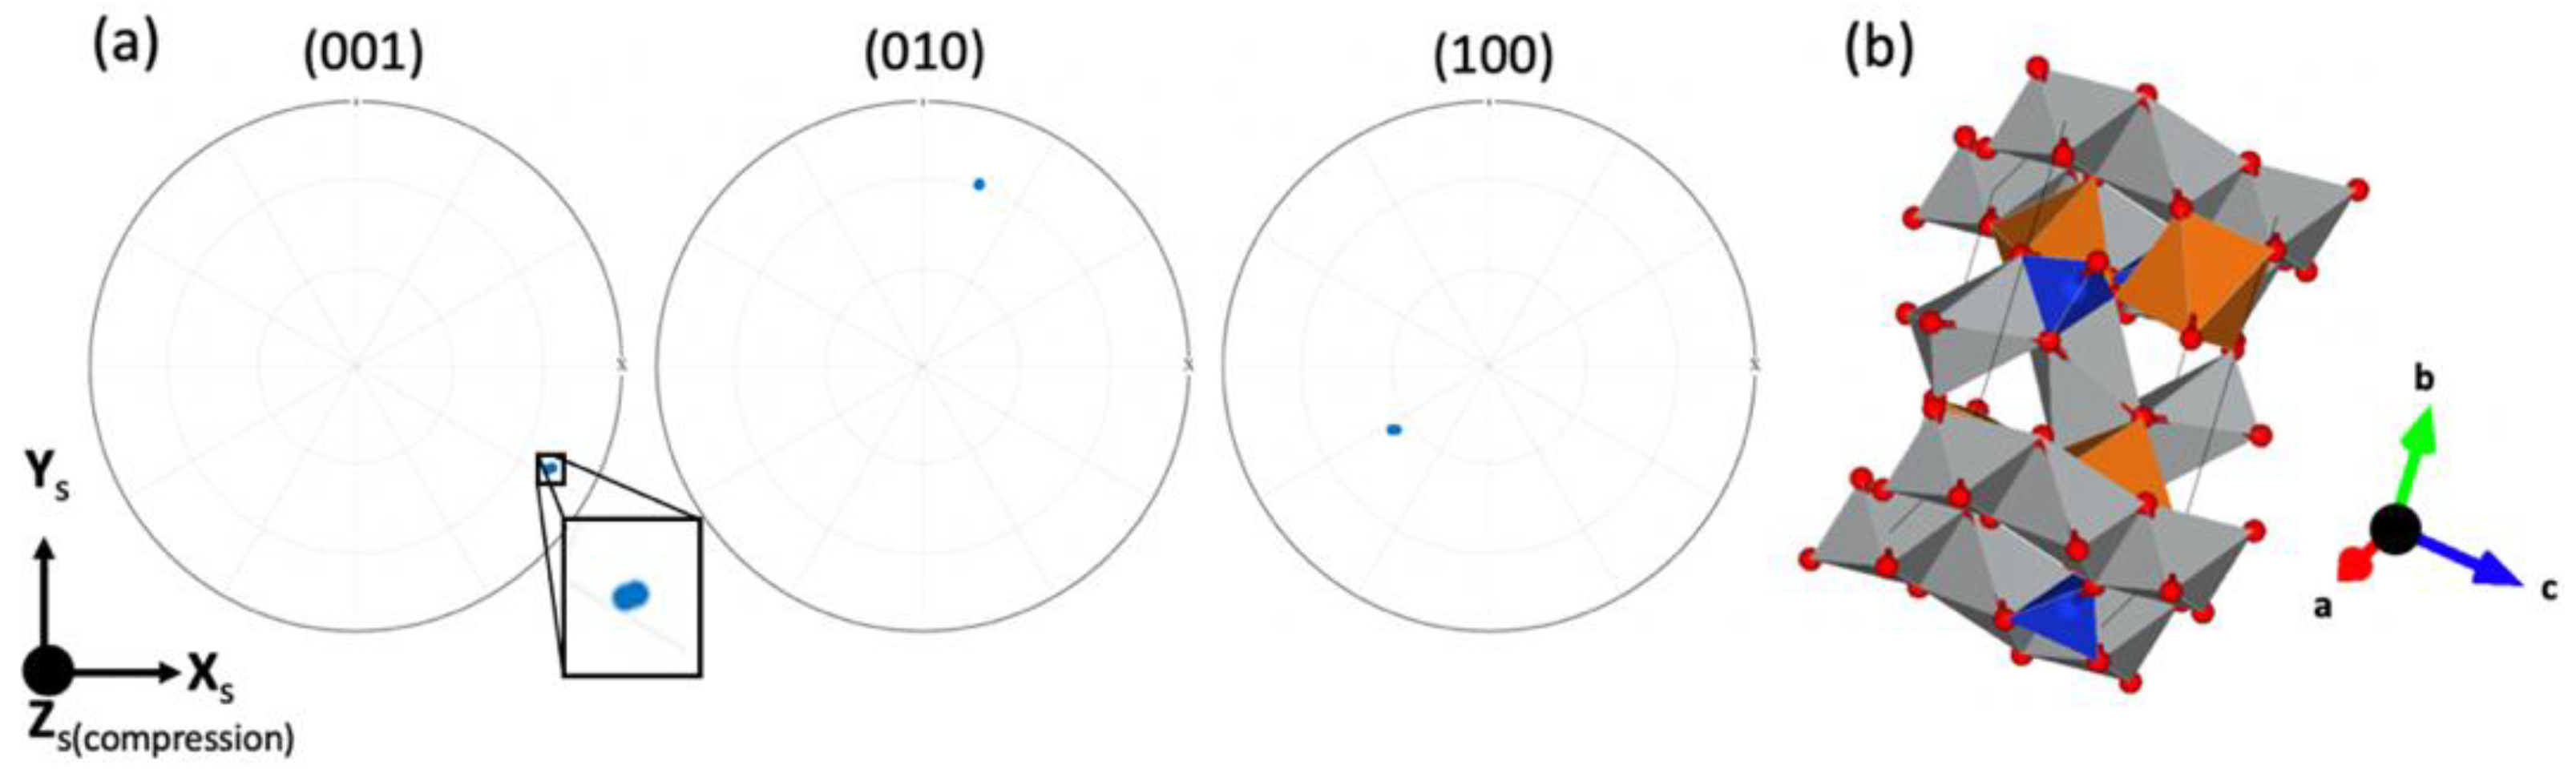
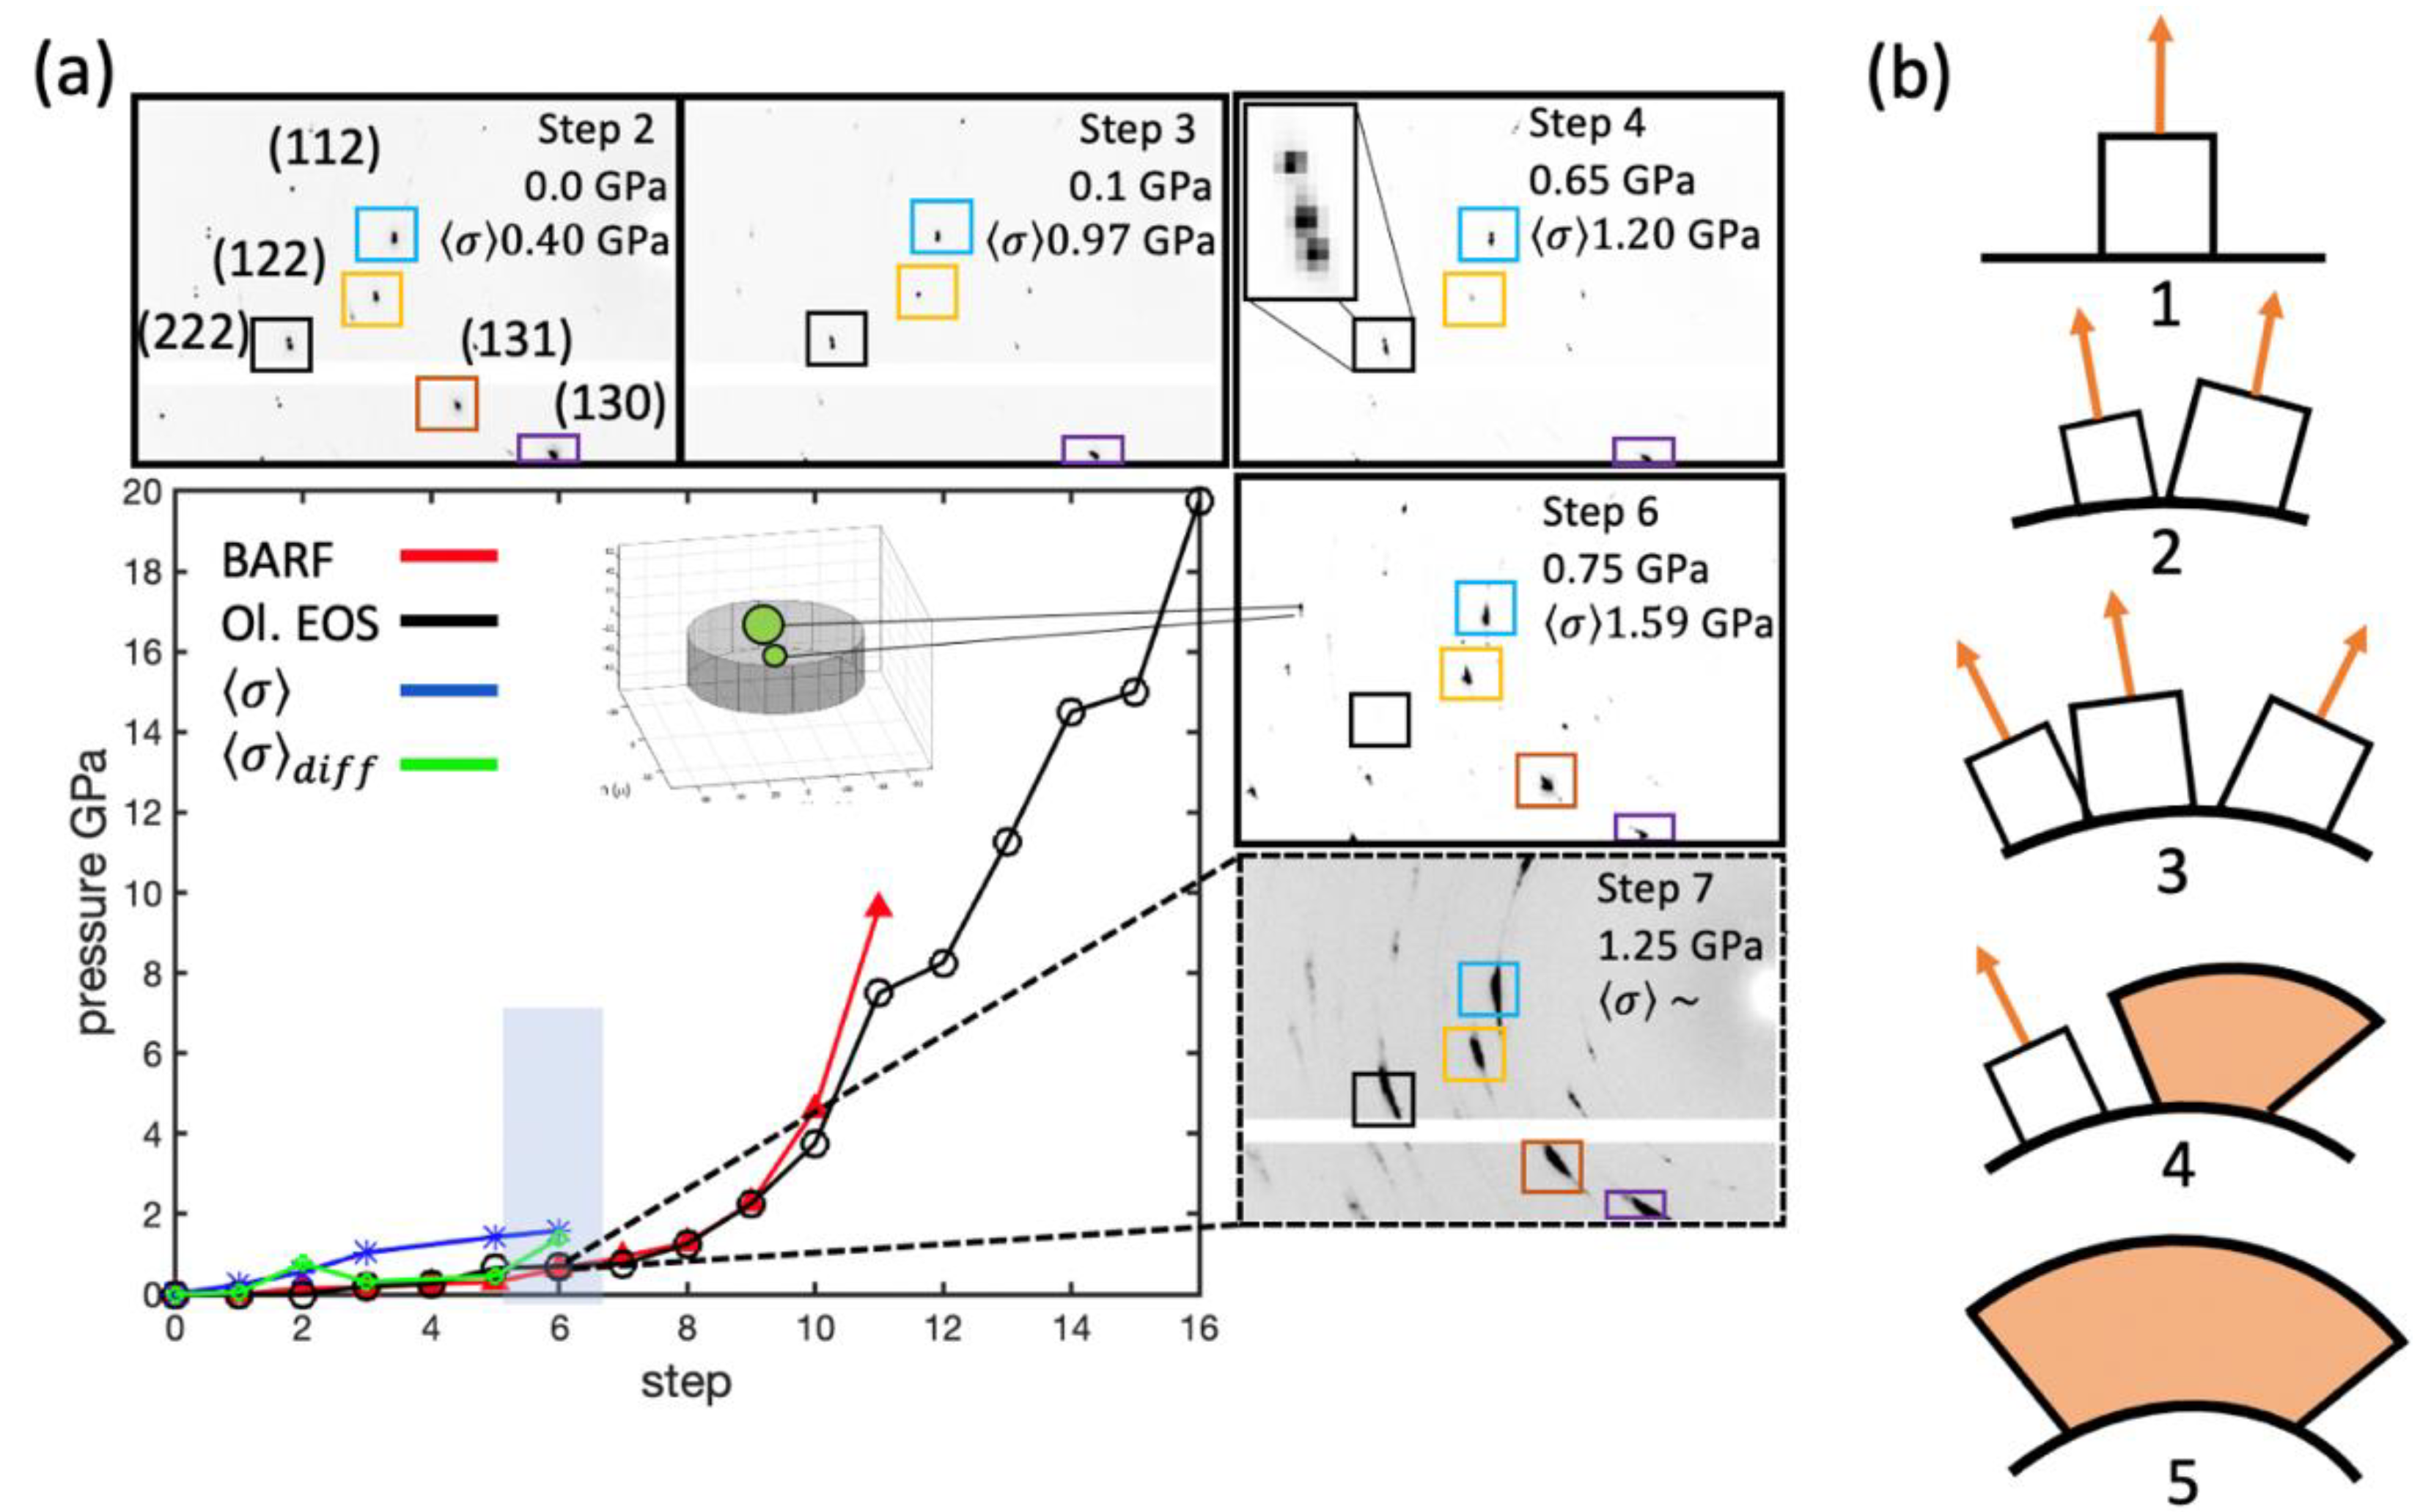
3.2. Deformation of San Carlos Olivine

Diffraction images of the olivine single crystal(s) prior to any pressurization showed visible asterism (i.e., a resolved row of individual diffraction spots for a given Debye–Scherrer ring) in this case, a pair (Figure 5a) similar to that previously described in [41]. The existence of two unique orientations was confirmed by MGC which identified two olivine orientations with refined averaged lattice parameters a = 4.7535(4) Å, b = 10.221(3) Å, c = 5.9916(4) Å and a standard deviation of 10−4 in good agreement with literature values (Table 1). The 124 and 117 reflections (completeness of 64% and 60% to an angular distance of 22° 2θ for grain 1 and grain 2) were identified above the background owing to the existence of one larger and one smaller diffracting volume (Figure 5b) which was confirmed by comparing the integrated spot intensity of the (112) reflection (highest structure factor) of both grains with the larger grain being 90% greater. The misorientation between the two grains (GaGb−1, representing the active rotation to bring the two grains coincident) was found to be <1.6°. The crystal c-axes of both grains were found oriented ~71.98° (Φ) from the compression axis of the DAC (62.5°, 71.98°, 300.29°) and (61.63°, 70.96°, 301.13°) for grains 1 and 2, respectively, in Bunge convention (ϕ1, Φ, ϕ2) (Figure 6a,b). Elastic strain tensors were obtained for both grains which act as a reference for the proceeding runs once pressure is added.
During pressure increases, we found good agreement between pressure measurements using ruby fluorescence (red line in Figure 7) and the EOS (black solid line in Figure 7) for olivine with deviations being less than ~60 MPa to 4 GPa with increasing divergence between the two measurements approaching at step 10. At 10 GPa, the quality of signal from the ruby spheres degraded and could no longer be distinguished and only the EOS for olivine was used.
Between pressures of 0.1 and 0.25 GPa, an increase in asterism was observed in the diffraction patterns (Figure 7 outer box step 4) resulting in a new (third) discernable orientation with the arising domain having a slightly larger misorientation gap from the original two (<1.6°) and accompanied by a drop in differential stress, which is discussed below. This event could occur for a couple of reasons: (1) the sample contained pre-existing subdomains but with a misorientation too small to distinguish in the ambient state of the sample; (2) the crystallite was fractured during the preparation process; or (3) the sample was further fractured during initial compression before confining pressure was reached. No undulatory extinction could be seen during optical microscopy prior to sample loading, but, because the extraction process involves laser drilling which imparts a rapid temperature gradient to the sample, we suspect either Scenario 2 or 3 to be the cause but cannot differentiate between those two with any certainty. While the orientation of the new domain was fairly well constrained, only 11% of reflections (totaling 12 reflections) could be assigned with MGC, leading to a poor overall fit on parameters such as strain tensor components and centroid position while the initial two grains remained fully constrained.
MGC enables monitoring peaks belonging to specific lattice planes as pressure is increased throughout the experiment until the onset of plastic yielding. At a pressure of 0.75 GPa, the observed triplet spots were replaced with the onset of spot broadening in both the azimuth and radial directions, markedly so on the identified (130) and (140) planes (Δη increasing to 2.33° and 0.28° in Δ2θ), and later at higher pressures the (110) plane ((hk0) type lattice planes) consistent with slip deformation experimentally predicted by [42] (albeit at much higher temperatures of 900°C) as well as by first principal calculations [8]. It has been previously shown that observed lattice-related peak broadening along the angular directions can be a sign of deformation at high pressures and low temperatures [41]. Diffraction spots belonging to the majority of the remaining lattice planes (e.g., (240) and (241)) showed little or no angular streaking in either the azimuthal direction η or radial 2θ at this pressure and maintained a clear distinction between the pairs or triplets with near Gaussian spot morphology. The angular streaking remained even after pressure was slightly decreased confirming plastic deformation to the crystalline lattice, whereas, had the streaking been purely elastic (lattice plane flexure), the spots would have returned to near Gaussian upon release. At 1.25 GPa (marked by grey bar in Figure 7 (middle) and shown in Figure 7 outer box step 7) extensive peak broadening in both angular directions (from 0.15° at ambient to 0.38° in 2θ, and from ~1° at ambient up to 15° in η) and increased in magnitude throughout the remaining pressure runs (Figure 8a). MGC requires the ability to distinguish individual intensity centroids to accurately determine the crystal orientations. When extensive streaking begins in the angular directions 2θ (pertaining to the strain on lattice d-spacing) and η (relating to the crystal orientation) the uncertainty in intensity centroid location drastically increases. In the weakly streaking cases, the centroid may still be recoverable though extensive intensity filtering but here this was not the case. At this stage, the analysis is beyond MGC and could continue with powder techniques such as the Rietveld method [43] to gain a statistical estimation of the orientations and stress but that is beyond the intent of this study.
Having access to each grain orientation as well as the full elastic strain tensor allowed for calculation of the stress of each grain under the assumption of linear elasticity through the application of Hooke’s Law, σi = Cijεj Single crystal elastic constants for olivine obtained under various P-T conditions [44] were used for these calculations. For subsequent calculations at higher pressures, the ambient condition elastic constants were Taylor expanded to the first derivative in pressure to each measured pressure step in the experiment. Each elastic tensor (Cijkl) was rotated coincident with grain orientation in the sample frame (Xsi with the subscript depicting the correct frame and the superscript running from 1 to 3 = x,y,z). The von Mises equivalent strain and stress [45] were then computed via Equations (6) and (7).
ε e q = 2 3 ( ε 11 ε 22 ) 2 + ( ε 22 ε 33 ) 2 + ( ε 11 ε 33 ) 2 + 6 ( ε 12 2 + ε 13 2 + ε 23 2 ) 2 ,
σ e q = ( σ 11 σ 22 ) 2 + ( σ 22 σ 33 ) 2 + ( σ 11 σ 33 ) 2 + 6 ( σ 12 2 + σ 13 2 + σ 23 2 ) 2 ,
A steadily increasing average equivalent elastic stress was found from sub GPa to 1.59 GPa just before the onset of plastic yielding with an associated differential stress (σdiff) of 0.195 GPa (calculated as σ1σ2, which represent the most compressive and least compressive elastic stress tensor components, respectively). As mentioned above, it is interesting to notice that outer box 3 in Figure 7a represents the first indication of the newly detectible olivine orientation (the third reflection forming the triplet) and is also coincident with a sudden drop in the average σdiff while σeq continues to steadily increase. This event may indicate that the newly identified orientation developed from brittle fracturing of the sample, meaning that complete confinement of the sample had yet to occur. Similar events occurred when Proietti et al. (2016) [13] performed deformation experiments using a deformation DIA (D-DIA) at 3–7 GPa. They attributed the similar drops in stress at low temperature to micro-fracturing. We were able to calculate each σeq and σdiff up to step 8, after which the centroids of the individual diffraction spots were no longer discernable and grain elastic strain tensors could not be quantified.
The calculated stress at the onset of yielding in this study are substantially lower than those previously recorded by both nanoindentation as well as DAC methods [4,10,11,12,13,14] by 1–4 times. Previous experiments used crushed or annealed powder samples with starting grain sizes from 2 to 20 μm, whereas in this study star a fully dense 100 μm single crystal was used. It has been shown in stishovite that the measured differential stress in powders can be up to 10 times greater than that of dense polycrystals [46]. This fact was made more apparent in [47] which describes a size effect phenomenon in olivine of “smaller is stronger” analogous to the Hall–Petch concept. That study also places constraints on the critical scale length (~300 μm) below which measurements of yield stress would increase. In this study, our initial sample was on the order of 100 μm but contained three domains before the onset of plastic deformation all of which fall below this critical scale length. Furthermore, this also explains why we found higher stresses in the smaller grains.
Using this technique for the measurement of in-situ stress in a DAC is not without limitations. For instance, transmission geometry results in poor sampling of lattice spacings along the diamond axis where the stresses are anticipated to be largest. In addition, as previously explained, the DAC only allows a limited range of Bragg reflections to be gathered. During each cell rotation, at most ~15 μm from the center of the sample chamber is sampled on either side of the rotation range, and the olivine single crystal used in this study almost certainly has stress gradients that span farther than this. We can assume that our estimates of stress in this case are reasonable because during the grain-fitting process we do not fit the normal strains to the infinitesimal strain tensor, but instead we are fitting over 100 collected Ghkl (obtained over a 40–60° rotation, with 20–30° off of the diamond axis) to the deformation tensor leading to an overdetermined least-squares problem which would be expected to return a reasonable model for those directions for which we do not have direct Ghkl observations. Along these lines, previous investigations measuring deviatoric stress in a DAC [48] compared the radial (cross-axial) geometry which places incident X-rays orthogonal to the diamond axis and the axial (co-axial) geometry, used here, which places the incident X-rays along the diamond axis. In that study [48], measured deviatoric stress in a gold standard implanted in NaCl revealed that in the co-axial geometry gradients occurring over 100 μm from the sample center varied by ~0.3–0.5 GPa while those in the cross-axial geometry varied by 0.1–0.3 GPa over a 200 μm distance. In our experiment, we could only sample at most 15 μm from the sample center due to the rotational limitations. This would translate to roughly a 0.2 GPa gradient here.
In future experiments, a more precise measurement of the stress gradients present in the sample could be made by translating the sample in 5–10 μm steps from the center axis and repeating the analysis to gain a better understanding of spatial variations on stress gradients. Using this approach, the allowable angular range of the scan would be greatly reduced on one side, however this can be overcome by performing symmetric scans where the DAC is rotated 180° and the scan repeated. This was not available during this experiment due to the mechanical restrictions of the pressurized membrane system employed.

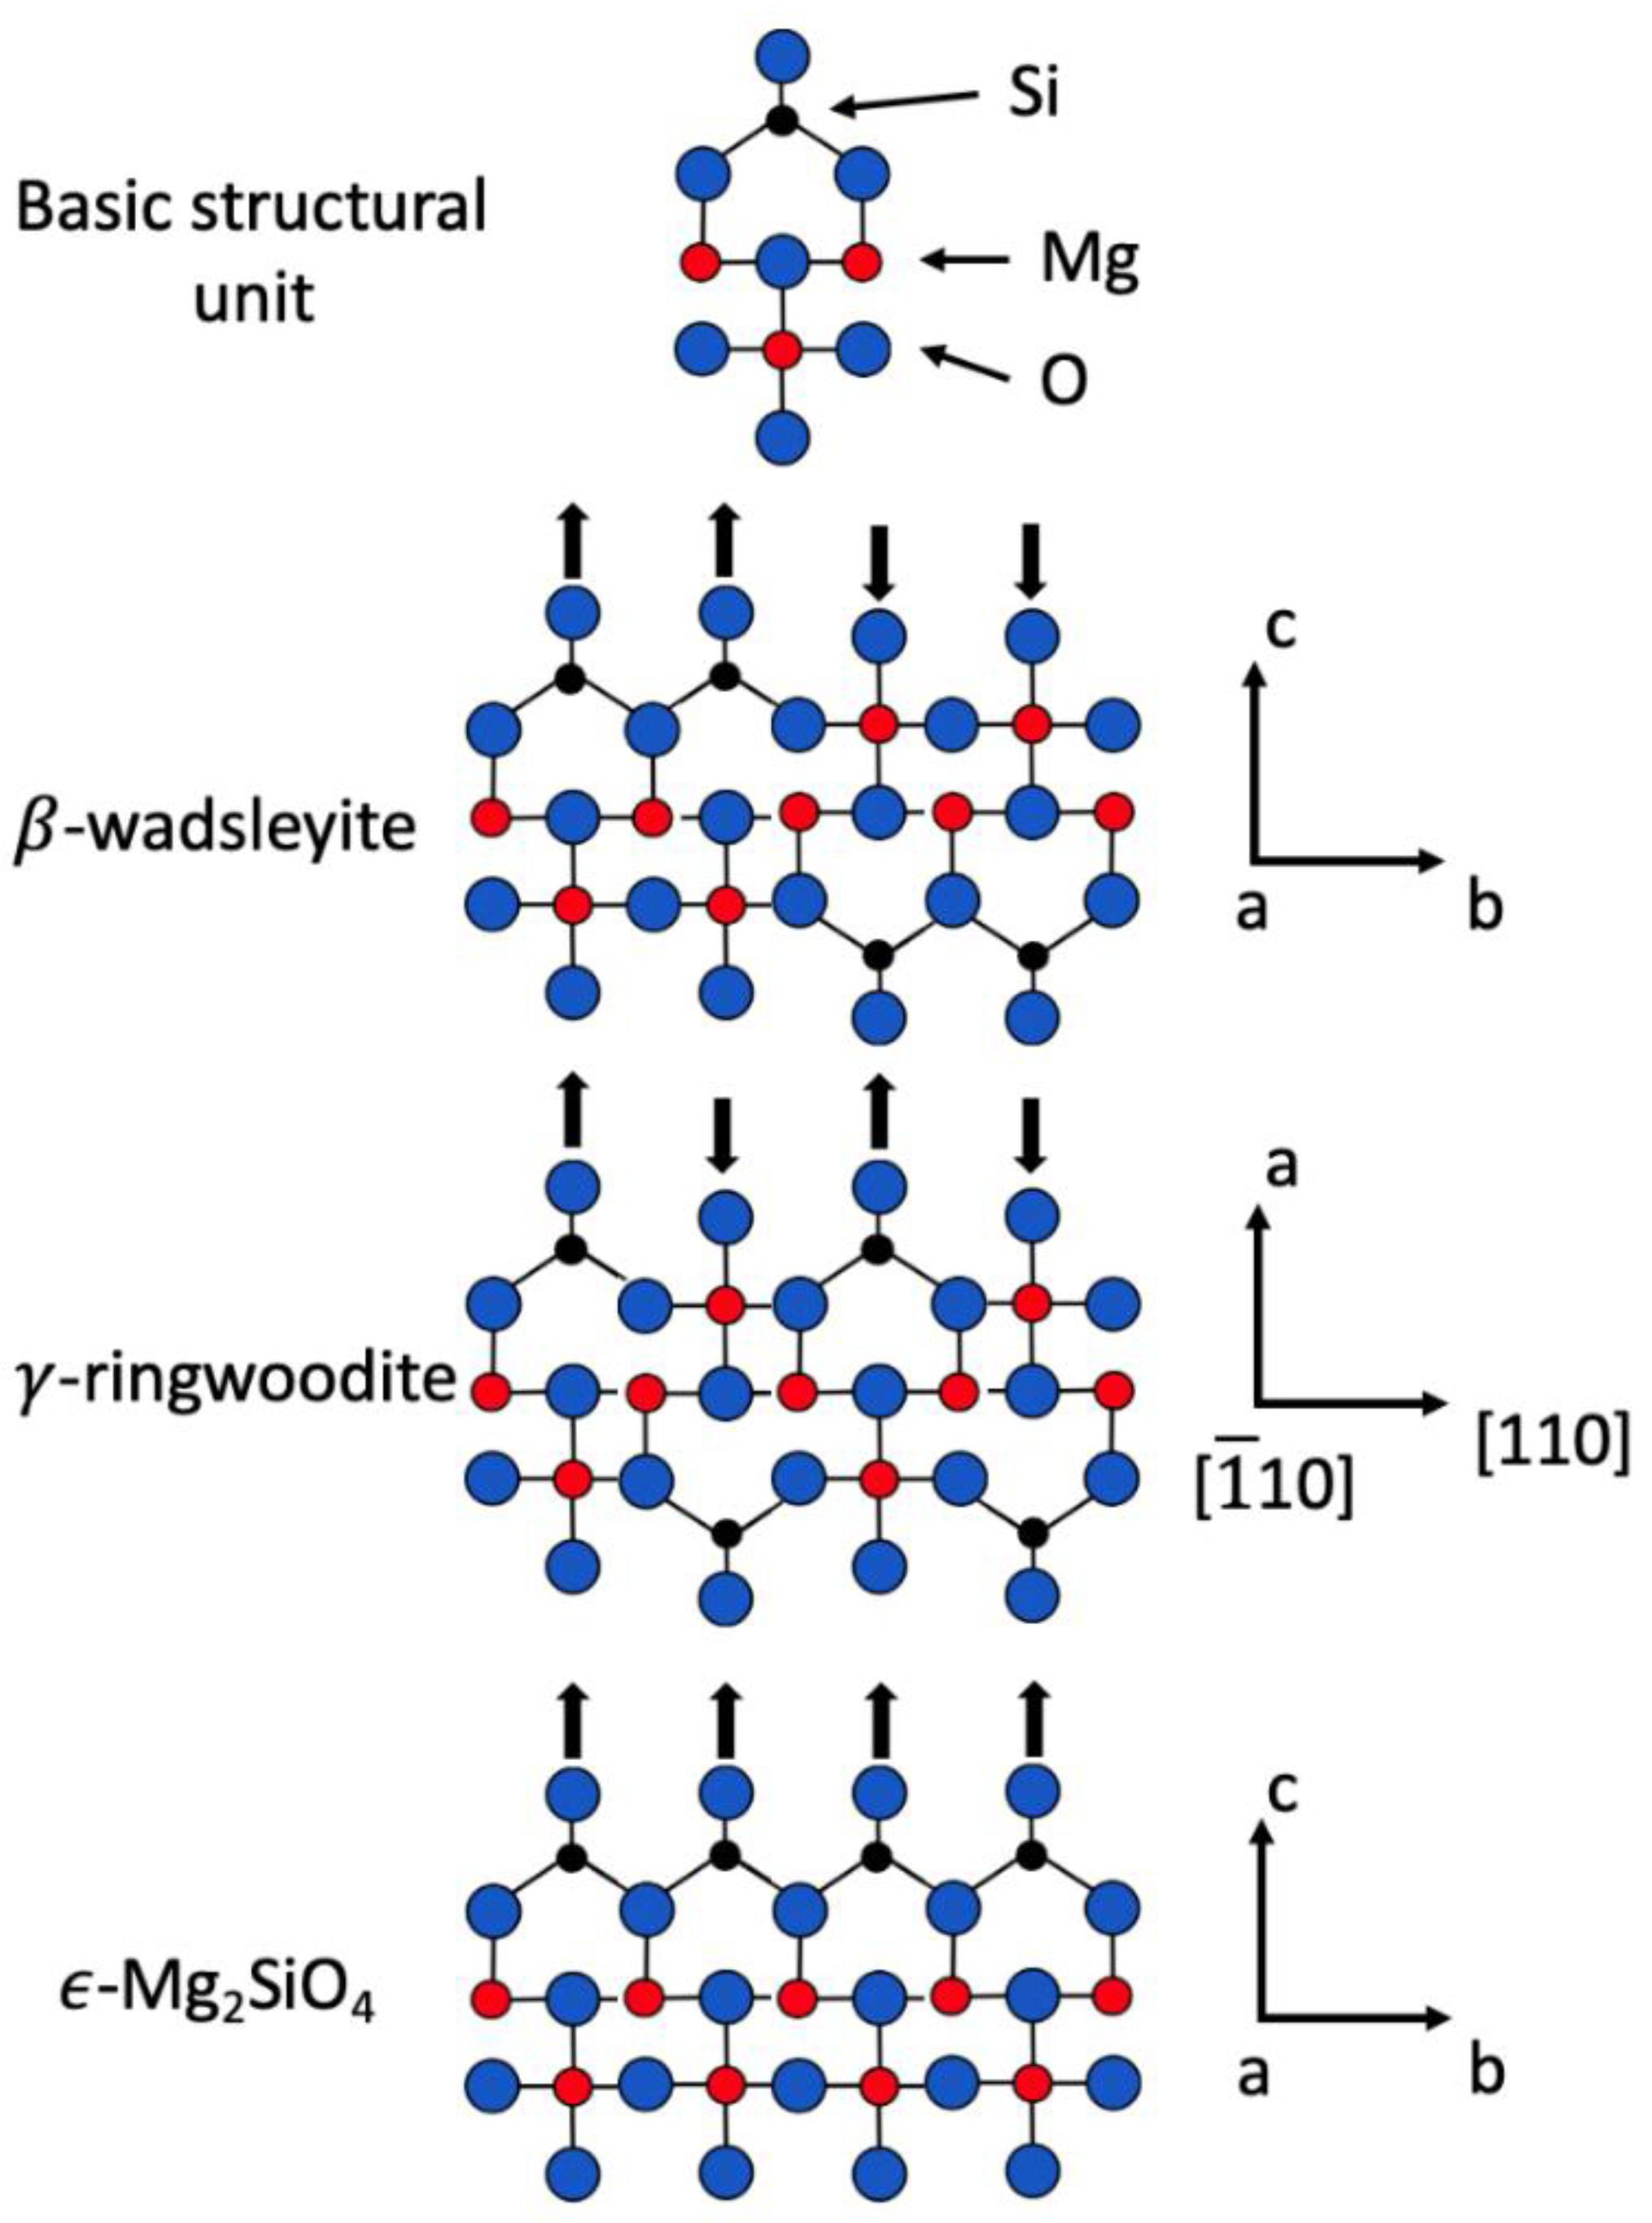
3.3. α → γ Phase Transition

After step 9, the pressure was increased directly to a pressure of 20 GPa and the sample was laser heated within a temperature range of 800–1000 K for 1 h to induce the α → γ phase transition (Figure 2). The sample was then quenched to room temperature and diffraction images were collected which showed no meta-stable olivine in the scanned area and revealed the appearance of several new peaks including the distinctive (311) belonging to cubic γ-ringwoodite (Figure 8b). Due to the large volume decrease that accompanies this phase transition (estimated at ~8% [49]), the pressure in the DAC dropped to 15.5 GPa after quenching, still within the stability field for γ-ringwoodite at room temperature.
We identified 77 unique orientations belonging to a cubic phase ringwoodite with a = 7.9097(3) Å (taken from three best constrained grains). It should be noted that more than 120 individual orientations were found but most only contained 3–5 reflections and could not be used for further grain refinement. This is generally the case when grain size is sub-micron while the beam spot size is large (15 μm in this case). The identification of γ-ringwoodite is further complicated by the presence of reflections from the stainless-steel gasket (bcc) at the far angular edges of the scan where {110}Fe overlaps with {400}γ, and {240}Fe overlaps with {440}γ. Care was taken here by using the {220}γ and {311}γ peaks as constraints on the initial orientation search by requiring their presence (Figure 8b). While this approach also lowers possible overall number of grains identified, it is necessary to minimize the possibility of mis-indexation which can lead to erroneous orientations. Here, if an orientation did not contain the {220}γ and {311}γ peaks but did contain higher 2θ peaks, it was not considered. This almost surely removed weakly identified ringwoodite grains, but it is a necessary exclusion to prevent cross indexation with the underlying iron peaks.
Another approach that has been taken to minimize the influence of gasket reflections is to further restrict the angular range of the scan excluding images with any indication of the gasket entering the incident beam and diffracting. We have found this approach to be successful when the grains are large and of low symmetry phases. Here, this approach was not ideal due to the few existing peaks of cubic γ-ringwoodite and would further decrease the angular working range to ~22° from 60°. The X-ray spot size can also be decreased, which widens the angular working range slightly; this approach comes at the cost of a proportional loss of X-ray flux which weakens the diffraction intensity, in this case for an already fine-grained weakly diffracting sample. This approach was attempted initially but greatly lowered the number of collected diffraction spots. It is also important to note that we only sampled a small subvolume of the specimen, given the initial sample volume of 3.9 × 105 μm3 and the described angular range, as well as X-ray spot size, and, due to the axial geometry, we only observed roughly 1.5% of the sample volume. Thus, we cannot capture any large-scale heterogeneities, especially those that may occur due to thermal gradients during the laser heating process. Because the IR-heating laser spot (20 μm at FWHM) is larger than the X-ray spot size (15 μm), and these were aligned to coincide, we assume that the area sampled is not affected by thermal gradients. Even with these constraints we can still estimate on the upper bound grain size of the extracted ringwoodite. The approximate volume of the scanned area of the sample is 1.0825 × 104 μm3. If we assume that ringwoodite is the only phase present in the sample and the 120 identified orientations account for all grains of ringwoodite in the scanned area, this leads to a cubic grain volume of 90.21 μm3 and therefore a grain length of 4.48 μm. It can be seen when comparing Figure 8b,c that the assigned intensities in Figure 8c are only identifying the largest intensities in Figure 8b so we can conclude that many smaller grains were not detected.
At 15.5 GPa, we detected no residual β-wadsleyite in the scanning area. Due to the limited access to reciprocal space, and the cubic symmetry of γ-ringwoodite, only five of the 120 identified grains were constrained enough to provide estimates of the stress state, but the grain centroids remained poorly constrained. Generally, this limitation can be overcome by utilizing symmetric scans which double the reciprocal space access and allows visualization of Friedel pairs. However, we did not have this option because the DAC was placed in a pressure cannister apparatus which prevents this rotation, and removal and rotation of the cell introduces the chance of scanning a different location of the sample. Nonetheless, the orientations were well constrained with most grains containing 30–60% of reflections out to a 2θ range of 18°. In the better constrained grains, the average σeq was found to be 3.055 GPa with an average σdiff = 1.61 GPa, lower than the 1.8 GPa stress determined by [50] under similar conditions while Wenk et al. (2005) [51] determined a maximum differential stress of ~5 GPa when deforming γ-ringwoodite at 6–8 GPa. In the latter case, the stress was determined during heavy deformation after nucleation, whereas, in this study, stress was measured just after heating-induced nucleation (with decompression). In addition, the mentioned previous experiments were performed on powder samples and therefore we expect our values at similar pressures to be lower based on the length effect described above. Microstructurally, we find that γ-ringwoodite forms as a fine-grained phase caused by nucleation during heating when converting directly from α-olivine. The nucleated grains showed a trend for the {100} lattice plane maxima to be aligned with the compressions direction nearly similar to that found in [27,28] where MGC was combined with resistive heating techniques to study transition zone microstructures.
Upon further investigation, extra features were noticed in the diffraction patterns with a unique set of reflections which could not be assigned to any of the expected transformation products (α-β-γ) or to the steel gasket material. The new reflections occurred in small, weakly reflecting, clusters indicating some form of preferred orientation, with four clusters readily visible at 2θ = 9.467° and η = 165°, −159°, 19°, and −16° (black boxes in Figure 8b,c). The existence of an intermediate high-pressure polymorph, ε-Mg2SiO4 (epsilon), has been predicted by transformation models in the Mg2SiO4 system [52,53], where it has been implicated in assisting the straight α-γ transition through shear mechanisms, as well as the α to β transition in the absence of the activation temperature needed to drive nucleation and growth (Figure 9). Recently ε-Mg2SiO4 was observed by Tomioka [54,55] in the heavily shocked Tenham chondritic meteorite which fell in Australia in 1879 [56].
The lattice parameters provided in [54], i.e., Pmma symmetry setting a = 5.78 Å, b = 2.88 Å, c = 8.33 Å, provided initial search criteria to identify the origin of the new peaks. Due to the differing symmetries, cubic (γ) versus orthorhombic (ε) (Table 1), we were able to separate the phases and isolated 17 candidate grains with 7–13 reflections each belonging to crystallites with the anticipated structural parameters for the ε-phase which structurally resembles β-wadsleyite but with ¼ size of the b-axis (Figure 9). Due to the unknown Mg and Fe content or partitioning in ε, and the fact that the only recorded lattice parameters for ε were obtained at ambient conditions, we set the allowable deviations in the 2θ direction to be 0.4° and then refined to 0.2°. We used the two best constrained grains for iterative least squares refinement using the software UnitCell [30,57] giving the lattice parameters a = 5.7393 Å, b = 2.8112 Å, 7 c = 8.3399 Å (Table 1), in close agreement with the previous estimates. Table 2 provides reflections and the respective d-spacings from one grain indexed as ε.
Table 1. Comparison of space groups and lattice parameters determined for the best constrained grain from each identified phase. * indicates this study.
PhaseSpace Groupa (Å)b (Å)c (Å)Volume (Å3)
α-olivine(ambient) *Pbnm4.7532(4)10.2215(3)5.9916(4)291.10(2)
α-olivine(ambient) [58]Pbnm4.7631(14)10.2272(9)5.9944(10)292.01(10)
α-olivine(0.1 GPa) *Pbnm4.7413(4)10.2184(3)5.9887(4)290.09(3)
α-olivine(0.65 GPa) *Pbnm4.7413(4)10.2113(4)5.9713(5)289.09(2)
α-olivine(0.75 GPa) *Pbnm4.7413(5)10.2119(4)5.9874(5)289.94(2)
Β-wadsleyite [59]Imma5.6983(4)11.4380(7)8.2566(8)538.14
γ-ringwoodite (15 GPa) * Fd3m7.9097(3)--494.863(2)
γ-ringwoodite [60]Fd3m8.0649(1)--524.522(2)
ε-phase (15 GPa) *Pmma5.7393(3)2.8112(3)8.3399(3)134.563(2)
ε-phase (ambient) [54]Pmma5.78(8)2.88(3)8.33(14)139(6)
To ensure the validity of the indexation of ε, multiple schemes were used: (1) We ensured that the (103) peak (encompassed by the black boxes in Figure 8c) was included as a seed reflection when searching for candidate orientations, along with other reflections. (2) We performed the same search using only the (103) peak and a single other reflection. (3) We varied the intensity threshold on both Approaches 1 and 2 to the extreme by systematically increasing the threshold high enough such that no grains could be found and low enough such that the most intensities could be assigned. In all cases, only subsets of the original indexed set of ε grains were identified, leading to the same orientations and adding validity to the identification.
It has been hypothesized that the α-γ and α-β transitions could occur through a shear mechanism when differential stresses are greater than 1 GPa [50] or the pressure overstep is large. Here, the last measurable σdiff in α-olivine was found to be 1.49 GPa just at the onset of plastic deformation prior to the pressure being increased to 20 GPa where we can assume the differential stress increased greatly. This was followed by a differential stress of 1.61 GPa in the newly formed γ-ringwoodite after nucleation at 20 GPa and then decompression to 15 GPa. We can assume that the differential stress during conversion lay somewhere between 1.61 and 1.49 GPa.
Furthermore, Tomioka et al. 2017 [54] also identified the topotaxial relation (001)ε parallel to {001}γ and (100)ε parallel to {110}γ through the use of high-resolution transmission electron microscopy. Having access to the individual orientations of each identified grain, we are able to probe for this relation directly. Figure 10 compares the obtained orientations for all three phases as upper hemisphere pole figures. In the current study, we did not find evidence for the same previously described topotaxial relation. The pole figures comparing (100)ε and {110}γ show evidence that there is alignment of these planes (e.g., the maxima near XS and YS locations around the border of both), but we do not see the described (001)ε parallel to {001}γ. However, we see a stronger alignment of (001)ε and {111}γ. Although we do not detect these relationships here, it does not mean that they do not exist in the sample. As mentioned previously, due to the rotating nature of the scan, the small three-dimensional volume sampled, and small apparent grains size, we cannot exclude that the detected ε-phase grains and γ-ringwoodite grains abide to a topotaxial relationship.
In this study, pressure was lost in the membrane after the initial heating cycle. Extended heating at pressure would have allowed for grain growth at pressure which could have made this feature more evident. Due to the numerous orientations of γ-ringwoodite found compared to the number of potential ε-phase orientations, this may have been a topotaxial relationship between parent and daughter grains for which the parent grains did not have enough reflections to constrain the orientation, meaning that the relationship may have existed, but we were unable to detect it here.
We think that we have strong evidence for the presence of the ε-phase in our DAC experiments. Pressure conditions may be comparable to those experienced during meteorite impact which produced ε-Mg2SiO4. Similarities between LH-DAC experiments and impacts can also be seen in the Fe partitioning occurring in the sample. Tomioka et al. [54] found a highly Fe-enriched γ-phase compared to the surrounding α-olivine when investigating the Tenham meteorite. They attributed this partitioning to solid state diffusion from surrounding melt formed in shock veins. Similar Fe partitioning has been seen in LH-DACs [26,30] in the bridgmanite + ferropericlase combination leading to a nearly iron-depleted bridgmanite phase due to Sorret diffusion [61]. It is possible that the phase did exist in previous reported LH-DAC investigations of the Mg2SiO4 system but was buried in the detector noise and primary phases. This study motivates future experiments at these conditions with an aimed attempt at confirming ε-Mg2SiO4 and establish equilibrium P-T conditions.

4. Conclusions

In this work, we present the far-field variant of MGC as a powerful method to track the microstructural evolution of minerals in-situ at high P-T conditions. We illustrated this by compressing a San Carlos olivine sample from ambient conditions to those of the Earth’s transition zone (20 GPa, 1000 °C). We extracted lattice parameters and elastic strain tensors of olivine deformed at room temperature and high pressures as well as monitored the evolving stress state until the occurrence of plastic deformation, where we found evidence for its onset at ~1.5 GPa significantly lower than previously suggested but consistent with pyramidal slip on {hk0}. Upon inducing the αγ phase transition at 1000 °C, we found that γ-ringwoodite forms as a sub-micron sized phase with an average equivalent stress of 3.055 GPa for the grains that were constrained with {100} aligned with the compression direction. We could also extract several Bragg reflections not belonging to β-wadsleyite or γ-ringwoodite but that could be assigned to the orthorhombic ε-phase that was previously observed in shocked meteorites through ex-situ methods.

Author Contributions

B.C. designed the study and performed the experiments and data analysis. M.D. and M.K. assisted in conducting the experiment. M.D., H.-R.W. and M.K. assisted result interpretation and writing the paper. B.C. wrote the paper with feedback and contributions from all co-authors. All authors discussed and interpreted the results. All authors have read and agreed to the published version of the manuscript.

Funding

This work was performed under the auspices of the U.S. Department of Energy by Lawrence Livermore National Laboratory under Contract DE-AC52-07NA27344. This research was supported by NSF (EAR 1343908 and CSEDI-106751) and DOE (DE-FG02-05ER15637). This research used resources of the Advanced Light Source, a U.S. DOE Office of Science User Facility under contract No. DE-AC02-05CH11231. B. Chandler was awarded an ALS doctoral fellowship to advance research using this technique and this research is a part of his PhD thesis.

Data Availability Statement

All data needed to evaluate the conclusions in the paper are present in the paper. All experimental data and processing software are made available upon request.

Acknowledgments

We thank Joel V. Bernier of Lawrence Livermore National Laboratory (LLNL) for making the HEXRD software available and guidance in its use as well as helpful conversations about result analysis along the way. We also thank A. Doran and B. Kalkan of ALS for their technical support. The HEXRD software used in this study is available at https://github.com/HEXRD/hexrd.git, accessed on 5 March 2021.

Conflicts of Interest

The authors claim no conflicts of interest.

References

  1. Cordier, P.; Demouchy, S.; Beausir, B.; Taupin, V.; Barou, F.; Fressengeas, C. Disclinations provide the missing mechanism for deforming olivine-rich rocks in the mantle. Nature 2014, 507, 51–56. [Google Scholar] [CrossRef]
  2. Long, H.; Weidner, D.J.; Li, L.; Chen, J.; Wang, L. Deformation of olivine at subduction zone conditions determined from in situ measurements with synchrotron radiation. Phys. Earth Planet. Int. 2011, 186, 23–35. [Google Scholar] [CrossRef]
  3. Couvy, H.; Frost, D.J.; Heidelbach, F.; Nyilas, K.; Ungar, T.; Mackwell, S.; Cordier, P. Shear deformation experiments of forsterite at 11 GPa—1400 °C in the multianvil apparatus. Eur. J. Min. 2004, 16, 877–889. [Google Scholar] [CrossRef]
  4. Li, L.; Weidner, D.; Raterron, P.; Chen, J.; Vaughan, M. Stress measurements of deforming olivine at high pressure. Phys. Earth Planet. Int. 2004, 143–144, 357–367. [Google Scholar] [CrossRef]
  5. Durham, W.B.; Ricoult, D.L.; Kohlstedt, D.L. Interaction of slip systems in olivine. In Point Defects in Minerals; Schock, R.N., Ed.; American Geophysical Union Monograph 31; AGU: Washington, DC, USA, 1985; pp. 185–193. [Google Scholar]
  6. Hansen, L.N.; Zhao, Y.H.; Zimmerman, M.E.; Kohlstedt, D.L. Protracted fabric evolution in olivine: Implications for the relationship among strain, crystallographic fabric, and seismic anisotropy. Earth Planet. Sci. Lett. 2014, 387, 157–158. [Google Scholar] [CrossRef]
  7. Kohlstedt, D.L.; Goetze, C. Low-stress high-temperature creep in olivine single crystals. J. Geophys. Res. 1974, 79, 2045–2051. [Google Scholar] [CrossRef]
  8. Mainprice, D.; Tommasi, A.; Couvy, H.; Cordier, P.; Frost, D.J. Pressure sensitivity of olivine slip systems and seismic anisotropy of Earth’s upper mantle. Nature 2005, 433, 731–733. [Google Scholar] [CrossRef]
  9. Durinck, J.; Devincre, B.; Kubin, L.; Cordier, P. Modeling the plastic deformation of olivine by dislocation dynamics simulations. Am. Min. 2007, 92, 1346–1357. [Google Scholar] [CrossRef]
  10. Idrissi, H.; Bollinger, C.; Boioli, F.; Schryvers, D.; Cordier, P. Low-temperature plasticity of olivine revisited with in situ TEM nanomechanical testing. Sci. Adv. 2016, 2, e1501671. [Google Scholar] [CrossRef] [PubMed] [Green Version]
  11. Evans, B.; Goetze, C. The temperature variation of hardness of olivine and its implication for polycrystalline yield stress. J. Geophys. Res. Solid Earth 1979, 84, 5505–5524. [Google Scholar] [CrossRef]
  12. Raterron, P.; Wu, Y.; Weidner, D.J.; Chen, J. Low-temperature olivine rheology at high pressure. Phys. Earth Planet. Int. 2004, 145, 149–159. [Google Scholar] [CrossRef]
  13. Proietti, A.; Bystricky, M.; Guignard, J.; Béjina, F.; Crichton, W. Effect of pressure on the strength of olivine at room temperature. Phys. Earth Planet. Int. 2016, 259, 34–44. [Google Scholar] [CrossRef]
  14. Meade, C.; Jeanloz, R. The strength of mantle silicates at high pressures and room temperature: Implications for the viscosity of the mantle. Nature 1990, 348, 533–535. [Google Scholar] [CrossRef]
  15. Ringwood, A.E. Phase Transformations and differentiation in subducted lithosphere: Implications for mantle dynamics, basalt petrogenesis, and crustal evolution. J. Geol. 1982, 90, 611–643. [Google Scholar] [CrossRef]
  16. Chai, M.; Brown, J.M.; Wang, Y. Yield strength, slip systems and deformation induced phase transition of San Carlos olivine up to the transition zone pressure at room temperature. In Properties of Earth and Planetary Materials at High Pressure and Temperature; Manghnani, M.H., Yagi, T., Eds.; American Geophysical Union Monograph 101; AGU: Washington, DC, USA, 1998; pp. 483–493. [Google Scholar]
  17. Fujino, K.; Irifune, T. TEM studies on the olivine to modified spinel transformation in Mg2SiO4. In High-Pressure Research: Application to Earth and Planetary Sciences; Manghani, M.H., Ed.; Manghani, M.H., Ed.; American Geophysical Union Monograph 67; AGU: Washington, DC, USA, 1992; pp. 237–243. [Google Scholar]
  18. Chien-Min, S.; Burns, R.G. Kinetics of high-pressure phase transformations: Implications to the evolution of the olivine → spinel transition in the downgoing lithosphere and its consequences on the dynamics of the mantle. Tectonophysics 1976, 31, 1–32. [Google Scholar] [CrossRef]
  19. Wang, Y.; Guyot, F.; Liebermann, R.C. Electron microscopy of (Mg, Fe)SiO3. Perovskite: Evidence for structural phase transitions and implications for the lower mantle. J. Geophys. Res. Solid Earth 1992, 97, 12327–12347. [Google Scholar] [CrossRef]
  20. Burnley, P.C.; Green, H.W. Stress dependence of the mechanism of the olivine–spinel transformation. Nature 1989, 338, 753–756. [Google Scholar] [CrossRef]
  21. Yamazaki, D.; Yoshino, T.; Nakakuki, T. Interconnection of ferro-periclase controls subducted slab morphology at the top of the lower mantle. Earth Planet. Sci. Lett. 2014, 403, 352–357. [Google Scholar] [CrossRef]
  22. Kasemer, M.; Zepeda-Alarcon, E.; Carson, R.; Dawson, P.; Wenk, H.-R. Deformation heterogeneity and intragrain lattice misorientations in high strength contrast dual-phase bridgmanite/periclase. Acta Mater. 2020, 121, 284–298. [Google Scholar] [CrossRef]
  23. Marquardt, H.; Miyagi, L. Slab stagnation in the shallow lower mantle linked to an increase in mantle viscosity. Nat. Geosci. 2015, 8, 311–314. [Google Scholar] [CrossRef]
  24. Sørensen, H.O.; Schmidt, S.; Wright, J.P.; Vaughan, M.; Techert, S.; Garman, E.F.; Oddershede, J.; Davaasambuu, J.; Paithankar, K.S.; Gundlach, C.; et al. Multigrain crystallography. Z. Krist. 2012, 227, 63–78. [Google Scholar] [CrossRef] [Green Version]
  25. Poulsen, H.F.; Garbe, S.; Lorentzen, T.; Jensen, D.J.; Poulsen, F.W.; Andersen, N.H.; Frello, T.; Feidenhans’l, R.; Graafsma, H. Applications of high-energy synchrotron radiation for structural studies of polycrystalline materials. J. Synch. Radiat. 1997, 4, 147–154. [Google Scholar] [CrossRef]
  26. Chandler, B.; Bernier, J.; Diamond, M.; Kunz, M.; Wenk, H.-R. Exploring microstructures in lower mantle mineral assemblages with synchrotron X-rays. Sci. Adv. 2021, 7, eabd3614. [Google Scholar] [CrossRef]
  27. Rosa, A.D.; Hilairet, N.; Ghosh, S.; Perrillat, J.-P.; Garbarino, G.; Merkel, S. Evolution of grain sizes and orientations during phase transitions in hydrous Mg2SiO4. J. Geophys. Res. Solid Earth. 2016, 121, 7161–7176. [Google Scholar] [CrossRef]
  28. Rosa, A.D.; Hilairet, N.; Ghosh, S.; Garbarino, G.; Jacobs, J.; Perrillat, J.-P.; Vaughan, G.; Merkel, S. In situ monitoring of phase transformation mcrostructures at earth’s mantle pressure and temperature using multi-grain XRD. J. Appl. Cryst. 2015, 48, 1346–1354. [Google Scholar] [CrossRef]
  29. Yuan, H.; Zhang, L. In situ determination of crystal structure and chemistry of minerals at Earth’s deep lower mantle conditions. Mat. Radiat. 2017, 2, 117–128. [Google Scholar] [CrossRef] [Green Version]
  30. Zhang, L.; Meng, Y.; Yang, W.; Wang, L.; Mao, W.L.; Zeng, Q.-S.; Jeong, J.S.; Wagner, A.J.; Mkhoyan, K.A.; Liu, W.; et al. Disproportionation of (Mg,Fe)SiO3 perovskite in Earth’s deep lower mantle. Science 2014, 344, 877–882. [Google Scholar] [CrossRef] [PubMed]
  31. Zhang, L.; Popov, D.; Meng, Y.; Wang, J.; Ji, C.; Li, B.; Mao, H. In-situ crystal structure determination of seifertite SiO2 at 129 GPa: Studying a minor phase near Earth’s core–mantle boundary. Am. Mineral. 2016, 101, 231–234. [Google Scholar] [CrossRef] [Green Version]
  32. Kantor, L.; Prakapenka, V.; Kantor, A.; Dera, P.; Kurnosov, A.; Sinogeikin, S.; Dubrovinskaia, N.; Dubrovinsky, L. BX90: A new diamond anvil cell design for X-ray diffraction and optical measurements. Rev. Sci. Inst. 2012, 83, 125102. [Google Scholar] [CrossRef] [PubMed]
  33. Prescher, C.; Prakapenka, V. DIOPTAS: A program for reduction of two-dimensional X-ray diffraction data and data exploration. High Press. Res. 2015, 35, 223–230. [Google Scholar] [CrossRef]
  34. Knittle, E.; Jeanloz, R. Synthesis and equation of state of (Mg,Fe) SiO3 perovskite to over 100 gigapascals. Science 1987, 235, 668–670. [Google Scholar] [CrossRef]
  35. Kunz, M.; Yan, J.; Cornell, E.; Domning, E.E.; Yen, C.E.; Doran, A.; Beavers, C.M.; Treger, A.; Williams, Q.; MacDowell, A.A. Implementation and application of the peak scaling method for temperature measurement in the laser heated diamond anvil cell. Rev. Sci. Inst. 2018, 89, 083903. [Google Scholar] [CrossRef] [Green Version]
  36. Fei, Y.; Orman, J.V.; Li, J.; Westrenen, W.; van Sanloup, C.; Minarik, W.; Hirose, K.; Komabayashi, T.; Walter, M.; Funakoshi, K. Experimentally determined postspinel transformation boundary in Mg2SiO4 using MgO as an internal pressure standard and its geophysical implications. J. Geophys. Res. 2004, 109. [Google Scholar] [CrossRef] [Green Version]
  37. Bernier, J.V.; Barton, N.R.; Lienert, U.; Miller, M.P. Far-field high-energy diffraction microscopy: A tool for intergranular orientation and strain analysis. J. Strain Anal. Eng. Des. 2011, 46, 527–547. [Google Scholar] [CrossRef]
  38. Bernier, J.V.; Suter, R.M.; Rollett, A.D.; Almer, J.D. High-energy X-ray diffraction microscopy in materials science. Annu. Rev. Mater. Res. 2020, 50, 395–436. [Google Scholar] [CrossRef]
  39. Bachmann, F.; Hielscher, R.; Schaeben, H. Texture analysis with MTEX—Free and open-source software toolbox. Solid State Phenom. 2010, 160, 63–68. [Google Scholar] [CrossRef] [Green Version]
  40. Mainprice, D.; Hielscher, R.; Schaeben, H. Calculating anisotropic physical properties from texture data using the MTEX open-source package. Geo. Soc. Lond. Spec. Publ. 2011, 360, 175–192. [Google Scholar] [CrossRef] [Green Version]
  41. Vinet, N.; Flemming, R.L.; Higgins, M.D. Crystal structure, mosaicity, and strain analysis of Hawaiian olivines using in situ X-ray diffraction. Am. Min. 2011, 96, 486–497. [Google Scholar] [CrossRef]
  42. Mussi, A.; Cordier, P.; Demouchy, S.; Vanmansart, C. Characterization of the glide planes of the [1] screw dislocations in olivine using electron tomography. Phys. Chem. Min. 2014, 41, 537–545. [Google Scholar] [CrossRef] [Green Version]
  43. Wenk, H.-R.; Lutterotti, L.; Kaercher, P.; Kanitpanyacharoen, W.; Miyagi, L.; Vasin, R. Rietveld texture analysis from synchrotron diffraction images. II. Complex multiphase materials and diamond anvil cell experiments. Powder Diffr. 2014, 29, 220–232. [Google Scholar] [CrossRef] [Green Version]
  44. Abramson, E.H.; Brown, J.M.; Slutsky, L.J.; Zaug, J. The elastic constants of San Carlos olivine to 17 GPa. J. Geophys. Res. Solid Earth 1997, 102, 12253–12263. [Google Scholar] [CrossRef]
  45. Liu, A.F. Mechanics and Mechanisms of Fracture: An Introduction; ASM International: Geauga County, OH, USA, 2005. [Google Scholar]
  46. Weidner, D.J.; Wang, Y.; Chen, G.; Ando, J.; Vaughan, M.T. Rheology measurements at high pressure and temperature. In Properties of Earth and Planetary Materials at High Pressure and Temperature; Manghnani, M.H., Yagi, T., Eds.; American Geophysical Union Monograph 101; AGU: Washington, DC, USA, 1998; pp. 473–482. [Google Scholar]
  47. Kumamoto, K.M.; Thom, C.A.; Wallis, D.; Hansen, L.N.; Armstrong, D.E.J.; Warren, J.M.; Goldsby, D.L.; Wilkinson, A.J. Size effects resolve discrepancies in 40 years of work on low-temperature plasticity in olivine. Sci. Adv. 2017, 3, e1701338. [Google Scholar] [CrossRef] [PubMed] [Green Version]
  48. Wu, T.-C.; Bassett, W.A. Measuring deviatoric stress in the diamond anvil cell using two X-ray diffraction geometries. In AIP Conference Proceedings; American Institute of Physics: College Park, MD, USA, 1994; Volume 309, pp. 1625–1628. [Google Scholar] [CrossRef]
  49. Raterron, P.; Chen, J.; Weidner, D.J. A process for low-temperature olivine-spinel transition under quasi-hydrostatic stress. Geophys. Res. Lett. 2002, 29, 36-1–36-4. [Google Scholar] [CrossRef]
  50. Chen, J.; Inoue, T.; Weidner, D.J.; Wu, Y.; Vaughan, M.T. Strength and water weakening of mantle minerals, olivine, wadsleyite and ringwoodite. Geophys. Res. Lett. 1998, 25, 575–578. [Google Scholar] [CrossRef]
  51. Wenk, H.-R.; Ischia, G.; Nishiyama, N.; Wang, Y.; Uchida, T. Texture development and deformation mechanisms in ringwoodite. Phys. Earth Planet. Int. 2005, 152, 191–199. [Google Scholar] [CrossRef]
  52. Madon, M.; Poirier, J.P. Transmission electron microscope observation of α, β and γ (Mg,Fe)2SiO4 in shocked meteorites: Planar defects and polymorphic transitions. Phys. Earth Planet. Int. 1983, 33, 31–44. [Google Scholar] [CrossRef]
  53. Kerschhofer, L.; Sharp, T.G.; Rubie, D.C. Intracrystalline transformation of olivine to wadsleyite and ringwoodite under subduction zone conditions. Science 1996, 274, 79–81. [Google Scholar] [CrossRef]
  54. Tomioka, N.; Okuchi, T. A new high-pressure form of Mg2SiO4 highlighting diffusionless phase transitions of olivine. Sci. Rep. 2017, 7, 17351. [Google Scholar] [CrossRef]
  55. Tomioka, N.; Okuchi, T.; Miyahara, M.; Iitaka, T.; Purevjav, N.; Tani, R.; Kodama, Y. Topotaxial Intergrowths of Epsilon-(Mg,Fe)2SiO4 in Wadsleyite and Ringwoodite in Shocked Chondrites. In Proceedings of the 82nd Annual Meeting of The Meteoritical Society, Sapporo, Japan, 7–12 July 2019; p. 6007, No. 2157. [Google Scholar]
  56. Spencer, L.J. The Tenham (Queensland) meteoritic shower of 1879 (With Plates XIV–XVII). Min. Mag. J. Min. Soc. 1937, 24, 437–452. [Google Scholar] [CrossRef]
  57. Holland, T.J.B.; Redfern, S.A.T. Unit cell refinement from powder diffraction data: The use of regression diagnostics. Min. Mag. 1997, 61, 65–77. [Google Scholar] [CrossRef]
  58. Zha, C.; Duffy, T.S.; Downs, R.T.; Mao, H.; Hemley, R.J. Brillouin scattering and X-ray diffraction of San Carlos olivine: Direct pressure determination to 32 GPa. Earth Planet. Sci. Lett. 1998, 159, 25–33. [Google Scholar] [CrossRef]
  59. Horiuchi, H.; Sawamoto, H. β-Mg2SiO4: Single-crystal X-ray diffraction study. Am. Mineral. 1981, 66, 568–575. [Google Scholar]
  60. Sasaki, S.; Prewitt, C.T.; Sato, Y.; Ito, E. Single-crystal x ray study of γ Mg2SiO4. J. Geophys. Res. Solid Earth 1982, 87, 7829–7832. [Google Scholar] [CrossRef]
  61. Tyrrell, H.J.V.; College, R. Thermal diffusion potentials and the Soret effect. Nature 1954, 173, 264–265. [Google Scholar] [CrossRef]
Figure 1. Experimental configuration used in MGC with diffraction source (blue sphere) irradiated and rotated through a range δω. The various frames of reference (f.o.r) are also shown: lab frame (Xl), sample frame (Xs), detector frame (Xd), crystal lattice frame (Xc) that is described by 3D (x,y,z) coordinates as well as the 3D (2θ, η, ω) angular coordinate system, and the detector tilt angles (Xtilt).
Minerals 11 00424 g001
Figure 2. Pressure-temperature phase diagram for the Mg2SiO4 (based on [36]) system showing experiment path with increasing pressure (horizontal black line), increasing temperature (vertical black line), and decreasing pressure + quenching (red dashed line). Blue circles represent data collection points with increasing pressure, while the red triangle shows the final data collection point after decompression. The star represents P-T location during laser heating for 1 h.
Minerals 11 00424 g002
Figure 3. (Right) Aggregate diffraction image of NIST ruby sphere collected over 320° [−100, 220°] in ω (Middle) Reference 2θ values (green lines) for selected Ghkl with initial 2θ tolerances (dashed yellow) applied globally to the image set. (Top Left) Measured intensities falling within the specified tolerances are used for orientation space segmentation and initial candidate grain identification. Here, the tolerances for (113), (006), (110), (104), and (012) are shown with visualized Bragg reflections for (113), (110), (104), and (012) in these azimuthal segments (Top Left, Middle).
Minerals 11 00424 g003
Figure 4. (Left) Comparison of predicted (blue circle) to measured (red x) spot locations for the NIST ruby sphere used for 3D detector calibration. (Right) Histograms showing deviation of measured diffraction spot locations compared to reference lattice predictions on the 2D detector face in the angular coordinate system (2θ, η, ω) described in Figure 1. Average deviation shown in top left corner.
Minerals 11 00424 g004
Figure 5. (a) Diffraction image collected on Pilatus 3s 1M detector of olivine sample over a range of 20° during a 60 s constant exposure showing paired diffraction intensities (asterism) (inset in (a)) due to two unique olivine grains/sub-domains. (b) The aggregate diffraction image consisting of 480 images taken over 60° in 0.125° increments obtained at the same location as in (a) with diffuse Debye rings emanating from the steel gasket are also identified with arrows. Notice near continuous intensity rings in (b) due to diffraction from the Fe gasket material in contact with the beam during DAC rotation, which are marked an arrow and “Fe”. (c) All assigned Q for both identified olivine grains. (d) Variations in predicted Ghkl to observed Q locations shown as histograms with average values shown in the upper left corner of each.
Minerals 11 00424 g005
Figure 6. (a) Equal area upper hemisphere pole figures of the crystallographic axes in both identified olivine orientations depicted by blue dots. Notice the tight two spot cluster indicating two unique orientations compared to Figure 5a–c. The Xs direction in the sample frame is to the right with Zs coincident with the DAC compression direction out of the page (depicted in the lower left). (b) A polyhedral rendering of the olivine structure in the identified orientation with direct lattice vectors (a–c) in bottom right.
Minerals 11 00424 g006
Figure 7. (a) Pressure evolution within the DAC (center) and diffraction peak morphology for the (112), (222), (122), (131), and (130) olivine peaks (outer boxes). Pressures obtained via BARF (red) and EOS (black) as well as grain elastic stress (blue) are included. Pressure recorded from the EOS and BARF online ruby system as well as the calculated mean equivalent stress is shown in select pressure steps in outer boxes. Inset shows two identified grain centroids (green circles with size scaled by number of assigned reflections) within the 100 μm diameter sample chamber (grey structure). Increasing asterism (a new third discernable intensity centroid) is seen in (122) and (222) reflections with increasing pressure and the onset of plastic deformation in step 7 at 1.25 GPa. (b) The evolution of mosaicity of Bragg reflections observed during increasing pressure in diffraction images (shown in outer boxes steps 2–7): 1 depicts an undeformed crystal giving rise to a single reflection (orange arrow), 2–3 depict increased lattice flexure and visible subdomains due to inhomogeneous deformation, and 4–5 indicate reflection streaking where previously discrete peaks (orange arrows) blend into a larger peak (orange box) as pressure is increased.
Minerals 11 00424 g007
Figure 8. (a) Diffraction pattern showing plastic deformation in olivine at room temperature and a compression of 20 GPa. (b) Diffraction pattern after heating sample between 800–1000 °C for 1 h at a pressure of 20 GPa. {331}γ,{220}γ and {400}γ family of peaks are labeled for γ-ringwoodite as well as the {110} emanating from the steel gasket which overlaps with the {400}γ. (c) Resulting indexation for both γ-ringwoodite (blue) and the possible ε-phase (red).
Minerals 11 00424 g008
Figure 9. Crystal structures of the Mg2SiO4 spineloids (β, ε) and spinel (γ) modified from [53] showing the relation of each crystal structure based on the orientation of the basic unit structure (Top).
Minerals 11 00424 g009
Figure 10. Olivine starting orientations (top row); ε-phase (middle row); and resulting γ-ringwoodite orientations (bottom row) shown as equal area projection pole figures. Sample coordinates are shown to the left with the DAC compression axis into the page (ZS) (center of pole figure).
Minerals 11 00424 g010
Table 2. Miller indices, and d-spacings assigned to a single ε grain.
hkld-Spacing (Å)
10−32.497
00−41.958
−21−12.115
3−1−11.569
00−61.387
40−21.350
0032.785
−1032.486
1−122.153
−1−141.596
Publisher’s Note: MDPI stays neutral with regard to jurisdictional claims in published maps and institutional affiliations.

