
Reactive Transport Simulation of Low-pH Cement Interacting with Opalinus Clay Using a Dual Porosity Electrostatic Model


Institute of Geological Sciences, University of Bern, CH-3012 Bern, Switzerland
*
Author to whom correspondence should be addressed.
Minerals 2021, 11(7), 664; https://0-doi-org.brum.beds.ac.uk/10.3390/min11070664
Submission received: 27 April 2021
/
Revised: 14 June 2021
/
Accepted: 18 June 2021
/
Published: 22 June 2021
(This article belongs to the Special Issue Clay Mineral Transformations after Bentonite/Clayrocks and Heater/Water Interactions from Lab and Large-Scale Tests)
Abstract
:Strong chemical gradients between clay and concrete porewater lead to diffusive transport across the interface and subsequent mineral reactions in both materials. These reactions may influence clay properties such as swelling behaviour, permeability or radionuclide retention, which are relevant for the safety of a radioactive waste repository. Different cement types lead to different interactions with Opalinus Clay (OPA), which must be understood to choose the most suitable material. The consideration of anion-depleted porosity due to electrostatic repulsion in clay modelling substantially influences overall diffusive transport and pore clogging at interfaces. The identical dual porosity model approach previously used to predict interaction between Portland cement and OPA is now applied to low-alkali cement—OPA interaction. The predictions are compared with corresponding samples from the cement-clay interaction (CI) experiment in the Mont Terri underground rock laboratory (Switzerland). Predicted decalcification of the cement at the interface (depletion of C–S–H and absence of ettringite within 1 mm from the interface), the Mg enrichment in clay and cement close to the interface (neoformation of up to 17 vol% Mg hydroxides in concrete, and up to 6 vol% in OPA within 0.6 mm at the interface), and the slightly increased S content in the cement 3–4 mm away from the interface qualitatively match the sample characterisation. Simulations of Portland cement—OPA interaction indicate a weaker chemical disturbance over a larger distance compared with low-pH cement—OPA. In the latter case, local changes in porosity are stronger and lead to predicted pore clogging.
1. Introduction
Deep geological repository designs include cementitious materials for structural elements, backfill or waste matrix. While mineralogy in Opalinus Clay (OPA) has proven stability for the last 170 million years, cementitious minerals are subject to deterioration; hence, concrete infrastructure has a typical service life between 50 and 100 years.
Chemical gradients between porewaters of cement and contrasting materials cause diffusive fluxes of dissolved species. In case of cement—clay interfaces, this may lead to mineralogical alterations, which in turn are expected to locally influence important barrier properties like permeability, swelling pressure or specific retention.
Experimental literature documents chemical and mineralogical changes at clay—cement interfaces [1,2,3,4,5,6,7,8,9,10]. Local decalcification (instability of portlandite, calcium silicate hydrate (C–S–H), and ettringite) is the main alteration of the cement. The resulting Ca depletion within a thin layer down to 0.2 mm can be measured by element mapping with various techniques, but mineralogical characterisation with such high spatial resolutions is still demanding [1]. Even more challenging is the characterisation of the measured Mg enrichments at the interface: the most likely neoformation, nano-crystalline magnesium silicate hydrate (M–S–H), shows no distinct reflections in X-ray diffraction [11]. Mg X-ray absorption near-edge spectroscopy reveal a crystallographic structure similar to certain clay minerals [12,13], which impedes M–S–H detection within OPA by this technique. The location and Mg content of the Mg-enriched layer in OPA depend on the nature of the cement [14]. Other interactions between cement and OPA result in carbonation in the cement and a sulphate enrichment detached from the interface, and the change of the exchanger population in OPA [6]. Reactive transport model approaches predict such changes [11,14,15,16,17,18,19], but studies rarely compare modelling results with experimental data. Of value are modelling studies comparing different cement types interacting with clay under similar conditions to contribute to the engineering design of a repository.
Changes in porosity, its distribution and connectivity—and therefore also permeability—near such interfaces are important processes governing the long-term physicochemical evolution of the engineered barrier and its geological near-field [17]. Increasing porosity in the Portland cement close to the interface, and clogging in the claystone adjacent to it are experimentally observed and commonly predicted by reactive transport modelling [15,16,17]. These studies all use a simplified porosity concept and do not account for the clay-specific influence of clay layer charge on the porewater solute distribution and on diffusive transport.
Dual porosity reactive transport modelling can take into account such clay-specific features, and this may be crucial when modelled porosity clogging approaches zero-porosity. Jenni, Gimmi, Alt–Epping, Mäder and Cloet [14] describe a novel dual porosity approach, simulate the short-term evolution of Portland cement concrete (OPC) in contact with OPA, and compare the results with experimental data from the CI experiment (Cement-clay Interaction) carried out in the Mont Terri rock laboratory (www.mont-terri.ch). The current study repeated the simulation but exchanged the OPC concrete with a low-alkali cement concrete (ESDRED, named after the European project “Engineering Studies and Demonstrations of Repository Designs” 2004–2008, which included the development of this concrete formulation). Both types of concrete were installed in the CI experiment, and their interfaces were sampled and characterised several times after emplacement. The simulation outcome was compared with element maps of the appropriate interface sample, and with the outcome of the previous OPC-OPA model.
2. Materials and Methods
The multicomponent reactive transport modelling was performed in 1D with the FLOTRAN code [20] in the same way the OPC—OPA interaction was modelled [14,19]. These publications contain further details, especially on the dual porosity approach used for the OPA part of the model, which is summarised in Section 2.2. Advection is negligible in these types of clay host systems. Site-specific transport studies on undisturbed OPA state diffusion-dominated transport [21]. Small hydraulic heads in the OPA close to the repository are expected, which lead to Peclet numbers in the range of 10−2 to 10−3 [22]. Glaciations or tunnel convergence might increase the importance of advection only temporarily. Therefore, only diffusion and electrochemical migration were included in this model approach.
Comparable reactive transport simulations considering electrostatic effects on the solutes were carried out by using CrunchFlowMC and PhreeqC. Alt–Epping, et al. [23] compare the capabilities of these codes with respect to dual porosity. Results of OPC—OPA interface simulations with these codes have been presented in Jenni, et al. [24].
2.1. Modelling of the Concrete Domain
Diffusive transport followed by reactions between concrete and clay rock start when the freshly-mixed cement slurry is applied to a clay rock surface. Substantial interactions between the materials are likely to occur during the early stage of cement hydration. Therefore, the initial condition of the simulation should consist of unhydrated cement clinker and water. Initial conditions with hardened cement are appropriate in case of pre-cast elements brought in contact with clay, and should not be used to simulate shotcrete applications.
Concrete properties used in the model (e.g., aggregate content, ESDRED cement composition) matched the concrete used in the Mont Terri CI experiment (Table 1, taken from Jenni, Mäder, Lerouge, Gaboreau and Schwyn [6]). The concrete aggregates were considered as non-porous and were included in the initial condition because they lowered total diffusive transport. The low specific surface areas and reaction rates of the aggregate minerals suggested treating them as inert for the limited time-scale of the model, in contrast to reactive clinker phases and nanosilica.
Within the cement, a geometric factor (ratio of constrictivity/tortuosity) of G = 0.1 was chosen, following arguments in Jenni, Gimmi, Alt-Epping, Mäder and Cloet [14].
The clinker dissolution rates mainly control the overall cement hydration kinetics, and the formation of hydrates is generally considered to be instantaneous [25,26]. Here, all cement hydrates formed with a fast rate constant of 10−3 mol/m3/s and a generic surface area of 0.01 m2/g (rate law described in [27,28]). Two combined dissolution rates per mineral (Table 2) were derived by a best-fit of clinker and silica fume dissolution data, measured by quantitative XRD on reference samples of the same cement [29]. The two rates were implemented by incorporating two reacting versions of the same mineral. Reaction rates of potentially forming non-cement hydrates were taken from Palandri and Kharaka [30] (generic surface area of 0.1 m2/g). Thermodynamic data was taken from the Cemdata07.2 [26,31,32,33,34,35,36] and EQ3/6 databases. More details about clinker composition, solid solutions of hydrates, and phase reactions are given in [14].
The set accelerator added to the ESDRED concrete leads to a formate content of more than 0.2 M in the early porewater, slightly decreasing with time [29]. In the initial condition of the model, 0.2 M formate, charge-balanced by Ca, was added to the pure water to account for this substantial anionic charge.
2.2. Dual Porosity Modelling of Opalinus Clay
Opalinus Clay was modeled in the exact same manner as described in Jenni, Gimmi, Alt-Epping, Mäder and Cloet [14], that contains further explanations and figures. Rock composition (Table 3) and porewater chemistry data were taken from Berner, et al. [38], based on measured and modelled data [39,40,41]. Thermodynamic data was taken from EQ3/6, except for chlorite (7 Å chamosite), K-feldspar, and albite, which were treated as inert. Too many reactive minerals in the simulation violate the phase rule, and no equilibrium initial condition can be achieved. Pyrophyllite represented the TOT layer of smectite, considered as inert due to the small extent of reaction to be expected within the time-scale of the model. Reaction rates for all reactive minerals were taken from Palandri and Kharaka [30].
In OPA, 6 vol% of 12 vol% total pores contains porewater with cations balancing the negative charge of the clay layers. This porosity consists of the water in the clay interlayer plus the water on clay outer particle surfaces (often called diffuse double layer). Because both of these porewater domains are similarly influenced by the negative charge of the clay layers, the sum of the domains was implemented in the model, and is called Donnan porewater (and Donnan porosity). Its homogeneous chemical composition was calculated by assuming Donnan equilibrium with the remaining fraction of the porewater, which is here referred to as freely accessible porewater, free porewater in short (contained in the free porosity). Donnan equilibrium assumes a homogeneous composition of the Donnan porewater (averaging a Poisson-Boltzmann distribution), and equal activity coefficients in both porosity domains [14]. The code inhibited mineral precipitation in the Donnan porosity, and all minerals kinetically equilibrated with the free porewater. Thermodynamically, mineral phases at saturation had equal chemical potentials in both domains, despite the depletion of anions (compensated by an electrostatic potential term). The restricted space in the interlayer was assumed to inhibit nucleation. Chagneau, et al. [42] give experimental evidence for mineral precipitation in the free porosity only in compacted clay. This implies that the Donnan porosity was not clogged and always provides a pathway for mainly neutral species and cations that diffuse while maintaining charge balance (by considering streaming potentials in multi-component transport). The model approach presented here can handle this type of transport [14].
In a Donnan porosity concept, Donnan equilibrium between the Donnan porewater and the free porewater replaces conventional cation exchange. An electrostatic term dependent on ionic strength and the mean potential governs the Donnan equilibrium. In CrunchflowMC or PhreeqC [23,43,44,45,46,47], this is implemented by an explicit partitioning function that distributes aqueous species between Donnan and free porewater. In the present FLOTRAN approach, the ion partitioning resulted from rapid diffusion and electrochemical migration between the free and Donnan porewater. The cation exchange capacity (CEC) was represented by immobile anions in the Donnan porewater. Technical implementation details are given in [14]. The geometric factor (G = constrictivity/tortuosity) in the free porosity was set to 0.023, and to 0.006 in the Donnan porosity (derived from diffusion experiments in OPA [14]).
The Donnan porosity was not linked to a specific clay mineral in the current approach, and the total ion charge in the Donnan porewater balanced the bulk CEC of OPA. Dissolution or precipitation of clay minerals did not decrease or increase the CEC or the Donnan porosity as they should. This simplification is acceptable, because the clay minerals are virtually stable on the time-scale of the model presented here (rate constant <10−13 mol/m2/s after [30]).
3. Results and Discussion
3.1. Model Predictions of Low-pH Cement—Opalinus Clay Interaction
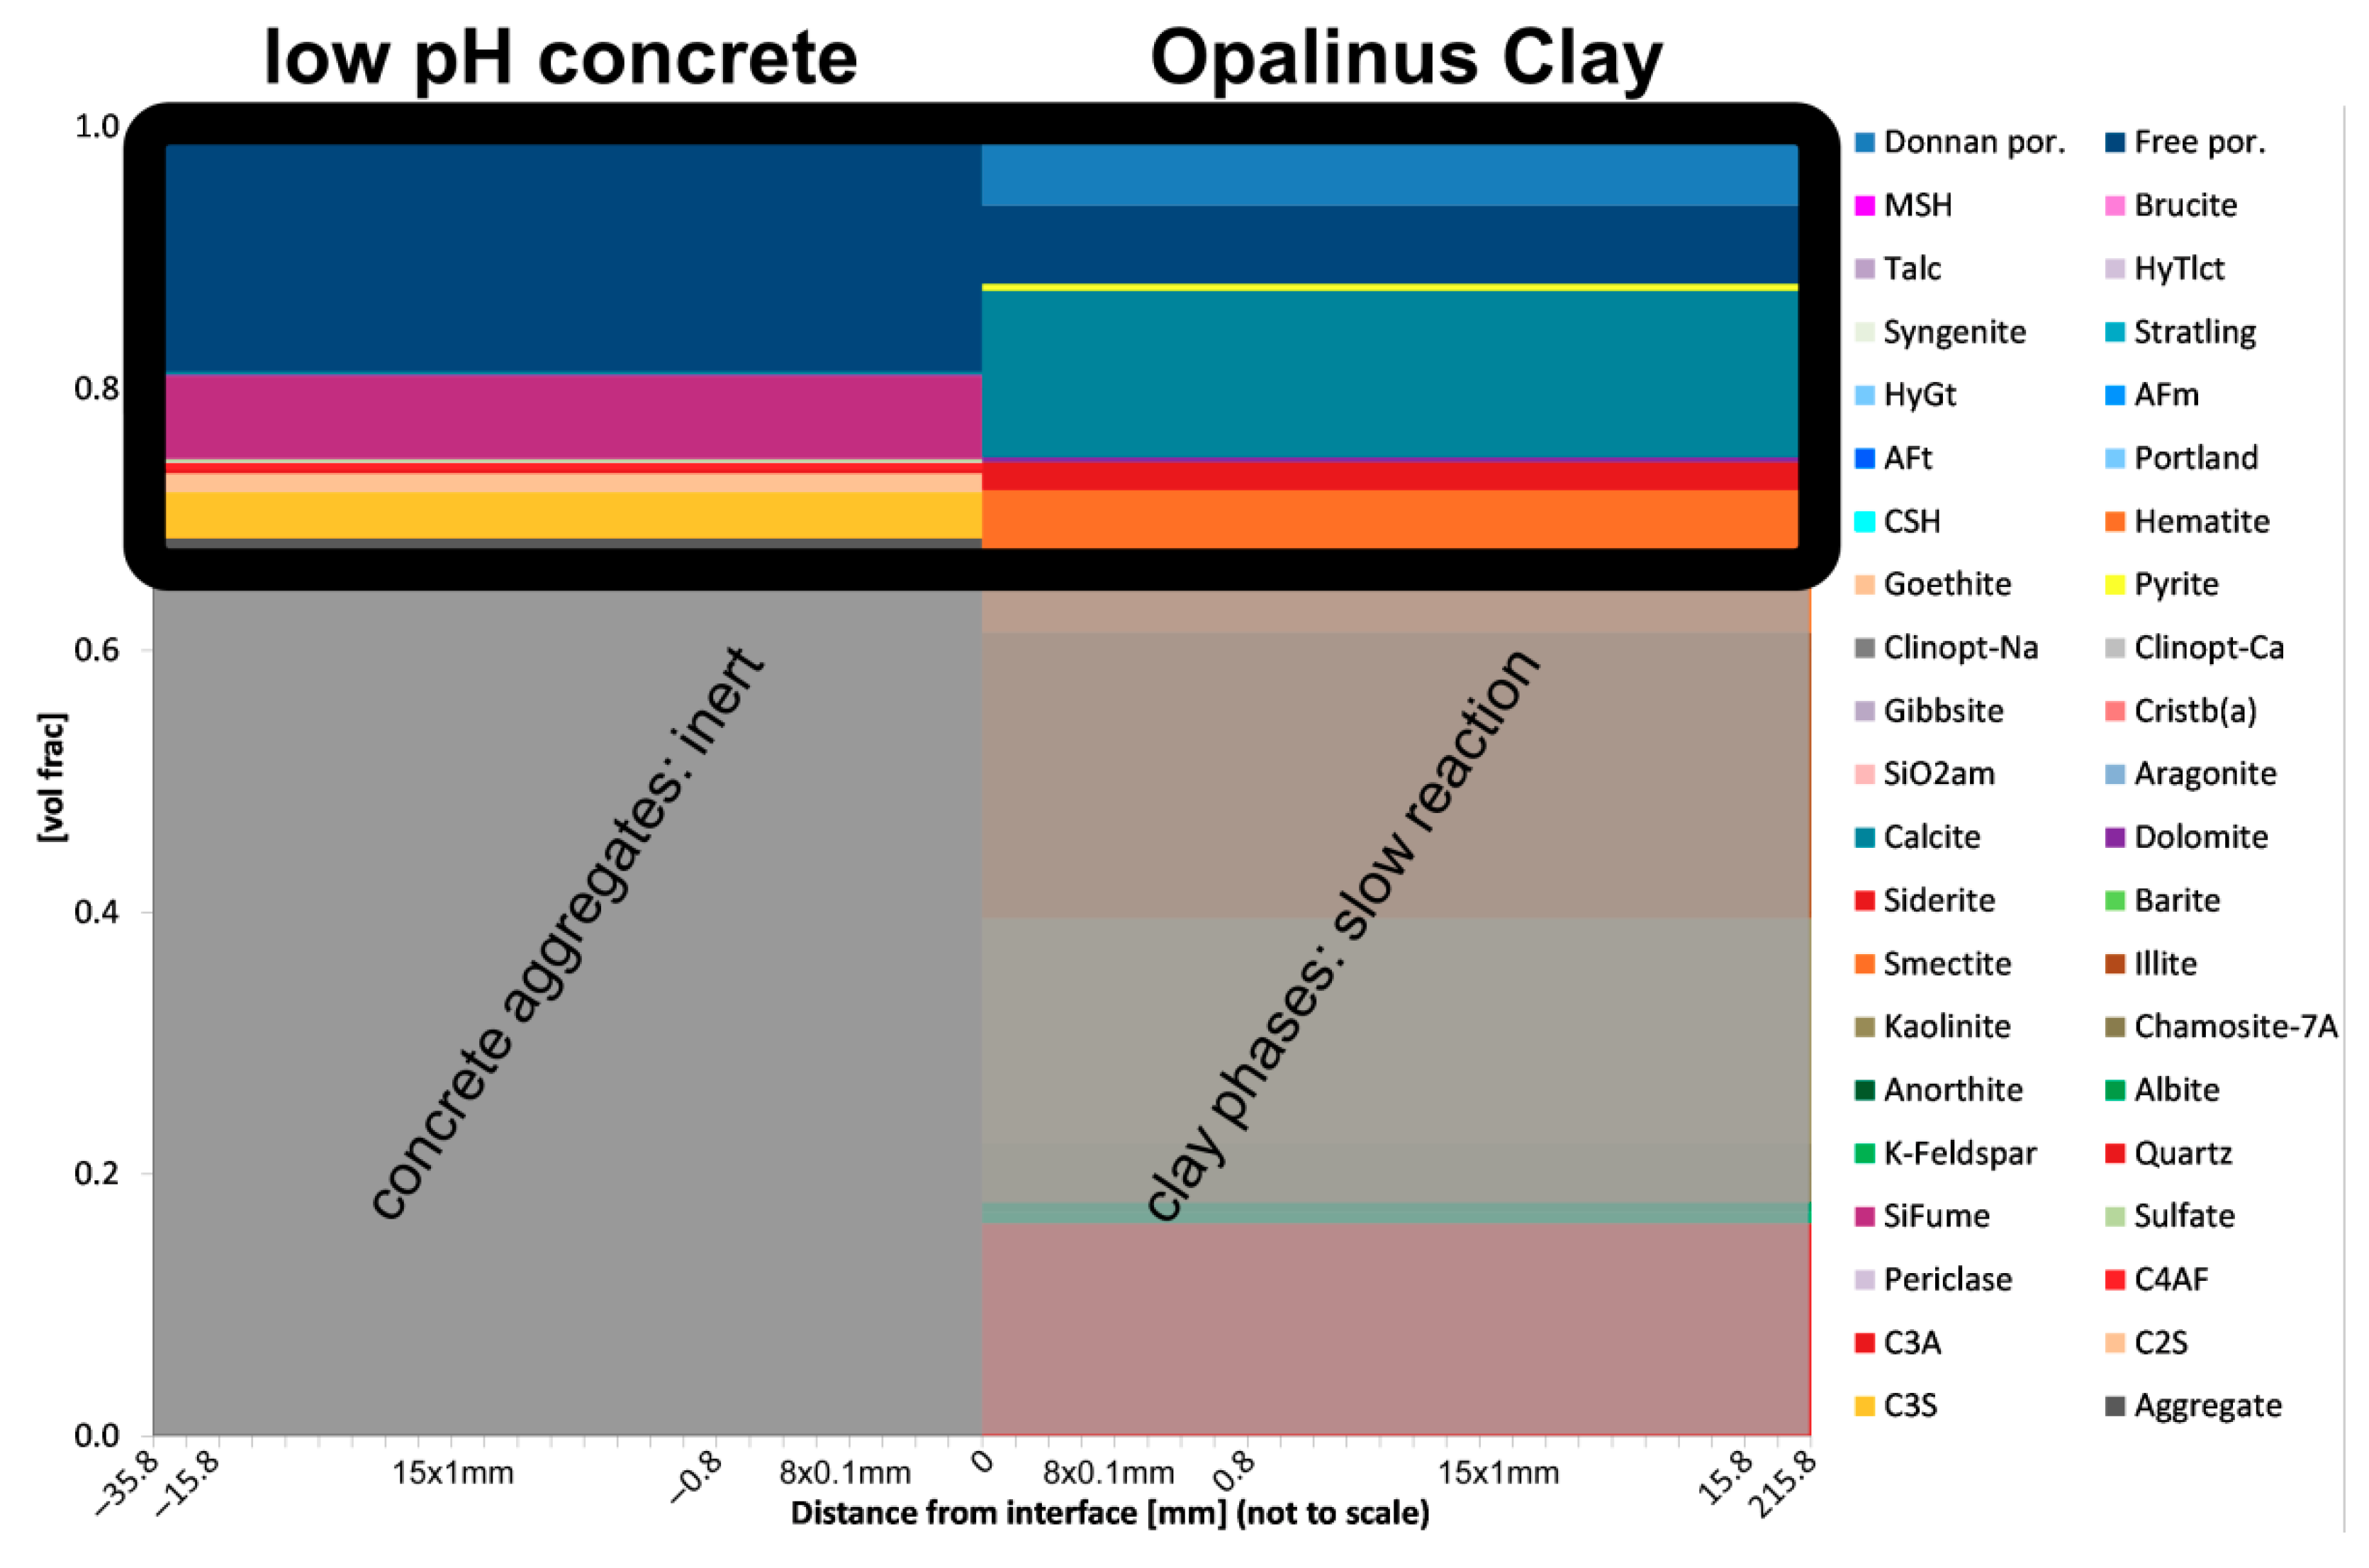
The initial conditions of the unhydrated ESDRED cement matrix consisted of pure water with Ca-formate (accelerator) in the free porewater, which was undersaturated with respect to the cement clinkers (Figure 1). The OPA free porewater was in chemical equilibrium with the reactive OPA minerals as well as in Donnan equilibrium with the Donnan porewater. This initial condition describes the fresh (unhydrated), well-mixed concrete right after casting into the borehole drilled into OPA (start of the Mont Terri CI experiment), or by analogy a shotcrete just applied to a tunnel wall for stabilisation within a repository.
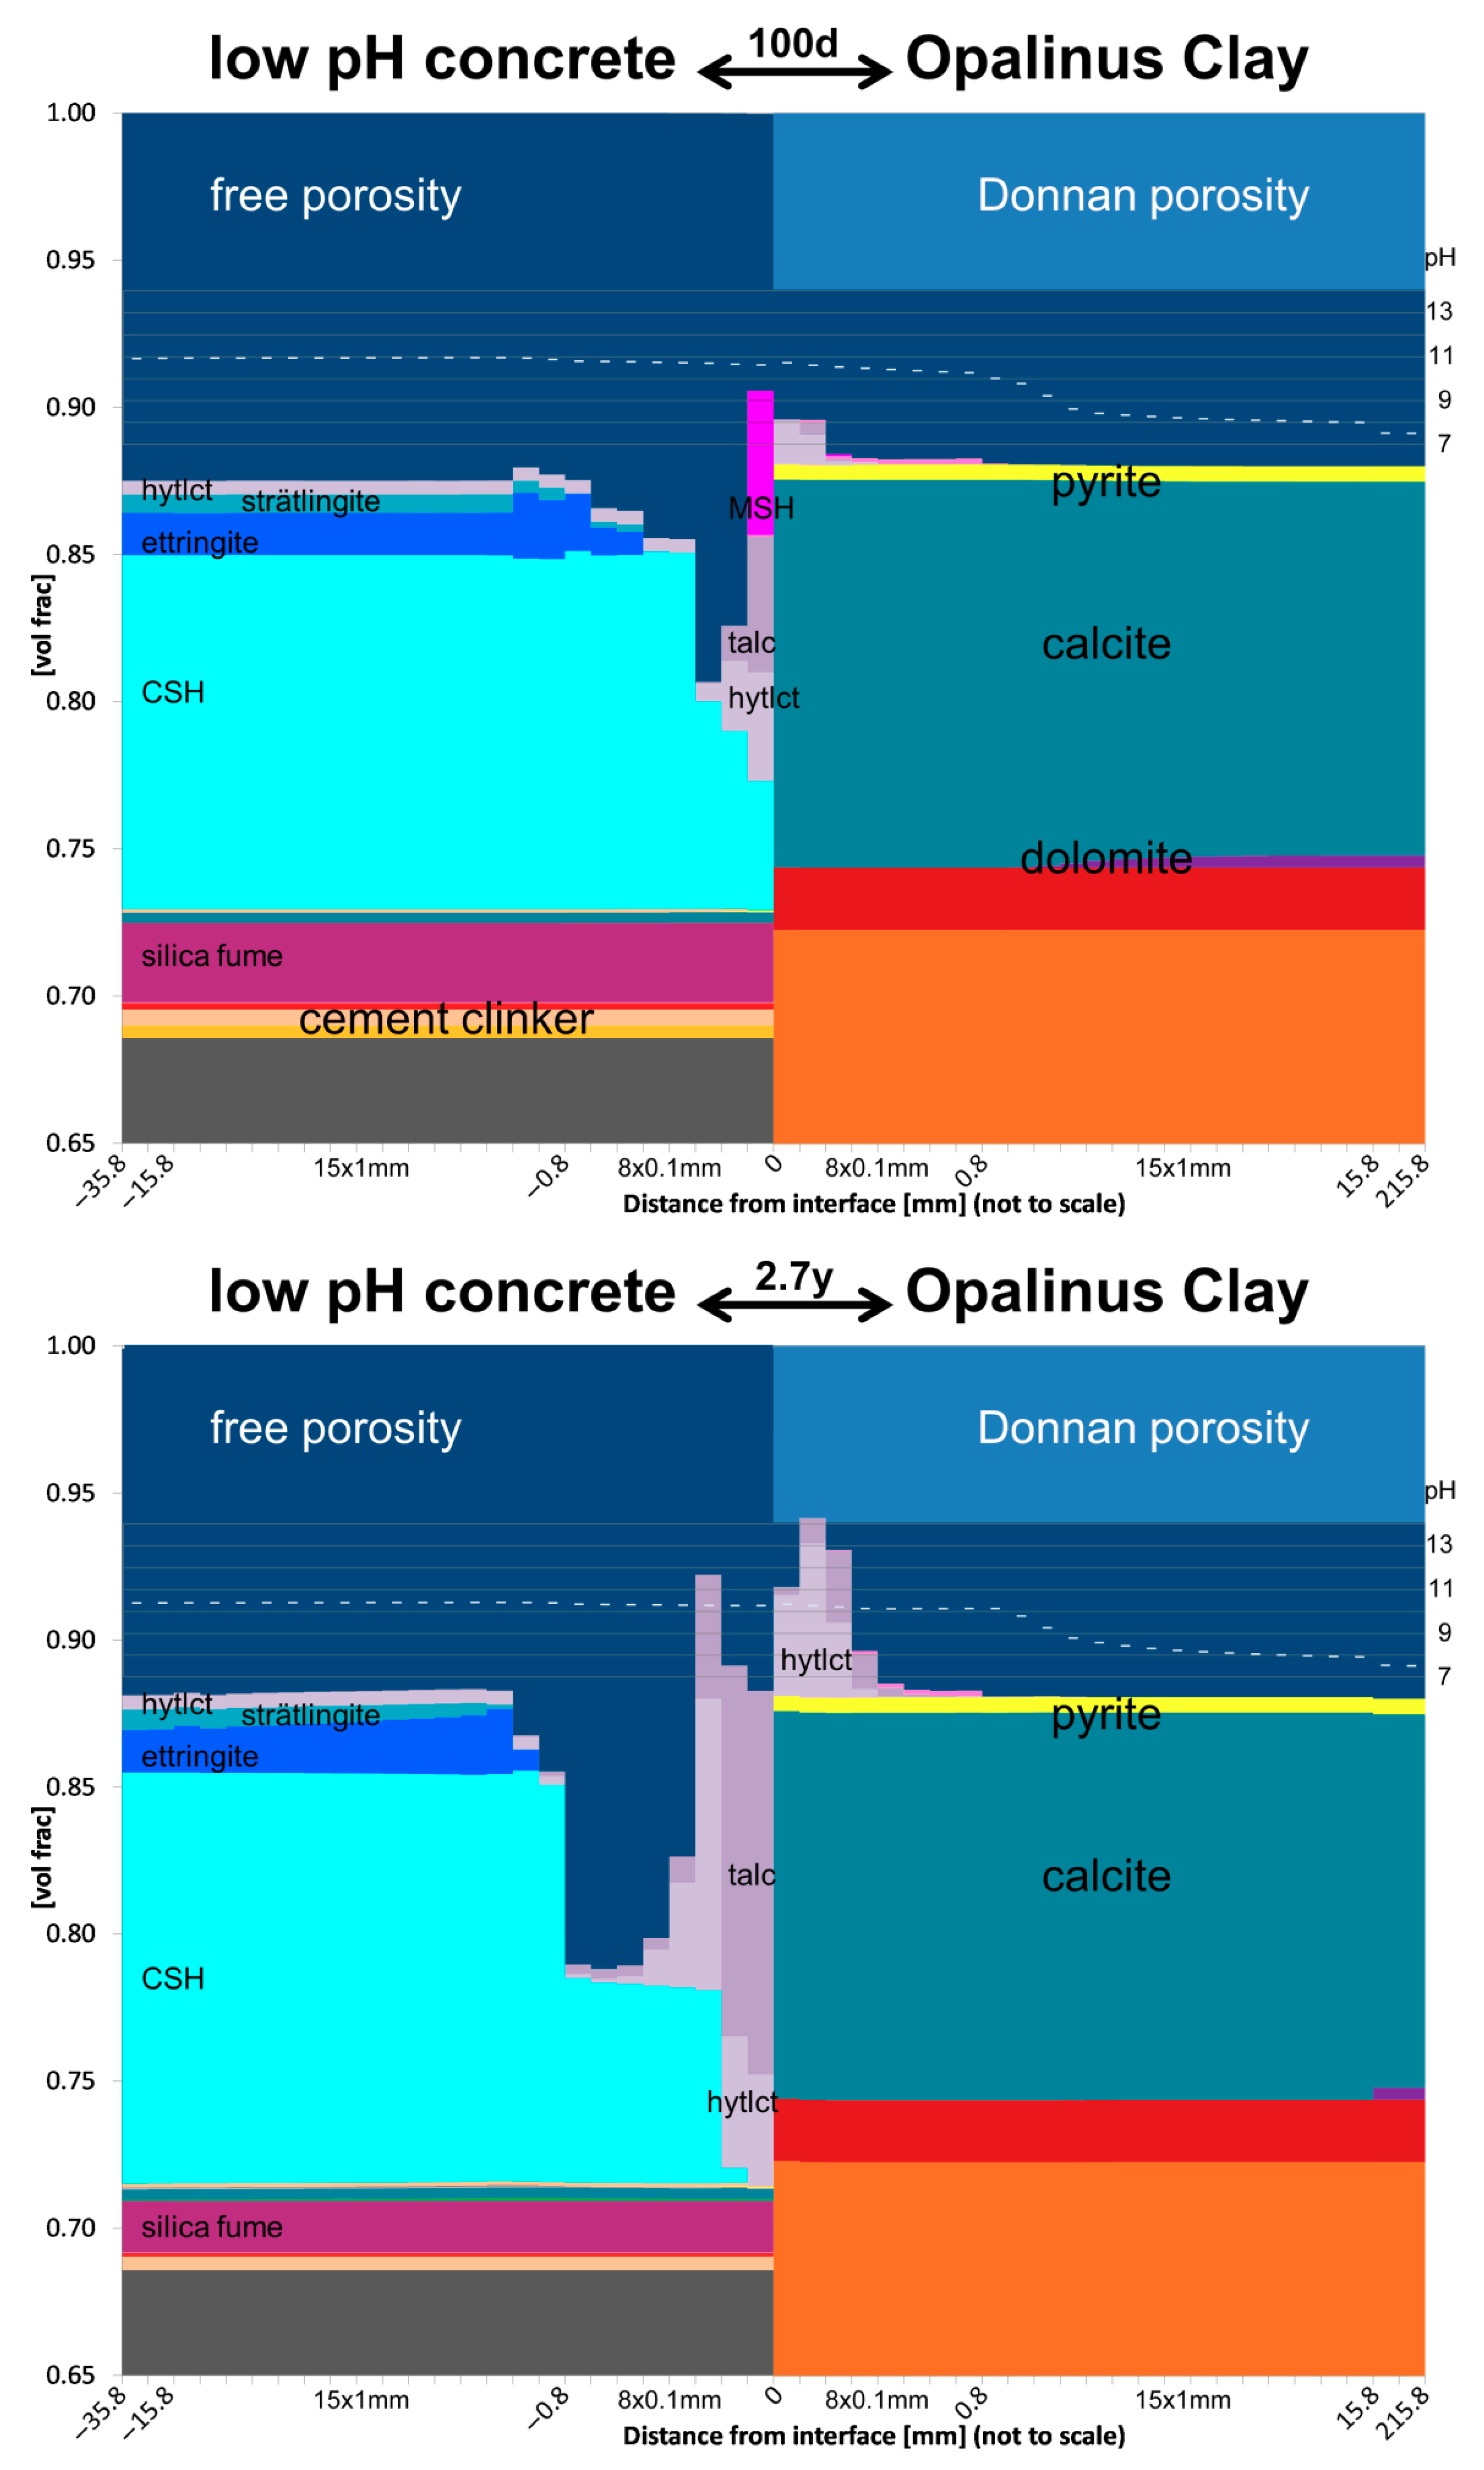
Comparably fast dissolution of clinkers and silica fume led to the precipitation of mainly C–S–H and ettringite (Figure 2). The high Si content and lower pH in the porewater compared to OPC suppressed portlandite formation and favoured low Ca/Si C–S–H, which is the main difference compared with Portland cements [49]. During the dissolution of the clinker phases, Ca and OH species diffused directly into the OPA due to the concentration gradient. At the same time, some OPA porewater species diffused into the concrete. At the interface, the pore solution in ESDRED was slightly lower in pH and dissolved Ca, which led to the instability of C–S–H and ettringite. In turn, Mg diffusing in from OPA porewater led to precipitation of Mg-phases.
Over time, the model predicted the precipitation of hydrotalcite in the unaffected ESDRED due to a slow dissolution of MgO associated with clinker, as predicted in [29]. However, hydrotalcite was not observed experimentally as a hydration product of ESDRED (same reference). In the present approach, hydrotalcite might have been more stable due to a overpredicted availability of Al in the pore solution that might be consumed in reality by Al uptake by C–S–H [50] and by M–S–H [51].
At the interface, hydrotalcite, M–S–H and/or talc precipitated. M–S–H is described in literature as a hydrated nano-crystalline precursor of phyllosilicates like talc or Mg-smectite [52], and therefore the presence of talc in the database inhibited the precipitation of early M–S–H due to its precursor character, i.e., M–S–H is a less stable phase compared to talc. Predictions of the nature of the Mg precipitates are uncertain due to uncertainties in thermodynamic data for Mg (Si-) hydroxides. The formation of a specific Mg (Si-) hydroxide depends on local pH and Mg, Ca, Al, and Si concentrations. Regardless of its nature, the Mg (Si-) hydroxides precipitated within the Ca-depleted zone of the cement, and could partly compensate the additional pore space available due to C–S–H dissolution. Availability of Mg from OPA, the Mg content in the cement, and the capability of the OPA to lower the pH in the cement determined the extent to which the porosity in the cement at the interface could be clogged. The model prediction clearly shows that Mg (Si-) hydroxides have the highest potential to clog the porosity in the cement at the interface.
Calcite formed in the cement with ongoing in-diffusion of inorganic carbon species from OPA. Transport was fast enough to carbonate the entire cement domain, but only resulted in calcite contents below 1 vol% due to the limited reservoir in the OPA porewater. Therefore, carbonation reduced porosity and transport insignificantly according to this model prediction.
From the very beginning of interaction, the high-pH front entered the OPA, where it was buffered by dissolution of clay minerals. Only negligible volumes of dissolving clay were required to efficiently buffer pH, but the limiting factor was the slow reaction kinetics relative to the OH diffusion. Two scenarios were calculated using the slow reaction rates in Palandri and Kharaka [30], and the increased rates (four orders of magnitude) proposed by Marty, et al. [53]. Figure 3 shows a more advanced high-pH front in case of slower reaction rates, whereas the faster clay reactivity hindered the pH front more efficiently from entering the OPA.
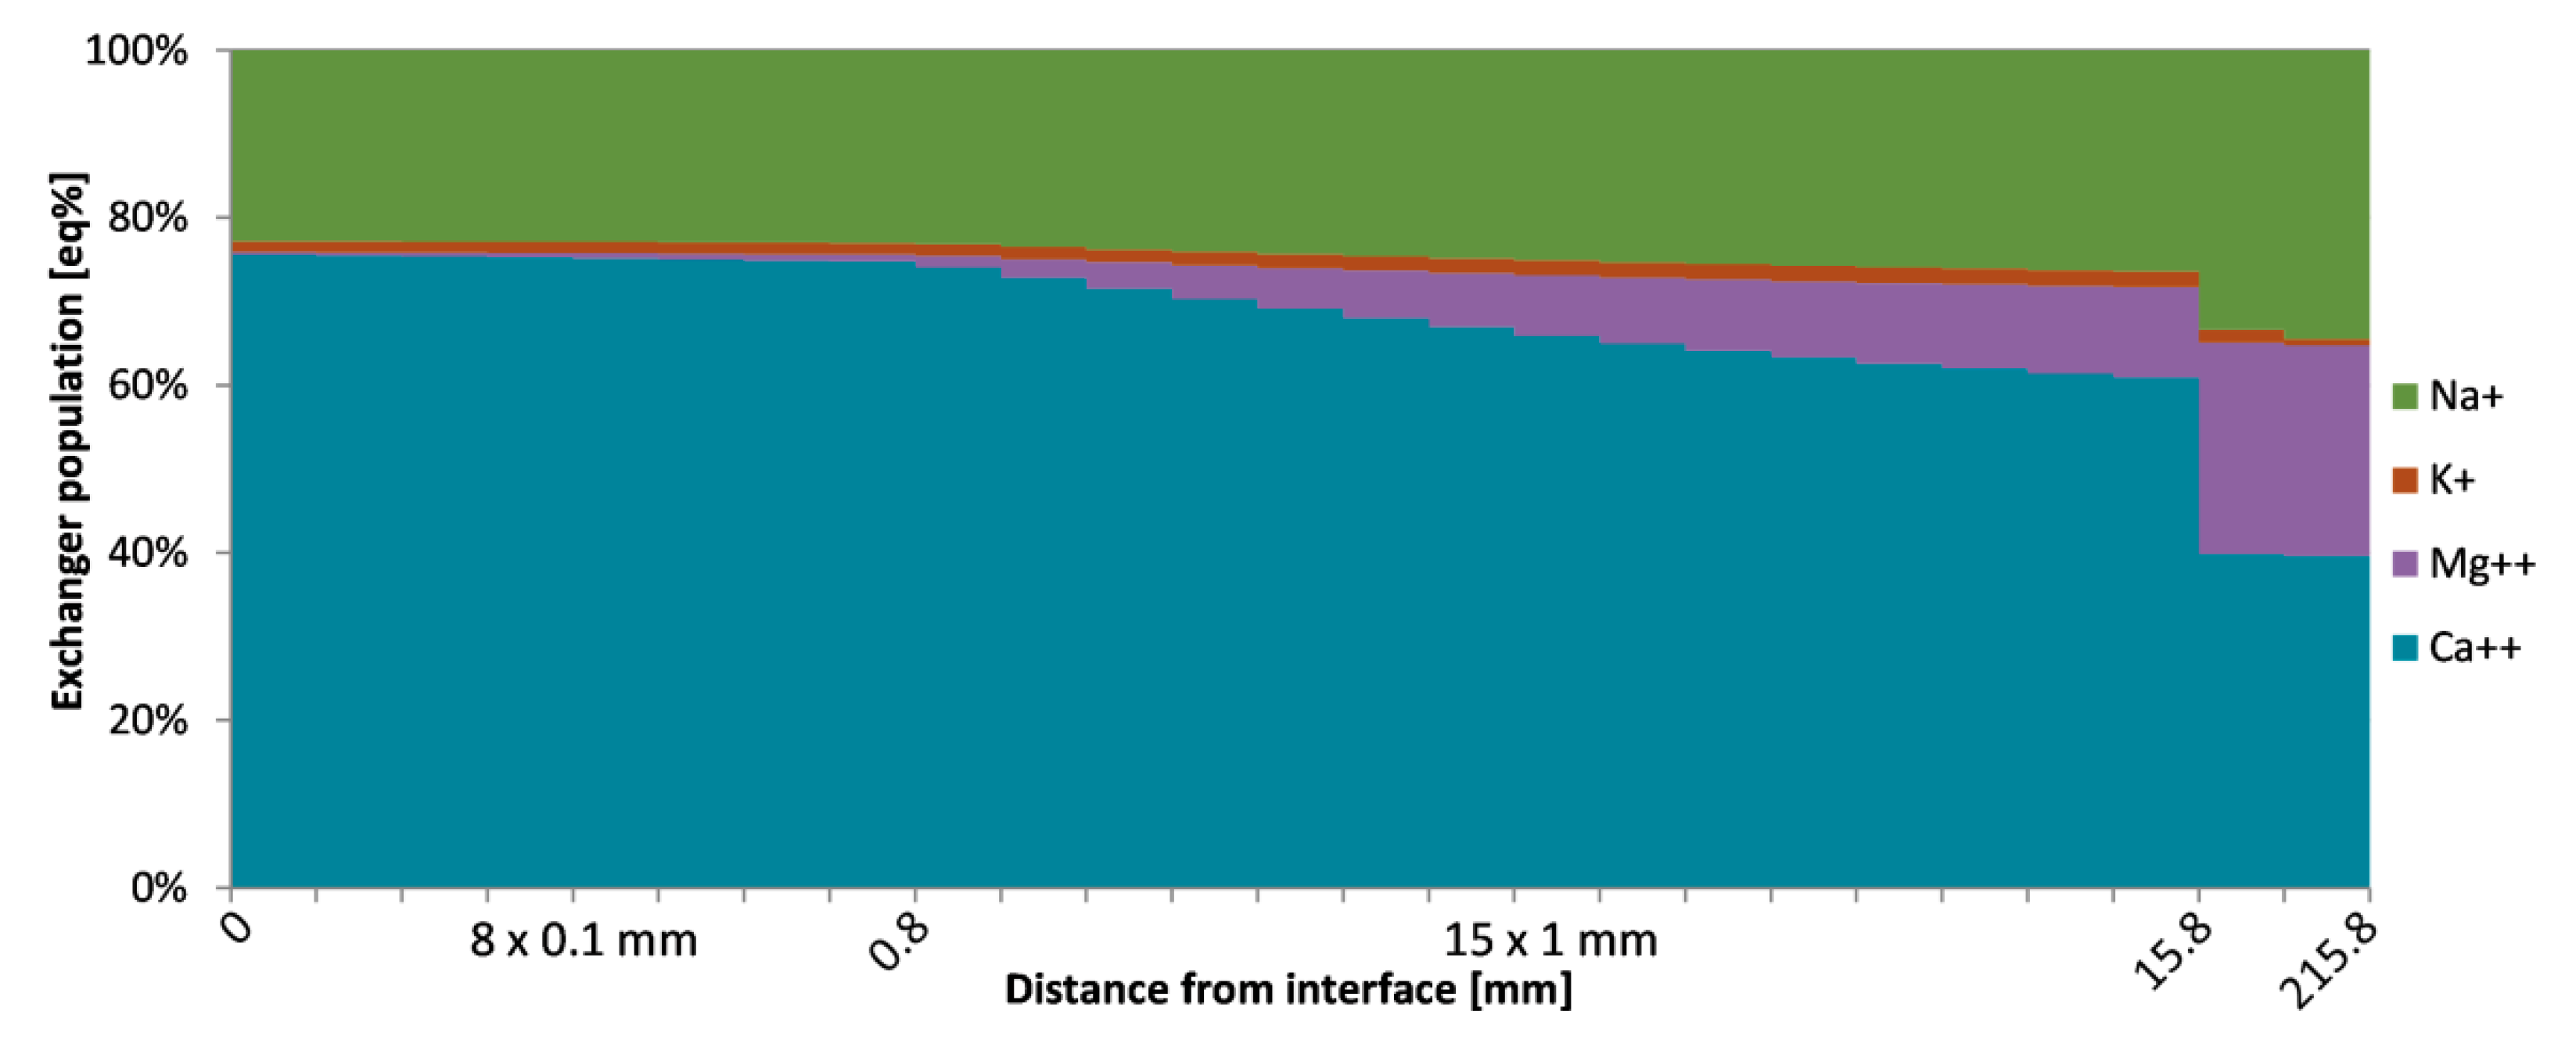
Following a strong concentration gradient, Mg migrated into the cement. The decreasing Mg in the OPA free porewater is buffered by the large Mg content in the Donnan porosity (equivalent to the clay exchangeable cations). The high mobility of the cations in the Donnan porosity led to a depletion of Mg up to 15 mm into the OPA within 2.7 y, compensated mainly by Ca (Figure 4), originating from the instability of mainly C–S–H at the interface (decalcification of the cement). The predicted dissolution of the minor dolomite content in the OPA contributed to a smaller extent to the Mg supply. The freed Ca and carbonate species were bound in newly formed calcite, but were also released to the OPA porewater.
Mg-hydroxides also formed in the OPA at the interface within a layer of increased pH. Between 100 d and 2.7 y, the free porosity became completely clogged, but the model was set up in a way that transport between the free porewater in the cement and the Donnan porewater in the OPA could continue (Section 2.2). However, anion mobility across the interface was extremely low due to the low anion concentration in the Donnan porosity. In turn, neutral species (e.g., water tracer) and cations still migrated considerably across the interface, as proposed in Jenni, Gimmi, Alt-Epping, Mäder and Cloet [14], and by a diffusion experiment with a fully clogged illite core [42]. A single porosity model approach cannot predict this ongoing interaction across an interface clogged on the clay side of an interface.
3.2. Comparison of Low-pH and Portland Cement Interactions with Opalinus Clay
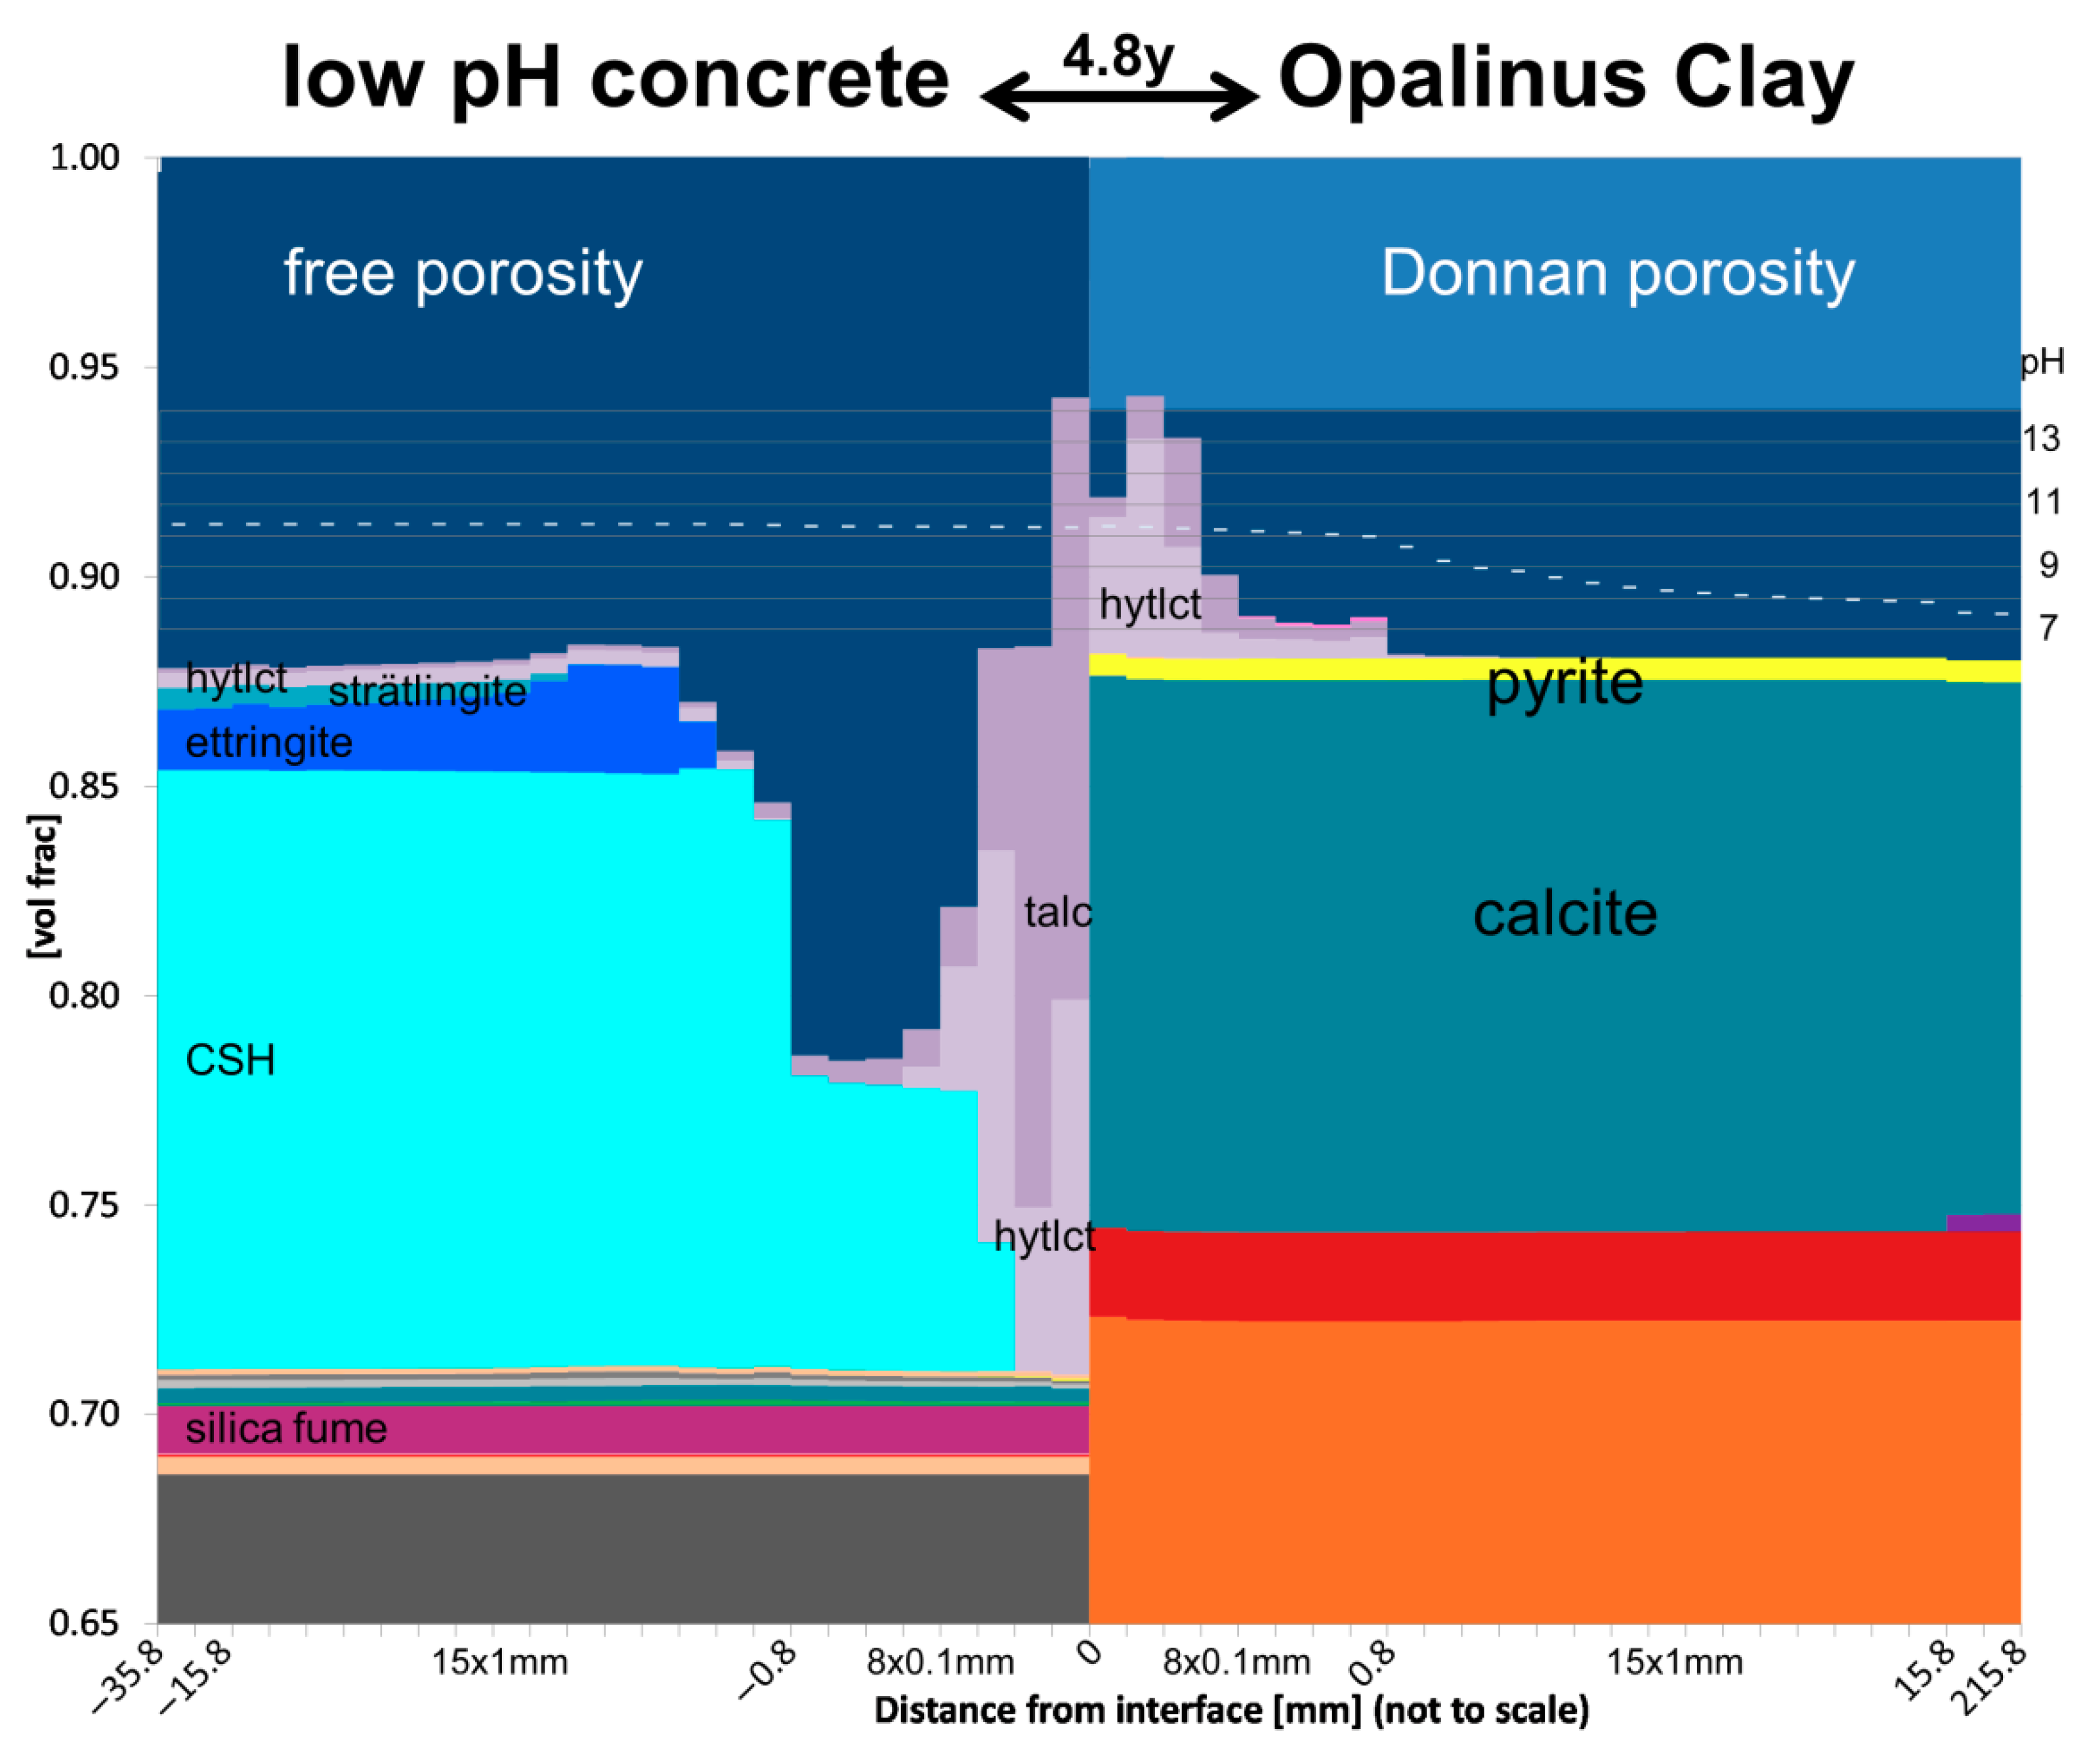
The modelling of the ESDRED low-pH cement interaction with Opalinus Clay predicted an early clogging of the free porosity on the clay-side, which led to a substantial decrease of the interaction rates: phase distributions after 4.8 y of interaction resemble the 2.7 y old interface, and the penetration of the pH front virtually stopped (Figure 5). In contrast, the porosity at the OPC-OPA interface was only predicted to minimally clog after 4.8 y [14]. In both predictions, OPA initial conditions and transport models are equal. The main difference is the presence of rapidly dissolving silica fume and the formate as additional anion charge carrier in the ESDRED, leading to a lower pH and an increased Si content in the porewater compared to OPC.
3.3. Comparison of Model Predictions with Measurements
Quantitative agreement of the model predictions with measurements is not perfect but shares essential communalities. It must be kept in mind that significant local variability exists across samples of equivalent interfaces in terms of amount of neoformations and extent of interaction zones. The qualitative agreement of measurements on both ESDRED—OPA and OPC—OPA interfaces with predicted interaction is striking. Both simulations predicted decalcification and depletion in sulphur in the cement at the interface (portlandite, C–S–H, and ettringite dissolution) in agreement with chemical maps (Figure 6 and [14]). Whereas a substantial Mg enrichment was measured in ESDRED and in adjacent OPA only close to the interface, OPC—OPA interfaces showed no or very limited Mg increase at the interface, but a small detached enrichment at approximately 7 mm distance from the interface in the OPA (Figure 7). These cement-specific features were predicted by both simulations: the Mg-mineral hydrotalcite occured in both ESDRED and OPA right at the interface, but in OPC—OPA, brucite (very high in Mg) occurred distant from the interface (further details given in [14]). Both models also suggested that the Mg enrichments in the OPA traced the high-pH fronts, which reached different positions in the two interfaces (Figure 5). The exact identity of the Mg-phase is under investigation [1,12].
4. Conclusions
Several uncertainties of this modelling approach limit a quantitative prediction of the evolution at the cement—clay interface, especially for extended interaction times to hundreds or thousands of years. Transport parameters, especially geometric factors in the free and Donnan porosities, are not well known and large errors may arise from a simple estimation from OPA diffusion experiments. Clay dissolution rates given in literature differ significantly, but strongly influence the interaction model outcome: the relationship between transport, e.g., migration of the pH-front, and rates of mineral dissolution, e.g., buffering pH, determine the extent of cement—clay interaction. An additional crucial uncertainty is the degree to which the free porosity can be clogged. Further, assuming a minimal remaining free porosity, as strongly suspected in the concrete, leads to considerable interaction within thousands of years. In contrast, full clogging of the total porosity in the concrete at the interface (implemented in the model by allowing precipitations up to zero porosity) would completely stop cement-clay interaction. Such conceptual questions cannot be answered by modelling studies, but require long-term transport experiments, whose outcome can then be used to conceptualise the models.
It is striking that the predicted extent of alteration in terms of overall mass transfer in case of the ESDRED (“low-pH cement”) was in fact larger than that in the OPC case after a given time, e.g., 4.7 y (Figure 5). This was predicted despite that the mobility of solutes across the interface became restricted due to clogging of free porosity in case of the low-alkali cement. Only the penetration of the high-pH front into the claystone was more extensive in the OPC case, but it was associated with smaller mineral mass transfers. In the ESDRED, the decrease of Ca-containing hydrates at the interface was higher than in OPC. More dissolved Ca may have diffused from ESDRED into the OPA and exchanged with Mg, which precipitated within the narrow high-pH zone. The clogging of OPA’s free porosity could not stop this cation exchange, because it could continue via the Donnan porosity. In contrast, OH− was mainly present in the free porosity and its diffusion was therefore affected by free porosity clogging. In the OPA in contact with OPC, the Mg neoformations distributed over a far wider high-pH zone and clogged only a small porosity fraction.
A supposedly higher inherent reactivity of OPC compared to low-alkali cementitious products due to its contrasting initial pH has motivated implementers to reduce, substitute or omit OPC in some repository designs for radioactive waste. If our model indeed captured the key reactive processes, a more extensive alteration at OPC-claystone interfaces may not be expected, and thus this a priori assumption is incorrect and should not be a decisive issue. A similar conclusion was reached [2] simply by comparing the extents of alteration based on highly-resolved element maps and other methods (similar to Figure 6 and Figure 7), and this despite a significantly larger water/cement ratio of 0.8 in OPC compared to 0.5 in the ESDRED cement. Based on the extensive characterisation and modelling of interfaces from the Mont Terri CI experiment reacted for up to 10 years, the high-pH front coming from OPC enters deeper into the OPA compared with the ESDRED high-pH front. In turn, the volumes of dissolved cement and neoformations are larger at the ESDRED-OPA interface. Simplified numerical simulations of Portland cement—clay interaction run for longer times [17,38,54] predicted clogging after considerably longer interactions than 10 years. This suggests that both high-pH and low-pH cements will clog eventually. The expected difference in clogging time might be crucial if the buffer resaturation requires water transport across a clay-cement interface.
Author Contributions
Conceptualization, A.J. and U.M.; methodology, A.J.; software, A.J.; validation, A.J. and U.M.; formal analysis, A.J. and U.M.; investigation, A.J. and U.M.; resources, A.J. and U.M.; data curation, A.J.; writing—original draft preparation, A.J.; writing—review and editing, A.J. and U.M.; visualization, A.J.; supervision, U.M.; project administration, A.J. and U.M.; funding acquisition, A.J. and U.M. All authors have read and agreed to the published version of the manuscript.
Funding
This research was partially funded by the Mont Terri Consortium.
Data Availability Statement
The data presented in this study are available on request from the corresponding author. The data are not publicly available due to technical reasons.
Acknowledgments
Peter Alt-Epping and Thomas Gimmi are acknowledged for their modifications of FLOTRAN. The Mont Terri Consortium via the CI Experiment group (ANDRA, CRIEPI, FANC, IRSN, Nagra, NWMO, Obayashi, RWM, SCK-CEN) provided funding for sampling campaigns and sample characterisation, as well as partial funding for this modeling study. The paper was improved by the internal review of Ellina Bernard.
Conflicts of Interest
The authors declare no conflict of interest.
References
- Bernard, E.; Jenni, A.; Fisch, M.; Grolimund, D.; Mäder, U. Micro-X-ray diffraction and chemical mapping of aged interfaces between cement pastes and Opalinus Clay. Appl. Geochem. 2020, 115, 104538. [Google Scholar] [CrossRef]
- Mäder, U.; Jenni, A.; Lerouge, C.; Gaboreau, S.; Miyoshi, S.; Kimura, Y.; Cloet, V.; Fukaya, M.; Claret, F.; Otake, T.; et al. 5-year chemico-physical evolution of concrete–claystone interfaces, Mont Terri rock laboratory (Switzerland). Swiss J. Geosci. 2017, 1–21. [Google Scholar] [CrossRef] [Green Version]
- Idiart, A.; Laviña, M.; Kosakowski, G.; Cochepin, B.; Meeussen, J.C.L.; Samper, J.; Mon, A.; Montoya, V.; Munier, I.; Poonoosamy, J.; et al. Reactive transport modelling of a low-pH concrete/clay interface. Appl. Geochem. 2020, 115, 104562. [Google Scholar] [CrossRef]
- Lerouge, C.; Gaboreau, S.; Grangeon, S.; Claret, F.; Warmont, F.; Jenni, A.; Cloet, V.; Mäder, U. In situ interactions between Opalinus Clay and Low Alkali Concrete. Phys. Chem. Earth Parts A/B/C 2017, 99, 3–21. [Google Scholar] [CrossRef]
- Fisch, M.; Jenni, A.; Mäder, U.; Grolimund, D.; Cloet, V. CI Experiment: Micro-XRD Studies on 3.2-Year-Old Interfaces between Opalinus Clay and OPC and ESDRED Mortar (3rd Sampling Campaign 2015); TN 2016-73; Mont Terri Project: St. Ursanne, Switzerland, 2017. [Google Scholar]
- Jenni, A.; Mäder, U.; Lerouge, C.; Gaboreau, S.; Schwyn, B. In situ interaction between different concretes and Opalinus Clay. Phys. Chem. Earth Parts A/B/C 2014, 70–71, 71–83. [Google Scholar] [CrossRef] [Green Version]
- Dauzères, A.; Le Bescop, P.; Sardini, P.; Coumes, C.C.D. Physico-chemical investigation of clayey/cement-based materials interaction in the context of geological waste disposal: Experimental approach and results. Cem. Concr. Res. 2010, 40, 1327–1340. [Google Scholar] [CrossRef]
- Read, D.; Glasser, F.P.; Ayora, C.; Guardiola, M.T.; Sneyers, A. Mineralogical and microstructural changes accompanying the interaction of Boom Clay with ordinary Portland cement. Adv. Cem. Res. 2001, 13, 175–183. [Google Scholar] [CrossRef]
- Tinseau, E.; Bartier, D.; Hassouta, L.; Devol-Brown, I.; Stammose, D. Mineralogical characterization of the Tournemire argillite after in situ interaction with concretes. Waste Manag. 2006, 26, 789–800. [Google Scholar] [CrossRef] [PubMed]
- Gaboreau, S.; Prêt, D.; Tinseau, E.; Claret, F.; Pellegrini, D.; Stammose, D. 15 years of in situ cement-argillite interaction from Tournemire URL: Characterisation of the multi-scale spatial heterogeneities of pore space evolution. Appl. Geochem. 2011, 26, 2159–2171. [Google Scholar] [CrossRef]
- Dauzères, A.; Achiedo, G.; Nied, D.; Bernard, E.; Alahrache, S.; Lothenbach, B. Magnesium perturbation in low-pH concretes placed in clayey environment—solid characterizations and modeling. Cem. Concr. Res. 2016, 79, 137–150. [Google Scholar] [CrossRef]
- Vespa, M.; Borca, C.; Huthwelker, T.; Lothenbach, B.; Dähn, R.; Wieland, E. Structural characterisation of magnesium (sodium) aluminium silicate hydrate (M-(N)-A-S-H) phases by X-ray absorption near-edge spectroscopy. Appl. Geochem. 2020, 123, 104750. [Google Scholar] [CrossRef]
- Vespa, M.; Lothenbach, B.; Dähn, R.; Huthwelker, T.; Wieland, E. Characterisation of magnesium silicate hydrate phases (M–S–H): A combined approach using synchrotron-based absorption-spectroscopy and ab initio calculations. Cem. Concr. Res. 2018, 109, 175–183. [Google Scholar] [CrossRef]
- Jenni, A.; Gimmi, T.; Alt-Epping, P.; Mäder, U.; Cloet, V. Interaction of ordinary Portland cement and Opalinus Clay: Dual porosity modelling compared to experimental data. Phys. Chem. Earth Parts A/B/C 2017, 99, 22–37. [Google Scholar] [CrossRef] [Green Version]
- Marty, N.C.M.; Tournassat, C.; Burnol, A.; Giffaut, E.; Gaucher, E.C. Influence of reaction kinetics and mesh refinement on the numerical modelling of concrete/clay interactions. J. Hydrol. 2009, 364, 58–72. [Google Scholar] [CrossRef]
- De Windt, L.; Marsal, F.; Tinseau, E.; Pellegrini, D. Reactive transport modeling of geochemical interactions at a concrete/argillite interface, Tournemire site (France). Phys. Chem. Earth 2008, 33, S295–S305. [Google Scholar] [CrossRef]
- Kosakowski, G.; Berner, U. The evolution of clay rock/cement interfaces in a cementitious repository for low- and intermediate level radioactive waste. Phys. Chem. Earth 2013, 64, 65–86. [Google Scholar] [CrossRef]
- Jenni, A.; Mäder, U. Reactive transport modelling of cement-clay interaction accounting for electrostatic effects in the clay. In Proceedings of the Mechanisms and Modelling of Waste/Cement Interactions, Karlsruhe, Germany, 25 March 2019. [Google Scholar]
- Jenni, A.; Gimmi, T.; Alt-Epping, P.; Mäder, U. CI Experiment: Interaction of Ordinary Portland Cement and Opalinus Clay: Dual Porosity Modelling Compared to Experimental Data; TN 2015-99; Mont Terri Project: St. Ursanne, Switzerland, 2016. [Google Scholar]
- Lichtner, P.C. FLOTRAN User’s Manual Version 2.0: LA-CC 02-036; Los Alamos National Laboratory: Los Alamos, NM, USA, 2007. [Google Scholar]
- Beauhheim, R.L. Hydraulic Conductivity and Head Distributions in the Host Rock Formations of the Proposed Siting Regions; Nagra Arbeitsbericht NAB: Wettingen, Switzerland, 2013. [Google Scholar]
- Kosakowski, G. Time-Dependent Flow and Transport Calculations for Project Opalinus Clay; Nagra Arbeitsbericht NAB: Wettingen, Switzerland, 2004. [Google Scholar]
- Alt-Epping, P.; Tournassat, C.; Rasouli, P.; Steefel, C.I.; Mayer, K.U.; Jenni, A.; Mäder, U.; Sengor, S.S.; Fernández, R. Benchmark reactive transport simulations of a column experiment in compacted bentonite with multispecies diffusion and explicit treatment of electrostatic effects. Comput. Geosci. 2015, 1–16. [Google Scholar] [CrossRef]
- Jenni, A.; Mäder, U.; Wieland, E.; Lerouge, C.; Gaboreau, S. Concrete-clay interaction: Give-and-take without a loser? In Proceedings of the 6th Meeting on Clays in Natural and Engineered Barrier for Radioactive Waste Confinement, Brussels, Belgium, 25 March 2015.
- Parrot, L.J.; Killoh, D.C. Prediction of Cement Hydration; British Ceramic Society: Stoke-on-Trent, UK, 1984; pp. 41–53. [Google Scholar]
- Lothenbach, B.; Winnefeld, F. Thermodynamic modelling of the hydration of Portland cement. Cem. Concr. Res. 2006, 36, 209–226. [Google Scholar] [CrossRef]
- Lasaga, A.C. Transition state theory. Rev. Mineral. Geochem. 1981, 8, 135–168. [Google Scholar]
- Lasaga, A.C. Chemical kinetics of water-rock interactions. J. Geophys. Res. 1984, 89, 4009–4025. [Google Scholar] [CrossRef]
- Lothenbach, B.; Rentsch, D.; Wieland, E. Hydration of a silica fume blended low-alkali shotcrete cement. Phys. Chem. Earth Parts A/B/C 2014, 70–71, 3–16. [Google Scholar] [CrossRef]
- Palandri, J.L.; Kharaka, Y.K. A Compilation of Rate Parameters of Water-Mineral Interaction Kinetics for Application to Geochemical Modeling; U.S. Geological Survey: Washington, WA, USA, 2004. [Google Scholar]
- Babushkin, V.I.; Matveyev, G.M.; Mchedlov-Petrossyan, O.P. Thermodynamics of Silicates; Springer: Berlin, Germany, 1985. [Google Scholar]
- Hummel, W.; Berner, U.; Curti, E.; Pearson, F.J.; Thoenen, T. Nagra/PSI chemical thermodynamic data base 01/01. Radiochim. Acta 2002, 90, 805–813. [Google Scholar] [CrossRef] [Green Version]
- Matschei, T.; Lothenbach, B.; Glasser, F.P. Thermodynamic properties of Portland cement hydrates in the system CaO-Al2O3-SiO2-CaSO4-CaCO3-H2O. Cem. Concr. Res. 2007, 37, 1379–1410. [Google Scholar] [CrossRef]
- Moeschner, G.; Lothenbach, B.; Rose, J.; Ulrich, A.; Figi, R.; Kretzschmar, R. Solubility of Fe-ettringite (Ca6[Fe(OH)6]2(SO4)3 26H2O). Geochim. Cosmochim. Acta 2008, 72, 1–18. [Google Scholar] [CrossRef]
- Moeschner, G.; Lothenbach, B.; Winnefeld, F.; Ulrich, A.; Figi, R.; Kretzschmar, R. Solid solution between Al-ettringite and Fe-ettringite (Ca6[Al1-xFex(OH)6]2(SO4)3 26H2O). Cem. Concr. Res. 2009, 39, 482–489. [Google Scholar] [CrossRef]
- Schmidt, T.; Lothenbach, B.; Romer, M.; Scrivener, K.; Rentsch, D.; Figi, R. A thermodynamic and experimental study of the conditions of thaumasite formation. Cem. Concr. Res. 2008, 38, 337–349. [Google Scholar] [CrossRef]
- Taylor, H.F.W. Cement Chemistry, 2nd ed.; Thomas Telford Publishing: London, UK, 1997. [Google Scholar]
- Berner, U.; Kulik, D.A.; Kosakowski, G. Geochemical impact of a low-pH cement liner on the near field of a repository for spent fuel and high-level radioactive waste. Phys. Chem. Earth 2013, 64, 46–56. [Google Scholar] [CrossRef]
- Mäder, U. Reference Pore Water for the Opalinus Clay and ‘‘Brown Dogger’’ for the Provisional Safety-Analysis in the Framework of the Sectorial Plan–Interim Results (SGT-ZE); NAB 09-14; Nagra: Wettingen, Switzerland, 2009. [Google Scholar]
- Mazurek, M. Aufbau und Auswertung der Gesteinsparameter-Datenbank für Opalinuston, den ’Braunen Dogger’, Effinger Schichten und Mergel-Formationen des Helvetikums; NAB 11-020; Nagra: Wettingen, Switzerland, 2011. [Google Scholar]
- Pearson, F.J.; Tournassat, C.; Gaucher, E.C. Biogeochemical processes in a clay formation in situ experiment: Part E - Equilibrium controls on chemistry of pore water from the Opalinus Clay, Mont Terri Underground Research Laboratory, Switzerland. Appl. Geochem. 2011, 26, 990–1008. [Google Scholar] [CrossRef] [Green Version]
- Chagneau, A.; Tournassat, C.; Steefel, C.I.; Bourg, I.C.; Gaboreau, S.; Esteve, I.; Kupcik, T.; Claret, F.; Schaefer, T. Complete Restriction of 36Cl− Diffusion by Celestite Precipitation in Densely Compacted Illite. Environ. Sci. Technol. Lett. 2015, 2, 139–143. [Google Scholar] [CrossRef]
- Appelo, C.A.J.; Wersin, P. Multicomponent diffusion modeling in clay systems with application to the diffusion of tritium, iodide, and sodium in Opalinus Clay. Environ. Sci. Technol. 2007, 41, 5002–5007. [Google Scholar] [CrossRef]
- Steefel, C.I. CrunchFlow: Software for Modeling Multicomponent Reactive Flow and Transport. 2009. Available online: https://bitbucket.org/crunchflow/crunchtope-dev/wiki/Home (accessed on 23 February 2021).
- Tournassat, C.; Appelo, C.A.J. Modelling approaches for anion-exclusion in compacted Na-bentonite. Geochim. Cosmochim. Acta 2011, 75, 3698–3710. [Google Scholar] [CrossRef] [Green Version]
- Tournassat, C.; Steefel, C.I. Ionic Transport in Nano-Porous Clays with Consideration of Electrostatic Effects. Rev. Mineral. Geochem. 2015, 80, 287–329. [Google Scholar] [CrossRef] [Green Version]
- Tournassat, C.; Steefel, C.I. Reactive Transport Modeling of Coupled Processes in Nanoporous Media. Rev. Mineral. Geochem. 2019, 85, 75–109. [Google Scholar] [CrossRef] [Green Version]
- Gimmi, T.; Alt-Epping, P. Simulating Donnan equilibria based on the Nernst-Planck equation. Geochim. Cosmochim. Acta 2018, 232, 1–13. [Google Scholar] [CrossRef]
- Lothenbach, B. Hydration of Blended Cements. In Cement-Based Materials for Nuclear Waste Storage; Bart, F., Cau-di-Coumes, C., Frizon, F., Lorente, S., Eds.; Springer: New York, NY, USA, 2013; pp. 33–41. [Google Scholar] [CrossRef]
- Myers, R.J.; L’Hôpital, E.; Provis, J.L.; Lothenbach, B. Effect of temperature and aluminium on calcium (alumino)silicate hydrate chemistry under equilibrium conditions. Cem. Concr. Res. 2015, 68, 83–93. [Google Scholar] [CrossRef]
- Bernard, E.; Lothenbach, B.; Cau-Dit-Coumes, C.; Pochard, I.; Rentsch, D. Aluminum incorporation into magnesium silicate hydrate (M–S–H). Cem. Concr. Res. 2020, 128, 105931. [Google Scholar] [CrossRef]
- Roosz, C.; Grangeon, S.; Blanc, P.; Montouillout, V.; Lothenbach, B.; Henocq, P.; Giffaut, E.; Vieillard, P.; Gaboreau, S. Crystal structure of magnesium silicate hydrates (M–S–H): The relation with 2:1 Mg–Si phyllosilicates. Cem. Concr. Res. 2015, 73, 228–237. [Google Scholar] [CrossRef]
- Marty, N.C.M.; Claret, F.; Lassin, A.; Tremosa, J.; Blanc, P.; Madé, B.; Giffaut, E.; Cochepin, B.; Tournassat, C. A database of dissolution and precipitation rates for clay-rocks minerals. Appl. Geochem. 2015, 55, 108–118. [Google Scholar] [CrossRef]
- Marty, N.M.; Bildstein, O.; Blanc, P.; Claret, F.; Cochepin, B.; Gaucher, E.; Jacques, D.; Lartigue, J.-E.; Liu, S.; Mayer, K.U.; et al. Benchmarks for multicomponent reactive transport across a cement/clay interface. Comput. Geosci. 2015, 19, 1–19. [Google Scholar] [CrossRef]
Figure 1.
Phase volume fractions of initial condition of the concrete—OPA interface. The legend shows all phases considered in the model (por.: porosity; HyTlct: hydrotalcite; Stratling: strätlingite; HyGt: hydrogarnet; AFm: monosulphate; AFt: ettringite; Portland: portlandite; Clinopt: clinoptilolyte; Crist (a): alpha-cristobalite; SiO2am: amorphous silica; SiFume: silica fume; Sulfate: sum of gypsum, hemihydrate, anhydrite; C4AF: ferrite; C3A: aluminate; C2S: belite; C3S: alite). Only reactive phases ondergoing visible volume changes are shown in subsequent figures (top 30 vol%, black frame). The entire domain was discretised into 16 × 100 μm-cells close to the interface, 30 × 1 mm-cells further away, and two large cells at the outer concrete and OPA boundaries.

Figure 2.
Predicted volume evolution of the reactive phases (legend and explanation of horizontal axis in Figure 1 and captions). The pH of the free porewater is indicated in the dark blue free porosity area.
Figure 2.
Predicted volume evolution of the reactive phases (legend and explanation of horizontal axis in Figure 1 and captions). The pH of the free porewater is indicated in the dark blue free porosity area.


Figure 3.
pH profiles across the OPA free porewater after 10 h of interaction with ESDRED, modelled with slow and increased reaction rates of illite and kaolinite. Interface at 0 mm, ESDRED on the left, OPA on the right.
Figure 3.
pH profiles across the OPA free porewater after 10 h of interaction with ESDRED, modelled with slow and increased reaction rates of illite and kaolinite. Interface at 0 mm, ESDRED on the left, OPA on the right.

Figure 4.
The cation concentration profile in the Donnan porewater (in charge equivalent fractions) across the OPA after 2.7 y of interaction with ESDRED. In the current modelling approach, the Donnan porewater concentrations replaced the cation occupancies of clay models with explicit ion-exchange. Explanation of horizontal axis in Figure 1 captions.

Figure 5.
Predicted volume evolution of the reactive phases after 4.8 y of interaction of ESDRED (top), and OPC (bottom, modified from [14]) with OPA. The phase legend and explanation of horizontal axis is shown in Figure 1 and captions, the pH of the free porewater is indicated in the dark blue free porosity area.


Figure 6.
SEM EDX element maps of 4.8 y ESDRED-OPA interfaces, concrete on the left, OPA on the right of the interface marked in red. Bright areas represent high concentrations of the element indicated. On the concrete side, only the cement matrix between the aggregates is relevant. OPA contains pyrite (high S areas) and calcite (high Ca spots).

Figure 7.
Comparison of SEM EDX Mg maps of interfaces (4.8 y), concrete on the left, OPA on the right of the interface marked in red. Bright areas represent high Mg concentrations. On the concrete side, only the cement matrix between the aggregates is relevant.
Figure 7.
Comparison of SEM EDX Mg maps of interfaces (4.8 y), concrete on the left, OPA on the right of the interface marked in red. Bright areas represent high Mg concentrations. On the concrete side, only the cement matrix between the aggregates is relevant.


Table 1.
Characteristics of concrete and cement. Binder represents all reactive components (cement, silica). Cement composition was determined by XRD Riedtveld analysis using an internal standard.
Table 1.
Characteristics of concrete and cement. Binder represents all reactive components (cement, silica). Cement composition was determined by XRD Riedtveld analysis using an internal standard.
| Concrete Composition | ||
| CEM I 42.5 N | [kg/m3] | 210 |
| silica fume | [kg/m3] | 140 |
| superplasticiser | [kg/m3] | 4.2 |
| accelerator | [kg/m3] | 16.8 |
| water | [kg/m3] | 175 |
| water/binder weight ratio | – | 0.5 |
| sand, gravel | [kg/m3] | 1800 |
| Cement Composition | ||
| alite | [wt%] | 52.8 |
| belite | [wt%] | 22.8 |
| aluminate | [wt%] | 5.0 |
| ferrite | [wt%] | 7.9 |
| periclase | [wt%] | 1.0 |
| calcite | [wt%] | 2.9 |
| quartz | [wt%] | 0.5 |
| anhydrite | [wt%] | 1.9 |
| hemihydrate | [wt%] | 1.7 |
| gypsum | [wt%] | 0.0 |
| syngenite | [wt%] | 2.0 |
| dolomite | [wt%] | 1.5 |
Table 2.
Stoichiometric clinker composition calculated from measured cement bulk chemical composition after Taylor [37], measured silica fume composition, implemented dissolution rates, and surface areas.
Table 2.
Stoichiometric clinker composition calculated from measured cement bulk chemical composition after Taylor [37], measured silica fume composition, implemented dissolution rates, and surface areas.
| Alite C3S | Belite C2S | Aluminate C3A | Ferrite C4AF | Si Fume | |
|---|---|---|---|---|---|
| CaO [formula units] | 2.911 | 1.975 | 2.793 | 4.202 | 0.024 |
| SiO2 [formula units] | 0.956 | 0.914 | 0.17 | 0.293 | 0.981 |
| Al2O3 [formula units] | 0.027 | 0.041 | 0.85 | 1.066 | 0.001 |
| Fe2O3 [formula units] | 0.01 | 0.01 | 0.088 | 0.665 | 0 |
| Na2O [formula units] | 0.002 | 0.002 | 0.036 | 0.005 | 0 |
| MgO [formula units] | 0.054 | 0.015 | 0 | 0 | 0.003 |
| K2O [formula units] | 0.002 | 0.014 | 0.016 | 0.007 | 0.003 |
| log rate constant1 [mol/m2/s] | −5.06374 | −5.34159 | −4.06095 | −4.69578 | −9.24229 |
| log rate constant2 [mol/m2/s] | −7.27421 | −8.48021 | −8.21623 | −8.2 | −11.39708 |
| surface area for 1 and 2 [m2/g] | 0.00319732 | 0.00301906 | 0.00329394 | 0.0026751 | 21 |
Table 3.
Mineral composition of OPA in wt% of dry rock.
| [wt%] | |
|---|---|
| illite | 23.9 |
| kaolinite | 17.7 |
| smectite | 12.2 |
| calcite | 13.7 |
| dolomite | 0.5 |
| quartz | 17.1 |
| siderite | 3.3 |
| pyrite | 1.0 |
| kalifeldspar | 1.3 |
| albite | 1.0 |
| chlorite | 8.3 |
Publisher’s Note: MDPI stays neutral with regard to jurisdictional claims in published maps and institutional affiliations. |
© 2021 by the authors. Licensee MDPI, Basel, Switzerland. This article is an open access article distributed under the terms and conditions of the Creative Commons Attribution (CC BY) license (https://creativecommons.org/licenses/by/4.0/).
Share and Cite
MDPI and ACS Style
Jenni, A.; Mäder, U. Reactive Transport Simulation of Low-pH Cement Interacting with Opalinus Clay Using a Dual Porosity Electrostatic Model. Minerals 2021, 11, 664. https://0-doi-org.brum.beds.ac.uk/10.3390/min11070664
AMA Style
Jenni A, Mäder U. Reactive Transport Simulation of Low-pH Cement Interacting with Opalinus Clay Using a Dual Porosity Electrostatic Model. Minerals. 2021; 11(7):664. https://0-doi-org.brum.beds.ac.uk/10.3390/min11070664
Chicago/Turabian StyleJenni, Andreas, and Urs Mäder. 2021. "Reactive Transport Simulation of Low-pH Cement Interacting with Opalinus Clay Using a Dual Porosity Electrostatic Model" Minerals 11, no. 7: 664. https://0-doi-org.brum.beds.ac.uk/10.3390/min11070664
Note that from the first issue of 2016, this journal uses article numbers instead of page numbers. See further details here.