
Diffraction Features from (101¯4) Calcite Twins Mimicking Crystallographic Ordering


1
Research Centre for Astronomy and Earth Sciences, Institute for Geological and Geochemical Research, Eötvös Loránd Research Network, Budaörsi Street 45, 1112 Budapest, Hungary
2
Department of Earth and Environmental Sciences, University of Pannonia, Egyetem út 10, 8200 Veszprém, Hungary
Minerals 2021, 11(7), 720; https://0-doi-org.brum.beds.ac.uk/10.3390/min11070720
Submission received: 3 June 2021
/
Revised: 28 June 2021
/
Accepted: 1 July 2021
/
Published: 4 July 2021
(This article belongs to the Special Issue Modularity and Twinning in Mineral Crystal Structures)
Abstract
:During phase transitions the ordering of cations and/or anions along specific crystallographic directions can take place. As a result, extra reflections may occur in diffraction patterns, which can indicate cell doubling and the reduction of the crystallographic symmetry. However, similar features may also arise from twinning. Here the nanostructures of a glendonite, a calcite (CaCO3) pseudomorph after ikaite (CaCO3·6H2O), from Victoria Cave (Russia) were studied using transmission electron microscopy (TEM). This paper demonstrates the occurrence of extra reflections at positions halfway between the Bragg reflections of calcite in 0kl electron diffraction patterns and the doubling of d104 spacings (corresponding to 2∙3.03 Å) in high-resolution TEM images. Interestingly, these diffraction features match with the so-called carbonate c-type reflections, which are associated with Mg and Ca ordering, a phenomenon that cannot occur in pure calcite. TEM and crystallographic analysis suggests that, in fact, (104) calcite twins and the orientation change of CO3 groups across the twin interface are responsible for the extra reflections.
1. Introduction
Transmission electron microscopy (TEM) is an excellent method for characterizing the nanostructures of crystalline materials. A wide range of imaging and diffraction techniques provide unique information about the crystal structure of the studied samples, such as the local elemental composition, electronic structure and bonding down to the atomic level [1]. Thanks to the latest developments, not only has the resolution limit been pushed below 0.5 Å, but nowadays even the behavior of materials and devices at the atomic scale can be mapped [2,3]. TEM is practically an indispensable technique for investigating crystal defects and studying phase transitions. However, the interpretation of TEM data can be challenging, and ambiguities can arise for cases that look simple [4]. In particular, the recognition of twins from TEM data can be difficult because their diffraction features can be confused with ordering and superstructures [5,6,7].
Here TEM is used to study the nanostructure of glendonite, which is a synonym for calcite pseudomorph after ikaite (CaCO3·6H2O), as a result of transformation. Glendonite is commonly associated with cold paleotemperature [8,9,10]. However, issues have been raised with regard to using it as an indicator for cold temperature [11] because, in a laboratory setting, ikaite formation was reported even above 20 °C [11,12]. Ikaite rapidly disintegrates into a mush of water and recrystallizes to calcite during slight warming or pressure release, resulting in a highly porous crystal mesh [13,14,15,16]. Aragonite (unit cell parameters a = 4.9611 Å, b = 7.9672 Å, c = 5.7404 Å; space group: Pmcn) has also been observed from ikaite transformation in marine and alkaline lake environments [17,18]. Studies on the transformation of synthetic ikaite suggest that it can also transform to amorphous calcium carbonate [19] and vaterite (unit cell parameters a = 4.13 Å, b = 7.15 Å, c = 8.48 Å; space group: Pbnm) (e.g., [20]). Macroscopic calcite pseudomorphs after ikaite are traditionally called glendonite, although other names also are used [8]. According to [11], the pseudomorph replacement of ikaite by calcite occurs through a coupled dissolution–reprecipitation mechanism at the ikaite–calcite interface. Since glendonites preserved the parent phase morphology, structural relicts indicating phase transition can be expected [21]. In fact, the TEM data here reported indicated an interesting lamellar structure with the occurrence of diffraction features that are inconsistent with ordinary calcite and that could mistakenly be associated with crystallographic ordering and superstructures.
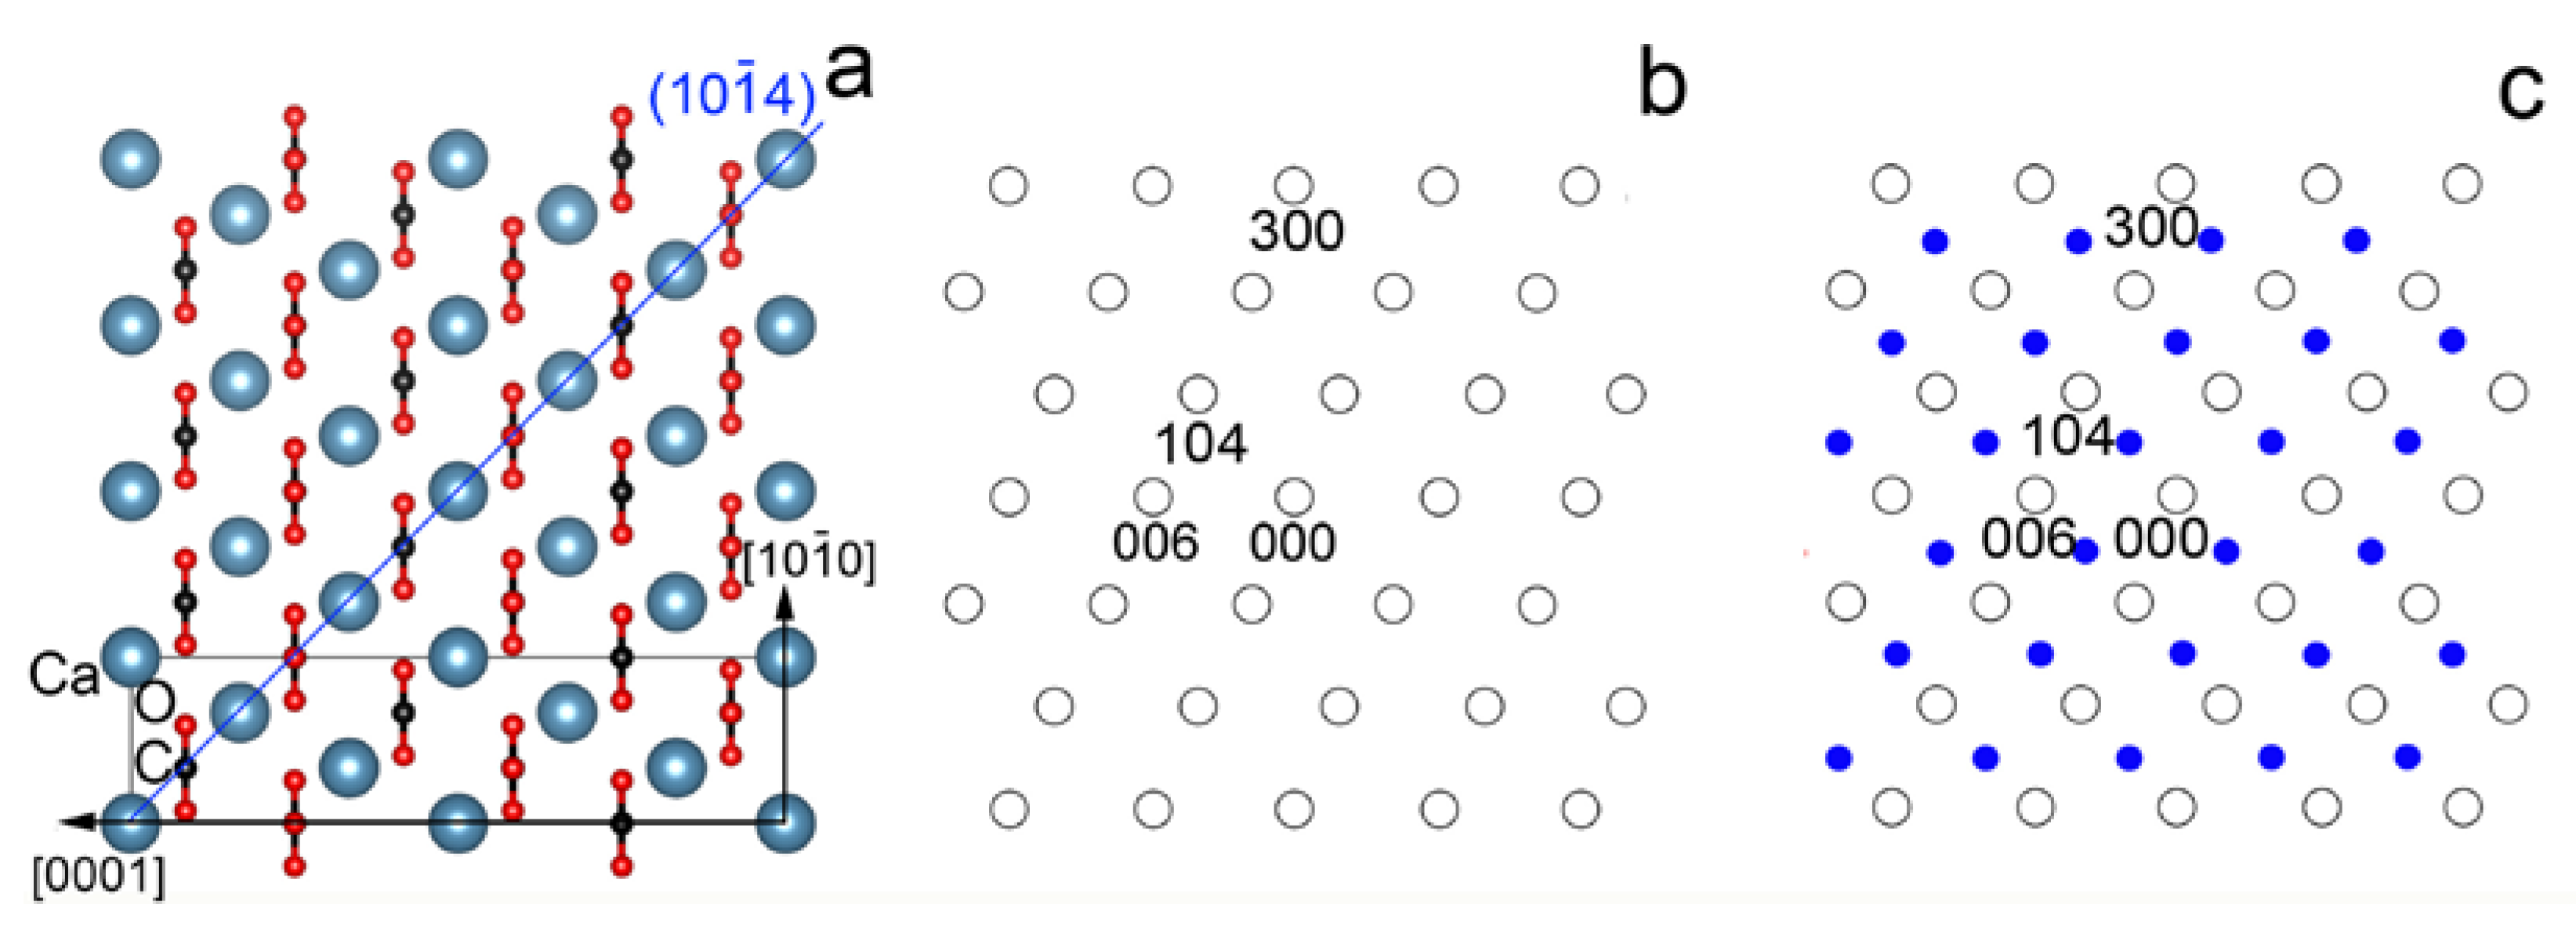
Understanding the structural details of Ca-Mg carbonates is an important topic since they are rock-forming minerals. In particular, calcite is the dominant carbonate phase on the Earth’s surface and it is the third most abundant mineral after quartz and feldspars. It abundantly precipitates at ambient conditions and is one of the most important biominerals. Calcite is rhombohedral (unit cell parameters a = 4.989 Å and c = 17.06 Å; space group: Rc). In this paper, three independent indices hkl are used to label reflections and d-spacings and four indices hkil (i = −(h + k)) are used whenever crystallographic planes and directions are discussed. Ca atoms lie in the (104) plane alternating with CO3 triangular groups along the [0001] (Figure 1a). The orientation change of the carbonate groups implies a c glide that is revealed by systematic absences (l = 2n + 1 for 0kl reflections) in the corresponding reciprocal lattice (Figure 1b). In dolomite, (104) Mg and Ca cation layers alternate along [0001]; as a result, the Rc symmetry is reduced to R and b-type reflections (l = 2n + 1 for 0kl reflections) occur (e.g., [22]). Although such b-type reflections do not occur in pure conventional calcite, they are present in a disordered phase of calcite (space group: Rm) as a consequence of the rotational disorder of the CO3 groups. This polymorph was reported at high temperature (>1260 K) and at high pCO2 [23]. The reflections halfway between those of the a-type (l = 2n for the 0kl reflections) and b-type are the so-called c-type reflections (Figure 1c), which have been associated with ordering and attributed to various superstructures in Mg-bearing calcite and dolomite [22,24,25]. In contrast to these explanations, Larsson and Christy [5] showed that the c-type reflections can arise from submicron-sized calcite twins. Shen et al. [26] followed this explanation and demonstrated that multiple diffraction between the host dolomite and twinned Mg-calcite nano-lamellae could give rise to the c-type reflections in Ca-rich dolomite.
The aim of this paper is to confirm Larsson and Christy’s [5] hypothesis via the recognition of calcite (104) twins from selected-area electron diffraction (SAED) patterns and high-resolution TEM images (HRTEM). Here it is demonstrated that the c-type reflections in glendonite can be successfully interpreted in terms of (104) twinning by reticular pseudo-merohedry [27]. It is also shown that streaked c-type reflections can be associated with (104) stacking faults occurring inside the small (5–15 nm wide) twin domains. The proper interpretation of these diffraction features is crucial as they can lead to erroneous conclusions.
2. Materials and Methods
Glendonite samples from Victoria Cave (Bashkiria, Russia) were received from Paul Töchterle and Yuri Dublyansky (Institute of Geology, University of Innsbruck). The description of the site and the characteristics of the samples are reported in [28] and [21] respectively.
Glendonite grains were coated in gold and measured using a Zeiss EVO 40 scanning electron microscope operated at 20 kV. A back-scattered electron (BSE) image was acquired at 10,000 magnifications and the chemical composition of the sample was measured using an Oxford INCA energy dispersive X-ray (EDX) spectrometer.
Glendonite powder was analyzed with an X-ray diffraction (X’Pert, PANalytical B.V.) method with Cu Kα radiation in the 2θ range of 10 to 60° and with a 0.04° step scan for 1 s. Si was used as an internal standard. The unit-cell parameter of calcite was refined based on the 012, 104, 110, 113, 202, 024 and 116 reflections using the PDIndexer program [29].
Zoltán May (ELKH Research Centre for Natural Sciences, Budapest) determined the elemental composition of glendonite by atomic emission spectroscopy using a Spectro Genesis ICP-OES (SPECTRO Analytical Instruments GmbH, Kleve, Germany) simultaneous spectrometer with axial plasma observation. Multi-element standard solutions for ICP (Merck Chemicals GmbH, Darmstadt, Germany) were used for calibration. The detection limits of the analytical method are reported in [30].
For TEM investigation the samples were crushed in ethanol and deposited onto copper grids covered by Lacey carbon supporting films. Bright-field TEM (BFTEM), HRTEM and SAED data were acquired with a 200 keV Talos Thermo Scientific electron microscope. Fast Fourier transforms (FFTs) obtained from the HRTEM images were calculated using Gatan Digital Micrograph 3.6.1 software. Structure models of calcite were drawn using VESTA-win64 software [31] and the twinning features of calcite were tested with the software GEMINOGRAPHY [32].
3. Results and Discussion
3.1. c-Type Reflections and the Twin Lattice
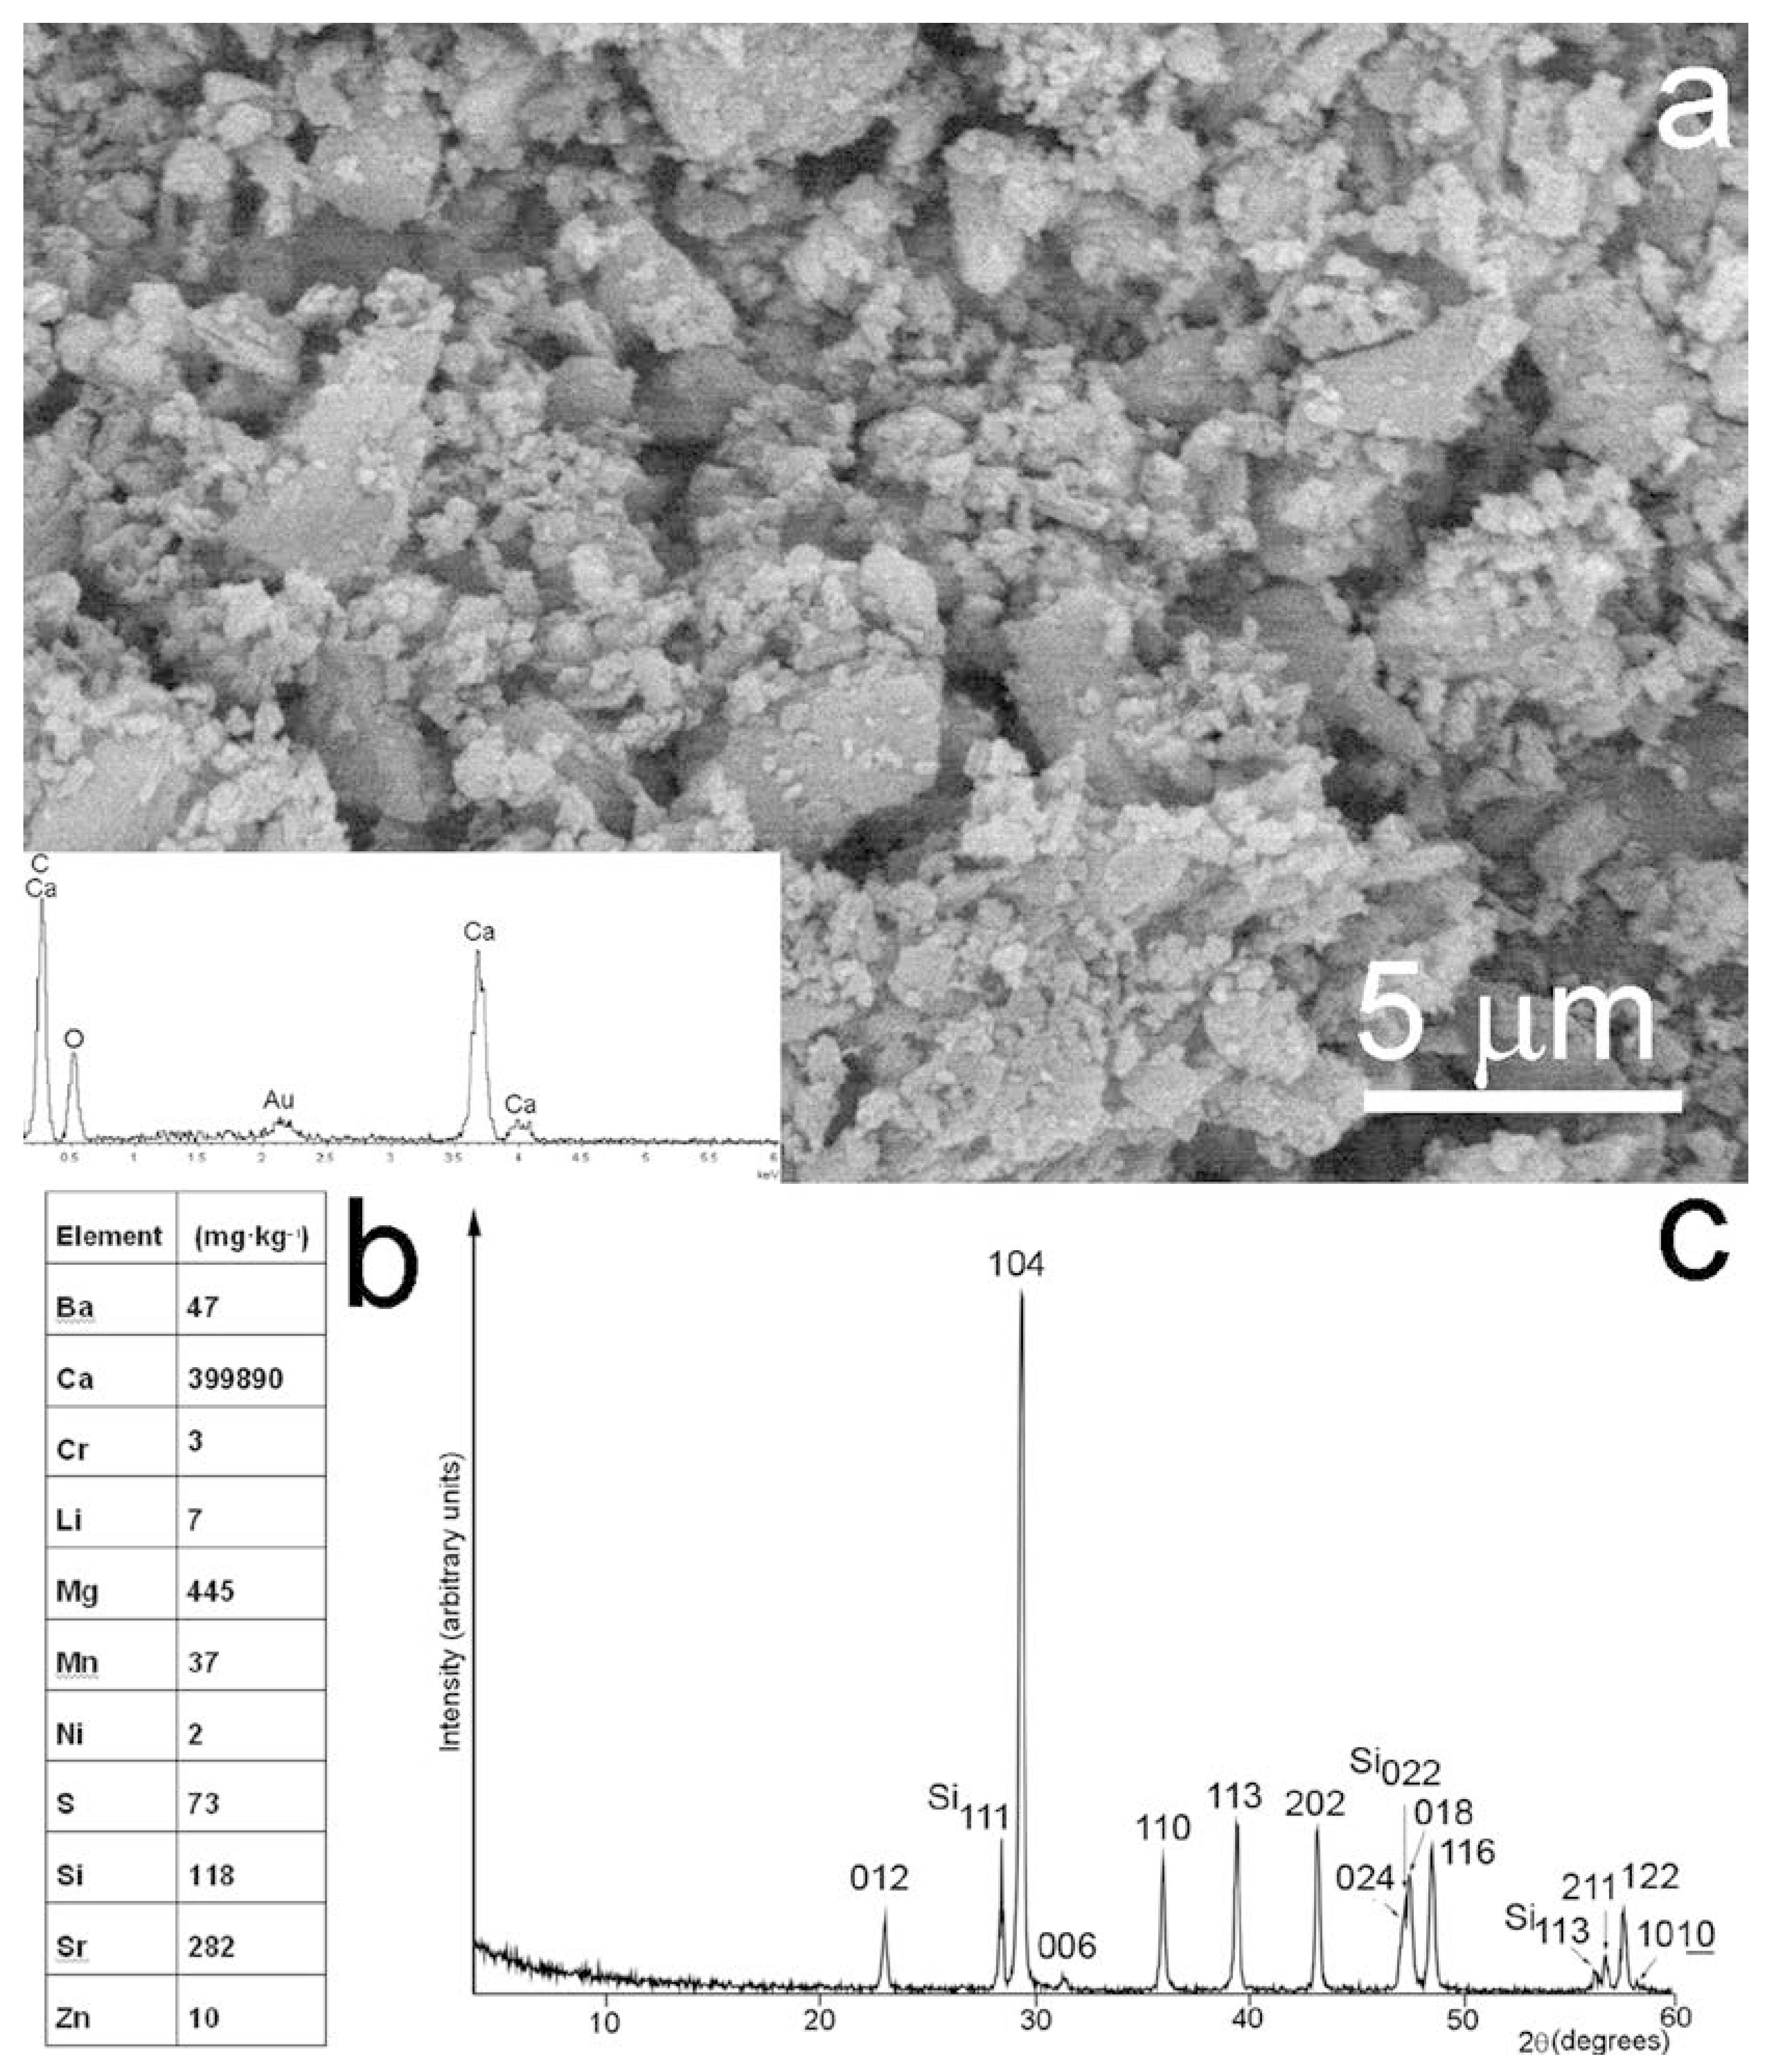
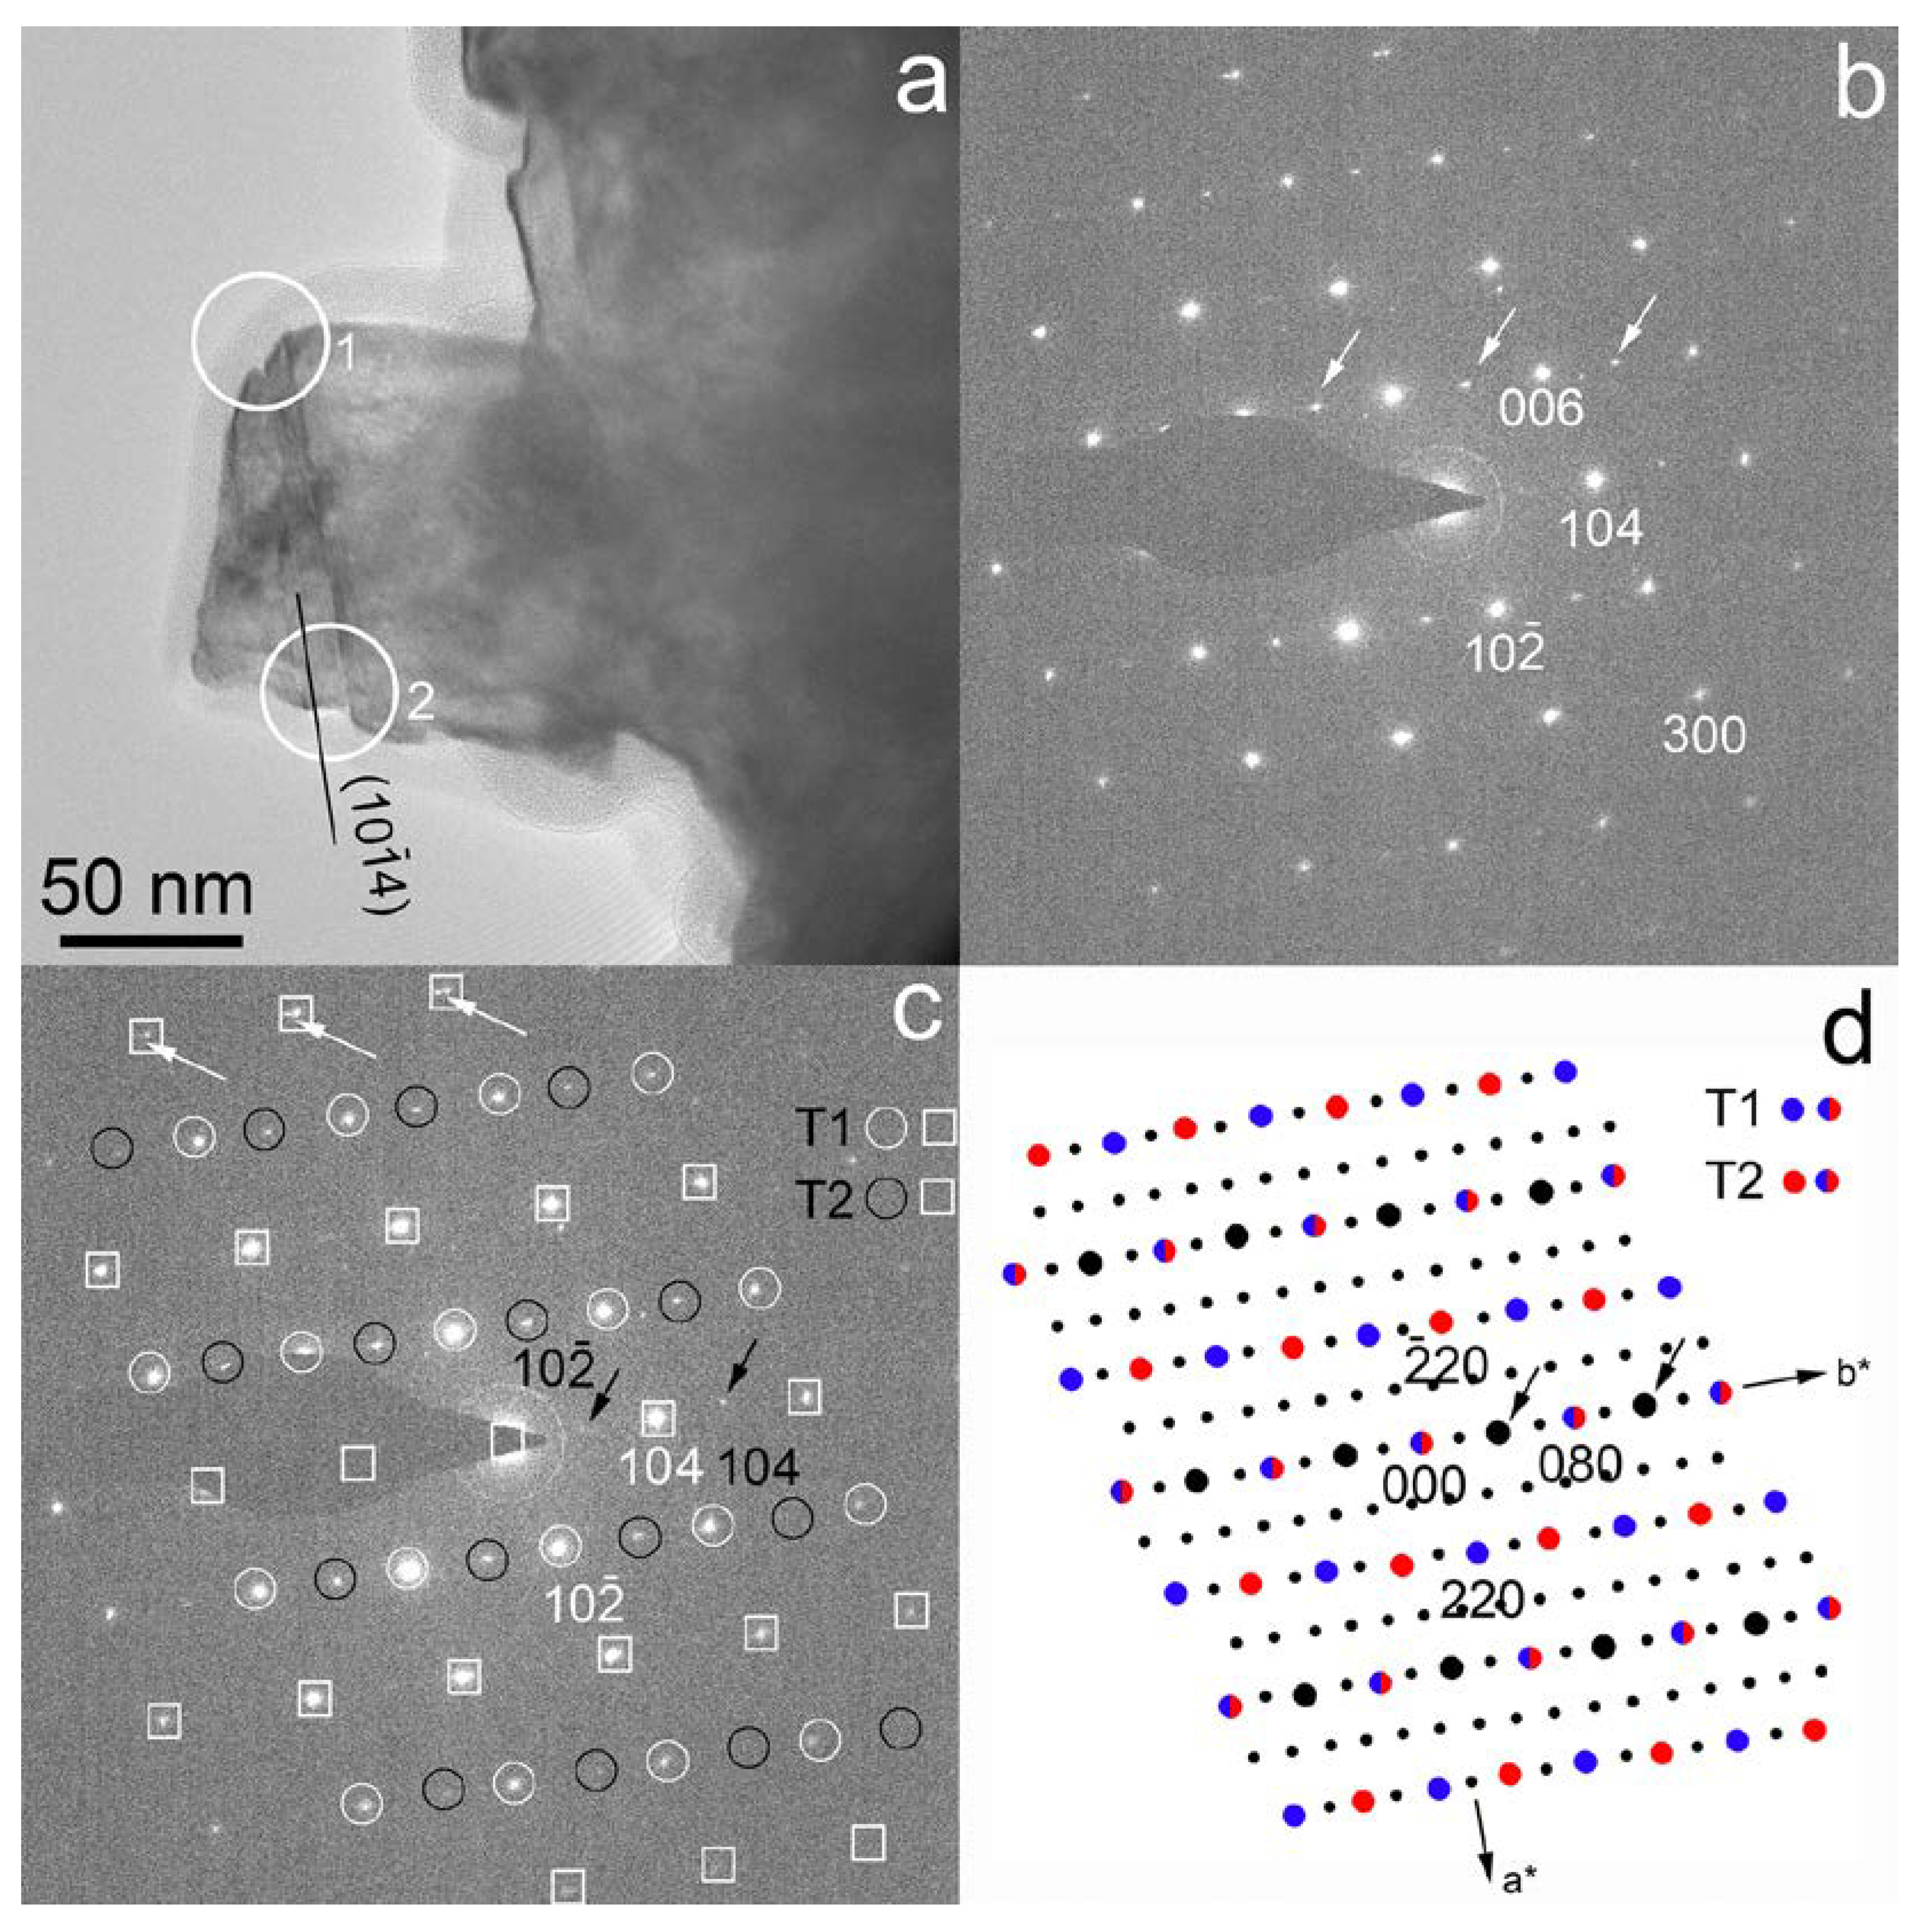
The studied glendonite is built up of fine-grained (submicrons to several microns in size) calcite crystals (Figure 2a). The sample is chemically homogeneous, practically pure CaCO3 (Figure 2a,b). Its water content is negligible [21] and its X-ray diffraction pattern is consistent with ordinary calcite, having the unit cell parameters a = 4.989 (2) and c = 17.08 (1) (Figure 2c). However, TEM reveals that the sample has a complex nanostructure. In particular, BFTEM images taken along [010] show linear features parallel to (104) and indicate the occurrence of 10–15 nm size nano-domains in the calcite matrix (Figure 3a). SAED patterns of the nano-domains reveal weak c-type reflections that are incompatible with the Rc space group of calcite (Figure 3b).
It is intriguing that the c-type reflections of the studied sample mimic the diffraction features of ikaite (a = 8.792 Å, b = 8.310 Å, c = 11.021 Å, β = 110.53°, space group: C2/c) and also those of a hypothetical carbonate supercell containing ordered cation sites. In fact, the measured d spacings of 6.05 Å and 3.85 Å roughly match the d110 (5.849 Å) and d2-1-1 (3.882 Å) of ikaite. In addition, the calculated angle between (110) and (2) is 75.7°, which is close to the measured value of 73°. However, ikaite loses its water content in vacuum within seconds; thus, it cannot be studied with TEM. Furthermore, Fourier transform infrared spectroscopy does not indicate a detectable amount (<1 wt%) of crystalline water inside the sample [21]. Similarly, the interpretation of c-type reflections with cation ordering is not viable, because both EDX and ICP-OES analysis (Figure 2) suggest that the sample does not contain a detectable amount (<1 wt%) of foreign cations.
In contrast to the abovementioned hypothetical explanations, (104) calcite twins provide a convincing solution for the diffraction features of the SAED pattern (Figure 3b). In particular, twin individuals hosted in an underlying calcite lattice [5] give rise to the observed extra and split reflections (Figure 3c). According to tests using the software GEMINOGRAPHY [32], the observed twin corresponds to a (104) twin by reticular pseudo-merohedry (twin index 4 and obliquity 0.74°) based on a pseudo-orthorhombic C-centered sublattice with cell parameters a = 8.095 Å, b = 24.286 Å, c = 4.989 Å, α = 90.00°, β = 90.00° and γ = 89.26°. The calculated obliquity (0.74°) is in accordance with the small observed split of reflections in the SAED pattern (Figure 3c). The relationship between the unit cell of calcite and that of the pseudo-orthorhombic twin lattice is described by the following matrix T:
Applying this matrix to any [u, v, w] vectors of calcite, the corresponding [u’, v’, w’] vectors of the pseudo-orthorhombic cell can be generated. In addition, applying this matrix to indexes of the calcite hkl reflections, we can transform them to the h’k’l’ indexes referred to the twin lattice. For example, the 104 reflection of calcite corresponds to 080 of the pseudo-orthorhombic twin lattice. The twin lattice explains all the observed reflections and shows that every fourth set of reflections of the individuals overlaps on the hk0 plane (Figure 3d), as expected from the twin index 4.
3.2. HRTEM Images of the (104) Calcite Twins and Doubled d104 Spacings
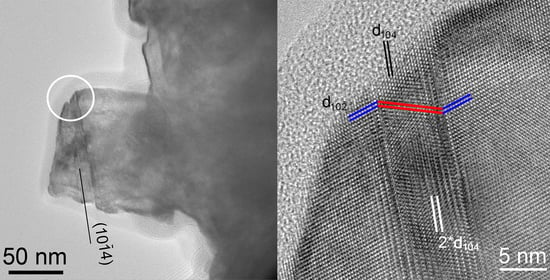
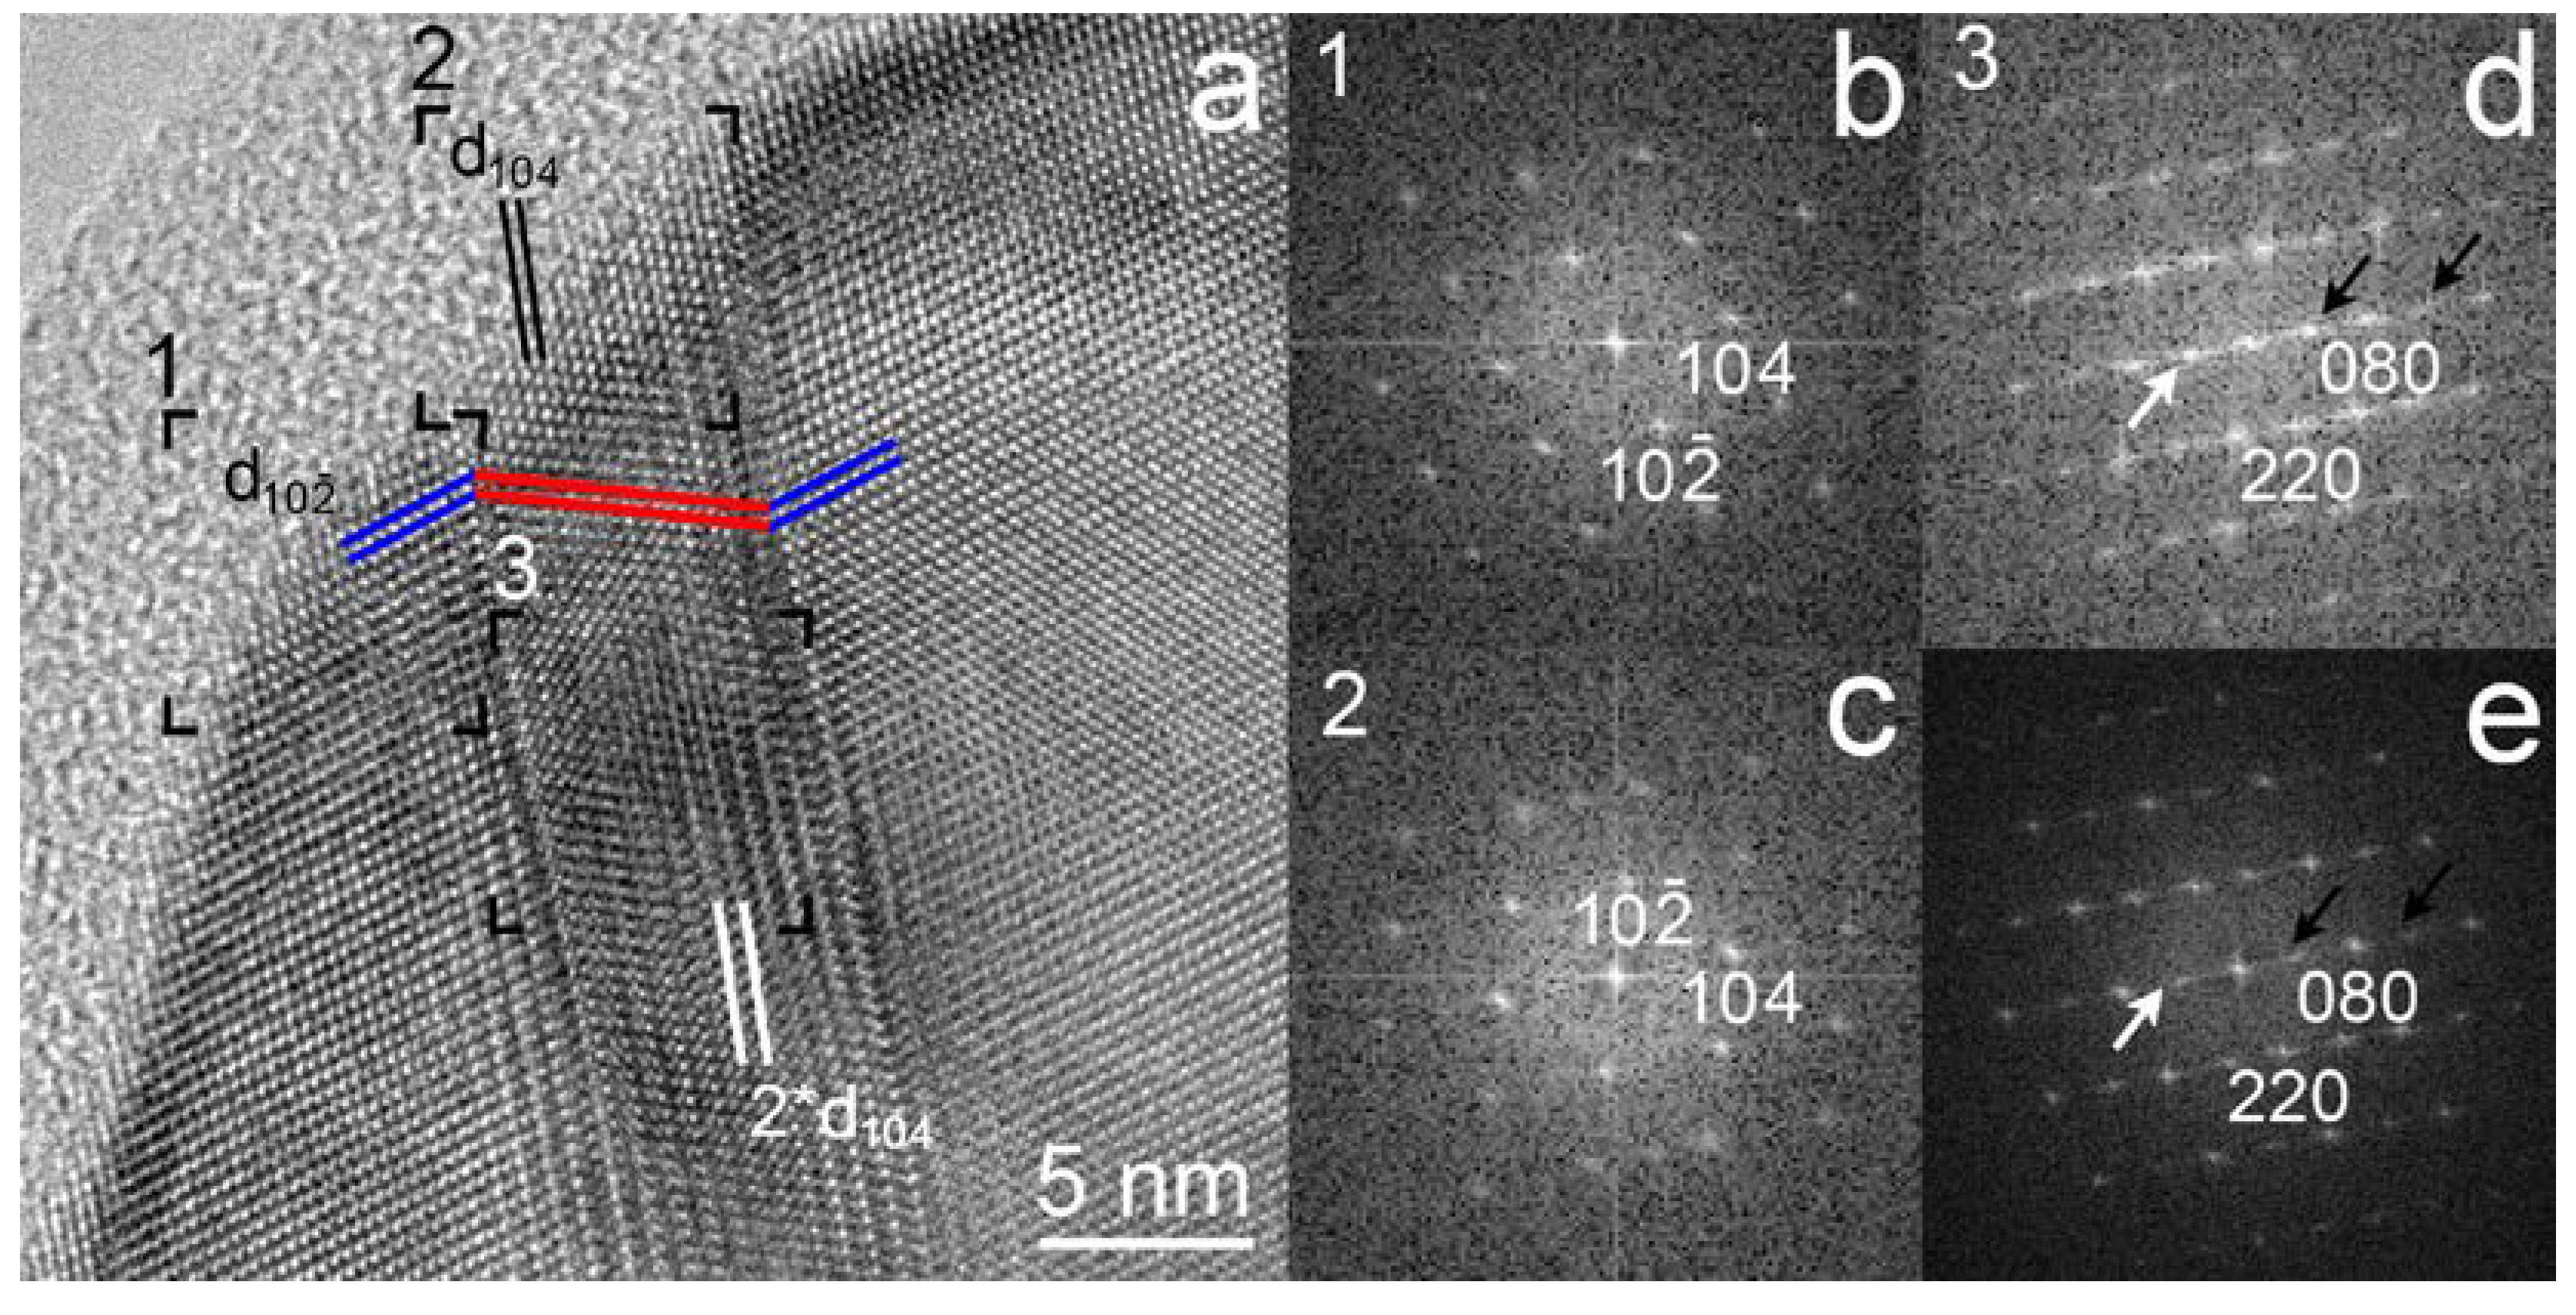
The identification of the (104) calcite twins is straightforward from the HRTEM image acquired with the electron beam incident along [010] of the thin part (~10 nm thick) of the sample; in fact, the two individuals can be easily recognized by the orientation change of the fringes corresponding to d012 spacings (3.85 Å) and they can be localized from their corresponding FFTs (Figure 4a–c). The HRTEM image (Figure 4a) obtained from the thin part also shows fringes with 3.03 Å corresponding to d104 spacing. However, 6.05 Å spacing can be measured from the thicker areas (>10 nm) of the image (white lines in Figure 4a) and its corresponding FFT (Figure 4d), as well as the FFT calculated from the entire HRTEM image (Figure 4e). This d-spacing, which is also evident in Figure 5a, erroneously indicates cell doubling.
It should be noted that the systematic absences of the Rc space group, i.e., those of the twin individuals, should be present even for thick samples. Thus, the side-by-side arrangement of the individuals does not provide an explanation for the c-type reflections of the FFT calculated from the thick part of the grain (Figure 4d). Therefore, following the suggestion of Larsson and Christy [5], it is proposed that the small (<10 nm) twin individual 2 is actually hosted in the calcite matrix (individual 1). Since HRTEM images are two-dimensional projections of the three-dimensional structures, the HRTEM image acquired with the electron beam incident along [010] shows the vertical projection of the individual 2 and that of the underlying calcite (individual 1) from areas thicker than the individual twin size (>10 nm). It is suggested that electrons dynamically scattered from these vertically stacked twin individuals give rise to the doubled d104 spacings (2∙3.03 Å) of the HRTEM image and the c-type reflections occurring along [104]* of the FFTs (Figure 4d,e and Figure 5b). In fact, Christy and Larson [5] have demonstrated that, by considering twins in an underlying calcite matrix, even the doubled d012 corresponding to a 2∙3.85 Å spacing can be generated. Thus, the doubled d104 and the d012 spacings measured on the thick part (>10 nm) of the HRTEM images can be used as evidence for nanosized calcite twins.
Nanotwins hosted in a matrix are commonly observed, in particular for materials such as diamond and SiC that contain abundant stacking faults [6,7,33,34]. In fact, the FFTs calculated from the thick region and the entire image show streaked reflections (white arrows in Figure 4d,e and Figure 5b), which can be associated with (104) stacking faults that occur inside the 5–15 nm wide twin individuals.
3.3. Crystal Structure of the (104) Calcite Twins
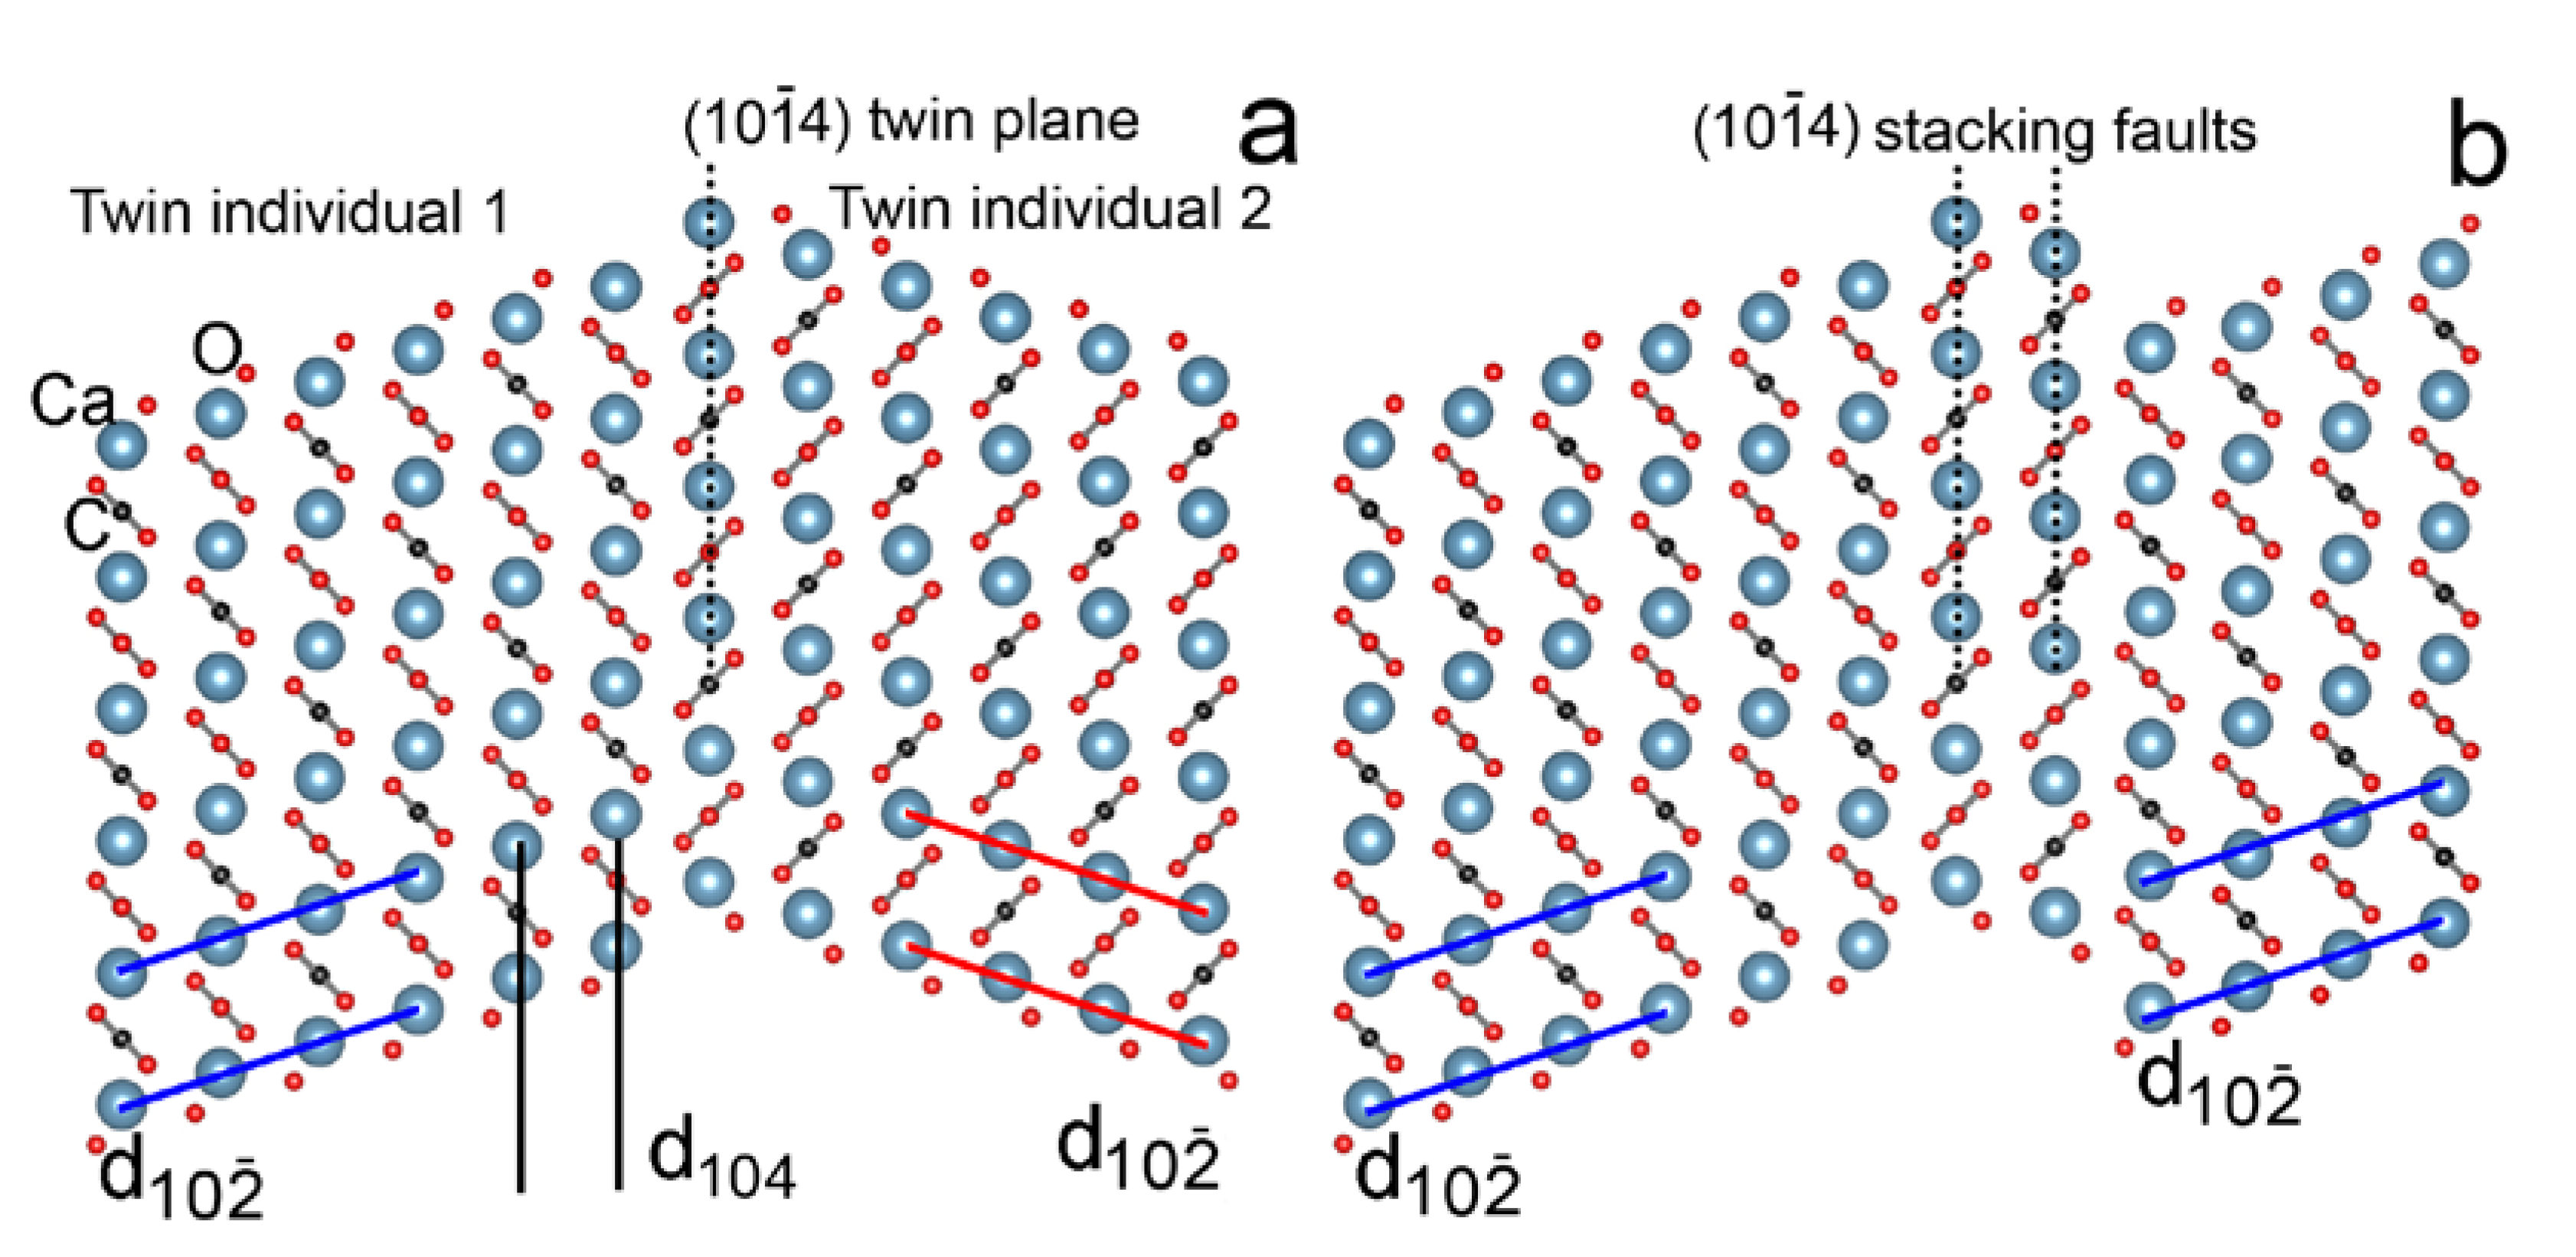
The crystallographic analysis suggests that the c-type reflections in calcite and their streaking can be successfully interpreted via (104) twins and stacking faults. The structure model of this twin along [010] (Figure 6a), built based on the work of Bruno et al. [35,36], reveals the orientation change of the CO3 groups and the (10 calcite planes across the twin interface, which agrees well with the observed features (Figure 4a and Figure 5a). Based on geometry optimizations of 2D twinned slabs, Bruno et al. [35,36] demonstrated that the twinned individuals are translated and, at the twin interface, tilting and rotation of the CO3 groups occur, which gives rise to variations of the Ca−O distances. Following the construction of the twin model, the crystal structure of a (104) stacking fault can also be generated (Figure 6b).
3.4. Possible Origin of the (104) Calcite Twins
The (104) twin is one of the four possible twins observed in calcite [37]. Although it has been reported as one of the main deformation twinning planes of calcite [37], it is also commonly associated with crystal growth and has been reported among others from the calcite shell of a sea urchin [5]. This twin was observed in a glendonite sample that formed from ikaite; thus, it may be associated with the ikaite-to-calcite transformation. However, since the formation of aragonite [17,18], amorphous calcium carbonate [19] and vaterite [20] has also been reported during this transition, a multiphase origin of the calcite twin is also plausible. In either way, interpretation based on the occurrence of this twin alone is definitely not a diagnostic for identifying glendonites and inferring cryogenic conditions [21].
4. Conclusions
c-type reflections (Figure 1) were identified in glendonite, a calcite pseudomorph after ikaite. As the sample was chemically pure CaCO3 (Figure 2), it turned out that the c-type reflections cannot mimic the diffraction features associated with crystallographic ordering. TEM and crystallographic analysis suggested that, in fact, twinning by reticular pseudomerohedry (twin plane: (104); twin index: 4; obliquity: 0.74°) successfully explains these reflections (Figure 3). The twin individuals could be recognized from thin areas (~10 nm) of the HRTEM images through the direction change of the fringes corresponding to d10-2 spacings (3.85Å). From the thicker part of the sample (>10 nm), the small-sized twin individual (5–10 nm) hosted in the calcite matrix and dynamically scattered electrons gave rise to double d104 spacings corresponding to 2∙3.03 Å measured on HRTEM images (Figure 4 and Figure 5). Streaked c-type reflections were also observed, and they were explained by (104) stacking faults occurring inside the small (5–15 nm wide) twin domains. It was shown that the orientation change of carbonate groups across the (104) calcite planes (Figure 6) gave rise to the (104) twins and stacking faults. Although in the glendonite sample Mg and Ca ordering could not occur, this phenomenon may be present in Mg-containing calcite, from which c-type reflections have been reported. This paper strongly supports (1) the interpretation of Larsson and Christy [5] associating c-type reflections with (104) twins and with the orientation change of carbonate groups across the twin interface and (2) the final conclusion of considering the occurrence of (104) twins before attributing c-type reflections to Mg and Ca ordering.
Funding
The author is grateful for use of the TEM facility at the University of Pannonia and to its staff in the framework of grant no. GINOP-2.3.3-15-2016-0009 from the European Structural and Investments Funds. Financial support from the Hungarian National Research, Development and Innovation Office (projects ANN134433, FK123871 and 2019-2.1.11-TÉT-2019-00016), the Eötvös Loránd Research Network (NANOMIN projects, KEP-1/2020), as well as the János Bolyai Research Scholarship and the ÚNKP-20-5-PE-7 New National Excellence program of the Ministry for innovation and technology are acknowledged.
Data Availability Statement
Not applicable.
Acknowledgments
The author thanks Giovanni Ferraris for calculating the twinning features using the software GEMINOGRAPHY; his insightful comments and revision of this manuscript are also greatly appreciated. Paul Töchterle and Yuri Dublyansky are acknowledged for the glendonite sample. The author also thanks Zoltán May for measuring the glendonite sample with ICP-OES, István Dódony for emphasizing the orientation change of carbonate groups for the interpretation of HRTEM images, Dino Aquilano for discussing the (104) calcite twins and the useful comments of three anonymous reviewers.
Conflicts of Interest
The author declares no conflict of interest.
References
- Inkson, B.J. Scanning electron microscopy (SEM) and transmission electron microscopy (TEM) for materials characterization. In Materials Characterization Using Nondestructive Evaluation (NDE) Methods Editor(s): Gerhard Hübschen, Iris Altpeter, Ralf Tschuncky, Hans-Georg Herrmann; Woodhead Publishing: Cambridge, UK, 2016; pp. 17–43. [Google Scholar] [CrossRef]
- Jiang, Y.; Chen, Z.; Han, Y.; Deb, P.; Gao, H.; Xie, S.; Muller, D.A. Electron ptychography of 2D materials to deep sub-ångström resolution. Nature 2018, 559, 343–349. [Google Scholar] [CrossRef]
- Yan, X.; Liu, C.; Gadre, C.A.; Gu, L.; Aoki, T.; Lovejoy, T.C.; Pan, X. Single-defect phonons imaged by electron microscopy. Nature 2021, 589, 65–69. [Google Scholar] [CrossRef]
- Németh, P.; Dódony, I.; Pósfai, M.; Buseck, P.R. Complex defect in pyrite and its structure model derived from geometric phase analysis. Microsc. Microanal. 2013, 19, 1303–1307. [Google Scholar] [CrossRef] [PubMed]
- Larsson, A.-K.; Christy, A.G. On twinning and microstructures in calcite and dolomite. Am. Mineral. 2008, 93, 103–113. [Google Scholar] [CrossRef]
- Németh, P.; Garvie, L.A.J.; Buseck, P.R. Twinning of cubic diamond explains reported nanodiamond polymorphs. Sci. Rep. 2015, 5, 18381. [Google Scholar] [CrossRef] [PubMed]
- Cayron, C. Diffraction artefacts from twins and stacking faults, and the mirage of hexagonal, polytypes or other superstructures. Scr. Mater. 2020, 194, 113629. [Google Scholar] [CrossRef]
- Huggett, J.M.; Schultz, B.P.; Shearman, D.J.; Smith, A.J. The petrology of ikaite pseudomorphs and their diagenesis. Proc. Geol. Assoc. 2005, 116, 207–220. [Google Scholar] [CrossRef]
- De Lurio, J.L.; Frakes, L.A. Glendonites as a paleoenvironmental tool: Implications for early Cretaceous high latitude climates in Australia. Geochim. Cosmochim. Acta 1999, 633, 1039–1048. [Google Scholar] [CrossRef]
- Rogov, M.; Ershova, V.; Vereshchagin, O.; Vasileva, K.; Mikhailova, K.; Krylov, A. Database of global glendonite and ikaite records throughout the Phanerozoic. Earth Syst. Sci. Data 2021, 13, 343–356. [Google Scholar] [CrossRef]
- Tollefsen, E.; Balic-Zunic, T.; Mörth, C.M.; Brüchter, V.; Lee, C.C.; Skelton, A. Ikaite nucleation at 35 °C challenges the use of glendonite as a paleotemperature indicator. Sci. Rep. 2000, 10, 8141. [Google Scholar] [CrossRef]
- Brooks, R.; Clark, L.M.; Thurston, E.F. Calcium carbonate and its hydrates. Philos. Trans. R. Soc. A 1950, 243, 145–167. [Google Scholar] [CrossRef]
- Swainson, I.P.; Hammond, R.P. Ikaite, CaCO3.6H2O: Cold comfort for glendonites as palaeothermometers. Am. Mineral. 2001, 86, 1530–1533. [Google Scholar] [CrossRef]
- Selleck, B.W.; Carr, P.F.; Jones, B.G. A Review and Synthesis of Glendonites (Pseudomorphs after Ikaite) with New Data: Assessing Applicability as Recorders of Ancient Coldwater Conditions. J. Sediment. Res. 2007, 77, 980–991. [Google Scholar] [CrossRef] [Green Version]
- Pauly, H. ‘Ikaite’, a new mineral from Greenland. Arctic Res. 1963, 16, 263–279. [Google Scholar] [CrossRef] [Green Version]
- Bischoff, J.L.; Fitzpatrick, J.A.; Rosenbauer, R.J. The solubility and stabilization of ikaite (CaCO3· 6H2O) from 0 to 25 C: Environmental and paleoclimatic implications for thinolite tufa. J. Geol. 1993, 101, 21–33. [Google Scholar] [CrossRef]
- Stein, E.S.; Smith, A.J. Authigenic carbonate nodules in the Nankai Trough, site 583. Initial. Rep. Deep. Sea Drill. Proj. 1985, 87, 659–668. [Google Scholar]
- Council, T.C.; Bennett, P.C. Geochemistry of ikaite formation at Mono Lake, California: Implications for the origin of tufa mounds. Geology 1993, 21, 971–974. [Google Scholar] [CrossRef]
- Zou, Z.; Bertinetti, L.; Habraken, W.; Fratzl, P. Reentrant phase transformation from crystalline ikaite to amorphous calcium carbonate. CrystEngComm 2018, 20, 2902–2906. [Google Scholar] [CrossRef] [Green Version]
- Tang, C.C.; Thompson, S.P.; Parker, J.E.; Lennie, A.R.; Azough, F.; Kato, K. The ikaite-to-vaterite transformation: New evidence from diffraction and imaging. J. Appl. Crystallogr. 2009, 42, 225–233. [Google Scholar] [CrossRef]
- Németh, P.; Töchterle, P.; Dublyansky, Y.; Stalder, R.; Molnár, Z.S.; Klébert, S.Z. Spötl Tracing structural relicts of the ikaite-to-calcite transformation in cryogenic cave glendonite. Am. Mineral 2021. submitted. [Google Scholar]
- Reeder, R.J.; Wenk, H.R. Microstructures in low-temperature dolomites. Geophys. Res. Lett. 1979, 6, 77–80. [Google Scholar] [CrossRef]
- Redfern, S.A.T.; Salje, E.; Navrotsky, A. High-temperature enthalpy at the orientational order-disorder transition in calcite: Implications for the calcite/aragonite phase equilibrium. Contrib. Mineral. Petrol. 1989, 101, 479–484. [Google Scholar] [CrossRef]
- Van Tendeloo, G.; Wenk, H.R.; Gronsky, R. Modulated structures in calcium dolomite: A study by electron microscopy. Phys. Chem. Miner. 1985, 12, 333–341. [Google Scholar] [CrossRef]
- Wenk, H.R.; Meisheng, H.; Lindsey, T.; Morris, J.W. Superstructure in ankerite and calcite. Phys. Chem. Miner. 1991, 17, 527–539. [Google Scholar] [CrossRef]
- Shen, Z.; Konishi, H.; Brown, P.E.; Xu, H. STEM investigation of exsolution lamellae and “c” reflections in Ca-rich dolomite from the Platteville Formation, western Wisconsin. Am. Mineral. 2013, 4, 760–766. [Google Scholar] [CrossRef] [Green Version]
- Nespolo, M.; Ferraris, G. Applied geminography—Symmetry analysis of twinned crystals and definition of twinning by reticular polyholohedry. Acta Crystallogr. A 2004, 60, 89–95. [Google Scholar] [CrossRef]
- Dublyansky, Y.; Moseley, G.E.; Lyakhnitsky, Y.; Cheng, H.; Edwards, R.L.; Scholz, D.; Spötl, C. Late Palaeolithic cave art and permafrost in the Southern Ural. Sci. Rep. 2018, 8, 12080. [Google Scholar] [CrossRef] [PubMed]
- Seto, Y.D.; Hamane, T.N.; Sata, N. Development of a software suite on X-ray diffraction experiments. Rev. High Press. Sci. Technol. 2010, 20, 269–276. [Google Scholar] [CrossRef] [Green Version]
- Zsigmond, A.R.; Kántor, I.; May, Z.; Urák, I.; Héberger, K. Elemental composition of Russula cyanoxantha along an urbanization gradient in Cluj-Napoca (Romania). Chemosphere 2020, 238, 124566. [Google Scholar] [CrossRef]
- Momma, K.; Izumi, F. VESTA 3 for three-dimensional visualization of crystal, volumetric and morphology data. J. Appl. Crystallogr. 2011, 44, 1272–1276. [Google Scholar] [CrossRef]
- Nespolo, M.; Ferraris, G. The derivation of twin laws in non-merohedric twins—Application to the analysis of hybrid twins. Acta Crystallogr. A 2006, 62, 336–349. [Google Scholar] [CrossRef]
- Németh, P.; Garvie, L.A.J.; Aoki, T.; Dubrovinskaia, N.; Dubrovinsky, L.; Buseck, P.R. Lonsdaleite is faulted and twinned cubic diamond and does not exist as a discrete material. Nat. Commun. 2014, 5, 5447. [Google Scholar] [CrossRef] [PubMed] [Green Version]
- Daulton, T.L.; Bernatowicz, T.J.; Lewis, R.S.; Messenger, S.; Stadermann, F.J.; Amari, S. Polytype distribution in circumstellar silicon carbide: Microstructural characterization by transmission electron microscopy. Geochim. Cosmochim. Acta 2003, 67, 4743–4767. [Google Scholar] [CrossRef]
- Bruno, M.; Massaro, F.R.; Rubbo, M.; Prencipe, M.; Aquilano, D. The (10.4), (01.8), (01.2) and (00.1) twin laws of calcite (CaCO3): Equilibrium geometry of the twin boundary interfaces and twinning energy. Cryst. Growth Des. 2010, 10, 3102–3109. [Google Scholar] [CrossRef]
- Aquilano, D.; Benages-Vilau, R.; Bruno, M.; Rubbo, M.; Massaro, F. Positive {hk.l} and negative {hk.l} forms of calcite (CaCO3) crystal. New open questions from the evaluation of their surface energies. CrystEngComm 2013, 15, 4465. [Google Scholar] [CrossRef]
- Wenk, H.R.; Barber, D.J.; Reeder, R.J. Microstructures in Carbonates. In Carbonates: Mineralogy and Chemistry; Reeder, R.J., Ed.; Reviews in Mineralogy; Mineralogical Society of America: Blacksburg, VA, USA, 1983; Volume 11, pp. 301–367. [Google Scholar] [CrossRef]
Figure 1.
(a) Structure of calcite seen along [010]. In order, the large blue circles and red and black dots represent Ca, O and C atoms. The (104) plane is marked with a blue line. (b) 0kl diffraction plane of Rc calcite with a-type reflections (empty circles). (c) 0kl diffraction plane with c-type reflections (blue dots) occurring halfway between a-type reflections.

Figure 2.
(a) BSE image and EDX data of the studied glendonite. (b) Elements present in glendonite. (c) X-ray powder diffraction pattern of glendonite calcite. Si standard was added for measuring the cell parameters.
Figure 2.
(a) BSE image and EDX data of the studied glendonite. (b) Elements present in glendonite. (c) X-ray powder diffraction pattern of glendonite calcite. Si standard was added for measuring the cell parameters.

Figure 3.
(a) BFTEM image of a ~10 nm size (104) twinned domain within the calcite matrix. The areas 1 and 2, marked by white circles, are magnified in Figure 4 and Figure 5, respectively. (b) The SAED pattern along [010] obtained from a ~200 nm size region shown in (a) reveals weak c-type reflections (white arrows). (c) The interpretation of the SAED pattern (b) via (104) twinning. The splitting of the overlapping reflections (white squares) increases with increasing diffraction angle (white arrows). Black arrows mark reflections arising from dynamically scattered electrons of the (104) twin hosted within a calcite matrix. (d) The interpretation of the SAED pattern (b) with the pseudo-orthorhombic twin cell (hk0 diffraction plane). Large-size black dots denote the reflections marked by black arrows in (c).

Figure 4.
(a) HRTEM image of a ~10 nm size (104) twinned domain within calcite along [010] (area shown in Figure 3a with white circle 1). Blue and red lines show d10-2 spacings of three polysynthetic twinned individuals. Black and white lines show single and doubled d104 spacings, respectively. FFTs calculated from regions 1 (b) and 2 (c) correspond to twin individuals 1 and 2. (d) FFT calculated from region 3 corresponds to an area where individual 2 is hosted in the calcite matrix. (e) FFT calculated from the entire HRTEM image (a) shows a diffraction pattern similar to inset (d). Dynamically scattered electrons arising from the thick part of the sample result in reflections marked by black arrows in (d) and (e). The FFTs of (d) and (e) are interpreted with the pseudo-orthorhombic twin cell. White arrows mark the streaked reflections for (d) and (e), which are indicative for (104) stacking faults.

Figure 5.
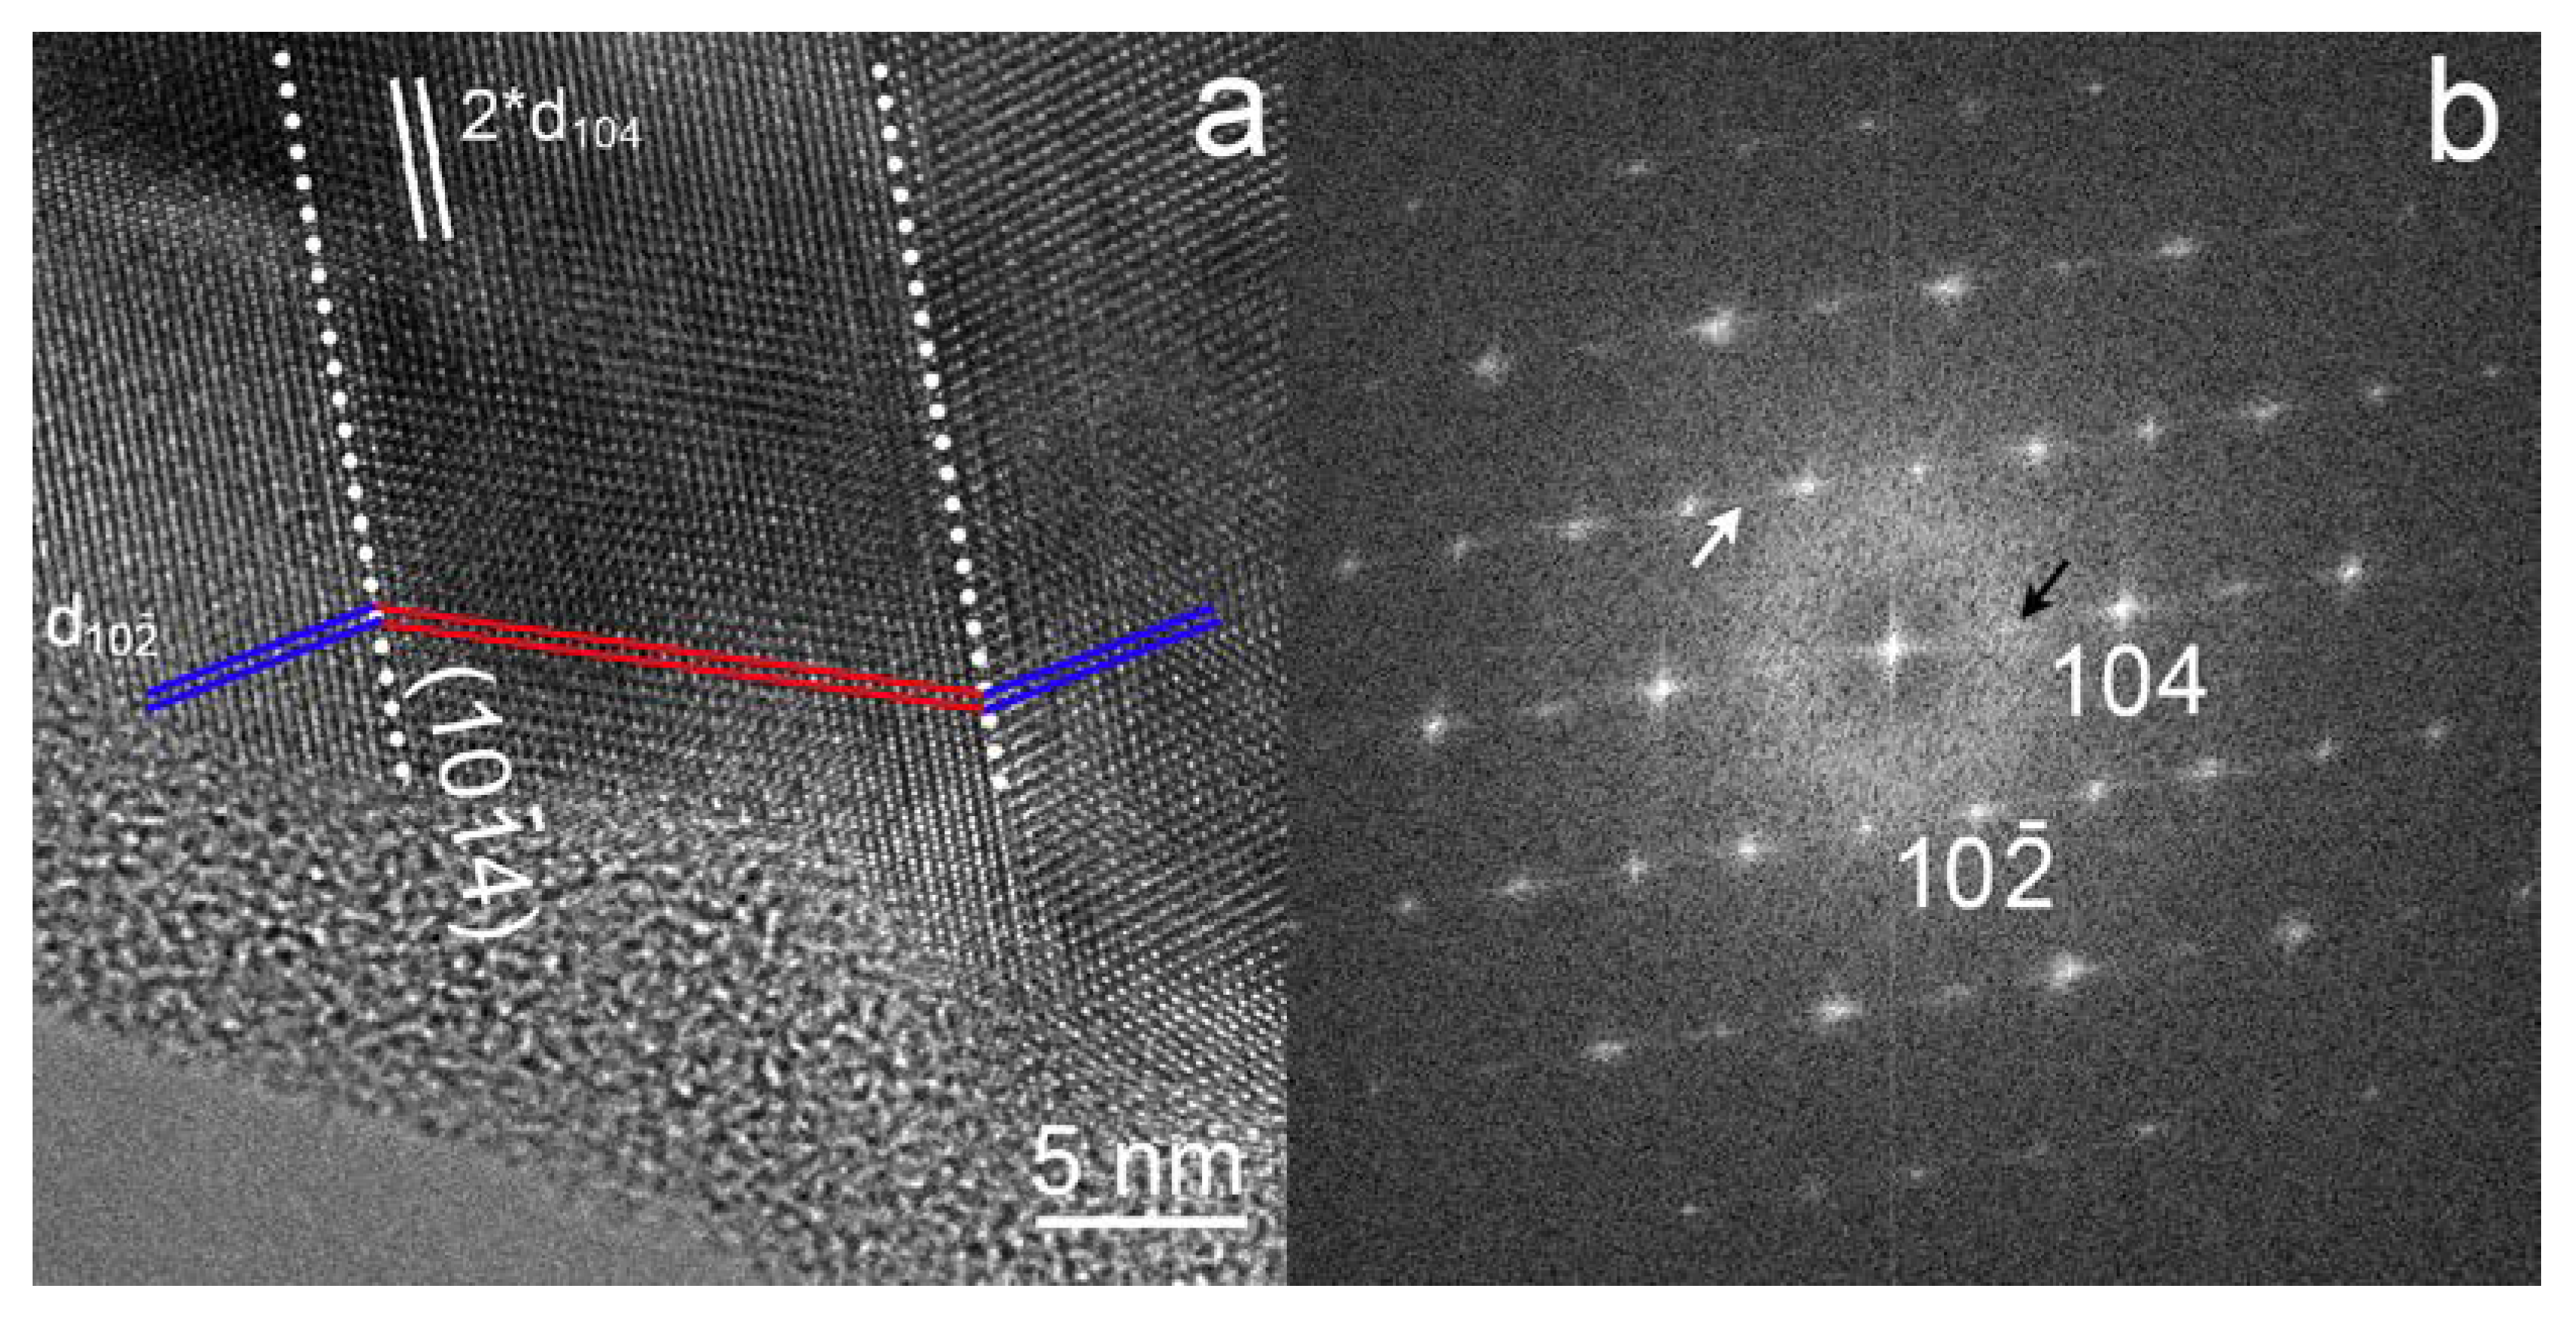
(a) HRTEM image of a ~15 nm size (104) twin domain within calcite along [010] (area shown in Figure 3a with white circle 2). Blue and red lines mark d10-2 spacings of the twin individuals. White lines mark doubled d104 spacings. (b) FFT calculated from the HRTEM image (a) showing c-type reflections (black arrow). The FFT is indexed according to rhombohedral calcite. The white arrow shows streaked reflections, which can indicate (104) stacking faults.
Figure 5.
(a) HRTEM image of a ~15 nm size (104) twin domain within calcite along [010] (area shown in Figure 3a with white circle 2). Blue and red lines mark d10-2 spacings of the twin individuals. White lines mark doubled d104 spacings. (b) FFT calculated from the HRTEM image (a) showing c-type reflections (black arrow). The FFT is indexed according to rhombohedral calcite. The white arrow shows streaked reflections, which can indicate (104) stacking faults.


Publisher’s Note: MDPI stays neutral with regard to jurisdictional claims in published maps and institutional affiliations. |
© 2021 by the author. Licensee MDPI, Basel, Switzerland. This article is an open access article distributed under the terms and conditions of the Creative Commons Attribution (CC BY) license (https://creativecommons.org/licenses/by/4.0/).
Share and Cite
MDPI and ACS Style
Németh, P. Diffraction Features from (101¯4) Calcite Twins Mimicking Crystallographic Ordering. Minerals 2021, 11, 720. https://0-doi-org.brum.beds.ac.uk/10.3390/min11070720
AMA Style
Németh P. Diffraction Features from (101¯4) Calcite Twins Mimicking Crystallographic Ordering. Minerals. 2021; 11(7):720. https://0-doi-org.brum.beds.ac.uk/10.3390/min11070720
Chicago/Turabian StyleNémeth, Péter. 2021. "Diffraction Features from (101¯4) Calcite Twins Mimicking Crystallographic Ordering" Minerals 11, no. 7: 720. https://0-doi-org.brum.beds.ac.uk/10.3390/min11070720
Note that from the first issue of 2016, this journal uses article numbers instead of page numbers. See further details here.