
NIR-MID Reflectance and Emissivity Study at Different Temperatures of Sodium Carbonate Minerals: Spectra Characterization and Implication for Remote Sensing Identification

 , ,
, ,
Abstract
:1. Introduction
Spectroscopy Properties of CO32− and H2O/OH Groups
2. Materials and Methods
2.1. Samples
2.2. Emissivity and Reflectance Measurements
2.3. Emissivity and Reflectance Data Reduction
2.4. X-ray Diffraction Measurements and Rietveld Analysis
3. Results
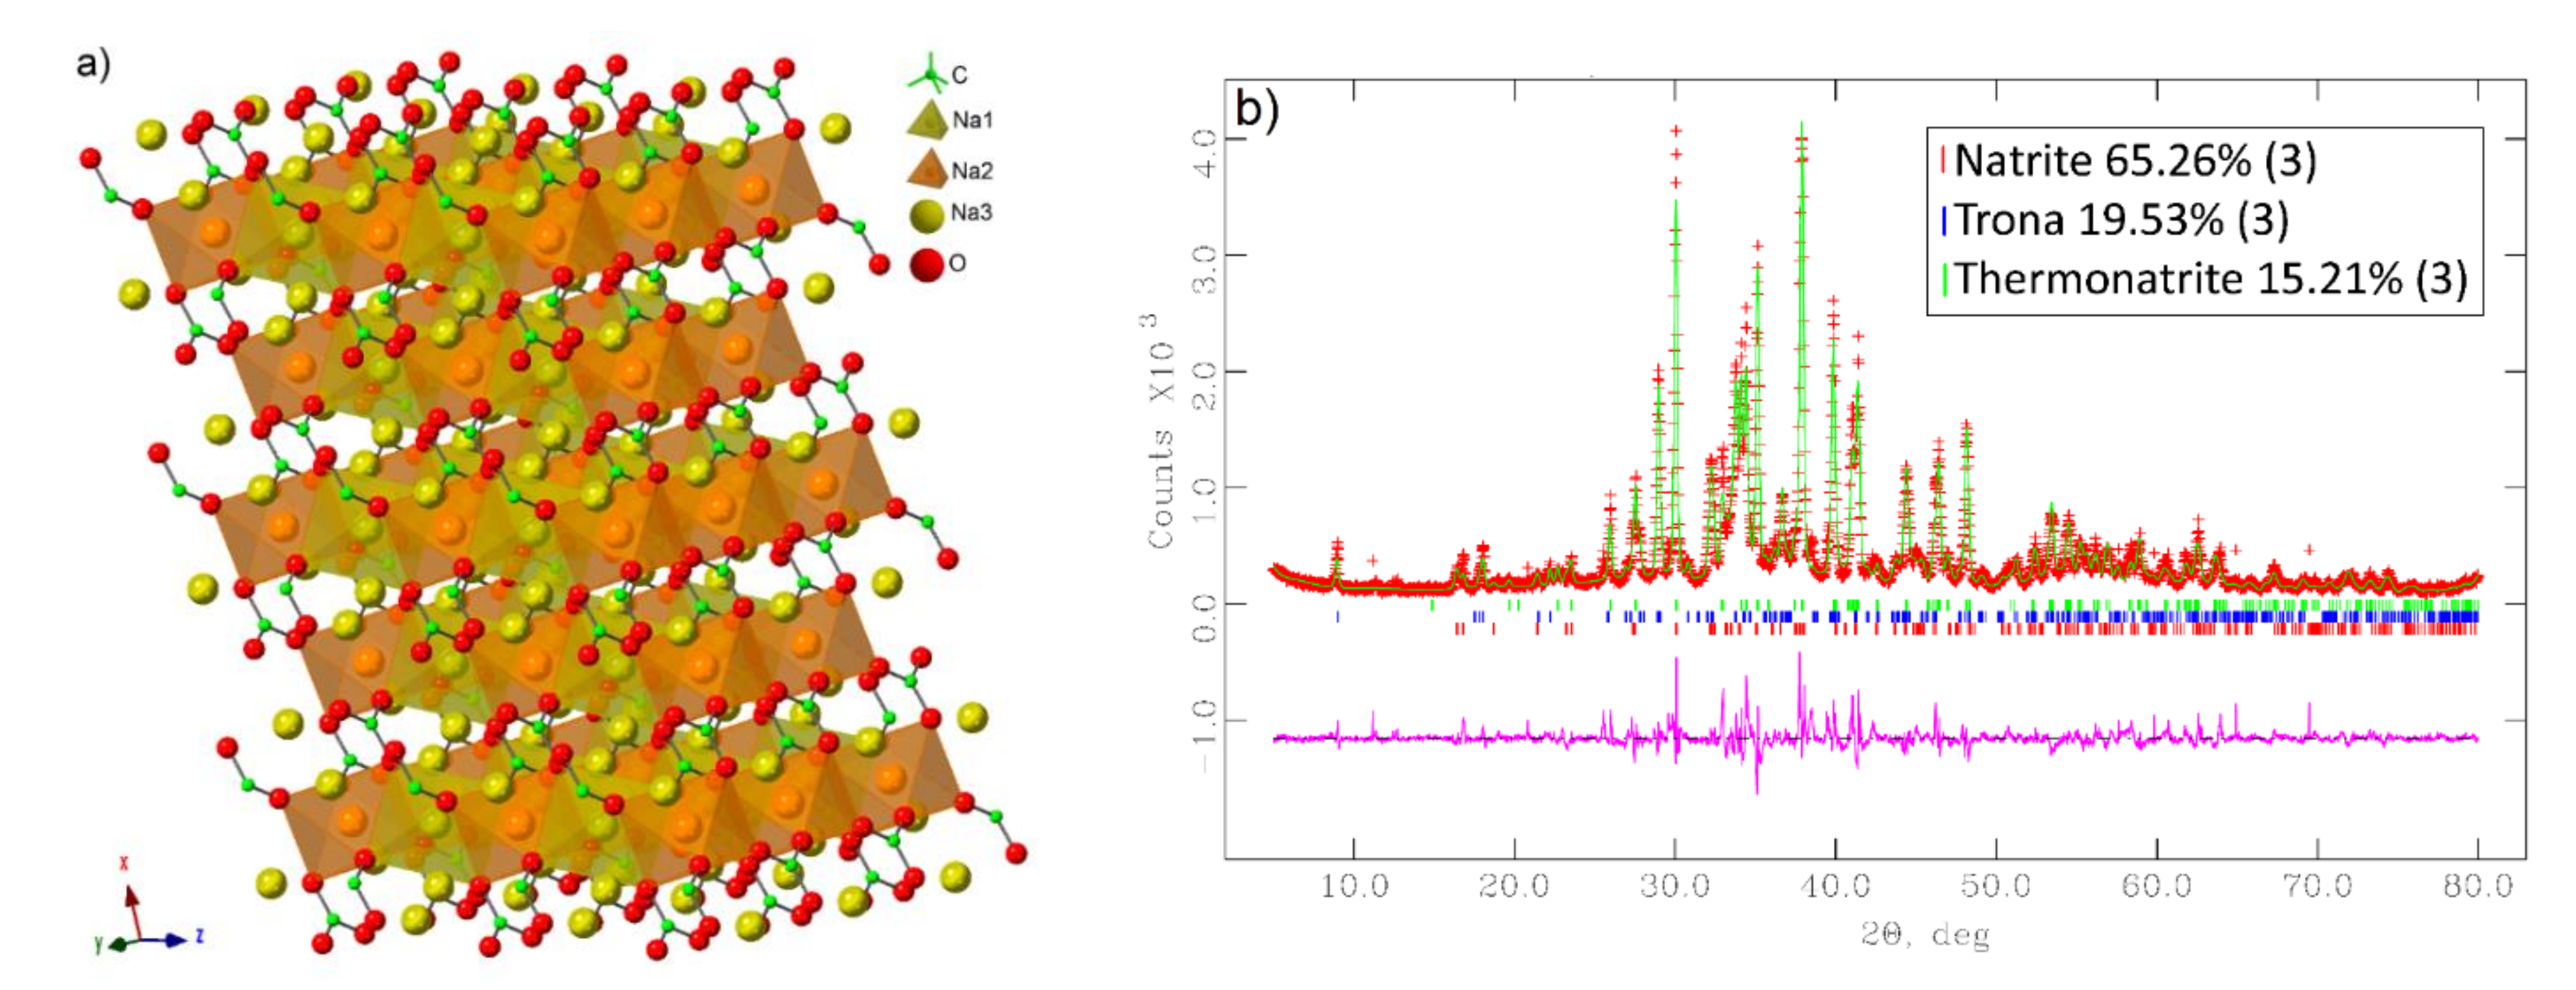
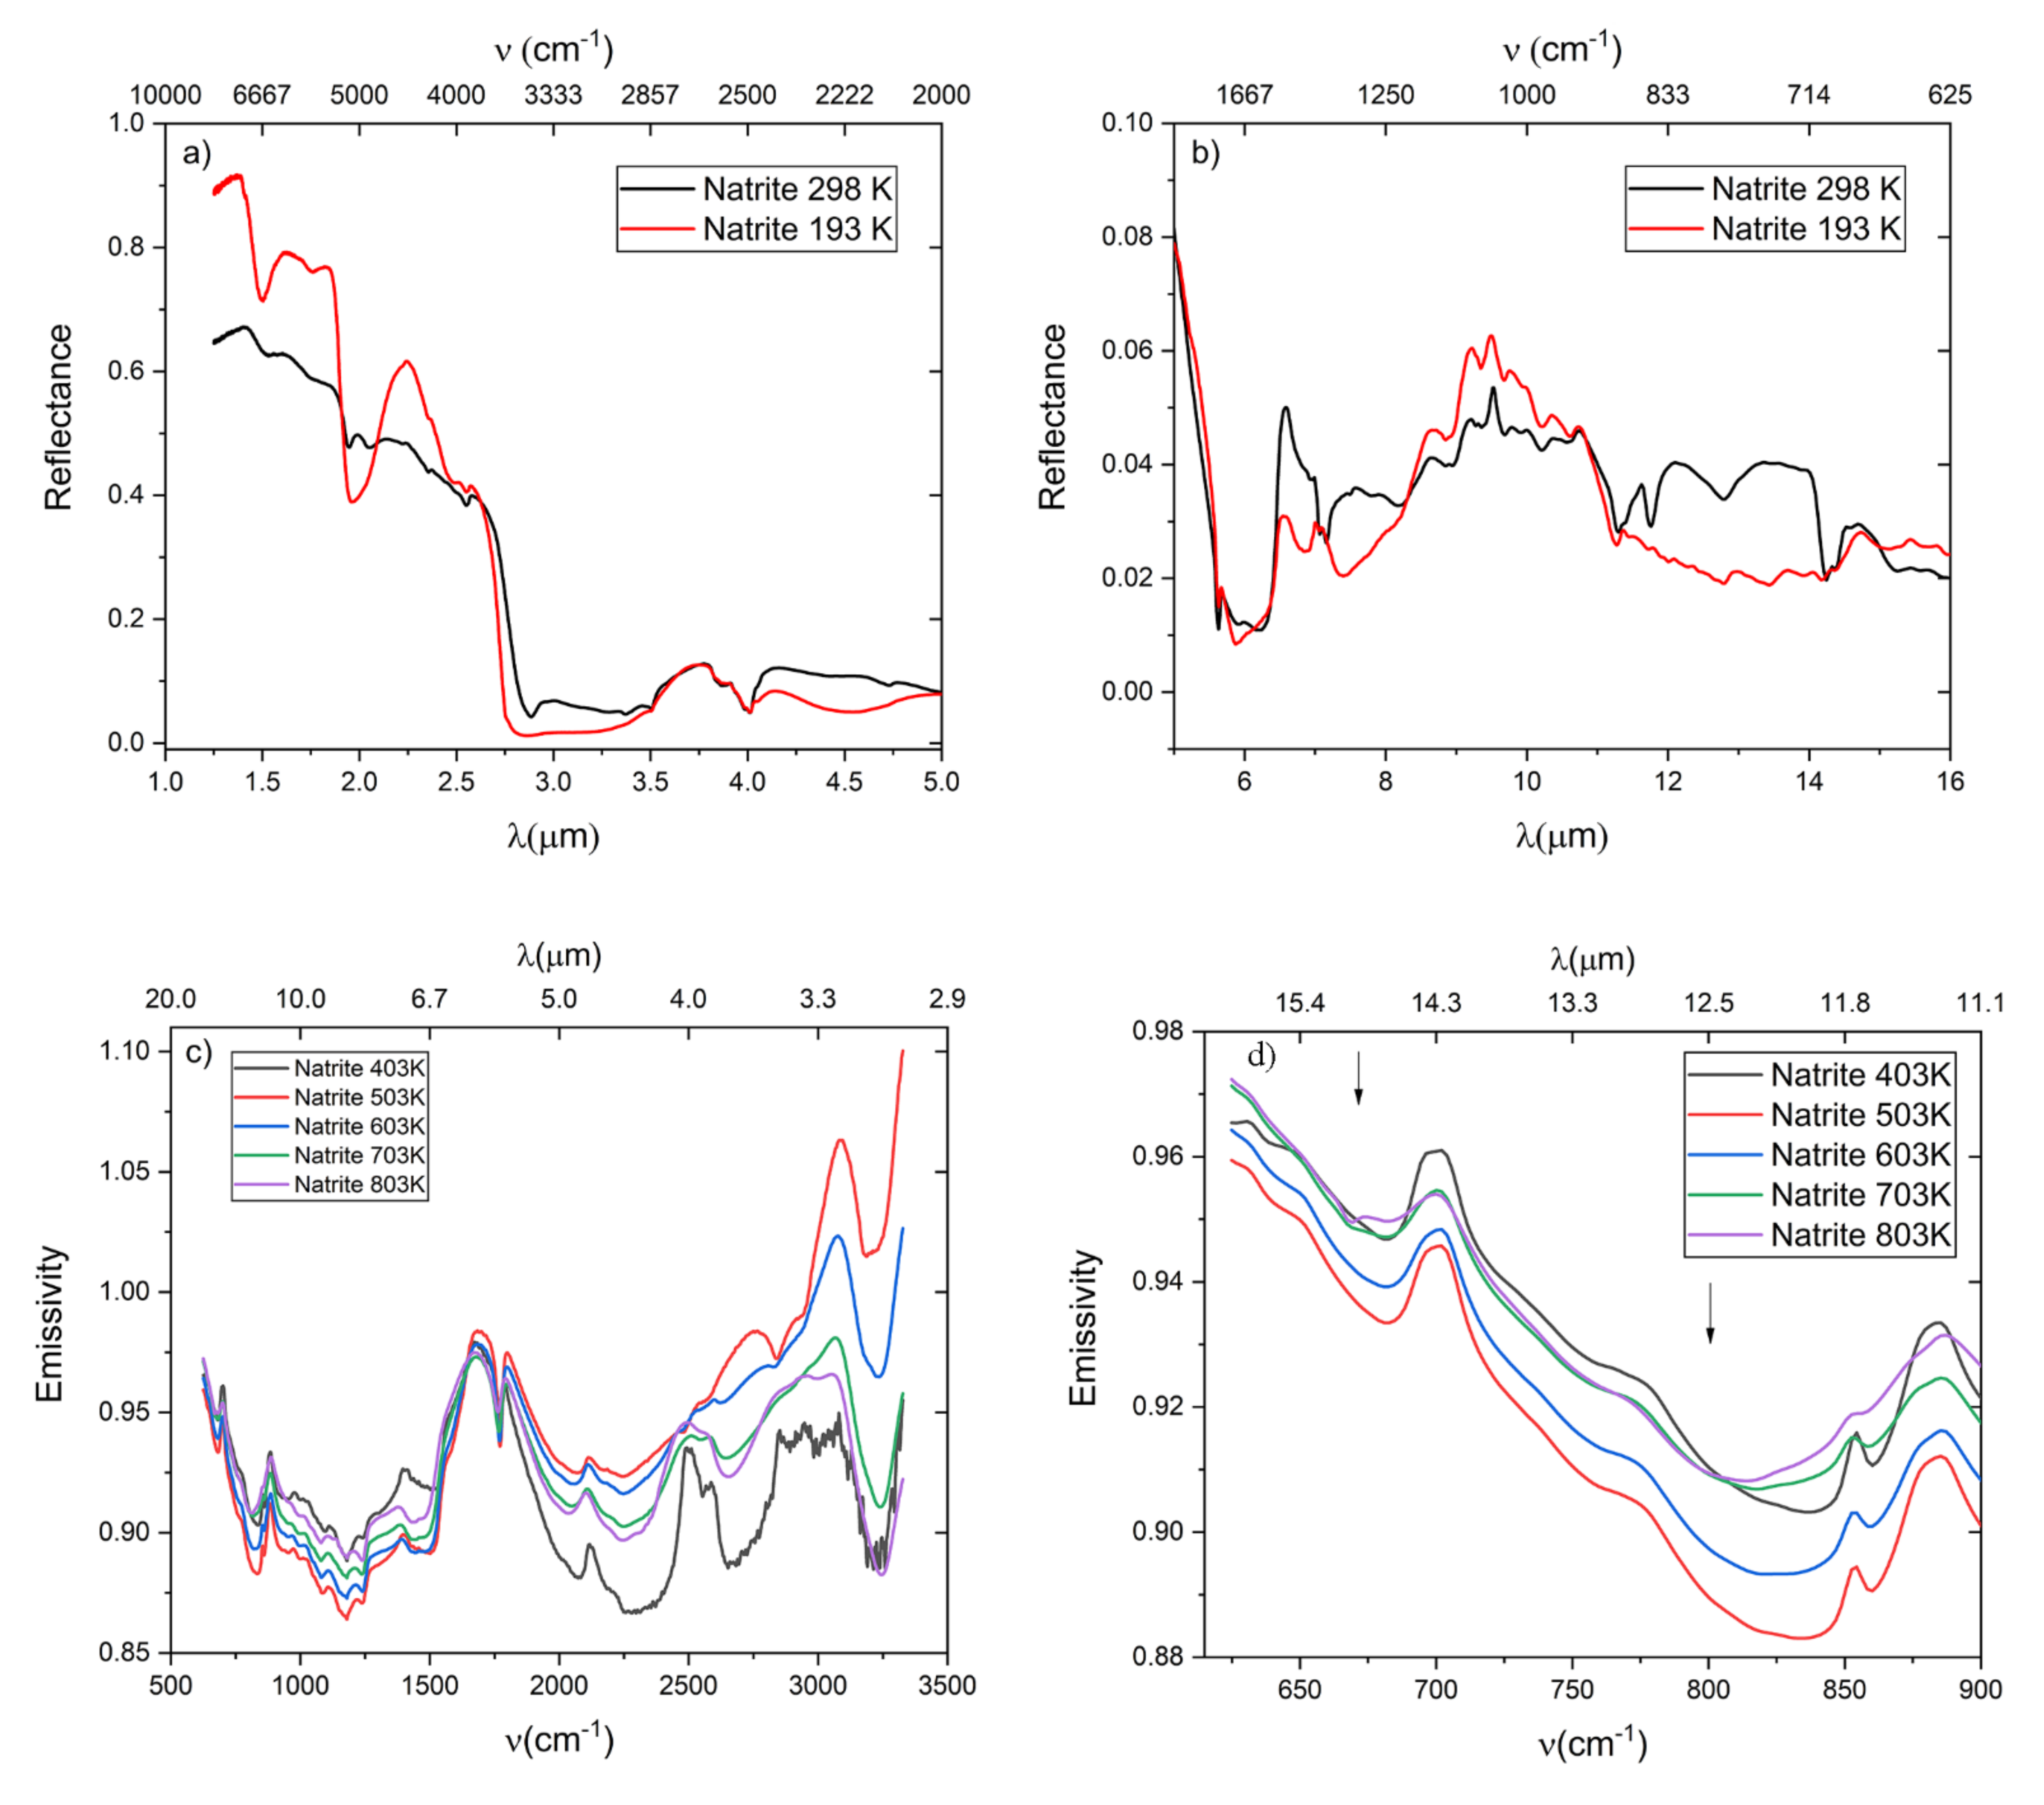
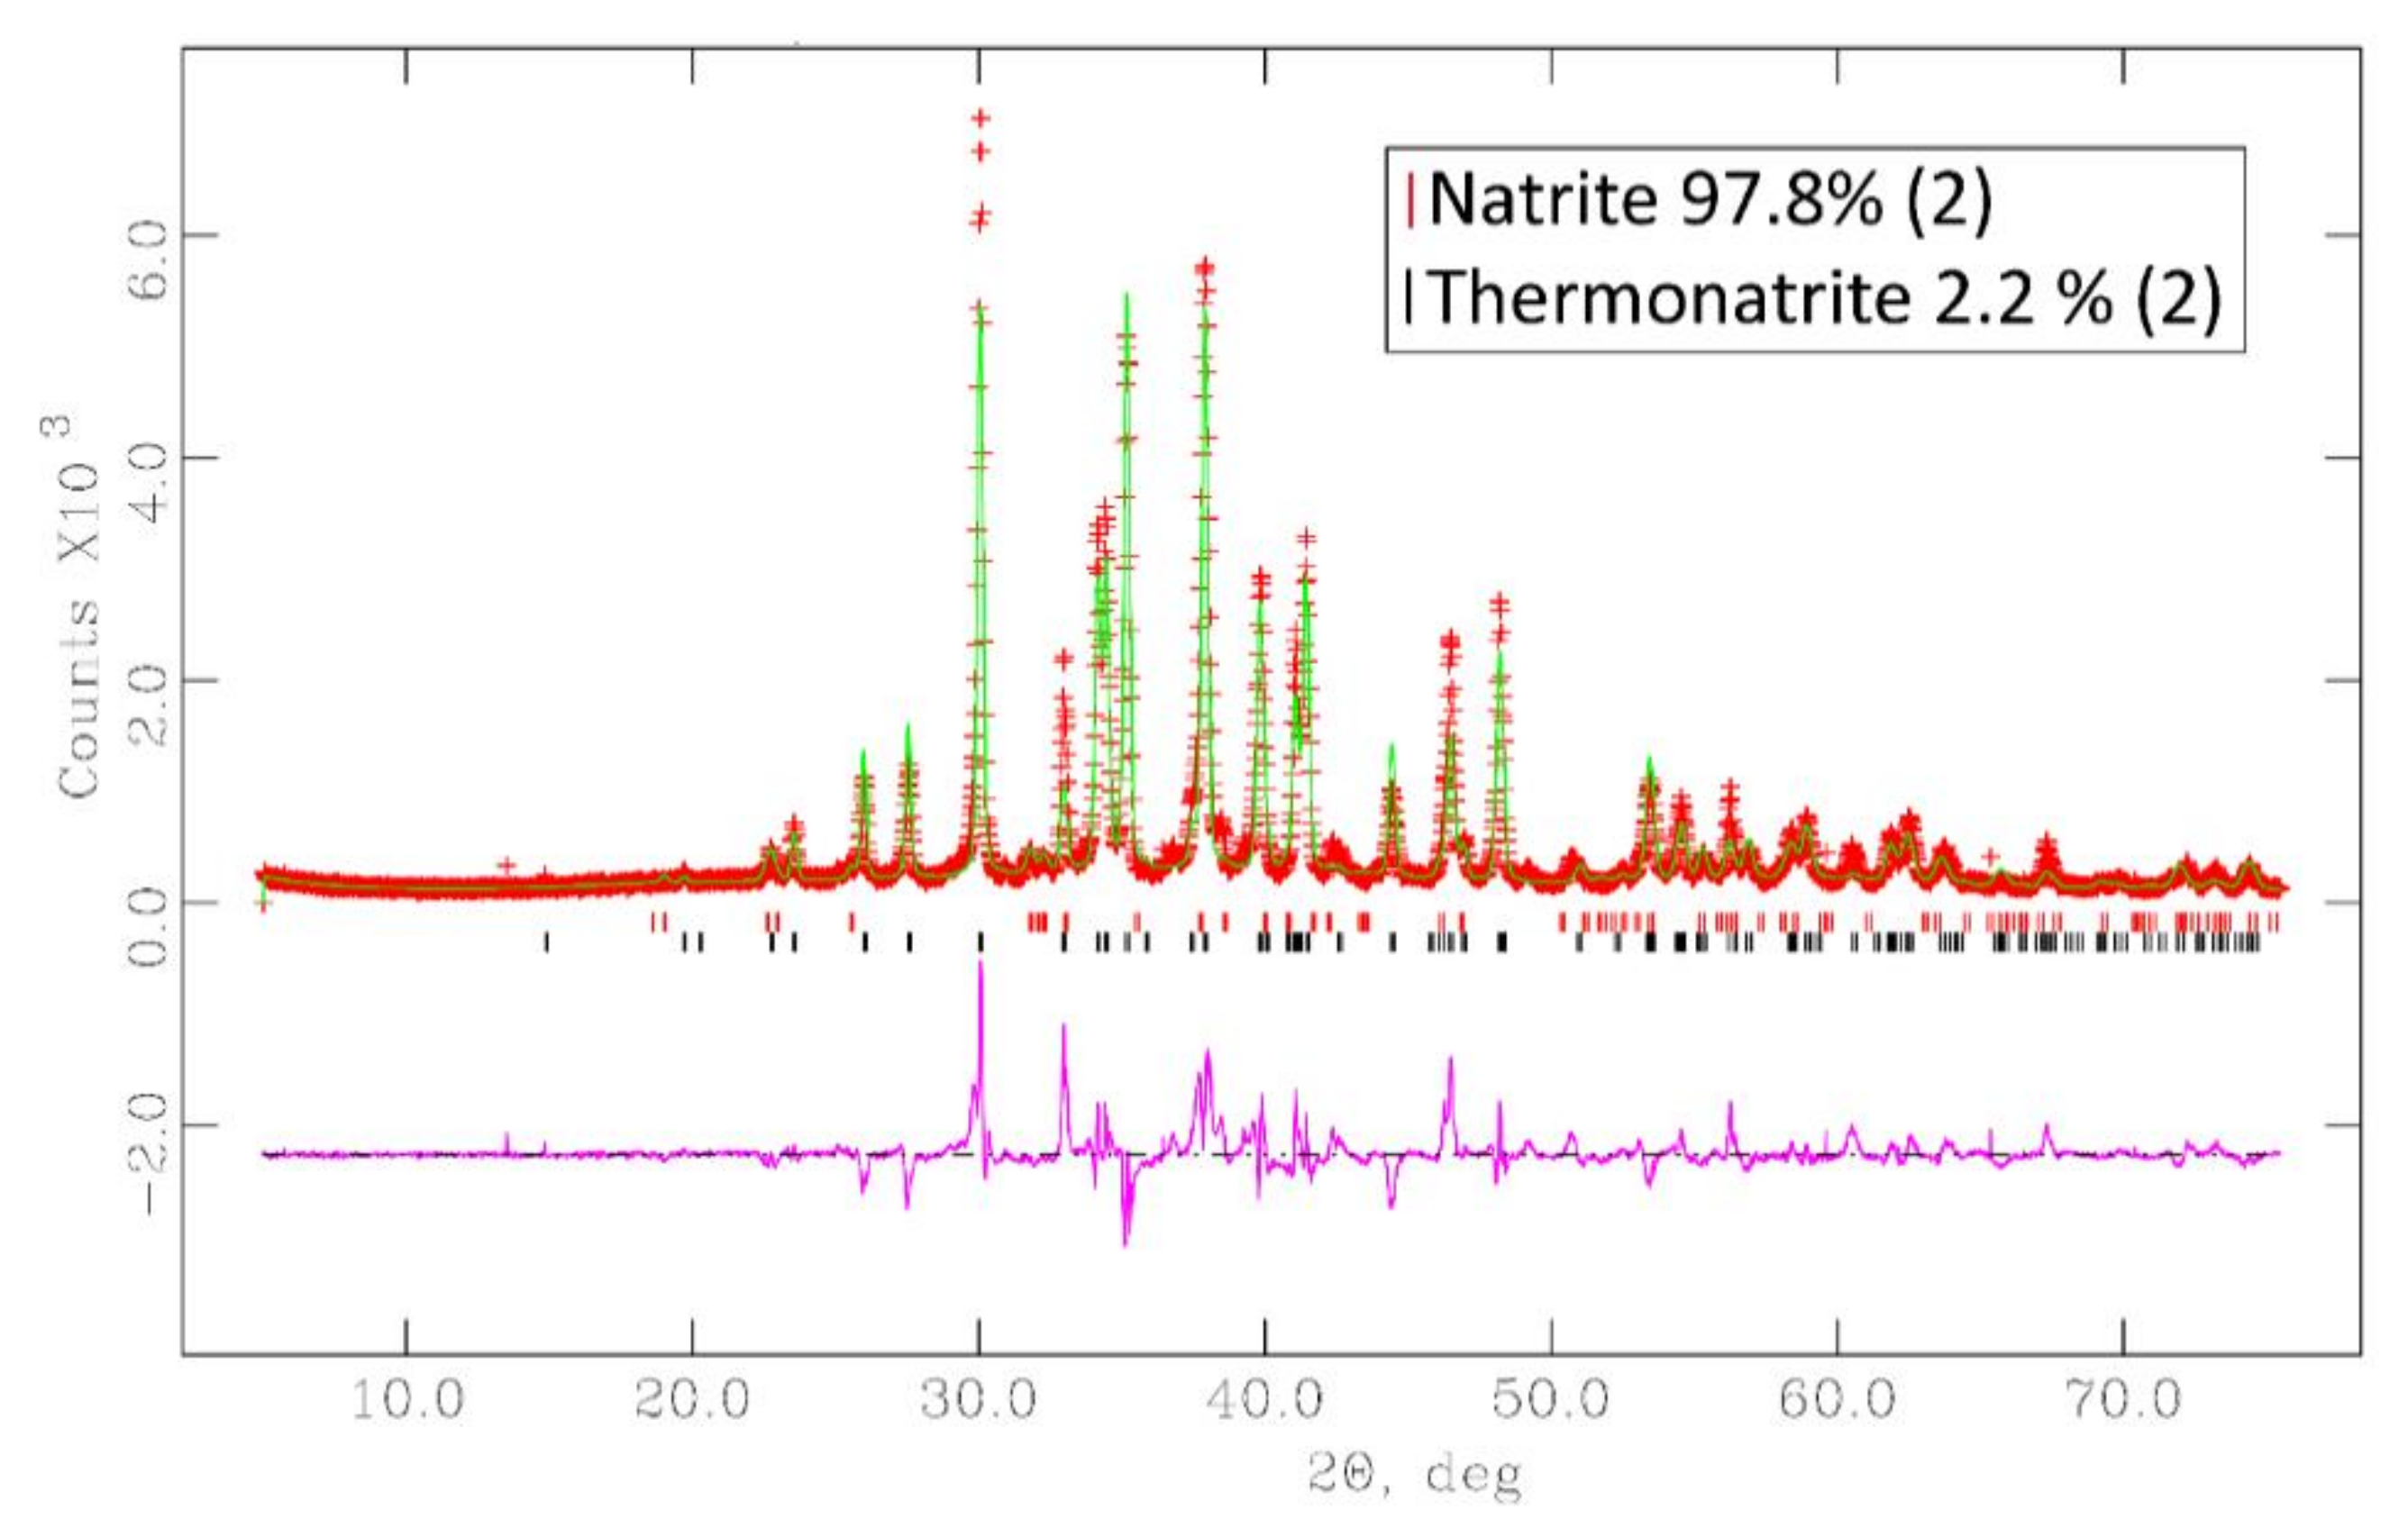
3.1. Natrite Na2CO3
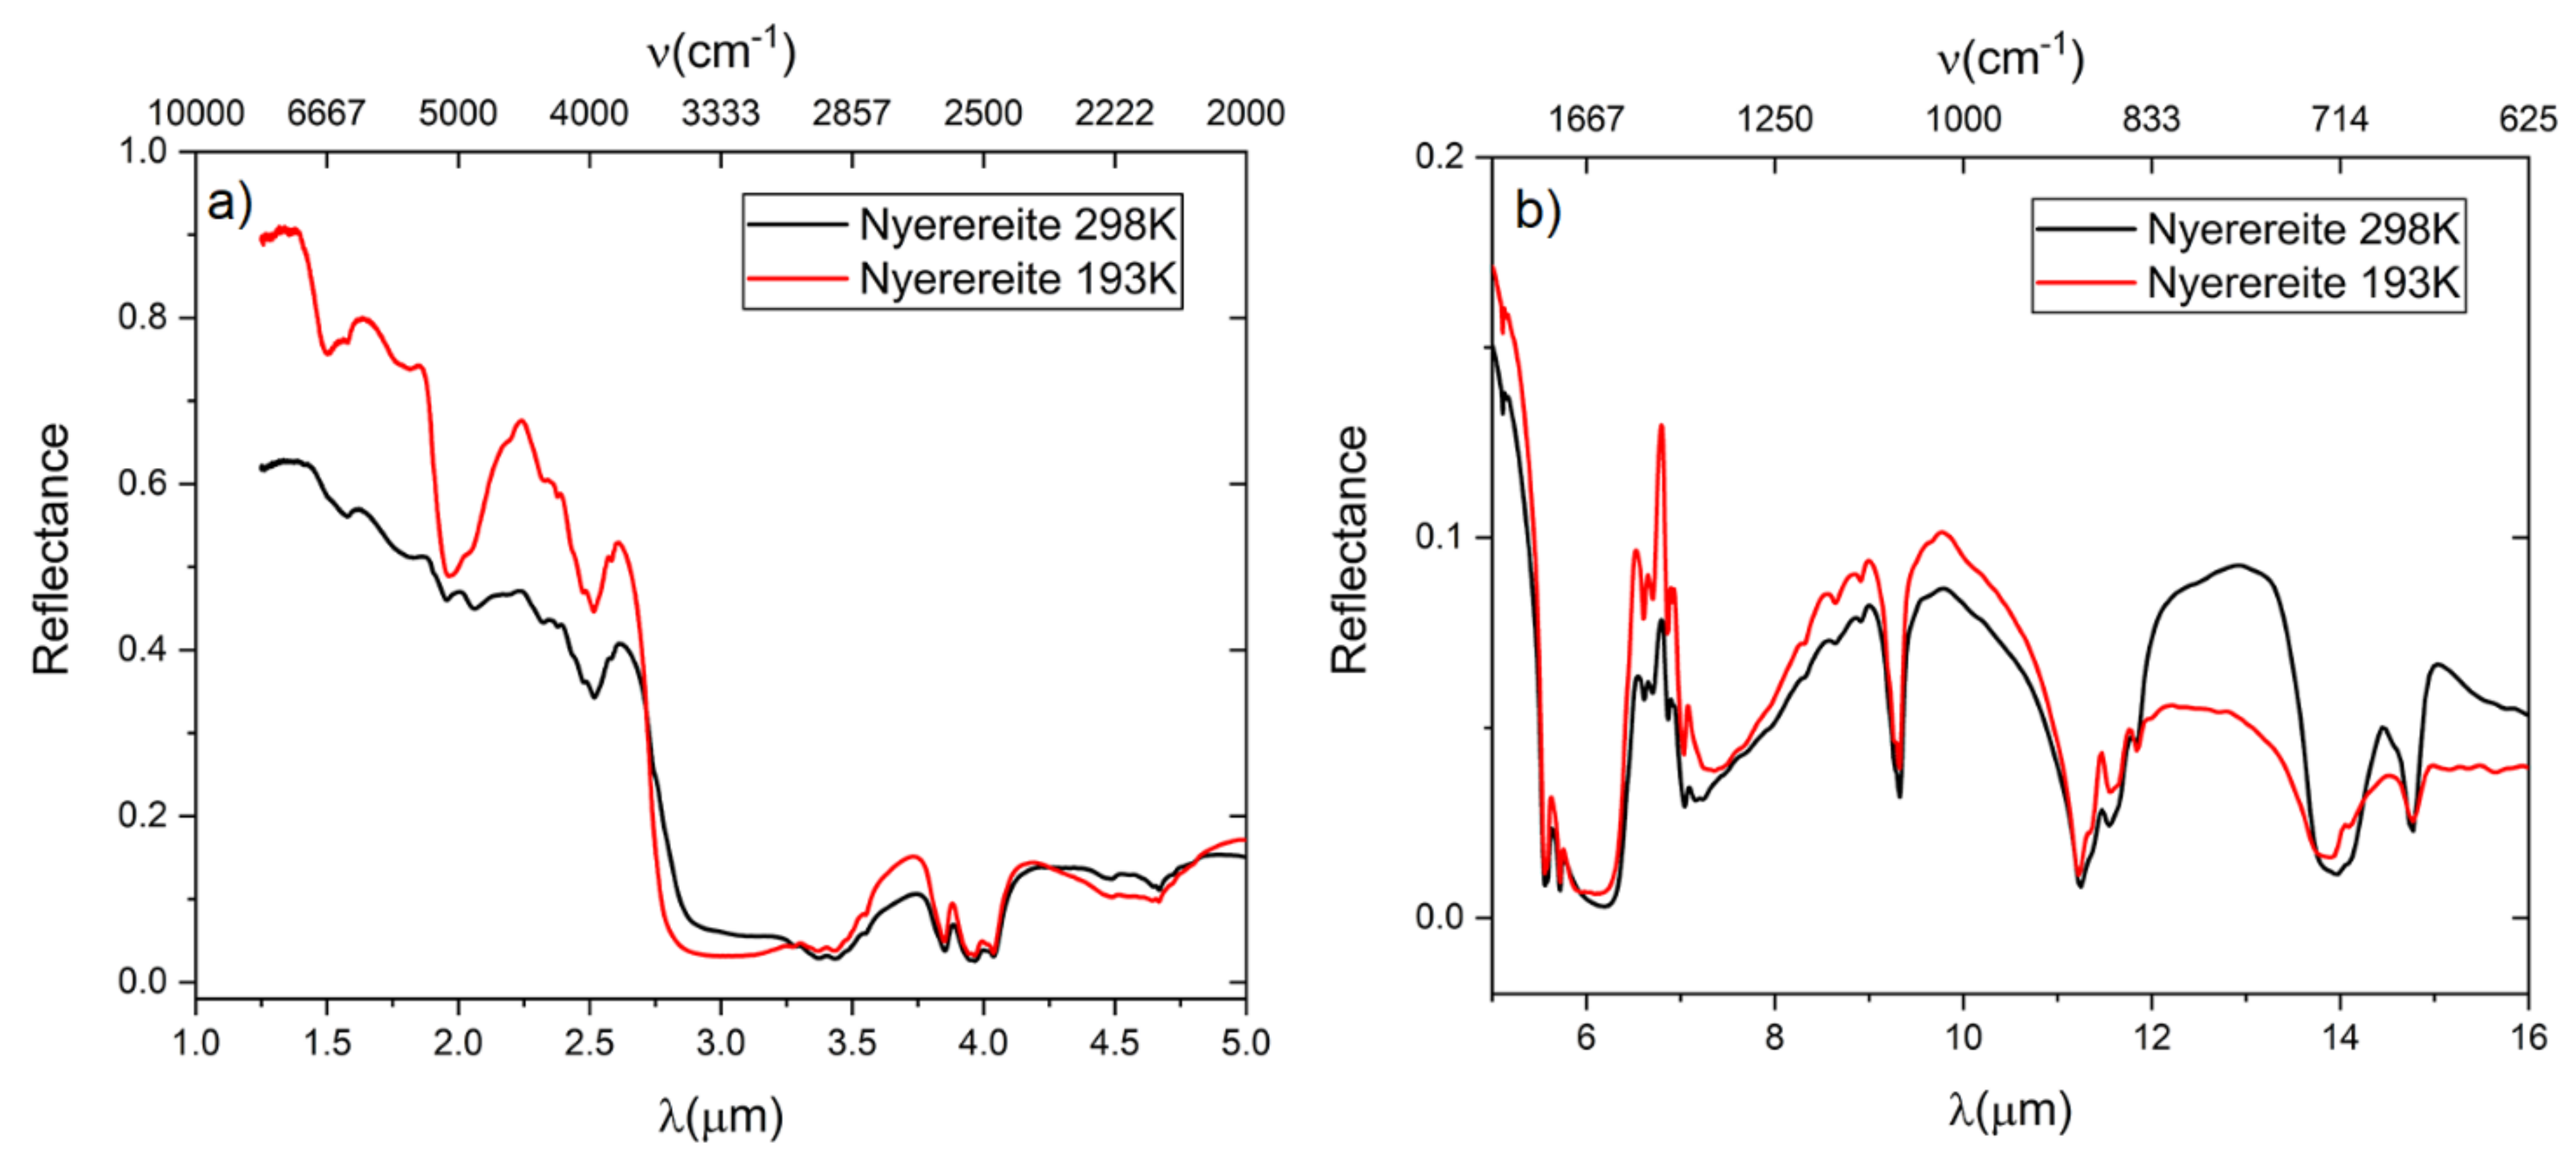
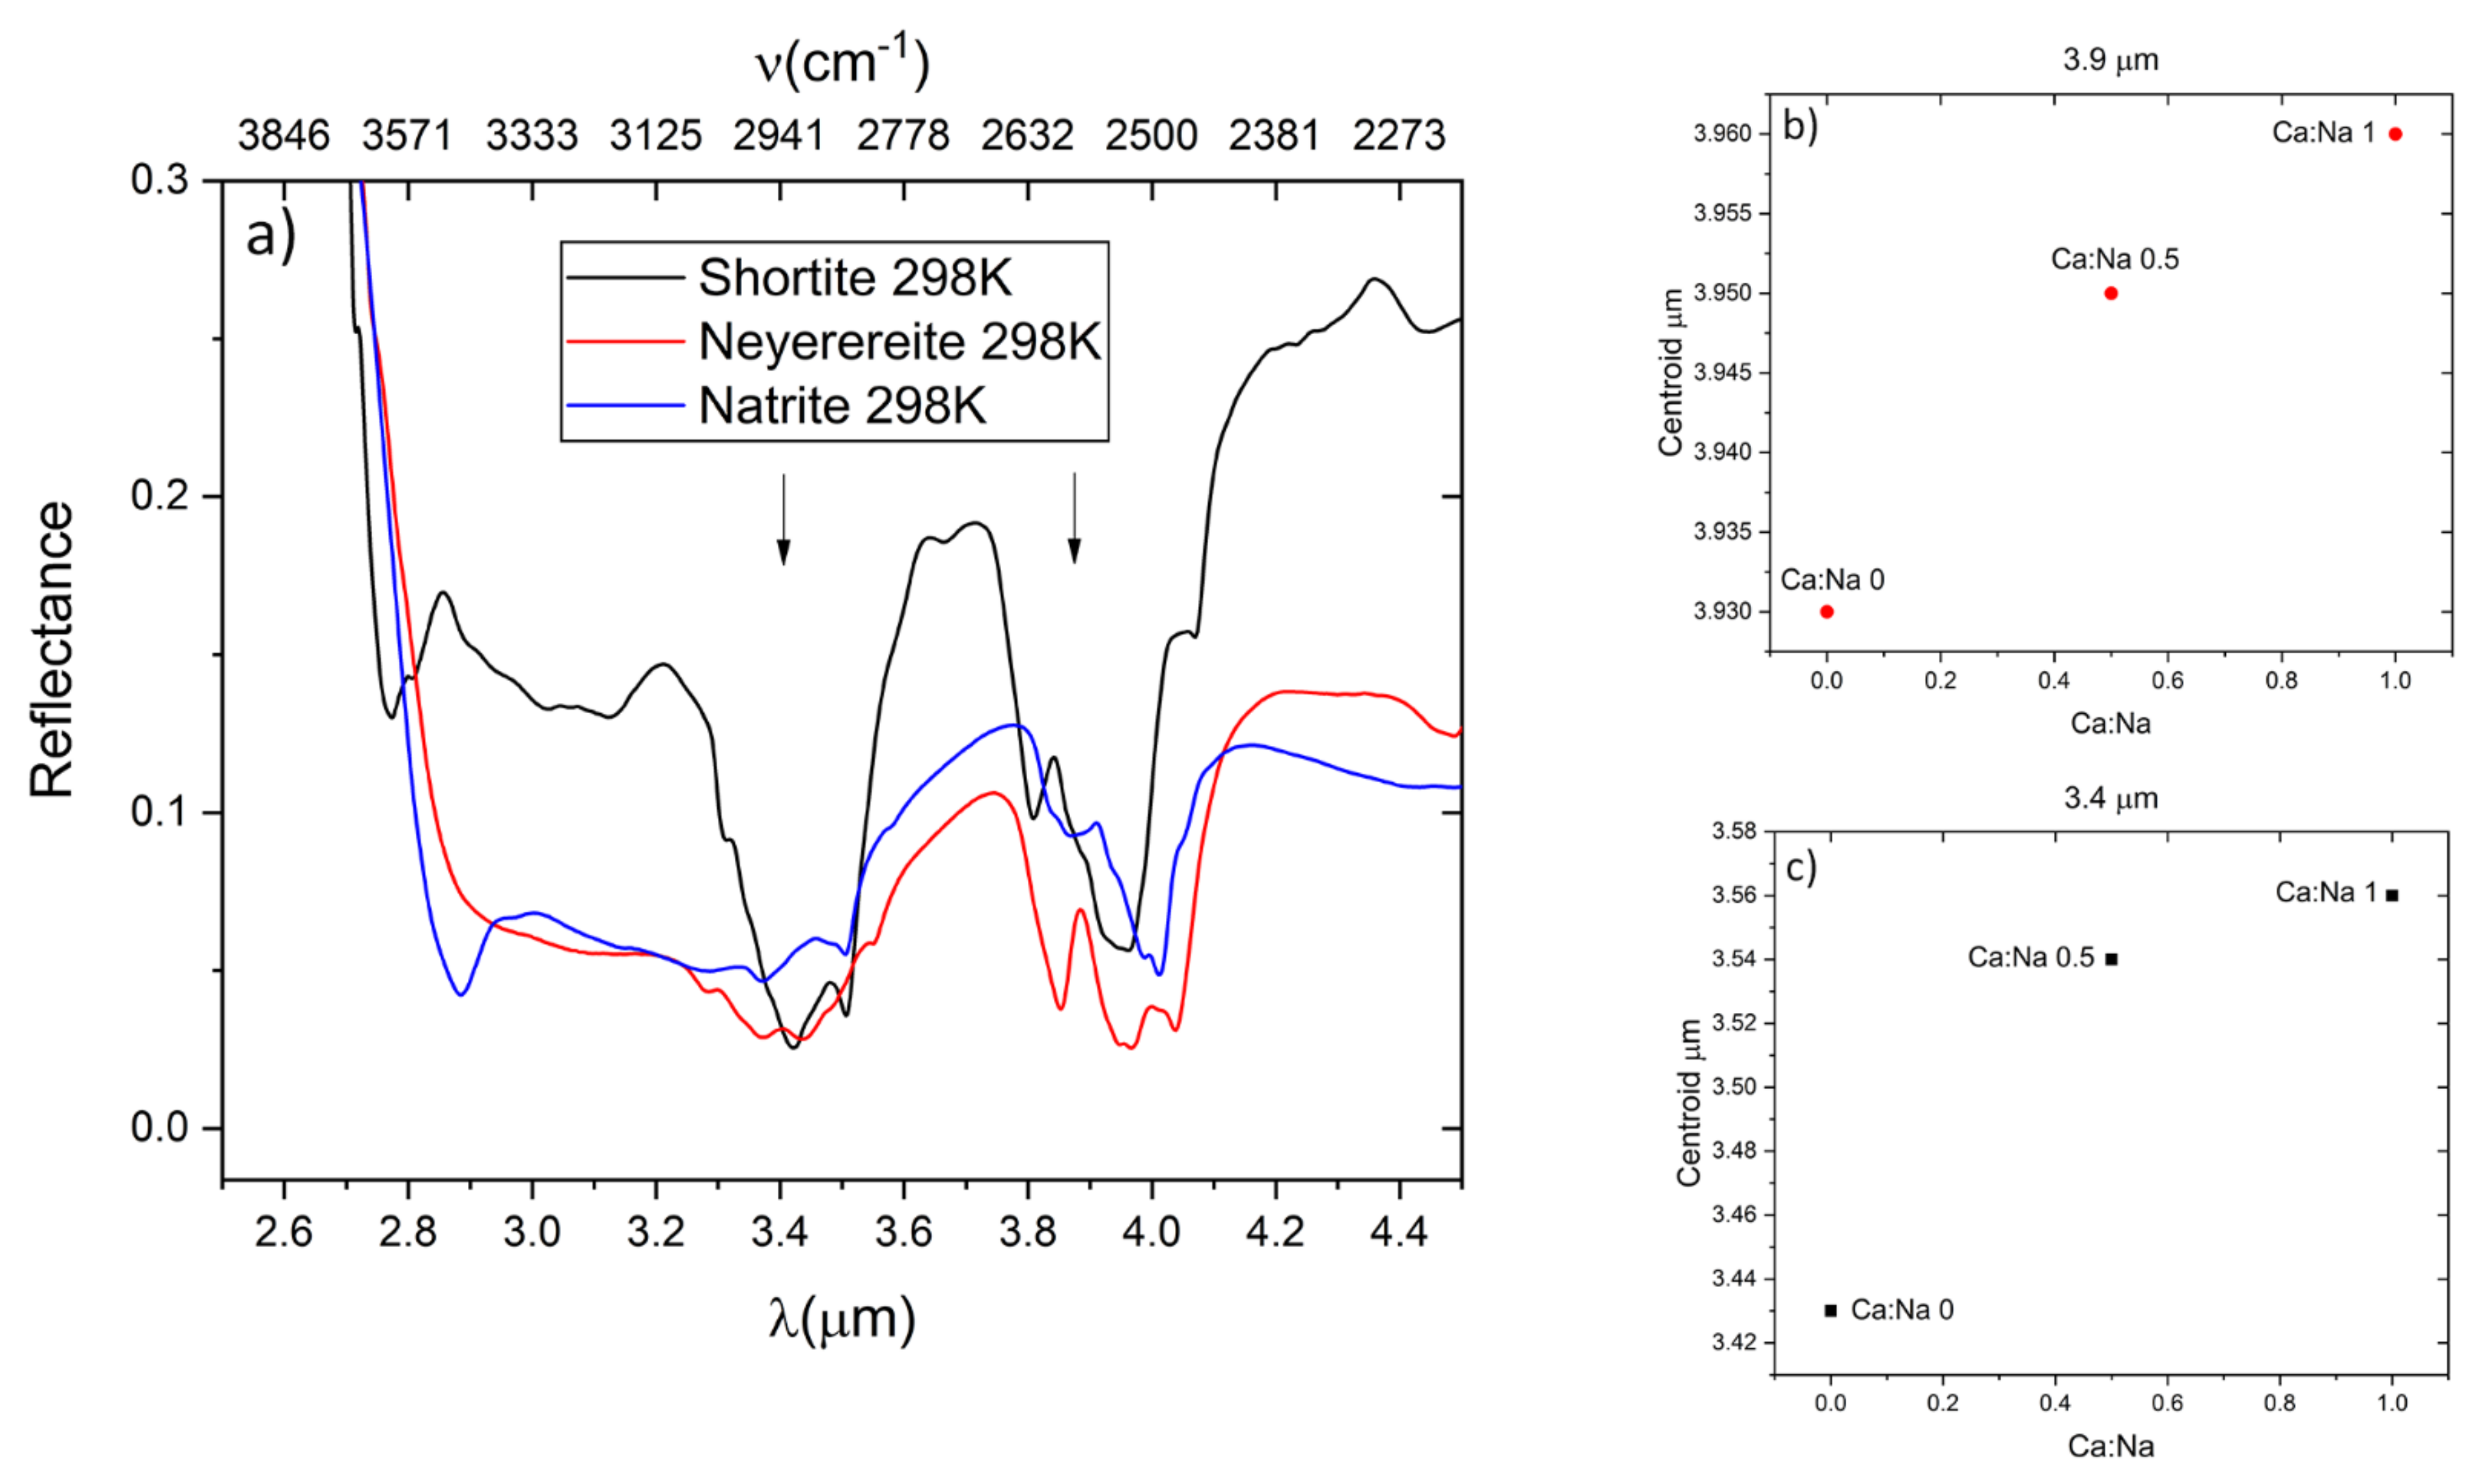
3.2. Nyerereite Na2Ca(CO3)2
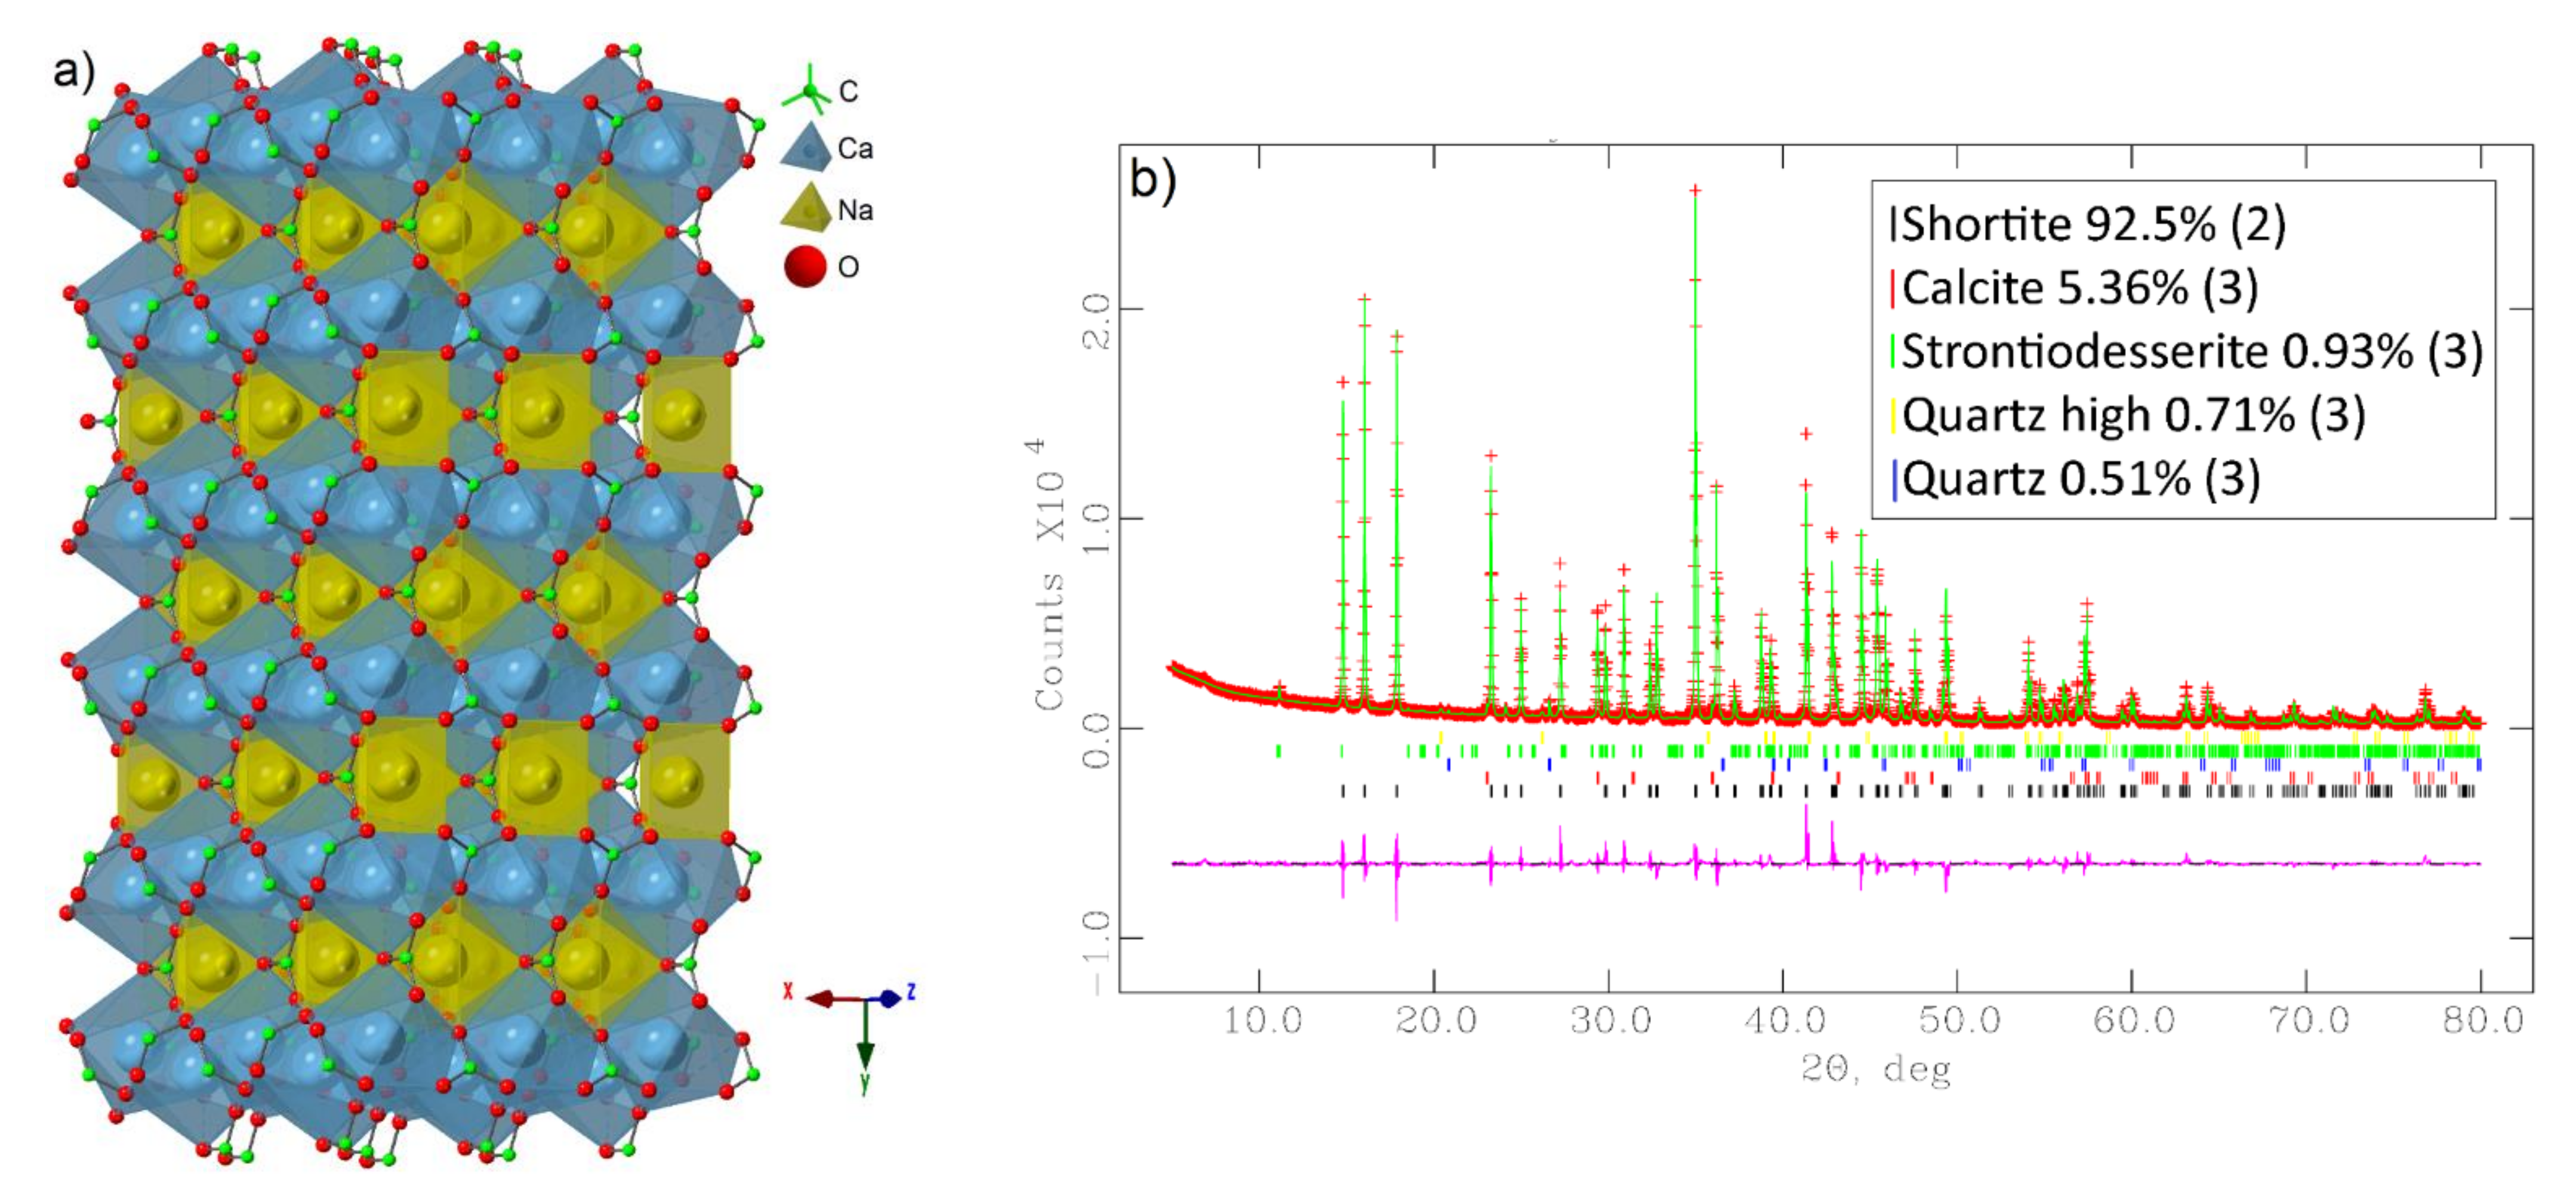
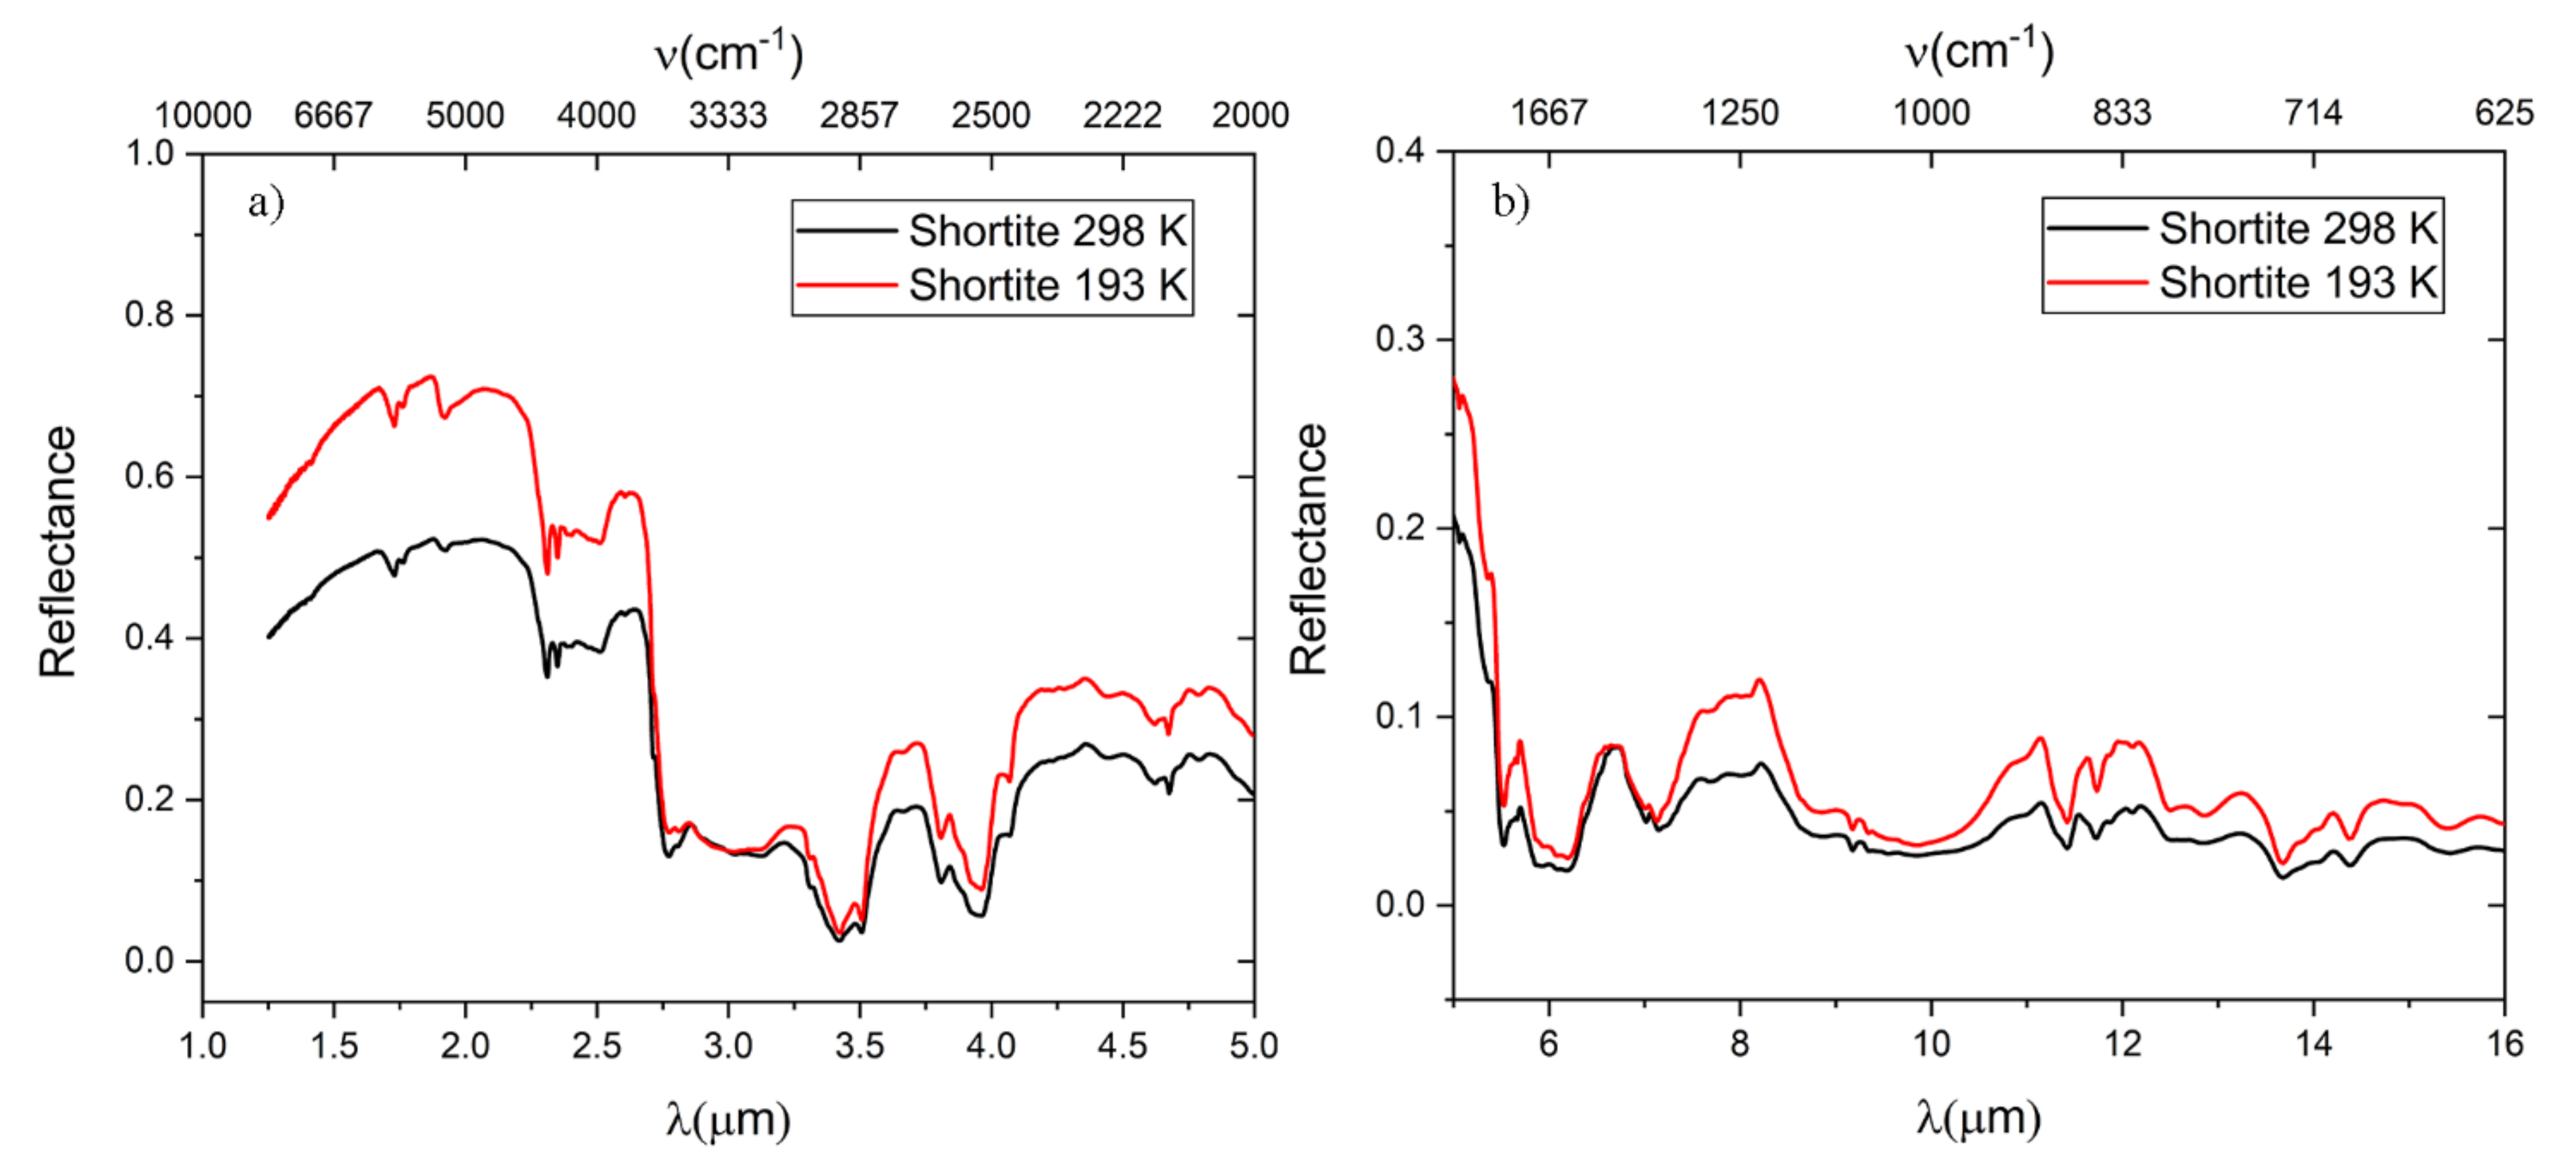
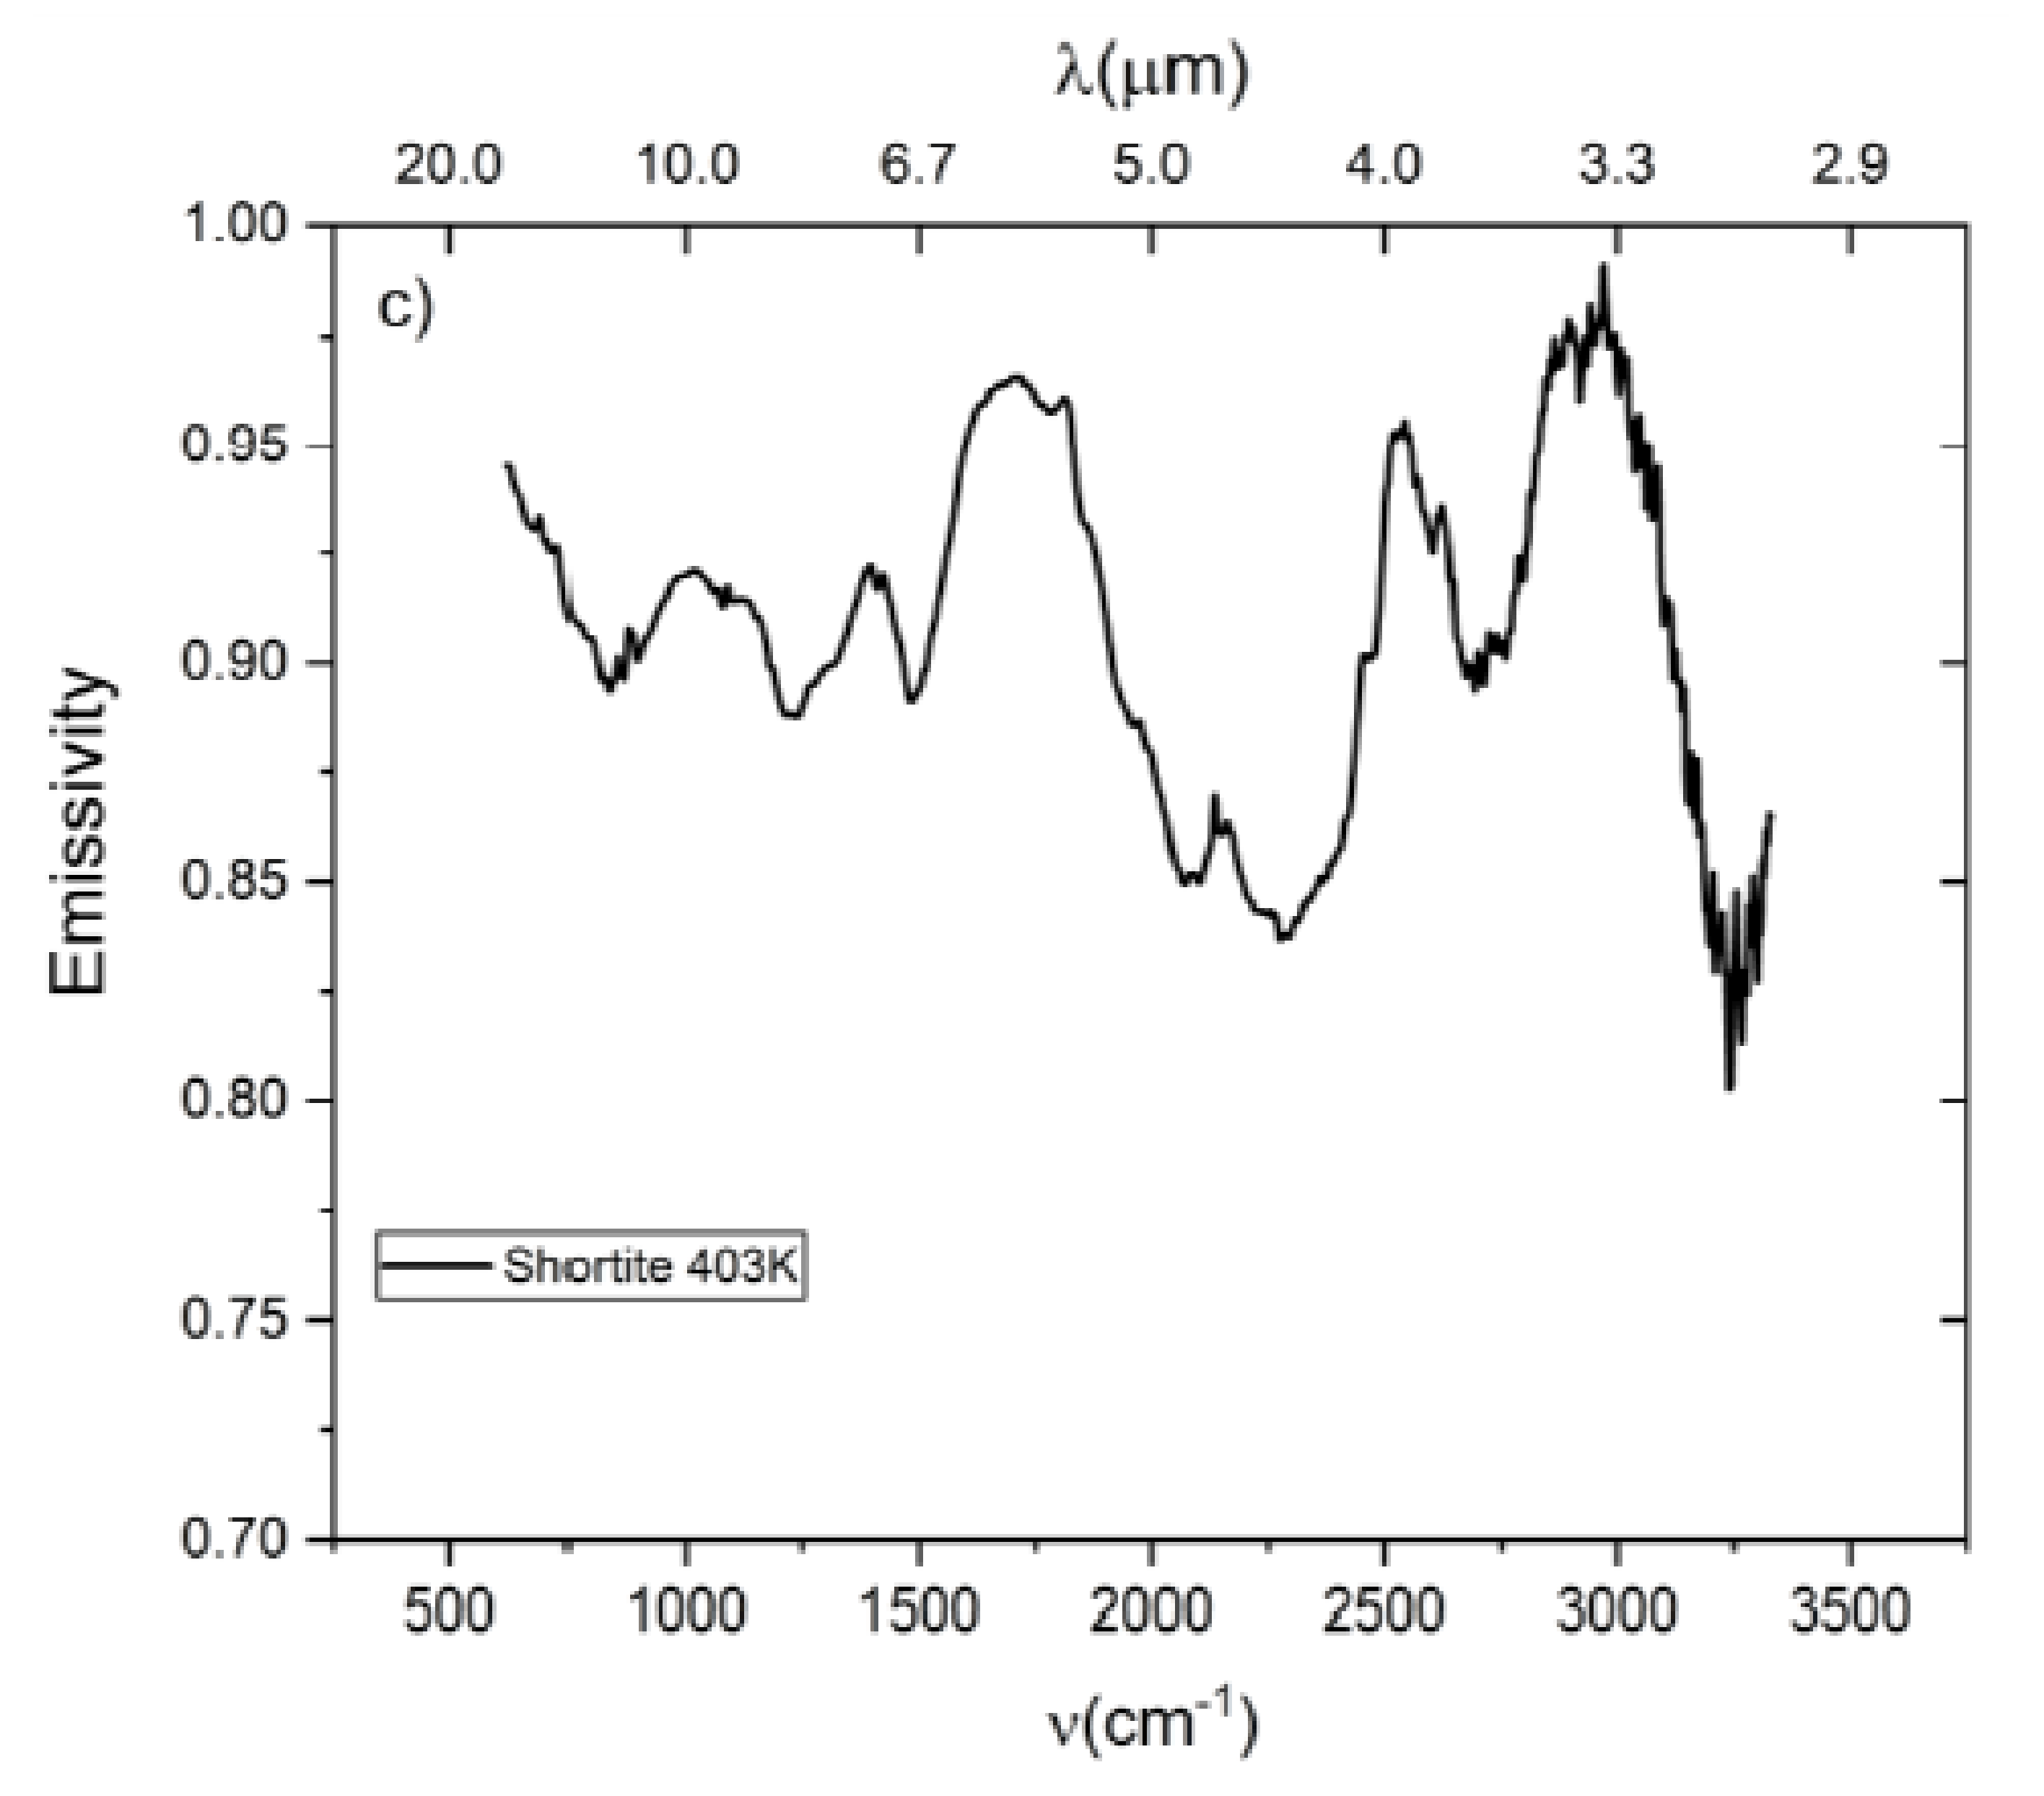
3.3. Shortite Na2Ca2(CO3)3
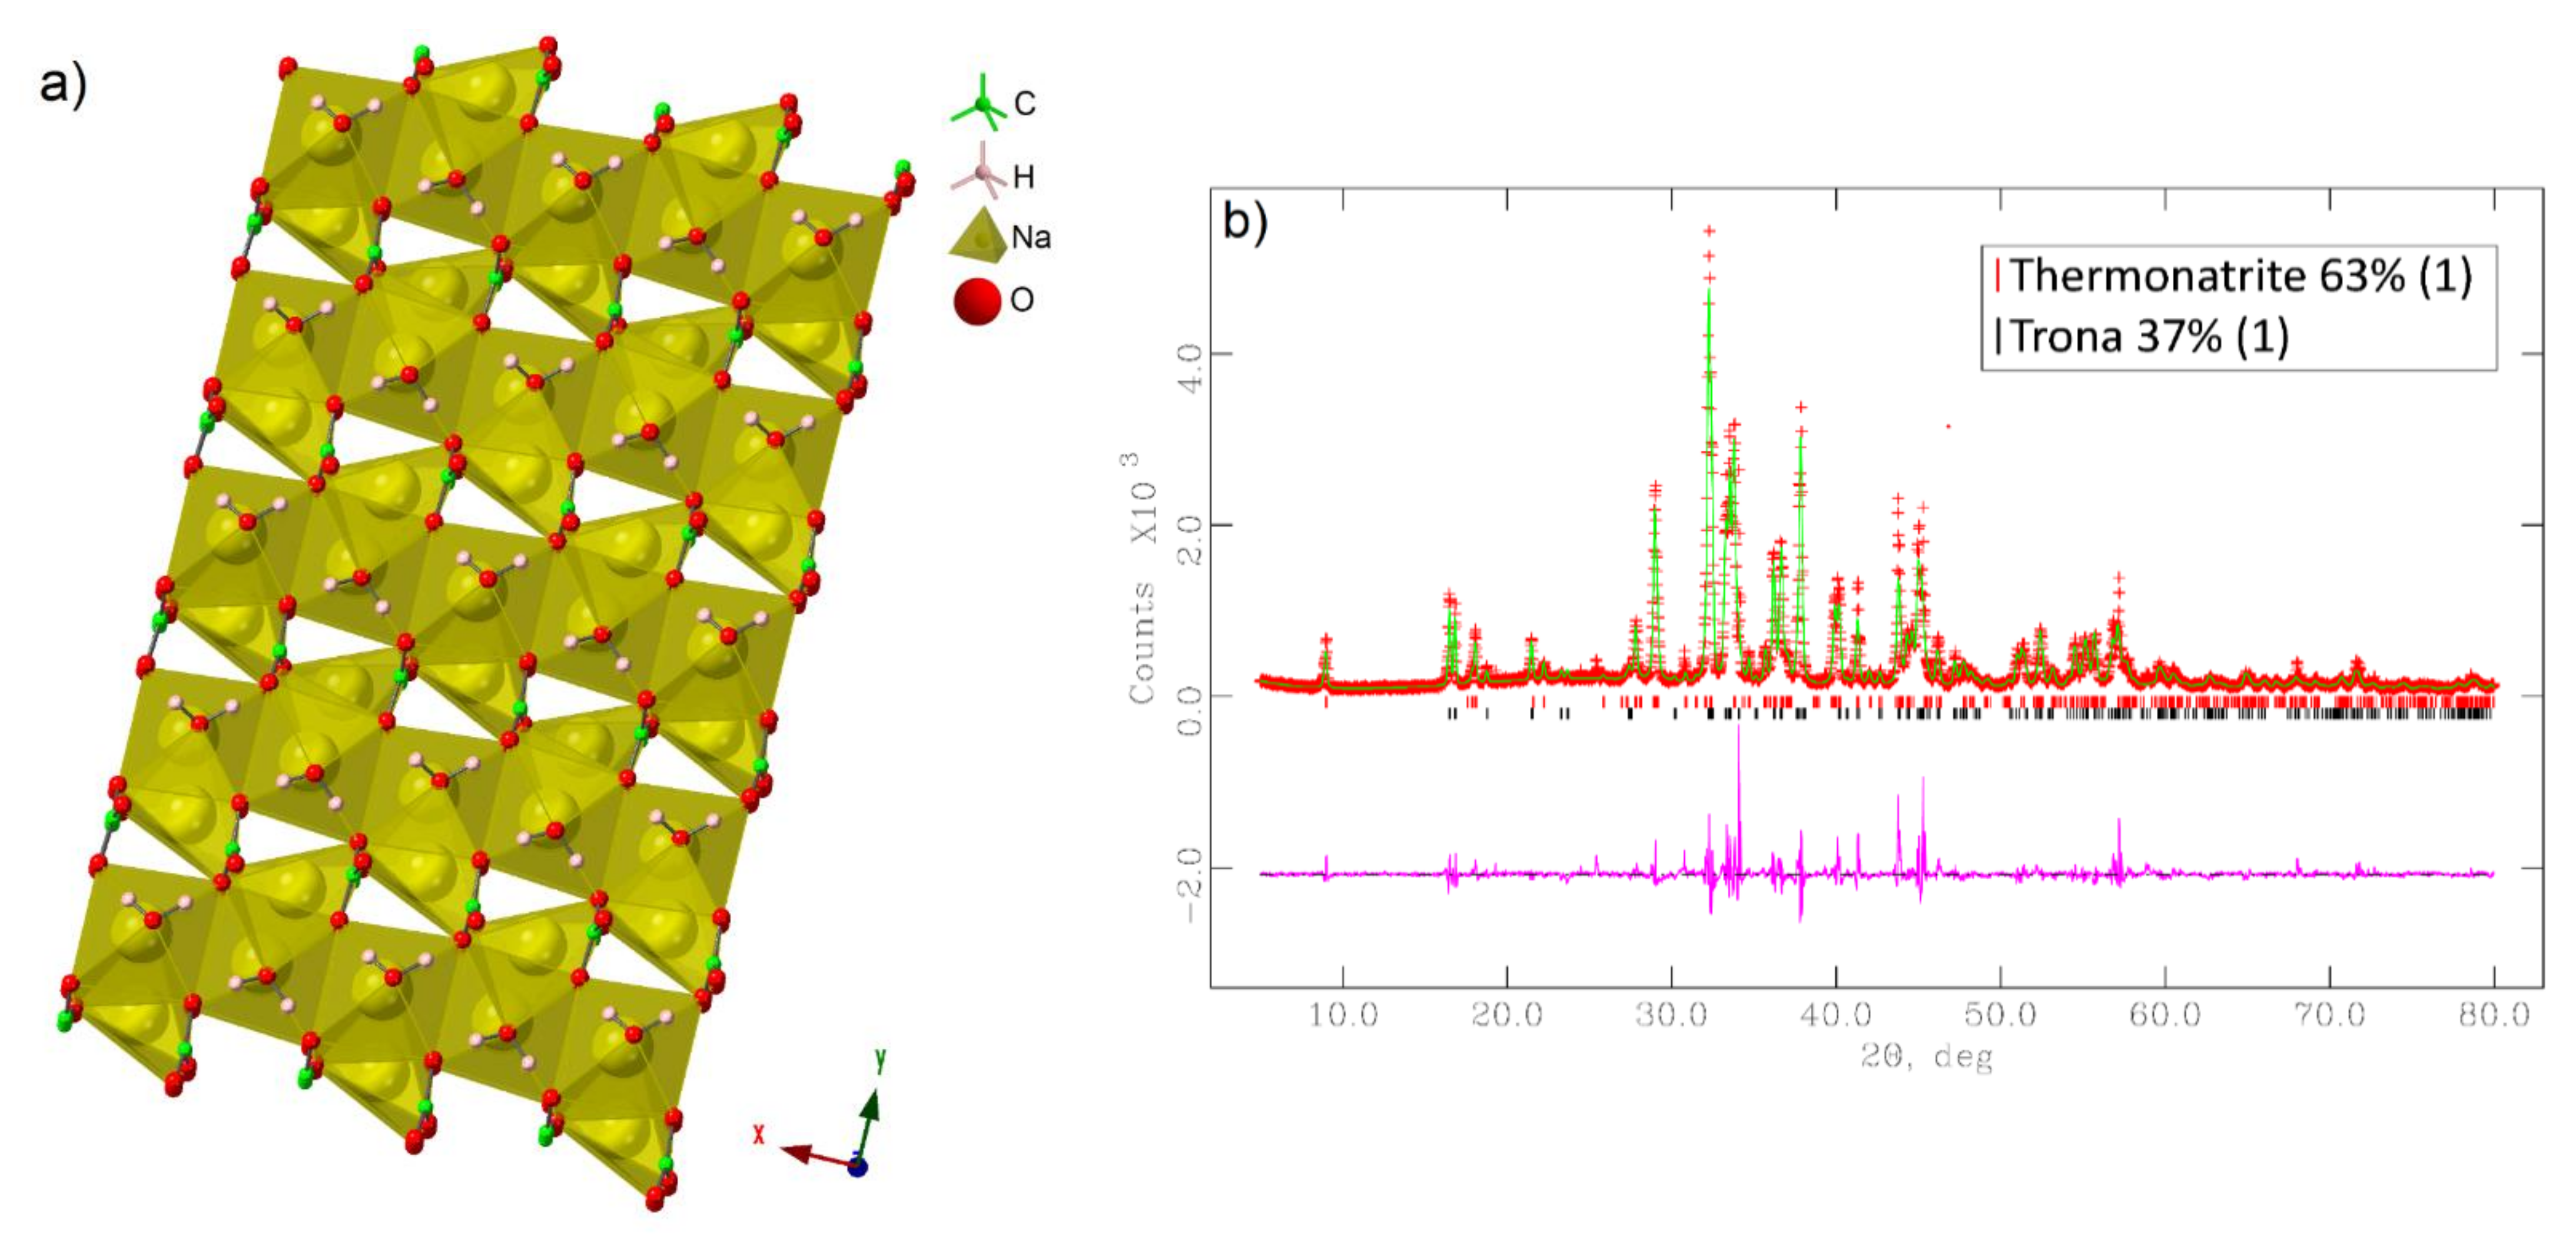
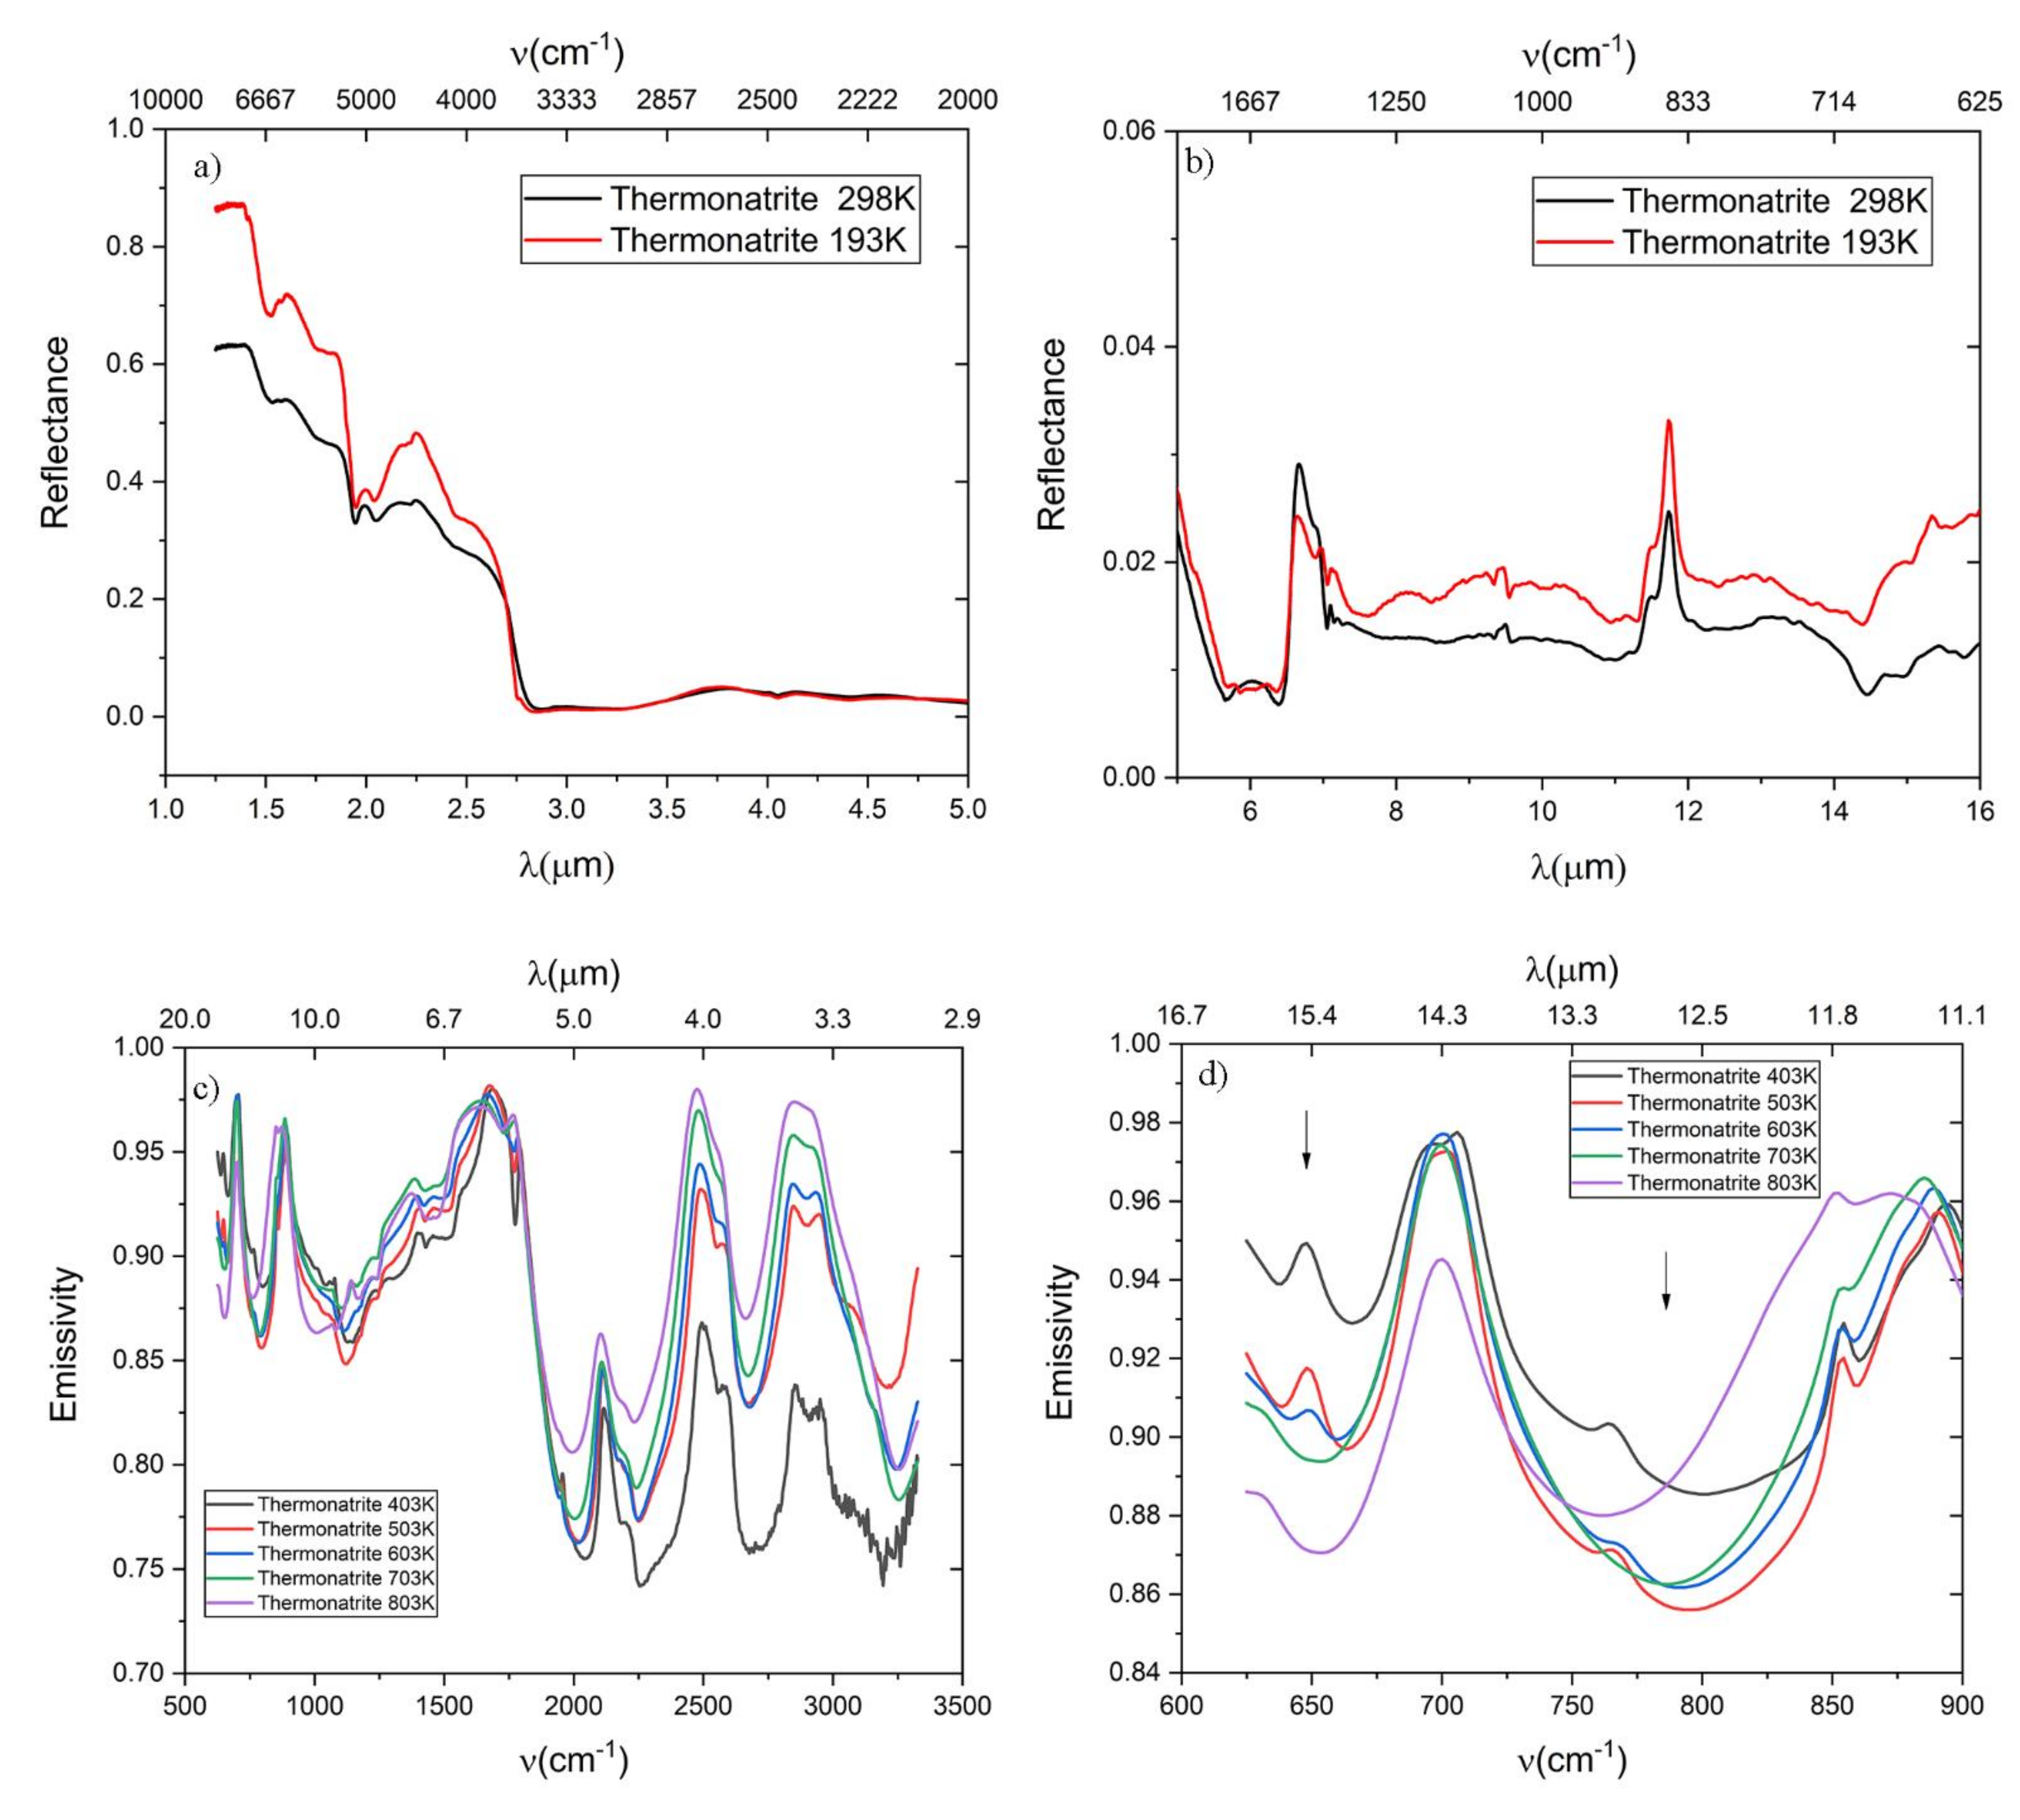
3.4. Thermonatrite Na2CO3·H2O
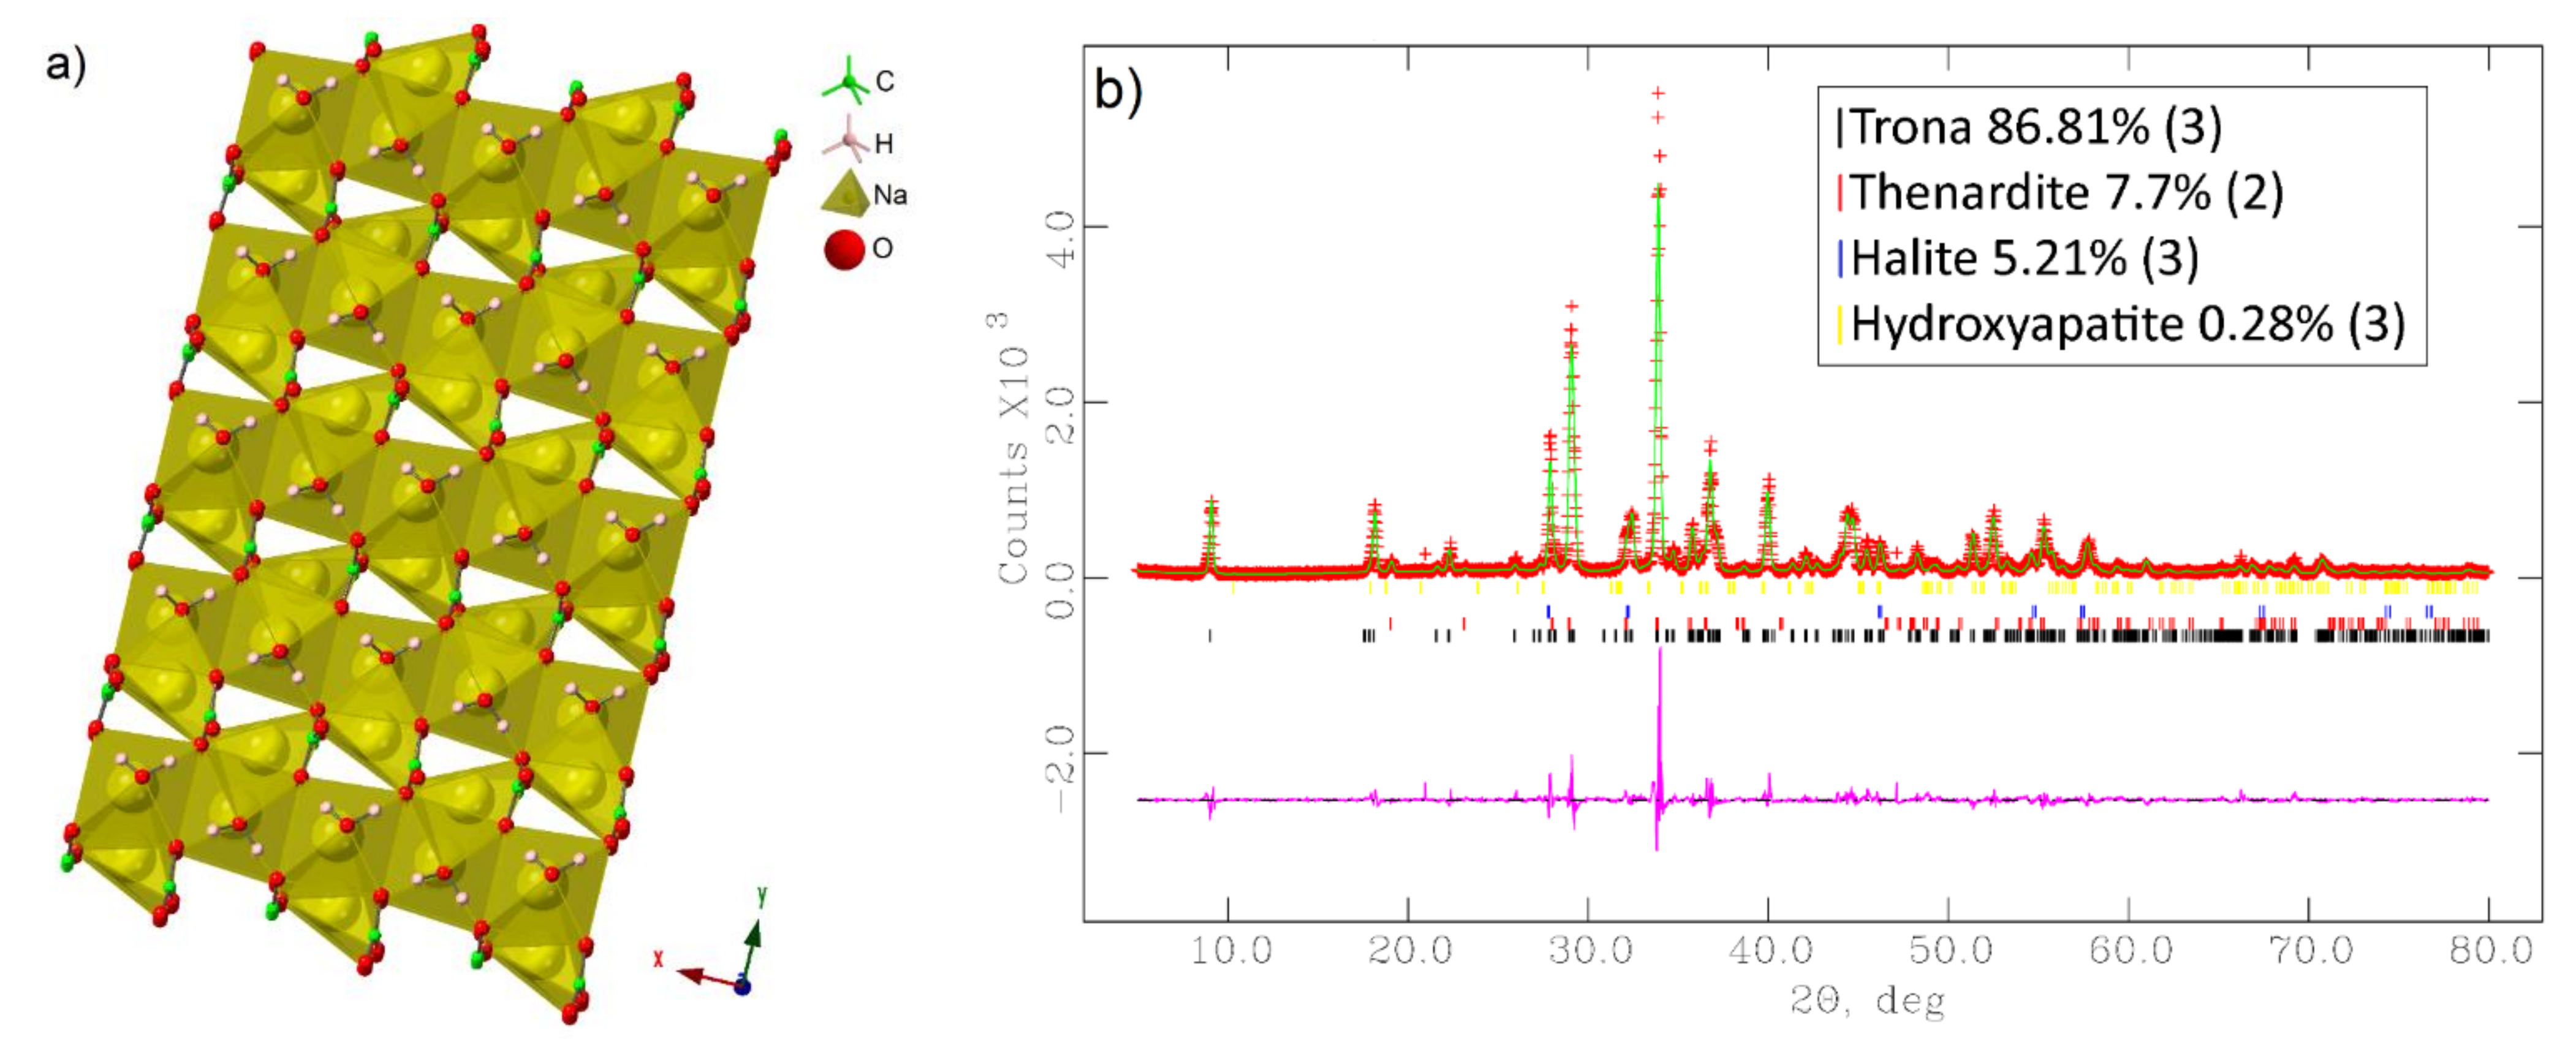
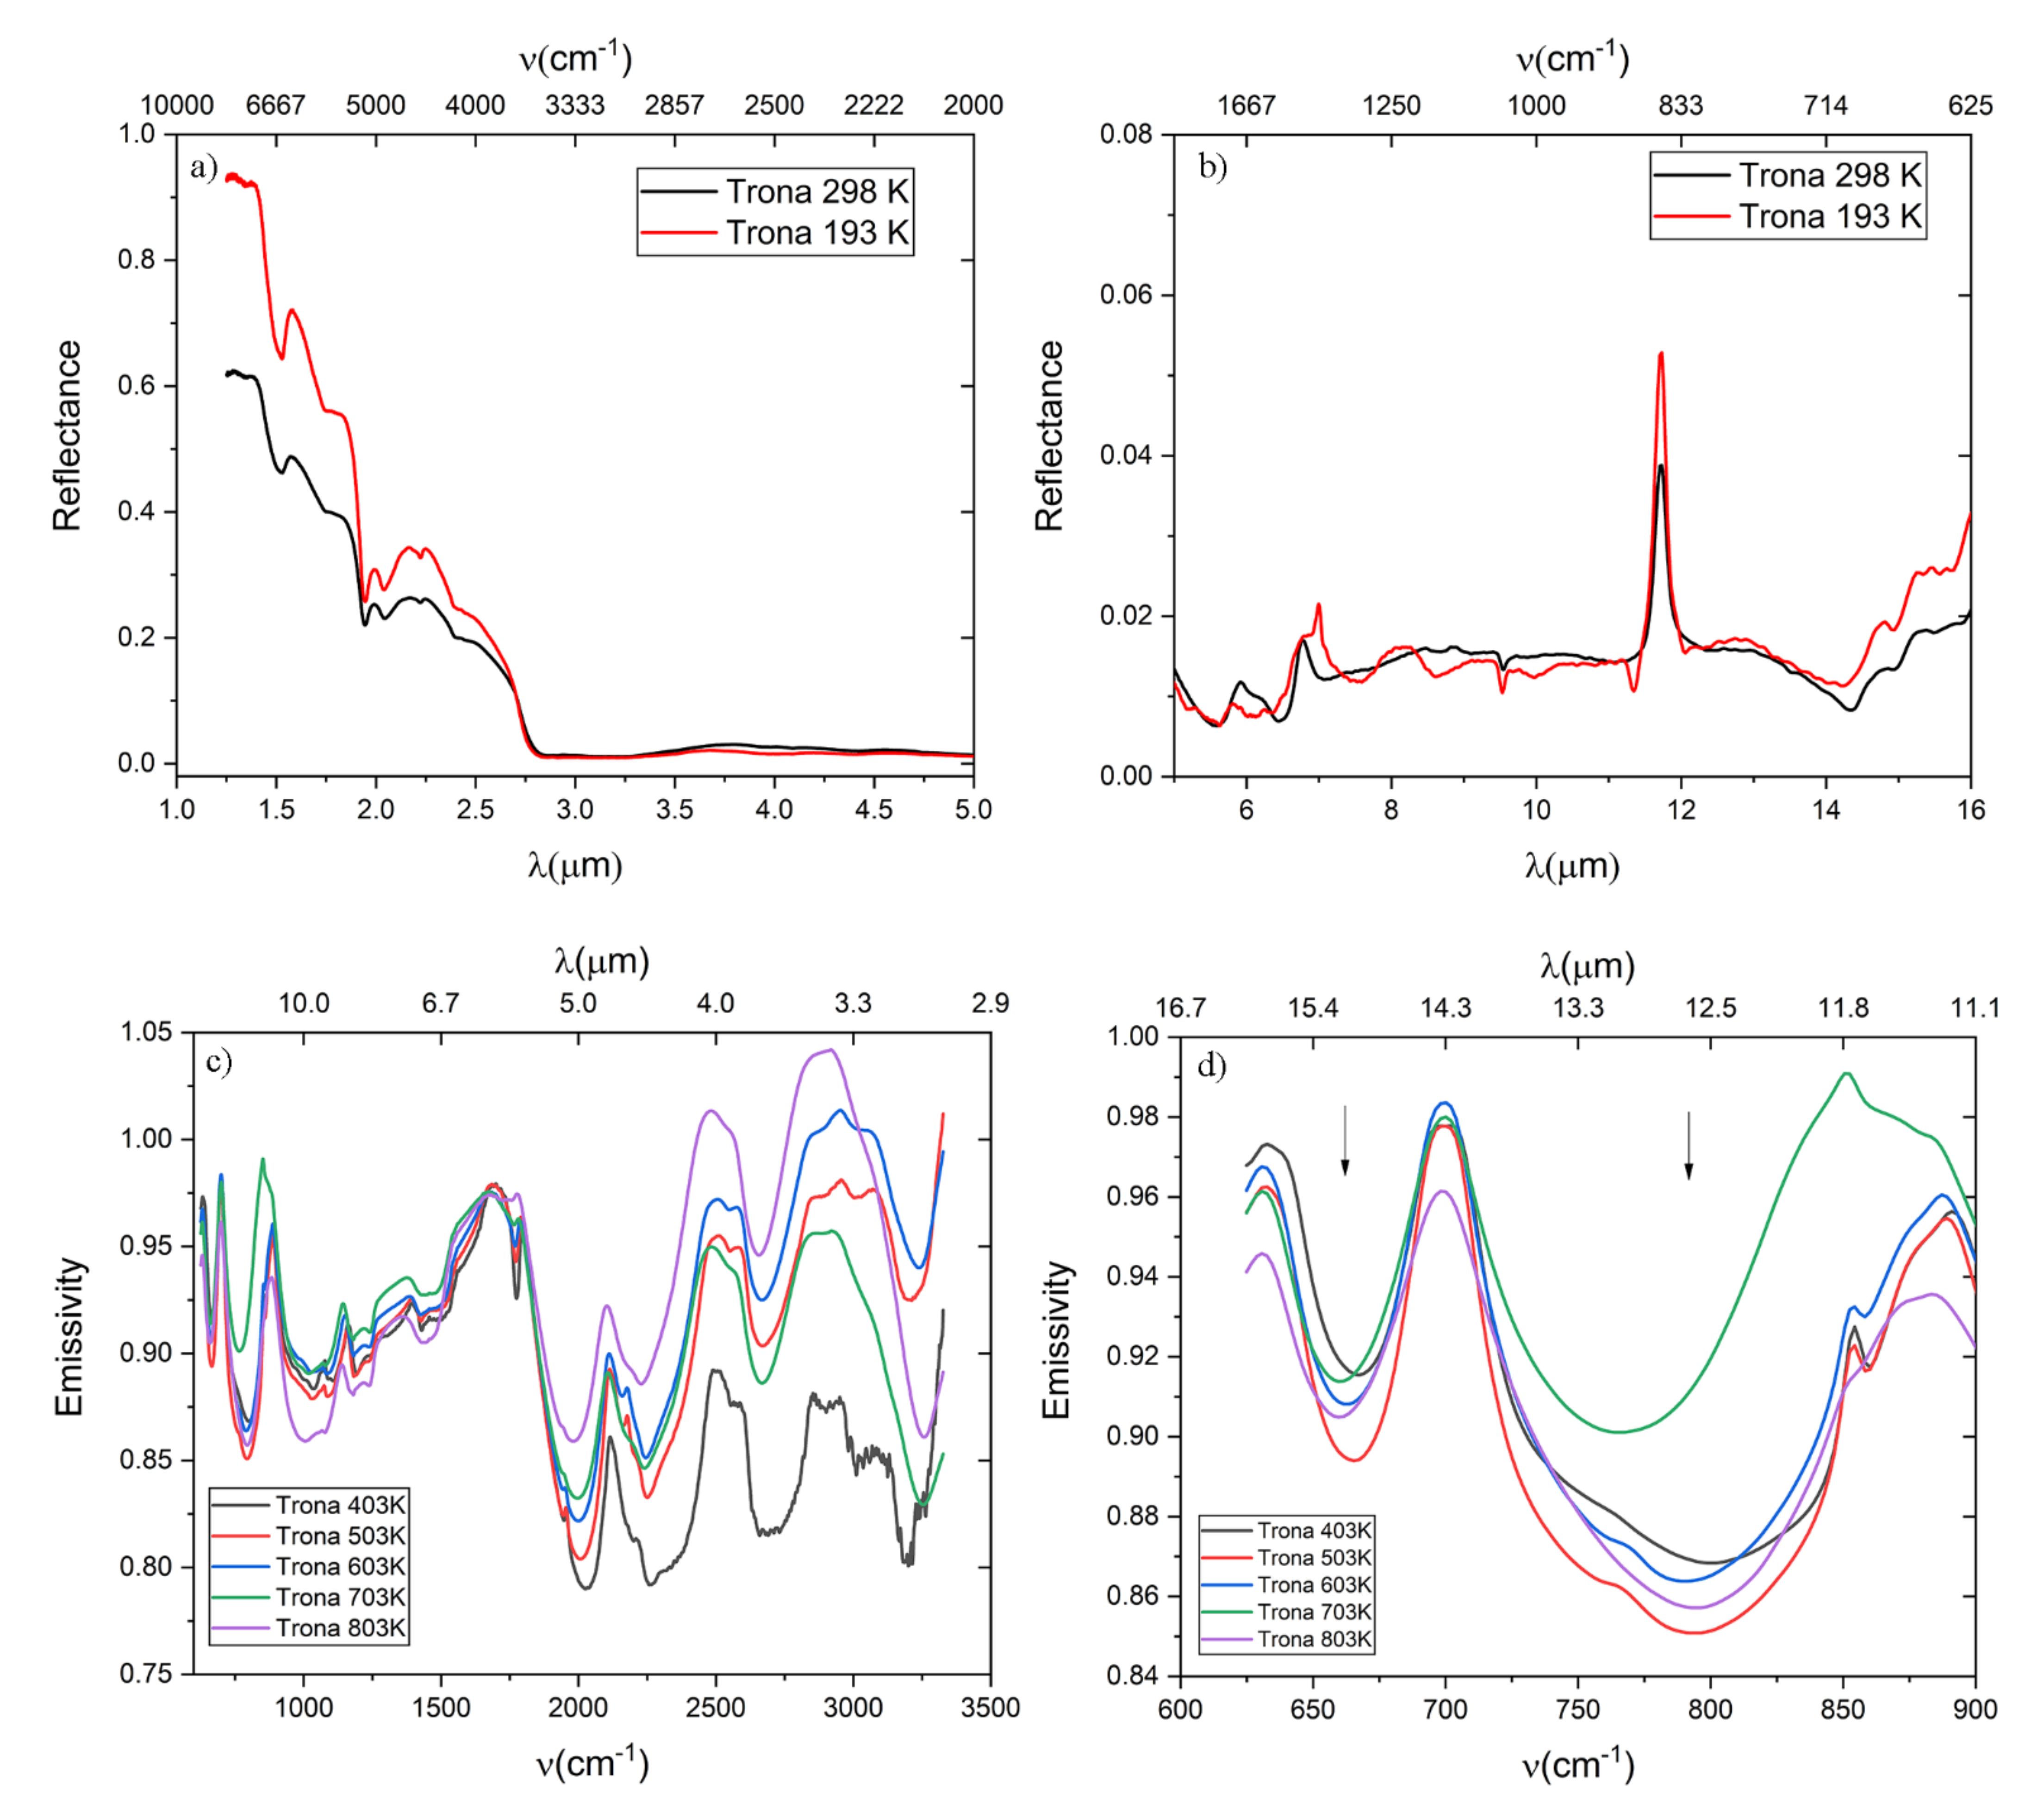
3.5. Trona Na3(CO3)(HCO3)·2(H2O)
4. Discussion
Carbonates on the Ceres Occattor Area
5. Conclusions
Supplementary Materials
Author Contributions
Funding
Data Availability Statement
Acknowledgments
Conflicts of Interest
Appendix A

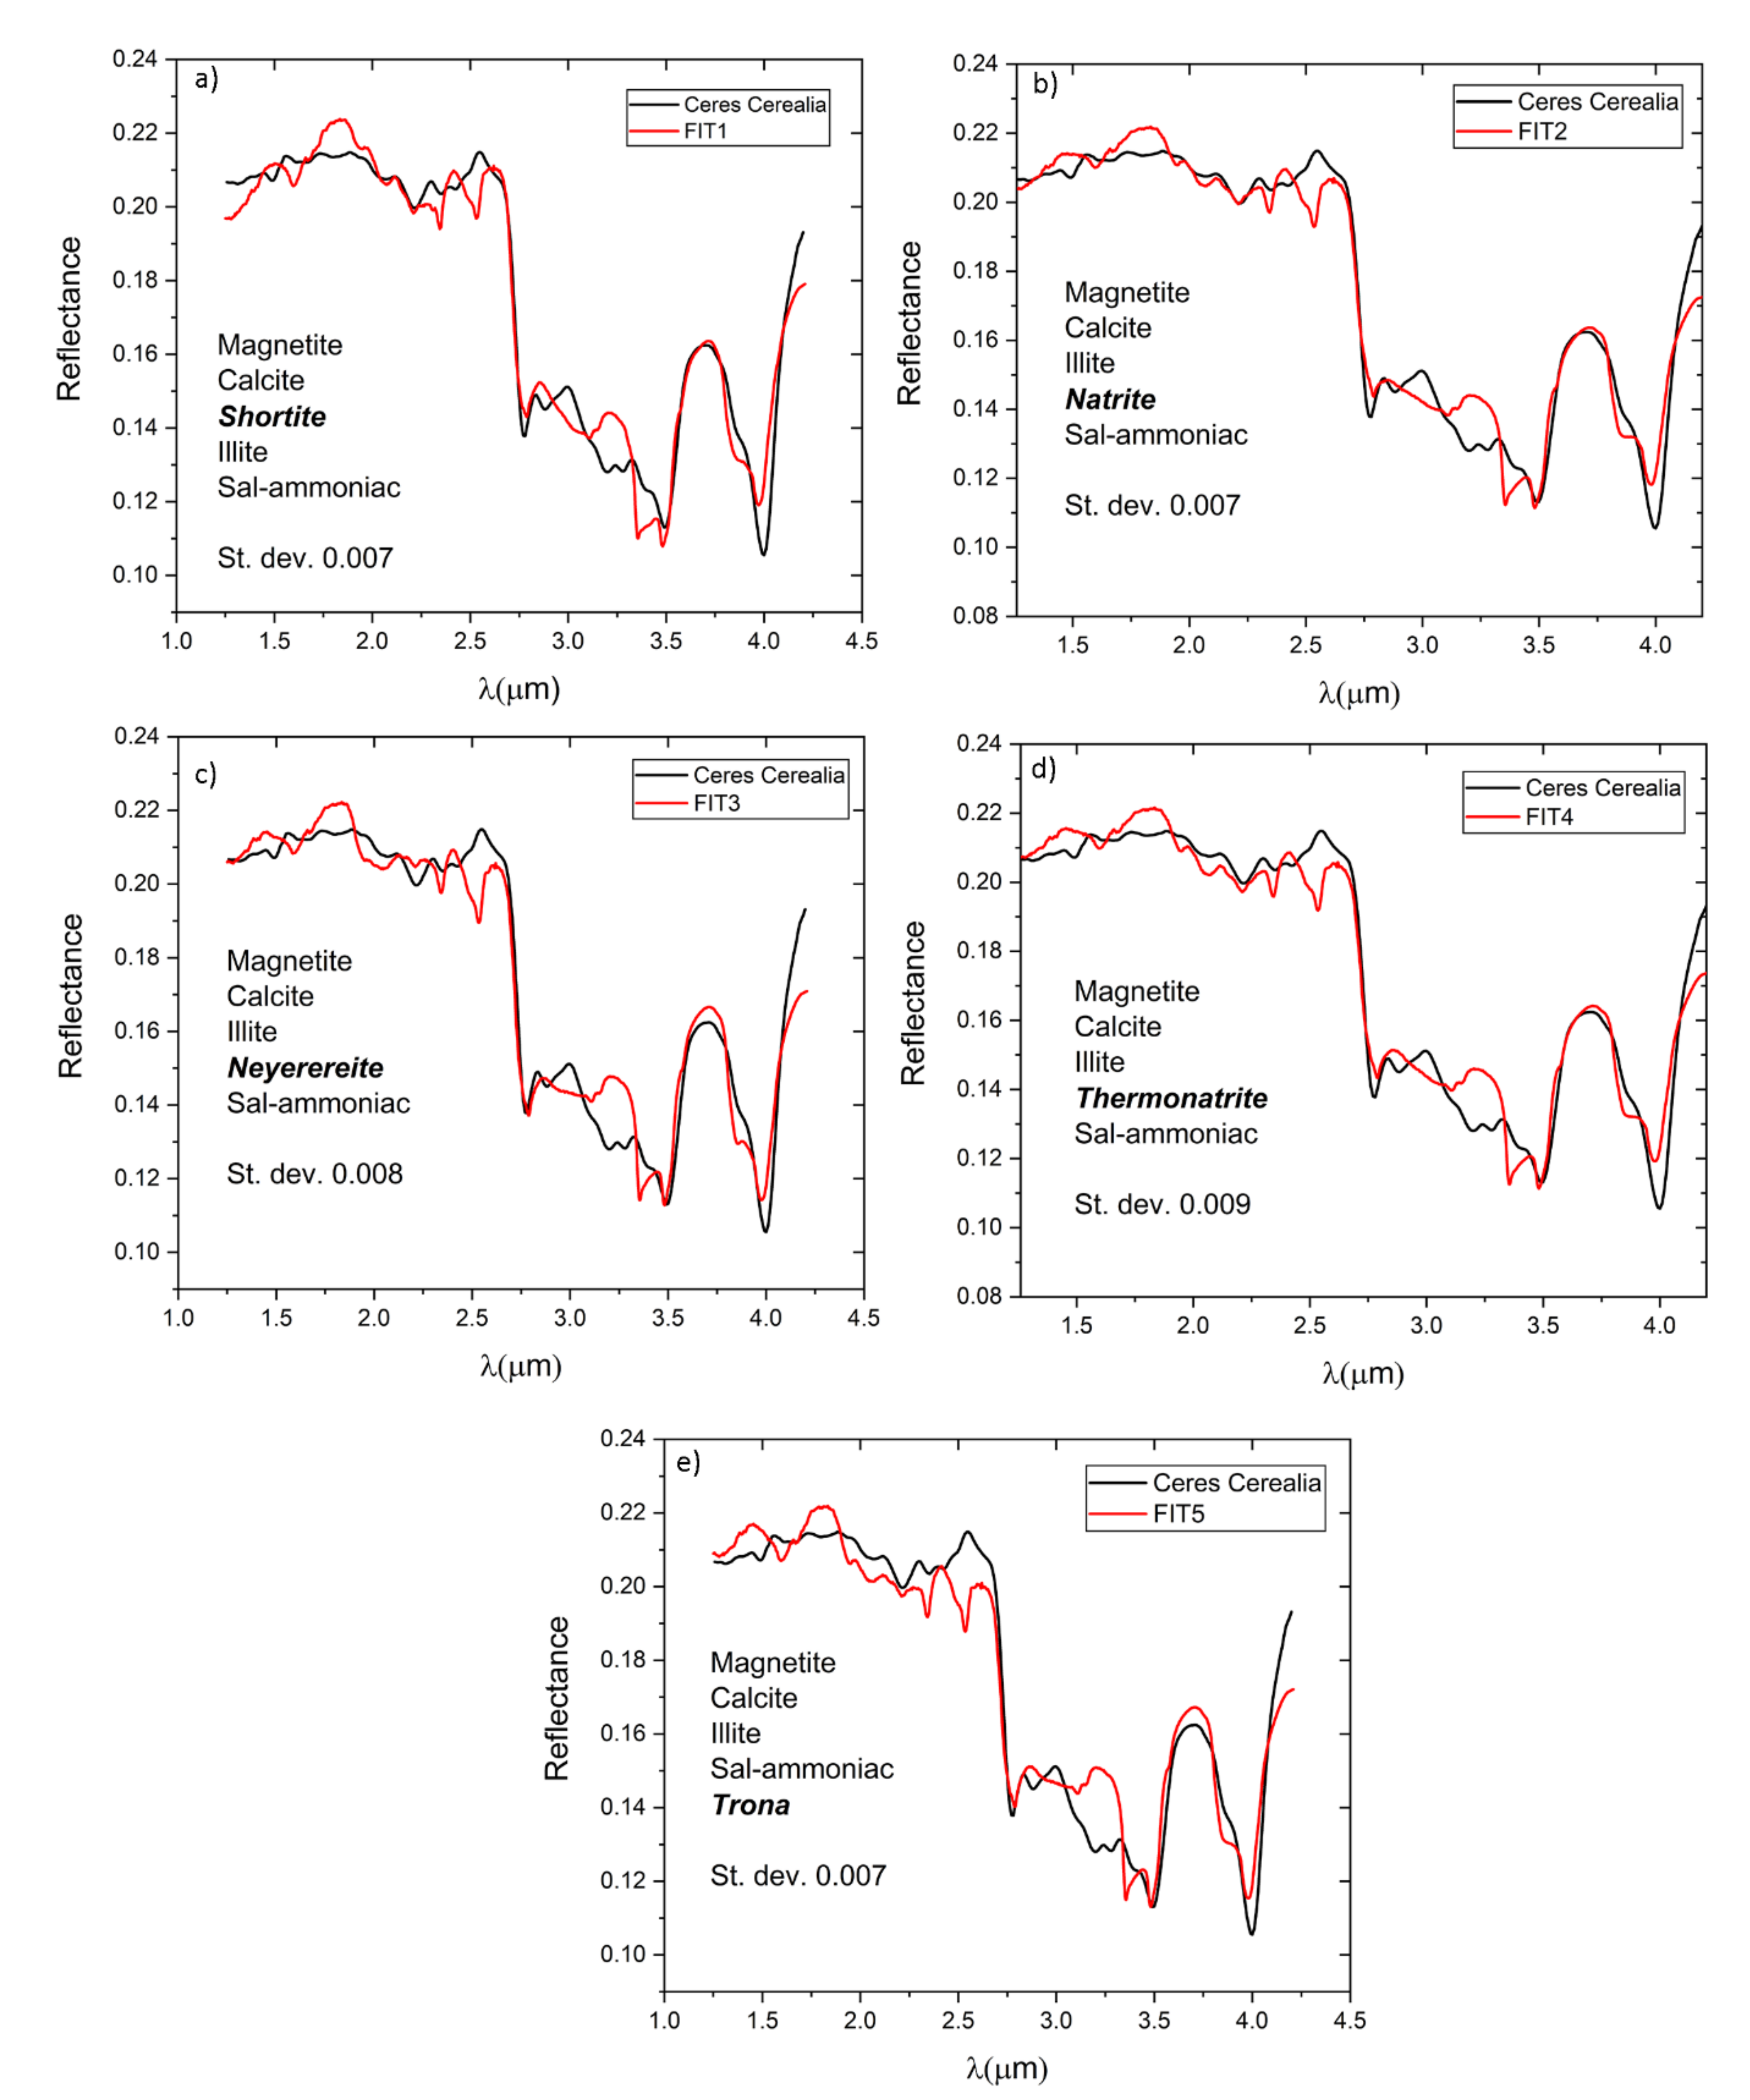
| Mineral Name | Chemical Formula | Sample/Spectra ID | Database |
|---|---|---|---|
| Magnetite | Fe3O2 | MG-EAC-002 | Relab |
| Calcite | CaCO3 | GR-CMP-001 | Crism |
| Illite | (K,H3O)(Al,Mg,Fe)2(Si,Al)4O10[(OH)2,(H2O)] | IL-EAC-001 | Relab |
| Sal-ammoniac | NH4Cl | CL-EAC-049 | Relab |
| Fit 1 (a) | Magnetite 76.2% | Calcite 8.8% | Shortite 6.1% | Illite5.4% | Sal-ammoniac 3.5% |
| Fit 2 (b) | Magnetite 77.4% | Calcite 9.5% | Illite 5.7% | Natrite4.9% | Sal-ammoniac 2.5% |
| Fit 3 (c) | Magnetite 78.6% | Calcite 9.7% | Illite 5.6% | Nyerereite 3.4% | Sal-ammoniac 2.8% |
| Fit 4 (d) | Magnetite 77% | Calcite 10.1% | Illite 5.8% | Thermonatrite 4.3% | Sal-ammmoniac 2.8% |
| Fit 5 (e) | Magnetite 74% | Calcite 10.8% | Illite 6.3% | Sal-ammoniac 4.8% | Trona3.4% |
References
- McCord, T.B. Reflectance Spectroscopy in Planetary Science: Review and Strategy for the Future; National Aeronautics and Space Administration, Scientific and Technical Information Division USA: Washington, DC, USA, 1988; Volume 493. [Google Scholar]
- Dalton III, J.B. Spectral behavior of hydrated sulfate salts: Implications for Europa mission spectrometer design. Astrobiology 2003, 3, 771–784. [Google Scholar] [CrossRef]
- Cook, J.C.; Dalle Ore, C.M.; Protopapa, S.; Binzel, R.P.; Cartwright, R.; Cruikshank, D.P.; Earle, A.; Grundy, W.M.; Ennico, K.; Howett, C.; et al. Composition of Pluto’s small satellites: Analysis of New Horizons spectral images. Icarus 2018, 315, 30–45. [Google Scholar] [CrossRef]
- Niles, P.B.; Catling, D.C.; Berger, G.; Chassefière, E.; Ehlmann, B.L.; Michalski, J.R.; Morris, R.; Ruff, S.W.; Sutter, B. Geochemistry of carbonates on Mars: Implications for climate history and nature of aqueous environments. Space Sci. Rev. 2013, 174, 301–328. [Google Scholar] [CrossRef]
- Ehlmann, B.L.; Mustard, J.F.; Murchie, S.L.; Poulet, F.; Bishop, J.L.; Brown, A.J.; Calvin, W.M.; Clark, R.N.; Des Marais, D.J.; Milliken, R.E.; et al. Orbital identification of carbonate-bearing rocks on Mars. Science 2008, 322, 1828–1832. [Google Scholar] [CrossRef] [PubMed] [Green Version]
- Morris, R.V.; Ruff, S.W.; Gellert, R.; Ming, D.W.; Arvidson, R.E.; Clark, B.C.; Golden, D.C.; Siebach, K.; Klingelhöfer, G.; Schröder, C.; et al. Identification of carbonate-rich outcrops on Mars by the Spirit rover. Science 2010, 329, 421–424. [Google Scholar] [CrossRef] [PubMed]
- Boynton, W.V.; Ming, D.W.; Kounaves, S.P.; Young, S.M.M.; Arvidson, R.E.; Hecht, M.H.; Hoffman, J.; Niles, P.B.; Hamara, D.K.; Quinn, R.C.; et al. Evidence for calcium carbonate at the Mars Phoenix landing site. Science 2009, 325, 61–64. [Google Scholar] [CrossRef] [PubMed] [Green Version]
- Carrozzo, F.G.; De Sanctis, M.C.; Raponi, A.; Ammannito, E.; Castillo-Rogez, J.; Ehlmann, B.L.; Marchi, S.; Stein, N.; Ciarniello, M.; Tosi, F.; et al. Nature, formation, and distribution of carbonates on Ceres. Sci. Adv. 2018, 4, e1701645. [Google Scholar] [CrossRef] [Green Version]
- De Sanctis, M.C.; Raponi, A.; Ammannito, E.; Ciarniello, M.; Toplis, M.J.; McSween, H.Y.; Castillo-Rogez, J.C.; Ehlmann, B.L.; Carrozzo, F.G.; Marchi, S.; et al. Bright carbonate deposits as evidence of aqueous alteration on (1) Ceres. Nature 2016, 536, 54–57. [Google Scholar] [CrossRef] [PubMed]
- De Sanctis, M.C.; Vinogradoff, V.; Raponi, A.; Ammannito, E.; Ciarniello, M.; Carrozzo, F.G.; De Angelis, S.; A Raymond, C.; Russell, C.T. Characteristics of organic matter on Ceres from VIR/Dawn high spatial resolution spectra. Mon. Not. R. Astron. Soc. 2019, 482, 2407–2421. [Google Scholar] [CrossRef]
- Zambon, F.; Raponi, A.; Tosi, F.; De Sanctis, M.C.; McFadden, L.A.; Carrozzo, F.G.; Longobardo, A.; Ciarniello, M.; Krohn, K.; Stephan, K.; et al. Spectral analysis of Ahuna Mons from Dawn mission’s visible-infrared spectrometer. Geophys. Res. Lett. 2017, 44, 97–104. [Google Scholar] [CrossRef] [Green Version]
- De Sanctis, M.C.; Mitri, G.; Castillo-Rogez, J.; House, C.H.; Marchi, S.; Raymond, C.A.; Sekine, Y. Relict Ocean Worlds: Ceres. Space Sci. Rev. 2020, 216, 1–33. [Google Scholar] [CrossRef]
- Castillo-Rogez, J.C.; Neveu, M.; Scully, J.E.; House, C.H.; Quick, L.C.; Bouquet, A.; Miller, K.; Bland, M.; De Sanctis, M.C.; Ermakov, A.; et al. Ceres: Astrobiological target and possible ocean world. Astrobiology 2020, 20, 269–291. [Google Scholar] [CrossRef]
- Postberg, F.; Kempf, S.; Schmidt, J.; Brilliantov, N.; Beinsen, A.; Abel, B.; Buck, U.; Srama, R. Sodium salts in E-ring ice grains from an ocean below the surface of Enceladus. Nature, 2009, 459, 1098–1101. [Google Scholar] [CrossRef] [PubMed]
- Postberg, F.; Schmidt, J.; Hillier, J.; Kempf, S.; Srama, R. A salt-water reservoir as the source of a compositionally stratified plume on Enceladus. Nature 2011, 474, 620–622. [Google Scholar] [CrossRef]
- Carlson, R.W.; Calvin, W.M.; Dalton, J.B.; Hansen, G.B.; Hudson, R.L.; Johnson, R.E.; McCord, T.B.; Moore, M.H. Europa’s Surface Composition. In Europa; Pappalardo, R.T., McKinnon, W.B., Khurana, K.K., Eds.; University of Arizona: Tucson, AZ, USA, 2009; Volume 283. [Google Scholar]
- McCord, T.B.; Hansen, G.B.; Combe, J.P.; Hayne, P. Hydrated minerals on Europa’s surface: An improved look from the Galileo NIMS investigation. Icarus 2010, 209, 639–650. [Google Scholar] [CrossRef]
- De Angelis, S.; Carli, C.; Tosi, F.; Beck, P.; Brissaud, O.; Schmitt, B.; Potin, S.; De Sanctis, M.C.; Capaccioni, F.; Piccioni, G. NIR reflectance spectroscopy of hydrated and anhydrous sodium carbonates at different temperatures. Icarus 2019, 317, 388–411. [Google Scholar] [CrossRef]
- McCord, T.B.; Hansen, G.B.; Matson, D.L.; Johnson, T.V.; Crowley, J.K.; Fanale, F.P.; Carlson, R.W.; Smythe, W.D.; Martin, P.D.; Hibbitts, C.A.; et al. Hydrated salt minerals on Europa’s surface from the Galileo near-infrared mapping spectrometer (NIMS) investigation. J. Geophys. Res. Planets 1999, 104, 11827–11851. [Google Scholar] [CrossRef]
- Gooding, J.L. Chemical weathering on Mars thermodynamic stabilities of primary minerals (and their alteration products) from mafic igneous rocks. Icarus 1978, 33, 483–513. [Google Scholar] [CrossRef]
- Ehlmann, B.L.; Edwards, C.S. Mineralogy of the Martian surface. Annu. Rev. Earth Planet. Sci. 2014, 42, 291–315. [Google Scholar] [CrossRef] [Green Version]
- Zolotov, M.Y.; Shock, E.L. Composition and stability of salts on the surface of Europa and their oceanic origin. J. Geophys. Res. Planets 2001, 106, 32815–32827. [Google Scholar] [CrossRef] [Green Version]
- Fanale, F.P.; Johnson, T.V.; Matson, D.L. Io’s surface and the histories of the Galilean satellites. In Annual Review of Earth and Planetary Sciences; Annual Reviews, Inc.: Palo Alto, CA, USA, 1978; Volume 6, pp. 93–125. [Google Scholar]
- Kargel, J.S. Brine volcanism and the interior structures of asteroids and icy satellites. Icarus 1991, 94, 368–390. [Google Scholar] [CrossRef]
- Kargel, J.S.; Kaye, J.Z.; Head, J.W., III; Marion, G.M.; Sassen, R.; Crowley, J.K.; Hogenboom, D.L. Europa’s crust and ocean: Origin. Composition. and the prospects for life. Icarus 2000, 148, 2262–2265. [Google Scholar] [CrossRef] [Green Version]
- Kamenetsky, V.S.; Kamenetsky, M.B.; Weiss, Y.; Navon, O.; Nielsen, T.F.; Mernagh, T.P. How unique is the Udachnaya-East kimberlite? Comparison with kimberlites from the Slave Craton (Canada) and SW Greenland. Lithos 2009, 112, 334–346. [Google Scholar] [CrossRef]
- Vennari, C.E.; Beavers, C.M.; Williams, Q. High-pressure/temperature behavior of the alkali/calcium carbonate shortite (Na2Ca2 (CO3)3): Implications for carbon sequestration in Earth’s transition zone. J. Geophys. Res. Solid Earth 2018, 123, 6574–6591. [Google Scholar] [CrossRef]
- Keller, J.; Zaitsev, A.N. Reprint of “Geochemistry and petrogenetic significance of natrocarbonatites at Oldoinyo Lengai, Tanzania: Composition of lavas from 1988 to 2007”. Lithos 2018, 152, 47–55. [Google Scholar] [CrossRef]
- Watkinson, D.H.; Chao, G.Y. Shortite in kimberlite from the Upper Canada gold mine, Ontario. J. Geol. 1973, 81, 229–233. [Google Scholar] [CrossRef]
- Cooper, A.F.; Gittins, J. Shortite in kimberlite from the upper Canada gold mine, Ontario: A discussion. J. Geol. 1974, 82, 667–669. [Google Scholar] [CrossRef]
- Stoppa, F.; Jones, A.P.; Sharygin, V.V. Nyerereite from carbonatite rocks at Vulture volcano: Implications for mantle metasomatism and petrogenesis of alkali carbonate melts Research Article. Cent. Eur. J. Geosci. 2009, 1, 131–151. [Google Scholar] [CrossRef]
- Golovin, A.V.; Sharygin, I.S.; Korsakov, A.V.; Kamenetsky, V.S.; Abersteiner, A. Can primitive kimberlite melts be alkali-carbonate liquids: Composition of the melt snapshots preserved in deepest mantle xenoliths. J. Raman Spectrosc. 2020, 51, 1849–1867. [Google Scholar] [CrossRef]
- Kaminsky, F.; Wirth, R.; Matsyuk, S.; Schreiber, A.; Thomas, R. Nyerereite and nahcolite inclusions in diamond: Evidence for lower-mantle carbonatitic magmas. Mineral. Mag. 2009, 73, 797–816. [Google Scholar] [CrossRef] [Green Version]
- Kelektsoglou, K. Carbon Capture and Storage: A Review of Mineral Storage of CO2 in Greece. Sustainability 2018, 10, 4400. [Google Scholar] [CrossRef] [Green Version]
- Deeg, H.J.; Belmonte, J.A. Handbook of Exoplanets; Springer: Berlin/Heidelberg, Germany, 2018. [Google Scholar]
- Balic-Zunic, T.; Birkedal, R.; Katerinopolou, A.; Comodi, P. Deydration of bloedite, Na2Mg(SO4)2(H2O)4 and leonite K2Mg(SO4)2(H2O)4. Eur. J. Mineral. 2016, 28, 133–142. [Google Scholar] [CrossRef]
- Comodi, P.; Stagno, V.; Zucchini, A.; Fei, Y.W.; Prakapenka, V. The compression behavior of blodite at low and high temperature up to similar to 10 GPa: Implications for the stability of hydrous sulphates on icy planetary bodies. Icarus 2017, 285, 137–144. [Google Scholar] [CrossRef] [Green Version]
- Comodi, P.; Fastelli, M.; Maturilli, A.; Balic-Zunic, T.; Zucchini, A. Emissivity and reflectance spectra at different temperatures of hydrated and anhydrous sulphates: A contribution to investigate the composition and dynamic of icy planetary bodies. Icarus 2021, 355, 114132. [Google Scholar] [CrossRef]
- Comodi, P.; Nazzareni, S.; Balić-Žunić, T.; Zucchini, A.; Hanfland, M. The high-pressure behavior of bloedite: A synchrotron single-crystal X-ray diffraction study. Am. Mineral. 2014, 99, 511–518. [Google Scholar] [CrossRef]
- Harner, P.L.; Gilmore, M.S. Visible–near infrared spectra of hydrous carbonates, with implications for the detection of carbonates in hyperspectral data of Mars. Icarus 2015, 250, 204–214. [Google Scholar] [CrossRef]
- Gaffey, S.J. Spectral reflectance of carbonate minerals in the visible and near infrared (0.35–2.55 um): Anhydrous carbonate minerals. J. Geophys. Res. Solid Earth 1987, 92, 1429–1440. [Google Scholar] [CrossRef]
- Meekes, H.; Rasing, T.; Wyder, P.; Janner, A.; Janssen, T. Raman and infrared spectra of the incommensurate crystal Na2CO3. Phys. Rev. B 1986, 34, 4240. [Google Scholar] [CrossRef]
- Harris, M.J.; Salje, E.K.H. The incommensurate phase of sodium carbonate: An infrared absorption study. J. Phys. Condens. Matter 1992, 4, 4399. [Google Scholar] [CrossRef]
- Golovin, A.V.; Korsakov, A.V.; Gavryushkin, P.N.; Zaitsev, A.N.; Thomas, V.G.; Moine, B.N. Raman spectra of nyerereite, gregoryite, and synthetic pure Na2Ca (CO3)2: Diversity and application for the study micro inclusions. J. Raman Spectrosc. 2017, 48, 1559–1565. [Google Scholar] [CrossRef]
- Palomba, E.; Longobardo, A.; De Sanctis, M.C.; Stein, N.T.; Ehlmann, B.; Galiano, A.N.; Raponi, A.; Ciarniello, M.; Ammannito, E.; Cloutis, E.; et al. Compositional differences among Bright Spots on the Ceres surface. Icarus 2019, 320, 202–212. [Google Scholar] [CrossRef] [Green Version]
- Hapke, B. Bidirectional reflectance spectroscopy: 1. Theory. J. Geophys. Res. Solid Earth 1981, 86, 3039–3054. [Google Scholar] [CrossRef]
- Hapke, B. Bidirectional reflectance spectroscopy 7: The single particle phase function hockey stick relation. Icarus 2012, 221, 1079–1083. [Google Scholar] [CrossRef] [Green Version]
- Scheetz, B.E.; White, W.B. Vibrational spectra of the alkaline earth double carbonates. Am. Mineral. 1977, 62, 36–50. [Google Scholar]
- Frost, R.L.; Palmer, S.J. Infrared and infrared emission spectroscopy of nesquehonite Mg(OH)(HCO3)·2H2O–implications for the formula of nesquehonite. Spectrochim. Acta Part A Mol. Biomol. Spectrosc. 2011, 78, 1255–1260. [Google Scholar] [CrossRef] [Green Version]
- Clark, R.N.; King, T.V.V.; Klejwa, M.; Swayze, G.A.; Vergo, N. High spectral resolution reflectance spectroscopy of minerals. J. Geophys. Res. Solid Earth 1990, 95, 12653–12680. [Google Scholar] [CrossRef] [Green Version]
- Zhu, Y.; Li, Y.; Ding, H.; Lu, A.; Li, Y.; Wang, C. Infrared emission properties of a kind of natural carbonate: Interpretation from mineralogical analysis. Phys. Chem. Miner. 2020, 47, 1–15. [Google Scholar] [CrossRef]
- Kolesov, B.A.; Geiger, C.A. The orientation and vibrational states of H2O in synthetic alkali-free beryl. Phys. Chem. Miner. 2000, 27, 557–564. [Google Scholar] [CrossRef]
- Yamatera, H.; Fitzpatrick, B.; Gordon, G. Near infrared spectra of water and aqueous solutions. J. Mol. Spectrosc. 1964, 14, 268–278. [Google Scholar] [CrossRef]
- Bayly, J.G.; Kartha, V.B.; Stevens, W.H. The absorption spectra of liquid phase H2O, HDO and D2O from 0·7 μm to 10 μm. Infrared Phys. 1963, 3, 211–223. [Google Scholar] [CrossRef]
- Cloutis, E.A.; Hawthorne, F.C.; Stanley, A.; Mertzman, K.K.; Michael, A.C.; Dionne, M.; Michelle Methot, J.S.; John, F.M.; Diana, L.B.; James III, F.B.; et al. Detection and discrimination of sulphate minerals using reflectance spectroscopy. Icarus 2006, 184, 121–157. [Google Scholar] [CrossRef]
- Moenke, H.H.W. Vibrational spectra and the crystal-chemical classification of minerals. In The Infrared Spectra of Minerals; White, W.B., Farmer, V.C., Eds.; Mineralogical Society Monograph: London, UK, 1974; pp. 111–118. [Google Scholar]
- Bishop, J.L.; Dyar, M.D.; Lane, M.D.; Banfield, J.F. Spectral identification of hydrated sulfates on Mars and comparison with acidic environments on Earth. Int. J. Astrobiol. 2004, 3, 275–285. [Google Scholar] [CrossRef] [Green Version]
- Maturilli, A.; Helbert, J.; John, J.M.S.; Head, J.W., III; Vaughan, W.M.; D’Amore, M.; Gottschalk, M.; Ferrari, S. Komatiites as Mercury surface analogues: Spectral measurements at PEL. Earth Planet. Sci. Lett. 2014, 398, 58–65. [Google Scholar] [CrossRef] [Green Version]
- Maturilli, A.; Helbert, J.; Arnold, G. The newly improved set-up at the Planetary Spectroscopy Laboratory (PSL). In Infrared Remote Sensing and Instrumentation XXVII; SPIE Optical Engineering Applications: San Diego, CA, USA, 2019; Volume 11128, p. 111280T. [Google Scholar]
- Rietveld, H.M. A profile refinement method for nuclear and magnetic structures. J. Appl. Crystallogr. 1969, 2, 65–71. [Google Scholar] [CrossRef]
- Larson, A.C.; Von Dreele, R.B. Generalized Structure Analysis System; University of California: San Diego, CA, USA, 1988. [Google Scholar]
- Toby, B.H. EXPGUI, a graphical user interface for GSAS. J. Appl. Crystallogr. 2001, 34, 210–213. [Google Scholar] [CrossRef] [Green Version]
- Downs, R.T.; Hall-Wallace, M. The American Mineralogist crystal structure database. Am. Mineral. 2003, 88, 247–250. [Google Scholar]
- Palmer, D.C. CrystalMaker; CrystalMaker Software Ltd: Begbroke, Oxfordshire, UK, 2014. [Google Scholar]
- Dollase, W.A. Correction of intensities for preferred orientation in powder diffractometry: Application of the March model. J. Appl. Crystallogr. 1986, 19, 267–272. [Google Scholar] [CrossRef]
- Adler, H.H.; Kerr, P.F. Infrared spectra, symmentry and structure relations of some carbonate minerals. Am. Mineral. 1963, 48, 839–853. [Google Scholar]
- Zubkova, N.V.; Pushcharovsky, D.Y.; Ivaldi, G.; Ferraris, G.; Pekov, I.V.; Chukanov, N.V. Crystal structure of natrite, gamma-Na2CO3. Neues Jahrb. Für Mineral. Monatshefte 2002, 2, 85–96. [Google Scholar] [CrossRef]
- Dušek, M.; Chapuis, G.; Meyer, M.; Petricek, V. Sodium carbonate revisited. Acta Crystallogr. Sect. B Struct. Sci. 2003, 59, 337–352. [Google Scholar] [CrossRef] [Green Version]
- Arakcheeva, A.; Bindi, L.; Pattison, P.; Meisser, N.; Chapuis, G.; Pekov, I. The incommensurately modulated structures of natural natrite at 120 and 293 K from synchrotron X-ray data. Am. Mineral. 2010, 95, 574–581. [Google Scholar] [CrossRef] [Green Version]
- Arakcheeva, A.; Chapuis, G. A reinterpretation of the phase transitions in Na2CO3. Acta Crystallogr. Sect. B Struct. Sci. 2005, 61, 601–607. [Google Scholar] [CrossRef] [PubMed] [Green Version]
- Swainson, I.P.; Dove, M.T.; Harris, M.J. Neutron powder diffraction study of the ferroelastic phase transition and lattice melting in sodium carbonate, Na2CO3. J. Phys. Condens. Matter 1995, 7, 4395. [Google Scholar] [CrossRef]
- Gavryushkin, P.N.; Thomas, V.G.; Bolotina, N.B.; Bakakin, V.V.; Golovin, A.V.; Seryotkin, Y.V.; Fursenko, D.A.; Litasov, K.D. Hydrothermal synthesis and structure solution of Na2Ca(CO3)2: “synthetic analogue” of mineral nyerereite. Cryst. Growth Des. 2016, 16, 1893–1902. [Google Scholar] [CrossRef]
- Song, Y.; Luo, M.; Zhao, D.; Peng, G.; Lina, C.; Ye, N. Explorations of new UV nonlinear optical materials in the Na2CO3–CaCO3 system. J. Mater. Chem. C 2017, 5, 8758. [Google Scholar] [CrossRef]
- Dickens, B.; Hyman, A.; Brown, W.E. Crystal structure of Ca2Na2(CO3)3 (shortite). J. Res. Natl. Bur. Stand. Sec. A Phys. Chem. A 1971, 75, 129–140. [Google Scholar] [CrossRef]
- Dickens, B.; Mauer, F.A.; Brown, W.E. A Refinement of the Crystal Structure of Na2CO3 H2O. J. Res. Natl. Bur. Standards. Sect. A Phys. Chem. 1970, 74, 319–324. [Google Scholar] [CrossRef]
- Wu, K.K.; Brown, I.D. A neutron diffraction study of Na2CO3.H2O. Acta Crystallogr. Sect. B: Struct. Crystallogr. Cryst. Chem. 1975, 31, 890–892. [Google Scholar] [CrossRef]
- Hartman, M.; Trnka, O.; Vesely, V.; Svoboda, K. Thermal dehydration of the sodium carbonate hydrates. Chem. Eng. Commun. 2001, 185, 1–16. [Google Scholar] [CrossRef]
- O’Bannon, E., III; Beavers, C.M.; Williams, Q. Trona at extreme conditions: A pollutant-sequestering material at high pressures and low temperatures. Am. Mineral. 2014, 99, 1973–1984. [Google Scholar] [CrossRef]
- Brown, C.J.; Peiser, H.S.; Turner-Jones, A. The Crystal Structure of Sodium Sesquicarbonate. Acta Crystallogr. 1949, 2, 167. [Google Scholar] [CrossRef]
- Choi, C.S.; Mighell, A.D. Neutron diffraction study of sodium sesquicarbonate dihydrate. Acta Crystallogr. Sect. B: Struct. Crystallogr. Cryst. Chem. 1982, 38, 2874–2876. [Google Scholar] [CrossRef]
- Barall, E.M., II; Rogers, L.B. Differential thermal analysis of the decomposition of sodium bicarbonate and its simple double salts. J. Inorg. Nucl. Chem. 1966, 28, 41–51. [Google Scholar] [CrossRef]
- Bultel, B.; Viennet, J.C.; Poulet, F.; Carter, J.; Werner, S.C. Detection of carbonates in Martian weathering profiles. J. Geophys. Res. Planets 2019, 124, 989–1007. [Google Scholar] [CrossRef]
- Huang, C.K.; Kerr, P.F. Infrared study of the carbonate minerals. Am. Mineral. 1960, 45, 311–324. [Google Scholar]
- Frost, R.L.; Dickfos, M.J. Raman and infrared spectroscopic study of the anhydrous carbonate minerals shortite and barytocalcite. Spectrochim. Acta A Mol. Biomol. Spectrosc. 2008, 71, 143–146. [Google Scholar] [CrossRef] [PubMed] [Green Version]
- Hartley, M.; Maclennan, J. Magmatic densities control erupted volumes in Icelandic volcanic systems. Front. Earth Sci. 2018, 6, 29. [Google Scholar] [CrossRef] [Green Version]
- De Sanctis, M.C.; Ammannito, E.; Raponi, A.; Marchi, S.; McCord, T.B.; McSween, H.Y.; Longobardo, A. Ammoniated phyllosilicates with a likely outer Solar System origin on (1) Ceres. Nature 2015, 528, 2412–2444. [Google Scholar] [CrossRef] [PubMed] [Green Version]
- Schröder, S.E.; Poch, O.; Ferrari, M.; De Angelis, S.; Sultana, R.; Potin, S.M.; Beck, P.; De Sanctis, M.C.; Schmitt, B. Dwarf planet (1) Ceres surface bluing due to high porosity resulting from sublimation. Nat. Commun. 2012, 12, 1–9. [Google Scholar]
- McSween, H.Y., Jr.; Emery, J.P.; Rivkin, A.S.; Toplis, M.J.; Castillo-Rogez, J.C.; Prettyman, T.H.; Russell, C.T. Carbonaceous chondrites as analogs for the composition and alteration of Ceres. Meteorit. Planet. Sci. 2018, 53, 1793–1804. [Google Scholar] [CrossRef]
- Schenk, P.; Sizemore, H.; Schmidt, B.; Castillo-Rogez, J.; De Sanctis, M.; Bowling, T.; Scully, J.; Buczkowski, D.; Quick, L.; Preusker, F.; et al. The central pit and dome at Cerealia Facula bright deposit and floor deposits in Occator crater, Ceres: Morphology, comparisons and formation. Icarus 2019, 320, 159–187. [Google Scholar] [CrossRef]
- Russell, C.T.; Raymond, C.A.; Ammannito, E.; Buczkowski, D.L.; De Sanctis, M.C.; Hiesinger, H.; Yamashita, N. Dawn arrives at Ceres: Exploration of a small, volatile-rich world. Science 2016, 353, 1008–1010. [Google Scholar] [CrossRef] [PubMed] [Green Version]
- Schenk, P.; Scully, J.; Buczkowski, D.; Sizemore, H.; Schmidt, B.; Pieters, C.; Raymond, C. Impact heat driven volatile redistribution at Occator crater on Ceres as a comparative planetary process. Nat. Commun. 2020, 11, 1–11. [Google Scholar] [CrossRef]
- Ruesch, O.; Platz, T.; Schenk, P.; McFadden, L.A.; Castillo-Rogez, J.C.; Quick, L.C.; Byrne, S.; Preusker, F.; O’Brien, D.P.; Schmedemann, N.; et al. Cryovolcanism on Ceres. Science 2016, 353, aaf4286. [Google Scholar] [CrossRef] [PubMed] [Green Version]
- Bu, C.; Lopez, G.R.; Dukes, C.A.; McFadden, L.A.; Li, J.Y.; Ruesch, O. Stability of hydrated carbonates on Ceres. Icarus 2019, 320, 136–149. [Google Scholar] [CrossRef]
- Zucchini, A.; Prencipe, M.; Belmonte, D.; Comodi, P. Ab initio study of the dolomite to dolomite II high pressure phase transition. Eur. J. Mineral. 2017, 29, 227–238. [Google Scholar] [CrossRef]
- Zucchini, A.; Comodi, P.; Nazzareni, S.; Hanfland, M. The effect of cation ordering and temperature on the high-pressure behaviour of dolomite. Phys. Chem. Miner. 2014, 41, 783–793. [Google Scholar] [CrossRef]
- Nakamura, R.; Ohtani, E. The high-pressure phase relation of the MgSO4–H2O system and its implication for the internal structure of Ganymede. Icarus 2011, 211, 648–654. [Google Scholar] [CrossRef]
- Journaux, B.; Kalousov’a, K.; Sotin, C.; Tobie, G.; Vance, S.; Saur, J.; Bollengier, O.; Noack, L.; Rückriemen-Bez, T.; Van Hoolst, T.; et al. Large ocean worlds with high-pressure ices. Space Sci. Rev. 2020, 216, 1–36. [Google Scholar] [CrossRef]
- Bevington, P.R.; Robinson, D.K.; Blair, J.M.; Mallinckrodt, A.J.; McKay, S. Data reduction and error analysis for the physical sciences. Comput. Phys. 1993, 7, 415–416. [Google Scholar] [CrossRef]


| Minerals | Chemical Formula | Source |
|---|---|---|
| Natrite | Na2CO3 | Koashva, Kola, Russia |
| Nyerereite | Na2Ca(CO3)2 | Synthetic |
| Shortite | Na2Ca2(CO3)3 | Green River, Wyoming, USA |
| Thermonatrite | Na2CO3·H2O | MT. Koashva, Kola, Russia |
| Trona | Na2(CO3)(HCO3)·2(H2O) | Wadi El-Natrun, Westen Desert, Egypt |
| Mineral Name | CO32− Fundamentals (µm) | CO32− Overtones and Combinations (µm) | OH Bands (µm) | H2O Bands (µm) | |||||||
|---|---|---|---|---|---|---|---|---|---|---|---|
| ν1 | ν2 | ν3 | ν4 | 2ν3 | 2ν1 + 2ν3 | ν1 + ν3 | 3ν3 | ν1 + 2v3 | |||
| Natrite a Na2CO3 | 9.36 9.68 9.90 | 11.29 11.75 12.78 | 6.24 7.07 7.16 | 14.25 14.41 | 3.35 3.51 | 1.94/H2O 2.05 | 3.86 4.01 | 2.34 | 2.54 | 1.52− 1.74− 1.94− | 2.88− 5.62− 5.91− |
| Nyerereite Na2Ca(CO3)2 | 9.33 | 11.24 11.55 11.84 | 6.61 6.70 6.85 7.04 7.20 | 13.83 14.78 | 3.35 3.43 | 1.95/H2O 2.06 | 3.85 3.95 4.04 | 2.31 | 2.46 2.51 | 1.57− 1.80− 1.95− | 2.90− 5.55− 5.70− 6.19− |
| Shortite b Na2Ca2(CO3)3 | 9.18 9.33 | 11.43 11.71 12.10 12.47 | 6.15 6.93 7.01 7.13 | 13.68 13.90 14.10 14.36 | 3.41 3.50 | 1.91/H2O | 3.80 3.95 4.06 | 2.31 2.35 | 2.51 | 1.72− 1.76− 1.91− | 3.02− 3.12− 5.51− |
| Thermonatrite c Na2CO3·H2O | 9.57 | 11.31 | 6.40 7.04 | 14.44 14.97 | 2.04 | 4.05 4.42 | 2.22 | 2.44 | 1.52+ 1.74+ 1.94+ | 2.83− 3− 5.68− | |
| Trona d Na3(CO3)(HCO3)·2(H2O) | 9.53 | 6.44 7.05 | 14.33 14.97 | 2.04 | 2.21 2.39 | 1.52+ 1.74+ 1.94+ | ~3− 5.61+ | ||||
| Phase | T (K) | Symmetry | Cell Parameters (Å) |
|---|---|---|---|
| α | 757–1000 | Hexagonal P63/mmm | a = 5.209(2), c = 6.454–6.676 |
| β | 628–757 | Monoclinic C2/m | a = 9.00(2), b = 5.23(2), c = 6.21–6.44, β = 101.87 (8) |
| γ | 170–628 | Monoclinic C2/m | a = 8.920(7), b = 5.245(5), c = 6.050(5), β = 101.35 (8) |
| δ | ≤170 | Monoclinic P21/n | a = 8.898 (7), b = 5.237 (5), c = 5.996 (5), β = 101.87 (8) |
Publisher’s Note: MDPI stays neutral with regard to jurisdictional claims in published maps and institutional affiliations. |
© 2021 by the authors. Licensee MDPI, Basel, Switzerland. This article is an open access article distributed under the terms and conditions of the Creative Commons Attribution (CC BY) license (https://creativecommons.org/licenses/by/4.0/).
Share and Cite
Fastelli, M.; Zucchini, A.; Comodi, P.; Maturilli, A.; Alemanno, G.; Palomba, E.; Piergallini, R. NIR-MID Reflectance and Emissivity Study at Different Temperatures of Sodium Carbonate Minerals: Spectra Characterization and Implication for Remote Sensing Identification. Minerals 2021, 11, 845. https://0-doi-org.brum.beds.ac.uk/10.3390/min11080845
Fastelli M, Zucchini A, Comodi P, Maturilli A, Alemanno G, Palomba E, Piergallini R. NIR-MID Reflectance and Emissivity Study at Different Temperatures of Sodium Carbonate Minerals: Spectra Characterization and Implication for Remote Sensing Identification. Minerals. 2021; 11(8):845. https://0-doi-org.brum.beds.ac.uk/10.3390/min11080845
Chicago/Turabian StyleFastelli, Maximiliano, Azzurra Zucchini, Paola Comodi, Alessandro Maturilli, Giulia Alemanno, Ernesto Palomba, and Riccardo Piergallini. 2021. "NIR-MID Reflectance and Emissivity Study at Different Temperatures of Sodium Carbonate Minerals: Spectra Characterization and Implication for Remote Sensing Identification" Minerals 11, no. 8: 845. https://0-doi-org.brum.beds.ac.uk/10.3390/min11080845