
Mineralogical Characterization and Acid Pretreatment of a Gold Calcine Leach Residue
by
 , , and
Godfrey Tinashe Bare
1,2, 
Jean Jacques Kalombo Mbayo
1,2,
Sehliselo Ndlovu
1,2,*,
Alan Shemi
1,2 and
Liberty Chipise
1,2,3 1
School of Chemical and Metallurgical Engineering, University of the Witwatersrand, Johannesburg 2000, South Africa
2
DSI/NRF SARChI, Hydrometallurgy and Sustainable Development, University of the Witwatersrand, Johannesburg 2000, South Africa
3
Department of Metallurgical Engineering, Manicaland State University of Applied Sciences, Mutare, Zimbabwe
*
Author to whom correspondence should be addressed.
Minerals 2022, 12(1), 10; https://0-doi-org.brum.beds.ac.uk/10.3390/min12010010
Submission received: 1 November 2021
/
Revised: 9 December 2021
/
Accepted: 16 December 2021
/
Published: 23 December 2021
(This article belongs to the Special Issue Hydrometallurgy in Gold Extraction)
Abstract
:Miners around Zimbabwe used to supply gold concentrates from sulphide flotation to the Kwekwe Roasting Plant (Zimbabwe) for toll treatment. The concentrates were roasted in Edward’s roasters and the calcine product was leached by cyanidation. Due to inefficient roasting, overall gold recoveries of 75–80% left behind a rich calcine leach residue at the Kwekwe Roasting Plant. The characterization performed to establish a potential process route involved several techniques, such as X-ray diffraction (XRD), scanning electron microscopy (SEM), fire assaying and inductively coupled plasma (ICP). Assays conducted on samples from the 350,000 tons tailings dam residue, created over the operational years, gave an average Au grade of 8.58 g/t and 12.54 g/t for Ag. The base metals assayed—0.11% Cu, 0.10% Pb, 0.17% Zn and 26.05% Fe. SiO2 (36.1%), Fe2O3 (36.9%), Mg3Si4O10 (OH)2 (8.9%), NaAlSi3O8 (6.9%), and Fe3O4 (6.4%)—were the major mineral phases in the cyanide leach residue. SEM gold scans on 24 polished sections showed only 2 discrete gold particles of less than 5 µm, with one partially liberated and associated with quartz, while the other was fully liberated. Therefore, the particulate gold in the calcine leach residue was negligible. It was deduced from the analysis after ultrafine milling (P80 < 5 µm) followed by cyanidation that 68.53% of the gold was sub-microscopic. Direct cyanidation using bottle roll resulted in only 2.33% of the total gold being leachable, indicating that the calcine leach residue was highly refractory. Diagnostic leaching by sequential use of acids in order of their strength resulted in HCl leachable phases (CaCO3, CaMg(CO3)2, PbS, Fe1-XS, and Fe2O3) freeing 4.2% of the total Au during subsequent cyanidation leach. H2SO4 leachable phases (Cu–Zn sulphides, labile FeS2) released an additional 26.57% during cyanidation, whereas HNO3 leachable phases (FeS2, FeAsS) released a further 20.98% of Au. After acid treatment and subsequent cyanidation, hot caustic leach of the residue followed by carbon in pulp resulted 4.43% of the total gold being eluted. Therefore, 4.43% of the total gold was surface bound. From the analysis after diagnostic acid leaching, it was deduced that a total of 54.08% of the gold was in the acid-leachable phase. Due to cost and environmental considerations, H2SO4 was selected for the evaluation of acid digestion as a pretreatment stage followed by cyanidation. Increasing the H2SO4 strength for the pretreatment of the calcine leach residue increased gold recoveries during cyanidation.
1. Introduction
The mineralogical investigation of ores is an important tool and a critical aspect in the prefeasibility studies of metallurgical work and quality control of metallurgical processes. The mineralogical characterization of process tailings is performed to investigate the reasons why valuables report to the tails. This helps to identify and explore the tails as a possible secondary resource. The identification and quantification of all gold carriers, as part of the mineralogical investigation of gold in the primary ore and tailings, expands insight into tails reprocessing routes.
In nature, gold exists as native gold, gold alloys, gold compounds and invisible gold associated with other mineral phases [1,2,3,4]. Gold can also be present as surface bound on carbon surfaces, and some researchers have also reported silica sand surfaces as having a capability of adsorbing gold [5]. Gold grains visible to the naked eye and simple light microscope are referred to as the microscopic gold, which, in some instances, can be alloyed with silver in nature. Invisible or submicroscopic gold (this size of gold is not detectable on the microscope) is divided into colloidal gold and solid solution gold, and both are commonly associated with sulphide minerals and iron oxides. Some of the minerals that associate with or carry gold make it inaccessible to lixiviants during leaching, and sometimes these can compete with gold for oxygen or cyanide [6]. These types of ores are referred to as refractory. The main reaction for cyanide is presented in Equation (1):
4 Au + 8NaCN + O2 +2H2O = 4Au (CN)2− + 4Na+ + 4NaOH
Overall, recoveries in gold plants are affected by many factors that sometimes necessitate the need for pretreatment of the refractory ores before cyanidation. Roasting was the most preferred pretreatment method in the pre 1980s due to its simplicity and ability to deal with double refractory ores. Changes in gas emission laws and advancement in other pretreatment methods, such as bio-oxidation [7,8], pressure oxidation [9,10], nitrox [11]), and Kell gold [12], reduced the preference for roasting. Many commercial plants, which used Edward’s roasters in the pre-1980 era (but now all have been decommissioned), included Government Roasting Plant (Kwekwe, Zimbabwe), Ashanti Goldfields Corporation (Obuasi, Ghana), Con Mine (Yellowknife, NT, Canada), Barrick Goldstrike (Eureka County, NV, USA), Fairview (Barberton, South Africa), Mount Morgan (Queensland, Australia) and Giant Yellowknife Mines (Yellowknife, NT, Canada) [1,13,14].
The migration of solid solution gold to the grain boundaries through pores created during roasting in response to the arsenic and sulphur diffusion direction has been reported by many researchers [2,15,16]. As a result of the migration, the coalescence of solid solution gold occurs and leads to the formation of particulate gold of up to 1µm diameter. Due to the destruction of the sulphide matrix during oxidation, this gold becomes easily accessible to leaching lixiviants [2]. The only gold that is left unexposed to cyanidation after roasting is the one that, initially, was totally enclosed in silicates. Due to some challenges with roasting, the complete migration and liberation of gold from the sulphide matrix is not achieved. Roaster calcine and autoclave cyanidation tails gold losses have been reported as being mostly associated with submicroscopic sized gold [1,5]. Paktunc and collaborators [15] noted the existence of gold as a surface bound, solid solution residual in maghematite and unoxidized sulphides in Barric Goldstrike’s calcine leach residue. Douglas and Semenyna [17] reported the greater part of the gold in the Barric Goldstrike’s calcine leach residue as being submicroscopic gold locked up in iron oxides and the remainder being gold salts, gold locked up in quartz and surface adsorbed gold. Microscopic gold and submicroscopic gold associated with As, S, silicates and talc in the Fairview calcine leach residue have been reported by Mutimutema [18].
To fully characterize ores and tailings, Zhou and co-authors [5] categorized mineralogical analysis techniques into conventional and advanced instrumental techniques. Fire assay for total gold determination, direct cyanide leach for free gold determination and diagnostic leach for determination of gold mineral association form part of the conventional techniques. Advanced instrumental techniques include (1) scanning electron microscopy (SEM) for gold scans, mineral identification, liberation and surface morphological study; (2) dynamic secondary ion mass spectrometry (D-SIMS) for the quantification and mapping of gold in sulfides and FeOx; (3) proton-induced X-ray emission (µ-PIXE) for the quantification and mapping of gold in sulfides and silicates; (4) laser ablation microprobe inductively coupled plasma mass spectroscopy (LAM-ICP-MS) for the quantification of gold in sulfides, silicates and oxides; an, (5) time-of-flight laser ion mass spectrometry (TOF-LIMS) for the quantification of surface gold and analysis of surface chemistry. Scans for visible gold can be detected using optical microscopy and SEM. Submicroscopic gold and surface adsorbed gold can only be detected by techniques 1–5 [1,19,20].
Reaction thermodynamics and kinetics for the acid digestion of hematite and magnetite has been investigated by many researchers [4,21,22]. The use of nitric acid as a pre-treatment method to process pyrite and arsenopyrite gold ores has also been recently investigated [23,24]. The application of sulphuric acid has been widely used for ferrous and non-ferrous metal leaching in hydrometallurgy. McRae [25] reported that calcine leach residue from Barberton, South Africa, offered a good recovery when pretreated with 40% hot sulphuric acid. The first reaction involves the acid dissociation of the sulphuric acid, as shown by Equations (2) and (3):
Two mechanisms of hematite dissolution have been noted. In the first one, and diffuse to the iron surface past the boundary layer and are adsorbed on the surface, forming a Fe complex that then detaches itself and diffuses to the bulk solution according to Equation (4) [26]:
In the protonation mechanism, which is the second one, a hydroxonium ion diffuses to the Fe surface and the protons are adsorbed on the surface weakening the Fe–O bond leading to the desorption of the Fe(III) ion, which then migrates to the bulk solution [27,28]. Senanayake and Muir [29] identified formed in sulphate media, as the most stable complex according to Equation (5):
At suitable acidity, Yang et al. [30] reported that ferric sulphate reacts with sulphuric acid to form rhomboclase according to the reaction in Equation (6):
The residue from the iron oxide digestion stage can then be washed and taken for gold recovery using cyanide. Corrans and Hayes [30] reported that acid digestion did not give satisfactory results when they tried it as a pretreatment method using a leached calcine residue.
Background
In 1937, the Government of Zimbabwe installed Edward’s roasters at the Kwekwe Roasting Plant to assist medium- and small-scale miners to treat their refractory sulphide ores. The flotation concentrates were obtained from mines mainly located on the Zimbabwe greenstone belt with ores that predominantly have arsenopyrite and pyrite as major gold carriers. The flotation concentrates delivered at the roasting plant had an average gold assay of 80–100 g/t [31]. The roaster exit calcine was milled and gravity-recoverable gold was recovered by the use of James tables prior to the recovery by cyanidation. Due to inefficiencies of the Edward’s roasters, overall gold recoveries of 75–80% were reported over the operational years, leaving behind a rich calcine leach residue. Assays conducted on the calcine leach residue revealed an average gold grade of 10 g/t. Therefore, this test work focuses on the mineralogical characterization of the historical Kwekwe tailings and explores the possible hydrometallurgy pretreatment method from the characterization results.
2. Materials and Methods
The material used in the study was a calcine leach residue obtained from the Kwekwe Roasting Plant, Zimbabwe. Analytical grade sulphuric acid, nitric acid, hydrochloric acid, sodium hydroxide, hydrated lime and sodium cyanide were used in the characterization tests. Activated carbon was also used in all cyanidation tests.
All gold cyanide leaching was performed using 5 liter HDPE bottles on a bottle rolling jar mill. Acid digestion steps were conducted in a jacketed glass reactor fitted with an overhead stirrer. A Buchner funnel connected to a vacuum pump was used for solid–liquid separation after each stage. A thermo scientific Orion star A211 pH meter was used in the tests.
The investigative procedure followed in the characterization of the calcine leach residue used in this study, from the Kwekwe Roasting Plant, is depicted in Figure 1. Based on the mineralogical analysis techniques proposed by Zhou and co-workers [5], the methodology of this study had the following objectives:
- The determination of Au and Ag by fire assay;
- The chemical analysis of base metals, S, As and other elements;
- The quantification of the fractions of liberated gold, gold associated with sulfides, gold associated with oxides/silicates and gold associated with carbonaceous material;
- The determination of the total visible gold, including identification and location of all gold minerals, their size, distribution, composition, liberation characteristics and associations with other minerals;
- The quantification of submicroscopic gold in sulfide and other minerals;
- The evaluation of preg-robbing potential of carbonaceous matter and gangue minerals;
- Depending on the above findings, to attempt the hydrometallurgical pretreatment method before gold recovery by cyanidation.
2.1. Sampling and Sample Collection
To determine the grade of the calcine leach residue dumps at the Kwekwe Roasting Plant, 4 slime dumps on site were identified and named. Each of these dumps was divided into three sections, top, middle, and bottom and representative samples were taken for fire assay. The fire assay of calcine leach residue dumps is listed in Table 1 below.
Considering the grade variability of the dumps due to the toll treatment process, 2 bags weighing 25 kg each of calcine leach residue material were collected from different points of the dump and supplied to the University of the Witwatersrand for the work reported in this paper. The calcine leach residue material was thoroughly mixed and representative samples were obtained using a spinning sample splitter for characterization.
2.2. Mineralogical Characterization
2.2.1. PSD
The feed sample particle size distribution to determine the ore P80 was performed on a 500 g sample using the wet screening method. The particle size analysis was conducted by physically screening the samples using test sieves (Fritsch, Idar-Oberstein, Germany) of various screen sizes within the range of 38 μm and 212 μm.
2.2.2. XRD Analysis
The mineralogical characterization using XRD analysis was employed to identify the mineral phases present in the sample. After milling, the material was prepared for XRD analysis using a back loading preparation method. The analysis was performed using a Malvern PANalytical Aeris diffractometer with PIXcel detector and fixed slits with Fe filtered Co-Kα radiation. The phases were identified using X’Pert Highscore plus software.
2.2.3. Chemical Analysis
The chemical analysis of the material to determine the major elements (Mg, Al, Si, Ca, Ti, V, Cr, Mn, Fe, Co, Ni, Cu, Zn and Pb) was performed using an inductively coupled plasma-optical emission spectrometry (ICP-OES) analyzer (Model: SPECTRO GENESIS, Spectro Analytical Instruments, Germany) with a detection limit of 0.05%. Furthermore, a gold aliquot sample was prepared by acid digestion and the subsequent solution was analyzed by mass spectrometry for the determination of silver (Ag). Fire assay analysis was conducted on the sample for determination of Au content.
2.2.4. SEM Analysis
A representative sample was screened into four fractions and prepared into 30 mm diameter polished sections for analysis using AutoSEM (MLA). The analysis is based on a bright phase search, which seeks out gold grains based on their higher backscattered electron intensity under the electron beam, compared with constituent gangue minerals. The bright phase(s), along with any of the other phases in the particle in which it occurs, were mapped using image analysis software. From the acquired data, information regarding the constituent Au-bearing minerals, associations between Au-minerals and gangue, grain size distribution and the liberation and exposure characteristics of the Au bearing minerals were derived. Note that the MLA, as an automated SEM, only seeks out discrete gold grains. However, gold in a solid solution of other minerals will not be found using this approach. A total of 24 polished sections were prepared and analyzed.
2.2.5. Diagnostic Leaching
Using part of the procedure employed by CELEP and co-workers [32], diagnostic leaching was conducted to determine the mineral phases occluding gold in the calcine leach residue. To perform this, different acids were used, in sequence, to digest different mineral phases in their order of strength and each acid digestion stage was followed by gold cyanidation of the exposed gold using a bottle roll leach method. HCl, H2SO4 and HNO3 acids were used as listed in Table 2 below. The acid treatments were carried out using a 2 liter jacketed reactor vessel, which was mechanically agitated with an overhead stirrer. A bottle roll machine operated at 60 rpm was used for the cyanide leaching process. The solid-to-liquid ratio was maintained at 1:2 for all samples. The cyanide leaching was conducted using 5 liter HDPE bottles with a hole on the lid for air transfer. Hydrated lime was used for pH control (10.5–11.5) and excess cyanide (6kg/ton) was added to the samples for cyanidation. After a treatment with different acids, a hot caustic leach was performed to check the presence of gold associated with carbon. The final solid tails from the hot caustic leach stage were taken for fire assay and the intermediate solutions were taken for analysis to determine the gold and base metal content using the Agilent 240 FS AAS machine. The diagnostic leaching tests were carried out according to the procedure presented in Table 2.
2.3. Alternative Gold Recovery Process Stages
2.3.1. Ultrafine Milling and Cyanidation
A part of the sample weighing 1 kg was milled for a predetermined period in a zirconium mill until the particle P80 was 5 µm. The material was taken and re-pulped to 40% solids by mass, and the pH corrected to 11.5. The slurry was put in a vessel with an overhead stirrer and agitated at 500 rpm; 6 kg/ton cyanide was added to commence the gold leaching and the test was run for 48 h. After 48 h, the slurry was filtered, and the residue was washed and filtered again. The final washed residue was taken for fire assay.
2.3.2. Acid Pretreatment and Cyanidation
Acid Pretreatment
The acid pretreatment stage involved acid digestion tests. Before acid pre-treatment, the ore was first ultra-finely milled in a zirconia ball mill with zirconium ceramic beads to avoid contamination. A milling curve was determined by loading 1 kilogram of the sample per run and about 45% ball loading. In order to obtain the required PSD, the ore was milled, using a Changsha Tianchuang powder technology bottle roll machine at 250 rpm, for an optimum residence time of 4 h.
Acid digestion runs were then conducted in a 2 liter glass jacketed reactor closed using a 4-neck glass lid connected to a Daihan scientific HT-50 DX overhead stirrer operated at 500 rpm. A glass air dispenser connected to an air pump was inserted through one lid neck into the reactor to bubble air into the slurry. An FHS instrument FMH110 circulating water bath was connected to the jacketed reactor to maintain the desired temperature of 95 °C.
A pulp density of 20% (w/v) was maintained for all the experiments, which translates to 400 g of the calcine in 2 L of de-ionized water. All acid digestion tests were performed with a residence time of 4 h. Hourly samples to monitor iron and base-metal leaching rates were taken. A 2-stage Gardner Denver vacuum system LVS301connected to a Buchner flask and Buchner funnel was used for solid–liquid separation. The hourly filtrate was analyzed using an atomic absorption spectrometer (AAS) machine (Model: Agilent 240FS, Agilent Technologies, Santa Clara, CA, USA) for iron and base metal content in solution. Temperature, pulp density, agitation speed and particle size were kept as constant parameters and only acid concentration was the variable parameter.
Gold and Silver Recovery from Acid Pretreated Calcine Residue (Cyanidation)
After acid digestion, the residue was re-pulped with de-ionized water twice and filtered as a wash stage forming a 20% pulp density at each stage. The washed sample was then dried in an oven at 50 degrees Celsius before the cyanidation stage.
A 20% (w/v) pulp density was maintained for these experiments by mixing 200 g of acid digested residue with 1000 mL of deionized water. A number of 5 Litre HDPE bottles with a hole on the lid were used for bottle roll cyanidation tests. Bottle roll cyanidation was conducted at ambient conditions using a Changsha Tianchuang powder technology bottle roll. A residence time of 24 h was maintained for all bottle roll cyanidation experiments at an agitation rate of 150 rpm. After leaching, the slurry was filtered, and the residue was washed and filtered twice before drying. The dried sample was taken for fire assay to determine the residual gold content in tails. Moreover, a chemical analysis was performed on the residue to determine the amount of residual iron and base metals.
3. Results and Discussion
3.1. Mineralogical Characterization
3.1.1. PSD
Root 2 series sieves were used, and the mass retained at each screen recorded as shown in Table 3.
By interpolating the P80 from the cumulative percentage passing against sieve size, the graph in Figure 2 below shows that the material’s P80 is 44.92 µm.
3.1.2. XRD Analysis
The Kwekwe Roasting Plant calcine leach residue material predominantly contained SiO2, and Fe2O3, as confirmed by the XRD results shown in Table 4. Mutimutema [18]) also reported the dominance of SiO2, and Fe2O3 in the Fairview Barberton calcine leach residue. This consistency in results may be caused by some similarities in the processing route and feed specifications for Edward’s roasters that were used in both processing plants. In the roaster operation, it has been pointed that a strict monitoring of the sulfur content, which required the addition of sulphur to low sulphur concentrates and addition of SiO2, to high sulphur concentrates, was important [33].
The FeS2/FeAsS oxidation reaction mechanism follows a Fe1−XS, Fe3O4 then Fe2O4 pathway, as reported by Yannopoulos [4]. The Fe3O4 intermediary product is a dense and low porosity phase that tends to retain As, S and gold. Many researchers have reported this phase as the major cause of gold reporting to the tailings [1,2,17]. In the Kwekwe Roasting Plant, the XRD results presented above show Fe3O4 to be 6.4% and gold association with iron oxides is a high possibility.
3.1.3. Chemical Analysis
Table 5 shows the bulk chemical assay results. The major elements detected are iron and silicon as confirmed by the XRD analysis above. The average gold grade of the analyzed sample is 8.58 g/t, and the average silver content is 12.54 g/t.
Considering the high presence of antimony (0.22%) in the calcine leach residue, the presence of stibnite in the concentrate supplied by the Kwekwe Roasting Plant might have influenced the high antimony levels (above 0.5%) during roasting, causing clinkering by triggering the particles in the roaster bed to agglomerate. This has also been reported by Thomas and Cole [10]. This is caused by an oxidation product of stibnite and antimony trioxide, which has a low melting point. Equation (7) shows this reaction:
Furthermore, a cyanide insoluble Ag–Sb alloy can result when antimony reacts with silver, and this can form an impervious layer around the gold termed antimony glass [2]. Bearing in mind the high silver (12.34 g/t) content in the calcine leach residue listed in Table 5, the possibility of this reaction in the roasters was very high.
Gold alloying with lead and antimony was observed in the Barberton roaster product and the formed auro-stibnite cannot be readily susceptible to cyanidation. Insoluble coatings of lead oxide around gold can occur if high lead quantities are present in the concentrate, which passivate the gold during the cyanidation process, and this is known to be solved by a dilute sodium chloride wash step prior to the gold dissolution in cyanide [2].
Gudyanga et al. [31] also confirmed high Pb and Cu contents in the concentrates and the high residual gold assay in the calcine leach residue. The high calcium content in the calcine leach residue might have been introduced through the addition of hydrated lime Ca(OH)2 during pH correction before cyanidation.
3.1.4. SEM Analysis
From the 24 prepared polished sections run on the SEM machine, only 2 gold (electrum) grains were identified. The analyzed sample was found to have an extremely low content of discrete gold grains. The two gold grains identified were very fine (4.8 microns and 2 microns in equivalent circle diameter size); one was liberated while the other was attached to a SiO₂ grain (Figure 3).
The sample was comprised of an abundance of porous iron–oxide particles (Figure 4) with textures typical of oxides in leached ores. The results of the gold characterization suggest that the leaching of the feed from which the analyzed calcine leach residue sample resulted was successful in extracting the discrete gold, as almost none could be identified in the calcine leach residue. However, the amount of discrete gold detected in the sample by automated SEM is inconsistent with the obtained gold grade of the sample. It is possible that the gold is sub-microscopic and is hosted within the porous Fe oxides at ppm levels; at such low concentrations the gold is undetectable via AutoSEM techniques. Given the large amount of Fe oxides present, as suggested by Figure 4, and the bulk Fe content, Au present at a low ppm in the Fe oxide would account for a large portion of the bulk Au grade.
3.1.5. Diagnostic Leaching
Gold recovery was calculated using the gold in solution as a percentage of the gold in the head grade. Direct cyanidation recovery of gold using bottle roll was 2.33%, suggesting that the calcine leach residue is highly refractory. Pre-treatment using HCl freed a further 4.2% of the gold present in the sample in the subsequent cyanidation stage and this showed that gold associated with Calcite, dolomite, galena, pyrhotite, and hematite was relatively low. Sulphuric acid and nitric acid treatment showed to have released most of the gold, implying that Cu–Zn sulphides, labile pyrite, Pyrite, marcasite and arsenopyrite are the possible dominant phases that occlude the gold in the calcine leach residue. This suggests that acid pretreatment using H2SO4 or HNO3 is a key step in processing the calcine leach residue. In recent studies, the use of HNO3 has shown to be a very effective pretreatment method for pyrite and arsenopyrite ores [23,24], especially as HNO3 is regarded as an oxidizing acid. However, there is a possibility that H2SO4, when used in combination with ferric sulphate, can be used to free the gold that was freed at the HNO3 leaching stage. Table 6 and Figure 5 show the comparison of gold recovery after each acid pretreatment stage.
The residue, after the diagnostic leach, was tested for gold using the fire assay method and the results showed an average Au grade of 3.18 g/t compared to an average of 8.58 g/t head grade. A calculated overall recovery of 62.9% was obtained based on the fire assay results and the fire assay head grade, thus confirming the accuracy of the solution grade calculated above.
The results of gold recovered from hot caustic leach also indicate the presence of surface adsorbed gold in the calcine leach residue. This suggests that a hot caustic leach could be a necessary step to be employed at the end of the method of choice.
The calculated total gold recovery from the diagnostic leach test based on the solution assay was 58.51%. Figure 6 shows the cumulative Au recovery after each stage.
During the inter-stage acid treatment, the pulp thickened at a 60 °C operating temperature during the experiment. This was largely noted during the H2SO4 treatment stage. The stored filtrate from the inter-stage acid pretreatment had a white crystalline precipitate, which was formed at the bottom (Figure 7). Samples were taken for SEM-EDS analysis, and the results revealed the presence of three major constituents (S, O and Ca). This was likely to be CaSO4. The precipitate, SEM image and precipitate EDS are shown in Figure 7.
The precipitates were more visible in the HCl and H2SO4 digestion liquor. SEM results revealed that the precipitates were calcium sulphate in both cases. This shows the need to be aware of the possibility of gypsum formation in the processing of the calcine leach residue using the acid digestion route. Gypsum tends to cause the blockages of pipes and the scaling of process equipment.
3.2. Alternative Gold Recovery Process Stages
3.2.1. Ultrafine Milling and Cyanidation
Zhou and co-authors [20] pointed out that intensive cyanide leaching on a finely ground sample (−5 µm) for prolonged times (48–72 h) and relatively high cyanide concentrations (>5 g/L) to leach out all the exposed gold gives an equal or close value of sub-microscopic gold, when the result of residue fire assay is compared to SIMS sub microscopic gold value. This test was used to estimate the amount of gold existing as a solid solution in the sample. The results are listed in Table 7.
3.2.2. Acid Pretreatment and Cyanidation
Based on the performance of the diagnostic leach tests, an acid leach step followed by cyanidation, gold adsorption on carbon, gold elution from carbon then gold electrowinning presents a promising potential for processing the calcine leach residue. The acid pretreatment has the potential to improve gold recovery from the acid leachable phases, which are otherwise unreachable by cyanidation alone. Therefore, acid leach pretreatment prior to cyanidation could improve the overall gold recovery from the cyanide leach residue.
Direct cyanidation results showed that only 2.33% of the total gold exists as free gold. This was supported by SEM gold search results, which showed a negligible mount of SEM visible gold. The inability to access the gold by direct cyanidation necessitates pretreatment in order to expose the gold to the cyanide lixiviant.
Ultrafine milling of the calcine leach residue to a P80 of 5 µm showed that 31.47% of the gold can be recovered in the subsequent cyanidation step. This showed that 68.53% of the gold exists as submicroscopic gold, pointing out that the pretreatment method of choice must be able to free the occluded submicroscopic gold. Despite the XRD results showing the abundance of iron oxide phases (Fe2O3, 36.9%; Fe3O4, 6.4%) in the calcine leach residue, the diagnostic leach test showed that only 4.2% of the total gold is in the iron oxide phases. The SEM image showed the porous, popcorn-like structure of the iron oxide phases, which made the gold accessible to the lixiviant in the previous cyanidation process during the operational days of the Kwekwe Roasting Plant. Diagnostic leaching also showed that the bulk of the gold is still present in the unoxidized sulphidic phases. Chemical analysis showed relatively high amounts of base metals in the ore making it a polymetallic calcine leach residue. Based on the results obtained from the diagnostic leaching, it can be seen that there is a possibility of leaching out the base metals during acid treatment to reduce the detrimental effects of base metals in the subsequent cyanidation step.
Acid Pretreatment
The acid digestion filtrate liquor increased color intensity from the 5% liquor to the 20% liquor and the intensity started to decrease for the 35% and 45% acid concentration. The color of the wash water from the 35% and 45% residue was darker than that of the acid filtrate, suggesting that leaching of the residue could have taken place during the washing of the residue. After some time, there was precipitation of a white substance, which, after SEM analysis, was found to be calcium sulphate. The precipitate was similar to the one observed during diagnostic leaching. The 35% and 45% acid liquor had relatively more calcium sulphate precipitate than the rest.
Table 8 shows the results of the washed sulphuric acid digested residue. The reaction with iron oxide phases forming soluble iron sulphate showed to be directly dependent on the acid concentration. Other base metal leaching was also indirectly dependent on the acid concentration, as shown in Table 8. Ajibola and Jimoh [34] also noted a decrease in lead dissolution with an increasing sulphuric acid concentration. was not affected by the acid digestion of the calcine leach residue; due to the dissolution of the iron, the washed residue content increased.
Figure 8 shows the iron concentration over time at different acid concentrations. The iron concentration in solution, when using acid concentration above 35% v/v, dropped with increase in reaction time. This could be due to the formation and crystallization of rhomboclase, as shown by Equation (5). Yang et al. [3] also reported the formation of rhomboclase at a high sulphuric acid concentration. The wash water of the acid digestion residue of acid concentrations above 35% had a higher iron concentration. This could have been due to the dissolution of rhomboclase, as investigated by Zhu et al. [35].
The chemical analysis of the material showed that the Kwekwe Roasting Plant calcine leach residue is polymetallic. The recovery of base metals to the acid leach liquor can be of interest as it can form a valuable by-product stream. Furthermore, a reduction in acid leachable base metals also reduces the detrimental effects of base metals, such as Fe and Cu, which are the major cyanicides during the cyanidation process. Table 9 shows the calculated recovery of base metals to solution based on the solid head chemical analysis and the washed residue chemical analysis.
Gold Recovery from Acid Pretreated Residue (Cyanidation)
The analysis of the leach solution from bottle roll tests, using an Agilent 240FS AAS machine, showed that the gold recovery during cyanidation stage was directly proportional to the acid concentration used during the acid pretreatment stage, as shown in Table 10.
The recovery of silver, based on solutions, showed no relationship with the acid concentration used in the pretreatment stage. Table 11 shows the results of Ag in solution.
The residues were analyzed using a fire assay, and the results are tabulated in Table 12.
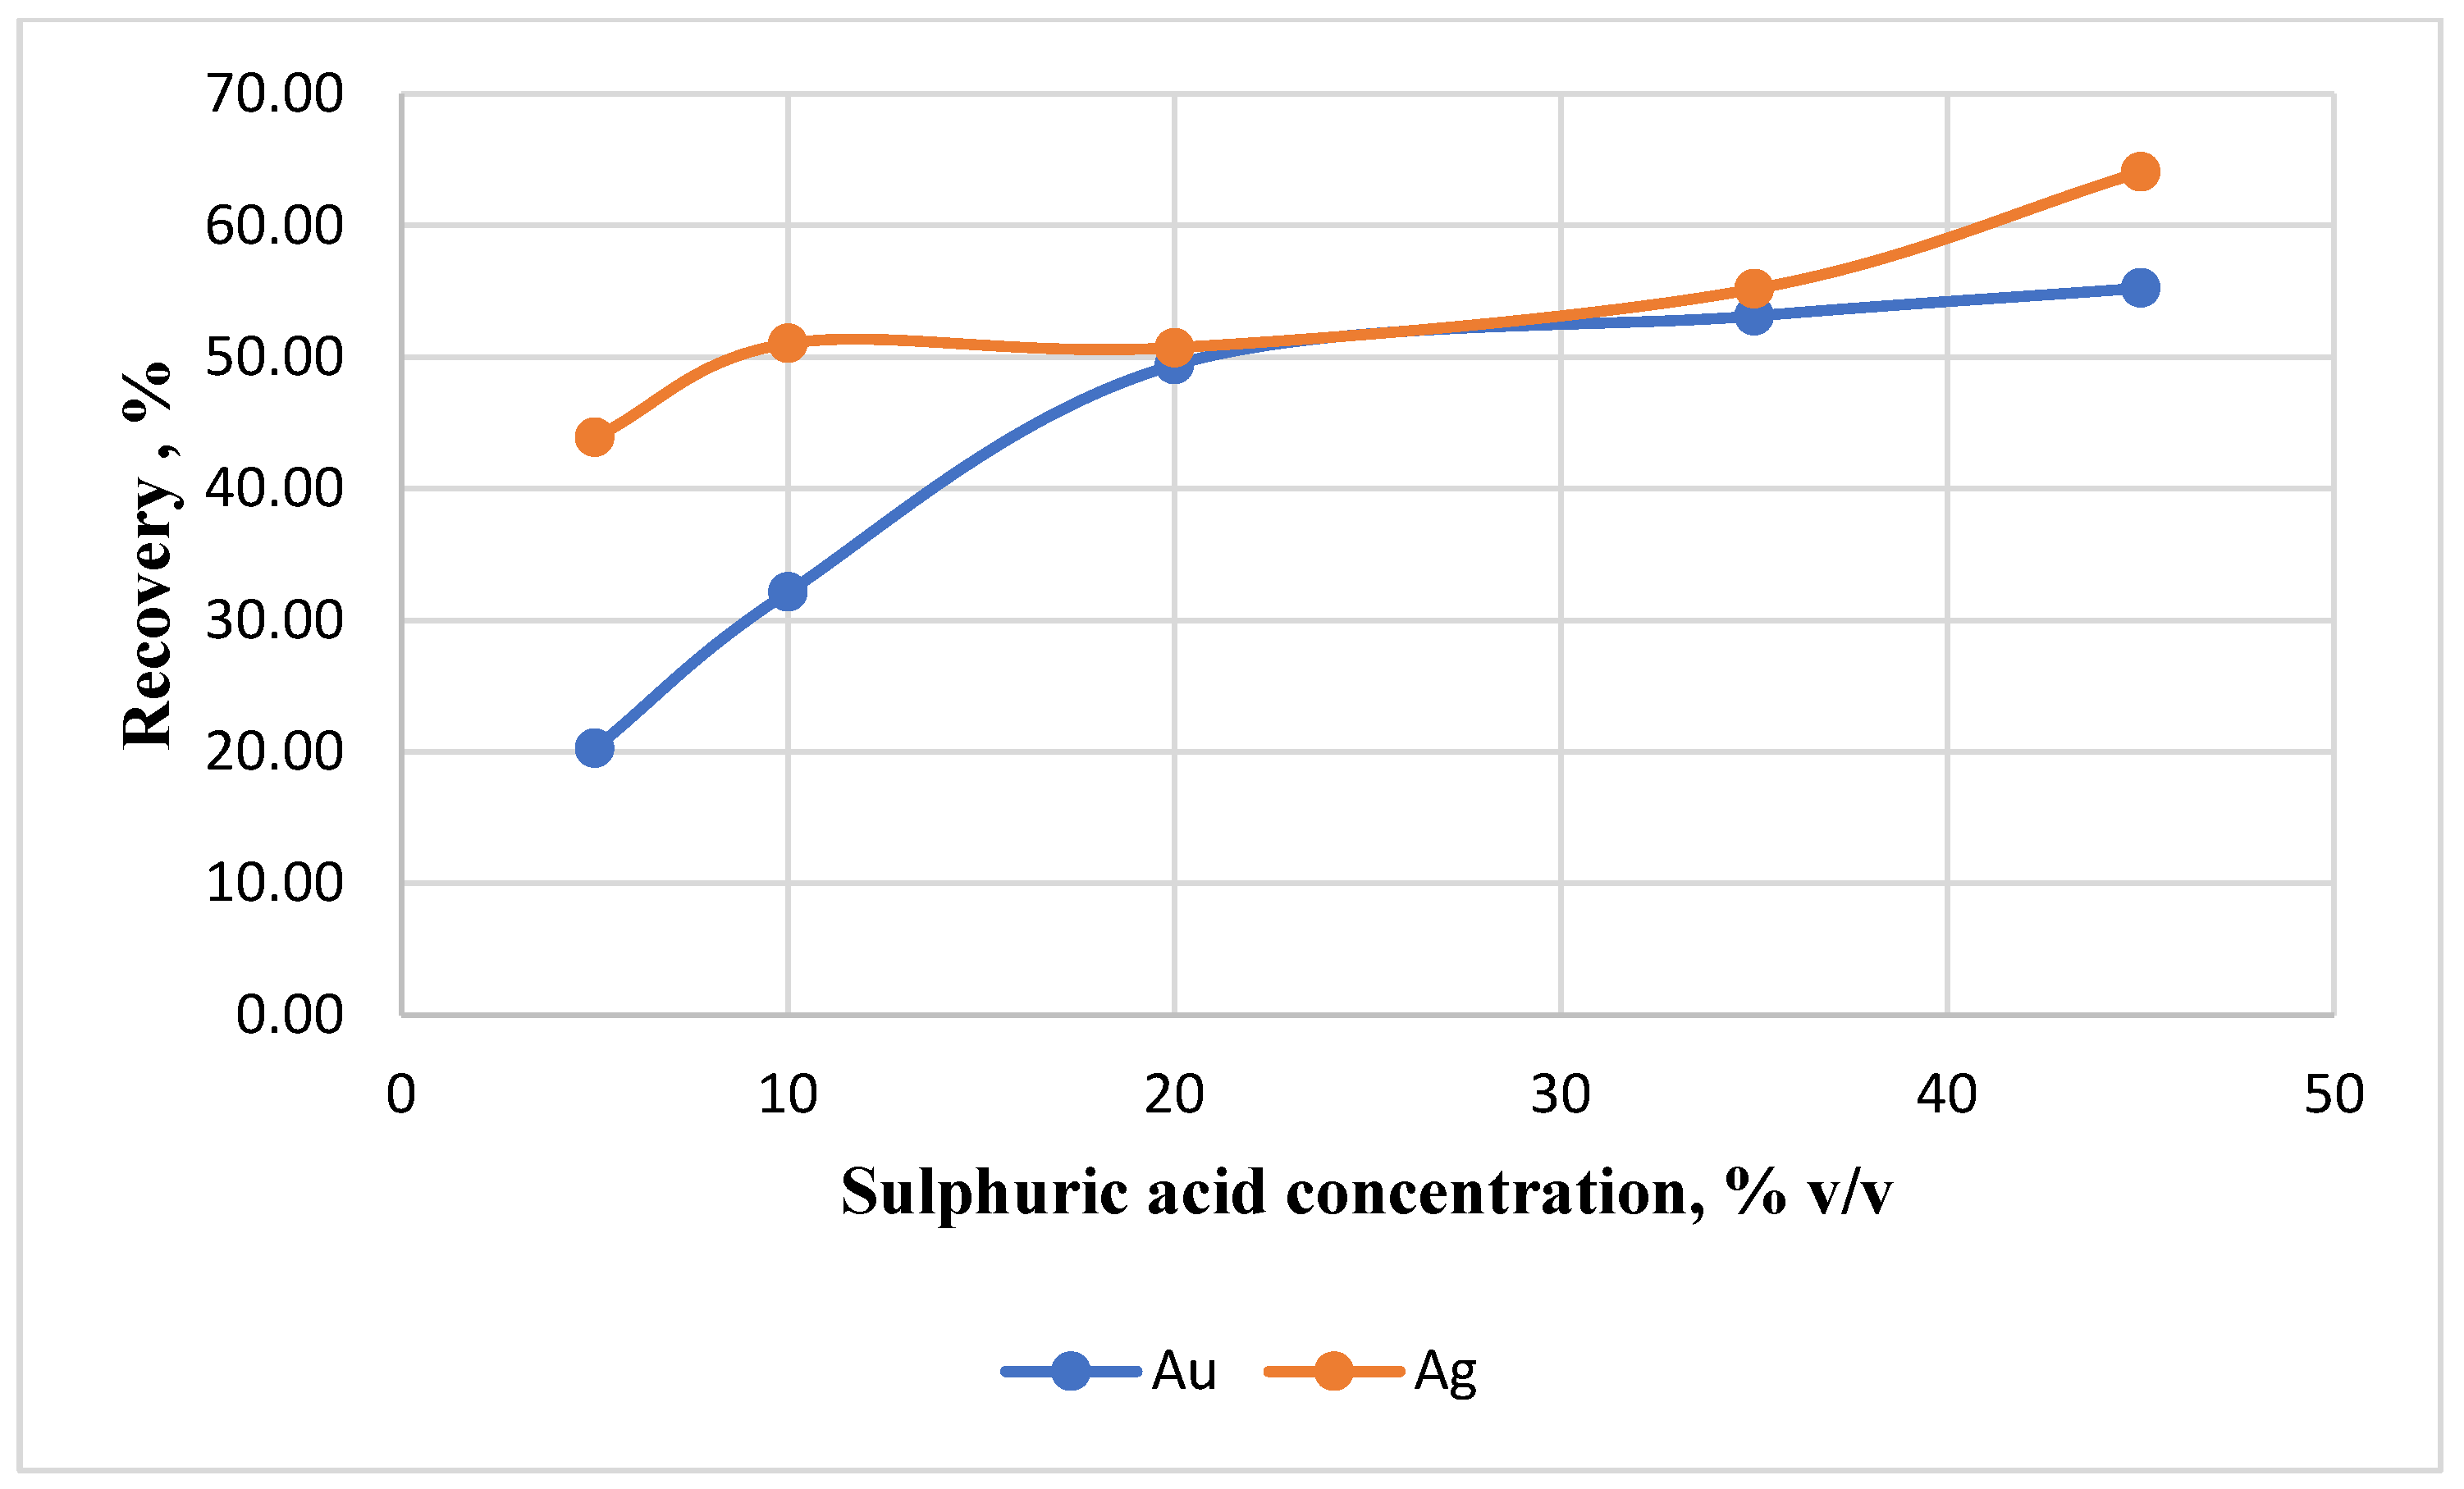
The calculated recovery of Au and Ag from a solid analysis was plotted against the sulphuric acid concentration used during the acid pretreatment stage, as shown in Figure 9. It is evident that a higher acid concentration during pretreatment removes acid leachable phases, thus paving the way for gold and silver recovery during cyanidation.
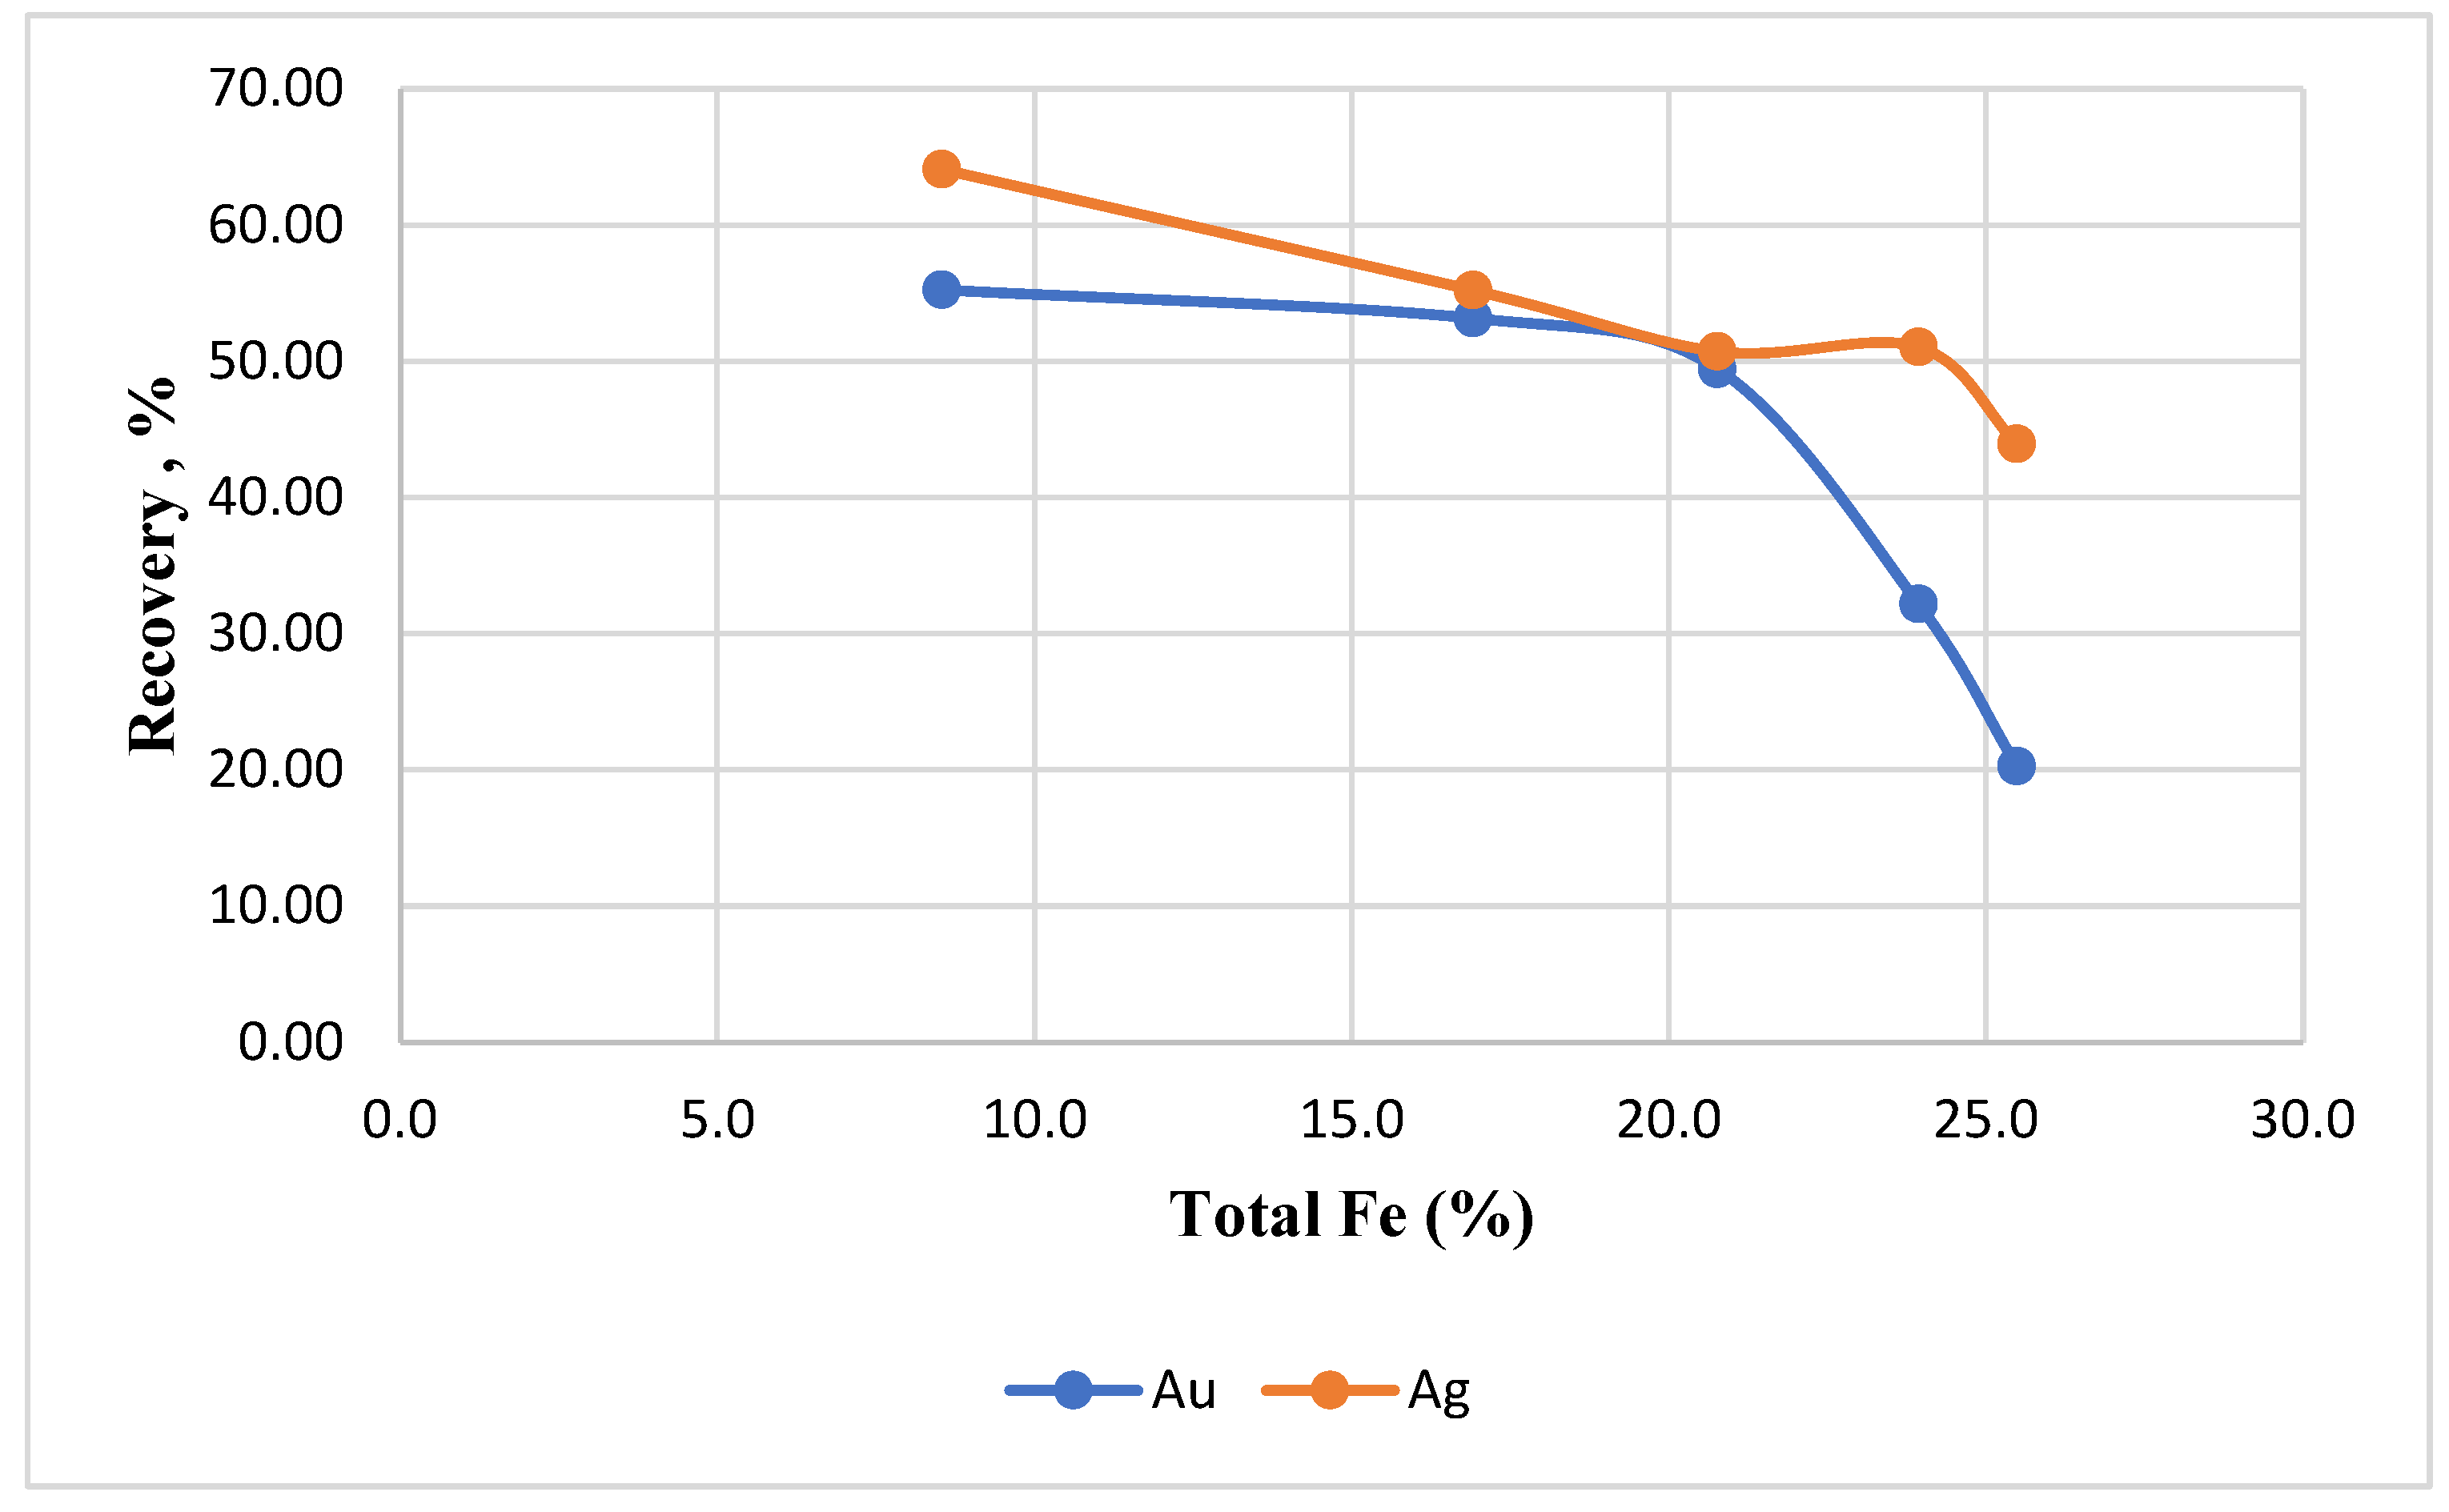
Figure 10 shows the relationship between the iron content in the acid treatment residue and gold recovery. This clearly shows that the iron dissolution leaves the gold liberated and more accessible to the lixiviant, with both Au and Ag recovery being the highest at low residual iron content on the acid leach residue.
4. Conclusions
These investigations were performed on the historical Kwekwe calcine leach residue from Zimbabwe. These dumps leach residue has shown to have a high gold and silver content. The chemical analysis conducted on this sample revealed a gold and silver content of 8.58 g/t and 12 g/t, respectively. Therefore, these calcine dumps are a potential source of gold, especially with the depletion of free milling ores and the continual increase in the cost related to underground mining. However, direct cyanidation showed that only 2.33% of the gold content can be recovered from this material. This is the reason why a mineralogical characterization of the historical Kwekwe calcine leach residue was conducted with a view to understand the calcine leach residue properties, reprocessing possibilities and limitations.
The characterization results showed that the dominant phases in the Kwekwe Roasting Plant calcine tails are SiO₂, Fe2O3, Mg3Si4O10(OH)2, NaAlSi₃O₈ and Fe₃O₄. SEM images showed that the high porosity of the calcine is due to the dominance of hematite. Diagnostic leaching showed that 54.08% of the gold in the calcined tails can be recovered by acid digestion, followed by the direct cyanidation of the material. The results from the diagnostic leaching also showed that only 4.43% of the gold is surface adsorbed.
To determine if there was any presence of submicroscopic gold, ultrafine milling (p80 of 5 μm) followed by cyanidation was performed. The results from these tests showed that only 31.47% of the total gold content was able to be recovered. This automatically means that 68.53% of the gold in the calcine is present as submicroscopic gold.
The ICP results showed that there was still residual As and S in the tails. This confirmed the diagnostic leach test results, which indicated that a significant amount of gold remains occluded by unroasted sulphides. From the mineralogical characterization and diagnostic leaching tests, ultrafine milling followed by acid digestion was then considered as a potential processing route prior to cyanidation.
Ultrafine milling was conducted with the objective of reaching a P80 of 5 μm. The results from these tests showed that the iron concentration in solution was increasing as the leaching time increased. However, it was also shown that the iron concentration in solution, when using acid concentration above 35% v/v, dropped with the increase in reaction time, due to the formation and crystallization of rhomboclase. These results are an indication of the limitations of the process.
The results from the cyanidation tests showed an improvement of more than 50% gold recovery compared to the direct cyanidation tests. This shows the Kwekwe calcine leach residue reprocessing possibilities.
Author Contributions
Conceptualization, S.N. and G.T.B.; funding acquisition, S.N.; investigation, G.T.B.; methodology, G.T.B., J.J.K.M., S.N., A.S. and L.C.; supervision, S.N.; Writing—original draft, G.T.B. and S.N.; editing and re-writing, G.T.B., S.N., J.J.K.M., A.S. and L.C. All authors have read and agreed to the published version of the manuscript.
Funding
This research was funded by th National Research Fund and Department of Science and Innovation of South Africa through the SARChI chair in Hydrometallurgy and Sustainable Development, project grant number 98350.
Acknowledgments
The National Research Fund and Department of Science and Innovation of South Africa through the SARChI chair in Hydrometallurgy and Sustainable Development, project grant number 98350, are gratefully acknowledged for their financial contribution to this research study.
Conflicts of Interest
The authors declare no conflict of interest.
References
- Adams, M.D. Advances in Gold Ore Processing. Elsevier: Amsterdam, The Netherlands, 2005. [Google Scholar]
- Marsden, J.; House, I. The Chemistry of Gold Extraction, 2nd ed.; Society for Mining, Metallurgy, and Exploration: Englewood, CO, USA, 2006. [Google Scholar]
- Yang, Y.B.; Zeng, G.W.; Li, Q.; Liu, X.L.; Jiang, T.; Liu, B. Pretreatment by sulfuric acid-curing of calcine roasting for gold ores with high sulfur and arsenic contents. Chin J. Nonferr. Met. 2014, 24, 2380–2386. [Google Scholar]
- Yannopoulos, J.C. The Extractive Metallurgy of Gold; Springer Science & Business Media: Berlin/Heidelberg, Germany, 2012. [Google Scholar]
- Zhou, J.; Fleming, C.A. Gold in tailings-Mineralogical characterization and metallurgical implications. In Proceedings of the World Gold Conference, Cairns, Australia, 22–24 October 2007; pp. 22–24. [Google Scholar]
- Habashi, F. Textbook of Hydrometallurgy, 2nd ed.Metallurgie Extractive Quebec: Quebec City, QC, Canada, 1999; pp. 208–288. [Google Scholar]
- Dew, D.W.; Lawson, E.N.; Broadhurst, J.L. The BIOX® process for biooxidation of gold-bearing ores or concentrates. In Biomining; Springer: Berlin/Heidelberg, Germany, 1997; pp. 45–80. [Google Scholar]
- Wang, G.; Xie, S.; Liu, X.; Wu, Y.; Liu, Y.; Zeng, T. Bio-oxidation of a high-sulfur and high-arsenic refractory gold concentrate using a two-stage process. Miner. Eng. 2018, 120, 94–101. [Google Scholar] [CrossRef]
- Rusanen, L.; Aromaa, J.; Forsen, O. Pressure oxidation of pyrite-arsenopyrite refractory gold concentrate. Physicochem. Probl. Miner. Process. 2013, 49, 101–109. [Google Scholar]
- Thomas, K.G. Pressure oxidation overview. Dev. Miner. Process. 2005, 15, 346–369. [Google Scholar]
- Fair, K.J.; Schneider, J.C.; Van Weert, G. OPTIONS IN THE NITROX PROCESS®. In Proceedings of the Metallurgical Society of the Canadian Institute of Mining and Metallurgy; Elsevier: Amsterdam, The Netherlands, 1987; pp. 279–291. [Google Scholar]
- Liddell, K.S.; Adams, M.D.; Smith, L.A.; Muller, B. Kell hydrometallurgical extraction of precious and base metals from flotation concentrates-Piloting, engineering, and implementation advances. J. S. Afr. Inst. Min. Metall. 2019, 119, 585–594. [Google Scholar] [CrossRef]
- Ollila, J.T. A mineralogical Investigation of a Refractory Gold Ore, and of a Sulphide Concentrate and Calcined Tailing from that Ore; Council for Mineral Technology: Johannesburg, South Africa, 1983. [Google Scholar]
- Walker, S.R.; Jamieson, H.E.; Lanzirotti, A.; Hall, G.E.M.; Peterson, R.C. The effect of ore roasting on arsenic oxidation state and solid phase speciation in gold mine tailings. Geochem. Explor. Environ. Anal. 2015, 15, 273–291. [Google Scholar] [CrossRef] [Green Version]
- Paktunc, D.; Kingston, D.; Pratt, A.; McMullen, J. Distribution of gold in pyrite and in products of its transformation resulting from roasting of refractory gold ore. Can. Mineral. 2006, 44, 213–227. [Google Scholar] [CrossRef]
- Swash, P.M.; Ellis, P. The Roasting of Arsenical Gold Ores: A Mineralogical Perspective; Mintek: Proceedings of the International Conference on Gold; The South African Institute of Mining and Metallurgy: Johannesburg, South Africa, 1986; Volume 2, pp. 235–257. [Google Scholar]
- Douglas, W.; Semenyna, L. Magnetic recovery of gold bearing iron oxides at Barrick Goldstrike’s roaster. In Proceedings of the World Gold Conference, Brisbane, Australia, 26–29 September 2013; pp. 79–85. [Google Scholar]
- Mutimutema, P. Value Recovery from Mine Calcine Tailings. 2021. Available online: https://scholar.sun.ac.za/handle/10019.1/110143 (accessed on 15 December 2021).
- Chryssoulis, S.L.; Cabri, L.J. Significance of gold mineralogical balances in mineral processing. Trans. Inst. Min. Metall. 1990, 99, C1–C10. [Google Scholar]
- Zhou, J.; Jago, B.; Martin, C. Establishing the process mineralogy of gold ores. Tech. Bull 2004. Available online: https://www.sgs.com/-/media/global/documents/technical-documents/sgs-technical-papers/sgs-min-tp2004-03-process-mineralogy-of-gold-ores.pdf (accessed on 15 December 2021).
- Bruyére, V.I.; Blesa, M.A. Acidic and reductive dissolution of magnetite in aqueous sulfuric acid: Site-binding model and experimental results. J. Electroanal. Chem. Interfacial Electrochem. 1985, 182, 141–156. [Google Scholar] [CrossRef]
- Salmimies, R.; Mannila, M.; Juha, J.; Häkkinen, A. Acidic dissolution of magnetite: Experimental study on the effects of acid concentration and temperature. Clays Clay Miner. 2011, 59, 136–146. [Google Scholar] [CrossRef]
- Rogozhnikov, D.A.; Shoppert, A.A.; Dizer, O.A.; Karimov, K.A.; Rusalev, R.E. Leaching Kinetics of Sulfides from Refractory Gold Concentrates by Nitric Acid. Metals 2019, 9, 465. [Google Scholar] [CrossRef] [Green Version]
- Rogozhnikov, D.; Karimov, K.; Shoppert, A.; Dizer, O.; Naboichenko, S. Kinetics and mechanism of arsenopyrite leaching in nitric acid solutions in the presence of pyrite and Fe(III) ions. Hydrometallurgy 2021, 199, 105525. [Google Scholar] [CrossRef]
- McRae, L.B. The Pyrometallurgical Recovery of Gold from Leach Residues. MINTEK Rep. S. Afr. 1992, 10. Available online: https://www.mintek.co.za/Pyromet/Files/1990McRae.pdf (accessed on 15 December 2021).
- Majima, H.; Awakura, Y.; Mishima, T. The leaching of hematite in acid solutions. Metall. Trans. B 1985, 16, 23–30. [Google Scholar] [CrossRef]
- Stumm, W. The dissolution of oxides and aluminum silicates: Examples of surface-coordination-controlled kinetics. Aquat. Surf. Chem. 1987, 33, 97–219. [Google Scholar]
- Vehmaanperä, P.; Salmimies, R.; Häkkinen, A. Thermodynamic and kinetic studies of dissolution of hematite in mixtures of oxalic and sulfuric acid. Min. Metall. Explor. 2021, 38, 69–80. [Google Scholar] [CrossRef]
- Senanayake, G.; Muir, D.M. Speciation and reduction potentials of metal ions in concentrated chloride and sulfate solutions relevant to processing base metal sulfides. Metall. Trans. B 1998, 19, 37–45. [Google Scholar] [CrossRef]
- Corrans, I.J.; Hayes, J. The recovery of gold from leached calcine residues—Tsvaga paGoogle [WWW Document]. 1989. Available online: https://www.google.com/search?q=the+recovery+of+gold+from+leached+calcine+residues&oq=the+recovery+of+gold+from+leached+calcine+residues&aqs=chrome..69i57j69i59j69i60l3.476993j0j7&sourceid=chrome&ie=UTF-8 (accessed on 19 October 2021).
- Gudyanga, F.P.; Mahlangu, T.; Roman, R.J.; Mungoshi, J.; Mbeve, K. An acidic pressure oxidation pre-treatment of refractory gold concentrates from the KweKwe roasting plant. Zimbabwe. Miner. Eng. 1999, 12, 863–875. [Google Scholar] [CrossRef]
- Celep, O.; Alp, İ.; Deveci, H.; Vicil, M. Characterization of refractory behaviour of complex gold/silver ore by diagnostic leaching. Trans. Nonferr. Met. Soc. China 2009, 19, 707–713. [Google Scholar] [CrossRef]
- Kadenhe, R.M.; Makande, E.S. Review of the roasting plant operations and services available to small mines at Kwekwe, Zimbabwe. Afr. Min. 1987, 191–204. [Google Scholar]
- Ajibola, O.; Jimoh, B. Agitation leaching recovery of lead and zinc from complex sulphide ore deposit using HF, HCL and H2SO4. Adv. Appl. Sci. Res. 2014, 5, 68–72. [Google Scholar]
- Zhu, Y.; Kong, Q.; Wei, W.; Zhu, Z.; Tang, S.; Zhang, L.; Yang, H. Dissolution and solubility of rhomboclase and arsenic-substituted rhomboclase phases at pH 2–10 and 25–45 °C. Appl. Geochem. 2021, 132, 105075. [Google Scholar] [CrossRef]
Figure 1.
The procedure that was followed in this investigation.

Figure 2.
Cumulative percent passing graph.

Figure 3.
Particle map depicting observed occurrence of gold grains in the sample.

Figure 4.
Back scattered electron images showing the overall texture of the sample (A) as well as the observed altered iron-oxide grains (B). Brightest grains are of scheelite (CaWO4).
Figure 4.
Back scattered electron images showing the overall texture of the sample (A) as well as the observed altered iron-oxide grains (B). Brightest grains are of scheelite (CaWO4).

Figure 5.
Recovery of gold after each acid pretreatment stage.

Figure 6.
Cumulative recovery graph.

Figure 7.
(a) Picture of the precipitates in H2SO4. (b) The SEM backscattered image of the precipitate and (c) the precipitate EDS.
Figure 7.
(a) Picture of the precipitates in H2SO4. (b) The SEM backscattered image of the precipitate and (c) the precipitate EDS.

Figure 8.
Iron concentration in solution at different intervals and different acid concentrations.

Figure 9.
Gold recovery as a function of pretreatment acid concentration.

Figure 10.
Relationship between remaining acid digested residue Fe and gold recovery.


Table 1.
Fire assay of calcine leach residue dumps.
| Sample ID | Sample Area Description | Ag (g/t) | Au (g/t) |
|---|---|---|---|
| AT | A Top Section | 8.31 | |
| AM | A Middle Section | 26 | 7.96 |
| AB | A Bottom Section | 9.37 | |
| BT | B Top Section | 9.85 | |
| BM | B Middle Section | 9.40 | |
| BB | Remainder of Reclaimed Dump Bottom Section | 9.72 | |
| CT | C Top Section | 15.32 | |
| CM | C Middle Section | 7.55 | |
| CB | C Bottom Section | 9.09 | |
| D | D Dump | 8.65 |
Table 2.
Diagnostic leaching procedure.
| Treatment Stage | Reagent | Leach Parameter | Concentration | Minerals Likely to Be Attacked |
|---|---|---|---|---|
| Cyanide leaching | NaCN | 24 h, pH10.5 | 6 g/kg | Gold |
| Acid leaching | HCl | L/S = 2:1, 8 h, 60 °C | 12% (v/v) | Calcite, dolomite, galena, pyrhotite, hematite |
| Cyanide leaching | NaCN | 24 h, pH10.5 | 6 g/kg | Gold |
| Acid leaching | H2SO4 | L/S = 2:1, 5 h; 80 °C | 48% (v/v) | Cu-Zn sulphides, labile pyrite |
| Cyanide leaching | NaCN | 24 h, pH10.5 | 6 g/kg | Gold |
| Acid leaching | HNO3 | L/S = 2:1, 6 h, 60 °C | 33% (v/v) | Pyrite, marcasite arsenopyrite |
| Cyanide leaching | NaCN | 24 h, pH10.5 | 6 g/kg | Gold |
| Elution (Hot caustic leach) | NaOH + NaCN + Carbon | L/S = 2:1, 6 h | 15 g/kg | Gold adsorbed on carbon |
Table 3.
Particle size distribution of the calcine leach residue.
| Sieve Size | Mass Retained | % Retained | % Passing |
|---|---|---|---|
| 212 | 0.00 | 0.00 | 100.00 |
| 150 | 7.00 | 1.40 | 98.60 |
| 106 | 14.00 | 2.80 | 95.80 |
| 75 | 29.00 | 5.80 | 90.00 |
| 53 | 22.00 | 4.40 | 85.60 |
| 38 | 52.00 | 10.40 | 75.20 |
| Pan | 376.00 | 75.20 | 0.00 |
| Total | 500.00 |
Table 4.
XRD analysis results.
| Mineral | Formulae | Percentage |
|---|---|---|
| Quartz low | SiO₂ | 36.1 |
| Hematite | Fe2O3 | 36.9 |
| Bassanite | 2CaSO4·H2O | 2.7 |
| Magnetite | Fe₃O₄ | 6.4 |
| Albite | NaAlSi₃O₈ | 6.9 |
| Talc 1A | Mg3Si4O10(OH)2 | 8.9 |
| Muscovite 2M1 | (KF)₂(Al₂O₃)₃(SiO₂)₆ | 1.8 |
| Gypsum | CaSO₄·2H₂O | 0.1 |
| Actinolite | Ca₂Si₈O₂₂(OH)₂ | 0.2 |
Table 5.
Bulk chemical data.
| Au (g/t) | Ag (g/t) | Al (%) | As (%) | Bi (%) | Ca (%) | Co (%) | Cr (%) | Cu (%) |
| 8.58 | 12.34 | 3.59 | 0.995 | <0.05 | 2.43 | <0.05 | 0.05 | 0.13 |
| Fe (%) | Mg (%) | Mn (%) | Ni (%) | Pb (%) | S (%) | Sb (%) | Sn (%) | Si (%) |
| 26.05 | 2.31 | 0.08 | 0.11 | 0.10 | 0.89 | 0.22 | <0.05 | 16.60 |
| Ti (%) | V (%) | W (%) | Zn (%) | |||||
| 0.40 | <0.05 | 0.06 | 0.17 |
Table 6.
Comparison of gold recovery after each pretreatment stage.
| Leach Test | Au (g/t) | Au Recovery (%) | Ag (g/t) | Ag Recovery (%) | Cu (g/t) | Cu Recovery (%) | Pb (g/t) | Pb Recovery (%) |
|---|---|---|---|---|---|---|---|---|
| NaCN leach | 0.10 | 2.33 | 0.35 | 5.65 | 29.74 | 2.29 | 1.84 | 0.18 |
| HCl digestion | 336.16 | 25.86 | 399.00 | 39.90 | ||||
| NaCN leach | 0.18 | 4.20 | 0.00 | 0.00 | 5.96 | 0.46 | 3.39 | 0.34 |
| H2SO4 digestion | 345.18 | 26.55 | 2.10 | 0.21 | ||||
| NaCN leach | 1.14 | 26.57 | 0.13 | 2.12 | 15.59 | 1.20 | 3.05 | 0.31 |
| HNO3 digestion | 3.39 | 0.26 | 36.90 | 3.69 | ||||
| NaCN leach | 0.90 | 20.98 | 0.21 | 3.30 | 13.28 | 1.02 | 4.40 | 0.44 |
| Hot caustic leach | 0.19 | 4.43 | 0.02 | 0.40 | 6.71 | 0.52 | 3.32 | 0.33 |
| Totals | 2.51 | 58.51 | 0.71 | 11.47 | 756.01 | 58.16 | 454.00 | 45.40 |
Table 7.
Residue fire assay results.
| Element | Head Grade Assay (g/t Au) | Intensive Leach Residue (g/t Au) | Submicroscopic Gold (%) |
|---|---|---|---|
| Au | 8.58 | 5.88 | 68.53 |
Table 8.
Chemical analysis of the washed acid digestion residue.
| Acid Wash | SiO2 (%) | Fe (tot) | Co (%) | Cu (%) | Ni (%) | Pb (%) | V (%) | Zn (%) | As (Unit) |
|---|---|---|---|---|---|---|---|---|---|
| 5% H2SO4 | 36.1 | 25.5 | 0.022 | 0.056 | 0.089 | 0.091 | 0.006 | 0.030 | 2117 |
| 10% H2SO4 | 36.8 | 23.9 | 0.020 | 0.043 | 0.082 | 0.080 | 0.006 | 0.022 | 1407 |
| 20% H2SO4 | 39.0 | 20.8 | 0.013 | 0.022 | 0.061 | 0.086 | 0.006 | 0.010 | 1142 |
| 35% H2SO4 | 49.7 | 16.9 | 0.009 | 0.016 | 0.057 | 0.102 | 0.007 | 0.017 | 919 |
| 45% H2SO4 | 54.1 | 8.54 | 0.006 | 0.011 | 0.031 | 0.118 | 0.007 | 0.016 | 273 |
Table 9.
Base metal recovery to solution.
| Acid Wash | Fe (tot) | Co (%) | Cu (%) | Ni (%) | Pb (%) | Zn (%) | As (%) |
|---|---|---|---|---|---|---|---|
| 5% H2SO4 | 2.15 | 12.00 | 56.92 | 19.09 | 9.00 | 82.35 | 78.73 |
| 10% H2SO4 | 8.10 | 20.00 | 66.92 | 25.45 | 20.00 | 87.06 | 85.86 |
| 20% H2SO4 | 20.27 | 48.00 | 83.08 | 44.55 | 14.00 | 94.12 | 88.53 |
| 35% H2SO4 | 35.05 | 64.00 | 87.69 | 48.18 | 0.00 | 90.00 | 90.76 |
| 45% H2SO4 | 67.20 | 76.00 | 91.54 | 71.82 | 0.00 | 90.59 | 87.21 |
Table 10.
Cyanidation stage: results of Au in solution.
| Description | Residue ex-5% H2SO4 | Residue ex-10% H2SO4 | Residue ex-20% H2SO4 | Residue ex-35% H2SO4 | Residue ex-45% H2SO4 |
|---|---|---|---|---|---|
| Au AAS reading (mg/L) | 0.51 | 0.7 | 1.39 | 2.22 | 2.16 |
| Calculated leached Au (g/t) | 1.275 | 1.75 | 3.475 | 5.55 | 5.4 |
| Au calculated recovery (%) | 14.86 | 20.39 | 40.50 | 64.68 | 62.94 |
Table 11.
Cyanidation stage: results of Ag in solution.
| Description | Residue ex-5% H2SO4 | Residue ex-10% H2SO4 | Residue ex-20% H2SO4 | Residue ex-35% H2SO4 | Residue ex-45% H2SO4 |
|---|---|---|---|---|---|
| Ag AAS reading (mg/L) | 1.023 | 0.769 | 1.146 | 0.952 | 0.759 |
| Calculated leached Ag (g/t) | 2.5575 | 1.9225 | 2.865 | 2.38 | 1.8975 |
| Ag calculated recovery (%) | 20.46 | 15.38 | 22.92 | 19.04 | 15.18 |
Table 12.
Cyanidation stage: Au and Ag in residue results.
| Sample Identity | Au (mg/kg) | Ag (mg/kg) |
|---|---|---|
| Ex-5% H2SO4 residue | 6.84 | 7.01 |
| Ex-10% H2SO4 residue | 5.82 | 6.12 |
| Ex-20% H2SO4 residue | 4.34 | 6.16 |
| Ex-35% H2SO4 residue | 4.02 | 5.60 |
| Ex-45% H2SO4 residue | 3.84 | 4.49 |
Publisher’s Note: MDPI stays neutral with regard to jurisdictional claims in published maps and institutional affiliations. |
© 2021 by the authors. Licensee MDPI, Basel, Switzerland. This article is an open access article distributed under the terms and conditions of the Creative Commons Attribution (CC BY) license (https://creativecommons.org/licenses/by/4.0/).
Share and Cite
MDPI and ACS Style
Bare, G.T.; Mbayo, J.J.K.; Ndlovu, S.; Shemi, A.; Chipise, L. Mineralogical Characterization and Acid Pretreatment of a Gold Calcine Leach Residue. Minerals 2022, 12, 10. https://0-doi-org.brum.beds.ac.uk/10.3390/min12010010
AMA Style
Bare GT, Mbayo JJK, Ndlovu S, Shemi A, Chipise L. Mineralogical Characterization and Acid Pretreatment of a Gold Calcine Leach Residue. Minerals. 2022; 12(1):10. https://0-doi-org.brum.beds.ac.uk/10.3390/min12010010
Chicago/Turabian StyleBare, Godfrey Tinashe, Jean Jacques Kalombo Mbayo, Sehliselo Ndlovu, Alan Shemi, and Liberty Chipise. 2022. "Mineralogical Characterization and Acid Pretreatment of a Gold Calcine Leach Residue" Minerals 12, no. 1: 10. https://0-doi-org.brum.beds.ac.uk/10.3390/min12010010
Note that from the first issue of 2016, this journal uses article numbers instead of page numbers. See further details here.