Article

Characteristics of Canister Core Desorption Gas from Unconventional Reservoirs and Applications to Improve Assessment of Hydrocarbons-in-Place

1
AGAT Laboratories Ltd., Calgary, AB T2E 6V6, Canada
2
Geological Survey of Canada, Calgary, AB T2L 2A7, Canada
*
Author to whom correspondence should be addressed.
Submission received: 17 August 2022 / Revised: 14 September 2022 / Accepted: 21 September 2022 / Published: 28 September 2022
(This article belongs to the Special Issue Shale and Tight Reservoir Characterization and Resource Assessment)

Abstract

:
Canister core desorption has been successfully applied to coal-bed methane evaluation and exploitation as the technique eliminates the need for time-consuming down-hole fluid retrieval through flow testing. The technique has also been used for the evaluation and exploration of early-stage tight and shale gas reservoirs in recent years, although its success and applicability are poorly understood. In this study, we analyzed a comprehensive canister desorption data set on 230 core samples from nine exploration wells drilled into the Montney Formation in northeastern British Columbia part of the Western Canada Sedimentary Basin (WCSB). The purpose of the study was to illustrate the desorption characteristics of tight rocks and the relationship to reservoir properties and operational parameters. Based on the measured core properties (e.g., porosity, fluid saturation, permeability, total organic carbon (TOC) content, and adsorption isotherms) of canister samples and adjacent core samples, non-isothermal gas transport in cores was modeled to quantify the lost gas during core recovery and lost gas time at the surface. Gas volumes were measured and subsampled by canister desorption tests. The results show that the gas contents measured by on-site canister desorption only accounts for a minor (but significant) portion (about 2 to 25%) of the total gas-in-place in the Montney Formation cores, with the lower percentages being associated with samples of better reservoir qualities (e.g., higher porosity). Over 60–90% (mainly free gas) of the total gas-in-place can be lost during core recovery, and up to 10% can be lost at surface, prior to canister desorption. The measured canister desorption gas is mainly from adsorbed gas, and hence shows strong positive correlation to TOC content. The study shows that the current canister desorption test method severely underestimates in-situ gas content because it fails to correctly estimate the total lost gas content, limiting the successful application of the desorption technique. Nevertheless, the bulk properties and molecular compositions of the desorption gases are strongly correlated to those of the gases produced in the same area, exhibiting distinctive gas composition profiles throughout core desorption for different reservoir types or thermal maturity, and thus can provide invaluable information for the initial evaluation of unconventional plays. A workflow of EOS-based PVT property and compositional modeling is proposed to integrate the core desorption gas test results with core analysis data and mud gas and/or produced gas data for improved characterization of in situ reservoir fluids, and hence, better assessments of hydrocarbons-in-place and evaluations of tight and shale reservoirs.

1. Introduction

The accurate characterization and assessment of hydrocarbon resources in place are crucial for the exploration and exploitation of gas and liquid-rich tight and shale reservoirs. As illustrated in Figure 1, for unconventional gas or liquid-rich plays, the total hydrocarbons-in-place (THCIP) include free gas, adsorbed gas, solution gas in water, and hydrocarbon liquids. These components must be determined separately and then integrated together to determine the total hydrocarbons-in-place. Adsorbed gas is mainly determined by adsorption isotherm experiments on representative core samples in the laboratory. Free gas is determined based on effective porosity and gas pressure-volume-temperature (PVT) properties under reservoir conditions. Solution gas in water is generally minor but can be significant if pressure and water saturation are high, which can be estimated based on a commonly used empirical correlation [1] or equation of state [2]. For retrograde condensate gas reservoirs, the volume of residual condensate liquids in core samples and their composition also needs to be determined for a complete hydrocarbon-in-place estimation. Adsorption isotherms, porosity, and water and residual liquid/oil saturations can be relatively accurately measured on fresh representative core samples using different core analysis techniques. Residual liquid hydrocarbon compositions can be directly analyzed using powdered core samples with thermal desorption–gas chromatography (TD–GC). Canister core desorption tests of retrieved cores can yield direct measurements of gas contents, and the desorption gas composition can be analyzed using gas chromatography to establish gas fractionation through time. After quantification of each component, in situ hydrocarbon fluid composition and total hydrocarbons-in-place can be determined by using equation-of-state (EOS) based PVT modeling or empirical correlations, as illustrated in Figure 1.
As shown in Figure 1, canister desorption plays an important role in determining gas contents and composition during early-stage exploration or evaluation programs when no well production or test data are available. Canister core desorption has been successfully applied to determine the gas-in-place for coal-seam gas (or coal-bed methane) reservoirs because gas in coal-seam or coal-mine reservoirs occurs predominantly in an adsorbed state, and coal seams have extremely low matrix permeability [3,4,5]. The canister core desorption test has also been adapted for evaluating the gas contents of organic-rich shale and tight gas reservoirs [6]. Several studies have applied canister core desorption data to estimate the volume of desorbed gas during production in the Montney Formation, based on petrophysical well log data and limited canister desorption data [7,8]. Kang et al. [9] performed a numerical simulation using canister desorption results from two Longmaxi gas shale samples to estimate the lost gas volume and total gas contents of gas shale. Han and Zhang [10] described an improved method for shale canister desorption measurements. Dang et al. [11] compared different methods for “lost” gas estimation based on a shale gas play in China. Nie et al. [12] demonstrated that time-series desorption data of freshly drilled cores can provide valuable information regarding the kinetics of gas release from shale cores.
Overall, the characteristics of core desorption gas from unconventional tight and shale rocks other than coals are still under-studied and poorly understood; thus, its application to reliable evaluation of tight and shale reservoirs deserves a more in-depth investigation. The main concern for the applicability of canister core desorption for tight and shale gas play is that the volume of gas lost during core retrieval and at surface before the commencement of canister desorption can be significant due to the higher permeability and relatively lower adsorbed gas in shale and tight rocks. Thus, the measured gas contents from canister core desorption experiments can be significantly lower than the total hydrocarbons-in-place [13]. Different methods have been proposed for better estimation of the “lost” gas prior to starting of the canister desorption test [11,14]. The relative amounts of lost gas and captured desorption gas can be affected by many factors, including operational factors (such as core tripping speed and time lost at surface), core properties (especially permeability, porosity, saturations, TOC, and mineralogy), reservoir pressure and temperature, as well as initial gas-in-place. To our knowledge, no previous studies have systematically studied the effects of these factors on canister desorption gas contents or how successful canister desorption can be applied for evaluating tight and shale gas reservoirs. Here, we present a relatively large data set of 230 core canister desorption tests from nine wells drilled into the Montney Formation of northeastern British Columbia, in the Western Canada Sedimentary Basin (WCSB), to comprehensively understand the characteristics of canister core desorption gas of unconventional reservoirs.
In this study, quantitative assessment of the hydrocarbon gases released from cores during core retrieval to the surface, “lost gas time” at surface, and canister core desorption was conducted through simulation of non-isothermal gas transport in cores subjected to these different processes (i.e., variable pressure and temperature boundary conditions). The associational and causal relations among various rock properties and operational parameters were statistically analyzed based on the Pearson correlation coefficient matrix and the hierarchical clustering of variables. The results afford us a comprehensive understanding of the characteristics of core canister desorption and shed light on the factors controlling the volume of free gas and adsorbed gas in the various stratigraphic zones of the Montney Formation, as well as gas transport characteristics in the microporous Montney Formation rocks.
For liquid-rich or retrograde condensate gas reservoirs and volatile oil reservoirs, accurate characterization of in situ hydrocarbon fluid composition and the associated PVT properties is paramount for reservoir evaluation, exploitation, and operational optimization. However, representative fluid sampling from liquid-rich low-permeability reservoirs is very challenging due to the severe fractionation of hydrocarbon fluids. Fractionation is a result of the well bottom-hole pressure becoming lower than the saturation pressure of the in situ fluid during well tests and production [15,16]. Consequently, significant amounts of heavier hydrocarbon components can be condensed into the liquids and remain in the reservoir or wellbore instead of being produced or sampled. On the other hand, well-site canister desorption of retrieved cores captures the heavier hydrocarbon components and residual hydrocarbon liquids remaining in the cores, and therefore, is a better representative of the complete heavy components of the in situ reservoir hydrocarbon fluids; however, the corresponding lighter components are lost into mud gas and the atmosphere during core recovery and extraction from the core barrel. Hypothetically, re-combination of the desorption gas, residual liquid or oil, and mud gas or produced hydrocarbon fluids would yield a more representative sample of in situ reservoir fluid for liquid-rich tight reservoirs that often experience severe liquid drop-out leading to biased surface sampling [17]. Based on this hypothesis, a novel approach is proposed to integrate the core analysis data, adsorption isotherm, canister gas content and compositional data along with properties of mug gas and/or produced gas to obtain a more accurate estimate of in situ fluid compositions, thus producing a better assessment of hydrocarbons-in-place for tight and shale reservoirs. The proposed approach is especially applicable to liquid-rich and retrograde condensate reservoirs during early-stage exploitations with limited well test and production data available.

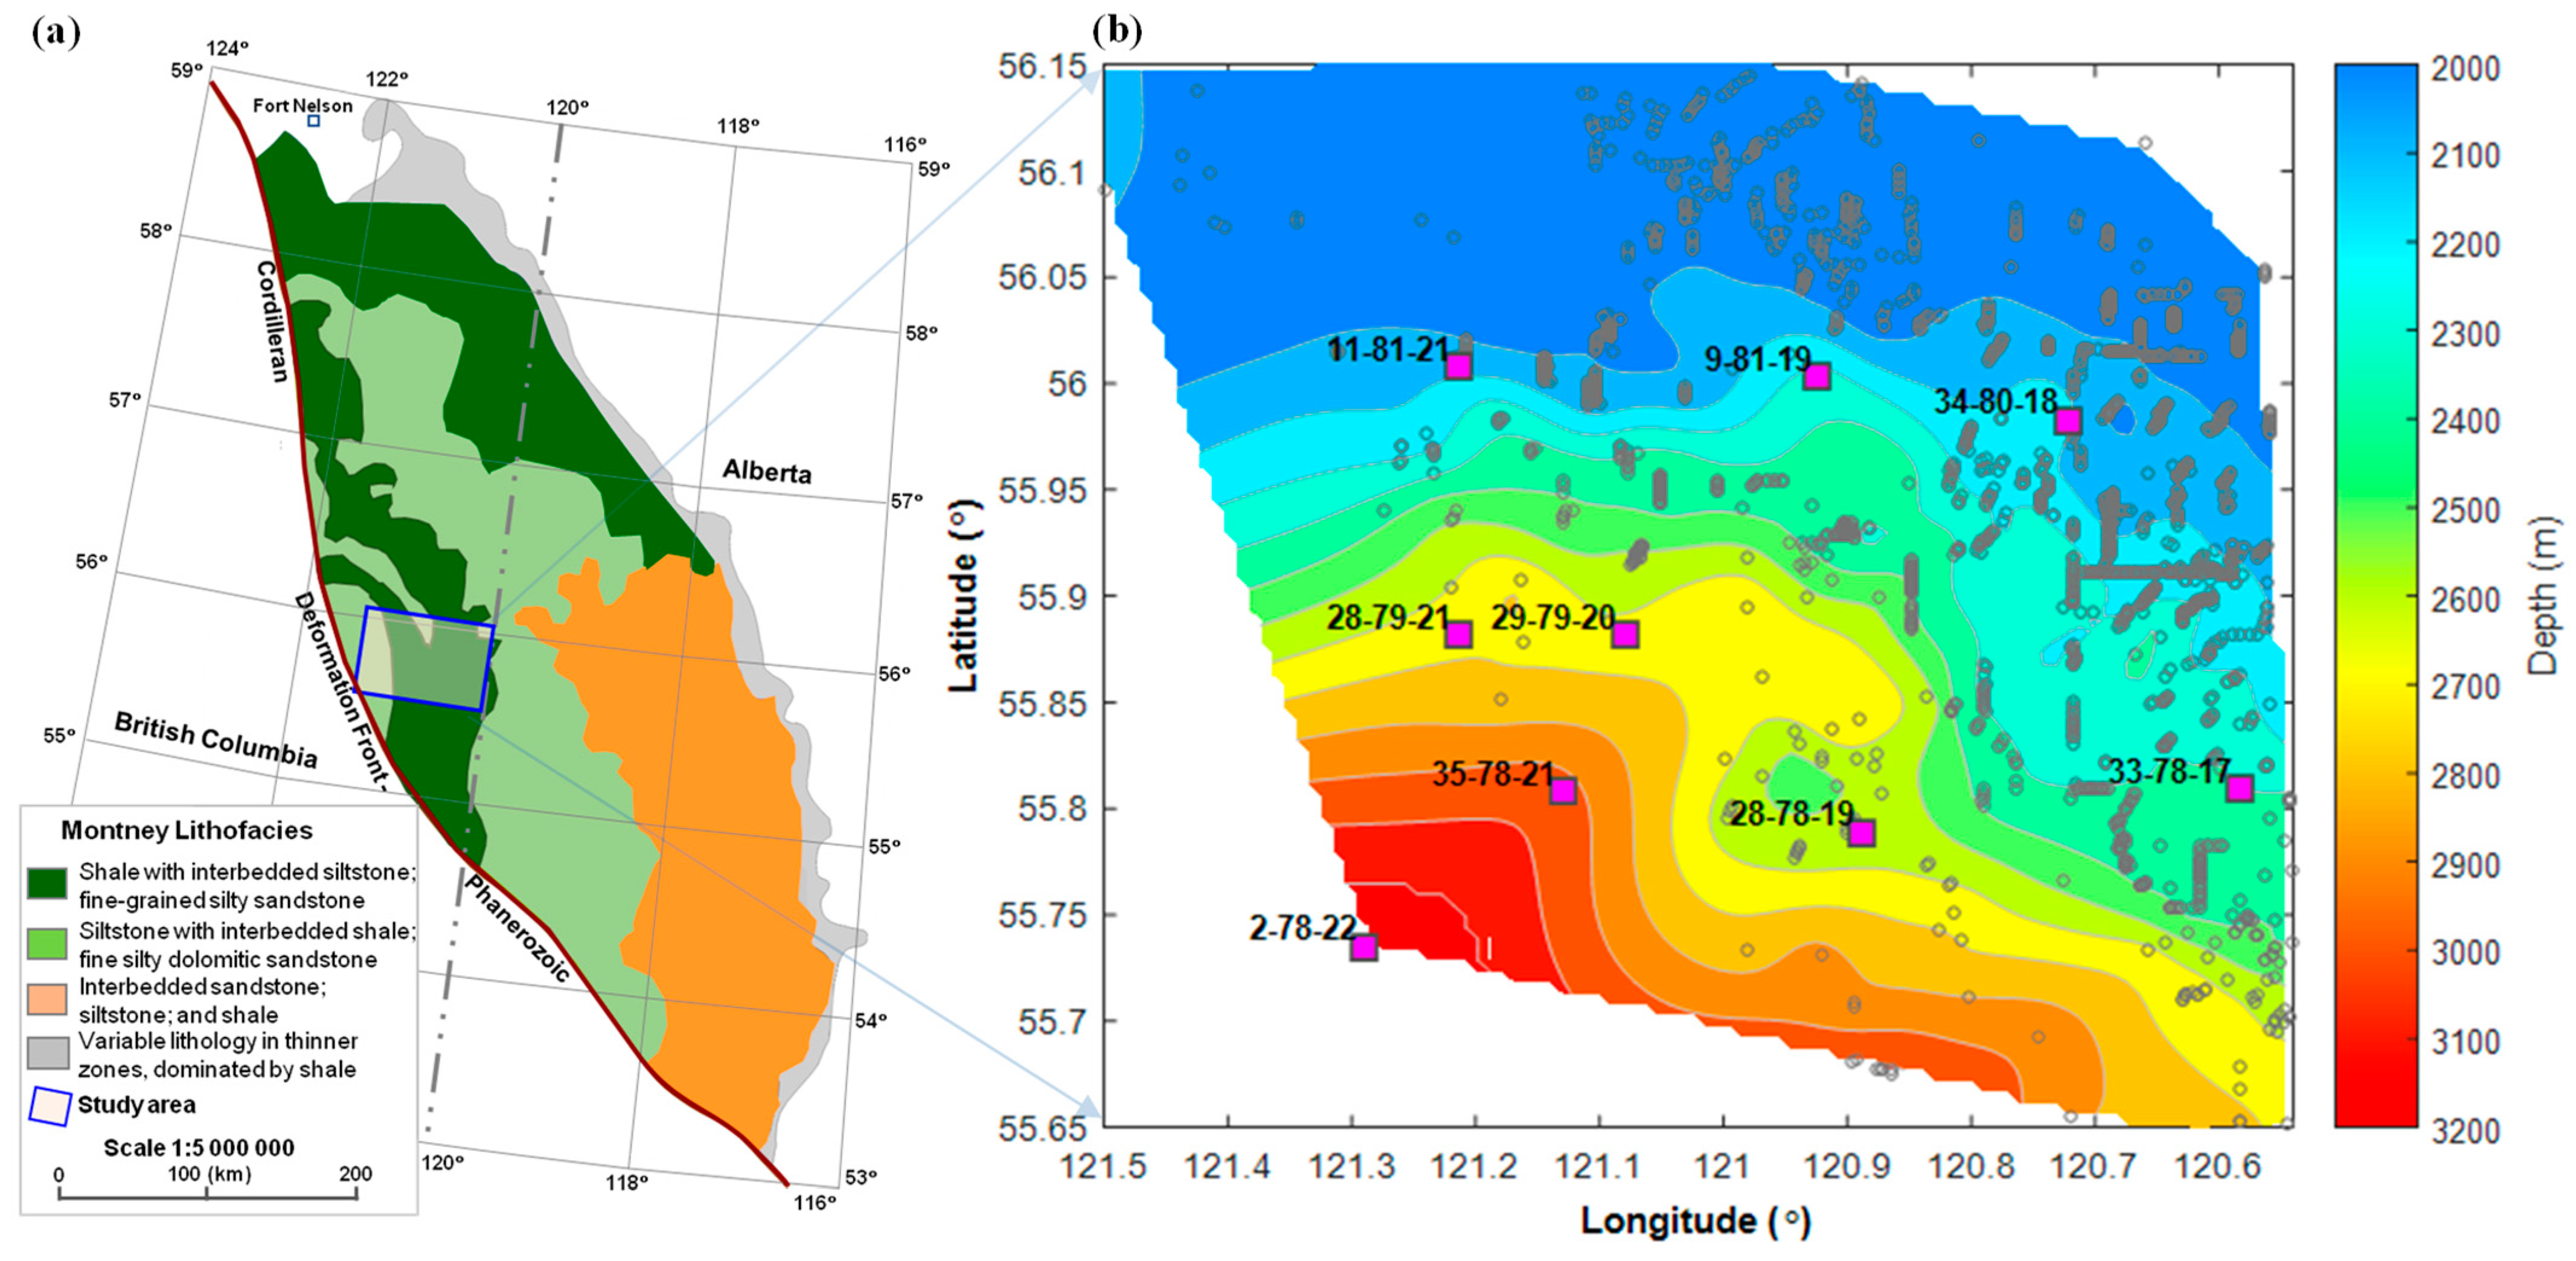
2. Geological Background, Samples, and Methods

The Lower Triassic Montney Formation in the WCSB consists of thick and geographically extensive siltstones spreading from northeastern British Columbia to west-central Alberta ([18], Figure 2a). Tremendous hydrocarbons-in-place were estimated for the Montney Formation, with estimated marketable hydrocarbons including 12.7 trillion m3 natural gas, 2.3 trillion m3 NGL, and 179 million m3 oil [19]. Horizontal wells have been drilled and stimulated with multi-stage hydraulic fracturing treatments to optimize hydrocarbon recovery.
Canister desorption tests on 230 Montney Formation core samples were used in this study. The cores were taken from nine Montney Formation exploration wells in northeast British Columbia during early-stage exploration and evaluation. All cores were recovered using conventional coring techniques, without being sealed or pressured in core barrels during their retrieval to the surface (Figure 2a). The majority of the cores were recovered from the upper Montney Formation zone with a mixed lithology of shale interbedded with siltstone and fine-grained silty sandstone. The depth interval of the evaluated cores ranges from approximately 2000 to 3200 m in burial depth (Figure 2b).
For a typical on-site canister core desorption test, when a core is retrieved to the surface, a representative core segment (e.g., 30 cm long) is promptly prepared and put into a pre-purged canister. The canister is then sealed with a cap and maintained at a constant temperature (e.g., 50 °C) in a heated water bath or oven for the desorption test. Desorbed gas in the canister is released through a valve on the cap for quantitative collection in short intervals of minutes to hours in the first one or two days. Following initial rapid data collection for the first two days, subsequent measurements are made once a day thereafter until very little to no gas is desorbed [6]. A typical desorption profile in shale and tight rock formations proceeds for 30 days or more. After the canister desorption test, a subsample is taken from the core and crushed to liberate and rapidly collect the residual gas. The gas released from the crushed sample is termed “crushed gas”, and the gas accumulated from canister desorption test is called “measured gas”. The gas that was lost out of the cores and not captured during or after core retrieval to surface and prior to canister desorption is defined as “lost gas”. Lost gas quantities are commonly estimated based on early-time desorption data using empirical or theoretical techniques, such as the USBM direct method [20], Smith–Williams method [21], Amoco curve fit method [22], and modified methods [23]. In our study, we defined lost gas as the y-intercept of a linear regression fit to the first several hours on a cross plot of cumulative desorption gas content versus the square root of time. For shale and tight rock formations, time zero for lost gas determinations starts at the point which the core reaches the surface. The total desorption gas content of a core sample is taken as the sum of lost gas, measured gas, and crushed gas, and is reported at standard temperature (15.56 °C) and pressure (101.325 kPa), in cubic centimeters (cc) per unit sample mass (gram) at as-received core condition.
Desorption gas collected at different stages of the canister desorption test was analyzed for composition using gas chromatography–flame ionization detection (GC–FID) for selected core samples. The bulk gas composition of a core sample is calculated based on the volume-weighted average of all gas samples collected over the desorption period. The time profiles of cumulative desorption gas volume were used to estimate the early-time and late-time permeability of the core samples using the early-time and late-time methods proposed by Cui et al. [24].
Programmed pyrolysis (e.g., Rock-Eval) analysis was conducted on the core subsamples after canister desorption to determine the bulk organic geochemical properties including TOC content (wt%), S1 (mg/g, amount of volatile or free hydrocarbons), S2 (mg/g, amount of hydrocarbons generated through thermal cracking of nonvolatile organic matter, e.g., kerogen of a sample), and the thermal maturity parameter, Tmax (the pyrolysis temperature at which maximum release of hydrocarbon from kerogen cracking occurs during pyrolysis). Total porosity, effective porosity, liquid saturations, and mineralogy of the canister desorption core samples were either directly measured on the core samples or interpolated from the measured values of adjacent core samples that were at most a few centimeters above or below the same core. Methane adsorption isotherms were also measured on selected samples from the Montney Formation wells under reservoir temperatures in the laboratory.

3. Results of Canister Core Desorption and Core Analysis

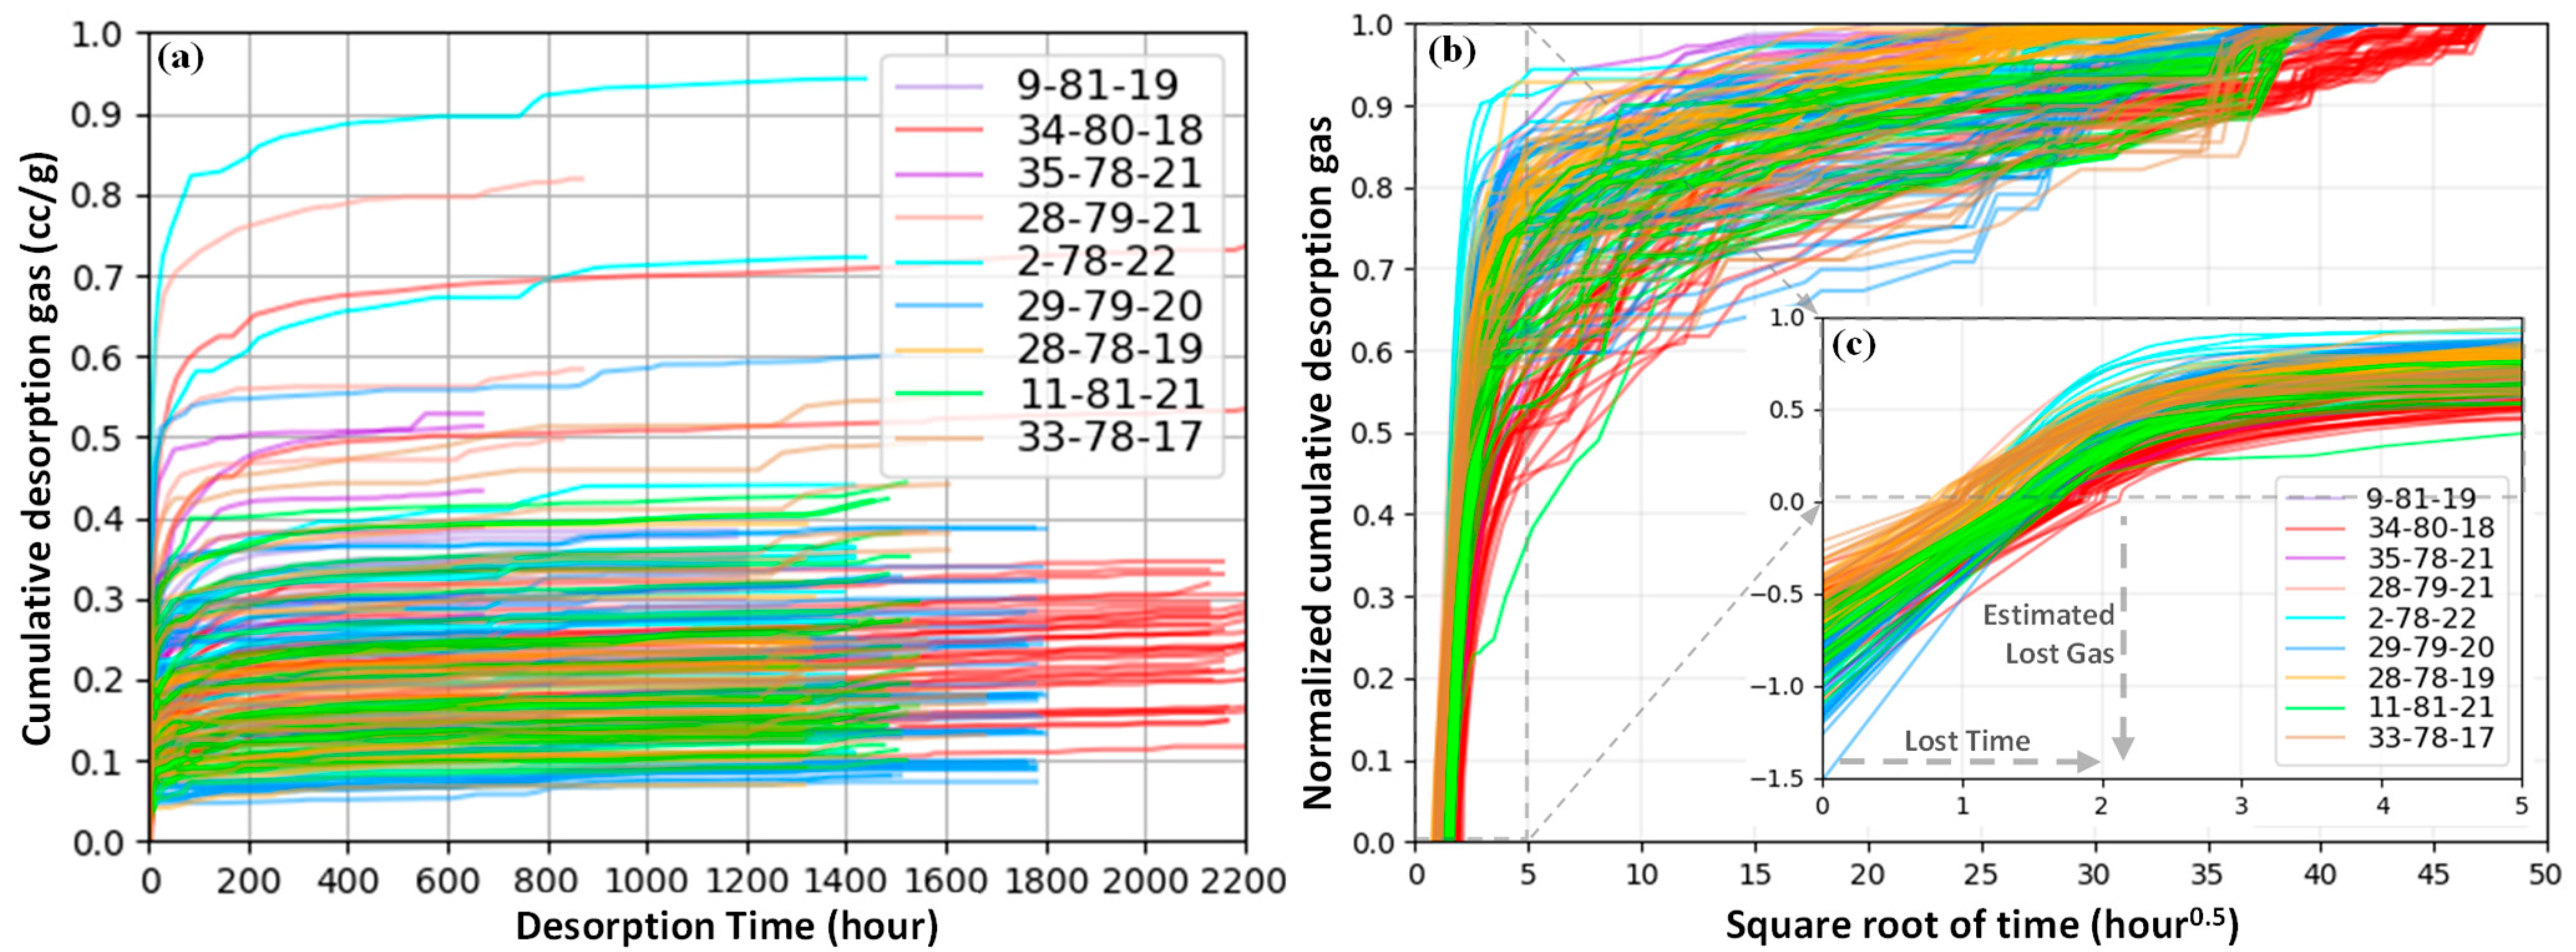
3.1. Desorption Gas Contents

The measured canister desorption gas contents for the 230 Montney Formation core samples varied from 0.07 to 0.94 cc/g of rock, but primarily fell in the range of 0.1–0.4 cc/g. Core samples from the same well also had variable cumulative desorption gas, with the completion of desorption occurring between about 700 and 2000 h (Figure 3a). Samples from some wells had a rapid desorption stage near the end of the desorption test at an elevated temperature of 60 °C instead of 50 °C, as indicated by the kinks in the cumulative desorption gas content curve in Figure 3a. Figure 3b,c presents the normalized cumulative desorption gas content (i.e., cumulative gas content divided by the total measured gas content) versus the square root of desorption time. For most samples, over half of the measured gas was desorbed within the first 25 h (i.e., before the five mark on the x-axis in Figure 3b,c), with “lost gas time” varying between 1 and 4 h prior to the canister desorption test (Figure 3c). The normalized lost gas estimated for these samples varied from about 0.25 to 1.5 times of the measured desorption gas content, being shown as negative values in Figure 3c, where zero normalized-cumulative desorption gas corresponds to the moment when core samples are placed into the canister for the desorption test. The early-time desorption profiles indicate that core samples from the same well tend to cluster together and follow a similar trend (Figure 3c). The lost gas contents are estimates for the amounts of gas potentially lost at the surface only, and do not include any gas lost during core retrieval from the reservoir to the surface; therefore, they do not represent the true amounts of total lost gas from the cores.

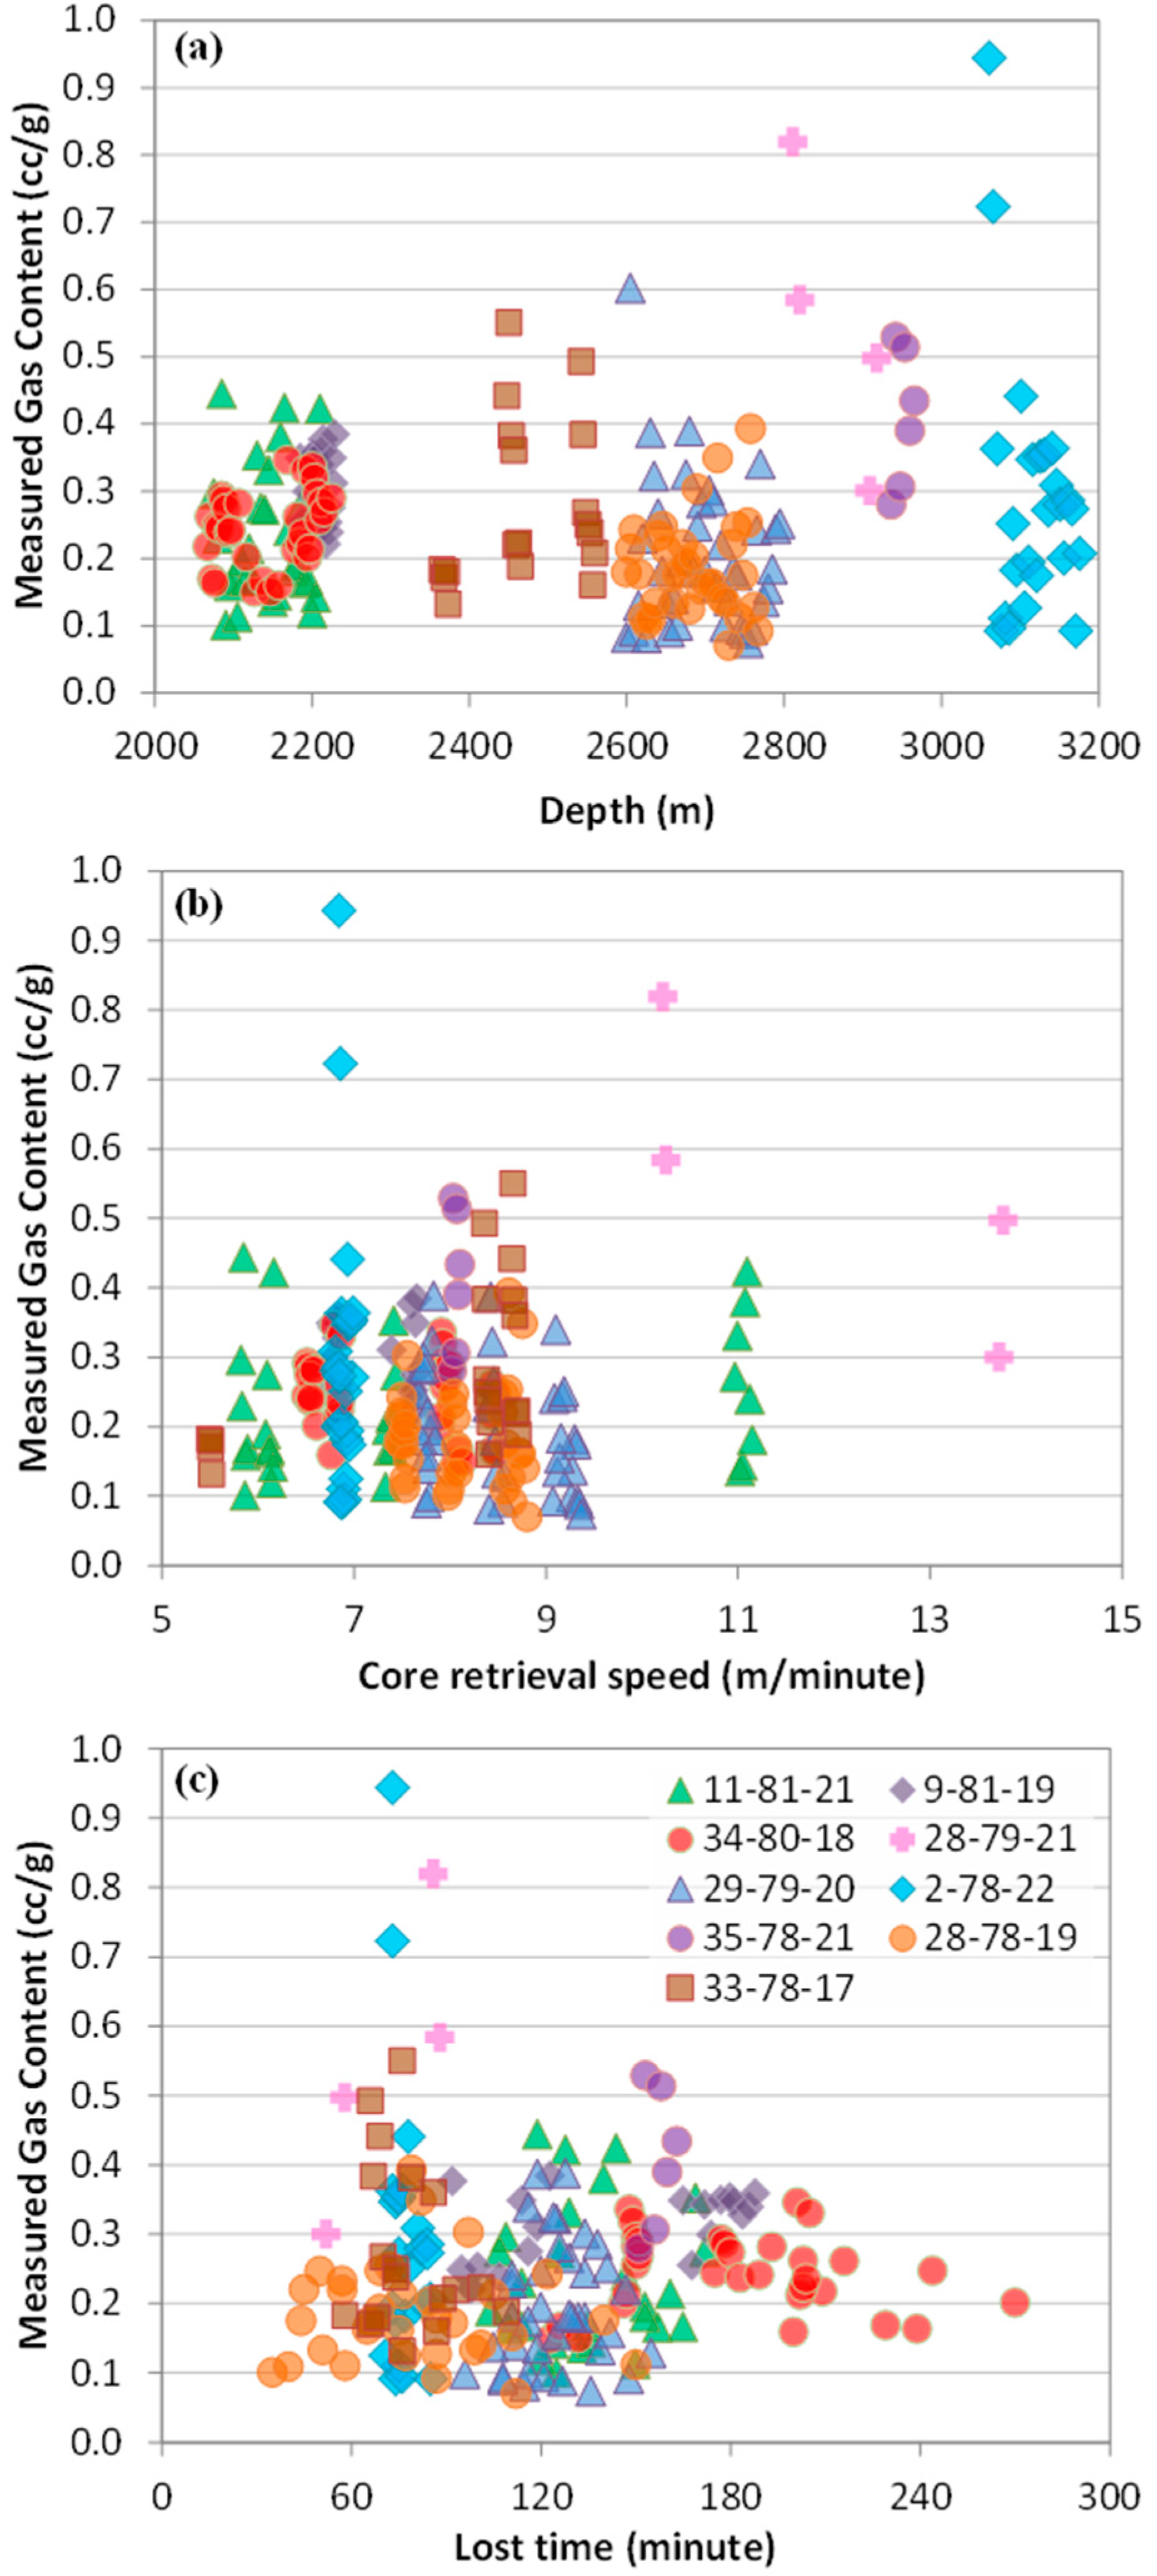
3.2. Effects of Operational Factors on Core Desorption Gas Content

The measured desorption gas contents correlate poorly with core depths (Figure 4a). The nine wells in the study area showed similar minimal desorption gas contents, at about 0.1 cc/g for their cores, whereas their maximal measured desorption gas contents increased with the core depth, from ~0.4 cc/g for wells of a burial depth of ~2100–2200 m to 0.9 cc/g at 3150 m (Figure 4a).
The average core retrieval speed (i.e., core depth divided by total core retrieval time used) varied between about 5.5 and 14 m/min for the studied core samples (Figure 4b). In general, higher values of the maximal desorption gas contents were associated with faster core retrievals, except for some samples from well 11-81-21 and two samples from wells 28-79-21 and 2-78-22 (Figure 4b). However, the minimal desorption gas contents of each well do not seem to show any correlation with the core retrieval speeds.
Figure 4c shows the relationship between the measured desorption gas contents and lost gas time for core samples. Longer lost gas time at surface prior to canister desorption does not necessarily result in lower gas contents for most samples, even from the same well. An exception to this were the core samples from well 34-80-18, where the desorption gas contents seemed to decrease with increasing lost gas time. Nevertheless, their lowest desorption gas contents, being around 0.15–0.2 cc/g with the longest lost gas time at surface of about 3–4 h, were still much higher than the lowest values of below 0.1 cc/g for the other wells/cores (Figure 4c).

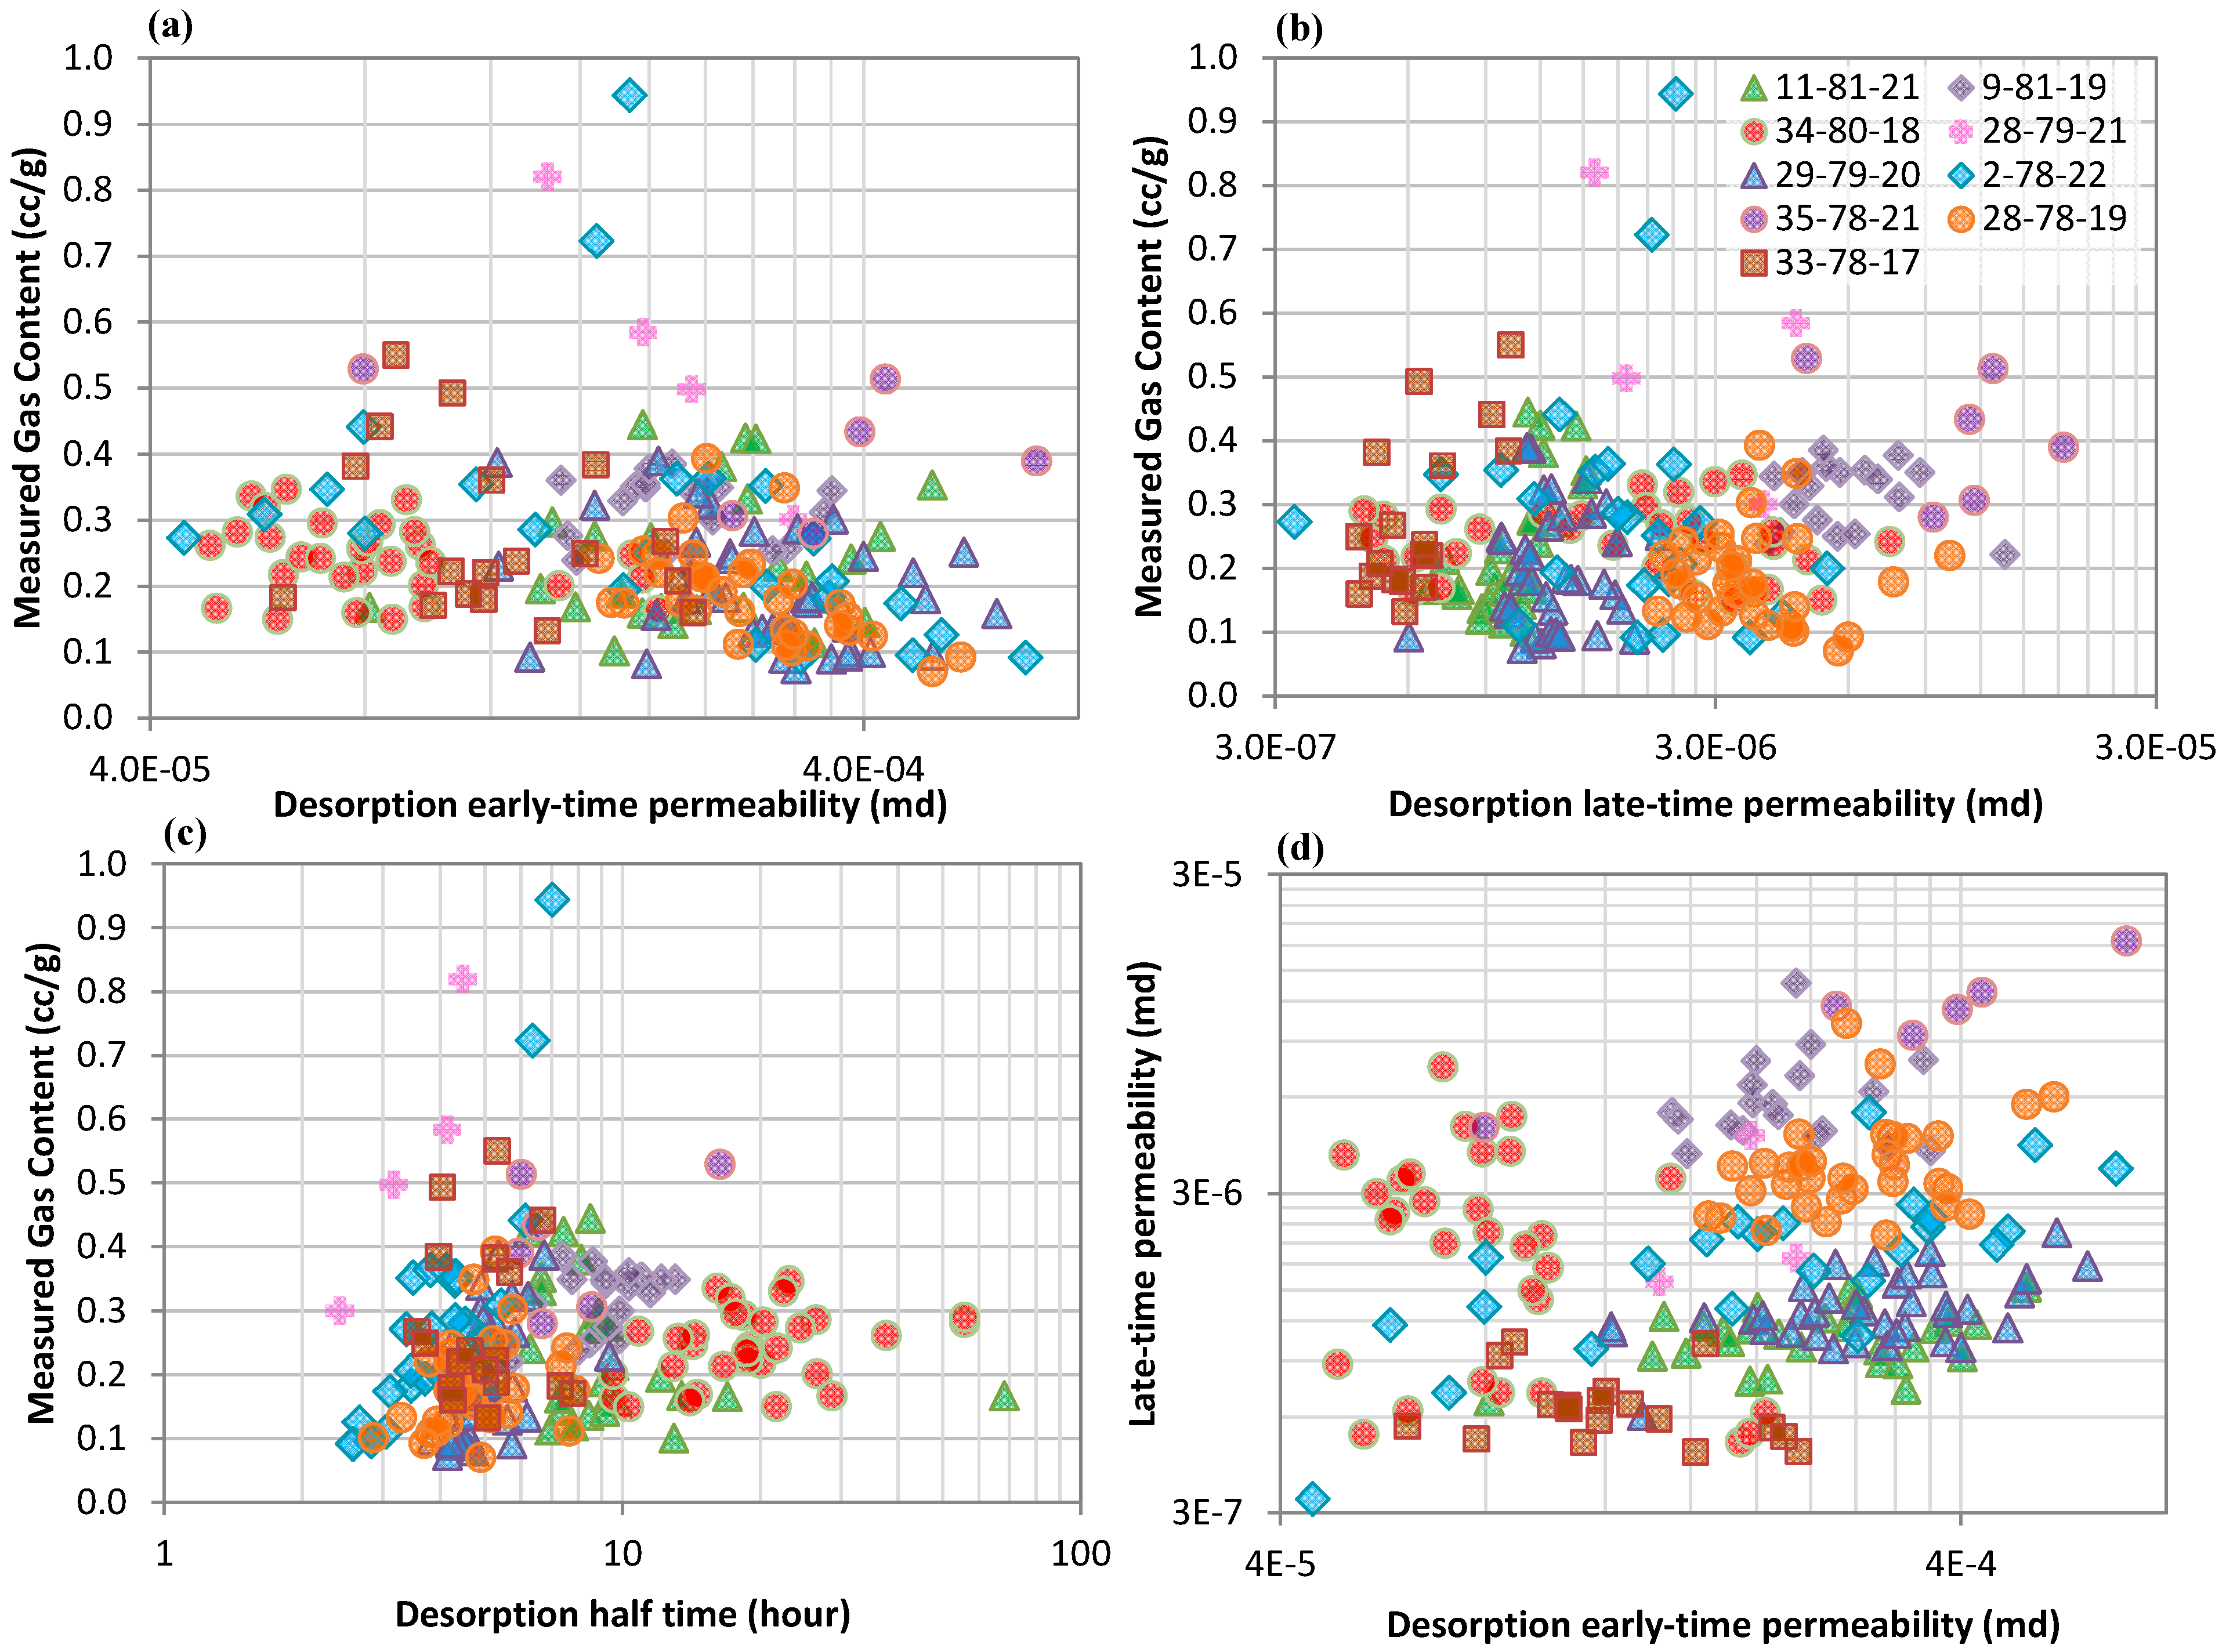
3.3. Core Desorption Permeability

Core desorption permeability was estimated using the early-time and late-time techniques proposed by Cui et al. [24]. As the desorption gas was released and collected intermittently, rather than continuously, from the desorption canisters in this study, the estimated desorption permeability for the canister core samples is only a first-order approximation. The early-time desorption permeability varied between 4 × 10⁻⁵ and 8 × 10⁻⁴ md (Figure 5a), whereas the late-time desorption permeability was about two orders of magnitude lower, ranging from 3 × 10⁻⁷ to 3 × 10⁻⁵ md (Figure 5b). Although the overall data are relatively scattered, samples from the same well and as a whole appear to show that samples with lower measured gas contents have higher early-time desorption permeability (Figure 5a). This weak trend is not observed at all between measured gas content and late-time desorption permeability (Figure 5b). Despite the poor relationship between measured desorption gas contents and the derived desorption permeability values, the desorption half time—required to desorb half of the measured gas—was positively correlated with measured gas content, for individual well samples and for all samples as a whole (Figure 5c). In addition, early-time and late-time permeability were poorly correlated but seemed to have an overall positive correlation with wide scattering. Moreover, desorption permeability data from individual wells tended to cluster together to develop well specific trends (Figure 5d).

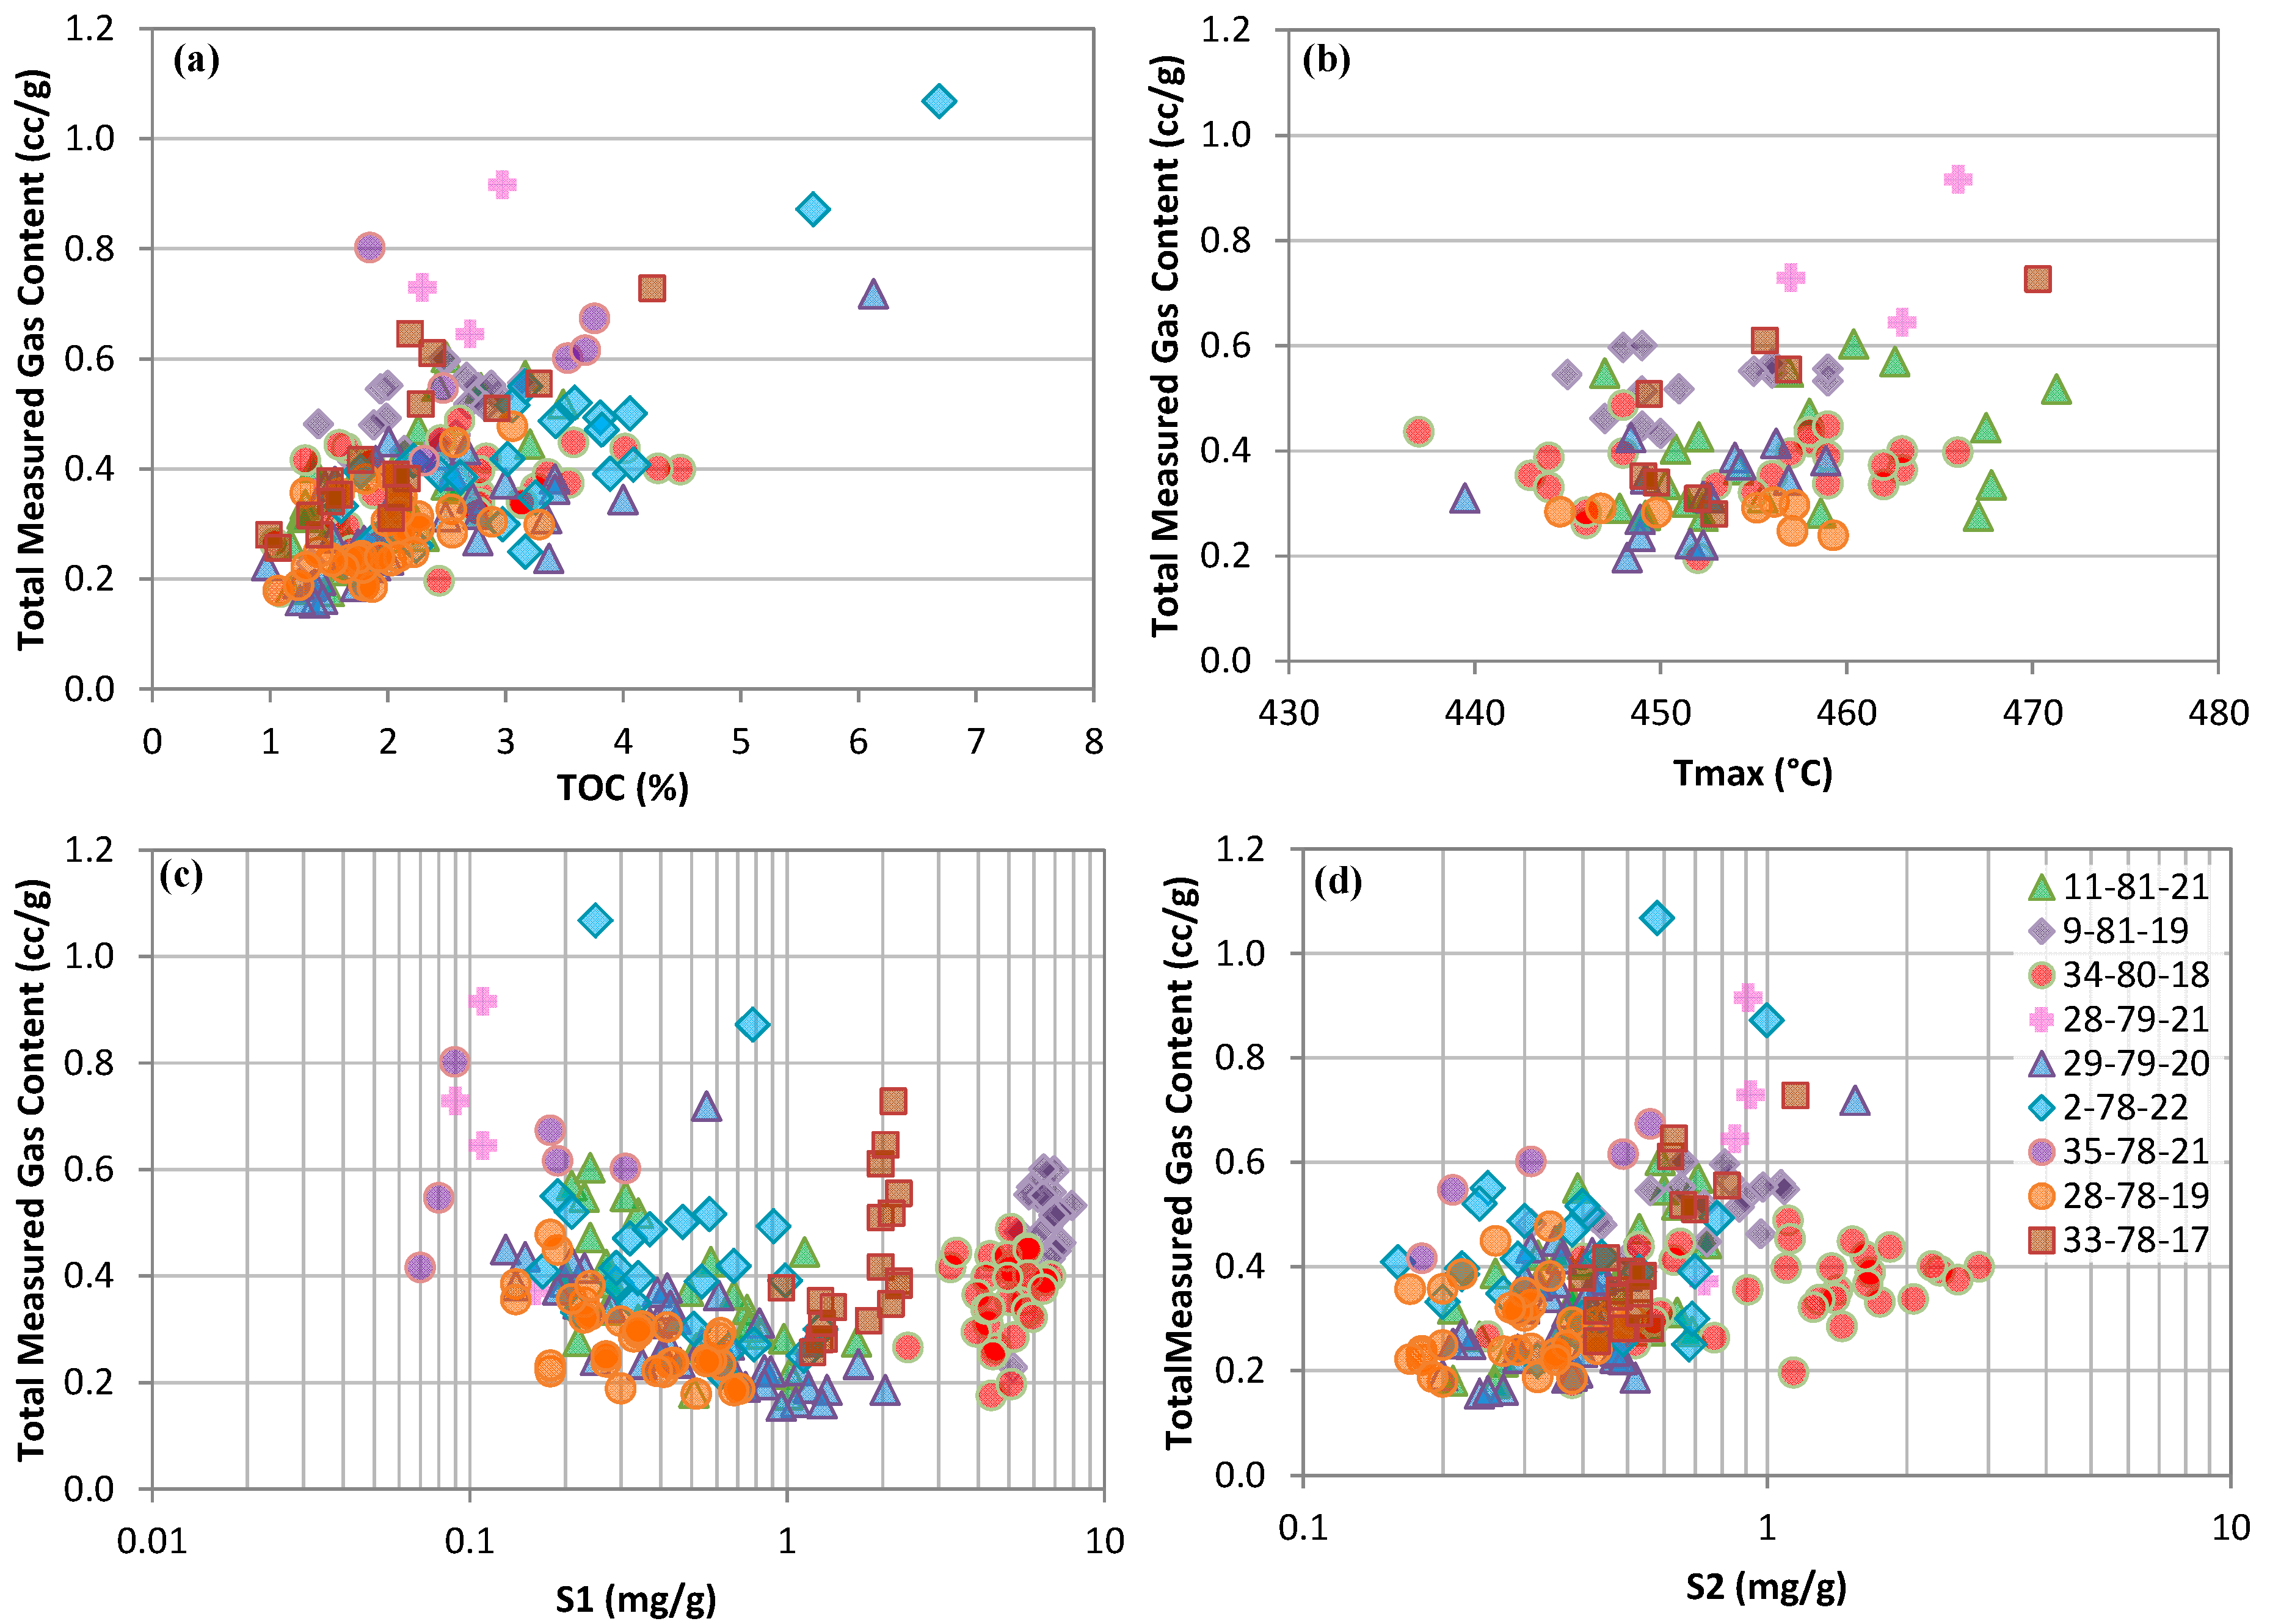
3.4. Effects of Organic Matter on Core Desorption Gas Content

The occurrence of organic matter is paramount for unconventional hydrocarbon plays. Organic matter is considered the main source of hydrocarbon generation and contributes to the pore space and adsorption capacity of hydrocarbon gas in organic-rich unconventional reservoirs. Organic matter in reservoir or source rocks is commonly characterized by programmed pyrolysis, such as Rock-Eval or HAWK analysis. For the 230 Montney Formation core samples for canister desorption, the TOC values ranged from about 1 to 7%, with the majority of samples being less than 4% (Figure 6a). The total measured desorption gas contents (measured + crushed) increased with increasing TOC for the majority of studied core samples, from ~0.15–0.2 cc/g at ~1% TOC to ~0.4–0.6 cc/g at ~4 % TOC (Figure 6a). The total measured desorption gas contents generally increased with the Tmax values from Rock-Eval analysis, varying from ~0.2 cc/g at a Tmax of 435 °C to 0.4–0.7 cc/g at a Tmax of 470 °C with a few scattered data points (Figure 6b). These positive correlations appeared to hold true for all samples from individual wells. Due to the relatively low TOC of most Montney Formation samples, the Tmax values had poor quality and only samples with S2 > 0.3 mg/g and TOC > 1% were included. It is interesting to note that the total measured desorption gas contents decreased with increasing S1 values, from 0.4–0.9 cc/g at S1 = 0.1 mg/g down to about 0.2–0.4 cc/g at S1 = 1.5 mg/g for all but wells 33-78-17, 34-80-18, and 9-81-19 (Figure 6c). Core samples from the latter three wells had S1 > 1.5 mg/g, and the desorption gas contents generally increased with increasing S1 values. Total measured gas contents of all samples weakly correlated with the S2 values but with large scattering, showing only a slight increasing trend (Figure 6d). This weak correlation was also reflected in the relationship between desorption gas contents and Rock-Eval HI values for the studied core samples that were all less than 70 mg HC/g TOC, and mostly below 40 mg HC/g TOC. The very low HI values are consistent with previous findings that showed that the organic matter in the Montney Formation siltstone reservoirs were mainly pyrobitumen due to the thermal cracking of secondary bitumen accumulated in the reservoir [25].

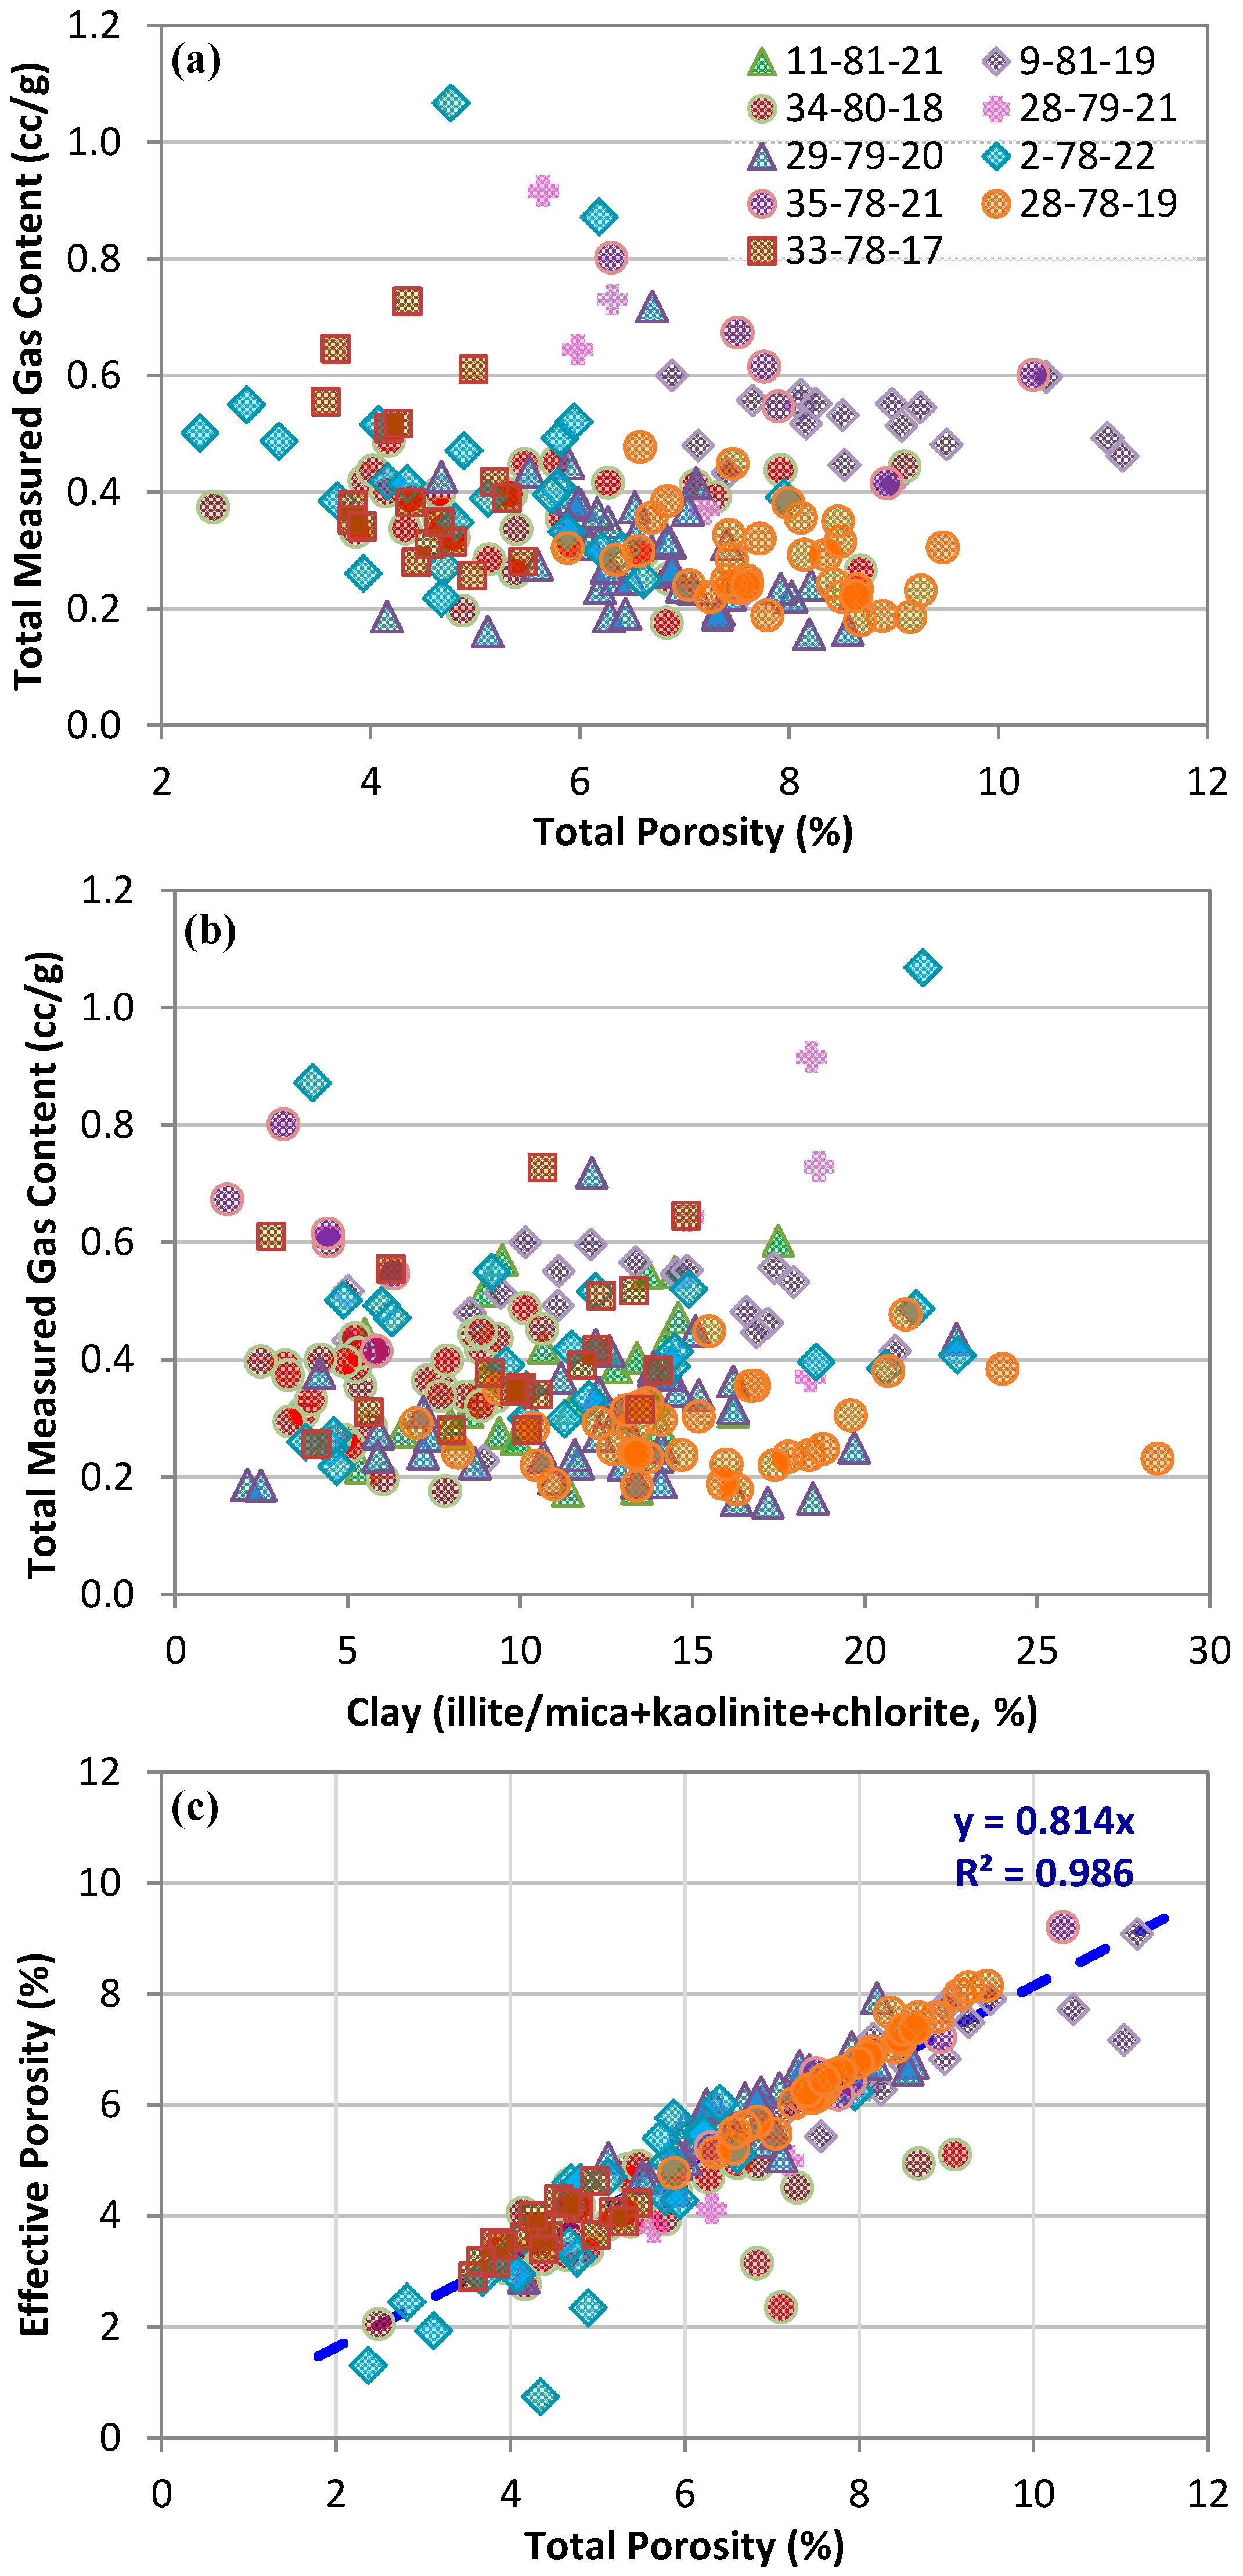
3.5. Relationship between Core Desorption Contents and Porosity and Mineralogical Compositions

Total and effective porosity and mineralogy of the canister desorption core samples were interpolated from laboratory measurements on adjacent core samples (typically less than a few centimeters away from the canister samples in depth), as no porosity and mineralogy were directly measured on the 30 cm long canister samples. The total measured desorption gas contents for most samples seemed to decrease with increasing total porosity, from 0.4–0.6 cc/g at ~3% porosity to about 0.2 cc/g at ~9% porosity (Figure 7a). However, samples from wells 9-81-19 and 35-78-21 showed a different decreasing trend, with higher desorption gas contents as a whole. The total measured canister desorption gas contents did not noticeably correlate with mineralogy composition in general, as highlighted by the cross-plot of total measured gas content versus clay mineral (illite/mica + kaolinite + chlorite) contents in Figure 7b, with illite/mica being the predominant clay mineral for most samples. A similar relationship was found for desorption gas content and effective porosity, as there was a strong linear correlation between total porosity and effective porosity (Figure 7c). Overall, total porosity and measured desorption gas content were weakly correlated but showed a more observable correlation than mineralogy and desorption gas content.

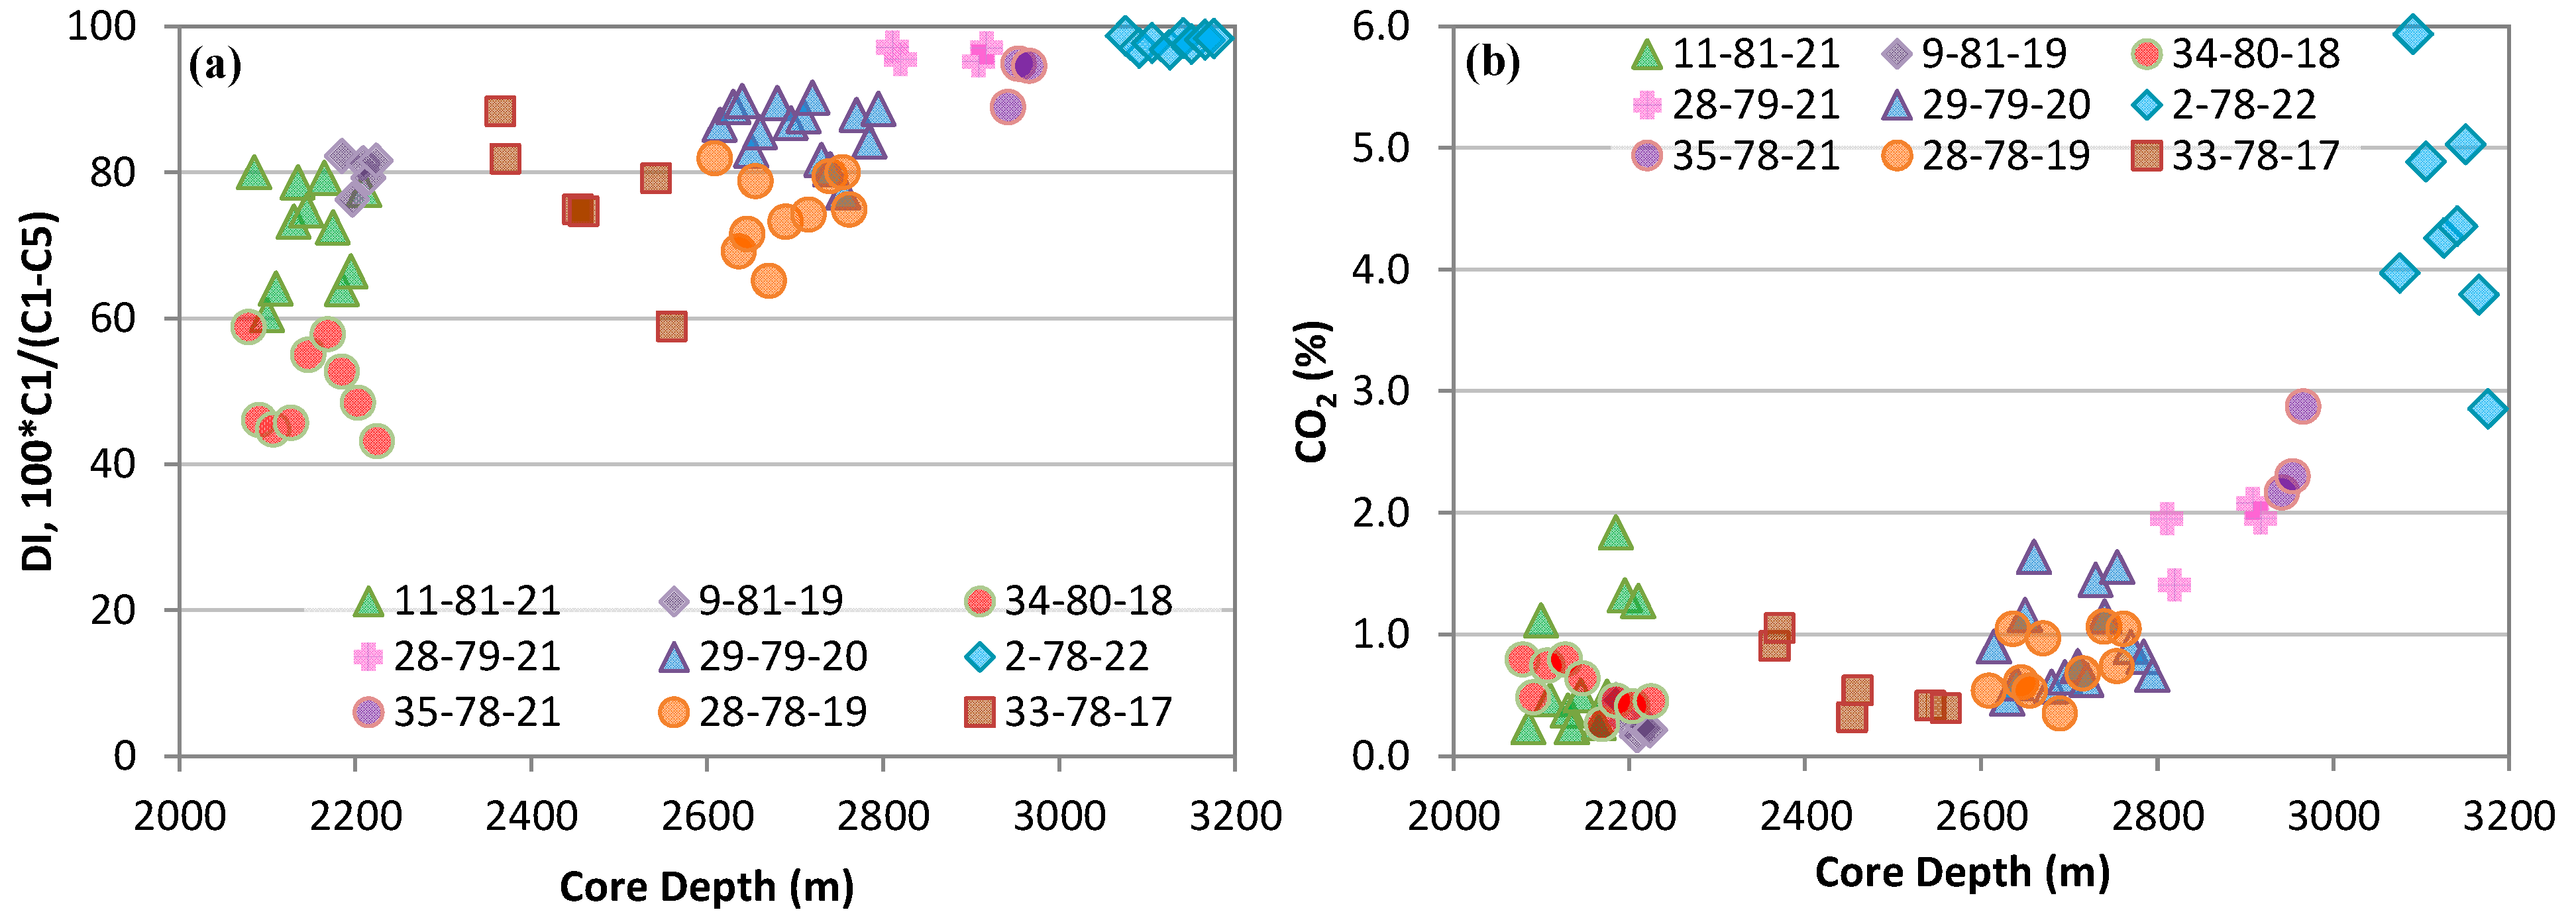
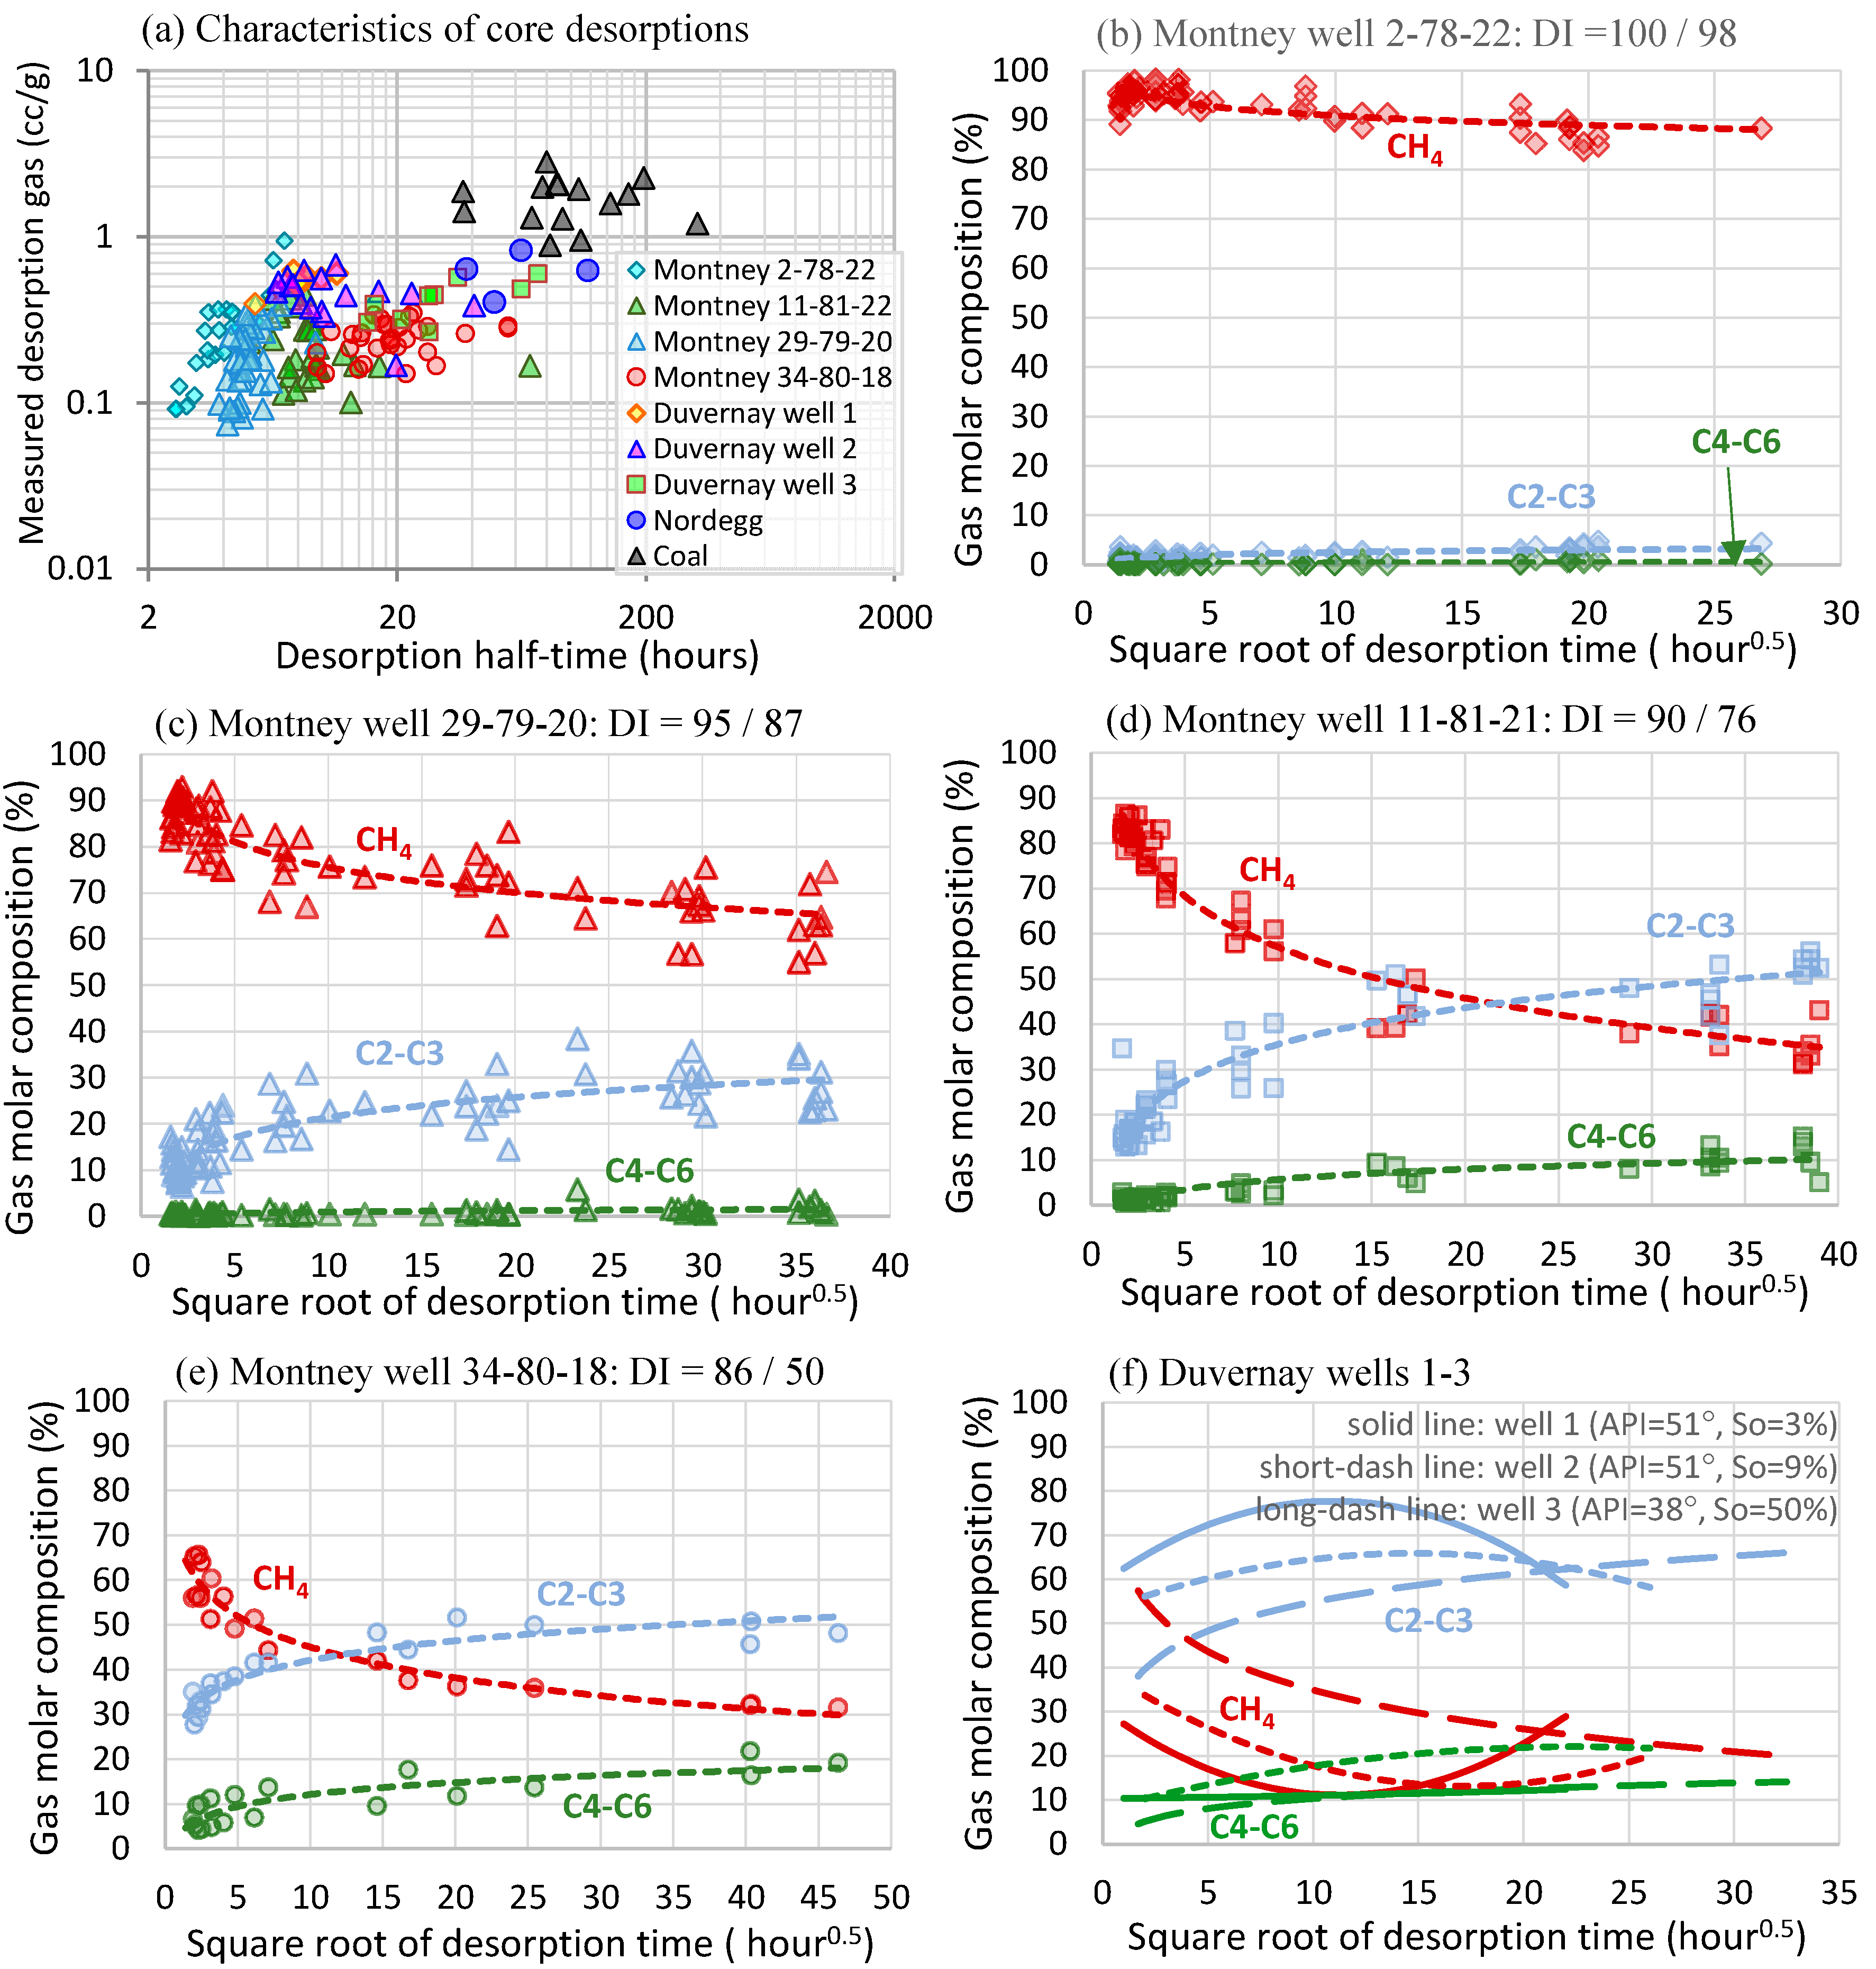
3.6. Desorption Gas Composition

Figure 8 presents cross plots of desorption gas compositions versus depth. Desorbed gases tend to be enriched in light components with larger incremental desorbed gas volumes at earlier desorption stages but contain more heavy components and CO2 with smaller incremental desorbed gas volumes at later desorption stages. The gas composition presented here is a volume-weighted average of the total desorbed gas of a core sample. Gas dryness index (DI = 100 × C1/(C1 − C5)) of the desorbed gas generally increased with increasing burial depth of the cores, from about 60 for cores at 2100 m burial depth to about 98 for cores at 3100 m deep (Figure 8a). In addition, Montney Formation cores from shallower wells (i.e., <2800 m deep) showed wider variation (i.e., ±20%) in the desorption gas dryness, and the variation narrowed significantly with increasing burial depth of the wells/cores (Figure 8a). CO2 content in the desorption gas from shallow wells of cores (e.g., <2800 m) was less than 2%, whereas cores from deeper Montney Formation wells displayed an increased amount of CO2 with increasing burial depth, from an average of 0.5% for cores at 2500 m to ~5% at ~3100 m (Figure 8b).

3.7. Total Gas-in-Place

Adsorbed hydrocarbon gas in organic-rich unconventional tight gas reservoirs can be an important component of the total gas-in-place or total in situ gas content. Adsorbed gas can be quantified by adsorption isotherms, which is commonly defined by the Langmuir isotherm with Langmuir volume and pressure. The Langmuir adsorption volume of selected Montney Formation core samples were normalized to their TOC contents and are presented in Figure 9a as a function of the corresponding reservoir temperatures. It is worth noting that the Langmuir volume per unit mass of organic matter increased with the reservoir temperatures at which the isotherms for the cores were measured, varying from about 6 cc/g TOC at 65 °C to over 10 cc/g TOC at 95 °C. This was likely due to the fact that organic matter in the Montney Formation cores from deeper burials or higher reservoir temperatures experienced more advanced thermal maturation. Thus, they may have had a greater surface area for adsorption [26], despite the general decrease in adsorption capacity for both kerogen and the rock matrix with increasing temperature [26,27,28]. The adsorbed gas contents calculated using the measured Langmuir isotherms were compared with total measured desorption gas (measured + crushed) and are presented in Figure 9b. Our findings indicated that the total measured gas contents were within the ranges of the in situ adsorbed gas defined by the limited number of adsorption isotherm measurements carried out. However, some samples had lower total measured gas contents than adsorbed gas, except for well 9-81-19, which had lower in situ adsorbed gas than measured desorption gas.
Methane adsorption isotherms were used to estimate the total gas-in-place (TGIP) in this study. For most of the canister-desorption samples, the methane adsorption isotherms were derived based on the TOC contents and bulk sample densities, using the correlation shown in Figure 9a. Methane compressibility factors under different pressures and temperatures were calculated using the program SUPERTRAPP [29], to estimate the free gas amounts under reservoir conditions. The pressure of each sample was estimated based on drilling mud weight and core depth, and temperatures were based on downhole temperature measurements. The total gas-in-place or in situ gas content (per unit mass basis) was considered to be the sum of free gas stored in effective pore space and adsorbed gas. For simplicity, solution gas in water was not considered here due to the low solubility of methane in water and the relatively low water saturations (~20%) for most cores in the study area (i.e., the effective gas porosity was about 81.4% of total porosity, as shown in Figure 7c), and the gas was assumed to be 100% methane. These assumptions are reasonable, as it was shown later by field data that methane was the predominant component (>85%) and CO2 was less than 3% in all canister desorption core wells, (except for well 2-78-22) even though canister desorption gas can have significant amounts of C2+ in shallow wells (Figure 8). The estimated total gas contents for all canister samples are shown in Figure 9c, demonstrating that total gas-in-place per unit sample mass varied between 2 and 10 cc/g, mostly in the range of 4–8 cc/g. Although the adsorption gas content noticeably increased with sample depth, from about 0.1–0.3 cc/g at 2100 m to 0.4–1 cc/g at 3100 m, it was slightly lower than the total canister desorption gas (measured + lost) content for samples deeper than 2600 m and significantly (about 50%) lower for shallower samples.
The relative percentages of total measured desorption gas, total desorption gas (i.e., total measured desorption gas plus lost gas), and estimated adsorption gas based on isotherms relative to the total gas-in-place (i.e., free gas + adsorbed gas) are shown in Figure 9d. The percentages of these components decreased exponentially with increasing total gas-in-place. For example, the percentage of the total desorption gas decreased from about 50% at TGIP = 1.5 cc/g to about 5% at TGIP = 12.5 cc/g, with most samples being in the 25–5% range and between 3 and 8 cc/g TGIP (Figure 9d). The overall trend of the measured desorption gas content was similar to the estimated adsorption gas based on methane adsorption isotherms, which were about 2–10% lower than that of the total desorption gas.

3.8. Well Production Data

As the wells selected for the canister core desorption tests in this study were drilled in the early-stage exploration phase in the Montney Formation, most wells have no production data or have not been put on production due to operational considerations. Therefore, pseudo-produced fluid properties were interpolated based on the properties of hydrocarbon fluids from 1021 production wells in the study area, as shown in Figure 2b and Figure 10a,c,e,g. The pseudo-field gas dryness index (DI), ethane + propane (C2–C3) concentrations, CO2 concentrations, and the cumulative gas produced in the first 12 months of production are cross-plotted against the corresponding canister-desorption data for the studied wells in Figure 10b,d,f,h, respectively.
The pseudo- or interpolated gas DI values of produced gas in the study area showed a strong linear correlation with the DI values of the canister desorption gas (Figure 10b). However, desorption gas DI is systematically lower than that of the pseudo-produced gas. The concentration of C2–C3 of the desorption gas also correlated well with the interpolated C2–C3 concentration of the field gas (Figure 10d); however, C2–C3 concentrations of desorbed gases were about two times higher than that of the pseudo-produced gas (Figure 10d). Furthermore, the CO2 concentrations of desorption gas were also about two times higher than those of the pseudo-field gases, except for the wells with a CO2 concentration below 0.25% (Figure 10f). The cumulative gas produced in the first 12 months of production correlated poorly with the average well desorption gas contents (Figure 10h). The wells with the highest cumulative gas production (>3 × 10⁷ m3) had relatively low desorption gas contents of about 0.35–0.4 cc/g, whereas two wells with the lowest cumulative gas production (<8 × 10⁶ m3) had the highest average canister desorption gas contents of >0.6 cc/g (Figure 10h). Locations or wells with a higher average gas-in-place (estimated based on core data, represented by the corresponding open symbols in Figure 10h) produced lower cumulative amounts of gas in the first 12 months, implying that well performance in the Montney Formation was not solely controlled by reservoir properties or resources in place, but also influenced by well completion and stimulation operations.

4. Simulation of Core Retrieval and Canister Core Desorption

A radial one-dimensional non-isothermal gas transport model was constructed to study the gas losses during core retrieval, lost gas time at the surface prior to canister desorption, and subsequent gas desorption in the canisters. As heat advection by gas and diffusion through gas in low-permeability rocks is negligible, only heat conduction through a rock matrix was considered in this study. Based on typical thermal properties of sedimentary rocks, a value of 1000 J/Kg/K for heat capacity and 2.5 W/m/K for heat conductivity were used [30]. Gas transfer was modeled using Darcy’s law with constant gas permeability, and gas adsorption was modeled based on the measured Langmuir isotherms, as described in Section 3.7. Dirichlet boundary conditions for pressure and temperature, which were applied to the external core surface during core retrieval, varied accordingly during core retrieval, and were calculated based on the core retrieval speed and drilling mud weight used for coring these wells. An average geothermal gradient (2.5 °C/100 m) was applied for all the wells. The core retrieval speeds were modeled as an exponential function of depth, consistent with common practice in the industry, with higher speeds initially at deeper depths, and lower speeds as the core approaches the surface; the resulting total retrieval time equals the actual retrieval time used to recover the individual cores. As most canister core desorption was carried out at 50 °C, constant temperatures of 15.6 and 50 °C were applied to the external circumferential surface during the lost gas time at surface and desorption in canister, respectively, whereas pressure at the external boundary was fixed at atmospheric pressure after samples were retrieved to surface. The measurements of porosity, effective porosity, TOC, adsorption isotherms, core depth, and initial pressure and temperatures used for the total gas-in-place estimation in Section 3.7 were also used for core recovery and desorption simulations. Heat conduction and gas transport in core samples were fully coupled and realized using the open-source software MRST [31].
The application of the early-time and later-time permeability in the core recovery and desorption simulations failed to reproduce the observed desorption gas contents for the studied Montney Formation cores. As such, GRI permeability data on a set of Montney Formation core samples adjacent to the canister core samples were used to predict the methane gas permeability of the canister samples (Figure 11a). As the GRI permeability was measured using helium on cleaned and dried core samples of 20–40 mesh particle sizes, a conversion from helium permeability to methane permeability was performed assuming a dominance of Knudsen effects [6,32], and the derived methane permeability was about two-fold lower than the corresponding helium permeability. Furthermore, the effective methane permeability was estimated based on the effective porosity (Figure 7c) by multiplying the estimated methane permeability by a factor of (1 − Sw)2, where Sw is the initial water saturation of the core samples. Interestingly, using the estimated methane permeability resulted in simulated canister desorption gas contents (open blue circles and solid blue curve, Figure 11b) that were fairly consistent with the laboratory measured canister core desorption gas contents (open red circles and solid red curve, Figure 11b). Even after considering the effect of drilling mud invasion (e.g., assuming 1 mm penetration into cores and an increased water saturation of 50%), the simulated desorption gas results (light cyan solid curve, Figure 11b) were only slightly higher compared with the measured gas contents (red solid line, Figure 11b).
The cumulative gas desorption/loss versus time are shown in absolute quantities in Figure 11c and in normalized values with respect to the measured desorption gas contents of all studied core samples in Figure 11d. In these two figures, time zero is set as the instant the core is retrieved to the surface. A zero gas content is defined as the commencement of canister core desorption. Therefore, the amount of gas lost before canister desorption and the time before the core reaches the surface are both negative. As shown in Figure 11c, the modeled canister desorption gas contents vary between 0.15 and 0.6 cc/g at up to 500 h of desorption, whereas the total lost gas during core retrieval and at surface can be as high as 10 cc/g. Although the total lost gas can be 2 to 35 times the amount of canister desorption gas, the amount of gas lost within the first 1–4 h at surface is about 0.1 to 1.5 times the amount of canister desorption gas (Figure 11d). In fact, the amounts of lost gas at surface from the simulation (Figure 11d) were fairly consistent with the lost gas estimates based on extrapolation of the canister desorption curves from the studied core samples (Figure 3b,c). However, the latter did not consider the gas lost during core recovery, hence often resulting in a severe underestimate of total gas content.
In summary, the simulation results generally confirmed that the canister core desorption procedure can only capture a minor amount of the total gas-in-place, and that the majority of the gases are free gases, of which 60–90% can be lost during core recovery, and a further 5–15% can be lost at the surface prior to canister core desorption (Figure 11b).

5. Discussions

5.1. Correlations of Core Desorption Data to Geological, Petrophysical, and Operational Parameters

The gas contents obtained from canister core desorption tests were highly variable in our study area of the Montney Formation, ranging from less than 0.2 cc/g to over 0.8 cc/g of rock, and were poorly correlated with most reservoir properties and operation parameters (Figure 4, Figure 5, Figure 6 and Figure 7). To gain a quantitative understanding of any correlational or causal relations between canister desorption gas contents and the considered parameters, a Pearson correlation coefficient (PCC) matrix among the variables was created and is shown as a heat map with hierarchical clustering in Figure 12. Based on the degree of similarity or closeness among the parameters, several hierarchical levels of row and column clustering are shown, respectively, to the left and to the top of the heat map (Figure 12). Within the base-level clusters, the leaf nodes or variables having the shortest distances to a joint (as indicated by horizontal line segments in the row cluster or by vertical line segments in the column cluster) were closely associated, having strong positive correlations with a PCC close to 1. The best examples of the base-level clustering were total desorption gas, measured gas (M), and total measured gas (M + C) in cluster C1, TOC and adsorption gas also in cluster C1, total porosity PHIT and effective porosity PHIE in cluster C3, and depth and temperature in cluster C4. However, the variables of a base-level cluster have weaker but positive correlations with other variables or other base-level clusters within the same variable but higher level, such as clusters C1, C2, C3, and C4. Variables from across these higher-level clusters were only weakly or even negatively correlated (e.g., weakly correlated cluster pairs C1 vs. C2 and C3 vs. C4; negatively correlated cluster pairs C1 vs. C3 and C2 vs. C4).
Although the hierarchical clusters were created statistically, based on the PCC matrix without any inputs about the physical or causal relations among the variables beforehand, the resultant clustering appeared to be meaningful in terms of petroleum geology and reservoir engineering, and demonstrated interesting relationships. The canister desorption data, including lost gas, total desorption gas, measured gas, and total measured gas contents were clustered together with TOC and adsorption gas results (C1 in Figure 12). As described in the preceding sections, the canister desorption gas was mainly the desorbed products of adsorbed gas, and therefore, closely related to the adsorption gas calculated based on adsorption isotherms. For the Montney Formation cores that are of siltstone lithology, their adsorption capacity was mainly contributed to by organic matter; therefore, both desorption and adsorption gas contents were strongly correlated to TOC content (i.e., Cluster C1 in Figure 12). In addition, the desorption/adsorption cluster C1 was positively correlated with pyrite content, because the abundant occurrence of pyrite is usually associated with increased accumulation and/or preservation of organic matter represented by TOC contents. Moreover, a higher reservoir pressure generally leads to more adsorbed gas in the reservoir or desorbed gas at the surface, in agreement with the positive correlation among these variables in Figure 12. Previous studies showed that porosity contribution by organic matter was minor in the Montney Formation [33], and organic matter (especially solid bitumen) may have even occluded inter-grain pores in Montney Formation reservoirs [25]. These observations are consistent with the weak (either positive or negative) correlations between the variables across clusters C1 and C3 in Figure 12. The pyrobitumen-dominated organic matter in the studied siltstone core samples had a very narrow and low range of HI values (i.e., <70 mg HC/g TOC); therefore, only a weak correlation exists between HI and desorption and adsorbed gases, as shown in Figure 12.
As expected, porosity and gas-in-place parameters were also clustered together (C3) in Figure 12. Core samples with higher porosity usually have better reservoir qualities and are likely of a higher quartz content, suggesting a strong correlation among the three variables (C3, Figure 12). Also, as anticipated, geological variables of burial depth, temperature, and pressure of the studied cores and the pseudo-production gas dryness and CO2 contents of the corresponding core samples were nicely clustered in group C4. With a few exceptions (e.g., the clustering of desorption half time and lost gas time with S1 and S2), the variables within each cluster were closely correlated to one another in terms of resource potential and petrophysical and geological properties of hydrocarbon reservoirs. Overall, PCC-based hierarchical clustering afforded quantitative and meaningful associations or causal relations among the parameters of the Montney Formation desorption cores, supplementing the individual cross-plot analyses (e.g., Figure 4, Figure 5, Figure 6 and Figure 7).

5.2. Usefulness of Canister Core Desorption

The canister core desorption test mainly measures the content and composition of the gas desorbed from cores taken from unconventional resource plays during early-stage evaluation and exploration activities. The usefulness and applicability of canister desorption depends not only on how reliably the gas content and composition is determined from a canister core desorption program, but also how close the measured total desorption gas contents are compared with the total gas-in-place. It has been considered a reliable technique for evaluating coal-seam gas and coal-mine methane reservoirs; however, its application in shale and tight gas evaluation has not been well-studied, especially for the prolific Montney Formation siltstone play. The results presented above clearly show that on-site canister desorption of tight reservoir cores, such as those from the Montney Formation with matrix gas permeability less than 1 × 10⁻⁴ md, could only capture variably low percentages of the total gas-in-place, from less than 2–5% at ≥1 × 10⁻⁴ md permeability to about 25% at ≤1 × 10⁻⁵ md permeability (Figure 11a,b). Due to the relatively high permeability, canister desorption gas mainly came from the adsorbed gas associated with solid organic matter in the Montney Formation samples. No noticeable correlation with clay minerals were observed from the 230 canister core desorption tests (Figure 7b), which differs from findings by Song et al. [8], who found that canister core desorption gas from their studied Montney Formation samples were mainly associated with clay minerals. The lost gas was predominantly from free gas under reservoir conditions, accounting for 60–90% of the total gas-in-place, and was mostly lost during core retrieval. The amount of lost gas can be severely underestimated if only the amount of gas lost at the surface prior to canister desorption is considered. In addition, early-time free gas loss was much faster than gas desorption during late-time desorption tests, as shown in Figure 3b,c and Figure 11c,d, which is also underscored by the fact that the estimated early-time permeability is about one to two orders of magnitude higher than the late-time permeability (Figure 5d). Thus, during field production, the adsorbed gas is likely produced from the reservoir only under significant depletion, and early production is mainly from free gas [34]. This also implies that, in addition to gas permeability or diffusivity and the probable existence of dual or triple permeability/porosity systems in the Montney Formation rock matrix, desorption kinetics also play an important role in the desorption of adsorbed gas from organic matter in the Montney Formation.
As revealed by the Montney Formation canister desorption data set, the total measured desorption gas contents (desorbed + crushed) were generally consistent with the adsorption gas (Figure 9b–d), which could be a significant part of the total gas-in-place for an unconventional play, especially for organic-rich shale gas and tight gas reservoirs. The compositional properties of canister desorption gas showed strong and consistent correlations with those of the produced gas in the study area (Figure 10b,d,f). Therefore, with proper calibration and modeling, desorption gas composition could be reliably used as viable proxies for in situ reservoir fluid compositions and reservoir types, thus providing invaluable information of reservoir characterization and resource assessment in the early stages of evaluation and exploration of unconventional plays.
Figure 13 presents the canister core desorption gas properties for typical unconventional plays in the WCSB, displaying distinct characteristics in terms of their measured desorption gas contents, desorption half-time, and reservoir types (e.g., dry gas, liquid-rich, retrograde condensate gas, or volatile oil reservoir). Most tight siltstone Montney Formation cores had the shortest half desorption time of several hours and relatively low desorption gas contents of less than 0.4 cc/g due to their higher permeability and lower TOC contents (Figure 5c and Figure 13a). In contrast, cores from the organic-rich Duvernay shales and the Cretaceous coal seams had desorption half-times in the ranges of 6–80 and 40–300 h, respectively, whereas their respective desorption gas contents were up to 0.8 cc/g and 3.0 cc/g, respectively (Figure 13a). Such varied desorption characteristics are apparently associated with the differences in fabrics, pore-size distribution and pore-throat networks, the amounts and types of organic matter, as well as matrix permeability. Therefore, canister core desorption tests can provide useful information for unconventional reservoir evaluation and characterization, even though the procedure may only capture a part of the total gas-in-place.
Furthermore, compositional profiles of desorption gases from different types of unconventional reservoirs followed distinct trends over the duration of the desorption tests (Figure 13b–f). Gas composition varied only slightly over time for Montney Formation cores from the dry gas window, dominated by CH4 (>~90%) and showing a minor increase in the concentrations of C2H6 and C3H8 (C2–C3) relative to CH4 at the late desorption stage (Figure 13b). In comparison, Montney Formation cores from well 29-79-20 with a pseudo-initial production gas DI of ~95 had significant declines in methane concentration from ~90 to ~65% after 1300 h of desorption, whereas C2–C3 concentration increased from 15 to ~30% with <2% of C4–C6 hydrocarbons (Figure 13c). For liquid-rich wells, methane concentration decreased from 70–90 to ~30% or less after ~1600 h of desorption, whereas C2–C3 and C4–C6 hydrocarbons increased from ~10 to 50% and <3–10%, respectively, for well 11-81-21 (Figure 13d), and from 30 to 50% and 5 to 20%, respectively, for well 34-80-18 (Figure 13e). In contrast, canister core desorption gases from three Duvernay Formations wells with variable amounts of residual hydrocarbon liquid or oil (i.e., residual oil saturations, So, ranging from 3 to 50%) had drastically different compositional patterns over time (Figure 13f). For the liquid-rich and condensate gas wells (i.e., Duvernay Formation wells 1 and 2), the desorption gases contained more than 50% of C2–C3, >10% of C4+, and less than 40% of methane (Figure 13f). Interestingly, desorption gases from Duvernay Formation cores with a 50% residual oil saturation (well 3) showed decreasing methane concentrations from ~60% at the beginning to 20% at the end of desorption, and correspondingly increasing concentrations of C2–C3 and C4–C6 from about 40 to 65% and 5 to 15%, respectively.
The evolution of desorption gas contents and compositions are likely controlled by different adsorption isotherms of different gases for dry-gas reservoirs. Generally, heavier hydrocarbon gases, such as C2H6, C3H8, and CO2, have stronger adsorption affinities than methane. Thus, gases tend to be differentially adsorbed to and desorbed from microporous rocks [35,36,37]. In addition, lighter gases have higher gas permeability or diffusivity due to strong Knudsen diffusion effects, and thus can be released faster and earlier out of core samples, resulting in lower CH4 concentration at later stages. Furthermore, for liquid-rich and retrograde condensate gas reservoirs and light or volatile oil reservoirs, decreasing temperature and pressure during core retrieval causes heavy hydrocarbon components to be fractionated and condensed into liquids to remain in cores, whereas the light components are released out of cores besides the differential transport and adsorption of gases in these reservoirs.
Therefore, the evolution of desorption gas composition over time can be theoretically considered as a small-scale analog of the depletion of the corresponding reservoir during production. If properly designed and analyzed, insightful information about the reservoir could be extracted from a canister core desorption test, especially regarding the in situ reservoir fluid. For tight reservoirs, well tests and production tests are time-consuming and challenging to obtain reliable results. A large drawdown of wellbore pressure can result in severe fluid fractionation in the wellbore and reservoir, leaving a significant amount of heavier hydrocarbon components unproduced in the reservoir and leading to biased sampling and erroneous characterization of in situ reservoir fluids. On the other hand, a core desorption test mainly captures the heavier gaseous hydrocarbon components with the fractionated or condensed heavy HC components trapped in core samples as residual liquid, which can subsequently be determined using dean-stark extraction for bulk amounts and by TD-GC for composition. Thus, using canister core desorption tests with proper core analyses can provide important data for more reliable fluid characterization and formation evaluation, especially for low- or extremely low-permeability reservoirs.

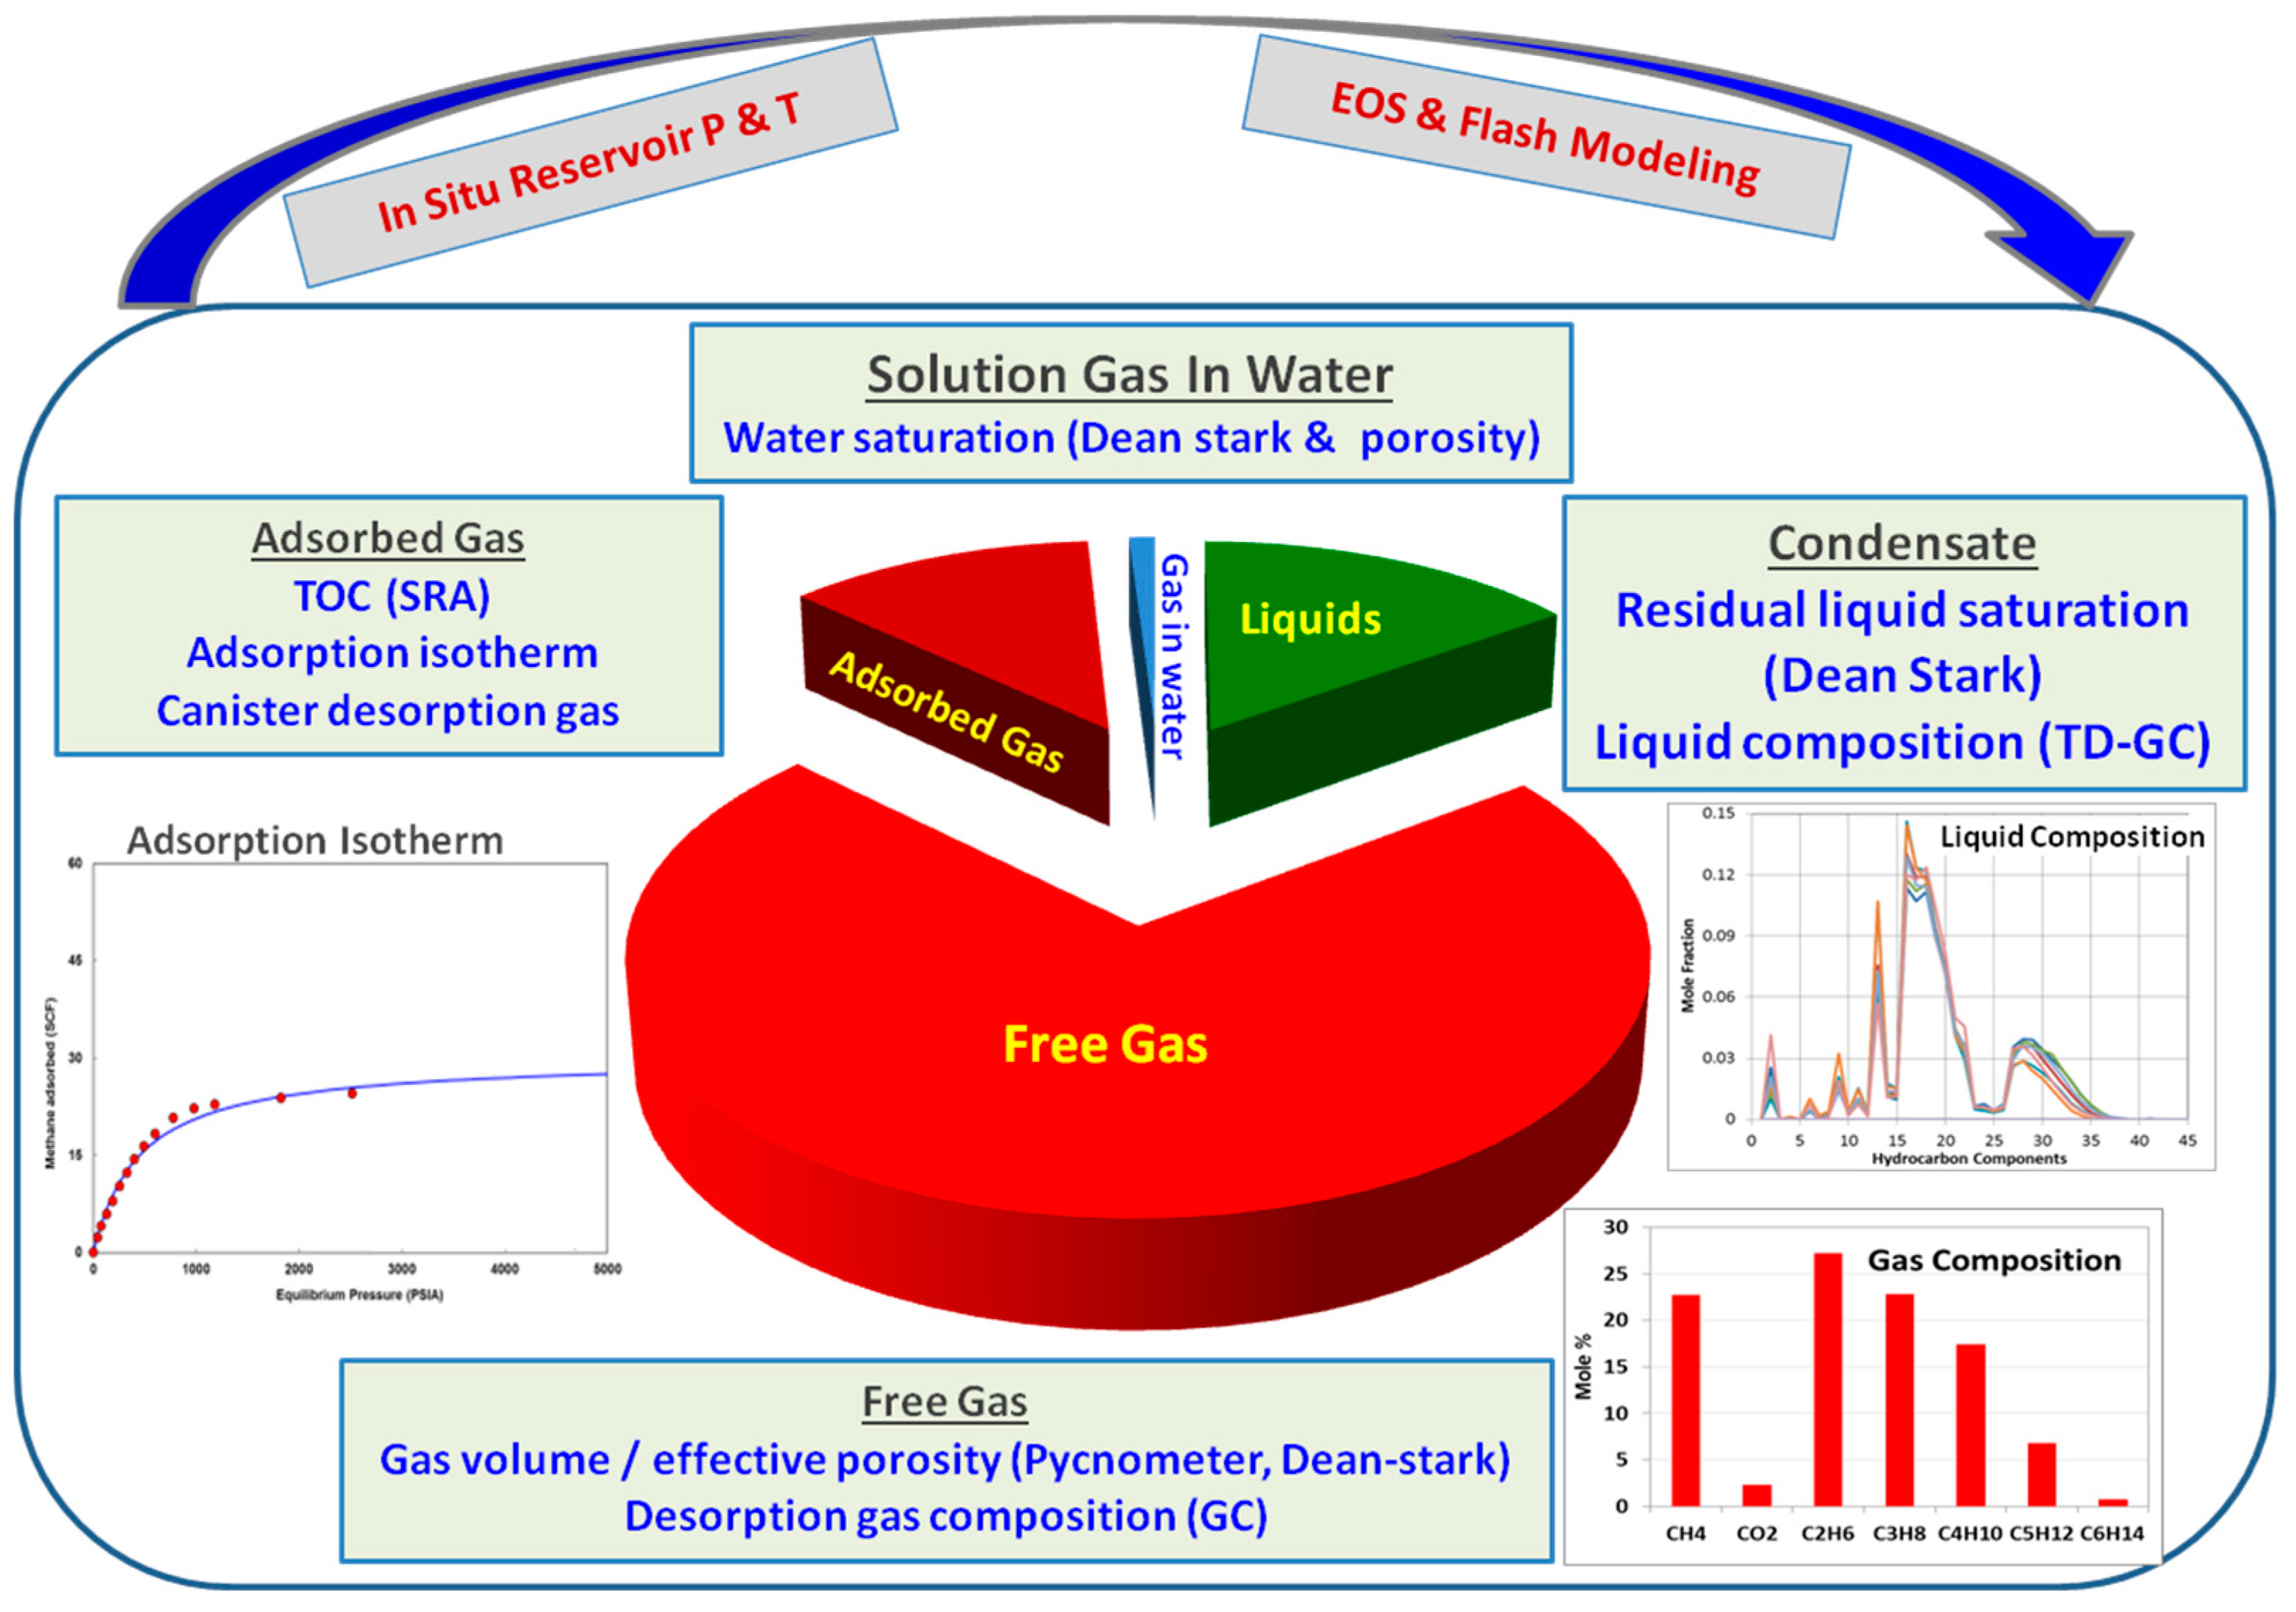
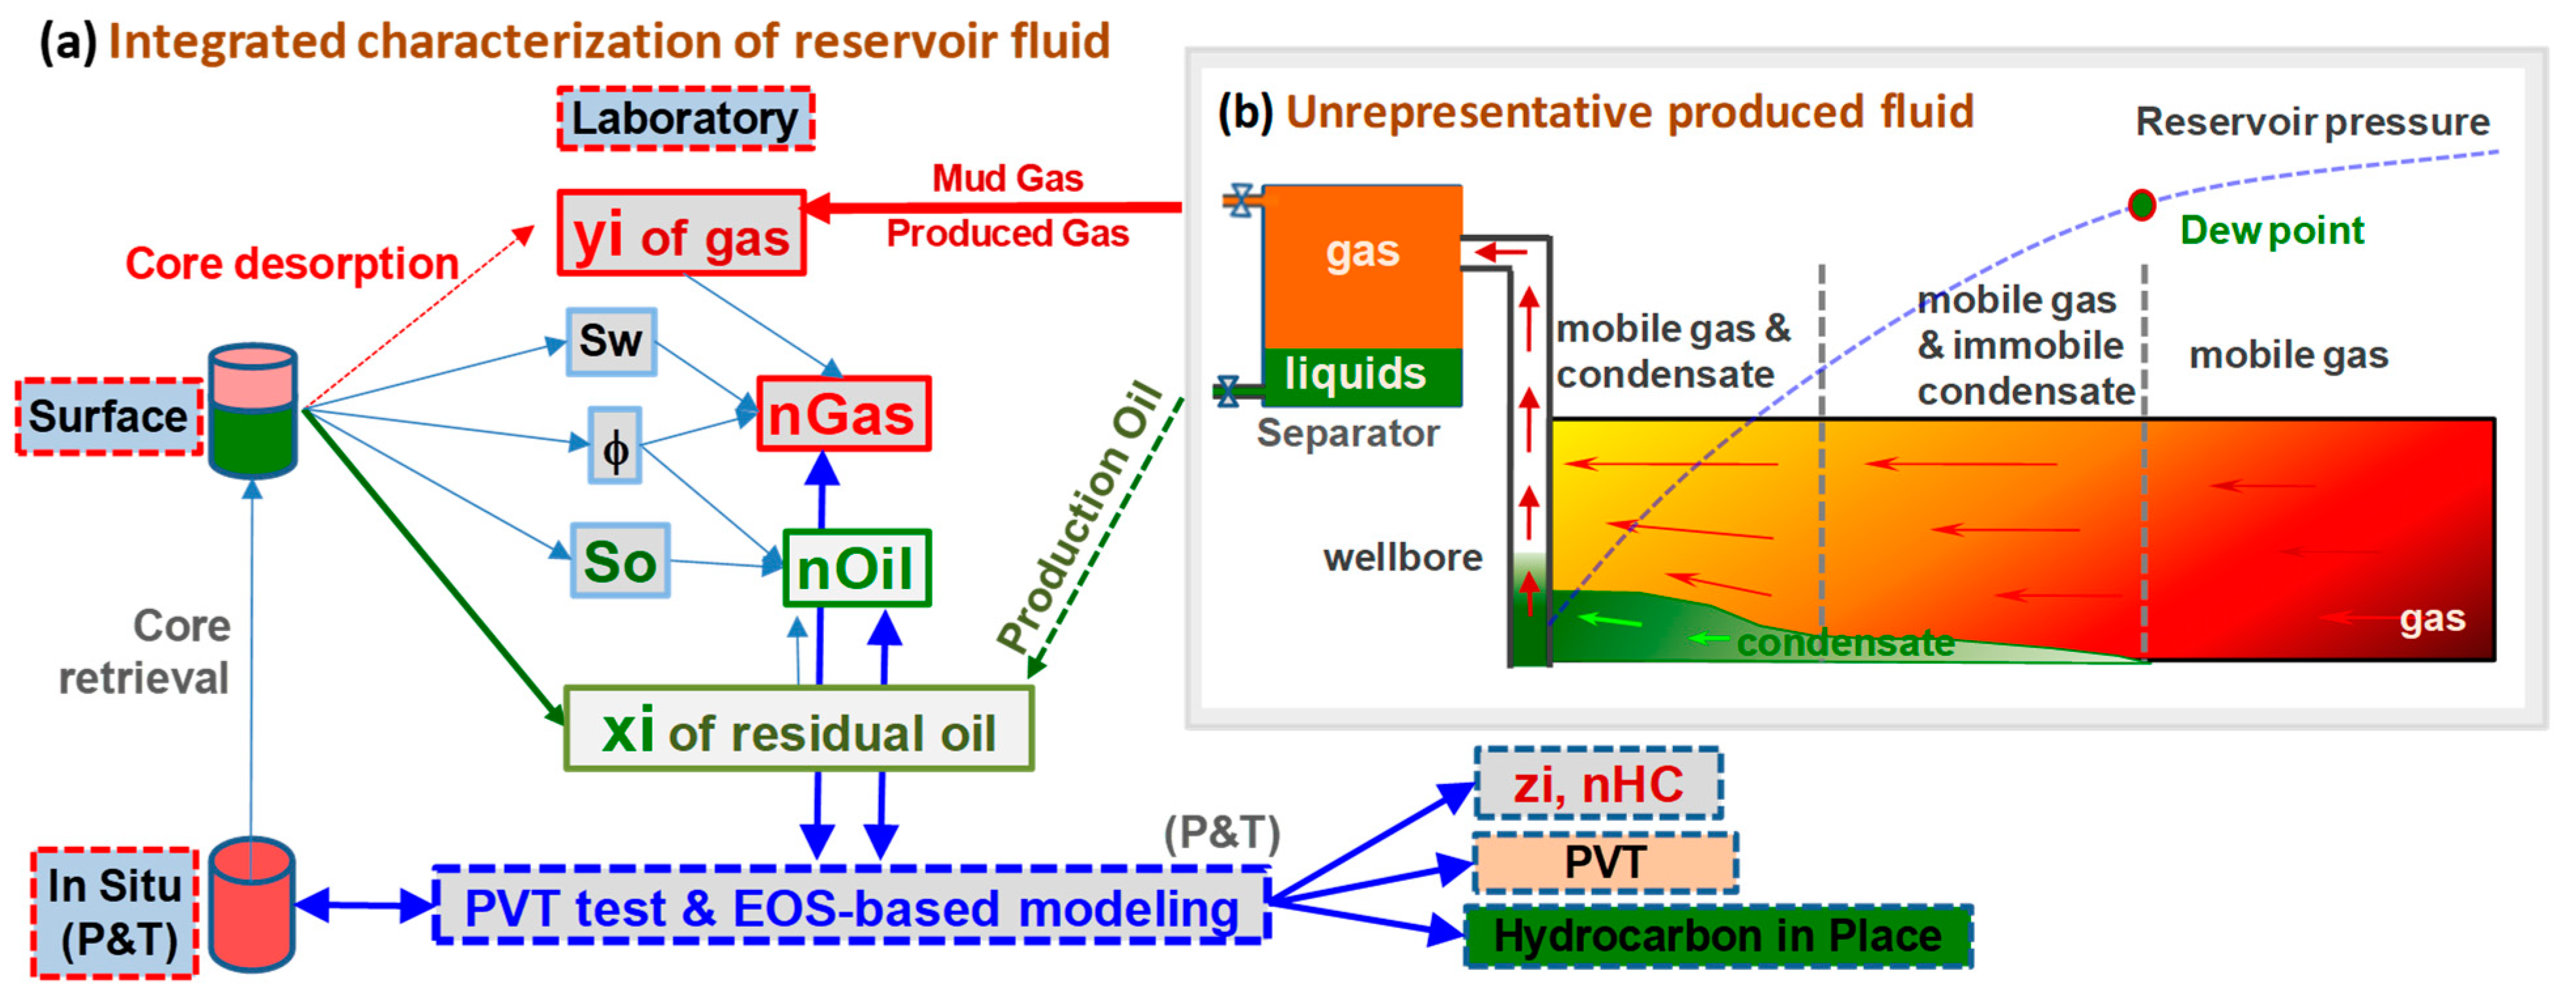
5.3. An Integrated Approach for a Better Hydrocarbon-in-Place Assessment

Accurate assessments of initial hydrocarbons-in-place are essential to early-stage evaluations of unconventional plays. As discussed in previous sections, there are many parameters required for a well-defined assessment, including porosity, adsorption isotherms, fluid saturations, fluid compositions and PVT properties, and reservoir pressure and temperature. Porosity and residual fluid saturations can be readily determined on preserved and representative cores using properly designed test programs. The accurate characterization of in situ hydrocarbon fluid composition and PVT properties requires unbiased sampling and reliable composition characterization of the fluid, which can be challenging if not impossible for liquid-rich or retrograde condensate gas reservoirs and volatile-oil reservoirs of low-permeability tight siltstone and shale plays [38]. Here, an integrated approach was proposed to overcome these challenges by utilizing the canister core desorption test, routine core analysis, mug gas logging or produced wellhead gas chemistry, and the associated PVT properties for an improved formation evaluation and assessment of hydrocarbons-in-place.
As illustrated in Figure 14a, when cores from liquid-rich tight and shale gas plays are recovered to the surface, decreased temperature and pressure cause the heavy hydrocarbon components, originally in gas phase at reservoir conditions, to be condensed into liquids with the majority of the liquids remaining in the cores. The majority of the gaseous hydrocarbon components can be lost during core retrieval and handling at the surface. Heavier gases captured from canister desorption were analyzed for composition, including the mole ratio yi of each component and the total moles of gas nGas. The liquid hydrocarbons remaining in core samples were analyzed for composition (xi) using the TD-GC technique, and the liquid volume (oil saturation So or moles of oil nOil), porosity (ϕ), and water saturation (Sw) were quantitatively determined by dean-stark extraction and other core analyses. The lost light hydrocarbon components during core recovery could be estimated based on the mud gas logging and analyses acquired during coring and after core retrieval. The lost gases could also be complementarily constrained with analysis of wellhead or surface gas sampling during well tests or productions, if available. As illustrated in Figure 14b, production from low permeability unconventional reservoirs can often lead to a large pressure drawdown in the wellbore and adjacent reservoir, resulting in the condensation of heavy hydrocarbon components and liquid dropout in the wellbore and reservoir. Heavy hydrocarbon components that dropout are unlikely to be produced and sampled; thus, the wellhead fluid or surface samples are mostly enriched in light HC components, which is opposite to what happens to canister core desorption gas samples. Therefore, integration of data from these opposing but complementary processes would afford a better characterization of in situ fluid composition and associated PVT properties.
In the proposed workflow, a representative in situ fluid is obtained through an iterative process using equation-of-state (EOS) based PVT properties and compositional modeling of core retrieval and desorption processes to predict values that match: (a) the measured fluid properties (e.g., desorption gas content and composition, residual liquid hydrocarbon amount and composition, and mud gas or produced gas composition) with the lost gas volume and/or composition as adjustable parameters, and (b) the dynamics (rates and compositions) of canister core desorption gas. The compositional fluid model constrained from core-based simulations can be fine-tuned further with a well test and production data (e.g., fluid compositions and production rates of gas and liquid phases), using single-well compositional reservoir simulations. Core analyses and desorption test data are more readily obtained and better defined than well test or production data or the associated reservoir properties that are rarely available or poorly defined at the early stage of play evaluations. Thus, a core-based compositional simulation to reconstruct a representative model of the in situ reservoir fluid is a more viable approach than a reservoir-based simulation, although a production history match can be applied for reservoir and fluid characterizations of a Montney Formation gas condensate well [39]. The core-based approach has also been successfully applied in estimating the composition of in situ fluids and hydrocarbons-in-place of a retrograde condensate reservoir based on Duvernay well 2, shown in Figure 13f, with significantly reduced uncertainty [17].
It is worth pointing out that the proposed approach for reliable fluid characterization of unconventional reservoirs centers on EOS-based PVT properties and compositional modeling that can be implemented using the open-source software MRST [40] or other commercial software. Ideally, the EOS models would be fine-tuned based on laboratory PVT tests on representative reservoir fluids; however, such representative fluids are rarely available in the early exploration stage. As a first-order approximation, generic cubic EOS (e.g., Peng-Robison [41], SRK EOS [42]) can be used for early-stage evaluations or can be fine-tuned based on basin-wide PVT laboratory tests of hydrocarbon fluids of the same play [43,44]. When combined with core porosity, residual hydrocarbon saturation, and composition data from core analyses, such a fine-tuned EOS model will significantly improve the accuracy in the estimation of native hydrocarbon fluid composition and can be further fine-tuned by EOS-based modeling to match observed laboratory and field production data. The resulting EOS-based PVT property and compositional models can then be applied with confidence to optimize well completion and stimulation, as well as other reservoir engineering operations, to maximize hydrocarbon recovery.

6. Conclusions

A large data set of canister core desorption tests from nine Montney Formation wells in northeastern British Columbia were reviewed and analyzed. We proposed an integrated approach to apply canister core desorption data for the improved characterization of in situ reservoir fluid and resource assessment of hydrocarbons-in-place for tight and shale reservoirs. The main findings from this study are summarized as follows:
(1)
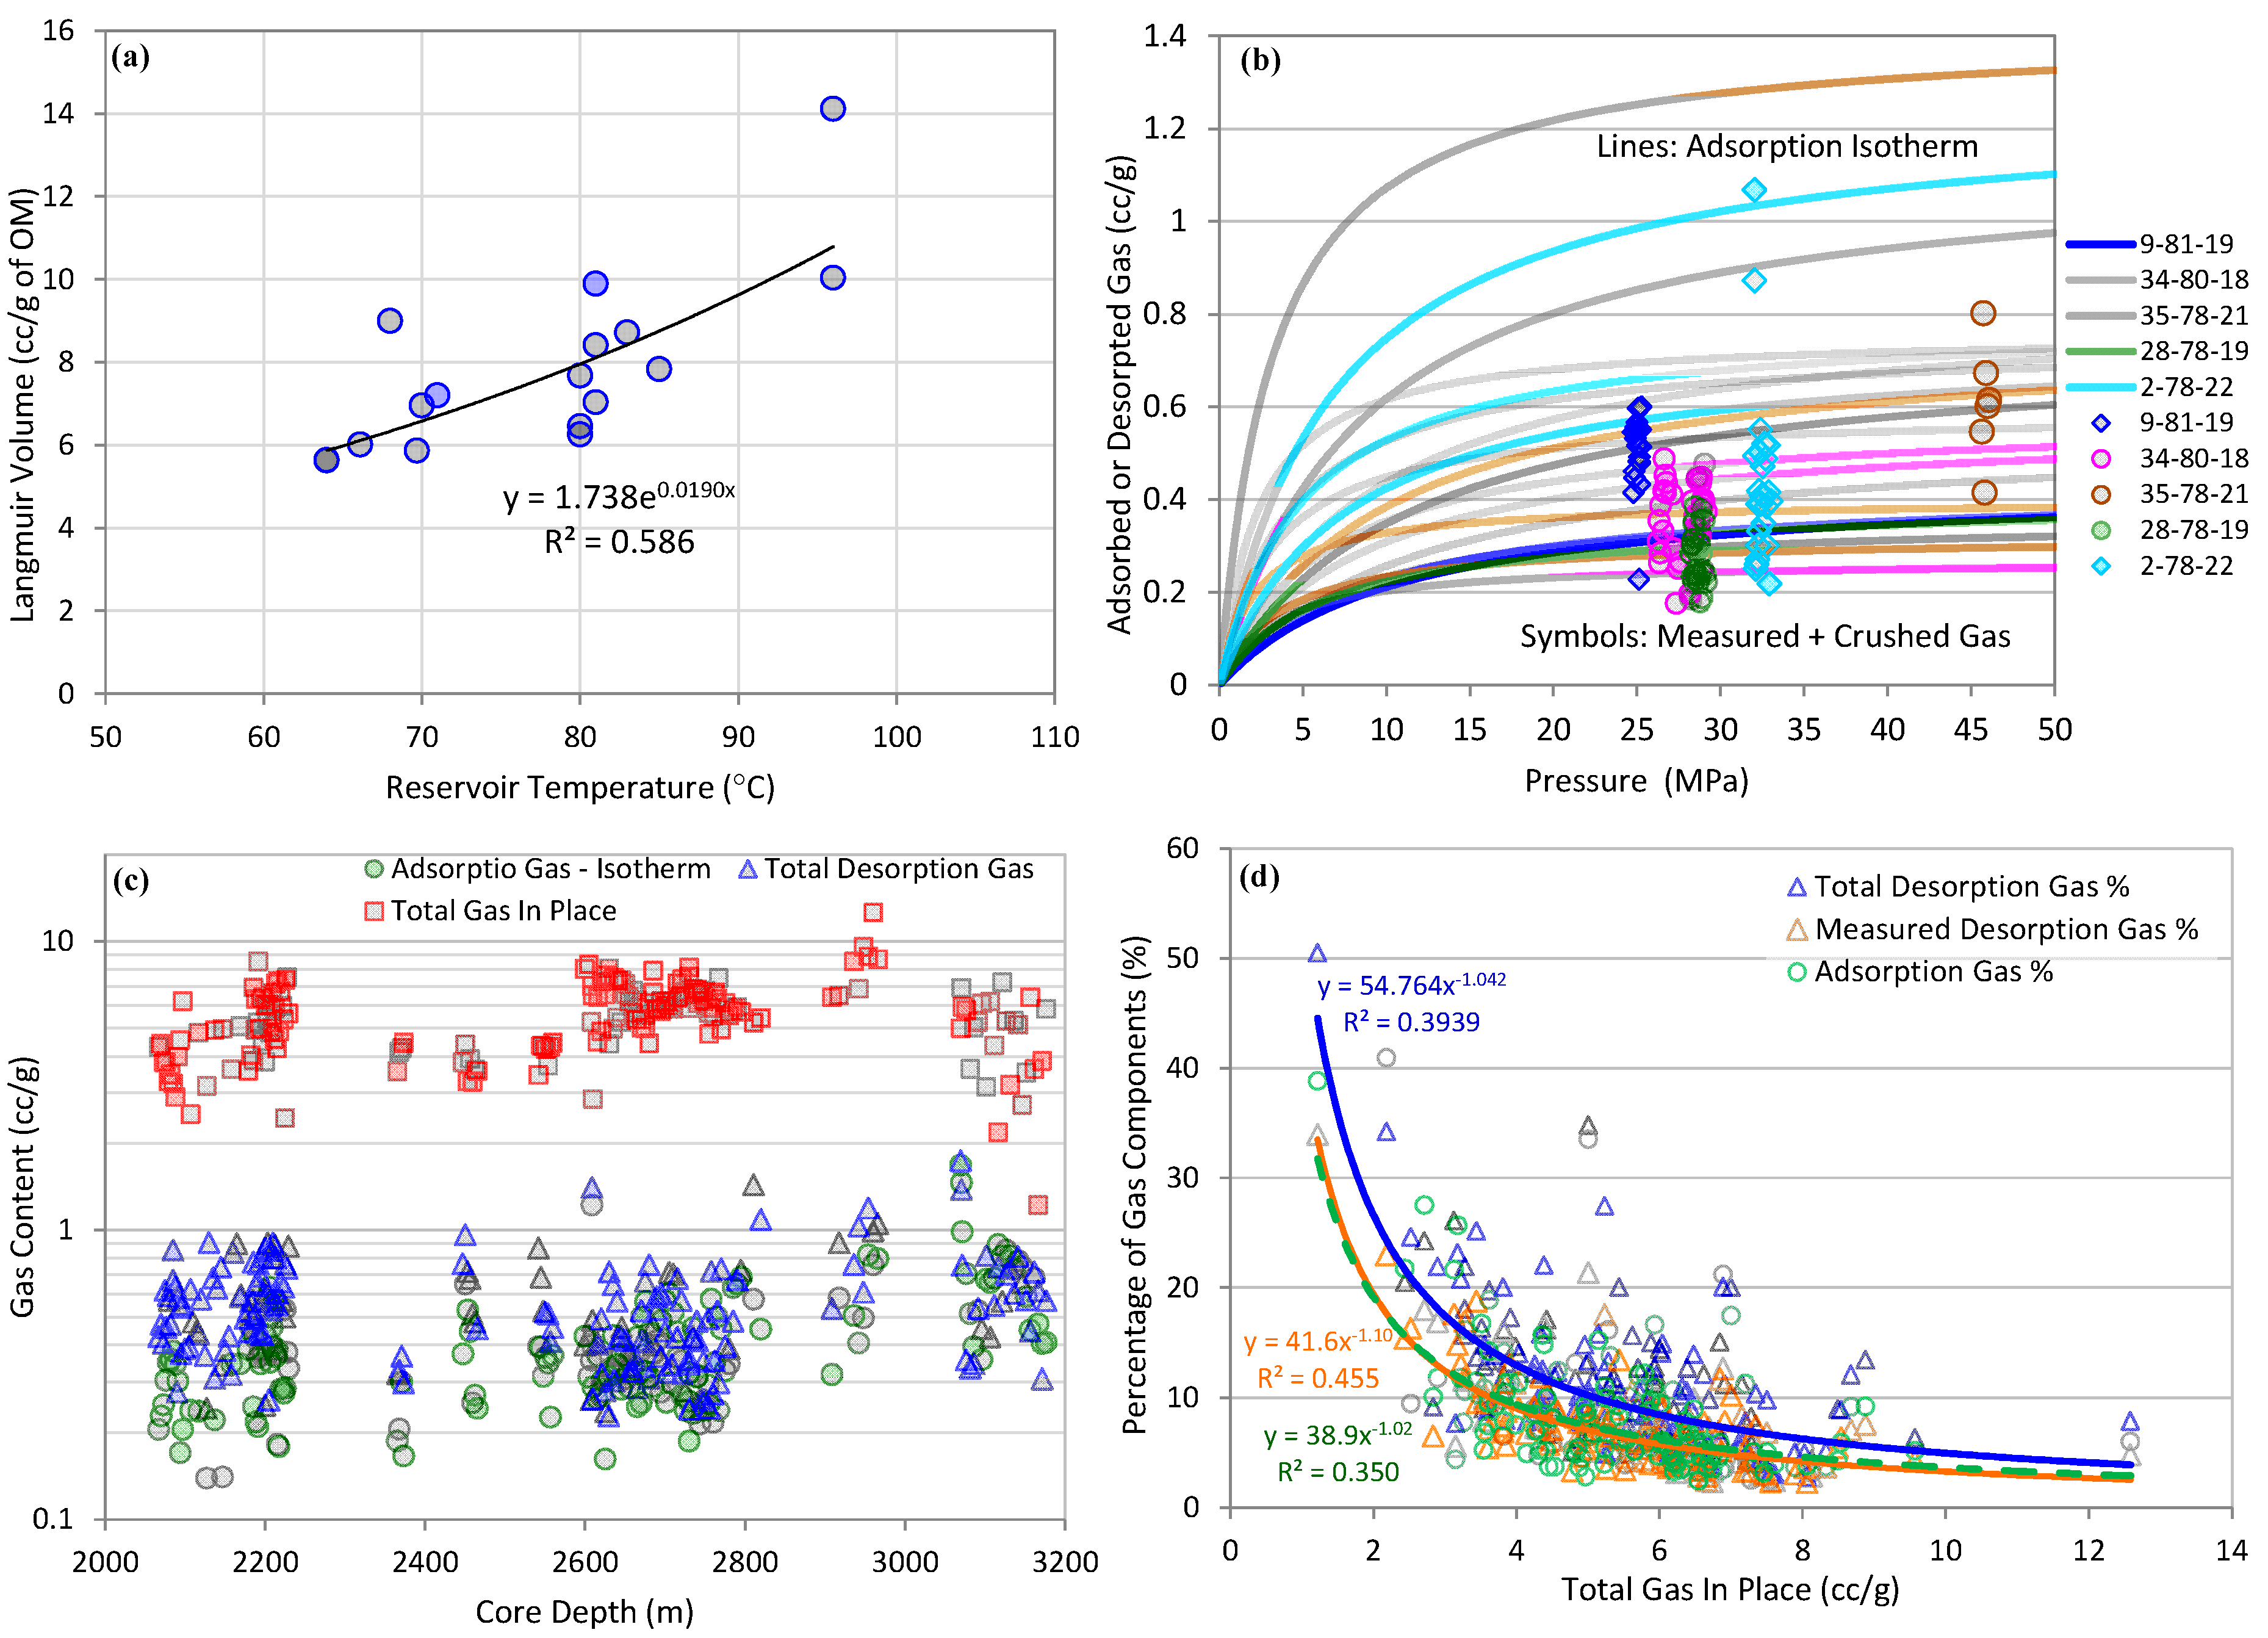
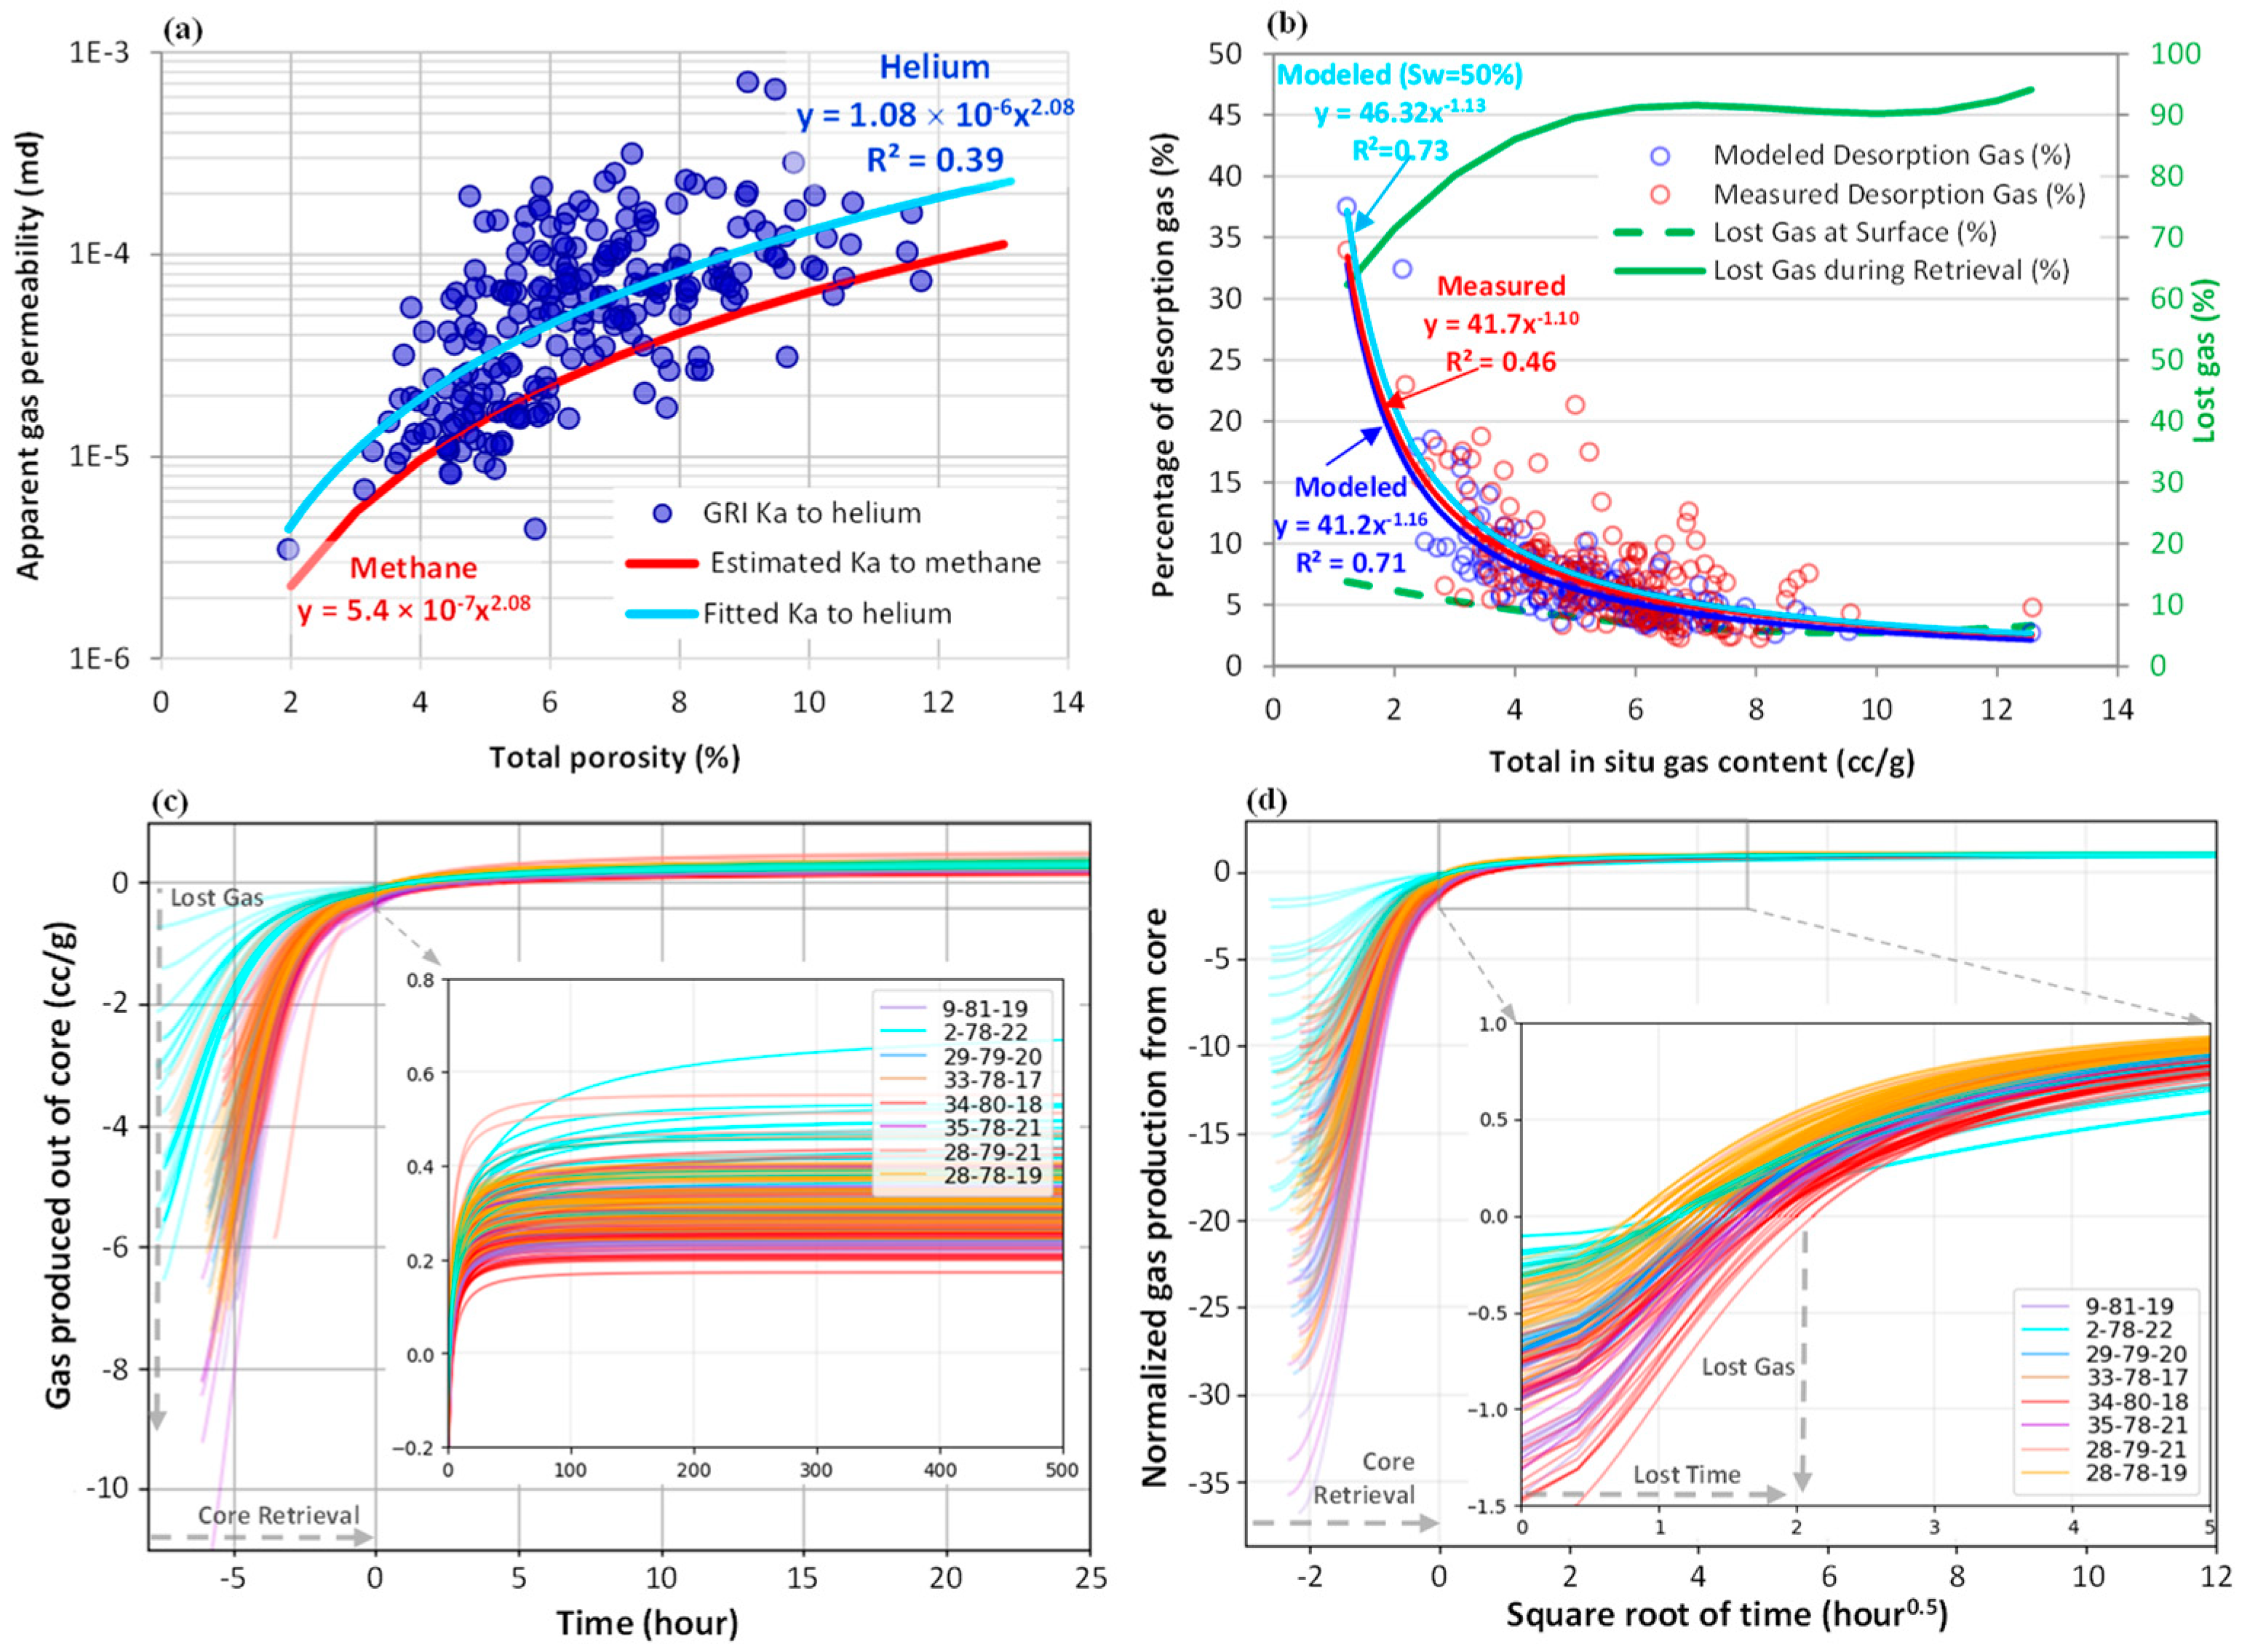
For the tight siltstone Montney Formation play, canister core desorption captured less than 25% of total gas-in-place, which was minor but significant. Up to 60–90% of the total gas-in-place, mainly free gas, was lost during core recovery, and less than 10% of gas was lost at the surface before canister core desorption.
(2)
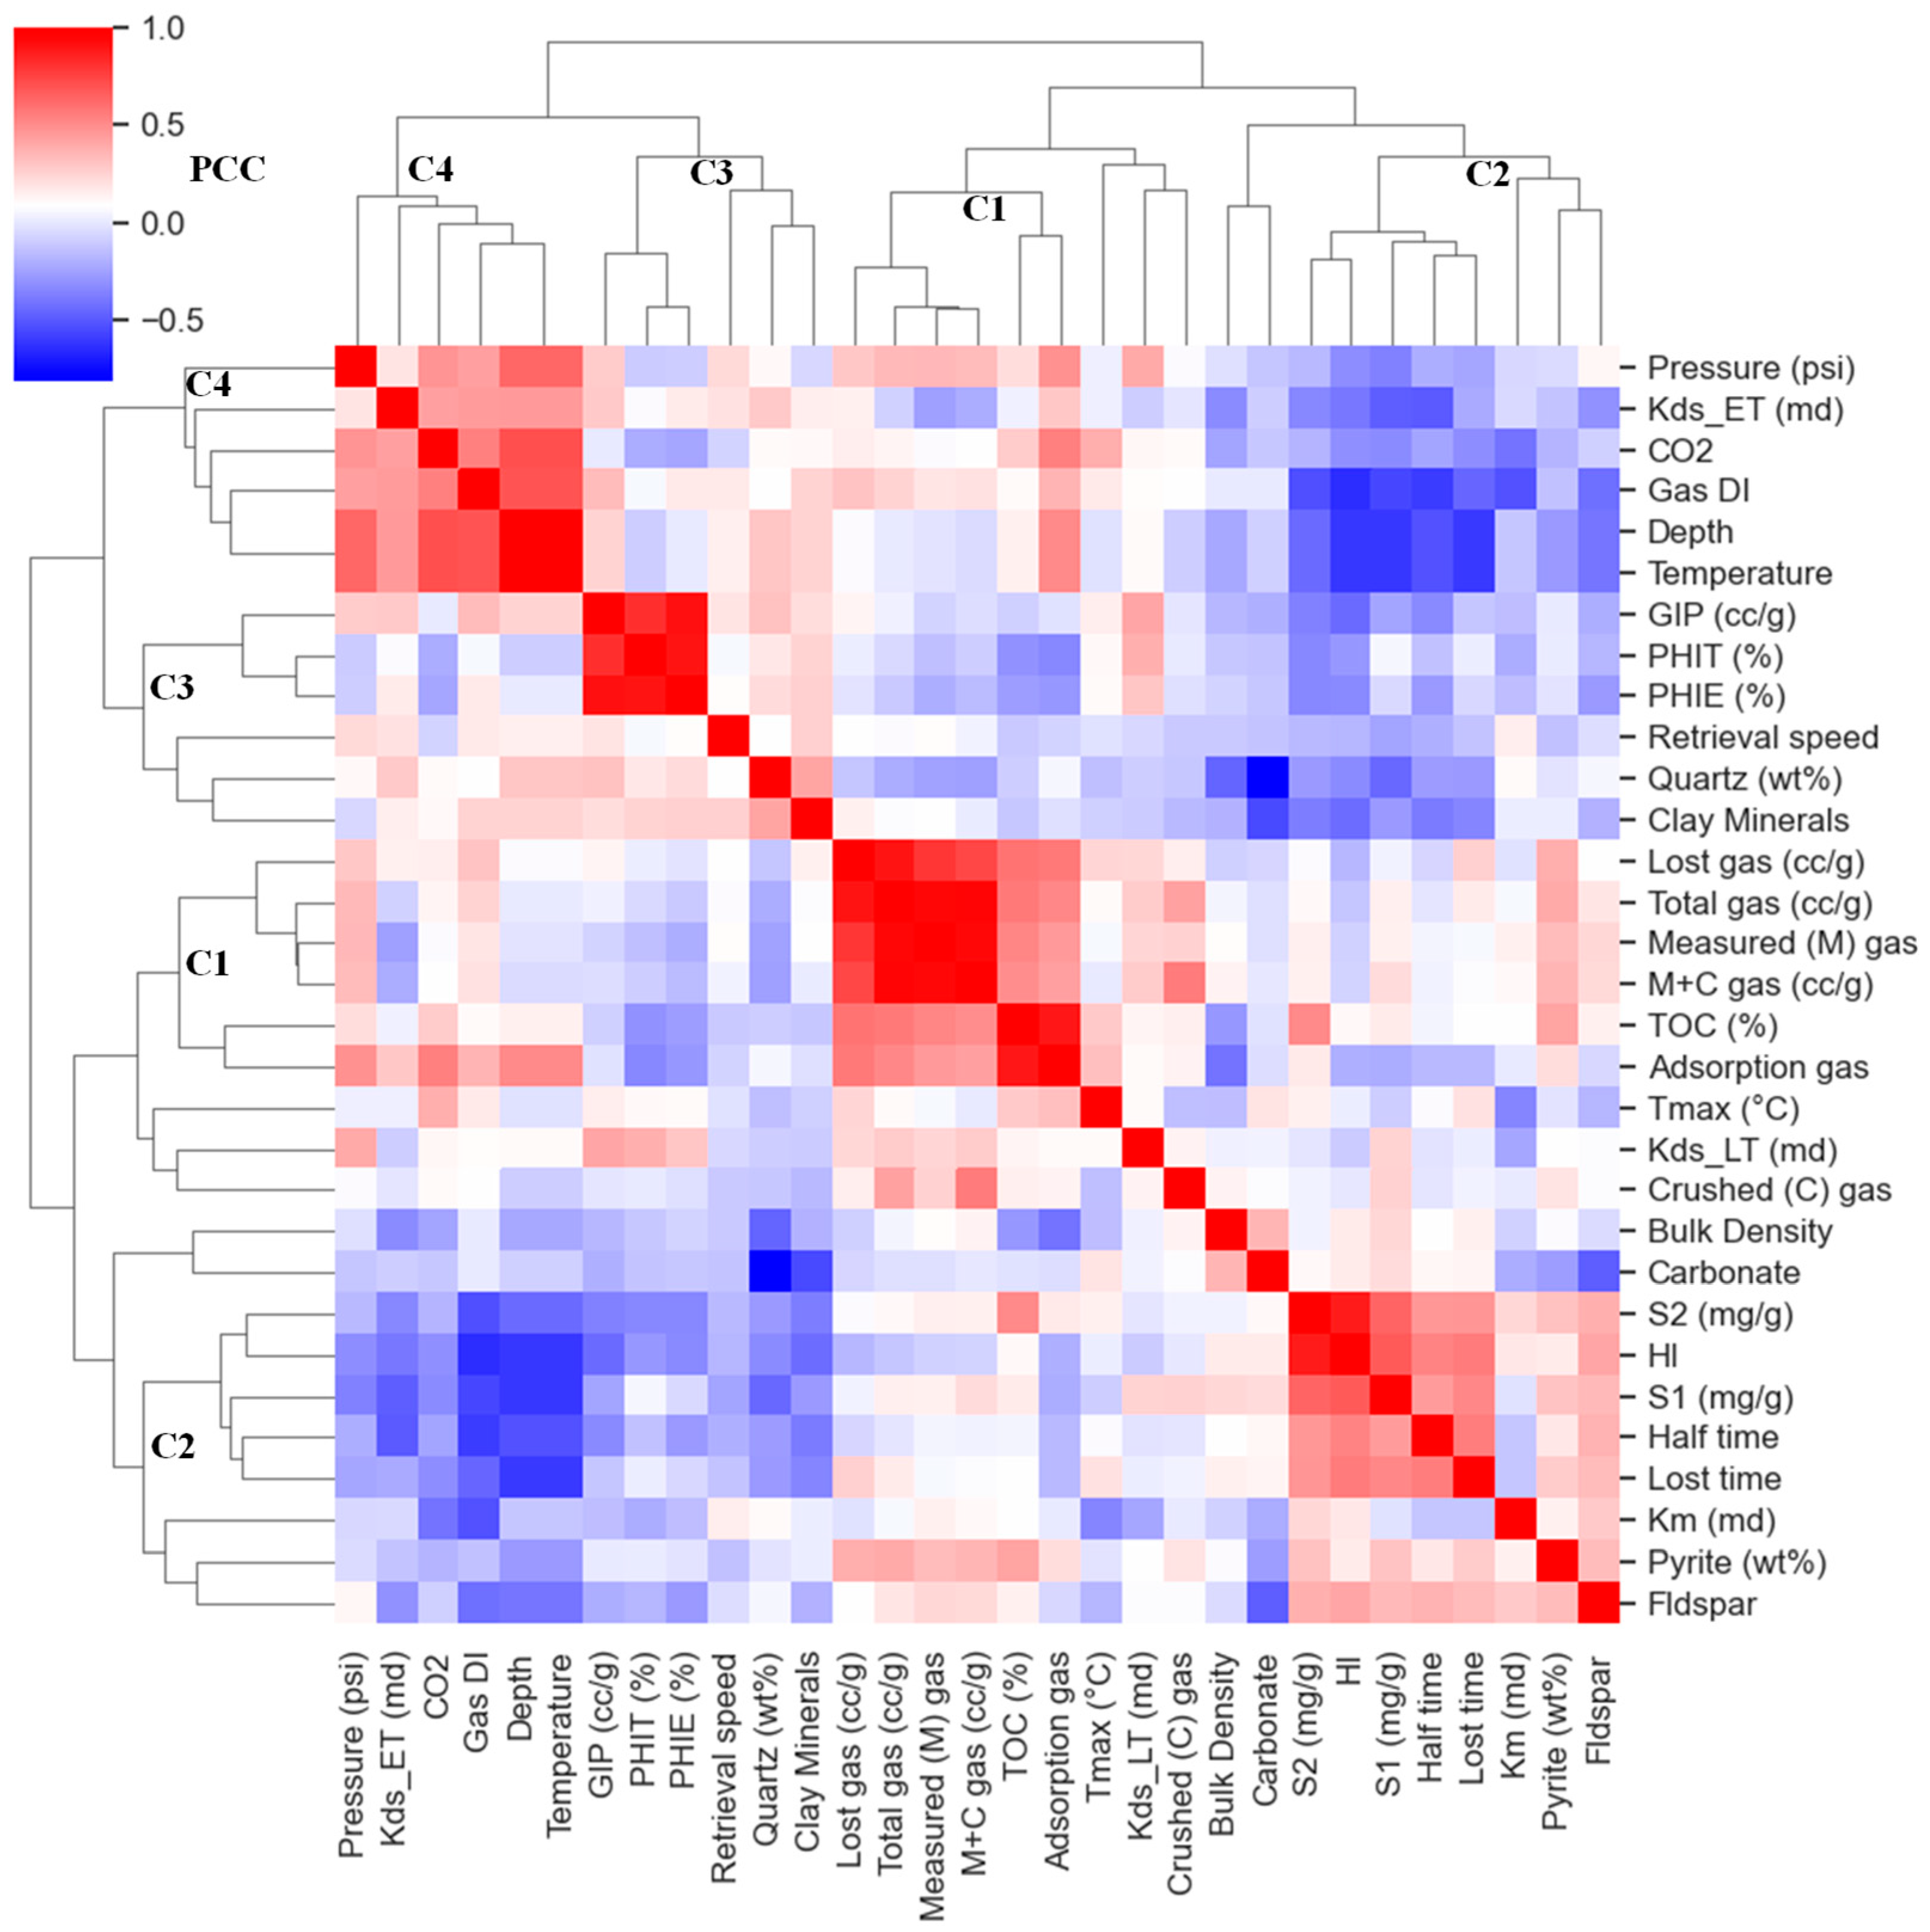
Measured desorption gas was mostly released from adsorbed gas in organic matter, as the gas content was strongly and positively correlated with TOC, negatively correlated with better reservoir qualities (i.e., higher porosity), and weakly or not correlated with mineralogy (especially clay minerals), core retrieval speed, and lost gas time at surface.
(3)
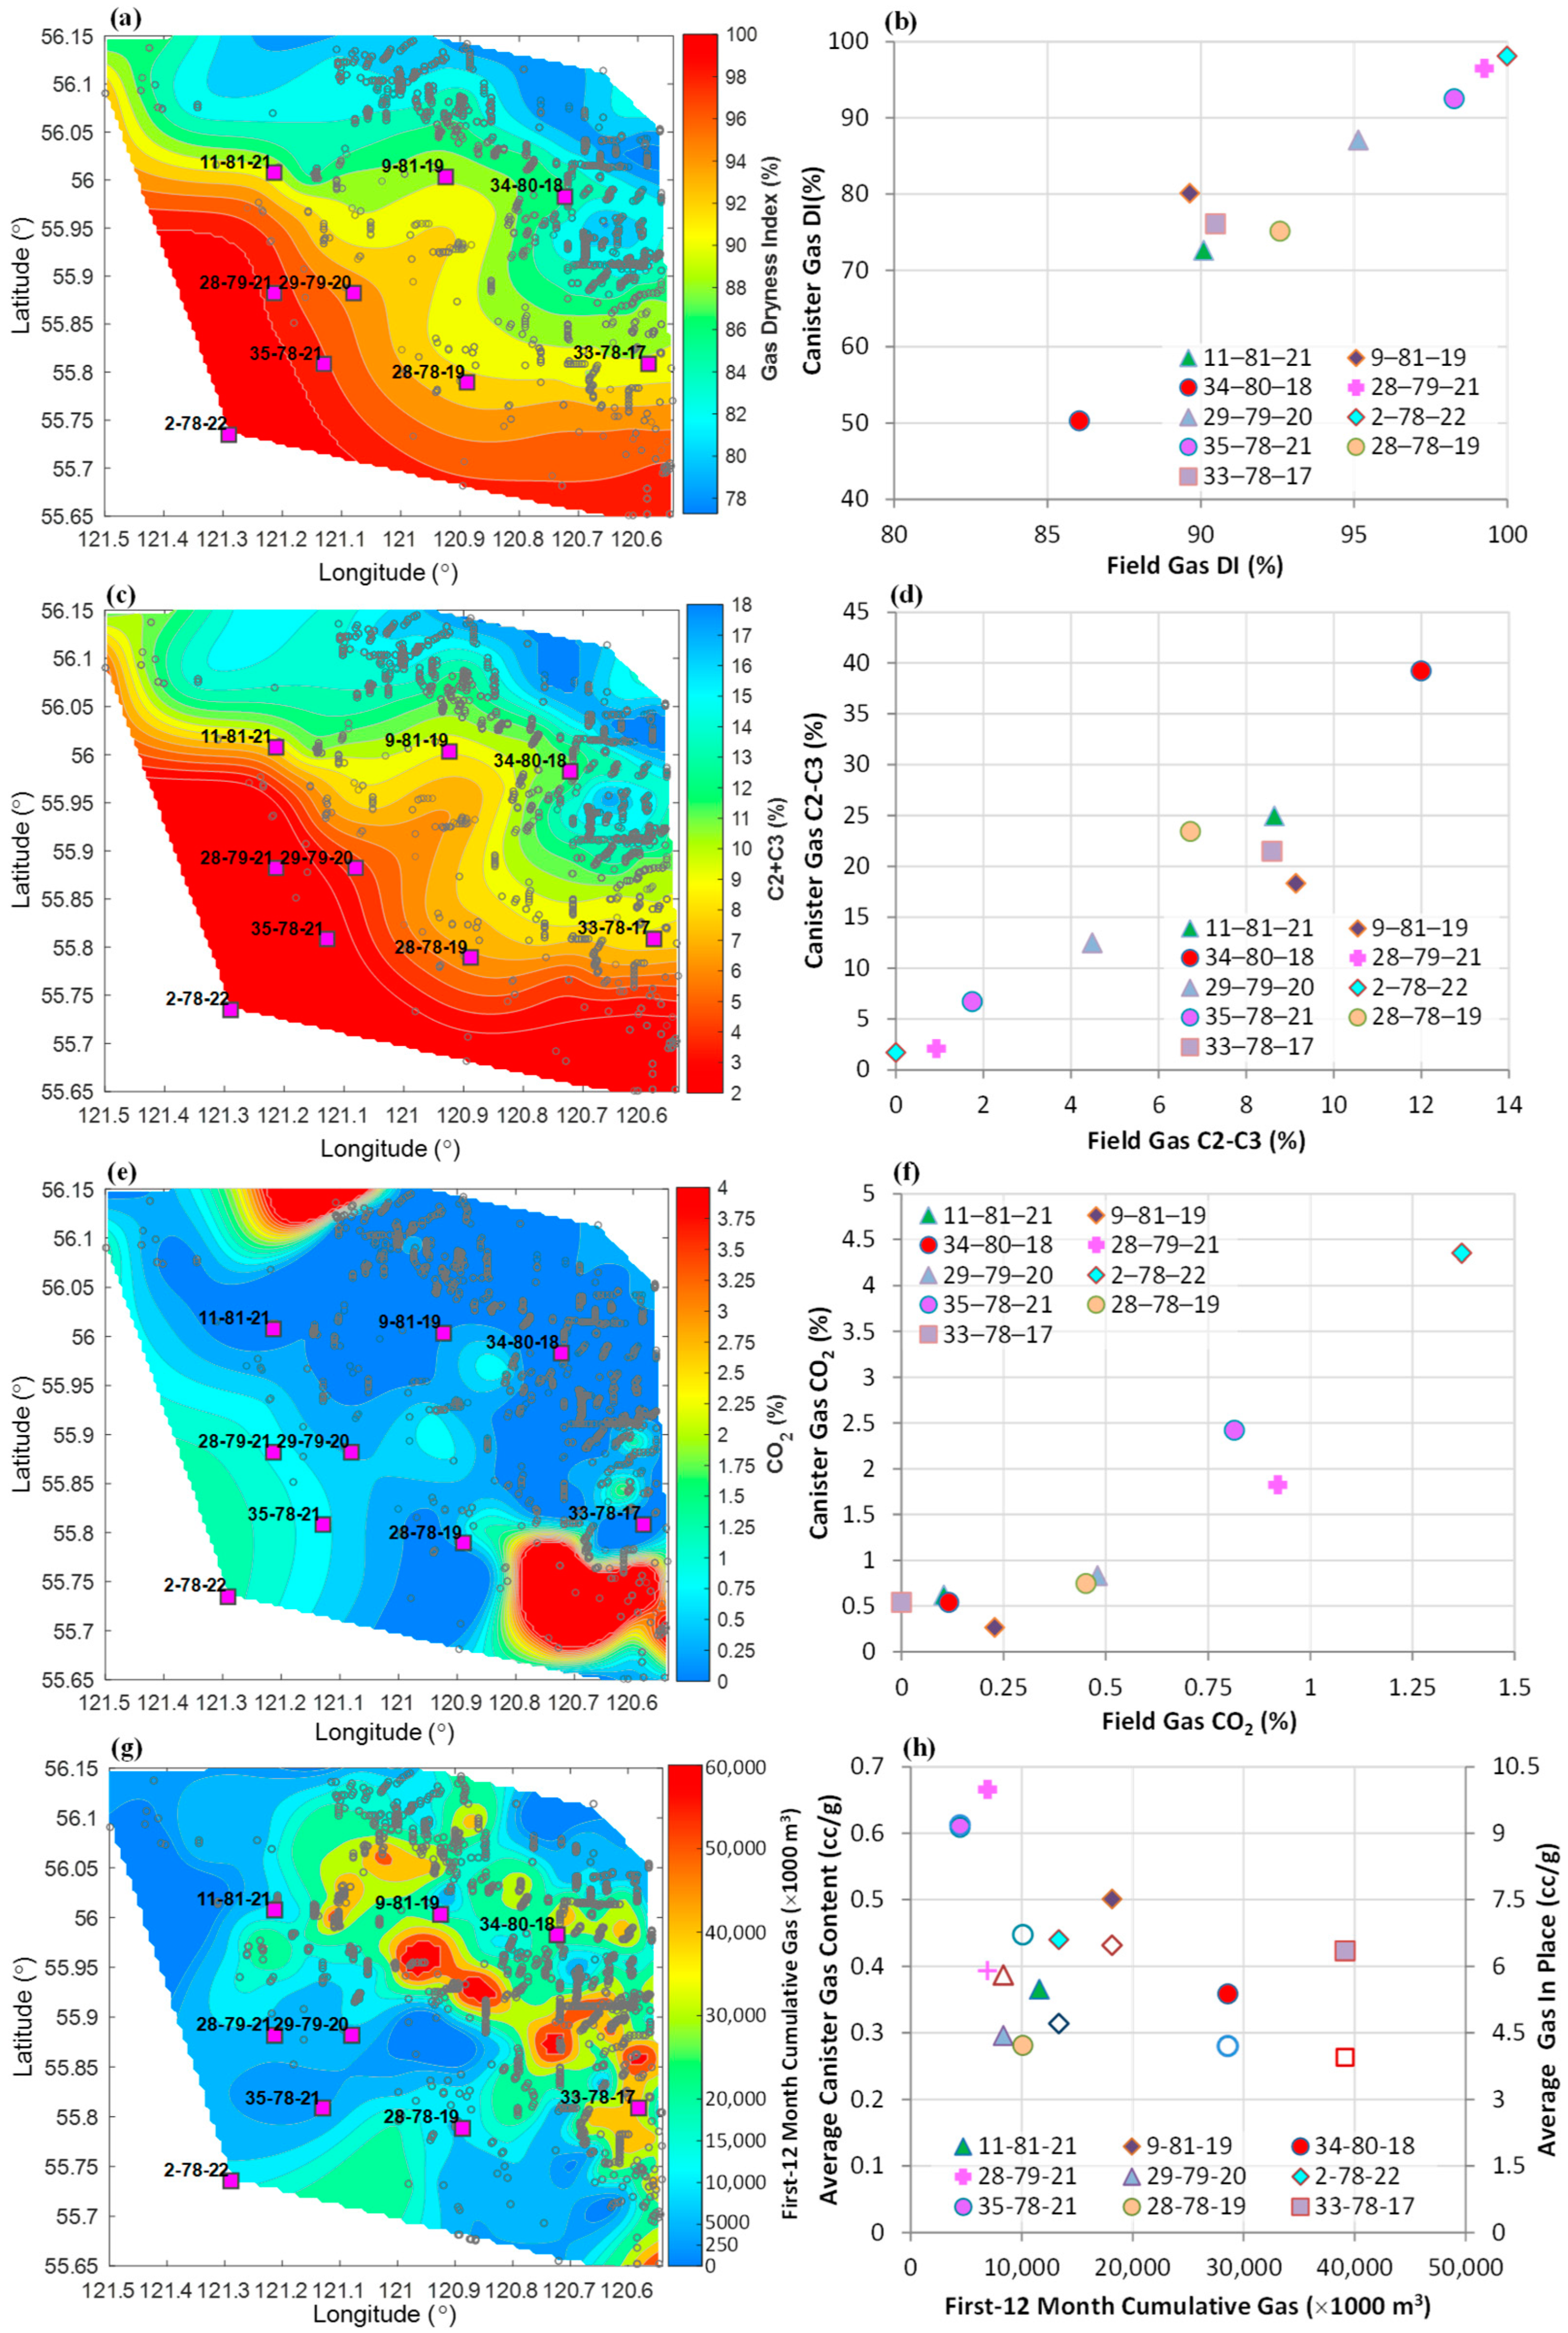
The bulk composition of canister core desorption gas was strongly correlated with the produced hydrocarbon fluids in the same area, but was systematically enriched in heavier components compared with the produced gas in liquid-rich reservoirs.
(4)
Desorption gas composition evolved distinctly with desorption time for different types of reservoirs, likely due to the differential adsorption and diffusion of gases in microporous rocks and/or compositional fractionation of liquid-rich or retrograde condensate gas reservoir fluids.
Overall, only a low percentage of total gas-in-place of tight reservoirs can be captured by canister core desorption tests, and the existing empirical methods based on canister desorption tests can significantly underestimate the lost gas content, and hence, the total gas content, even though it is the most highly sought parameter in current industrial practices. Nevertheless, the currently underutilized canister core desorption test data can provide invaluable information, especially on hydrocarbon compositional properties. This data should be comprehensively and systematically exploited in combination with core and well production or test data, as proposed in this study, to reduce the uncertainties associated with the evaluation and exploitation of unconventional liquid-rich plays.

Author Contributions

X.C., conceptualization, data curation, investigation, methodology, software, validation, writing—original draft; C.J., conception, investigation, resources, writing—review & editing; B.N., conceptualization, review & editing. J.W., conceptualization, review & editing. All authors have read and agreed to the published version of the manuscript.

Funding

This research received no external funding.

Acknowledgments

We acknowledge AGAT Laboratories Ltd. for assisting the authors in this study. The study was also supported by Geological Survey of Canada’s GNES (Geoscience for New Energy Supply) research program. This is Geological Survey of Canada NRCan Contribution #20220227.

Conflicts of Interest

The authors declare no conflict of interest.

References

  1. Cramer, S.D. Solubility of methane in brines from 0 to 300 °C. Ind. Eng. Chem. Proc. Des. Dev. 1984, 23, 533. [Google Scholar] [CrossRef]
  2. Sørensen, H.; Pedersen, K.S.; Christensen, P.L. Modeling of gas solubility in brine. Org. Geochem. 2002, 33, 635–642. [Google Scholar] [CrossRef]
  3. Bertard, C.; Bruyet, B.; Gunther, J. Determination of desorbable gas concentration of coal (direct method). Int. J. Rock Mech. Min. Sci. 1970, 7, 43–65. [Google Scholar] [CrossRef]
  4. Kissell, F.N.; McCulloch, C.M.; Elder, C.H. The direct method of determining methane content of coalbeds for ventilation design. In U.S. Bureau of Mines Report of Investigations 7767; U.S. Bureau of Mines: Washington, DC, USA, 1973; 22p. [Google Scholar]
  5. Diamond, W.P.; Levine, J.R. Direct method determination of the gas content of coal—Procedures and results. In U.S. Bureau of Mines Report of Investigations 8515; U.S. Bureau of Mines: Washington, DC, USA, 1981; 36p. [Google Scholar]
  6. Cui, X.; Nassichuk, B. Permeability of the Montney Formation in the Western Canada Sedimentary Basin: Insights from different laboratory measurements. Bull. Can. Pet. Geol. 2018, 66, 394–424. [Google Scholar]
  7. Yang, I.H.; Lee, H.S. Desorbed gas volume estimation using conventional well-log data for the Montney Formation, Deep Basin, Canada. J. Pet. Sci. Eng. 2018, 162, 633–651. [Google Scholar] [CrossRef]
  8. Song, I.H.; Lee, S.; Shin, H. Three-dimensional modelling of desorbed gas volume and comparison to gas production rate in the Montney Plays, Western Canadian Sedimentary Basin. Geofluids 2021, 2021, 6674183. [Google Scholar] [CrossRef]
  9. Kang, S.; Lu, L.; Tian, H.; Yang, Y.; Jiang, C.; Ma, Q. Numerical simulation based on the canister test for shale gas content calculation. Energies 2021, 14, 6518. [Google Scholar] [CrossRef]
  10. Han, H.; Zhang, J. Canister desorption method for shale gas content measurement. Adv. Resour. Res. 2021, 1, 20–27. [Google Scholar] [CrossRef]
  11. Dang, W.; Zhang, J.-C.; Tang, X.; Wei, X.-L.; Li, Z.-M.; Wang, C.-H.; Chen, Q.; Liu, C. Investigation of gas content of organic-rich shale: A case study from Lower Permian shale in southern North China Basin, central China. Geosci. Front. 2018, 9, 559–575. [Google Scholar] [CrossRef]
  12. Nie, H.; Yang, Z.; Dang, W.; Chen, Q.; Li, P.; Li, D.; Wang, R. Study of shale gas release from freshly drilled core samples using a real-time canister monitoring technique: Release kinetics, influencing factors, and upscaling. Energy Fuels 2020, 34, 2916–2924. [Google Scholar] [CrossRef]
  13. Hosseini, S.A.; Javadpour, F.; Michael, G.E. Novel analytical core-sample analysis indicates higher gas content in shale-gas reservoirs. SPE J. 2015, 20, 1397–1408. [Google Scholar] [CrossRef]
  14. He, J.; Tang, J.; Lu, Z.; Wang, L.; Zhou, J.; Tang, B. A method for calculating loss of shale gas during coring based on forward modeling. Energy Sci. Eng. 2021, 9, 447–460. [Google Scholar] [CrossRef]
  15. Carlsen, M.L.; Whitson, C.H.; Alavian, A.; Martinsen, S.Ø.; Mydland, S.; Singh, K.; Younus, B.; Yusra, I. Fluid sampling in tight unconventionals, SPE-196056-MS, 2019. In Proceedings of the SPE Annual Technical Conference and Exhibition, Calgary, AB, Canada, 30 September–2 October 2019. [Google Scholar]
  16. Euzen, T.; Watson, N.; Cui, X.; Wilson, J.; Cronkwright, D. Mapping liquid recovery potential in an unconventional play: A practical approach integrating geology, geochemistry and PVT properties (Montney Fm., Canada). In Proceedings of the 8th Unconventional Resources Technology Conference, Virtual, 20–22 July 2020. [Google Scholar] [CrossRef]
  17. Cui, X.; Wilson, J. An integrated approach to determine the hydrocarbon compositions and PVT properties of unconventional gas condensate reservoirs, extended abstract. In Proceedings of the Geoconvention, Calgary, AB, Canada, 13–17 May 2019. [Google Scholar]
  18. Edwards, D.E.; Barclay, J.E.; Gibson, D.W.; Kvill, G.E.; Halton, E. Triassic strata of the Western Canada Sedimentary Basin. In Geological Atlas of the Western Canada Sedimentary Basin; Mossop, G.D., Shetsen, I., Eds.; Canadian Society of Petroleum Geologists and Alberta Research Council: Edmonton, AB, Canada, 1994; pp. 1–18. [Google Scholar]
  19. NEB. Energy Briefing Note: The ultimate potential for unconventional petroleum from the Montney Formation of British Columbia and Alberta; National Energy Board, Alberta Energy Regulator, British Columbia Oil and Gas Commission, and British Columbia Ministry of Natural Gas Development: Calgary, AB, Canada, 2013; ISSN 1917-506X. [Google Scholar]
  20. Diamond, W.P.; LaScola, J.C.; Hyman, D.M. Results of direct-method determination of the gas content of US coalbeds. In U.S. Bureau of Mines Information Circular 9067; U.S. Bureau of Mines: Washington, DC, USA, 1986; Volume 95. [Google Scholar]
  21. Smith, D.M.; Williams, F.L. Direct method of determining the methane content of coal d a modification. Fuel 1984, 63, 425–427. [Google Scholar] [CrossRef]
  22. Yee, D.; Seidle, J.P.; Hanson, W.B. Gas sorption on coal and measurement of gas content. In Hydrocarbons from Coal; Law, B.E., Rice, D.D., Eds.; American Association of Petroleum Geologists, Studies in Geology: Tulsa, OK, USA, 1993; Volume 38, pp. 203–218. [Google Scholar]
  23. Yuan, W.; Pan, Z.; Li, X.; Yang, Y.; Zhao, C.; Connell, L.D.; Li, S.; He, J. Experimental study and modelling of methane adsorption and diffusion in shale. Fuel 2014, 117, 509–519. [Google Scholar] [CrossRef]
  24. Cui, X.; Bustin, A.M.M.; Bustin, R.M. Measurements of gas permeability and diffusivity of tight reservoir rocks: Different approaches and their applications. Geofluids 2009, 9, 208–223. [Google Scholar] [CrossRef]
  25. Wood, J.M.; Sanei, H.; Curtis, M.E.; Clarkson, C.R. Solid bitumen as a determinant of reservoir quality in an unconventional tight gas siltstone play. Int. J. Coal Geol. 2015, 150–151, 287–295. [Google Scholar] [CrossRef]
  26. Zhang, T.; Ellis, G.S.; Ruppel, S.C.; Milliken, K.; Yang, R. Effect of organic-matter type and thermal maturity on methane adsorption, in shale-gas systems. Org. Geochem. 2012, 47, 120–131. [Google Scholar] [CrossRef]
  27. Zou, J.; Rezaee, R.; Liu, K. The effect of temperature on methane adsorption in shale gas reservoirs. Energy Fuels 2017, 31, 12081–12092. [Google Scholar] [CrossRef]
  28. Gao, Z.; Ma, D.; Chen, Y.; Zheng, C.; Teng, J. Study for the effect of temperature on methane desorption based on thermodynamics and kinetics. ACS Omega 2021, 6, 702–714. [Google Scholar] [CrossRef]
  29. Huber, M.L. NIST Thermophysical Properties of Hydrocarbon Mixtures Database (SUPPERTRAPP); version 3.2; NIST Standard Reference Database 4; National Institute of Standards and Technology: Gaithersburg, MD, USA, 2007.
  30. Robertson, E.C. Thermal properties of rocks. In Open-File Report 88-441; United State Department of the Interior Geological Survey: Reston, VA, USA, 1988. [Google Scholar]
  31. Krogstad, S.; Lie, K.-A.; Møyner, O.; Nilsen, H.M.; Raynaud, X.; Skaflestad, B. MRST-AD—An open-source framework for rapid prototyping and evaluation of reservoir simulation problems. In Proceedings of the 2015 Reservoir Simulation Symposium, Houston, TX, USA, 23–25 February 2015. [Google Scholar] [CrossRef] [Green Version]
  32. Cui, X.; Brezovski, R. Laboratory permeability and diffusivity measurements of unconventional reservoirs: Useless or full of information? A Montney example from the Western Canadian Sedimentary Basin. In Proceedings of the Unconventional Resources Conference and Exhibition—Asia Pacific, Brisbane, Australia, 11–13 November 2013. SPE167047. [Google Scholar]
  33. Vaisblat, N.; Harrisa, N.B.; Ayranci, K.; Chalaturnyk, R.; Power, M.; Twemlow, C.; Minion, N. Petrophysical properties of a siltstone reservoir—An example from the Montney Formation, western Canada. Mar. Pet. Geol. 2022, 136, 105431. [Google Scholar] [CrossRef]
  34. Quirk, D.J.; Cui, X. Integration of Montney microseismic information into a reservoir simulator to analyze a horizontal wellbore with multiple fracture stages. In Proceedings of the Canadian Unconventional Resources and International Petroleum Conference, Calgary, AB, Canada, 19–21 October 2010. SPE-136700-MS. [Google Scholar] [CrossRef]
  35. Cui, X.; Bustin, R.M.; Dipple, G. Selective transport of CO2, CH4, and N2 in coals: Insights from modeling of experimental gas adsorption data. Fuel 2004, 83, 293–303. [Google Scholar] [CrossRef]
  36. Cui, X.; Bustin, R.M. Controls of coal fabric on coalbed gas production and compositional shift in both field production and canister desorption test. SPE J. 2006, 11, 111–119. [Google Scholar] [CrossRef]
  37. Chareonsuppanimit, P.; Mohammad, S.A.; Robinson, R.L., Jr.; Gasem, K.A.M. High-pressure adsorption of gases on shales: Measurements and modeling. Int. J. Coal Geol. 2012, 95, 34–46. [Google Scholar] [CrossRef]
  38. Kool, H.; Azari, M.; Soliman, M.Y.; Proett, M.A.; Irani, C.A.; Dybdahl, B. Testing of gas condensate reservoirs—Sampling, test design and analysis. In Proceedings of the SPE Asia Pacific Oil and Gas Conference and Exhibition, Jakarta, Indonesia, 17–19 April 2001. [Google Scholar]
  39. Behmanesh, H.; Hamdi, H.; Clarkson, C.R. Reservoir and fluid characterization of a tight gas condensate well in the Montney Formation using recombination of separator samples and black oil history matching. J. Nat. Gas Sci. Eng. 2018, 49, 227–240. [Google Scholar] [CrossRef]
  40. Lie, K.-A. An Introduction to Reservoir Simulation Using MATLAB/GNU Octave: User Guide for the MATLAB Reservoir Simulation Toolbox (MRST); Cambridge University Press: Cambridge, UK, 2019. [Google Scholar]
  41. Peng, D.Y.; Robinson, D.B. A New-Constant Equation of State. Ind. Eng. Chem. 1976, 15, 59. [Google Scholar] [CrossRef]
  42. Soave, G. Equilibrium constants from a modified Redlich-Kwong equation of state. Chem. Eng. Sci. 1972, 27, 1197. [Google Scholar] [CrossRef]
  43. Younus, B.; Whitson, C.H.; Alavian, A.; Carlsen, M.L.; Martinsen, S.Ø.; Singh, K. Field-wide equation of state model development. In Proceedings of the Unconventional Resources Technology Conference, Denver, CO, USA, 22–24 July 2019. URTeC-55. [Google Scholar]
  44. Whitson, C.H.; Sunjerga, S. PVT in liquid-rich shale reservoirs. In Proceedings of the SPE Annual Technical Conference and Exhibition, San Antonio, TX, USA, 8–10 October 2012. SPE 155499. [Google Scholar]
Figure 1. Schematic illustration of the various components of total hydrocarbons-in-place for unconventional liquid-rich reservoirs.
Minerals 12 01226 g001
Figure 2. Study area and sample well locations: (a) map showing the distribution of lithofacies of the Montney Formation in the Western Canada Sedimentary Basin (after Cui and Nassichuk [6]); (b) depth contour map of the formation top of the Upper Montney Formation in the study area based on 1020 production wells represented by the gray open circles. The purple squares represent the Montney Formation wells selected for the canister core desorption tests included in this study.
Minerals 12 01226 g002
Figure 3. Canister core desorption data for 230 Montney Formation samples from nine wells: (a) cumulative desorption gas content versus time; (b) normalized desorption gas content versus the square root of desorption time; and (c) an insert with zoomed-in data showing estimated lost gas. Samples from the same well have the same color. The time zero is defined as the moment when cores are recovered to the surface at well sites, and zero gas content is defined as the beginning of canister desorption; therefore, lost gas contents are shown to be negative values in (c).
Minerals 12 01226 g003
Figure 4. Effects of operation parameters on canister core desorption gas contents: (a) core depths; (b) core recovery or retrieval speed; and (c) lost gas time at surface prior to canister core desorption.
Minerals 12 01226 g004
Figure 5. Characteristics of canister desorption for the studied Montney Formation cores: (a) cross-plot of measured desorption gas content versus estimated early-time desorption permeability; (b) cross-plot of measured desorption gas content versus estimated late-time desorption permeability; (c) cross-plot of measured desorption gas content versus desorption half-time; and (d) cross-plot of estimated early-time desorption permeability versus estimated late-time desorption permeability.
Minerals 12 01226 g005
Figure 6. Correlations of measured desorption gas contents with organic matter properties for the Montney Formation core samples: (a) content of TOC—total organic carbon; (b) maturity parameter Tmax—temperature at which maximal release of hydrocarbons occurs during pyrolysis; (c) S1—content of volatile hydrocarbons in the sample; and (d) S2—generated hydrocarbons through thermal cracking of nonvolatile organic matters (e.g., kerogen).
Minerals 12 01226 g006
Figure 7. Correlations of measured desorption gas contents with (a) total porosity, (b) clay mineral contents, and (c) total porosity and effective porosity, shown in a cross plot. The porosity and mineralogy of the canister core samples were interpolated from laboratory measurements of adjacent samples, at most just a few centimeters above or below the canister samples along core axis.
Minerals 12 01226 g007
Figure 8. Compositional characteristics of canister core desorption gas: (a) variation of gas dryness index DI with core depth and (b) variation of CO2 content with core depth.
Minerals 12 01226 g008
Figure 9. Characteristics of adsorbed gas, total gas-in-place and measured canister desorption gas contents for the studied Montney Formation cores: (a) the correlation of measured Langmuir adsorption volume of methane per unit mass of organic matter with reservoir temperature; (b) a comparison of estimated adsorbed gas and measured canister desorption gas contents, (c) a comparison of estimated total gas-in-place or in situ gas content and adsorbed gas and measured canister desorption gas; and (d) a comparison of the relative percentages of total canister desorption gas, measured desorption gas, and calculated adsorption gas, with respect to the total gas-in-place. The measured methane adsorption isotherms were only available from 5 Montney Formation wells listed in (b), which were used to estimate adsorption gas for all canister samples shown in (c,d).
Minerals 12 01226 g009
Figure 10. Comparison of produced gas and canister core desorption gas properties in the study area: (a) contour map of gas dryness of produced gas; (b) gas dryness index (DI) cross-plot of canister core desorption gas versus produced gas; (c) contour map of the C2–C3 concentrations in produced gas; (d) cross-plot of C2–C3 concentrations in canister core desorption gas versus produced gas; (e) contour map of CO2 concentrations in produced gas; (f) cross-plot of CO2 concentrations in canister core desorption gas versus field produced gas; (g) contour map of cumulative gas production in first 12 months; (h) cross-plot of average canister core desorption gas contents (solid symbols) and estimated total gas contents (open symbols) versus cumulative gas production in the first 12 months. Most canister core sample wells have no production data, hence production data at the well locations were interpolated based on the regional production data of 1021 Montney Formation wells, represented by the gray circles in the contour maps with the canister core wells represented by purple squares.
Minerals 12 01226 g010
Figure 11. Simulation results for core recovery and canister core desorption test: (a) the gas permeability estimated and used for simulation; (b) percentages of total in situ gas for the two types of lost gases from the simulation and desorption gas obtained from both measurement and simulation; (c,d) Simulated time profiles of gas production or release from the studied cores. Samples from the same well have the same color; time zero is defined as the moment when cores are recovered to surface on well site; and zero gas content is defined as the beginning of canister core desorption test.
Minerals 12 01226 g011
Figure 12. Hierarchical clustering and heatmap of various parameters based on Pearson correlation coefficient (PCC) matrix. Red squares indicate positive correlations between associated variables, whereas blue squares indicate negative correlations. DI—gas dryness index; GIP—gas-in-place; HI—Hydrogen index from Rock-Eval analysis; Kds_ET—estimated early-time desorption permeability; Kds_LT—estimated late-time desorption permeability; Km—permeability of rock matrix interpolated from measured GRI permeability of Montney Formation samples adjacent to the canister core samples; M + C gas—measured (M) + crushed (C) gas or total measured canister core desorption gas content; PHIE—effective porosity; PHIT—total porosity.
Minerals 12 01226 g012
Figure 13. (a) Typical canister core desorption profiles for different types of unconventional reservoirs and plays; and (b,c,f) compositional evolution of canister core desorption gas for Montney Formation wells with different gas dryness indices (pseudo- or production gas DI/desorption gas DI) and Duvernay Formation wells of different residual liquid saturations (So) and oil API, shown in (a). The symbols in (d,e) represent the measured compositions of incremental desorption gas of different samples and the dashed lines represent the best-fitting curves to the measured data. For clarity, only the best-fitted curves of available measured desorption gas composition profiles of Duvernay Formation samples are shown in (f).
Minerals 12 01226 g013
Figure 14. Schematic illustration of an integrated approach for improved reservoir fluid characterization: (a) characterization of in situ reservoir fluid based on routine core analysis and canister core desorption; (b) illustration of the production of fractionated native reservoir fluid from a liquid-rich or condensate gas reservoir. Integration of the complementary core analysis and canister desorption data with mud gas or produced fractionated fluids through EOS-based PVT and compositional simulation can significantly reduce the uncertainties in characterization of in situ hydrocarbon fluids of unconventional reservoirs, especially for liquid-rich or retrograde condensate gas reservoirs of low or extremely low permeability.
Minerals 12 01226 g014
Publisher’s Note: MDPI stays neutral with regard to jurisdictional claims in published maps and institutional affiliations.

