Article

Research on Grinding Characteristics and Comparison of Particle-Size-Composition Prediction of Rich and Poor Ores

1
College of Chemistry and Chemical Engineering, Guangxi University, Nanning 530004, China
2
College of Resources, Environment and Materials, Guangxi University, Nanning 530004, China
3
Guangxi Key Laboratory of Processing for Nonferrous Metallic and Featured Materials, Guangxi University, Nanning 530004, China
*
Author to whom correspondence should be addressed.
Submission received: 17 September 2022 / Revised: 21 October 2022 / Accepted: 24 October 2022 / Published: 26 October 2022

Abstract

:
The particle size composition of grinding products will significantly affect the technical and economic indexes of subsequent separation operations. The polymetallic complex ores from Tongkeng and Gaofeng are selected as the research object in this paper. Through the JK drop-weight test, the batch grinding test, and the population-balance kinetic model of grinding with the Simulink platform, the grinding characteristics of the two types of ores and the particle-size-composition prediction methods of grinding products are studied. The results show that the impact-crushing capacity of Tongkeng ore and Gaofeng ore are “medium” grade and “soft” grade, respectively. The crushing resistance of Tongkeng ore increases with the decrease in particle size, and the crushing effect is more easily affected by particle size than that of Gaofeng ore. For the same ore, the accuracy order of the three methods is: PSO–BP method > JK drop-weight method > BIII method. For the same method, only the BIII method has higher accuracy in predicting Gaofeng ore than Tongkeng ore, and other methods have better accuracy in predicting Tongkeng ore than Gaofeng ore. The prediction accuracy of the BIII method is inferior to that of the JK drop-weight method and the PSO–BP method and is easily affected by the difference in mineral properties. The PSO–BP method has a high prediction accuracy and fast model operation speed, but the accuracy and speed of the iterative results are easily affected by parameters such as algorithm program weight and threshold. The parameter-solving process of each prediction method is based on different simplifications and assumptions. Therefore, appropriate hypothetical theoretical models should be selected according to different ore properties for practical application.

1. Introduction

Grinding operation is widely used in solid resources processing industries such as mining, chemical, metallurgy and building materials [1,2,3,4]. In terms of beneficiation production, grinding plays a very important role. Its capital construction cost accounts for about 60% of the construction cost of the concentrator, and the production cost accounts for 40%~50% of the concentrator [5]. Grinding is the preparation of material particle size, and its product’s particle size composition will significantly affect the efficiency of subsequent separation operations and the economic and technical indicators of the concentrator [6,7,8]. Therefore, optimizing grinding operation, improving grinding process efficiency and reducing grinding cost are of great significance for the mineral resources processing industry to reduce its production costs and improve its resource recovery and utilization rate [9,10,11]. With the continuous development and utilization of mineral resources, a large number of high-grade mineral resources have been nearly exhausted [12,13]. Poor and complex ore has gradually become the main body of mineral processing. Its development and utilization is difficult, the separation process is complex, and the production cost is high [14]. As one of the main rare-metal production bases in China, Dachang (in Guangxi) has a variety of complex polymetallic ores with complex mineral distribution and high comprehensive utilization value. However, the recovery rate of tin metal is low, and a large amount of cassiterite is lost in the tailings in the form of fine particles. Cassiterite comes from overgrinding (into tin paste), resulting in a large amount of tin metal loss [15,16]. The grinding of sulfide ore will also lead to the loss of other metals, which will seriously affect the technical and economic indicators of the concentrator [17]. Therefore, in the grinding production of the polymetallic concentrator, while improving the grinding efficiency of sulfide ore, the production of fine cassiterite should be reduced as far as possible, to improve the contradiction between the overgrinding of cassiterite and undergrinding of sulfide ore. Based on the above problems, the rich and poor polymetallic complex ores from Tongkeng and Gaofeng are selected as the research object in this paper. The effects of grinding conditions on the grinding behavior of rich and poor polymetallic complex ores from two aspects, such as the crushing characteristics of the two ores and the comparison of particle-size-composition prediction methods, are studied. The research results can provide a theoretical basis for formulating an industrial and reasonable grinding process and technical separation route. This lays a foundation for the subsequent grinding optimization of rich and poor polymetallic complex ores and the effective regulation of the particle size of grinding products.

2. Materials and Methods

2.1. Materials

The materials are taken from polymetallic complex ores in Tongkeng and Gaofeng, Dachang, Guangxi, China. In this test, 100 kg raw ore samples are obtained, naturally washed and dried, then crushed to −1.7 mm by jaw crusher (PE-150 × 250) and roller crusher (2PG-400 × 250) and finally screened into 12 particle sizes by vibrating screen (Analysette 3). The results are shown in Table 1. In order to ensure the uniformity of materials, each particle size fraction shall be fully mixed into 500 g/bag for subsequent grinding test.

2.2. Methods

JK drop-weight test method is adopted to study the impact-crushing characteristics of the ores. Through the particle size analysis of the crushing products, the soft and hard degree classification of the ores and the crushing behavior characteristics under the impact are obtained by using the software fitting function method. Then, through the batch grinding test, the actual grinding results data are obtained, and the data are used as the comparison basis of grinding result prediction. Finally, the simulation framework based on the population-balance kinetic model is established with the Simulink platform. Different prediction methods are used to solve and calculate the crushing function and selection function, and the prediction methods of particle size composition of grinding products and their adaptability are compared and analyzed [18].

2.2.1. Characterization

The chemical element analysis data of ores were recorded with an X-ray fluorescence element analyzer (S8 TIGER, BRUKER, Berlin, Germany). Elements between Na–U can be analyzed. The content range is from ppm–100%. It can be used for qualitative and quantitative analysis of solid, powder, liquid and other samples. The characterization test was performed in the laboratory of Guangxi University (Room 106, College of Resources, Environment and Materials, Guangxi University, Nanning, 530004, China).

2.2.2. JK Drop-Weight Test

JK drop-weight test is a process of selecting drop hammer combinations of different qualities and freely dropping at different heights to impact crush a single ore with a certain particle size. Changing the mass and drop height of the drop hammer can produce different amounts of energy to break the ore. The ratio of crushing energy Ec to ore mass m is defined as specific crushing energy Ecs. Through the particle size analysis of the crushed products, the impact-crushing parameters A and b of the ore can be obtained. The ore is broken and divided into five particle sizes according to the test requirements: −63 + 53 mm, −45 + 37.5 mm, −31.5 + 26.5 mm, −22.4 + 19 mm and −16 + 13.2 mm. Each particle size is divided into three parts, and their weighing records are recorded. They are impact crushed by three different energy levels. After the impact crushing is completed, the crushed products of each particle size/energy combination are screened and analyzed, and the weighing records are made.
Based on the particle size analysis of the crushed products, the particle size characteristic curve is drawn, and the origin software function fitting regression analysis is used to obtain the particle size distribution model of impact crushed mineral products, as shown in Formula (1) [19], so that the cumulative yield under the sieve of any required particle size can be calculated.
  y = A 1 + A 2     A 1 1 + 10 (   l o g x 0   x )   p        
where, x is the sieving particle size (mm), y is the corresponding cumulative weight percentage undersize (%), A1 and A2 are the upper and lower asymptotes of the particle size characteristic curve (%), logx0 is the particle size at (A1 + A2)/2(mm), and p is the absolute value of the maximum slope on the particle size curve (%/mm).
Based on the above particle size distribution model, the cumulative yield under the sieve of any specific sieve size in 15 groups of crushing test products can be calculated, respectively. Generally, the particle size in the crushing product with particle size that is less than one-tenth of the feed particle size is used as a characteristic particle size. The crushing degree of minerals is reflected by the cumulative yield under the sieve corresponding to this characteristic particle size, and the symbol is marked as t10. According to 15 groups of t10 values and Ecs data of impact specific crushing energy, t10Ecs scatter diagram can be drawn. Finally, the impact-crushing characteristic parameters A and b of the mineral can be obtained by fitting and analyzing the functional relationship of t10Ecs (as shown in Formula (2)) [20].
t 10 = A ( 1     e b · E c s )
According to 15 groups of test data, the values of coefficients A and b can be fitted. The value of A × b can be used to measure the impact-crushing resistance of ore. Based on the JK database, the test parameters (A × b) and the corresponding relationship with ore properties are shown in Table 2 [21].

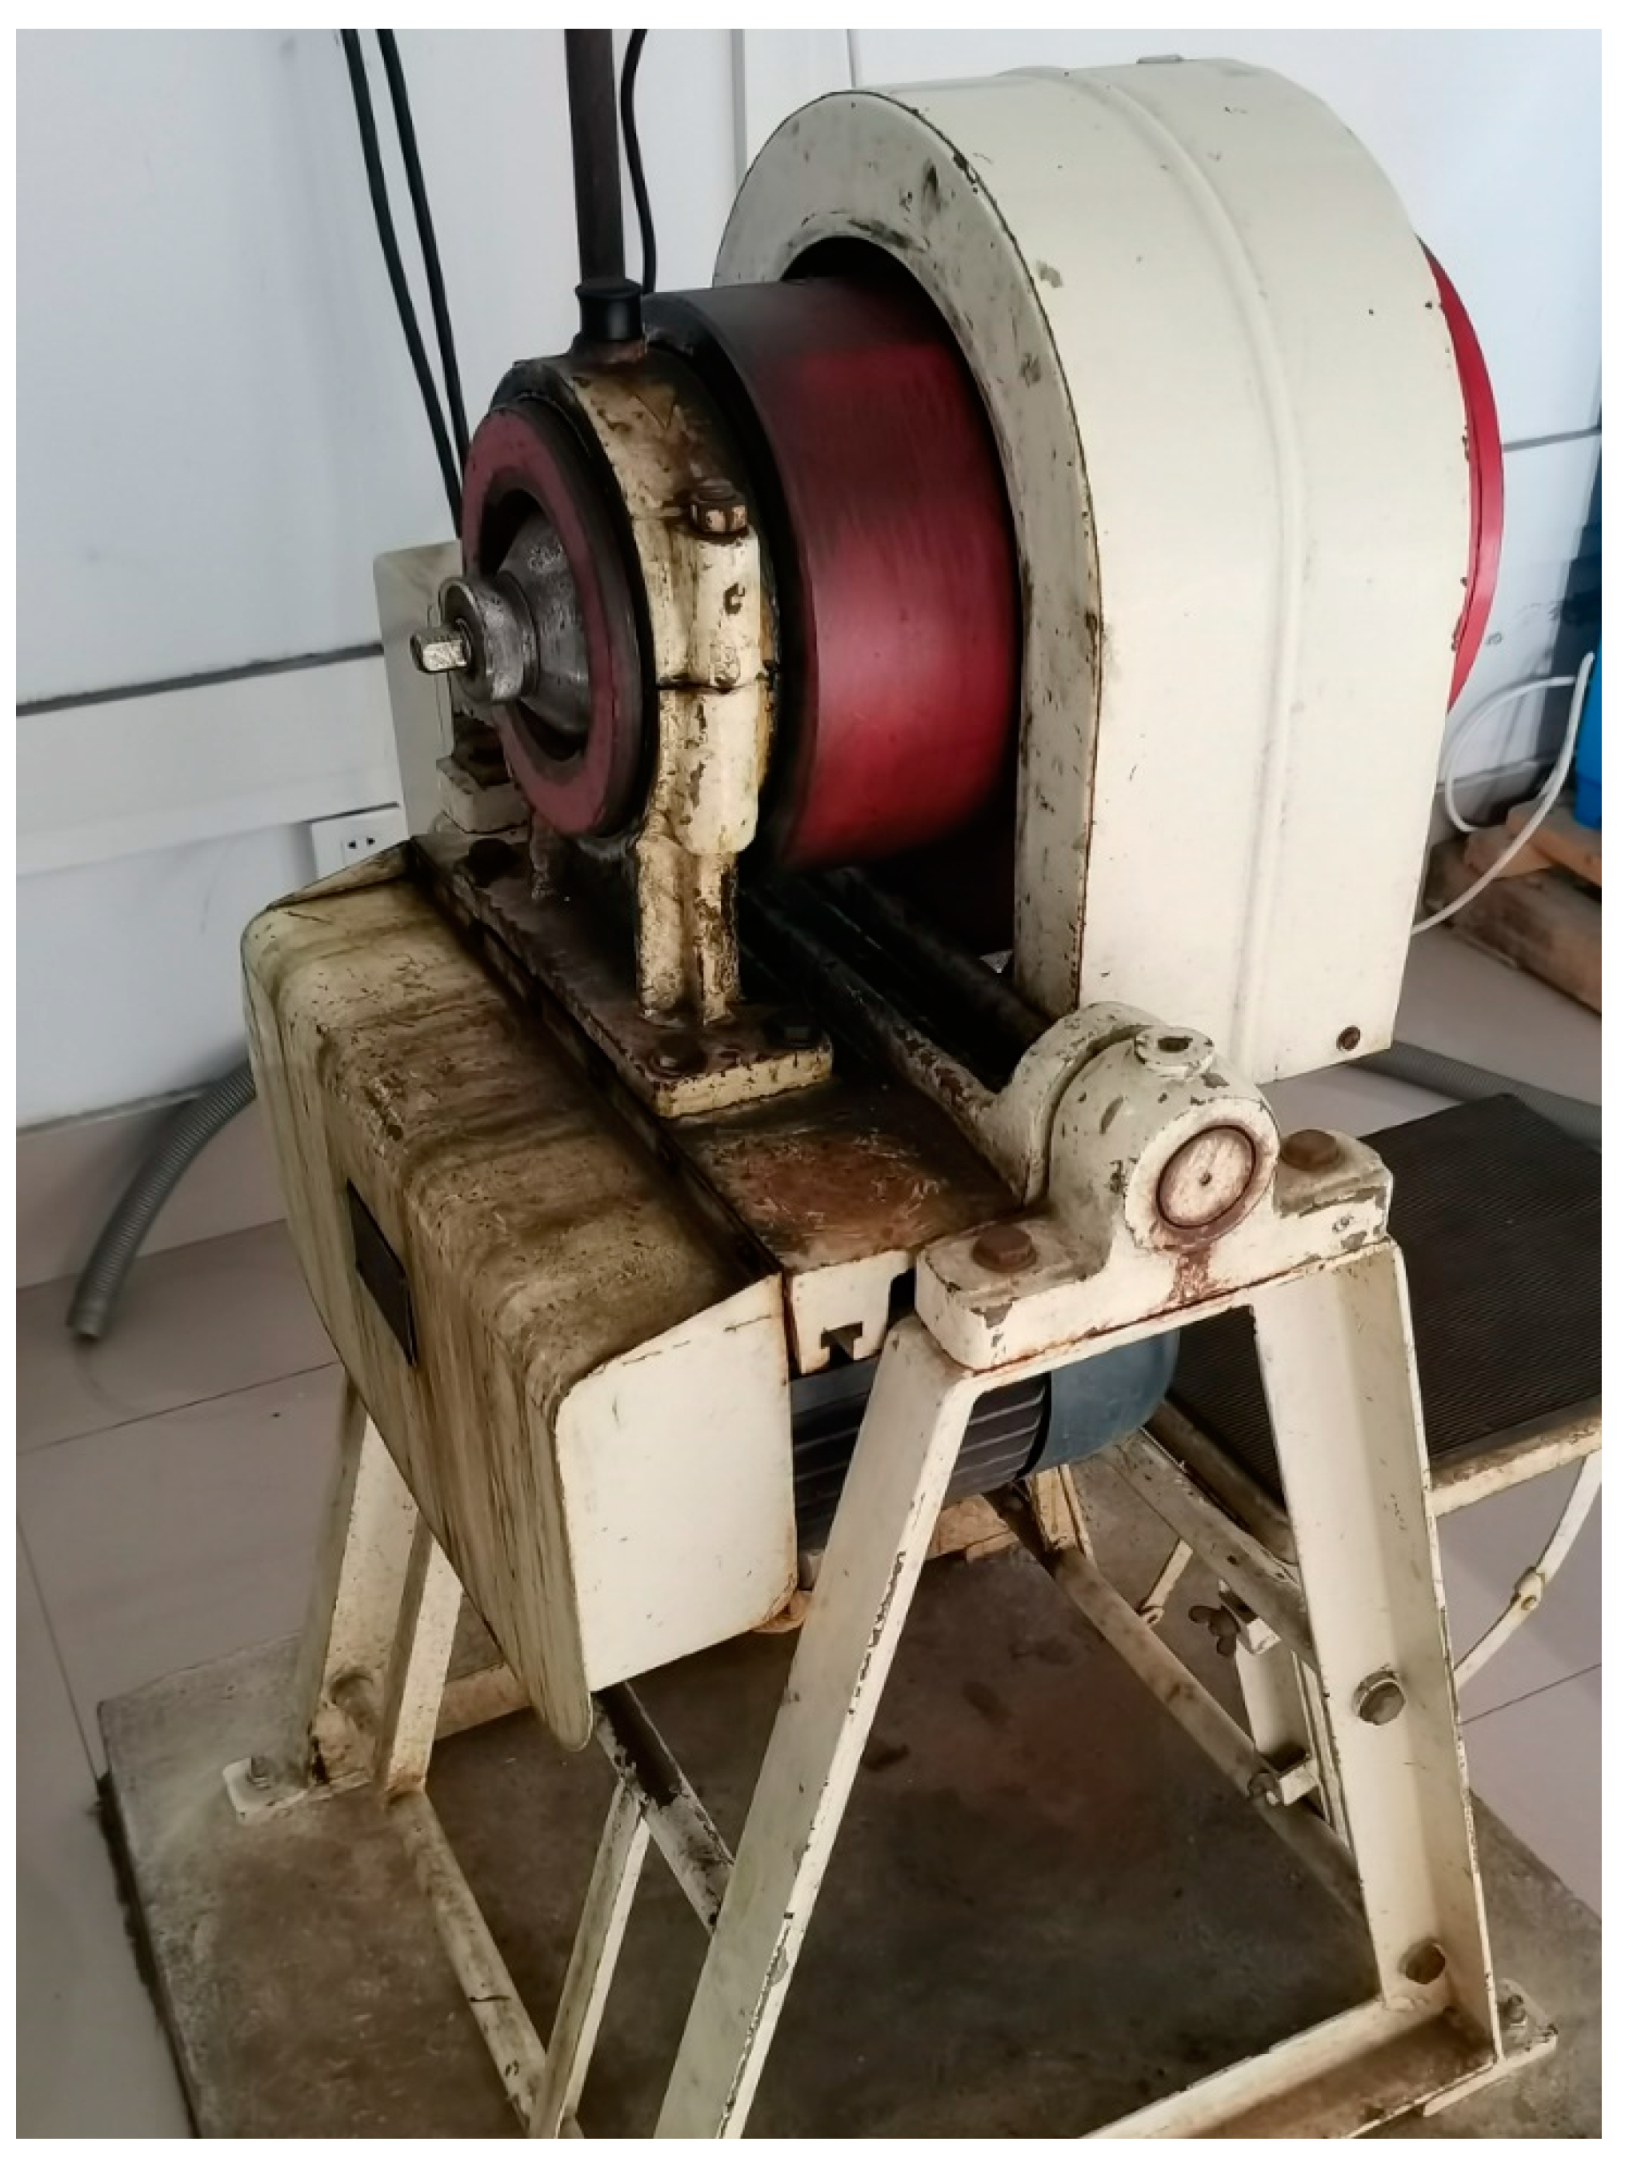
2.2.3. Batch Grinding Test

A tumbling mill was used in the batch grinding tests. The picture of the tumbling mill is shown in Figure 1.
As shown in Figure 1, the diameter of the tumbling mill is 200 mm. In addition, the length of the tumbling mill is 240 mm. The medium of the mill is iron ball with diameter of 25 mm. The critical rotational speed of the mill is 101.4 r/min. The type of grinding is wet milling. The power of tumbling mill is 0.55 kW. Particle size distribution of two types of ores’ feeding samples are shown in Table 1. The grinding parameters are shown in Table 3.
The grinding parameters in Table 3 are the optimal grinding parameters obtained according to the corresponding surface method. The rotational rate is the percentage of critical rotational speed, and the grinding concentration is the ratio of the quality of the ore material to the slurry. In order to obtain the input data of the simulation model, grinding tests with different grinding time were conducted. Among them, grinding times of Tongkeng ore are 0 min, 0.5 min, 1 min, 2 min, 4 min and 6 min, respectively. Grinding times of Gaofeng ore are 0 min, 1 min, 2 min, 3 min and 4.5 min, respectively. In addition, the optimal grinding times of the two ores were selected according to the optimal grinding parameters, and the actual grinding test was carried out and compared with the simulation prediction date. Among them, the optimal grinding time of Tongkeng ore is 5.4 min, and the optimal grinding time of Gaofeng ore is 3.8 min. All grinding tests are conducted twice, and the average value is taken as the final data.

2.2.4. Build Simulink Simulation Model

In this paper, the Simulink module in MATLAB (version 2019b) is used for modeling the population-balance kinetic model of grinding, which can simulate the change of particle size of grinding products in real time [22]. The modeling steps are as follows:
① Analyze the experimental object and abstract it into a mathematical model;
② Select and connect modules from the module library;
③ Set module parameters and simulation environment;
④ Run the simulation.
The modules included in Simulink simulation model are: a constant module for ore feeding; two gain modules to convert the percentage content; two display modules to display the particle size distribution of ore feeding and grinding products; a subsystem module to set the rupture function matrix B and select the function matrix s for operation; an output module to output grinding products. The flowchart of the Simulink platform is shown in Figure 2.
The simulation flow is as follows: firstly, the gain module calculates the feed data and displays the feed particle size distribution, then the feed data are calculated by the subsystem module to obtain the grinding products, and finally the gain module displays the particle size distribution of the grinding products through the gain module calculation. By setting the simulation time and running the simulation model, the yield distribution of each particle size of grinding products can be observed from the display module.

2.2.5. BIII Method Based on N-Order Grinding Dynamic Model

BIII method is proposed by Austin and Luckie [23] to calculate the B value. It is used to calculate the selection function S of different particle sizes according to the n-order dynamic equation [24] and then calculate the B value of fracture function, as shown in Equation (3).
R i ( t ) = R i ( 0 ) e x p ( S i t n )    i = 1 ,   2 ,   3 ,   j
where Ri(t) and Ri(0) are the cumulative yield on the sieve with particle size i in the feed and product respectively, and Si is the selection function of particle size i, n is the parameter related to mineral properties, t is the grinding time, j is the quantity of single particle size in feed and product.
Linearize Equation (4) as follows:
l n ( l n R i ( t ) R i ( 0 ) ) = n l n t + l n S i  
The above formula is linearly fitted with origin software to obtain the values of parameters Si and n, and then the n-order dynamic equation under the condition of corresponding particle size can be obtained.
Theoretically, the particle size composition after short-time grinding is the only result of functions B and S, so B can be calculated after obtaining S. However, except for the first and second particle sizes, it is difficult to solve for other particle sizes. Therefore, according to the method proposed by Reid [25,26], the analytical solution is obtained first, then Bi1 is inversely calculated by S, and finally the approximate solution formula is derived.

2.2.6. JK Drop-Weight Method Based on JK Drop-Weight Test

The ore breakage distribution function B can be calculated through JK drop-weight test [21]. The selection function S is inversely calculated through the test data of batch grinding test, and the population-balance kinetic model is constructed. The specific steps are as follows:
① According to the particle size to be used for screening analysis of grinding test products, calculate the multiple xx of each particle size relative to each particle size finer than it and obtain a series of xx values;
② Using the mathematical model fitting the drop-weight test data, calculate the cumulative yield under the sieve txx of a series of under screen particle sizes with crushed products less than 1/xx of the feed particle size;
③ Fitting the polynomial relationship between t10 and each txx to obtain the relationship equation between them;
④ Carry out batch grinding tests at different times and analyze the particle size composition of grinding products through the proposed sieve particle size fraction;
⑤ According to the grinding conditions such as grinding medium size, filling ratio and rotational rate, deduce the specific crushing energy Ecs of medium to material corresponding to different screening particle sizes;
⑥ According to the particle energy equation of the relationship between t10 and Ecs obtained in the drop-weight test, calculate the t10 values corresponding to the above different specific crushing energies Ecs.
⑦ Calculate the txx value corresponding to each xx value according to the relationship equation between t10 and txx. Obtain the particle size distribution of mineral particles after crushing under ideal conditions, that is, the cumulative fracture function matrix Bij, and further obtain the fracture distribution function bij.
⑧ According to the obtained fracture distribution function bij; combined with the particle size composition of grinding products at different grinding times, the selection function is inversely calculated based on Reid’s analytical solution formula [23].
⑨ According to ⑧, the relationship between selection function and grinding time can be established, and the selection function of each particle size under different grinding time can be obtained.
⑩ According to the results of the obtained fracture distribution function and selection function, an population-balance kinetic model is established for prediction.

2.2.7. BP Neural Network Algorithm Based on Particle Swarm Optimization (PSO–BP)

With the popularization of computer application and modeling technology, a series of intelligent algorithms such as genetic algorithm, particle swarm optimization algorithm, simulated annealing algorithm and ant colony algorithm are widely used in various fields. Grinding process is a complex system with many influencing factors. The grinding mathematical model based on intelligent algorithm takes its main influencing factors as input variables, uses intelligent algorithm to build the corresponding mathematical model and designs the control scheme through the model to realize grinding optimization.
As one of the most widely used neural network models, BP neural network is a multilayer feedforward network that minimizes the error between the actual output value and the expected output value by continuously modifying the weights of each neuron in the error back-propagation training. BP neural network has the advantages of strong nonlinear mapping ability, high self-learning and adaptive ability and certain fault tolerance [27], but it also has the disadvantages of easily falling into local optimization, slow convergence speed, poor stability and so on. Particle swarm optimization is a swarm intelligence optimization algorithm based on a bird swarm, which gradually approaches the optimal solution by searching the area of the bird closest to the food. It can avoid falling into the local optimal solution and has good global optimization ability. Therefore, BP neural network intelligent algorithm based on particle swarm optimization is proposed. The particle swarm optimization algorithm is introduced into the BP neural network model to speed up the convergence speed and calculation accuracy of the traditional BP neural network algorithm. The particle position is replaced by the vector with only speed and position. The speed and position of the particle are continuously updated through the algorithm iteration, until the global optimal solution meets the error requirements or reaches the maximum number of iterations, and finally the global optimal solution is output.
Set the number of hidden layer neurons as 6, the number of iterations as 500, the learning factor as c1 = 2 and the iterative operation as c2 = 0.8. Since the weights and thresholds are generated by random initialization every time, the two predictions are compared with the experimental values, respectively.

3. Results and Discussion

3.1. XRF Analysis Results

The analysis results of XRF are shown in Table 4 and Table 5.
It can be seen from Table 4 that Tongkeng ore contains metallic elements such as iron, tin, lead and zinc and nonmetallic elements such as sulfur and arsenic. The total content of SiO2, CaO, Al2O3 and MgO is 78.9%, indicating that the gangue mineral content is high. The main useful minerals of Tongkeng ore are cassiterite, marmatite, pyrrhotite, jamesonite, pyrite, arsenopyrite, etc. The main gangue minerals are calcite and quartz [28]. According to the density test, the density of Tongkeng ore is 2.73 × 10³ kg/m3, similar to the density of calcite and quartz. From Table 5, the Gaofeng ore contains a variety of metal elements such as iron, lead, zinc, tin and antimony and nonmetallic elements such as sulfur and arsenic. The total content of SiO2, CaO, Al2O3 and MgO is 26.2%, indicating that the content of gangue minerals is low. Therefore, in terms of the content of main useful minerals, Tongkeng ore is a “poor ore” and Gaofeng ore is a “rich ore”.

3.2. JK Drop-Weight Test

3.2.1. JK Drop-Weight Test of Tongkeng Ore and Gaofeng Ore

After screening the drop-weight impact-crushing products of Tongkeng ore and Gaofeng ore, the curves of the cumulative yield under the sieve are drawn in semilogarithmic coordinates, as shown in Figure 3.
It can be seen from Figure 3a–e that under the same screening particle size, with the increase in crushing energy, the greater the cumulative yield under the sieve is, the finer the crushed product. With the same initial particle size, the change trend of the curves of the cumulative yield under the sieve under the three crushing energies is similar; the lower the crushing energy is, the larger the particle size corresponding to the inflection point of the cumulative yield under the sieve change. Therefore, the particle size distribution of the ore is closely related to the initial crushing energy. From Figure 3a’–e’, the particle size distribution of the crushing products of Gaofeng ore is similar to that of Tongkeng ore, and the cumulative yield under the sieve under the same particle size increases with the increase in specific crushing energy. With the same initial particle size, the trend of the curves of the cumulative yield under the sieve under different specific crushing energies is similar. The curve distance is closer under medium and high crushing energy. This shows that when the crushing energy is input to a certain extent, it will reach “crushing saturation”, resulting in a smaller difference for the impact-crushing effect of Gaofeng ore.

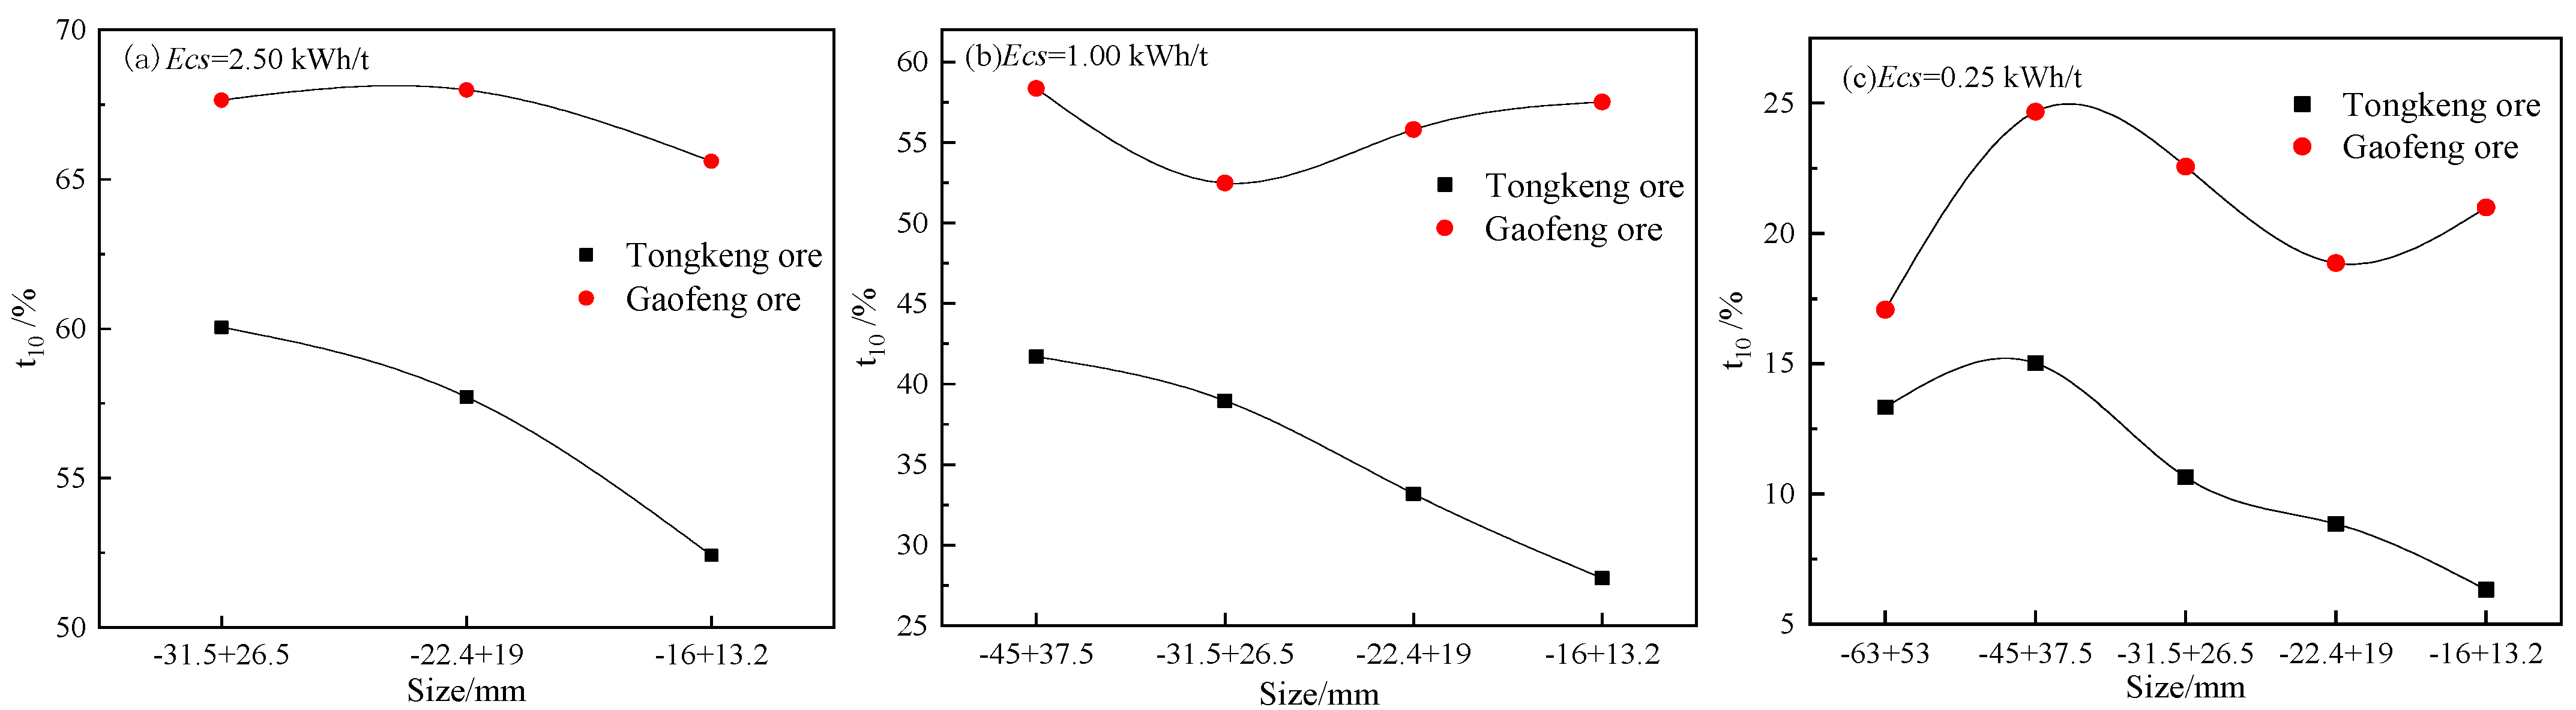
3.2.2. Impact-Crushing Characteristics of Tongkeng and Gaofeng Ores

The crushing parameters A and b of the two ores can be obtained by fitting the 15 groups of t10 values calculated from the particle size distribution characteristic coefficient with the corresponding 15 groups of specific crushing energy. The fitting curve is shown in Figure 4.
By fitting the test data with Equation (2) and combining with Figure 4, the parameters of Tongkeng ore and Gaofeng ore can be obtained. The specific parameter values are shown in Table 6.
According to Table 2 and Table 6, the impact-crushing capacity of Tongkeng ore belongs to a “medium” grade, A × b = 52.71, while the impact-crushing capacity of Gaofeng ore belongs to a “soft” grade, A × b = 105.68.

3.2.3. Comparison and Analysis of Tongkeng and Gaofeng Ores

The t10 variation curve of the two types of ores under different specific crushing energies is shown in Figure 5.
It can be seen from Figure 5 that under the same specific crushing energy, the t10 value of Tongkeng ore of any particle size is less than that of Gaofeng ore. That is, the breakage resistance of Tongkeng ore is greater than that of Gaofeng ore, and Gaofeng ore is easier to be crushed. At the same time, the effect of feed particle size on the crushing effect is related to the specific crushing energy and ore type. Generally speaking, the t10 value of Tongkeng ore decreases with the decrease in feed particle size, while the effect of feed particle size on Gaofeng ore is more complex.

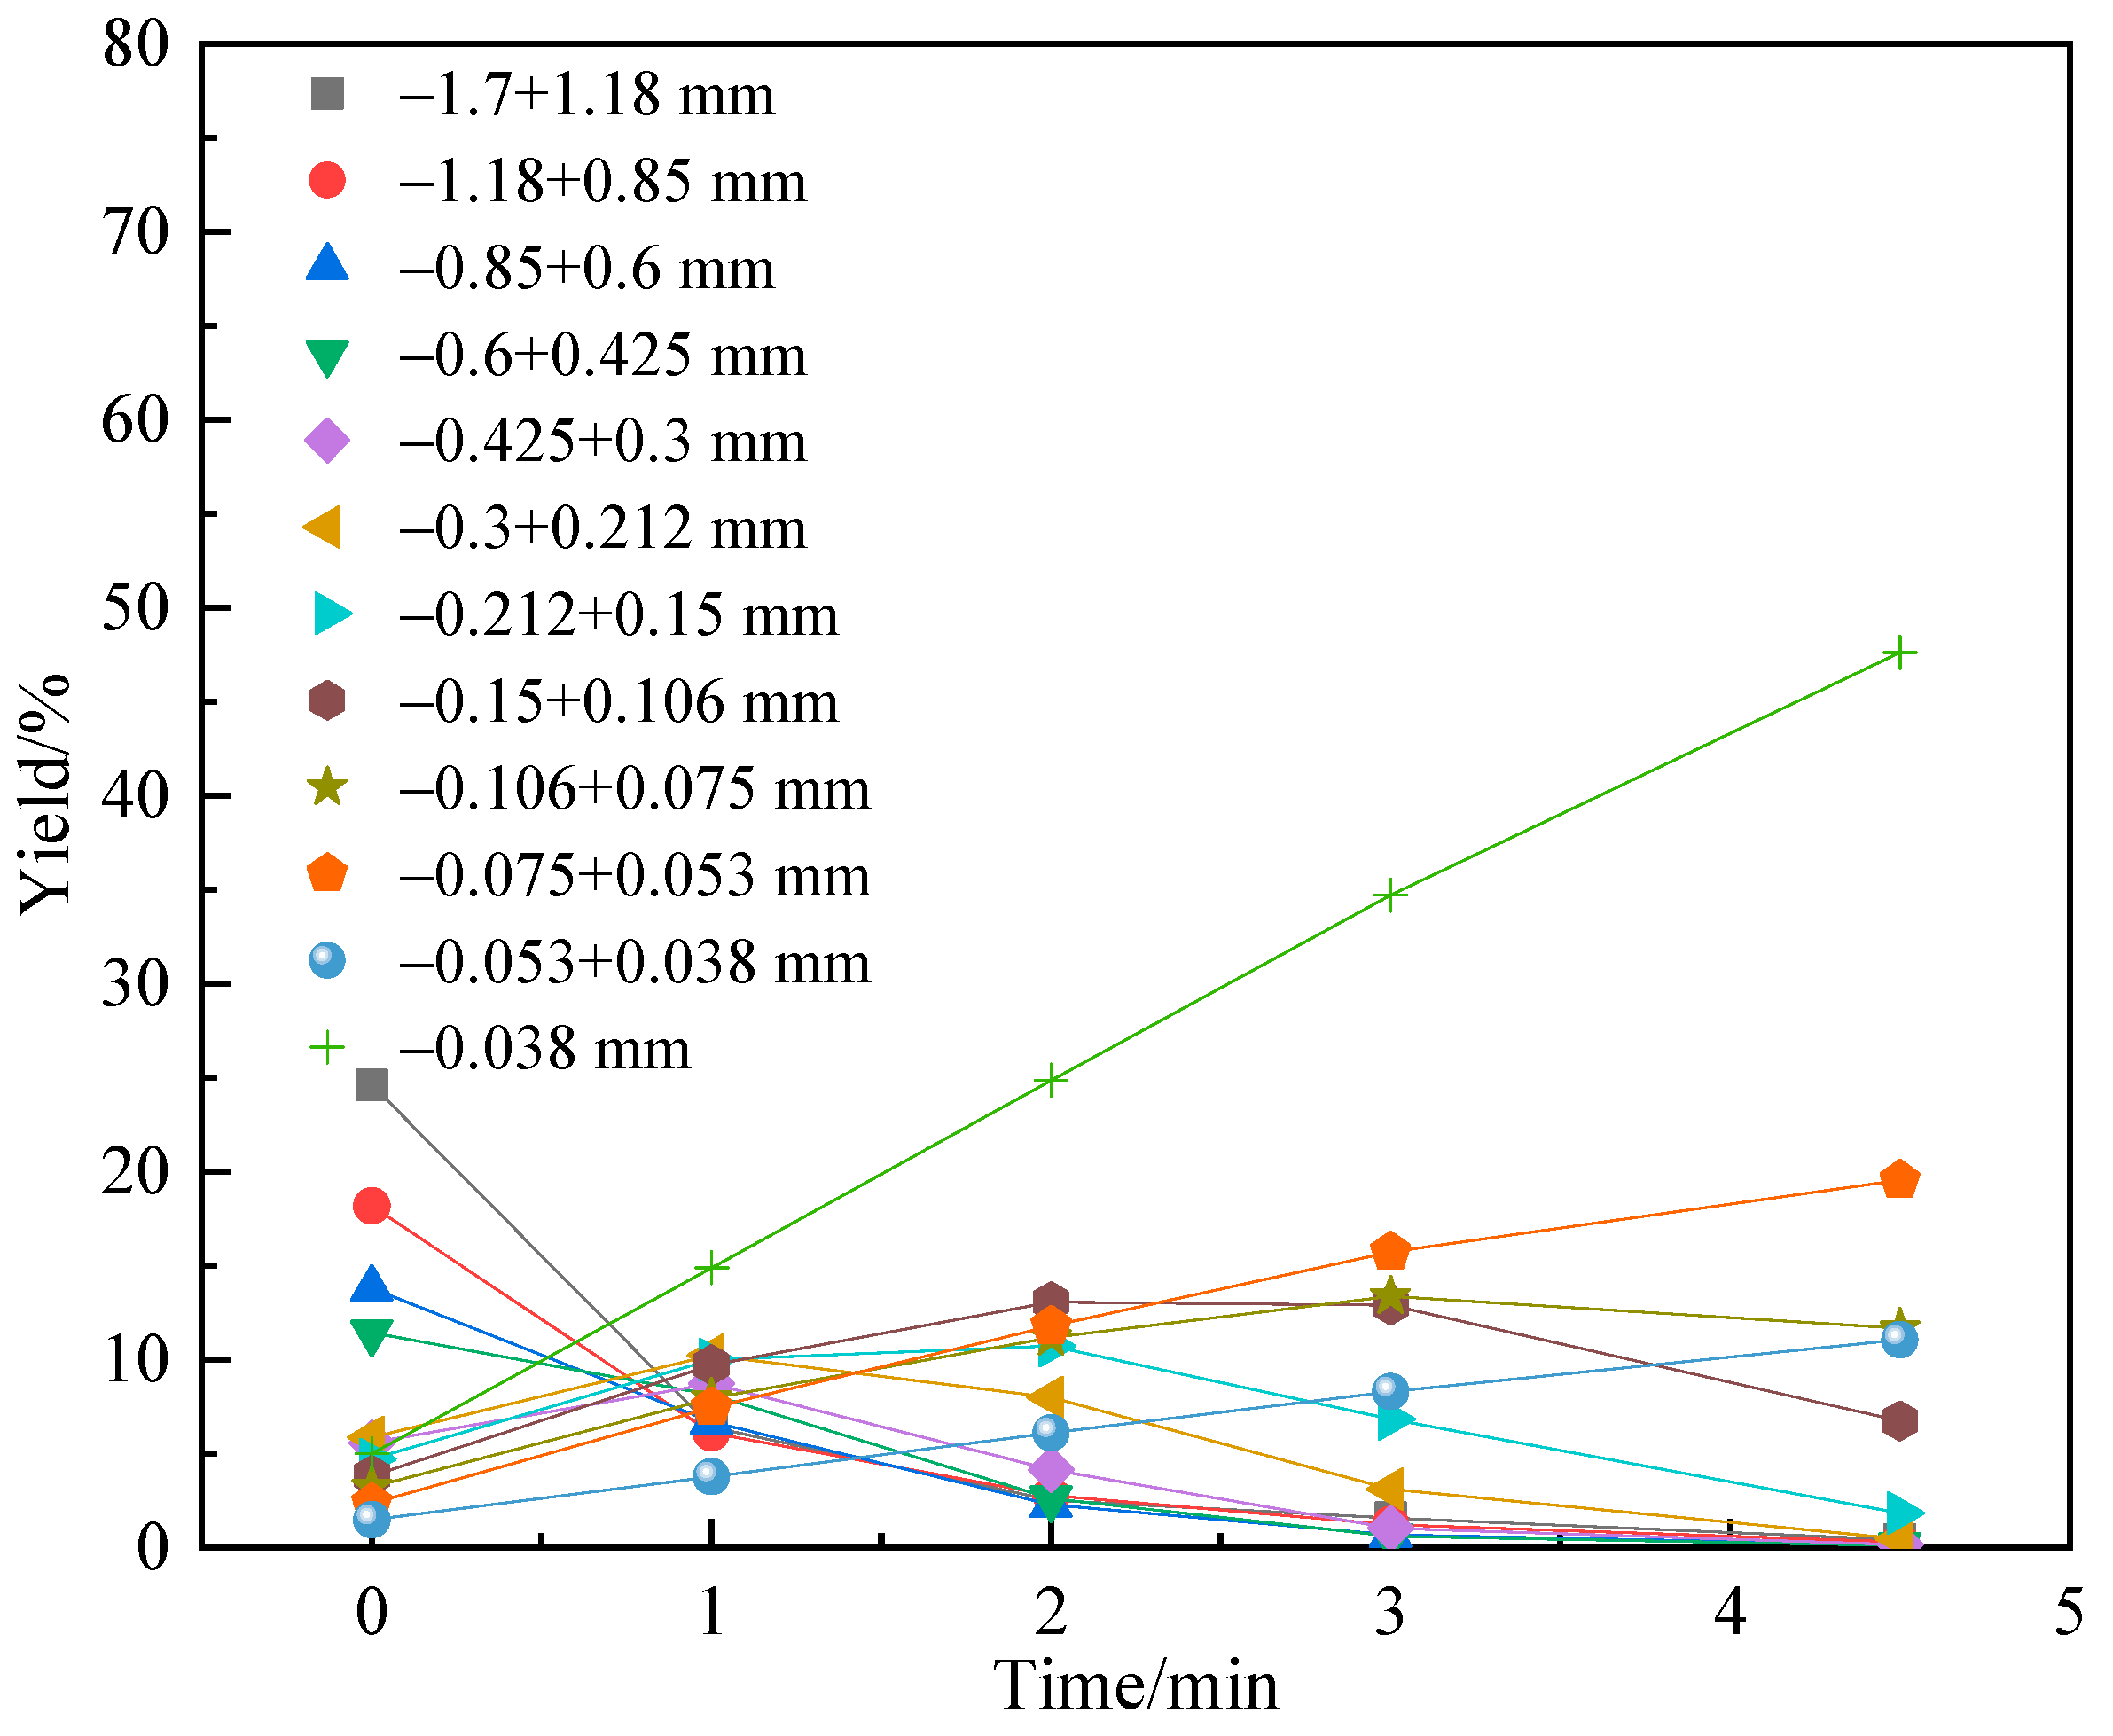
3.3. Batch Grinding Test

In order to provide basic data for the prediction method of particle size composition of grinding products, batch grinding tests of Tongkeng ore and Gaofeng ore at different grinding times are carried out according to the test conditions in Section 2.2.3. The results are shown in Figure 6 and Figure 7.
In order to compare the simulation data with the actual test data, the actual batch grinding test is carried out according to the optimized grinding conditions in Section 2.2.3. It can be seen from Figure 6 and Figure 7 that the yield of −0.038 mm particle size is about 50%. In Figure 6, the main gangue minerals of Tongkeng ore are calcite and quartz. Quartz is difficult to grind; however, the gangue minerals in Tongkeng ore include calcite in addition to quartz. Calcite is a very soft material. Under the same particle size (−63.0 + 13.2 mm), the impact-crushing capacity of calcite belongs to a “very soft” grade, A × b = 204.51. Therefore, calcite is very easy to grind. It can be seen from the XRF data that the content of CaO reaches 28.2%. The main component of calcite is CaCO3, so according to the principle of material conservation, it can be inversely calculated from the XRF data that the content of calcite (CaCO3) in Tongkeng ore is about 41.2%, and the content of quartz (SiO2) is reduced to about 37.6%. Since calcite is easily broken and has a high content, with the increase in grinding time, the product of −0.038 mm particle size will further increase, which conforms to the crushing principle. In addition, although the diameter of our cylindrical ball mill is only 200 mm, the total mass of the grinding medium iron ball reaches 20 kg, and the mass of feeding ores are only 500 g in each grinding test, so the crushing efficiency is very high. In Figure 7, because the impact-crushing capacity of Gaofeng Mine belongs to the “soft” grade and contains almost no quartz, it is easier to grind.
Since, when the grinding is completed, the yield of the coarse particle sizes is generally small, resulting in a large relative error value, which is not convenient for error analysis. Therefore, the seven coarse particle sizes are combined into the +0.15 mm particle sizes. The results are shown in Table 7.

3.4. BIII Method Based on N-Order Grinding Dynamic Model

Based on the batch grinding test data, according to Section 2.2.5, the calculated parameters S and bij are input into the established Simulink model, the feed particle size distribution f and simulation time t are set, the simulation model to obtain the particle size composition of grinding products is run, and the results with the test values are compared to obtain Figure 8 and Table 8.
It can be seen from Figure 8 that the prediction error of the two ores by the BIII method is relatively small, especially in the qualified particle size range of −0.15 + 0.038 mm. Although the error of predicting Tongkeng ore is slightly greater than that of Gaofeng ore, on the whole, the BIII method can be used for predicting the particle size of the grinding products of the two ores. From Table 8, for the Tongkeng ore, the absolute errors of the BIII method for the coarse particle size +0.15 mm and the fine particle size −0.038 mm predictions are larger, both about 4%, and the prediction accuracy is relatively low. The prediction accuracy of the other particle sizes is relatively high, and the maximum absolute error is −1.05%. This shows that the grinding process of Tongkeng ore approximately meets the n-order grinding dynamic model equation. It can be seen from Table 8 that for Gaofeng ore, the prediction error of the BIII method for the +0.15 mm particle size fraction is the largest, with an error value of 3.22%, and the prediction accuracy is relatively low. The prediction accuracy of the other particle sizes is relatively high, and the maximum absolute error is −1.2%. This shows that the grinding process of Gaofeng ore also approximately meets the n-order grinding dynamic model equation, and the degree of satisfaction is higher than that of Tongkeng ore.

3.5. JK Drop-Weight Method Based on JK Drop-Weight Test

Based on the JK drop-weight test data and the batch grinding test results, combined with the method in Section 2.2.6, Simulink is used for modeling and simulation, and the simulation results are compared with the test values. The comparison results are shown in Figure 9 and Table 9.
It can be seen from Figure 9 that the error of the two ores predicted by the JK drop-weight method is small, the predicted value of each particle size is close to the test value, and the error of Gaofeng ore is greater than that of Tongkeng ore. In general, the JK drop-weight method can be used for the particle size prediction of the two ores’ grinding products. From Table 9, for Tongkeng ore, the maximum absolute error and the relative error between the predicted value and the test value are −0.57% and 3.44%, respectively. The absolute error of the other particle size’s predictions is no more than 0.5%, so the prediction accuracy is high. From Table 9, for Gaofeng ore, the error of the prediction of the JK drop-weight method is small, and the maximum absolute error and the relative error between the predicted value and the test value are 2.1% and −8.01%, respectively. The absolute error of the other particle size predictions is no more than 1%, so the prediction accuracy is high.

3.6. BP Neural Network Algorithm Based on Particle Swarm Optimization

Based on the method in Section 2.2.7, the average value of the two predicted values is used as the final result to compare with the test value, as shown in Figure 10 and Table 10.
It can be seen from Figure 10 that the prediction results, by using the PSO–BP algorithm model, are highly consistent with the test values, indicating that the model has a high prediction accuracy and can provide a theoretical basis for the efficient and intelligent regulation of the particle size distribution of grinding products. From Table 10, for Tongkeng ore, the predicted value and test value of the PSO–BP method are similar, and the absolute error and the relative error of the particle size prediction at −0.053 + 0.038 mm are the largest, which are 0.5% and 7%, respectively. The maximum absolute error of predicting other particle sizes is −0.38%, which shows that the prediction accuracy is high, so this model algorithm is feasible. From Table 10, for Gaofeng ore, the difference between the predicted value and the test value of the PSO–BP method is very small, the maximum absolute error is within 1%, and the absolute error and the relative error of the particle size prediction at −0.106 + 0.075 mm are the largest, which are 0.91% and 6.54%, respectively. The maximum absolute error of predicting other particle sizes is −0.64%. It can be seen that this intelligent algorithm has a high accuracy and can be used in the simulation of Gaofeng ore.

3.7. Comparative Analysis of Three Different Methods

The error comparison of the three different methods is shown in Table 11.
It can be seen from Table 11 that for the same ore, the accuracy order of the three methods is: PSO–BP method > JK drop-weight method > BIII method. For the same method, the prediction accuracy of Tongkeng ore is basically better than that of Gaofeng ore. When the BIII method is used for prediction, the prediction accuracy of Gaofeng ore is higher than that of Tongkeng ore. It shows that the fitting degree of Gaofeng ore to the n-order grinding kinetic equation is higher than that of Tongkeng ore. The reason may be that Gaofeng ore belongs to a “rich ore”, which is mainly composed of useful metal minerals. The properties of the constituent minerals in the ore are similar and have little mutual effect on the grinding process. It can be regarded as a whole, so the simplified assumption is more reasonable. On the contrary, Tongkeng ore belongs to a “poor ore”, which is mainly composed of gangue minerals such as quartz and calcite. The two main gangue minerals are quite different in hardness, grindability and other properties, so the simplified assumption that they are regarded as a whole is not reasonable.

4. Conclusions

The following conclusions were drawn from this research:
When Tongkeng ore and Gaofeng ore are crushed by impact, the crushing degree is closely related to the specific crushing energy and feed particle size. The impact-crushing resistance of Tongkeng ore and Gaofeng ore belong to a “medium” grade and a “soft” grade, respectively. The hardness of Tongkeng ore is higher than that of Gaofeng ore. The crushing resistance of Tongkeng ore increases with the decrease in particle size, and the crushing resistance of the Gaofeng ore is more complex.
For the same ore, the accuracy order of the three methods is: PSO–BP method > JK drop-weight method > BIII method. For the same method, only the BIII method has a higher prediction accuracy for Gaofeng ore than Tongkeng ore, while the other methods have a better prediction accuracy for Tongkeng ore than Gaofeng ore.
The prediction accuracy of the BIII method is inferior to that of the JK drop-weight method and the PSO–BP method and is easily affected by the difference in mineral properties. The PSO–BP method has a high prediction accuracy and fast model operation speed, but the accuracy and speed of iterative results are easily affected by parameters such as algorithm program weight and threshold.

Author Contributions

Conceptualization, S.M. and J.Y.; data curation, Z.S. and H.L.; formal analysis, W.X. and X.D.; funding acquisition, S.M.; investigation, Z.S. and H.L.; methodology, J.Y. and S.M.; project administration, J.Y. and S.M.; validation, Z.S. and H.L.; writing—original draft, H.L. and J.Y.; writing—review and editing, J.Y. and S.M. All authors have read and agreed to the published version of the manuscript.

Funding

This research was funded by the National Natural Science Foundation of China (No. 52274258 and No. 51874105).

Data Availability Statement

Not applicable.

Conflicts of Interest

The authors declare no conflict of interest.

References

  1. Urbaniak, D.; Kolmasiak, C.; Wyleciał, T. Using of fluidized-bed jet mill to a super fine comminution of steel composite. Metalurgija 2015, 54, 201–203. [Google Scholar]
  2. Hashim, S.F.S.; Hussin, H. Effect of grinding aids in cement grinding. J. Phys. Conf. Ser. 2018, 1082, 012091. [Google Scholar] [CrossRef] [Green Version]
  3. Krishnaraj, L.; Ravichandran, P.T. Investigation on grinding impact of fly ash particles and its characterization analysis in cement mortar composites. Ain Shams Eng. J. 2019, 10, 267–274. [Google Scholar] [CrossRef]
  4. Taylor, L.; Skuse, D.; Blackburn, S.; Greenwood, R. Stirred media mills in the mining industry: Material grindability, energy-size relationships, and operating conditions. Powder Technol. 2020, 369, 1–16. [Google Scholar] [CrossRef]
  5. Sadrai, S.; Meech, J.A.; Ghomshei, M.; Sassani, F.; Tromans, D. Influence of impact velocity on fragmentation and the energy efficiency of comminution. Int. J. Impact Eng. 2006, 33, 723–734. [Google Scholar] [CrossRef]
  6. Huang, K.Q.; Xiao, C.H.; Wu, Q.M. Application of accurate ball-load-addition method in grinding production of some tailings. Adv. Mat. Res. 2014, 962, 771–774. [Google Scholar] [CrossRef]
  7. Kotake, N.; Kuboki, M.; Kiya, S.; Kanda, Y. Influence of dry and wet grinding conditions on fineness and shape of particle size distribution of product in a ball mil. Adv. Powder Technol. 2011, 22, 86–924. [Google Scholar] [CrossRef]
  8. Peng, Y.; Grano, S. Effect of iron contamination from grinding media on the flotation of sulphide minerals of different particle size. Int. J. Miner. Process. 2010, 97, 1–6. [Google Scholar] [CrossRef]
  9. Woywadt, C. Grinding process optimization—Featuring case studies and operating results of the modular vertical roller mill. In Proceedings of the IEEE-IAS/PCA Cement Industry Technical Conference, Calgary, AB, Canada, 21–25 May 2017. [Google Scholar]
  10. Hfels, C.; Dambach, R.; Kwade, A. Geometry influence on optimized operation of a dry agitator bead mill. Miner. Eng. 2021, 171, 107050. [Google Scholar] [CrossRef]
  11. Santosh, T.; Soni, R.K.; Eswaraiah, C.; Rao, D.S.; Venugopal, R. Optimization of stirred mill parameters for fine grinding of PGE bearing chromite ore. Part. Sci. Technol. 2020, 39, 663–675. [Google Scholar]
  12. Henckens, M.L.C.M.; van Ierland, E.C.; Driessen, P.P.J.; Worrell, E. Mineral resources: Geological scarcity, market price trends, and future generations. Res. Policy 2016, 49, 102–111. [Google Scholar] [CrossRef] [Green Version]
  13. Gorman, M.R.; Dzombak, D.A. A review of sustainable mining and resource management: Transitioning from the life cycle of the mine to the life cycle of the mineral. Resour. Conserv. Recycl. 2018, 137, 281–291. [Google Scholar] [CrossRef]
  14. Chen, Y.M.; Li, H.; Feng, D.X.; Tong, X.; Hu, S.X.; Yang, F.; Wang, G.C. A recipe of surfactant for the flotation of fine cassiterite particles. Miner. Eng. 2021, 160, 106658. [Google Scholar] [CrossRef]
  15. Zhou, W.T.; Han, Y.X.; Li, Y.J.; Yang, J.L.; Ma, S.J.; Sun, Y.S. Research on prediction model of ore grinding particle size distribution. J. Disper. Sci. Technol. 2020, 41, 537–546. [Google Scholar]
  16. Fuerstenau, D.W.; Abouzeid, A.Z.M.; Phatak, P.B. Effect of particulate environment on the kinetics and energetics of dry ball milling. Int. J. Miner. Process. 2010, 97, 52–58. [Google Scholar] [CrossRef]
  17. Yang, J.L.; Shuai, Z.C.; Zhou, W.T.; Ma, S.J. Grinding optimization of cassiterite-polymetallic sulfide ore. Minerals. 2019, 9, 134. [Google Scholar] [CrossRef] [Green Version]
  18. Epstein, B. Logarithmico-normal distribution in breakage of solids. Ind. Eng. Chem. 1948, 40, 2289–2291. [Google Scholar] [CrossRef]
  19. Sun, R.G.; Gao, Y.; Yang, Y. Leaching of heavy metals from lead-zinc mine tailings and the subsequent migration and transformation characteristics in paddy soil. Chemosphere 2021, 291, 132792. [Google Scholar]
  20. Leung, K. An Energy Based Ore Specific Modelfor Autogenous and Semi-Autogenous Grinding. Ph.D. Thesis, University of Queensland, Brisbane, Austrilia, 1987. [Google Scholar]
  21. JK Tech. JkSimMet User Manual—Steady State Mineral Processing Simulator; JK Tech Pty Ltd.: Brisbane, Austrilia, 2003. [Google Scholar]
  22. Huang, L.L.; Zhang, G.W.; Song, X.X. Modelling and simulation of batch grinding with vertical stirred mill based on MATLAB/simulink. Min. Met. Eng. 2016, 36, 26–30. [Google Scholar]
  23. Austin, L.G.; Luckie, P.T. Methods for determination of breakage distribution parameters. Powder Technol. 1972, 5, 215–222. [Google Scholar] [CrossRef]
  24. Austin, L.G.; Shoji, K.; Bell, D. Rate equations for non-linear breakage in mills due to material effects. Powder Technol. 1982, 31, 127–133. [Google Scholar] [CrossRef]
  25. Reid, K.J. A solution to the batch grinding equation. Chem. Eng. Sci. 1965, 20, 953–963. [Google Scholar] [CrossRef]
  26. Morozov, E.F.; Shumailov, V.K. Modified solution of the batch grinding equation. Sov. Min. Sci. 1983, 19, 43–47. [Google Scholar] [CrossRef]
  27. Juntao, J.A.; Pingfa, F.A.; Shiliang, W.B.; Hong, Z.C. Investigation on surface morphology model of Si3N4 ceramics for rotary ultrasonic grinding machining based on the neural network. Appl. Surf. Sci. 2017, 396, 85–94. [Google Scholar]
  28. Cai, M.H.; Peng, Z.N.; Hu, Z.S.; Li, Y. Zn, He-Ar and Sr-Nd isotopic compositions of the Tongkeng Tin-polymetallic ore deposit in south China: Implication for ore genesis. Ore Geol. Rev. 2020, 124, 103605. [Google Scholar] [CrossRef]
Figure 1. Picture of the tumbling mill.
Minerals 12 01354 g001
Figure 2. The flowchart of the Simulink platform.
Minerals 12 01354 g002
Figure 3. Particle size distribution from breakage product of different fractions. ((ae) are for Tongkeng ore; (a’–e’) are for Gaofeng ore).
Minerals 12 01354 g003aMinerals 12 01354 g003b
Figure 4. Fitting curve of t10 and specific crushing energy Ecs of Tongkeng ore and Gaofeng ore.
Minerals 12 01354 g004
Figure 5. The t10 change curve of two ores at different specific crushing energies.
Minerals 12 01354 g005
Figure 6. Product particle size composition of Tongkeng ore at different grinding times.
Minerals 12 01354 g006
Figure 7. Product particle size composition of Gaofeng ore at different grinding times.
Minerals 12 01354 g007
Figure 8. Prediction results of BIII method for Tongkeng ore and Gaofeng ore.
Minerals 12 01354 g008
Figure 9. Prediction results of JK drop-weight method for Tongkeng ore and Gaofeng ore.
Minerals 12 01354 g009
Figure 10. Prediction results of PSO–BP method for Tongkeng ore and Gaofeng ore.
Minerals 12 01354 g010
Table 1. Particle size distribution of two types of ores’ samples.
Particle Size/mmTongkeng OreGaofeng Ore
Yield/%Cumulative Distribution
under Sieve/%
Yield/%Cumulative Distribution
under Sieve/%
−1.7 + 1.1819.41100.0024.63100.00
−1.18 + 0.8514.5680.5918.1875.37
−0.85 + 0.612.1366.0313.7857.18
−0.6 + 0.4259.7053.9011.4443.40
−0.425 + 0.38.0944.205.5731.96
−0.3 + 0.2127.5536.115.8726.39
−0.212 + 0.155.6628.564.6920.53
−0.15 + 0.1063.7722.903.8115.84
−0.106 + 0.0753.2319.133.2312.02
−0.075 + 0.0533.2315.902.358.80
−0.053 + 0.0381.8912.671.476.45
−0.03810.7810.784.994.99
Total100.00100.00
Table 2. The relationship between experimental parameters and ore properties.
ParametersVery HardHardMedium HardMediumMedium SoftSoftVery Soft
A × b<3030~3838~4343~5656~6767~127>127
Table 3. The grinding parameters for Tongkeng ore and Gaofeng ore.
Grinding ParametersTongkengGaofeng
Mass of Ore Feeding Material500 g500 g
Filling Ratio35%34%
Total Mass of the Iron Ball20.58 kg20.00 kg
Grinding Concentration67%73%
Rotational Rate75%70%
Table 4. Chemical components of Tongkeng ore.
ComponentSiO2CaOFe2O3SO3Al2O3ZnOK2OMgO
Content/%45.928.28.47.24.12.30.90.7
ComponentSnO2As2O3PbOP2O5Sb2O3MnOOthers
Content/%0.50.50.30.40.40.10.1
Table 5. Chemical components of Gaofeng ore.
ComponentSiO2CaOFe2O3SO3Al2O3ZnOK2O
Content/%5.017.024.233.51.312.20.4
ComponentMgOPbOSnO2Sb2O3MnOAs2O3Others
Content/%2.91.80.11.30.10.10.1
Table 6. The specific parameter values of Tongkeng ore and Gaofeng ore.
Type of OreAbA × b
Tongkeng65.00540.810952.71
Gaofeng69.59001.5186105.68
Table 7. Experimental values of the yields of grinding product.
Particle Size/mmExperimental Values/%
Tongkeng OreGaofeng Ore
+0.158.097.37
−0.15 + 0.10610.469.83
−0.106 + 0.07512.1113.91
−0.075 + 0.05312.4917.78
−0.053 + 0.0387.1410.86
−0.03849.7140.25
Table 8. Error comparison of Tongkeng ore and Gaofeng ore.
Particle Size/mmTongkeng OreGaofeng Ore
Absolute
Error/%
Relative
Error/%
Absolute
Error/%
Relative
Error/%
+0.154.0550.063.2243.69
−0.15 + 0.106−1.05−10.04−0.15−1.53
−0.106 + 0.0750.453.72−0.91−6.54
−0.075 + 0.0530.584.640.160.90
−0.053 + 0.038−0.01−0.14−1.12−10.31
−0.038−4.02−8.09−1.2−2.98
Total10.1676.696.7665.95
Table 9. Error comparison of Tongkeng ore and Gaofeng ore.
Particle Size/mmTongkeng OreGaofeng Ore
Absolute
Error/%
Relative
Error/%
Absolute
Error/%
Relative
Error/%
+0.15−0.3−3.71%−0.03−0.41
−0.15 + 0.1060.060.57%0.232.34
−0.106 + 0.0750.262.15%−0.98−7.05
−0.075 + 0.0530.433.44%−0.45−2.53
−0.053 + 0.0380.121.68%−0.87−8.01
−0.038−0.57−1.15%2.15.22
Total1.7412.74.6625.56
Table 10. Error comparison of Tongkeng ore and Gaofeng ore.
Particle Size/mmTongkeng OreGaofeng Ore
Absolute
Error/%
Relative
Error/%
Absolute
Error/%
Relative
Error/%
+0.150.212.60−0.05−0.68
−0.15 + 0.106−0.09−0.86−0.36−3.66
−0.106 + 0.075−0.29−2.390.916.54
−0.075 + 0.053−0.38−3.04−0.64−3.60
−0.053 + 0.0380.57.000.080.74
−0.0380.070.140.050.12
Total1.5416.042.0915.34
Table 11. Error comparison of different methods.
Prediction MethodTongkeng OreGaofeng Ore
BIII MethodJK Drop-Weight MethodPSO–BP MethodBIII MethodJK Drop-Weight MethodPSO–BP Method
Absolute Error/%10.161.741.546.764.662.09
Relative Error/%76.6912.716.0465.9525.5615.34
Publisher’s Note: MDPI stays neutral with regard to jurisdictional claims in published maps and institutional affiliations.

