
Evaluation of Radionuclide Levels in Drinking Water from Communities near Active and Abandoned Gold Mines and Tailings in the West Rand Region, Gauteng, South Africa

Abstract
:1. Introduction
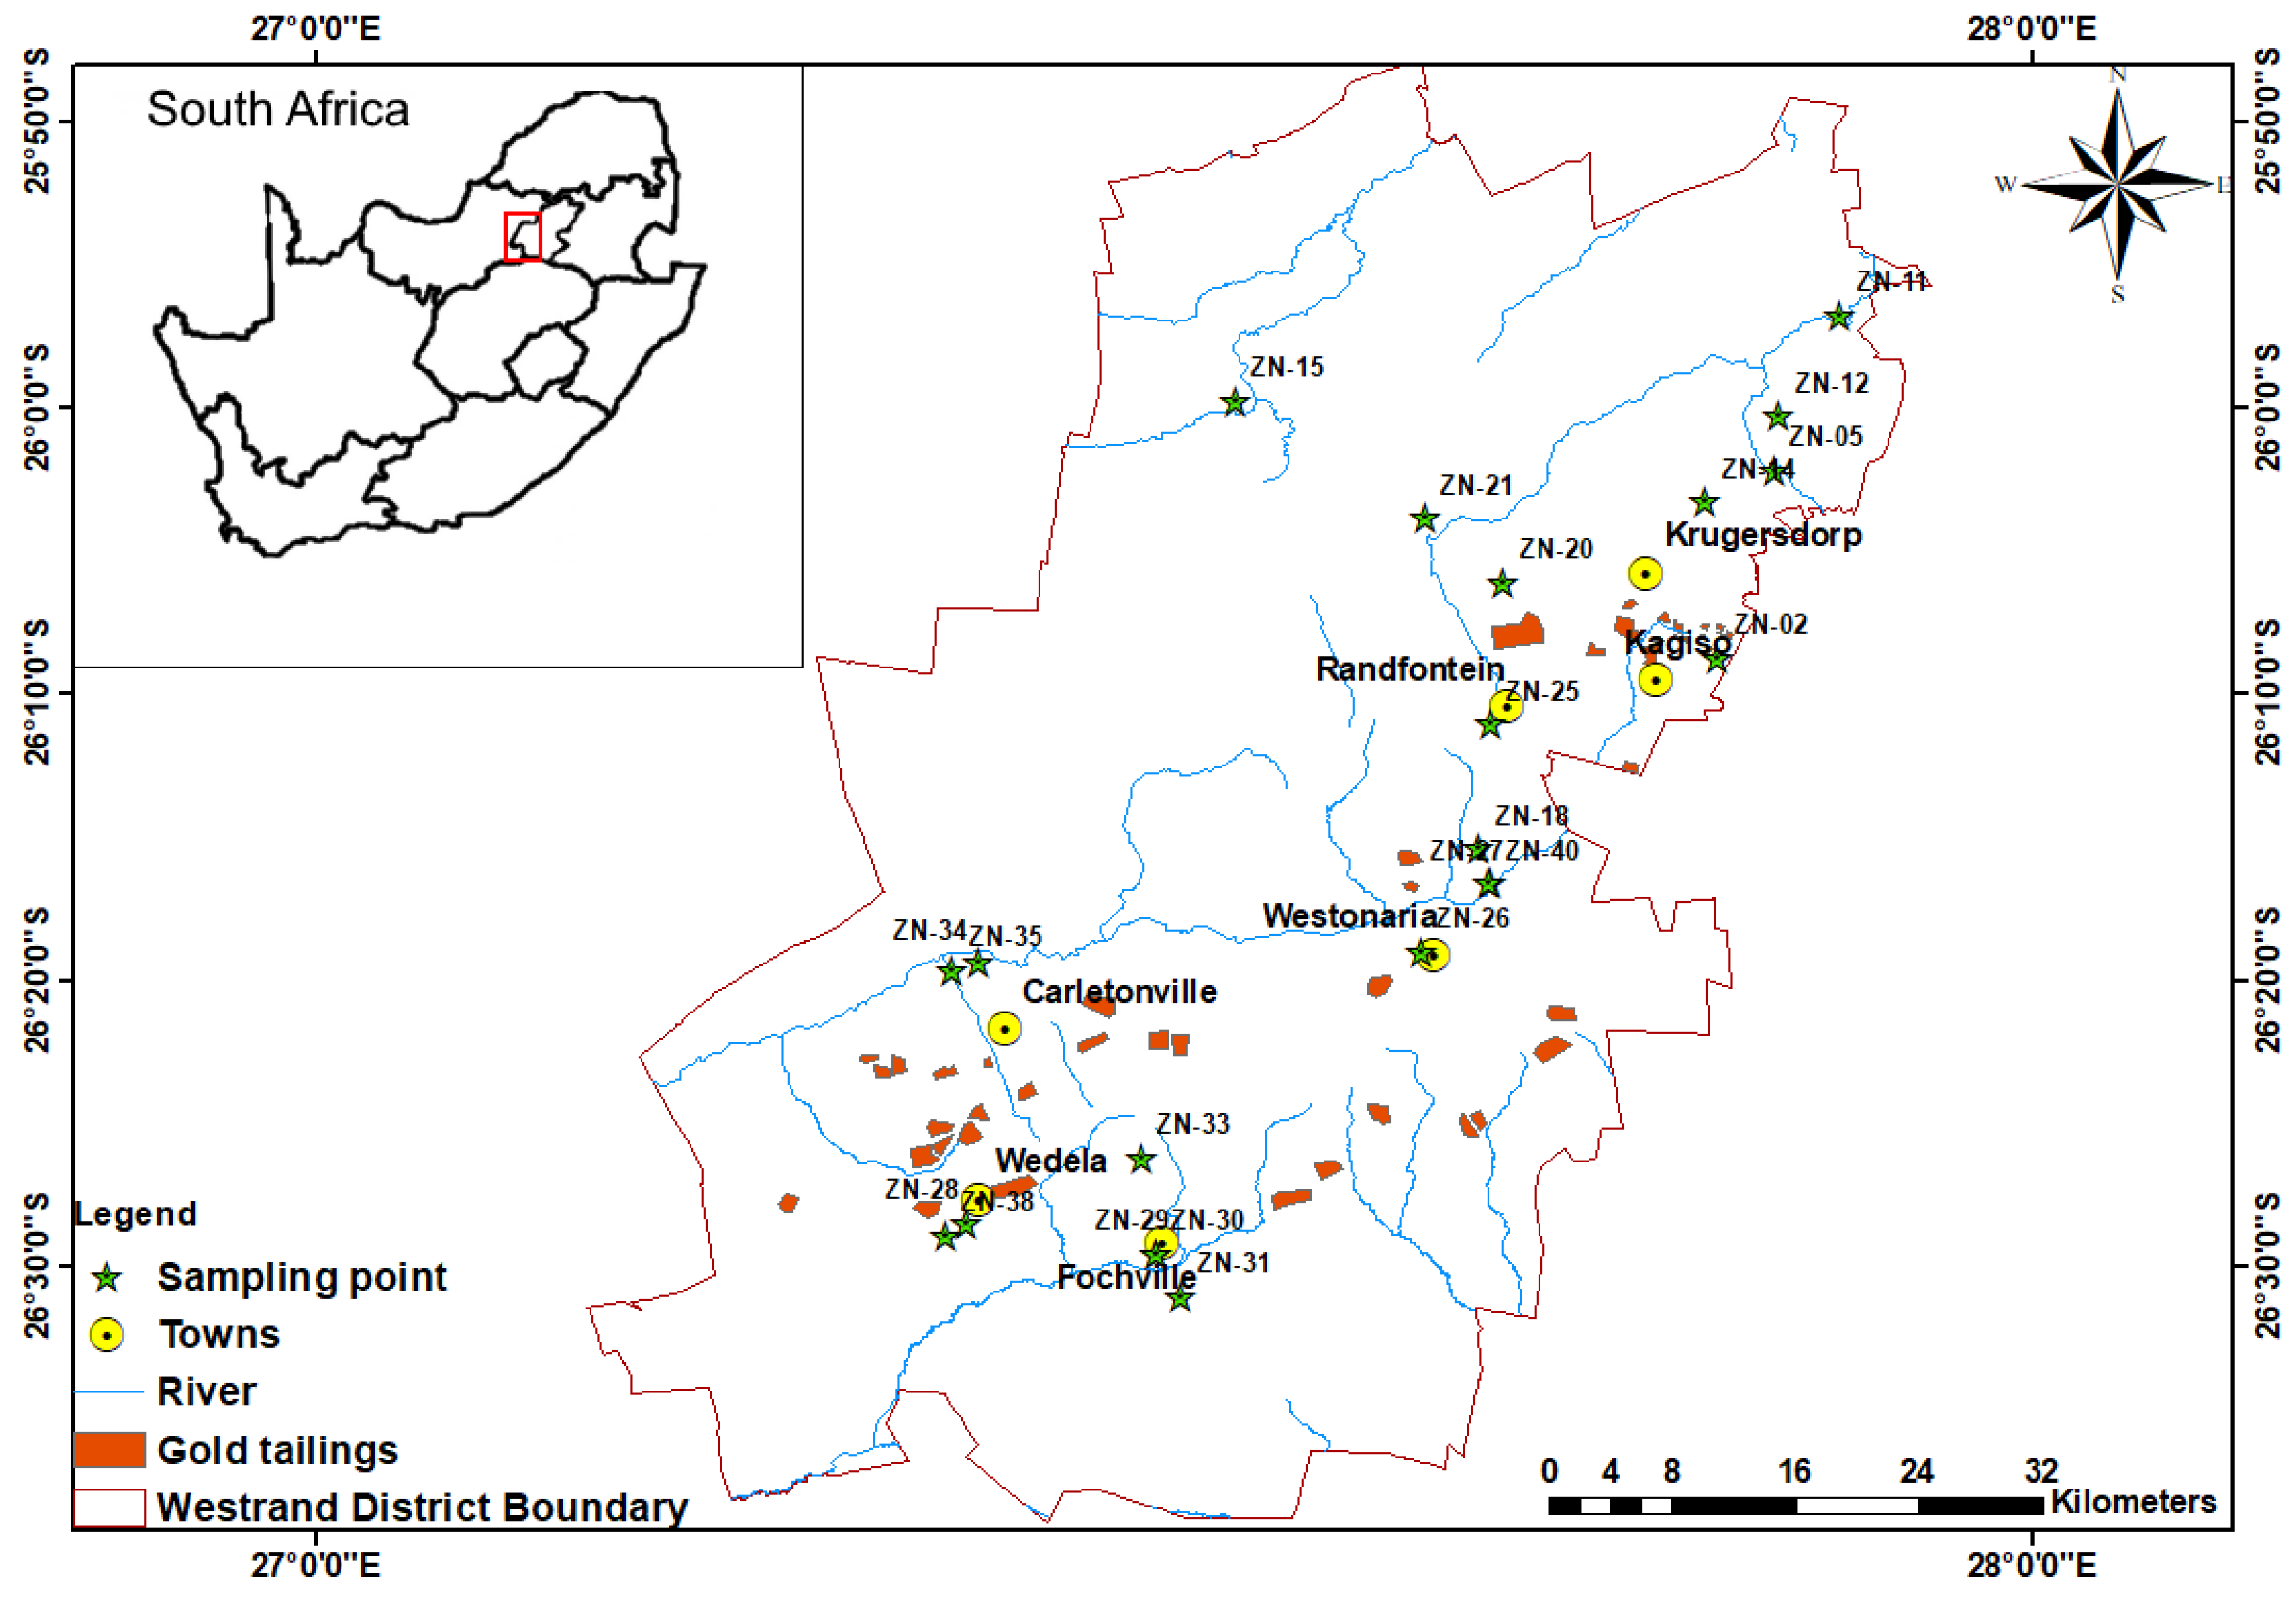
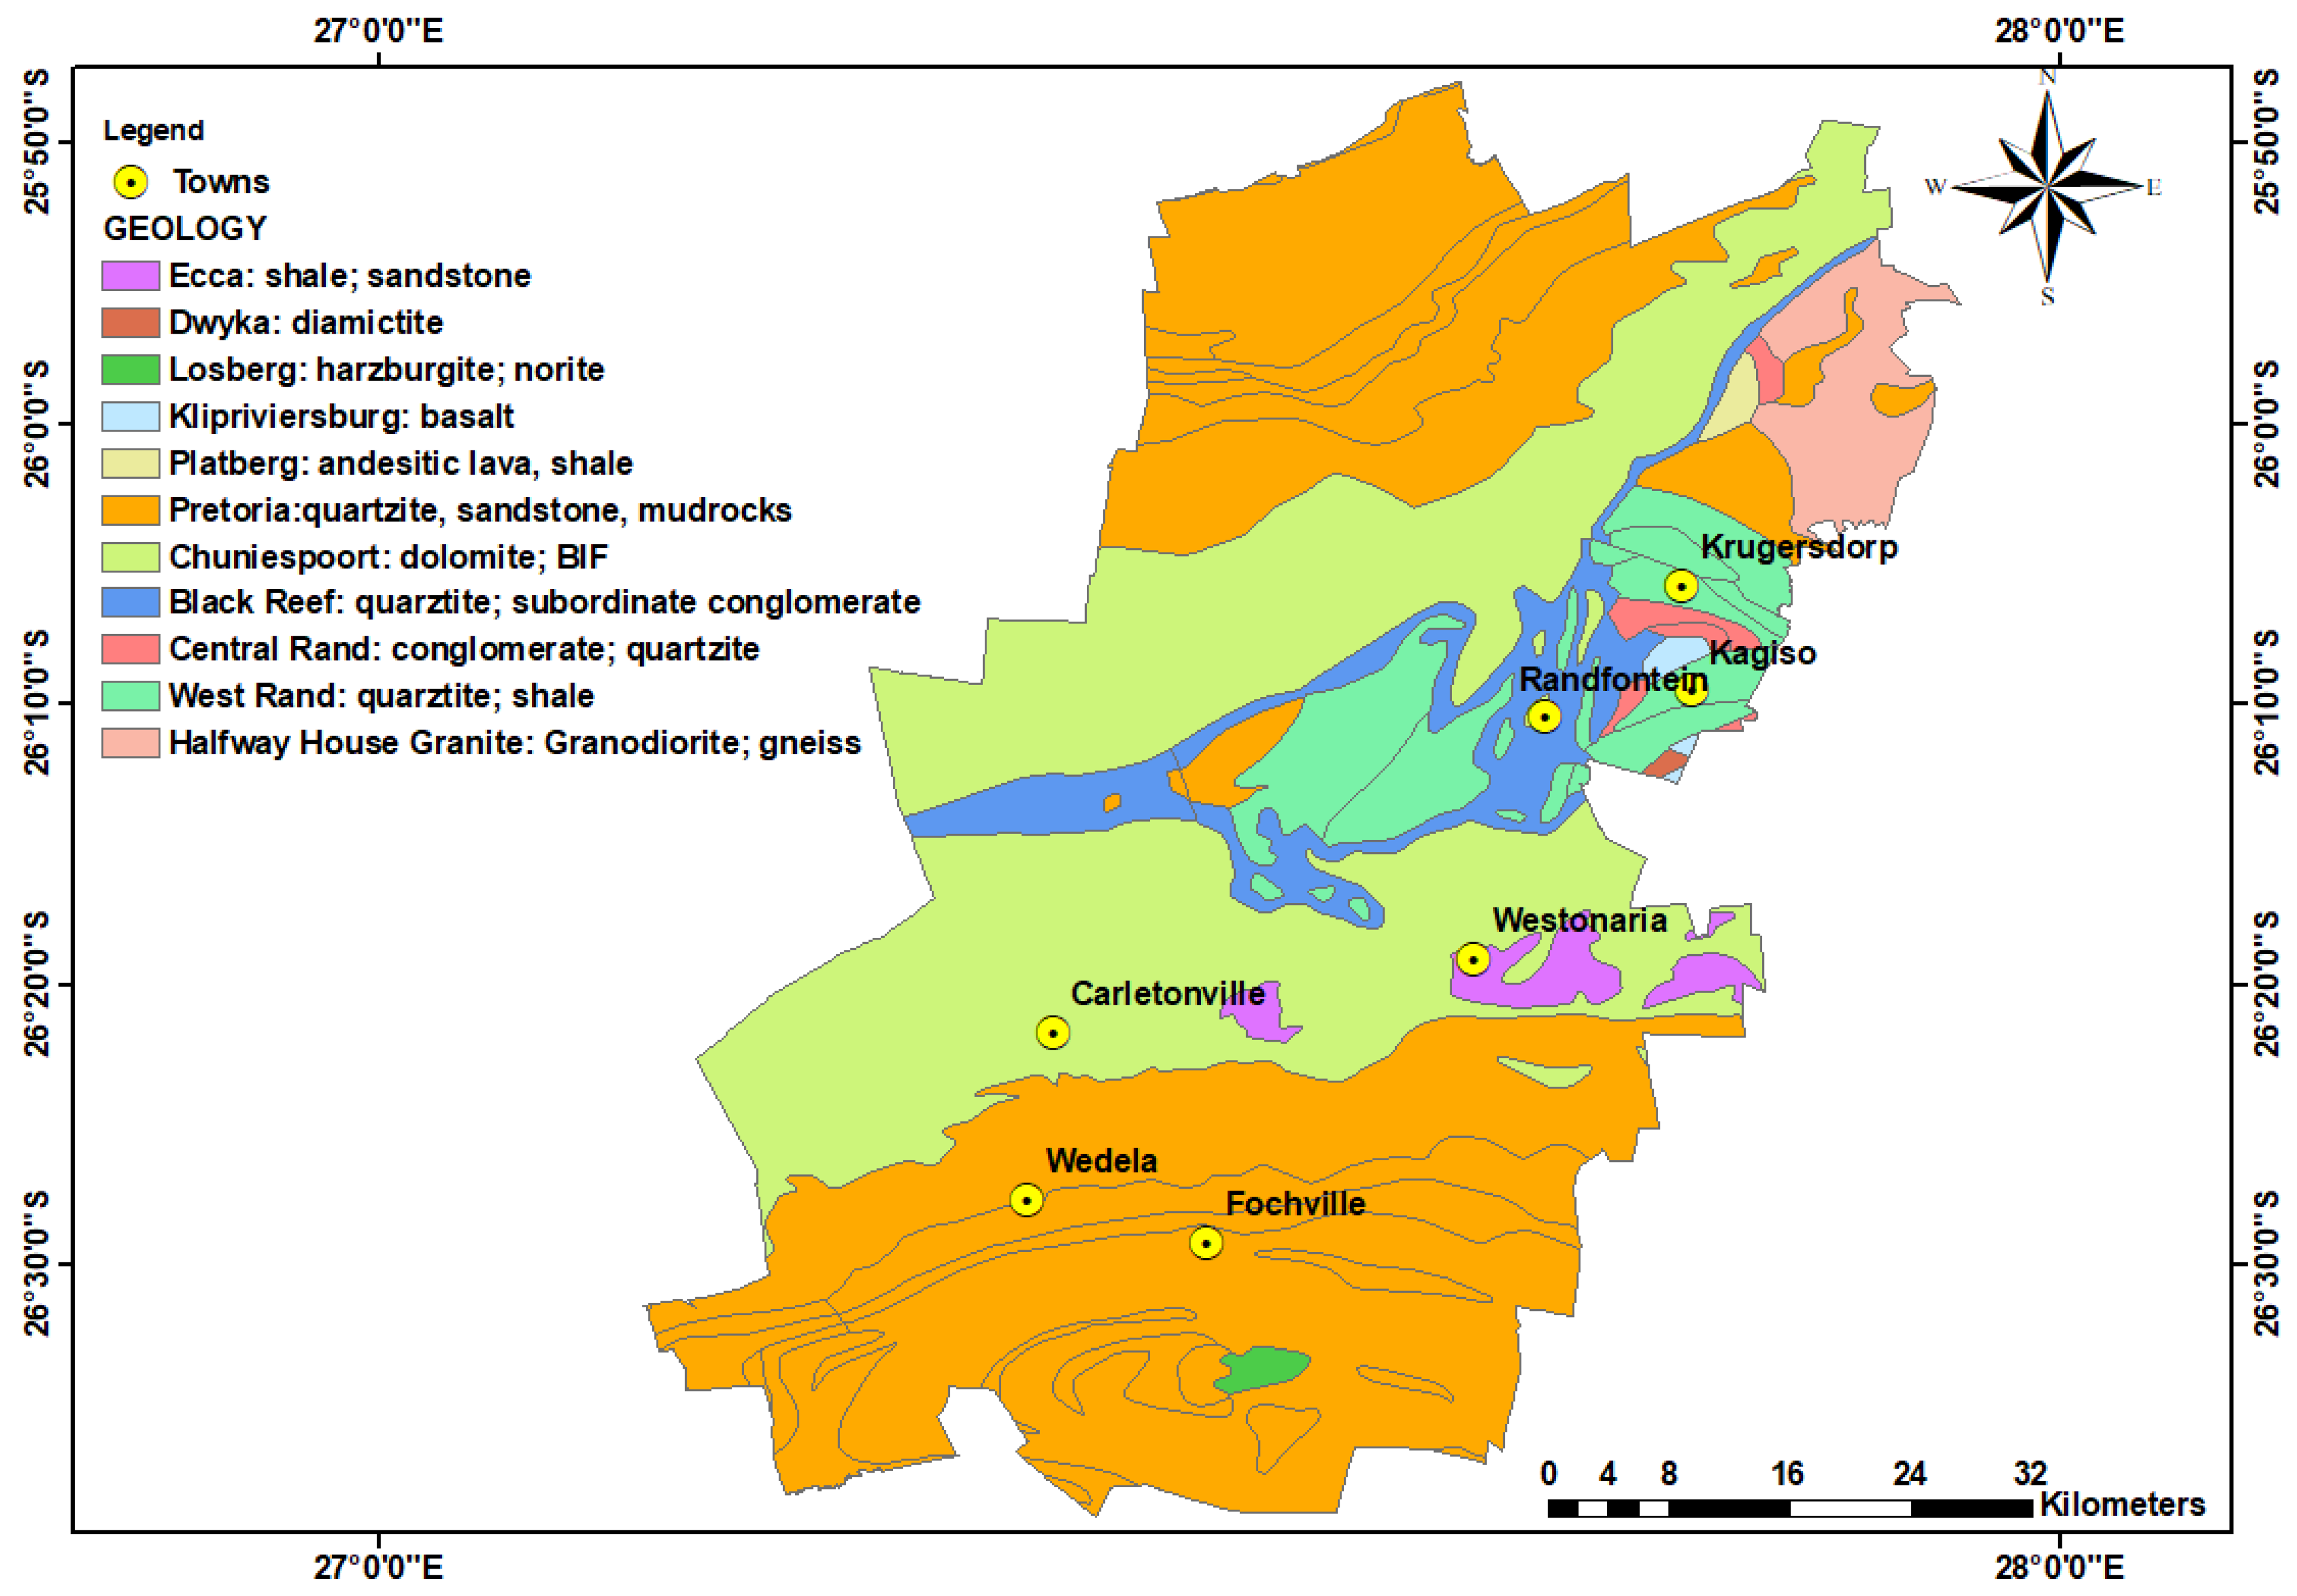
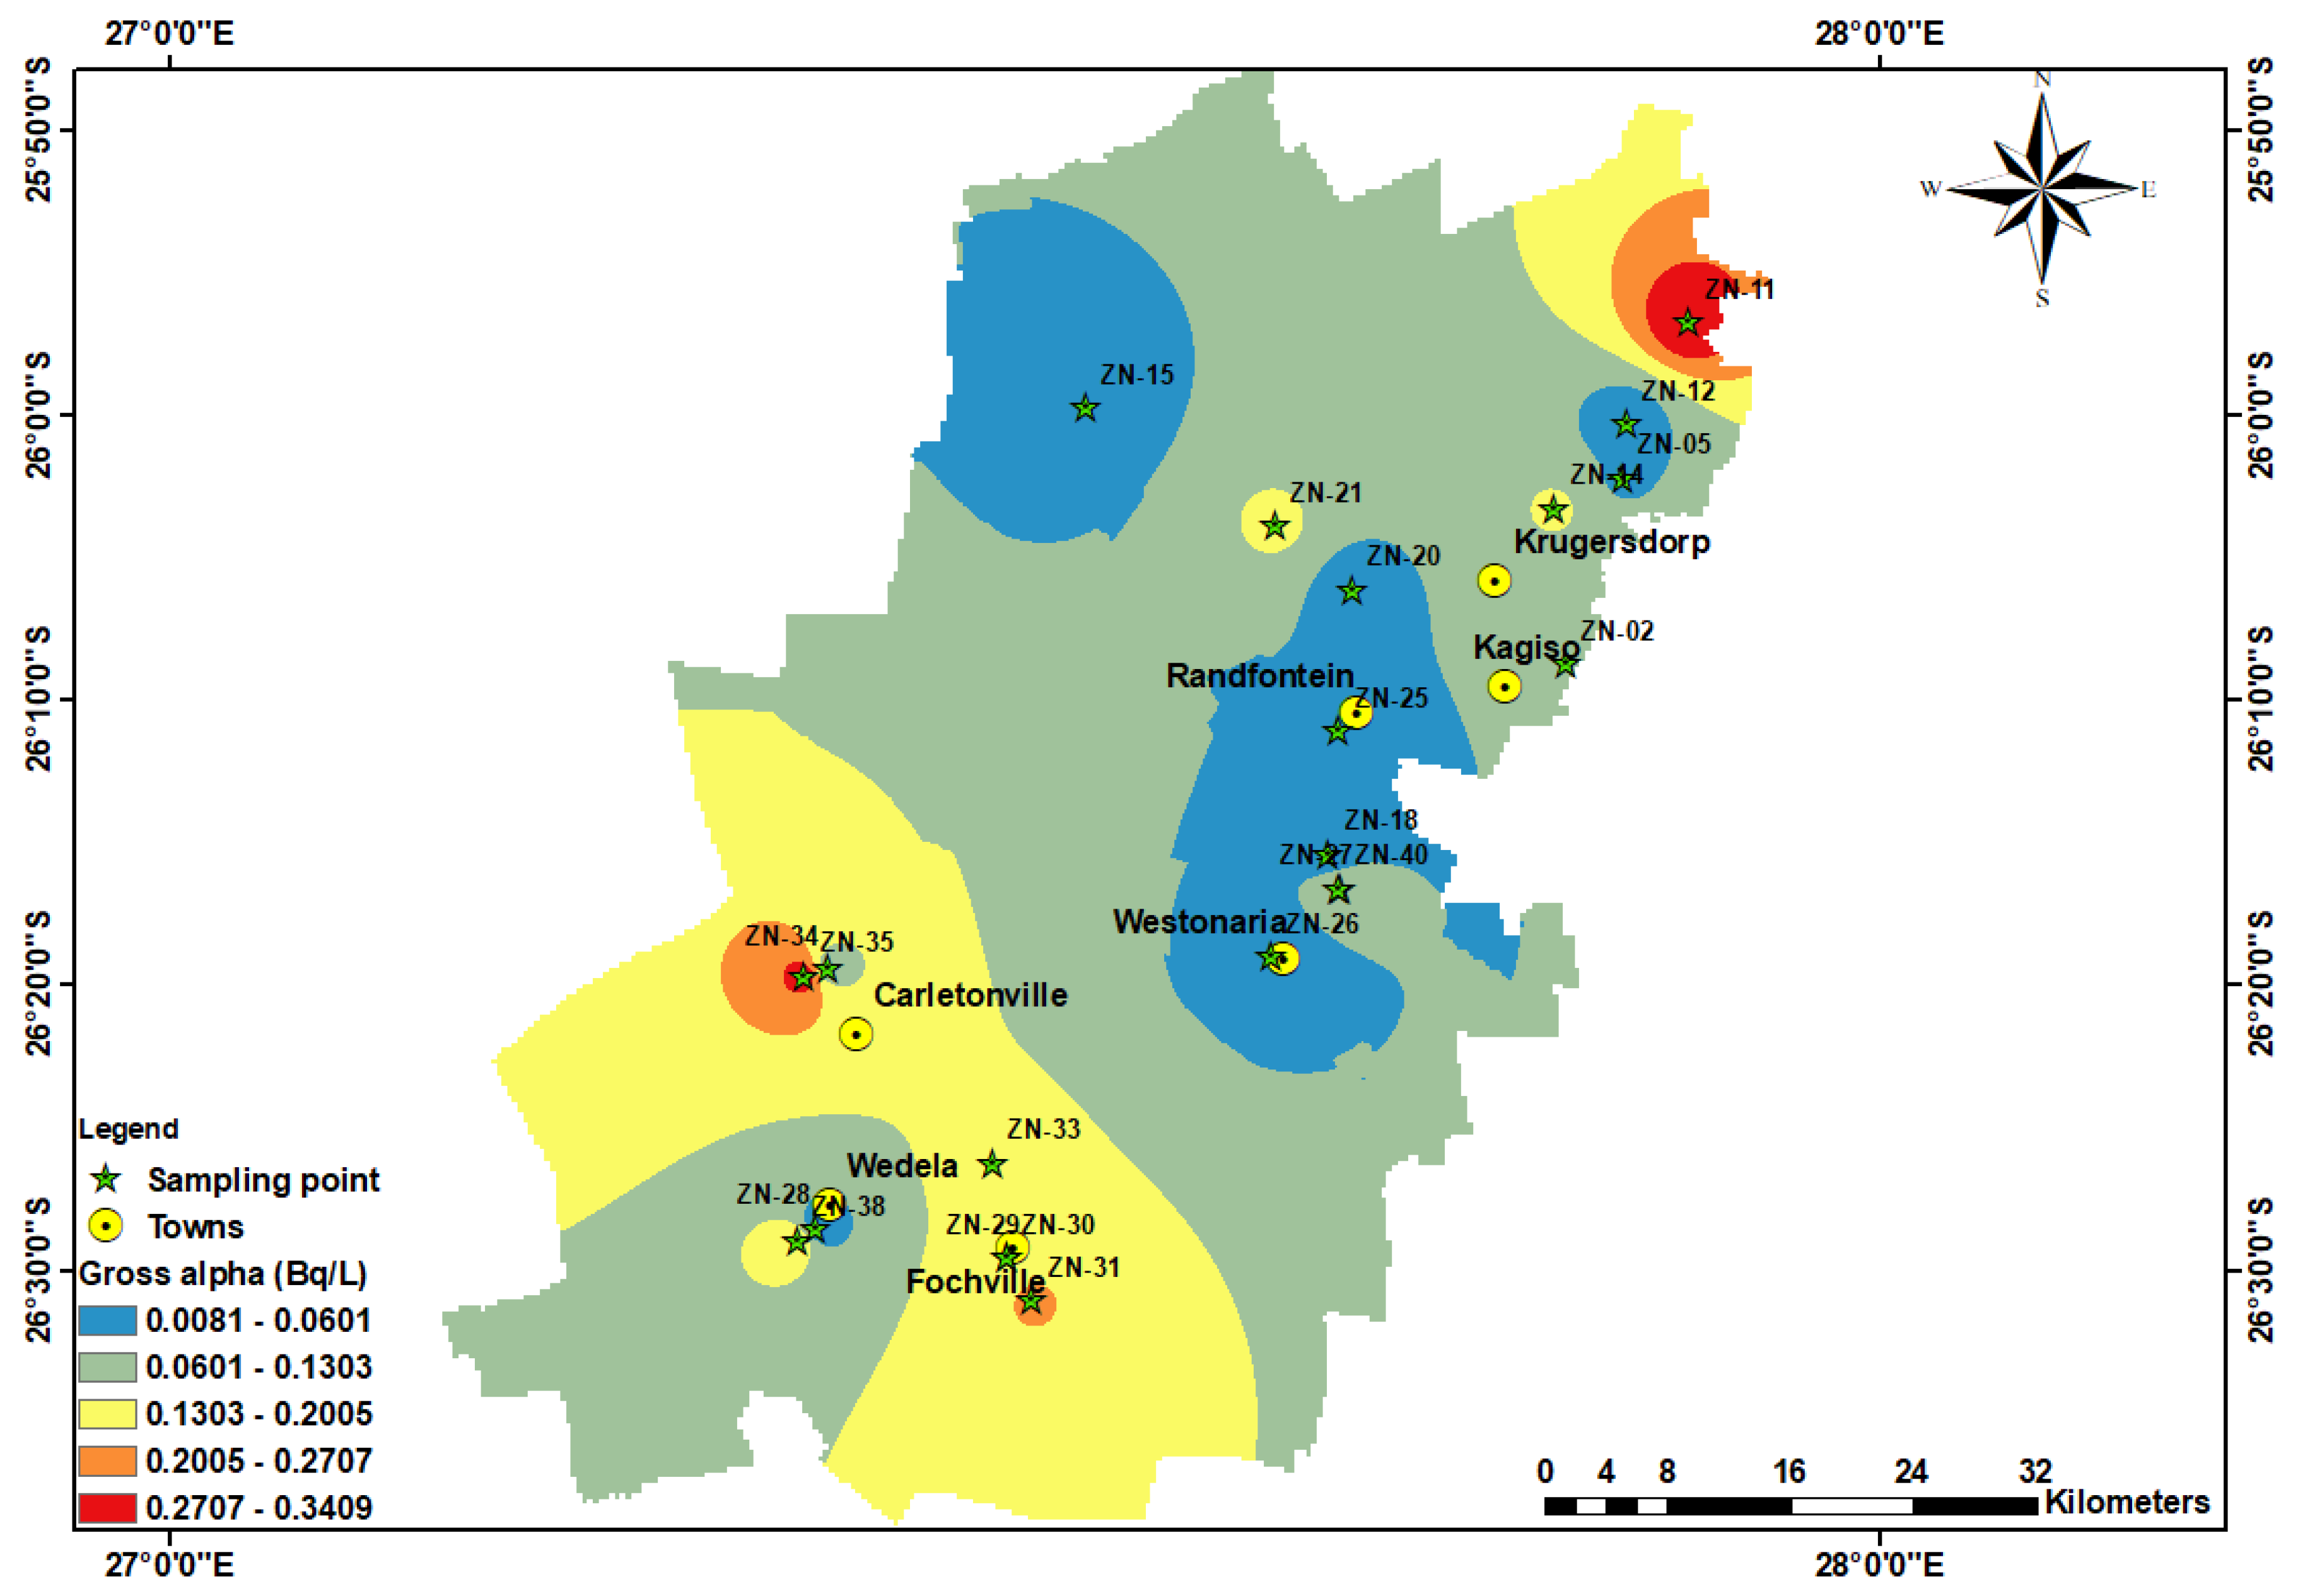
Study Site
- An intergranular aquifer in areas covered by alluvium and colluvium;
- Fractured aquifers in the Witwatersrand Supergroup that are associated with joints, fractures, and fissures;
- The karstic aquifer in the Malmani dolomites;
- The intergranular and fractured aquifers in the crystalline rocks.
2. Materials and Methods
2.1. Water Sampling
2.2. Health Risk Assessments
2.2.1. Annual Effective Dose
2.2.2. Cancer Risk Assessment
3. Results
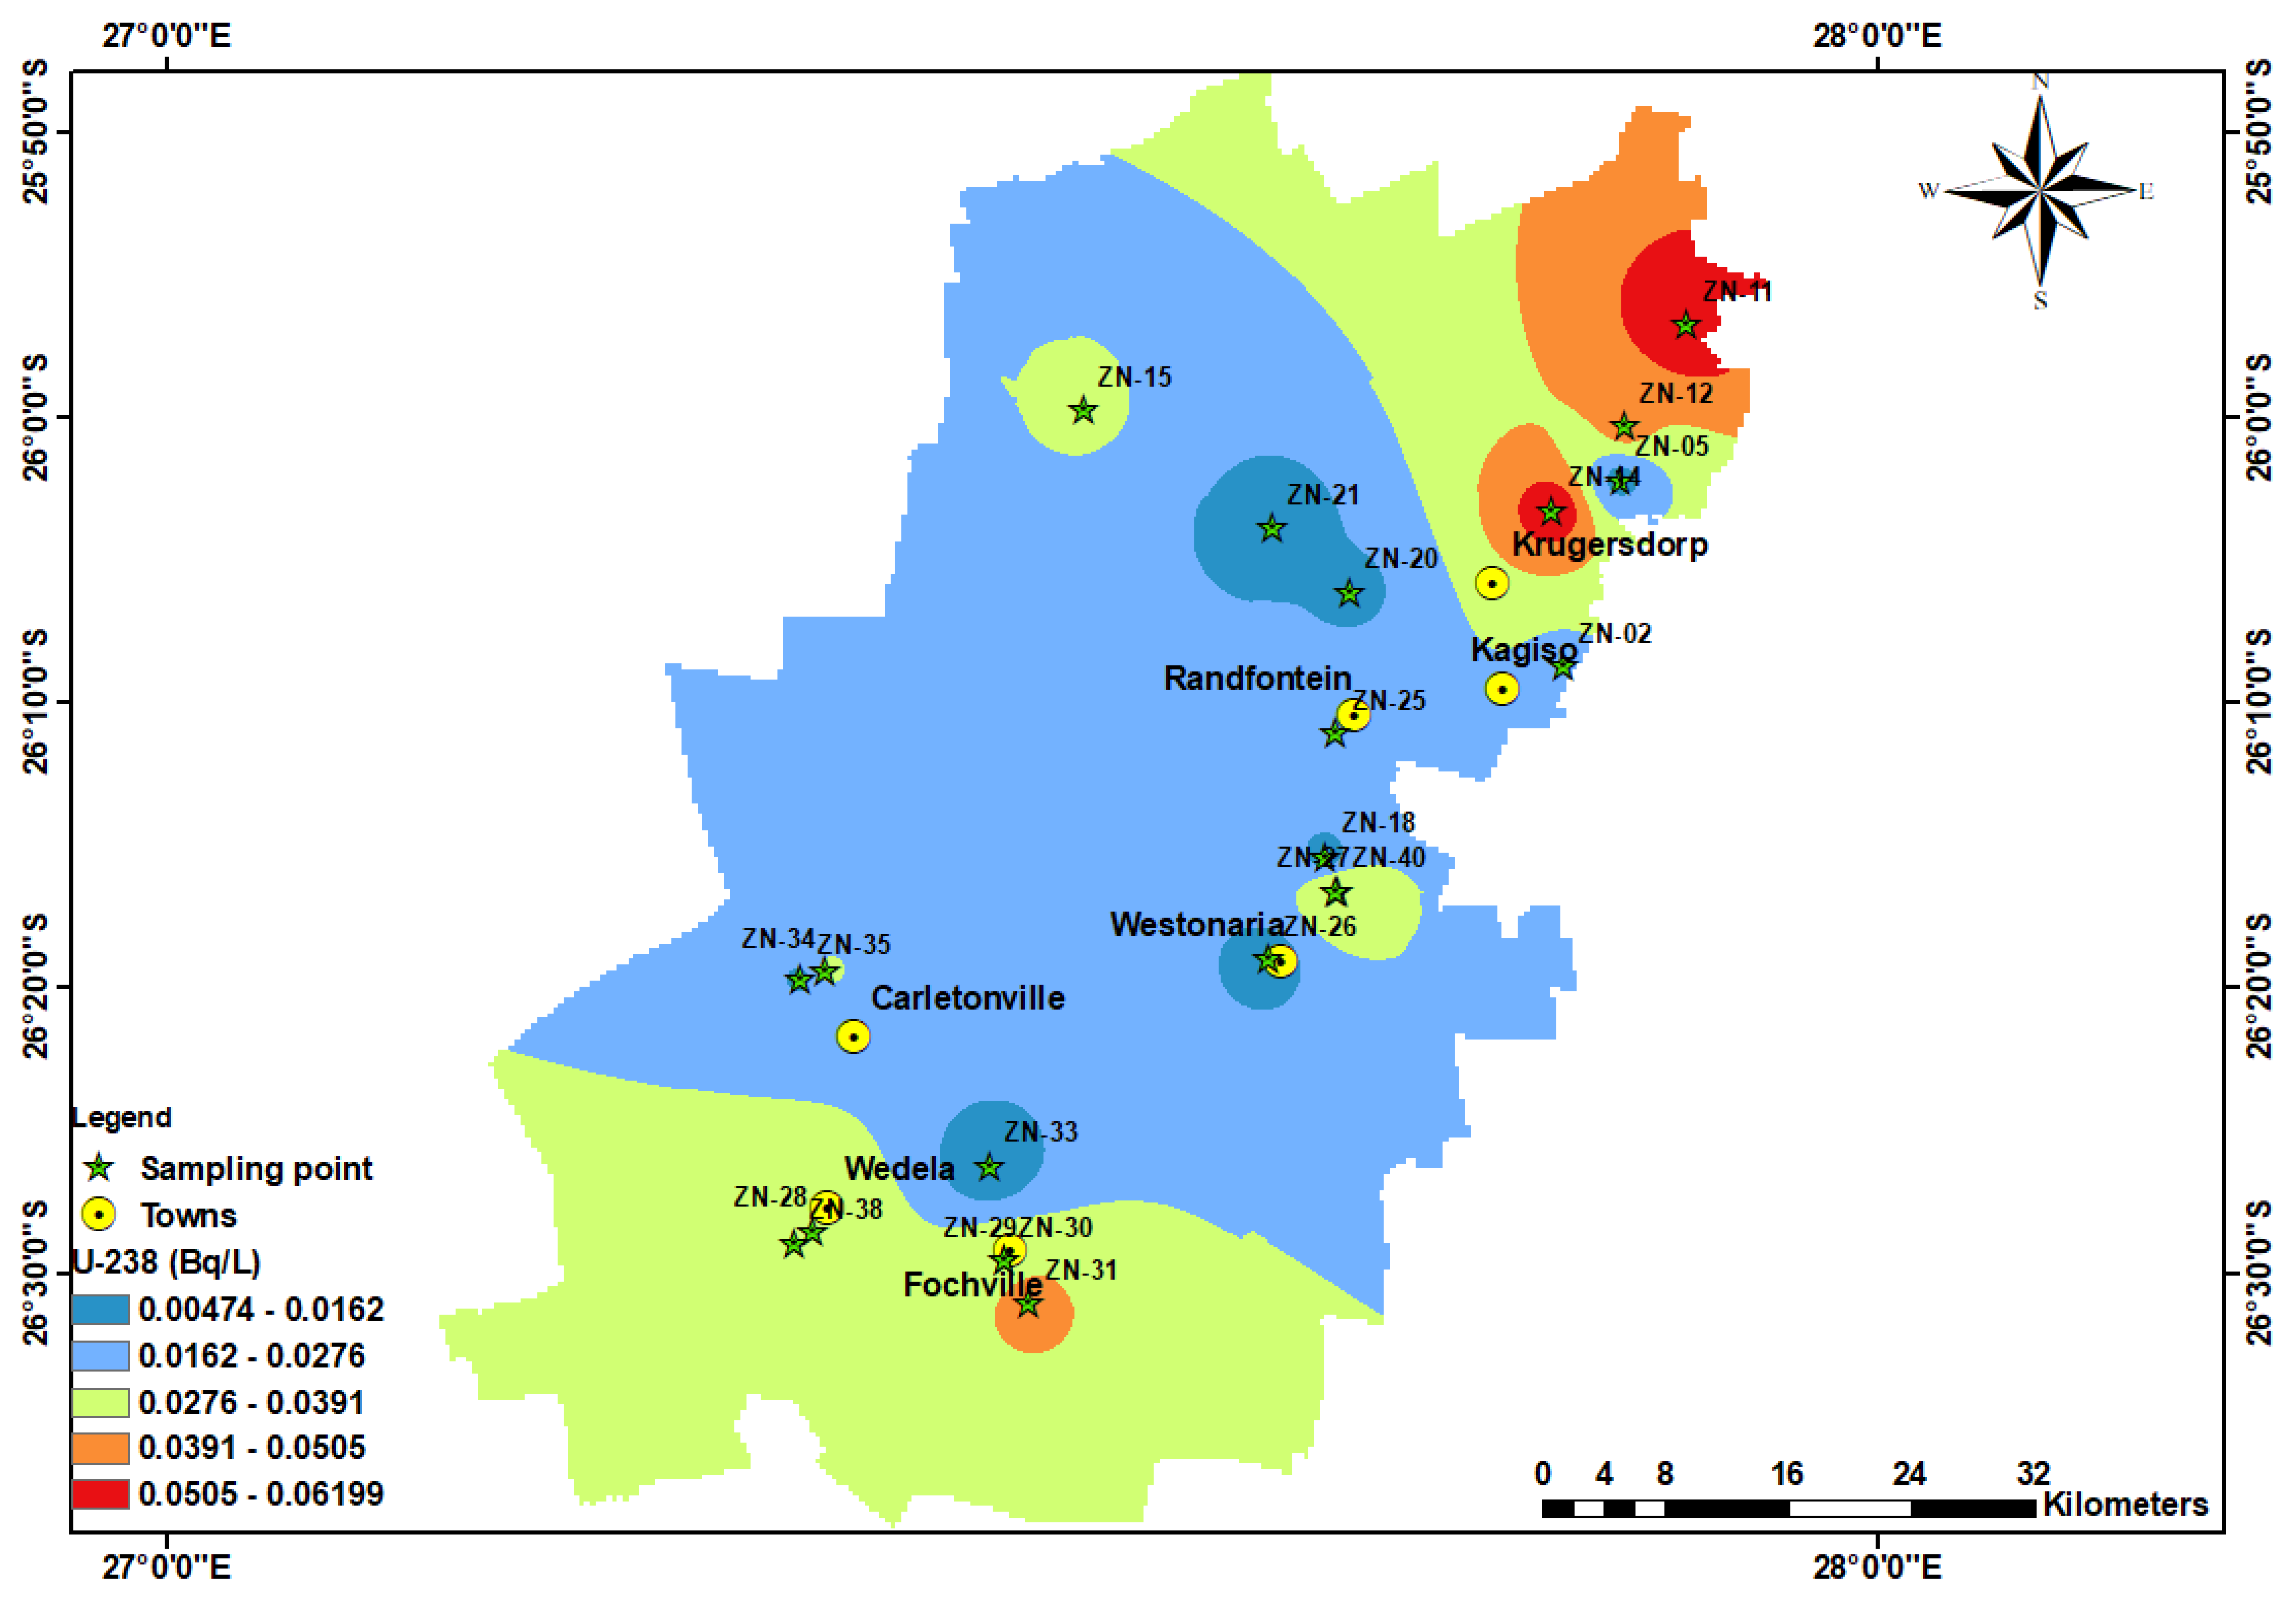
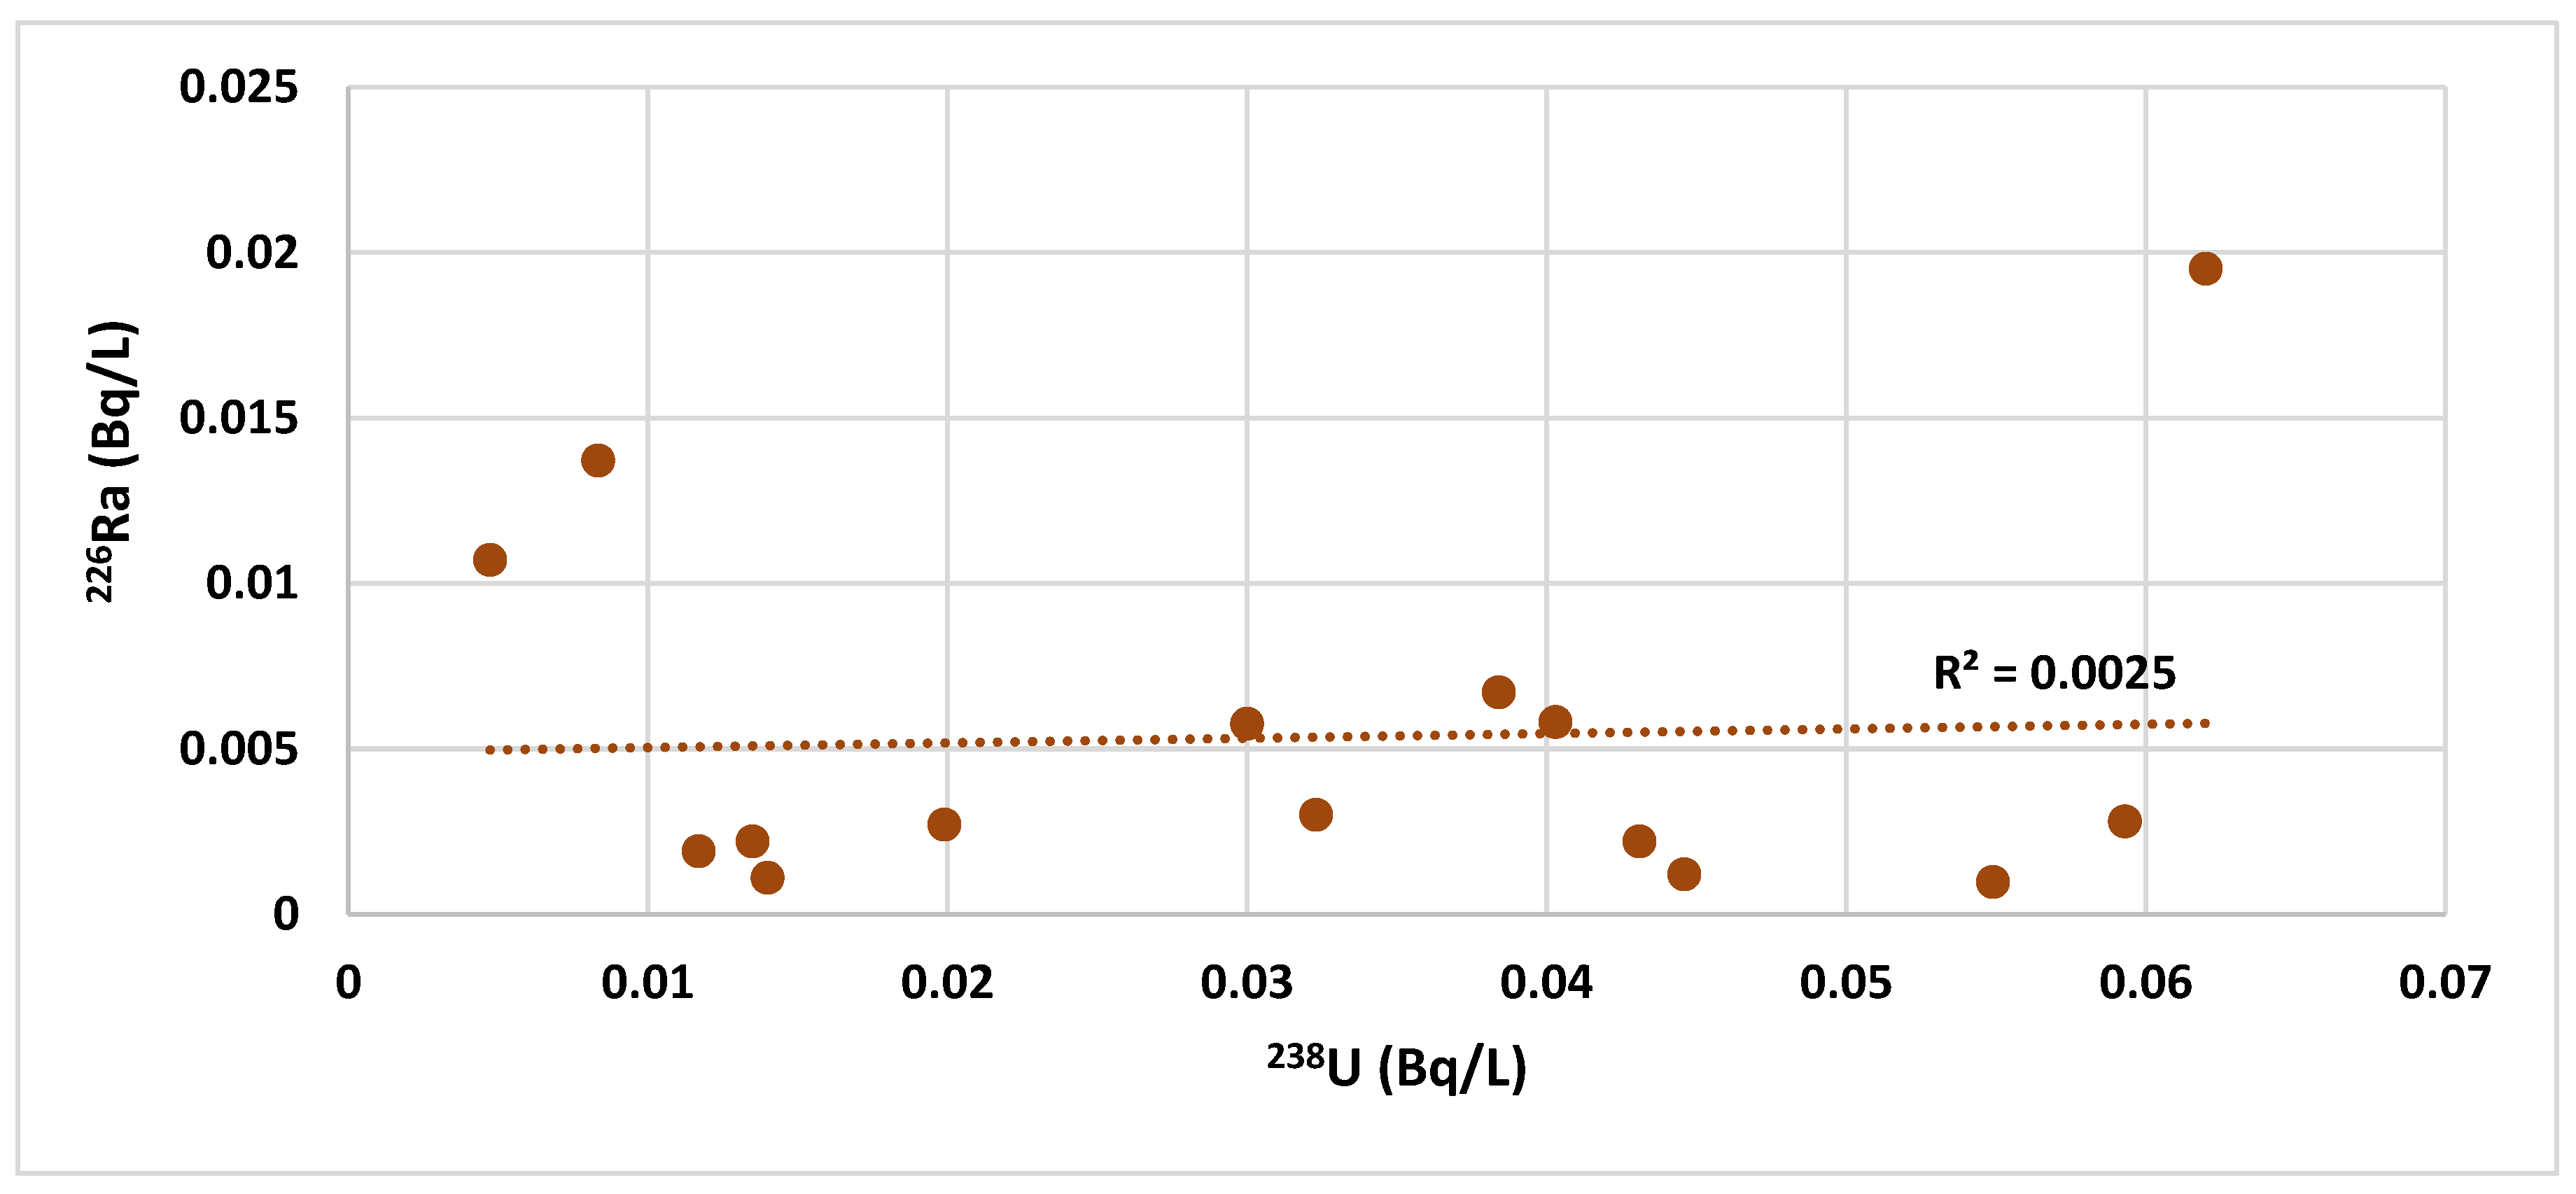
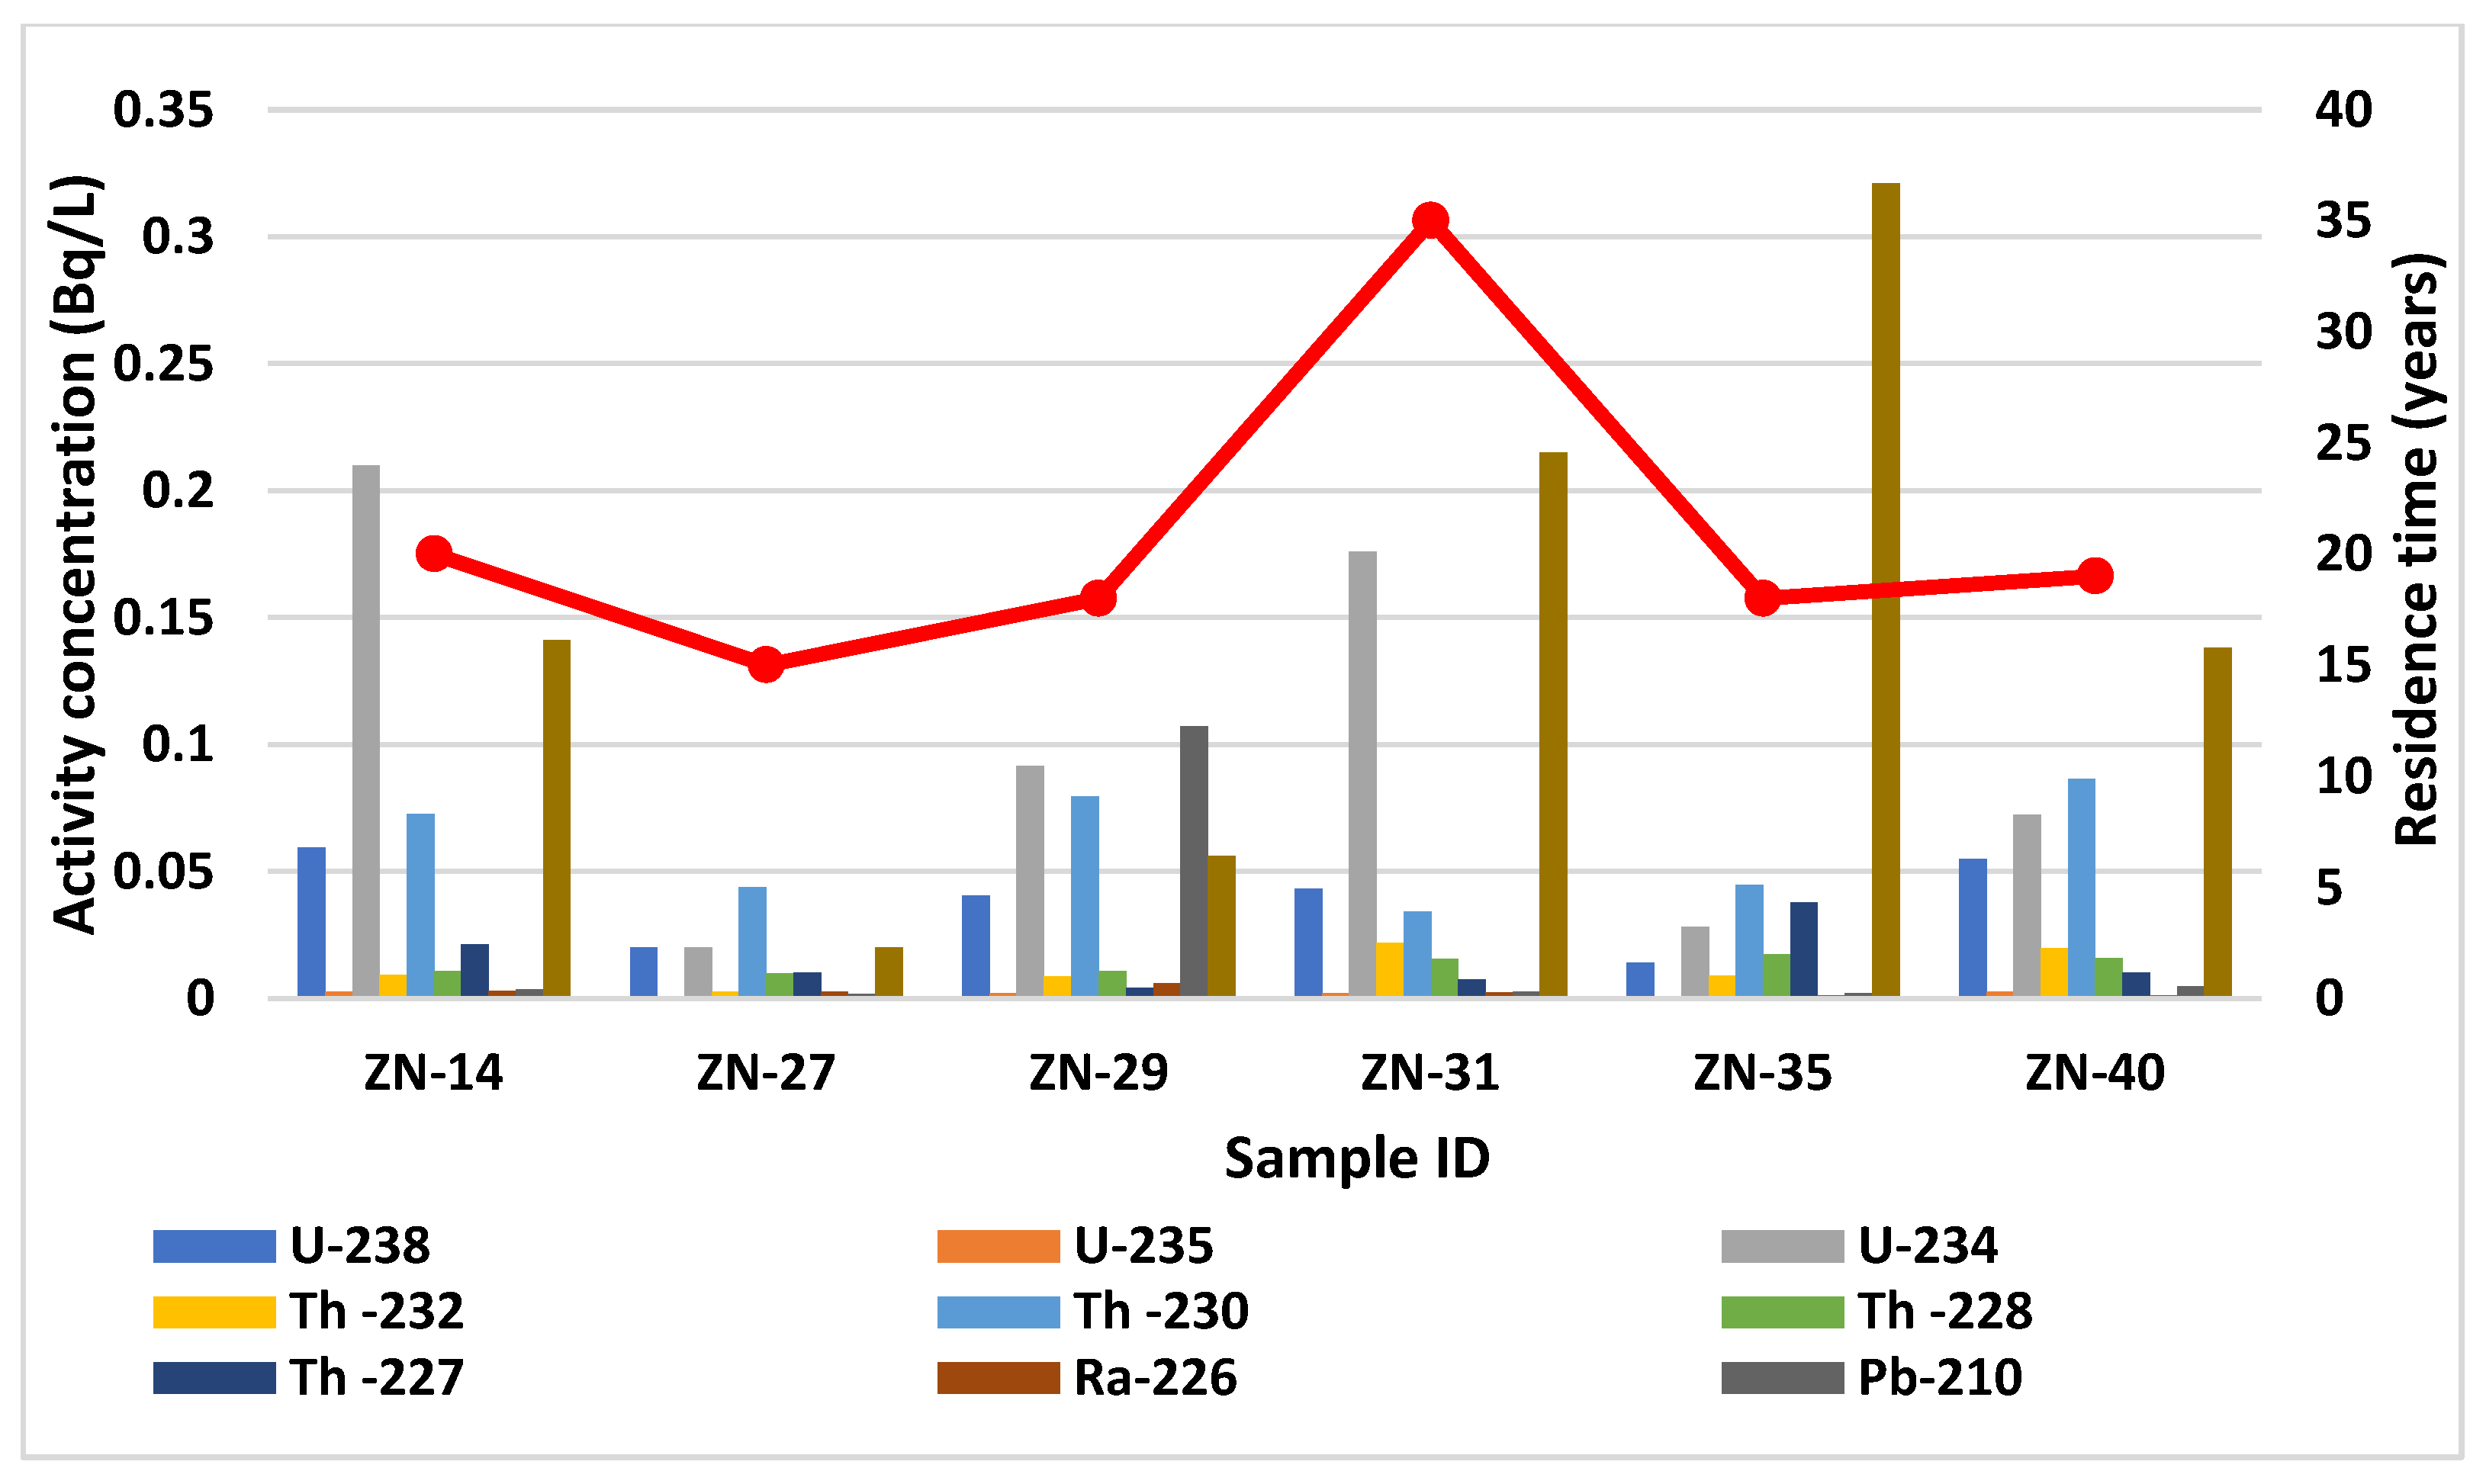
3.1. NORMs in Water
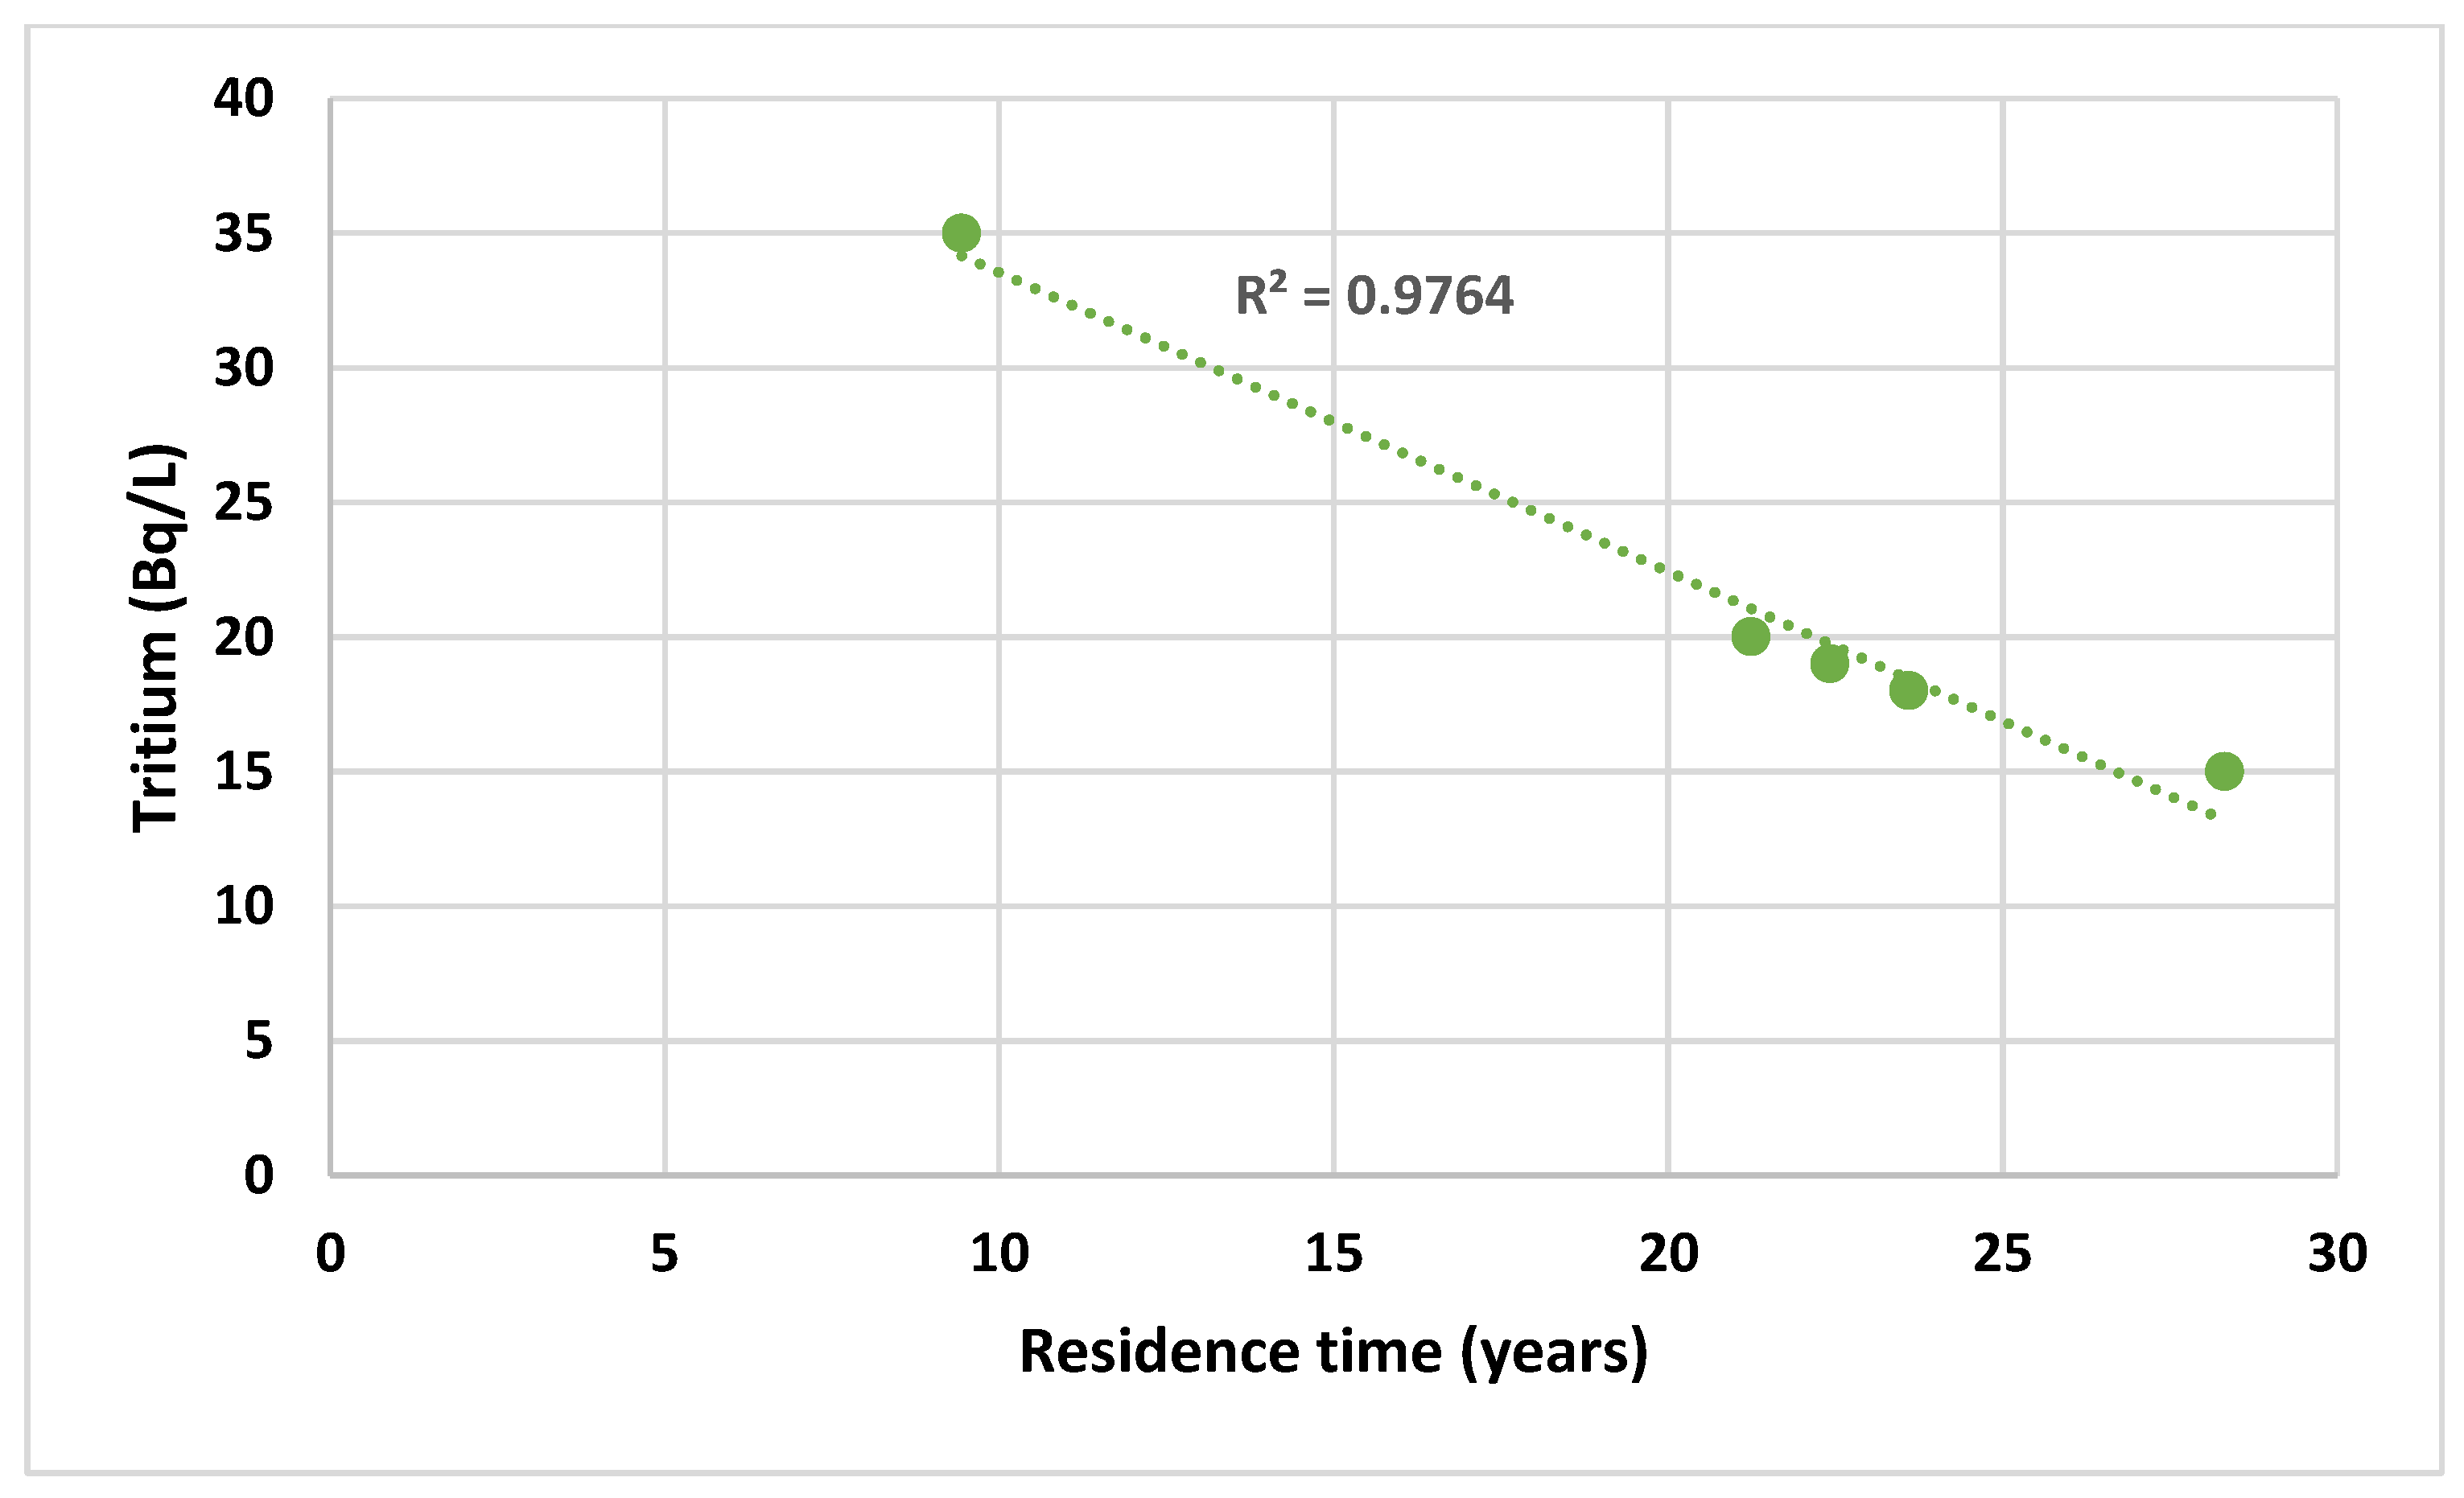
3.2. Tritium
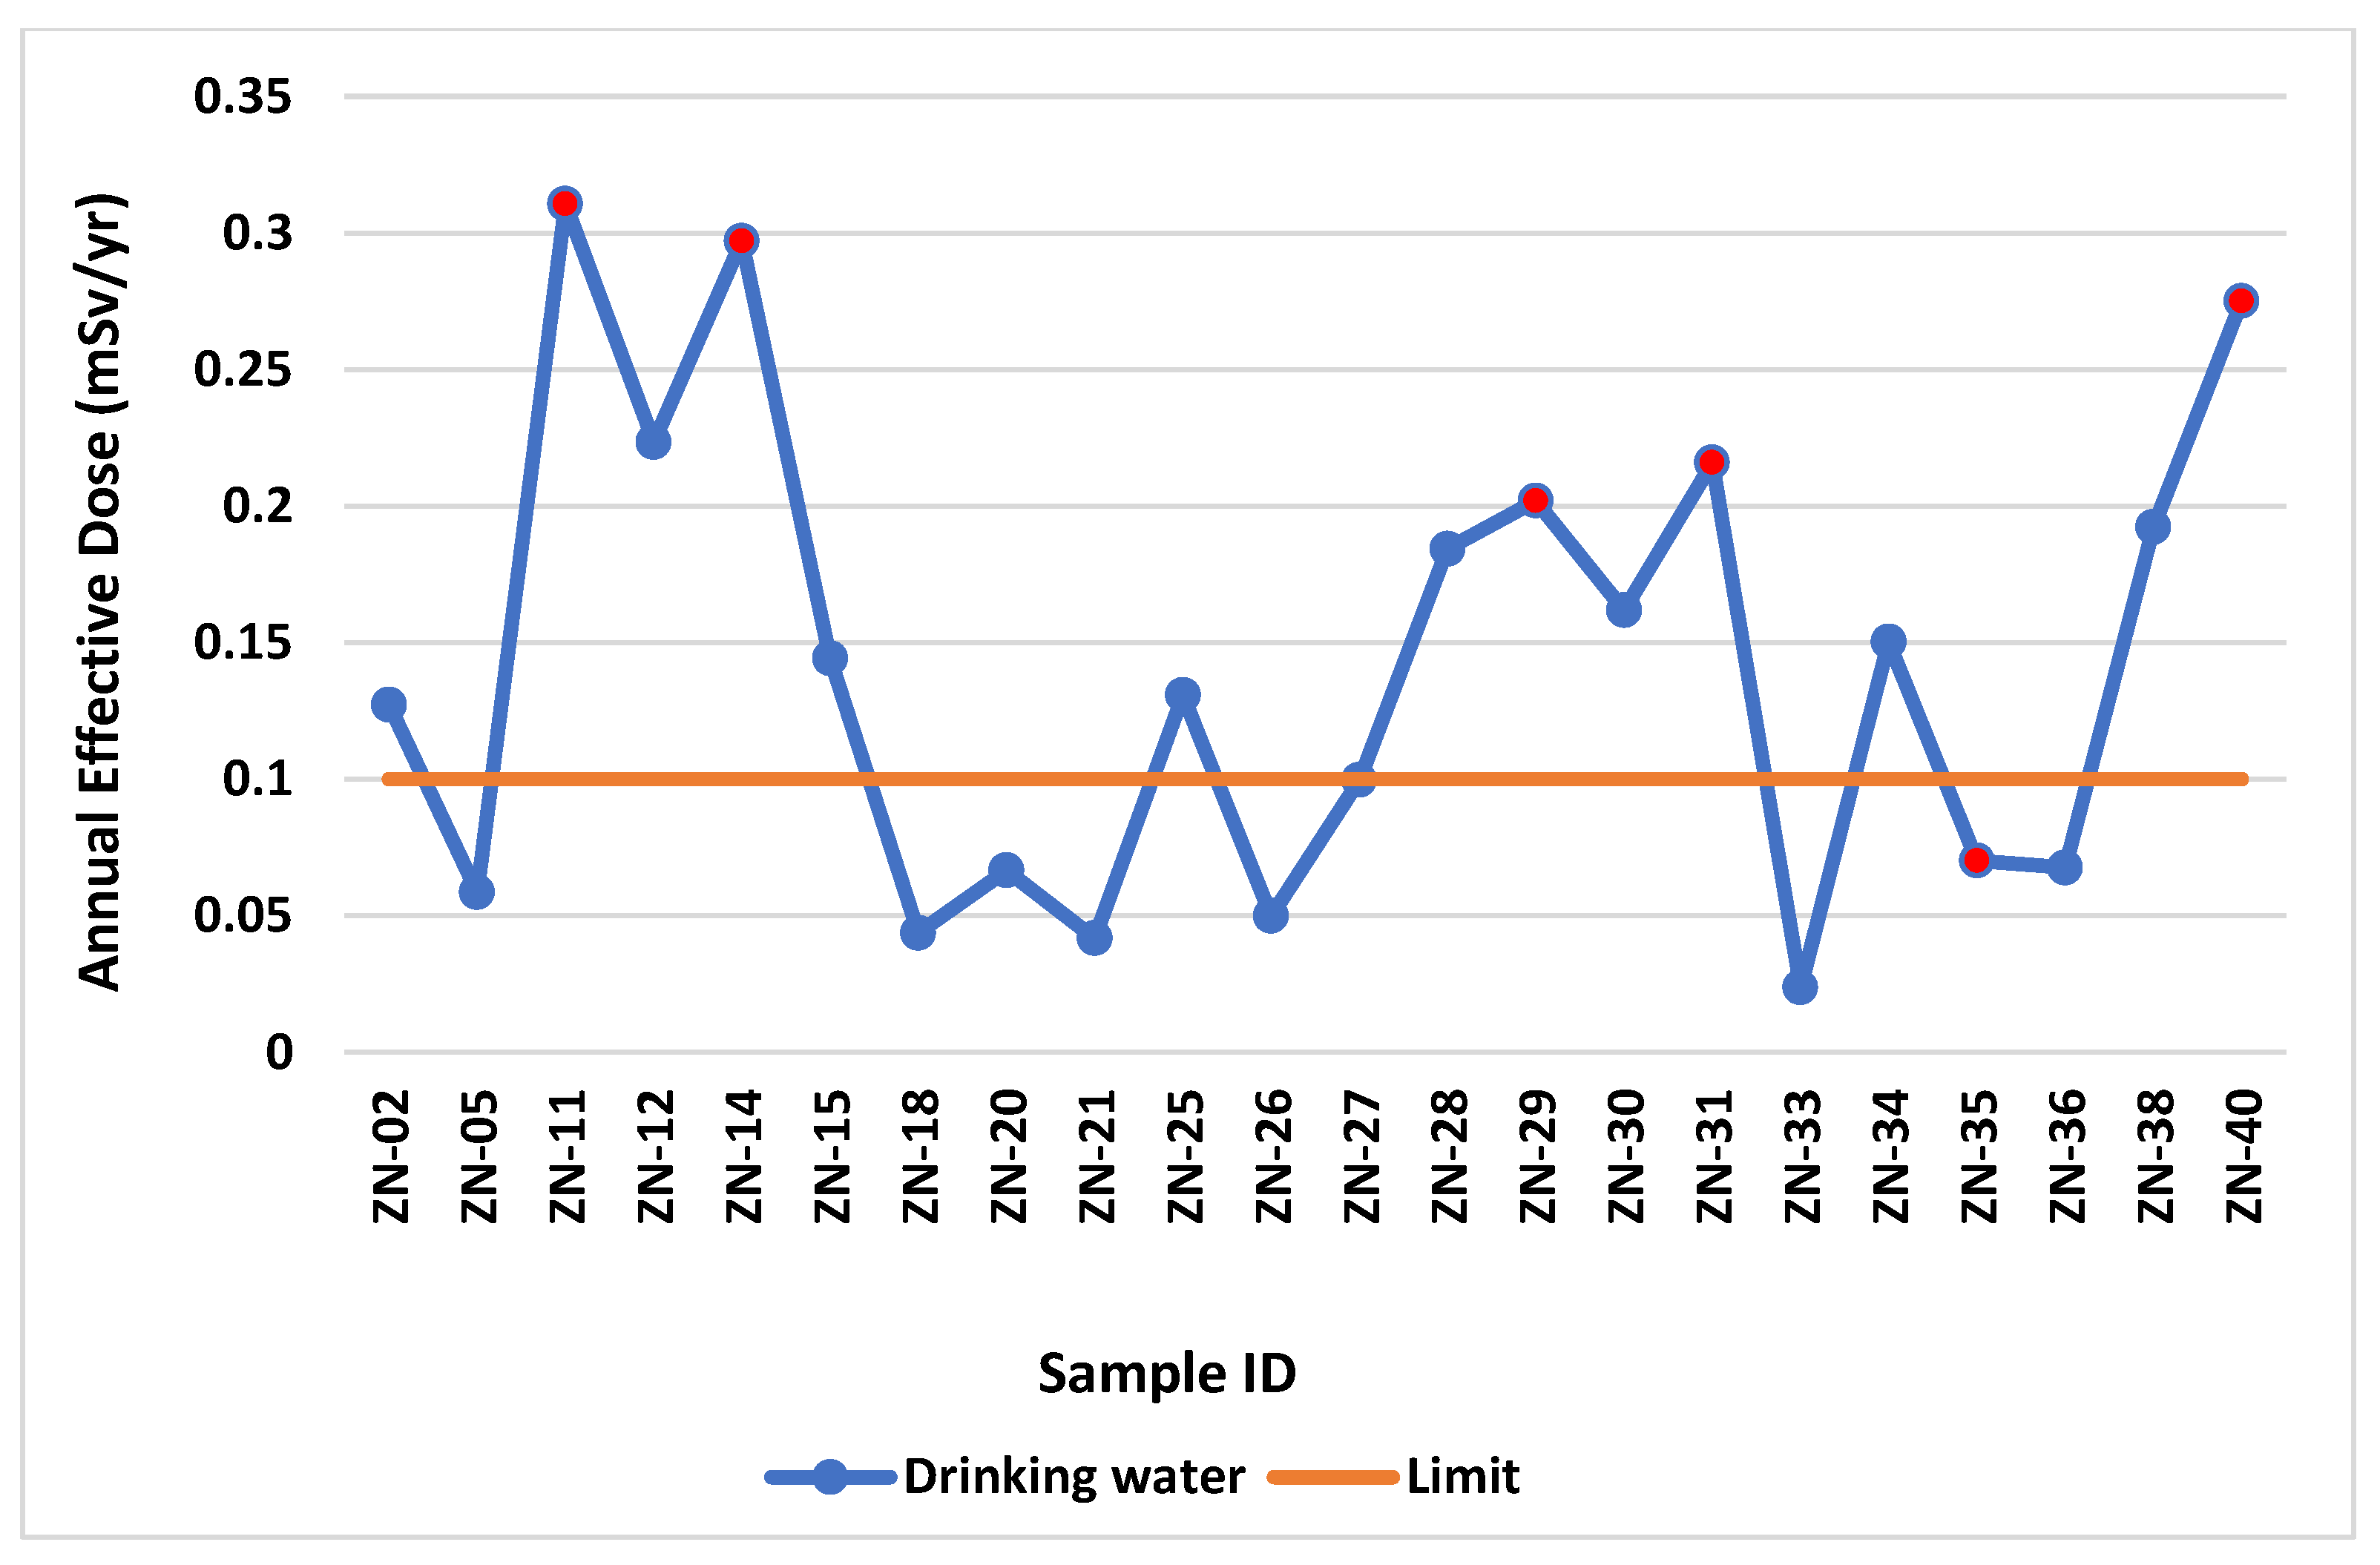
3.3. Annual Effective Dose
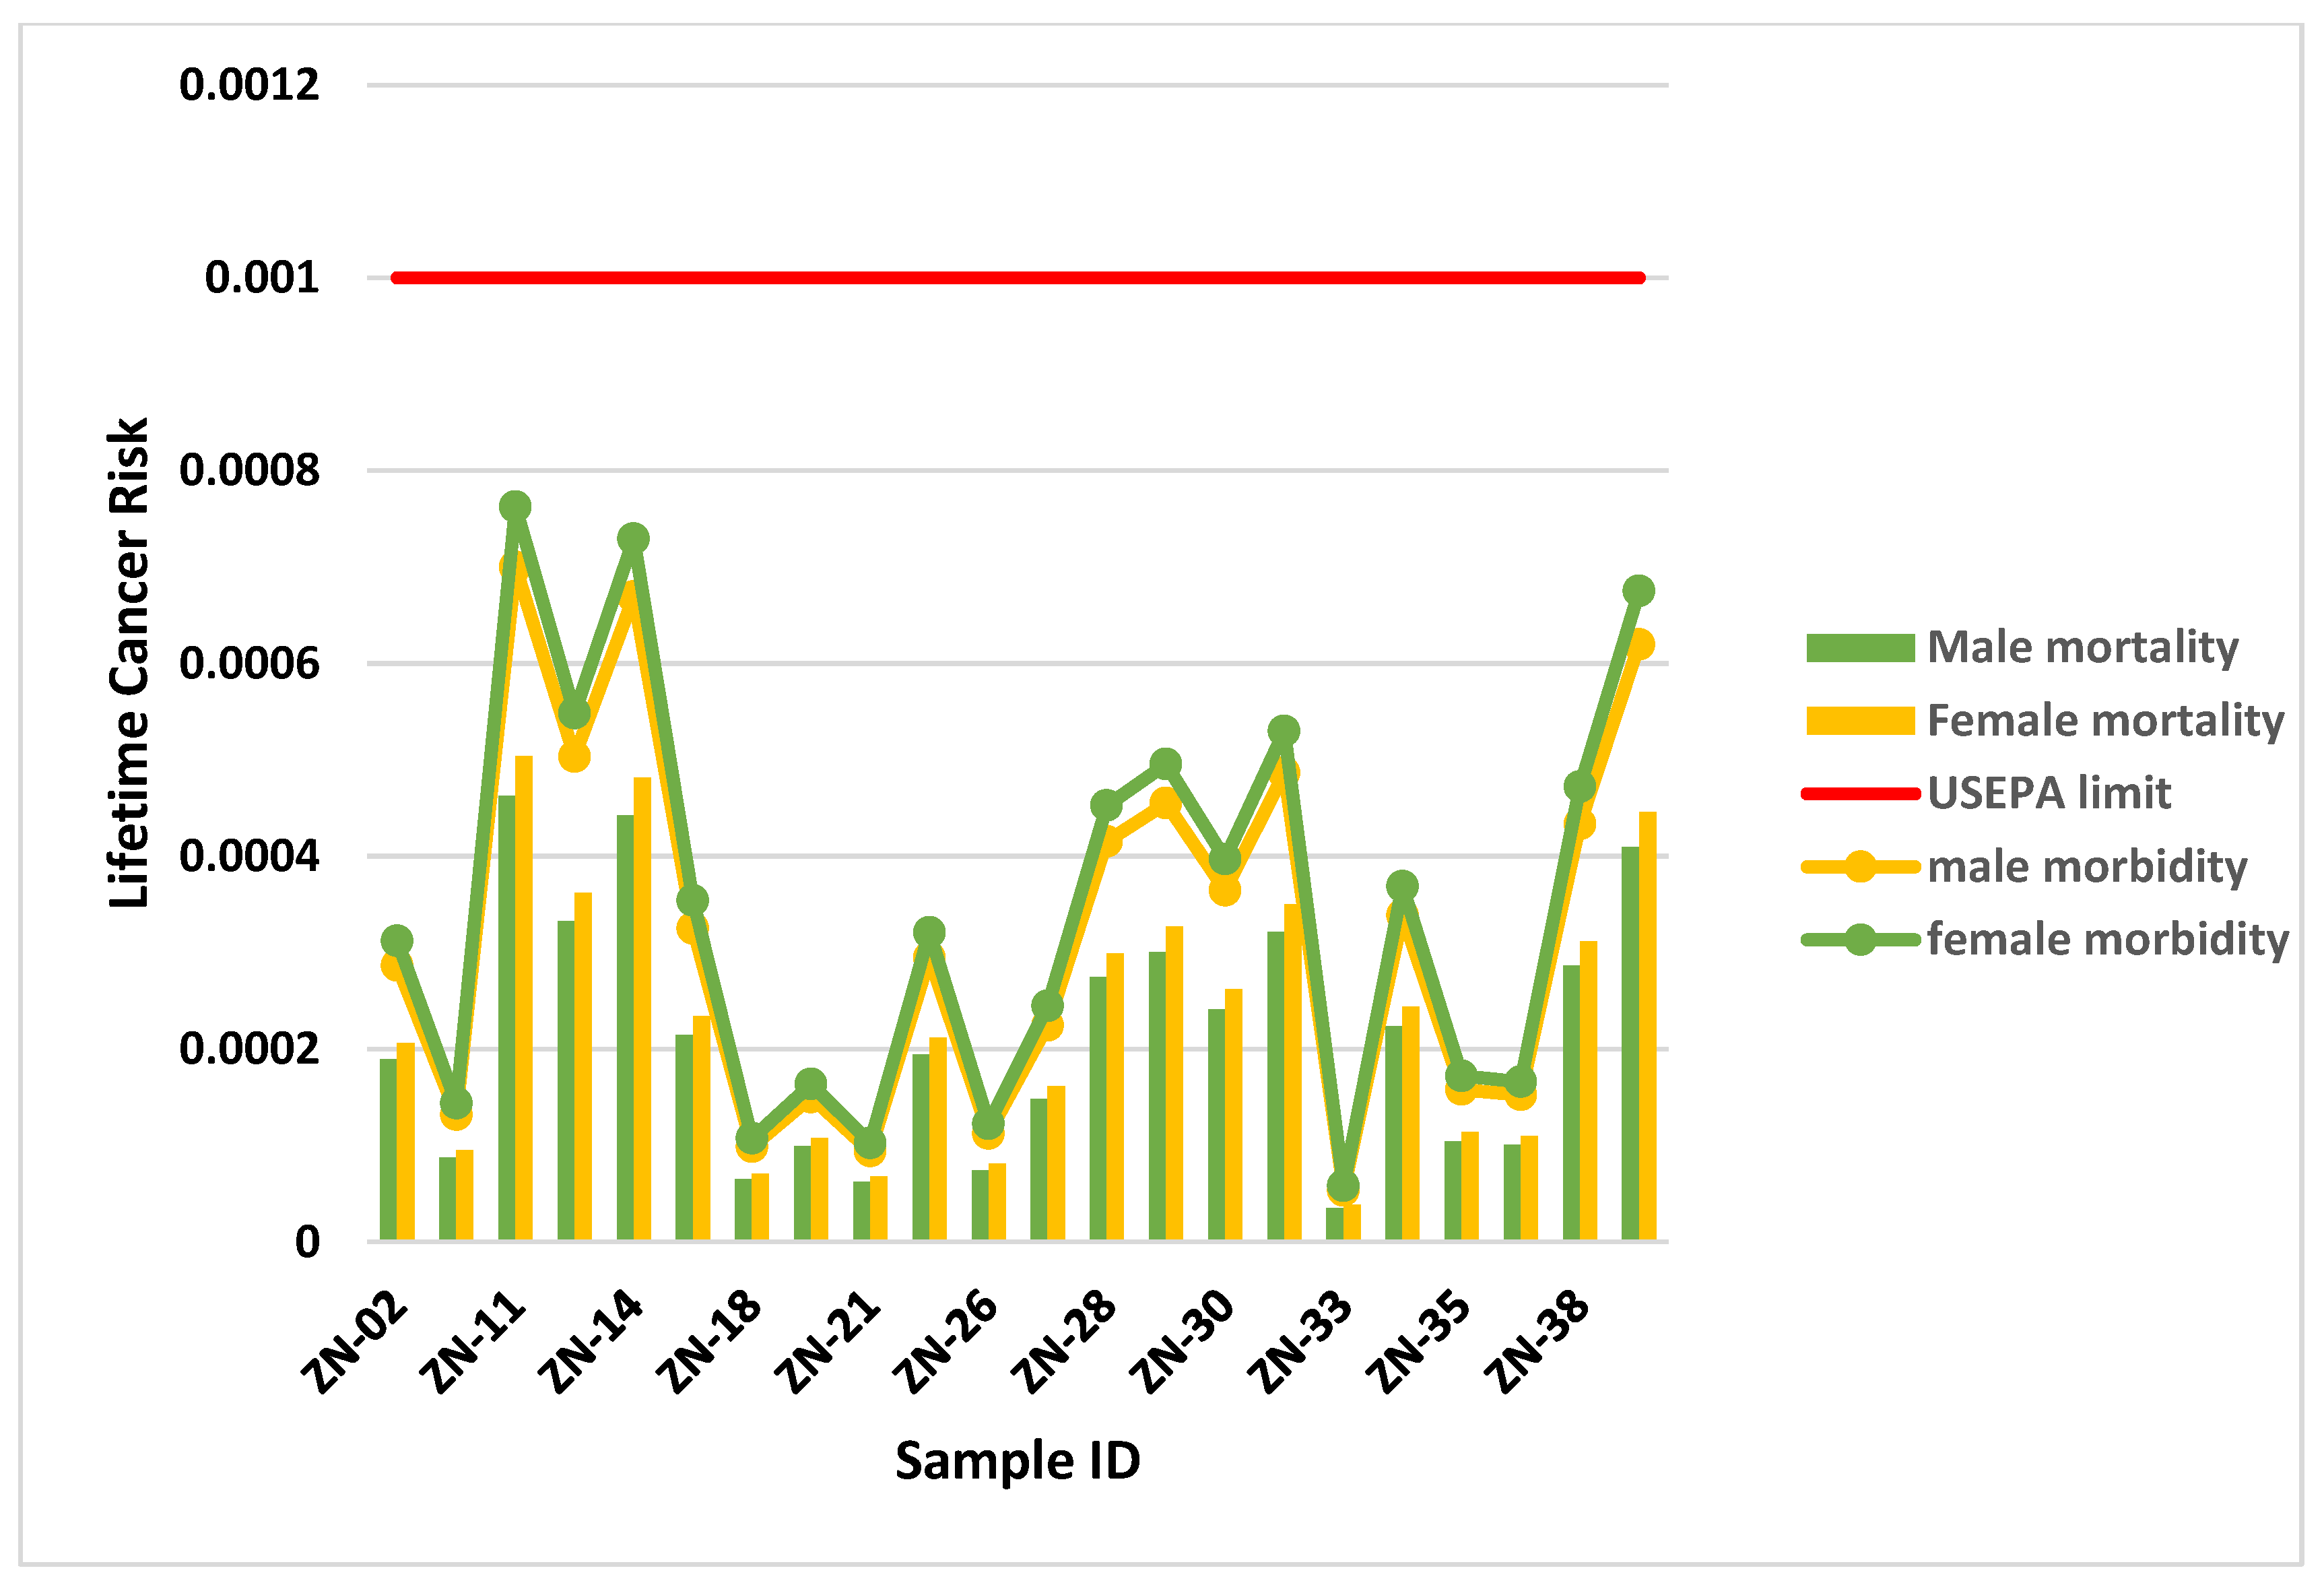
3.4. Lifetime Cancer Risks
4. Discussion
5. Conclusions
Author Contributions
Funding
Data Availability Statement
Acknowledgments
Conflicts of Interest
References
- Durand, J.F. The impact of gold mining on the Witwatersrand on the rivers and karst system of Gauteng and North West Province, South Africa. J. Afr. Earth Sci. 2012, 6, 8–24. [Google Scholar] [CrossRef]
- Tutu, H. The chemical characteristic of acid mine drainage with particular reference to sources. Distribution and remediation. The Witwatersrand basin South Africa, a case study. Appl. Geochem. 2008, 23, 3666–3684. [Google Scholar] [CrossRef]
- Winde, F.; Sandham, L.A. Uranium pollution of South African streams—An overview of the situation in gold mining areas of the Witwatersrand. GeoJournal 2004, 61, 131–149. [Google Scholar] [CrossRef]
- Madzunya, D.; Dudu, V.P.; Mathuthu, M.; Manjoro, M. Radiological health risk assessment of drinking water and soil dust from Gauteng and North West Provinces, South Africa. Heliyon 2020, 6, e03392. [Google Scholar] [CrossRef] [PubMed] [Green Version]
- Njinga, R.L.; Tshivhase, V.M.; Mathuthu, M. Chemical Toxicity of Surface-Based Drinking Water Sources Due to Natural Uranium Pollutant Around Princess Gold Mine Environs in Roodepoort, South Africa. Expo. Health 2016, 8, 457–464. [Google Scholar] [CrossRef]
- USEPA: United States Environmental Protection Agency. Federal Guidance Report No. 13: Cancer Risk Coefficients for Environmental Exposure to Radionuclides; EPA 402-R-99−001; U.S. Environmental Protection Agency: Washington, DC, USA, 1999. Available online: https://www.epa.gov/radiation/federal-guidance-report-no-13-cancer-risk-coefficients-environmental-exposure (accessed on 21 October 2022).
- Scott, R. Flooding of Central and East Rand Gold Mines; Report No. 486/1/95; Water Research Commission: Pretoria, South Africa, 1995. [Google Scholar]
- Naicker, K.; Cukrowska, E.; McCarthy, T.S. Acid mine drainage arising from gold mining activity in Johannesburg. South Africa and environs. Environ. Pollut. 2003, 122, 29–40. [Google Scholar] [CrossRef]
- Abiye, T.A. Provenance of groundwater in the crystalline aquifer of Johannesburg area, South Africa. Int. J. Phys. Sci. 2011, 6, 98–111. [Google Scholar]
- Mathuthu, M.; Dlamini, S.G.; Njinga, R.L. Exposure Risks Assessment Due to Gamma Emitting Radionuclides in Soils and Consumable Waters Around Princess Gold Mine Dump in Roodepoort, South Africa. Mine Water Environ. 2017, 37, 98–105. [Google Scholar] [CrossRef]
- World Health Organization. Guidelines for Drinking-Water Quality, 4th ed.; WHO Library Cataloguing-in-Publication Data; World Health Organization: Geneva, Switzerland, 2011; p. 564.
- Moshupya, P.; Abiye, T.; Mouri, H.; Levin, M.; Strauss, M.; Strydom, R. Assessment of Radon Concentration and Impact on Human Health in a Region Dominated by Abandoned Gold Mine Tailings Dams: A Case from the West Rand Region, South Africa. Geosciences 2019, 9, 466. [Google Scholar] [CrossRef] [Green Version]
- Poujol, M.; Anhaeusser, C.R. The Johannesburg Dome. South Africa: New Single Zircon U-Pb Isotopic Evidence for Early Arcahean Granite-Greenstone Development within the Central Kaapvaal Craton. Precambrian Res. 2001, 108, 139–157. [Google Scholar] [CrossRef]
- Barton, J.M.; Barton, E.S.W.; Kroner, A. Age and Isotopic Evidence for the Origin of the Archaean Granitoid Intrusive of the Johannesburg Dome, South Africa. J. Afr. Earth Sci. 1999, 28, 693–702. [Google Scholar] [CrossRef]
- Meyers, R.E.; McCarthy, T.S.; Stanistreet, I.G. A Tectono-Sedimentary Reconstruction of the Development and Evolution of the Witwatersrand Basin. with Particular Emphasis on the Central rand Group. S. Afr. J. Geol. 1990, 93, 180–201. [Google Scholar]
- McCarthy, T.S. The Witwatersrand Supergroup. In The Geology of South Africa; Haeusser, C.R., Thoms, R.J., Johnson, M.R., Eds.; Geological Society of South Africa: Johannesburg, South Africa, 2006; pp. 155–186. [Google Scholar]
- Eriksson, P.G.; Clendenin, C.W. A Review of the Transvaal Sequence, South Africa. J. Afr. Earth Sci. 1990, 10, 101–116. [Google Scholar] [CrossRef]
- Eriksson, P.G.; Altermann, W.; Hartzer, F.J. The Transvaal Supergroup and Its Precursors. In The Geology of South Africa; Johnson, M.R., Anhaeusser, C.R., Thoms, R.J., Eds.; Geological Society of South Africa: Johannesburg, South Africa, 2006; pp. 237–260. [Google Scholar]
- Abiye, T.A.; Mengistu, H.; Demlie, M. Groundwater Resource in the Crystalline Rocks of the Johannesburg Area, South Africa. J. Water Resour. Prot. 2011, 3, 199–212. [Google Scholar] [CrossRef] [Green Version]
- Barnard, H.C. An Explanation of the 1:500,000 General Hydrogeological Map; Department of Water Affairs and Forestry: Pretoria, South Africa, 2000. [Google Scholar]
- Leketa, K.; Abiye, A.; Butler, M. Characterisation of groundwater recharge conditions and flow mechanisms in bedrock aquifers of the Johannesburg area, South Africa. Environ. Earth Sci. 2018, 77, 727. [Google Scholar] [CrossRef]
- Cook, G.T.; Passo, C.J.; Carter, B. Environmental Liquid Scintillation Analysis. In Handbook of Radioactive Analysis, 2nd ed.; Academic Press: Cambridge, MA, USA, 2003; Chapter 6; pp. 537–607. [Google Scholar]
- Clark, I.D.; Fritz, P. Environmental Isotopes in Hydrogeology; CRC Press: Boca Raton, FL, USA, 2013. [Google Scholar]
- Kurttio, P.; Komulainen, H.; Leino, A.; Salonen, L.; Auvinen, A.; Saha, H. Bone as a possible target of chemical toxicity of natural uranium in drinking water. Environ. Health Perspect. 2005, 113, 68–72. [Google Scholar] [CrossRef]
- ICRP: International Commission on Radiological Protection. Compendium of Dose Coefficients Based on ICRP Publication 60; ICRP Publication 119, Annals of the ICRP (Suppl. 41); International Commission on Radiological Protection: Ottawa, ON, Canada, 2012. [Google Scholar]
- Vesterbacka, P. 238U–Series Radionuclides in Finnish Groundwater-Based Drinking Water and Effective Doses, STUK-A213; Dark Oy: Vantaa, Finland, 2005; pp. 1–94. [Google Scholar]
- ICRP: International Commission on Radiological Protection. Recommendations of the International Commission on Radiological Protection. ICRP Publication 103. Ann. ICRP 2007, 37, 2–4. [Google Scholar]
- ICRP: Internal Commission on Radiological Protection. Age-Dependent doses to Members of the Public from Intake of Radionuclides, Part 3: Ingestion dose Coefficients; Annals of the ICRP, ICRP Publication 69; Pergamon Press: Oxford, UK, 1995. [Google Scholar]
- EDC Tanks Official Website. Available online: https://edctanks.co.za/household-water-usage.html (accessed on 1 September 2022).
- South African Government Website. Available online: https://www.gov.za/about-sa/people-south-africa (accessed on 16 August 2022).
- World Health Organization. Guidelines for Drinking Water Quality Health Criteria and Other Supporting Information, 2nd ed.; World Health Organization: Geneva, Switzerland, 2003; Volume 2, pp. 367–370.
- World Health Organization. Meeting the MDG Drinking Water and Sanitation Target: The Urban and Rural Challenge of the Decade; World Health Organization: New York, NY, USA, 2006; pp. 1–47.
- Cothern, R.C.; Rebers, P.A. Radon, Radium and Uranium in Drinking Water; Lewis Publishers, Inc.: Boca Raton, FL, USA, 1990; p. 286. [Google Scholar]
- Rösner, T. The Environmental Impact of Seepage from Gold Mine Tailing Dams Near Johannesburg, South Africa. Unpublished. Ph.D. Thesis, University of Pretoria, Pretoria, South Africa, 1999; pp. 1–231. [Google Scholar]
- Department of Water Affairs and Forestry. South African Water Quality Guidelines, Volume 1 Domestic Use, 2nd ed.; Department of Water Affairs and Forestry: Pretoria, South Africa, 1996. [Google Scholar]
- Giri, S.; Singh, G.; Jha, V.N. Evaluation of radionuclides in groundwater around proposed uranium mining sites in Bagjata and Banduhurang, Jharkhand (India). Radioprotection 2011, 46, 39–57. [Google Scholar] [CrossRef] [Green Version]
- Hoffmann, W.; Kranefeld, A.; Schmitz-Feuerhake, I. Radium-226 contaminated Drinking water: Hypothesis on an Exposure Pathway in a Population with Elevated Childhood Leukemia. Environ. Health Persp. Suppl. 1993, 101, 113–115. [Google Scholar]
- U.S. Geological Survey; New Jersey Department of Environment Protection. Occurrence of Radium-224, Radium-226 and Radium-228 in Water of the Unconfined Kirkwood-Cohansey Aquifer System, Southern New Jersey; Scientific Investigations; U.S. Geological Survey Publication: Lawrenceville, NJ, USA, 2004.
- Weihai, Z.; Takao, I.; Xiaotang, Y. Occurrence of Rn-222, Ra-226, Ra-228 and U in Groundwater in Fujian Province, China. J. Environm. Radioact. 2001, 53, 111–120. [Google Scholar]
- Almeida, R.M.R.; Lauria, D.C.; Ferreira, A.C.; Sracek, O. Groundwater radon, radium and uranium concentrations in Região dos Lagos, Rio de Janeiro State, Brazil. J. Environ. Radioact. 2004, 73, 323–334. [Google Scholar] [CrossRef] [PubMed]
- Nour Khalifa, A. Natural Radioactivity of Ground and drinking water in some areas of Upper Egypt. Turkish. J. Eng. Environ. Sci. 2004, 28, 345–354. [Google Scholar]
- Nuccetelli, C.; Rusconi, R.; Forte, M. Radioactivity in drinking water: Regulations. monitoring results and radiation protection issues. Ann. Ist. Super. Sanità 2012, 48, 362–373. [Google Scholar] [CrossRef] [PubMed]
- Amakom, C.M.; Jibiri, N.N. Chemical and radiological risk assessment of uranium in borehole and well waters in the Odeda Area, Ogun State. Niger. Int. J. Phys. Sci. 2010, 5, 1009–1014. [Google Scholar]


| Sample Name | 238U (Bq/L) | 235U (Bq/L) | 234U (Bq/L) | 232Th (Bq/L) | 230Th (Bq/L) | 228Th (Bq/L) | 227Th (Bq/L) | 226Ra (Bq/L) | 224Ra (Bq/L) | 223Ra (Bq/L) | Gross Alpha (Bq/L) | Gross Beta (Bq/L) |
|---|---|---|---|---|---|---|---|---|---|---|---|---|
| ZN-02 | 0.0254 | 0.00117 | 0.0595 | <MDA | 0.031 | 0.00473 | 0.00507 | −0.0021 | 0.011 | 0.0012 | −0.016 | 0.37 |
| ZN-05 | 0.0117 | 0.000537 | 0.0192 | 0.00454 | 0.0344 | 0.00671 | 0.00899 | 0.0019 | 0.004 | 0.0016 | 0.053 | 0.283 |
| ZN-11 * | 0.062 | 0.00285 | 0.127 | 0.0133 | 0.0479 | 0.0223 | 0.00228 | 0.0195 | 0.0136 | 0.002 | 0.341 | 0.502 |
| ZN-12 | 0.0446 | 0.00205 | 0.112 | 0.00612 | 0.0291 | 0.00868 | 0.00673 | 0.0012 | 0.0025 | 0.0023 | 0.0081 | 0.15 |
| ZN-14 * | 0.0593 | 0.00273 | 0.21 | 0.00909 | 0.0726 | 0.0107 | 0.0212 | 0.0028 | −0.0057 | −0.0013 | 0.141 | 0.031 |
| ZN-15 | 0.0288 | 0.00132 | 0.0459 | 0.00605 | 0.0468 | 0.012 | 0.0347 | −0.0054 | −0.0038 | 0.013 | 0.015 | 0.064 |
| ZN-18 | 0.00873 | 0.000402 | 0.0245 | 0.0125 | 0.035 | 0.0316 | 0.0056 | −0.0055 | 0.012 | 0.0015 | 0.026 | −0.04 |
| ZN-20 | 0.0133 | 0.000612 | 0.031 | 0.0036 | 0.044 | 0.0226 | 0.0062 | −0.00097 | −0.006 | −0.0084 | 0.028 | −0.47 |
| ZN-21 | 0.00834 | 0.000384 | 0.104 | 0.0216 | 0.0702 | 0.0136 | 0.0097 | 0.0137 | −0.02 | −0.002 | 0.147 | 0.086 |
| ZN-25 | 0.0261 | 0.0012 | 0.0473 | 0.00671 | 0.0407 | 0.0113 | 0.00777 | −0.0064 | 0.025 | 0.0057 | 0.037 | 2.38 |
| ZN-26 | 0.00996 | 0.000459 | 0.0316 | 0.00774 | 0.033 | 0.033 | 0.00263 | −0.0044 | −0.019 | −0.0026 | 0.0092 | −0.12 |
| ZN-27 * | 0.0199 | 0.000914 | 0.0199 | 0.00271 | 0.0439 | 0.00981 | 0.0102 | 0.0027 | −0.001 | −0.0071 | 0.02 | −0.96 |
| ZN-28 | 0.0368 | 0.00169 | 0.042 | 0.0155 | 0.0327 | 0.0121 | 0.0082 | −0.0049 | −0.0025 | 0.0013 | −0.012 | 0.606 |
| ZN-29 * | 0.0403 | 0.00185 | 0.0914 | 0.00848 | 0.0795 | 0.0108 | 0.0041 | 0.0058 | −0.011 | 0.0029 | 0.056 | −1.1 |
| ZN-30 | 0.0323 | 0.00149 | 0.0522 | 0.0235 | 0.028 | 0.024 | 0.0382 | 0.003 | −0.011 | −0.0031 | 0.132 | 13.5 |
| ZN-31 * | 0.0431 | 0.00199 | 0.176 | 0.0217 | 0.034 | 0.0154 | 0.00744 | 0.0022 | −0.034 | −0.0059 | 0.215 | 0.604 |
| ZN-33 | 0.00473 | 0.000218 | 0.0158 | 0.0159 | 0.0789 | 0.0183 | 0.0143 | 0.0107 | −0.0055 | −0.0098 | 0.149 | 0.394 |
| ZN-34 | 0.03 | 0.00138 | 0.0627 | 0.0089 | 0.018 | 0.0203 | 0.0505 | 0.00575 | <MDA | −0.0015 | 0.068 | 0.396 |
| ZN-35 * | 0.014 | 0.000646 | 0.0281 | 0.00883 | 0.0446 | 0.0173 | 0.0377 | 0.0011 | 0.00884 | 0.00784 | 0.321 | 0.673 |
| ZN-36 | 0.0135 | 0.000623 | 0.0153 | 0.00868 | 0.0548 | 0.0159 | 0.016 | 0.0022 | 0.0045 | 0.0018 | 0.13 | 0.34 |
| ZN-38 | 0.0384 | 0.00177 | 0.0498 | 0.0065 | 0.0397 | 0.031 | 0.0058 | 0.0067 | 0.006 | −0.00071 | 0.198 | 0.309 |
| ZN-40 * | 0.0549 | 0.00253 | 0.0723 | 0.0196 | 0.0864 | 0.0157 | 0.0101 | 0.00097 | −0.0081 | −0.0026 | 0.138 | 0.24 |
| Minimum | 0.00473 | 0.000218 | 0.0153 | 0.00271 | 0.018 | 0.00473 | 0.00228 | −0.0064 | −0.034 | −0.0098 | −0.016 | −1.1 |
| Maximum | 0.062 | 0.00285 | 0.21 | 0.0235 | 0.0864 | 0.033 | 0.0505 | 0.0195 | 0.025 | 0.013 | 0.341 | 13.5 |
| Mean | 0.02846 | 0.00131 | 0.06534 | 0.01103 | 0.04660 | 0.01672 | 0.01425 | 0.00230 | −0.00191 | −0.00018 | 0.10020 | 0.8290 |
| Country | 226Ra Activity Concentration (Bq/L) |
|---|---|
| South Africa (this study) | 0.0019–0.0195 |
| India | 0.0035–0.206 [36] |
| Finland | 0.001–1 [26] |
| Germany | 0.00296–0.0222 [37] |
| United State of America | 0.0185–0.644 [38] |
| China | 0.0011–0.939 [39] |
| Brazil | 0.002–0.492 [40] |
| Egypt | 0.0792 [41] |
Publisher’s Note: MDPI stays neutral with regard to jurisdictional claims in published maps and institutional affiliations. |
© 2022 by the authors. Licensee MDPI, Basel, Switzerland. This article is an open access article distributed under the terms and conditions of the Creative Commons Attribution (CC BY) license (https://creativecommons.org/licenses/by/4.0/).
Share and Cite
Mohuba, S.C.; Abiye, T.; Nhleko, S. Evaluation of Radionuclide Levels in Drinking Water from Communities near Active and Abandoned Gold Mines and Tailings in the West Rand Region, Gauteng, South Africa. Minerals 2022, 12, 1370. https://0-doi-org.brum.beds.ac.uk/10.3390/min12111370
Mohuba SC, Abiye T, Nhleko S. Evaluation of Radionuclide Levels in Drinking Water from Communities near Active and Abandoned Gold Mines and Tailings in the West Rand Region, Gauteng, South Africa. Minerals. 2022; 12(11):1370. https://0-doi-org.brum.beds.ac.uk/10.3390/min12111370
Chicago/Turabian StyleMohuba, Seeke Carol, Tamiru Abiye, and Sifiso Nhleko. 2022. "Evaluation of Radionuclide Levels in Drinking Water from Communities near Active and Abandoned Gold Mines and Tailings in the West Rand Region, Gauteng, South Africa" Minerals 12, no. 11: 1370. https://0-doi-org.brum.beds.ac.uk/10.3390/min12111370