
The Grouping and Segregation Error in the Rice Experiment

School of Mining Engineering, University of the Witwatersrand, Private Bag 3, Johannesburg 2050, South Africa
Minerals 2022, 12(3), 335; https://0-doi-org.brum.beds.ac.uk/10.3390/min12030335
Submission received: 15 December 2021
/
Revised: 3 March 2022
/
Accepted: 4 March 2022
/
Published: 8 March 2022
(This article belongs to the Special Issue Sampling Across the Mine Value Chain)
Abstract
:The grouping and segregation error, one of the seven sampling errors defined by Pierre Gy, is related to the combined effects of gravity and characteristics of the target analyte such as particle size, density, shape, and moisture content of the particulate materials being sampled. Kinetic energy acting on particulate materials that are moved, flow, transported, or stockpiled causes the spatial distribution of fragments relative to one another to change. The grouping and segregation error is identified, quantified, and measured in relative sampling variance terms by comparing the sampling variability due to fractional shovelling (scooping) with that using a Jones riffle splitter. The relative sampling variance of low concentrations, approximately 0.01%, of steel balls, lead balls, and flakes of tungsten carbide in the host substrate indicates that, in this specific sampling space, the grouping and segregation error is primarily a function of particle density. Conclusions from the experiments are that components of the grouping and segregation error, namely the grouping factor and segregation factor, can be identified, measured, and mitigated. Whereas the grouping and segregation error has historically been considered to be less than the fundamental sampling error, these experiments suggest that it can be up to four times the fundamental sampling error depending on the density of the segregated materials.
1. Introduction
Sampling experiments in a teaching environment provide simple and meaningful examples for understanding concepts of particulate sample behaviour. The so-called rice experiment is a simple classroom exercise for teaching sampling concepts and modelling the behaviour of non-cohesive particulate materials using scooping (fractional shovelling) and riffle splitting as mass reduction sampling methods. This would represent a rare and extreme case in practice but is an effective teaching tool to demonstrate the characteristics and behaviour of sampling errors as a result of differing modes of sample selection and extraction [1,2,3,4,5]. The experiment popularized by Dr Dominique Francois-Bongarçon was first demonstrated by the late Mark Springett, manager of exploration and geostatistics for Goldfields USA, using a single, coloured grain in a few kilos of rice. Mark suggested that Dominique use the experiment in his sampling course entitled “The Theory and Practice of Particulate Sampling”. The “rice experiment” was based on principles found in Gy’s [2] Theory of Sampling, but “…there is a body of knowledge, however, that can be organized such that it forms—albeit imperfectly—the beginnings of an expandable and coherent framework to describe mixing and segregation of granular materials?” [6] outside the Theory of Sampling. Numerous studies have investigated the mixing and segregation behaviour of particulate materials due to the differences in particle size, density, and shape [7,8,9,10,11]. Factors responsible for segregation during loading of hoppers include particle velocities, trajectories, the effect of friction coefficients and mixing effects [6]. Ottino and Khakhar [12] catalogue the possible variations in systems for the mixing of granular materials in terms of the type of mixing, the shape of the container, the degree of filling, the density and size of the materials, and particle interactions leading to segregation. The grouping and segregation error (GSE) is a function of the distributional heterogeneity which Gy [4] defined as the variance in analyte content from one ‘group’ to the next amongst the ‘population of groups’ which constitute the lot; thus, the term group is equivalent to the term increment, each group representing one increment.
Aspects of the GSE as defined by Gy [3] have been researched by Sona and Dube [13], who demonstrate that TOS provides a means of controlling sampling errors by comparing the representativeness of probabilistic sampling and grab sampling. They concluded that representativeness is a function of the sampling technique and that variances associated with grab sampling disqualify it as an acceptable sampling method [14] Devriendt, Gatumel, and Berthiaux [7] found that the risk of segregation in some industrial materials is a function of particle size distributions, rather than of individual particle sizes or shapes; risk of segregation increases markedly as the particle size distribution narrows but is negligible for wide PSDs. They relate the risk of segregation to the number of particle–particle contacts and the increasing cohesion of materials as the PSD increases, suggesting the existence of a threshold, above which segregation cannot occur, and so percolation theory is used to model this behaviour of granular physics.
2. Aim of the Experiments
The experiments aim to evaluate the elusive GSE described by Gy [3] as “a consequence of the distributional heterogeneity, which itself is a function of the constitutional heterogeneity and of the increment size (the smaller the increment, the smaller GSE)”. The combined FSE and GSE, the correct sampling errors, is measured by scoop sampling to extinction, and GSE is then eliminated by riffle splitting, effectively composite sampling of a number of increments, to evaluate FSE alone. The chief characteristics of samples of particulate materials is that they should be accurate and precise, i.e., repeated sampling should produce averages close to the true value of the target analyte in the lot. The number of coloured grains in each sample is an unbiased estimate of the mean value of the lot.
To each lot, discrete grains of steel balls, lead balls and fragments of tungsten carbide were added as target analytes, chosen because of their significantly different densities. The experiment compares the distribution and precision (or coefficient of variation CV%, σ/μ*100) amongst thirty-two samples produced by scooping with that of thirty-two samples produced by riffle splitting from an identical lot ‘sampled to extinction without replacement’. The measure of variability used is the CV%, a dimensionless number, times 100 to give a value termed the precision as a percentage. This allows the precision derived from sampling one material type to be easily compared with the precision of another. While CV% is a rough measure of the combined FSE and GSE for target analytes, it is also a measure of efficiency for different sampling methods and different sampling equipment, so lower precision implies less sampling error and is therefore a better result. Three lots of non-cohesive particulate materials, one of popcorn mielies, a second of rice grains, and a third of dolomite sand, were seeded with low number fractions 0.1–0.4% of discrete high-density particles, namely, iron beads, lead shot, and tungsten carbide fragments. Differences in CV% from one target analyte to the next is due to differences in their densities—the greater the variability between samples, the higher the CV%, and the greater the degree of segregation. The results of the sampling experiments in popcorn, rice, and dolomite sand lots by scoop and riffle splitter methods illustrate how differences in sample mass, fragment size, and material density affect the CV% of sampling distributions.
3. Experimental Materials and Equipment
Starting materials for the experiments consist of one lot each of popcorn kernels, rice grains and dolomite sand that were placed in separate containers. The corn grain lot comprised 32 by 250 mL scoops of corn containing approximately 38,560 grains, weighing 7712 g. To the corn lot were added 100 blue-dyed grains, 100 steel balls, 100 lead balls and 100 tungsten carbide grains (Figure 1a–c). The rice grain lot comprised 32 by 125 mL scoops of rice containing approximately 160,450 grains weighing 3151 g. To the rice lot were added 160 blue-dyed grains, 160 steel balls, 160 lead balls and 160 tungsten carbide grains. To the dolomite sand lot comprising 32 by 15 mL scoops equivalent to 612 g was added 120 black glass beads, 120 steel balls, 120 lead balls and 120 tungsten carbide grains. Detailed characteristics for the corn, rice, and dolomite sand lots and the numbers of grains of target analytes added are listed in Table 1.
The addition of steel balls, lead balls and chips of tungsten carbide to the lot monitors the effects of density on sampling characteristics. The target analytes, coloured grains, steel balls, lead balls and tungsten carbide chips were added to give approximate concentrations by number of 0.26% in the corn lot, 0.1% in the rice lot, and 0.04% in the dolomite sand lot (Table 1).
The physical properties of popcorn mielies are strongly determined by moisture content [15] but in this study, each 250 mL scoop contains approximately 1205 popcorn kernels, so the lot contained approximately 38,560 kernels; on average, the mass of each kernel is 0.201 g, so the mass of each increment is approximately 241 g. Each 125 mL scoop of rice grains contains 5014 grains, so the lot contained 160,450 grains; on average, the mass of each grain is 0.01964 g, so the mass of each increment is approximately 98 g. Each 15 mL scoop of dolomite sand contains approximately 9500 grains, so the lot contained ~304,000 grains; on average, the mass of each grain is 0.002 g, so the mass of each increment is approximately 19 g (Table 1). Figure 1a shows the corn lot, Figure 1b the rice lot and Figure 1c the dolomite sand lot with added target analytes, before mixing. Figure 1c shows the dolomite grain lot with added target analytes, before mixing, although it is difficult to see the added grains. Details of the volume, size and number grains for each grain type used are listed in Table 1.
The materials sealed in rectangular plastic bucket (400 mm × 300 mm × 250 mm) were mixed by numerous vertical rotations of the containers. The proportion of coloured popcorn and rice, easily visible in the lots, act as a ‘control’ or standard reference material since they have the same density as the materials comprising the lots. The control grains in dolomite sand consisted of similar-sized black glass beads.
The equipment used for the experiments are shown in the series of photographs in Figure 2. The relative sizes of the 250 mL, 125 mL and 15 mL scoops are shown in Figure 2a–c, and the numbers of steel balls, lead shot and tungsten carbide chips added to the popcorn, rice, and dolomite sand lots are shown in Figure 2d–f, respectively. The 32 vane riffle splitter and a 16 vane desktop riffle splitter used in the experiments are shown in Figure 2g,h, respectively.
A 20 vane riffle splitter for reducing a granular sample mass, can also be used as an effective incremental sampling tool, producing 2, 4, 8, 16 or 32 subsamples for different stages of splitting. Dahl, Petersen and Esbensen [16] ranked seventeen items of mass reduction sampling equipment, based on accuracy (bias), reproducibility (precision), and other factors. Only devices based on riffle splitting principles (static or rotational) passed their representivity test; they also verified “Gy’s formula” for order-of-magnitude estimation of the fundamental sampling error (FSE). RSV% or CV% is a measure precision; a lower CV% is a better result.
4. The Sampling Experiments
The number of coloured grains in each increment is an unbiased estimate of the mean value of the lot. Implicit in the notion that sampling results “constitute a range of appropriate and statistically valid answers” [17] is the understanding that more samples provide a better estimate of the mean. Each repetition of the experiment produced 32 samples to be ‘assayed’ by counting the discrete grains of blue kernels, steel balls, lead balls, tungsten carbide bits.
A single performance of the sampling experiments yielded only 32 sample results for each of the target analytes, whereas three repetitions of the experiments using exactly the same protocol, in the same well-defined sampling space, produced 96 sample results. Thus, the shape of the histograms of the target analytes was a better representation of the true sampling distribution.
Sampling the discrete particulate materials (random variables), by scooping or passing through a riffle splitter, is simple. After thoroughly mixing the target analyte grains of blue-dyed grains, steel, lead, and tungsten carbide with the corn, rice, and sand lots in separate containers, 32 scoop samples were extracted, 250 mL for corn, 125 mL for rice, and 15 mL for sand, until each lot was sampled to extinction. The number of blue grains, steel, lead shot, and tungsten carbide fragments were counted in each of the 32 scoop samples and are listed for corn in Table A1, for rice in Table A3, and for dolomite sand in Table A5, in Appendix A, Appendix B, Appendix C, respectively.
Each of the scooping and riffle splitting experiments for each of the different lots was repeated three times by recombining the samples, blue rice, steel, lead, and tungsten carbide and sub-dividing the lot into 32 samples by incremental sampling using a 20 vane Jones riffle splitter (Figure 2g). For the dolomite sand, a 16 vane laboratory desktop riffle splitter was used (Figure 2h). Results of counting target analytes in the 32 samples are listed for corn in Table A2, for rice in Table A4, and for dolomite sand in Table A6, in Appendix A, Appendix B, Appendix C, respectively. The mass of the 32 increments produced by scooping and 32 increments produced by riffle splitting should be identical so the effect of minor differences in sample mass is not considered.
5. Analysis of Sampling Results
The results for the sampling experiments for each of the lot types listed in Appendix A, Appendix B and Appendix C are summarised for the blue grains, steel balls, lead shot and tungsten carbide grains by scooping and riffle splitting for 96 samples in Table 2, Table 3 and Table 4.
5.1. The Corn Experiment
Histograms of the results for blue corn, steel balls, lead balls and tungsten carbide for scooping and incremental sampling are shown in Figure 3. Sampling with a 250 mL scoop yields strongly positively skewed distributions for each target analyte (Figure 3, upper panel). Incremental sampling with a riffle splitter acts to dampen the extent of the positive skew so that histograms tend towards normal distributions (lower panel of Figure 3).
A summary of descriptive statistics for the corn experiment is provided in Table 2.

Table 2.
Descriptive statistics for three repetitions (96 samples) of sampling of the corn grain lot containing 100 grains each of blue corn, steel, lead and tungsten carbide by 250 mL scoop and riffle splitter, without replacement.
Table 2.
Descriptive statistics for three repetitions (96 samples) of sampling of the corn grain lot containing 100 grains each of blue corn, steel, lead and tungsten carbide by 250 mL scoop and riffle splitter, without replacement.
| 250 mL Scoop | 20 Vane Riffle Splitter | |||||||
|---|---|---|---|---|---|---|---|---|
| Material | Blue Corn | Steel | Lead | Tungsten | Blue Corn | Steel | Lead | Tungsten |
| Density (g/cm3) | 1.304 | 4.5 | 11.34 | 15.63 | 1.304 | 4.5 | 11.34 | 15.63 |
| Number of grains | 300 | 294 | 300 | 301 | 300 | 295 | 300 | 295 |
| Number of Samples | 96 | 96 | 96 | 96 | 96 | 96 | 96 | 96 |
| Mean (m) | 3.13 | 3.06 | 3.13 | 3.14 | 3.13 | 3.07 | 3.13 | 3.07 |
| Standard deviation | 2.18 | 5.11 | 7.39 | 7.55 | 1.66 | 1.87 | 1.79 | 2.07 |
| Variance | 4.74 | 26.12 | 54.59 | 57.04 | 2.74 | 3.48 | 3.21 | 4.30 |
| Relative variance | 0.49 | 2.79 | 5.59 | 5.80 | 0.28 | 0.37 | 0.33 | 0.46 |
| Precision (CV%) | 69.7% | 166.9% | 236.4% | 240.9% | 53.0% | 60.7% | 57.3% | 67.5% |
| Overall precision | 191.5% | 59.8% | ||||||
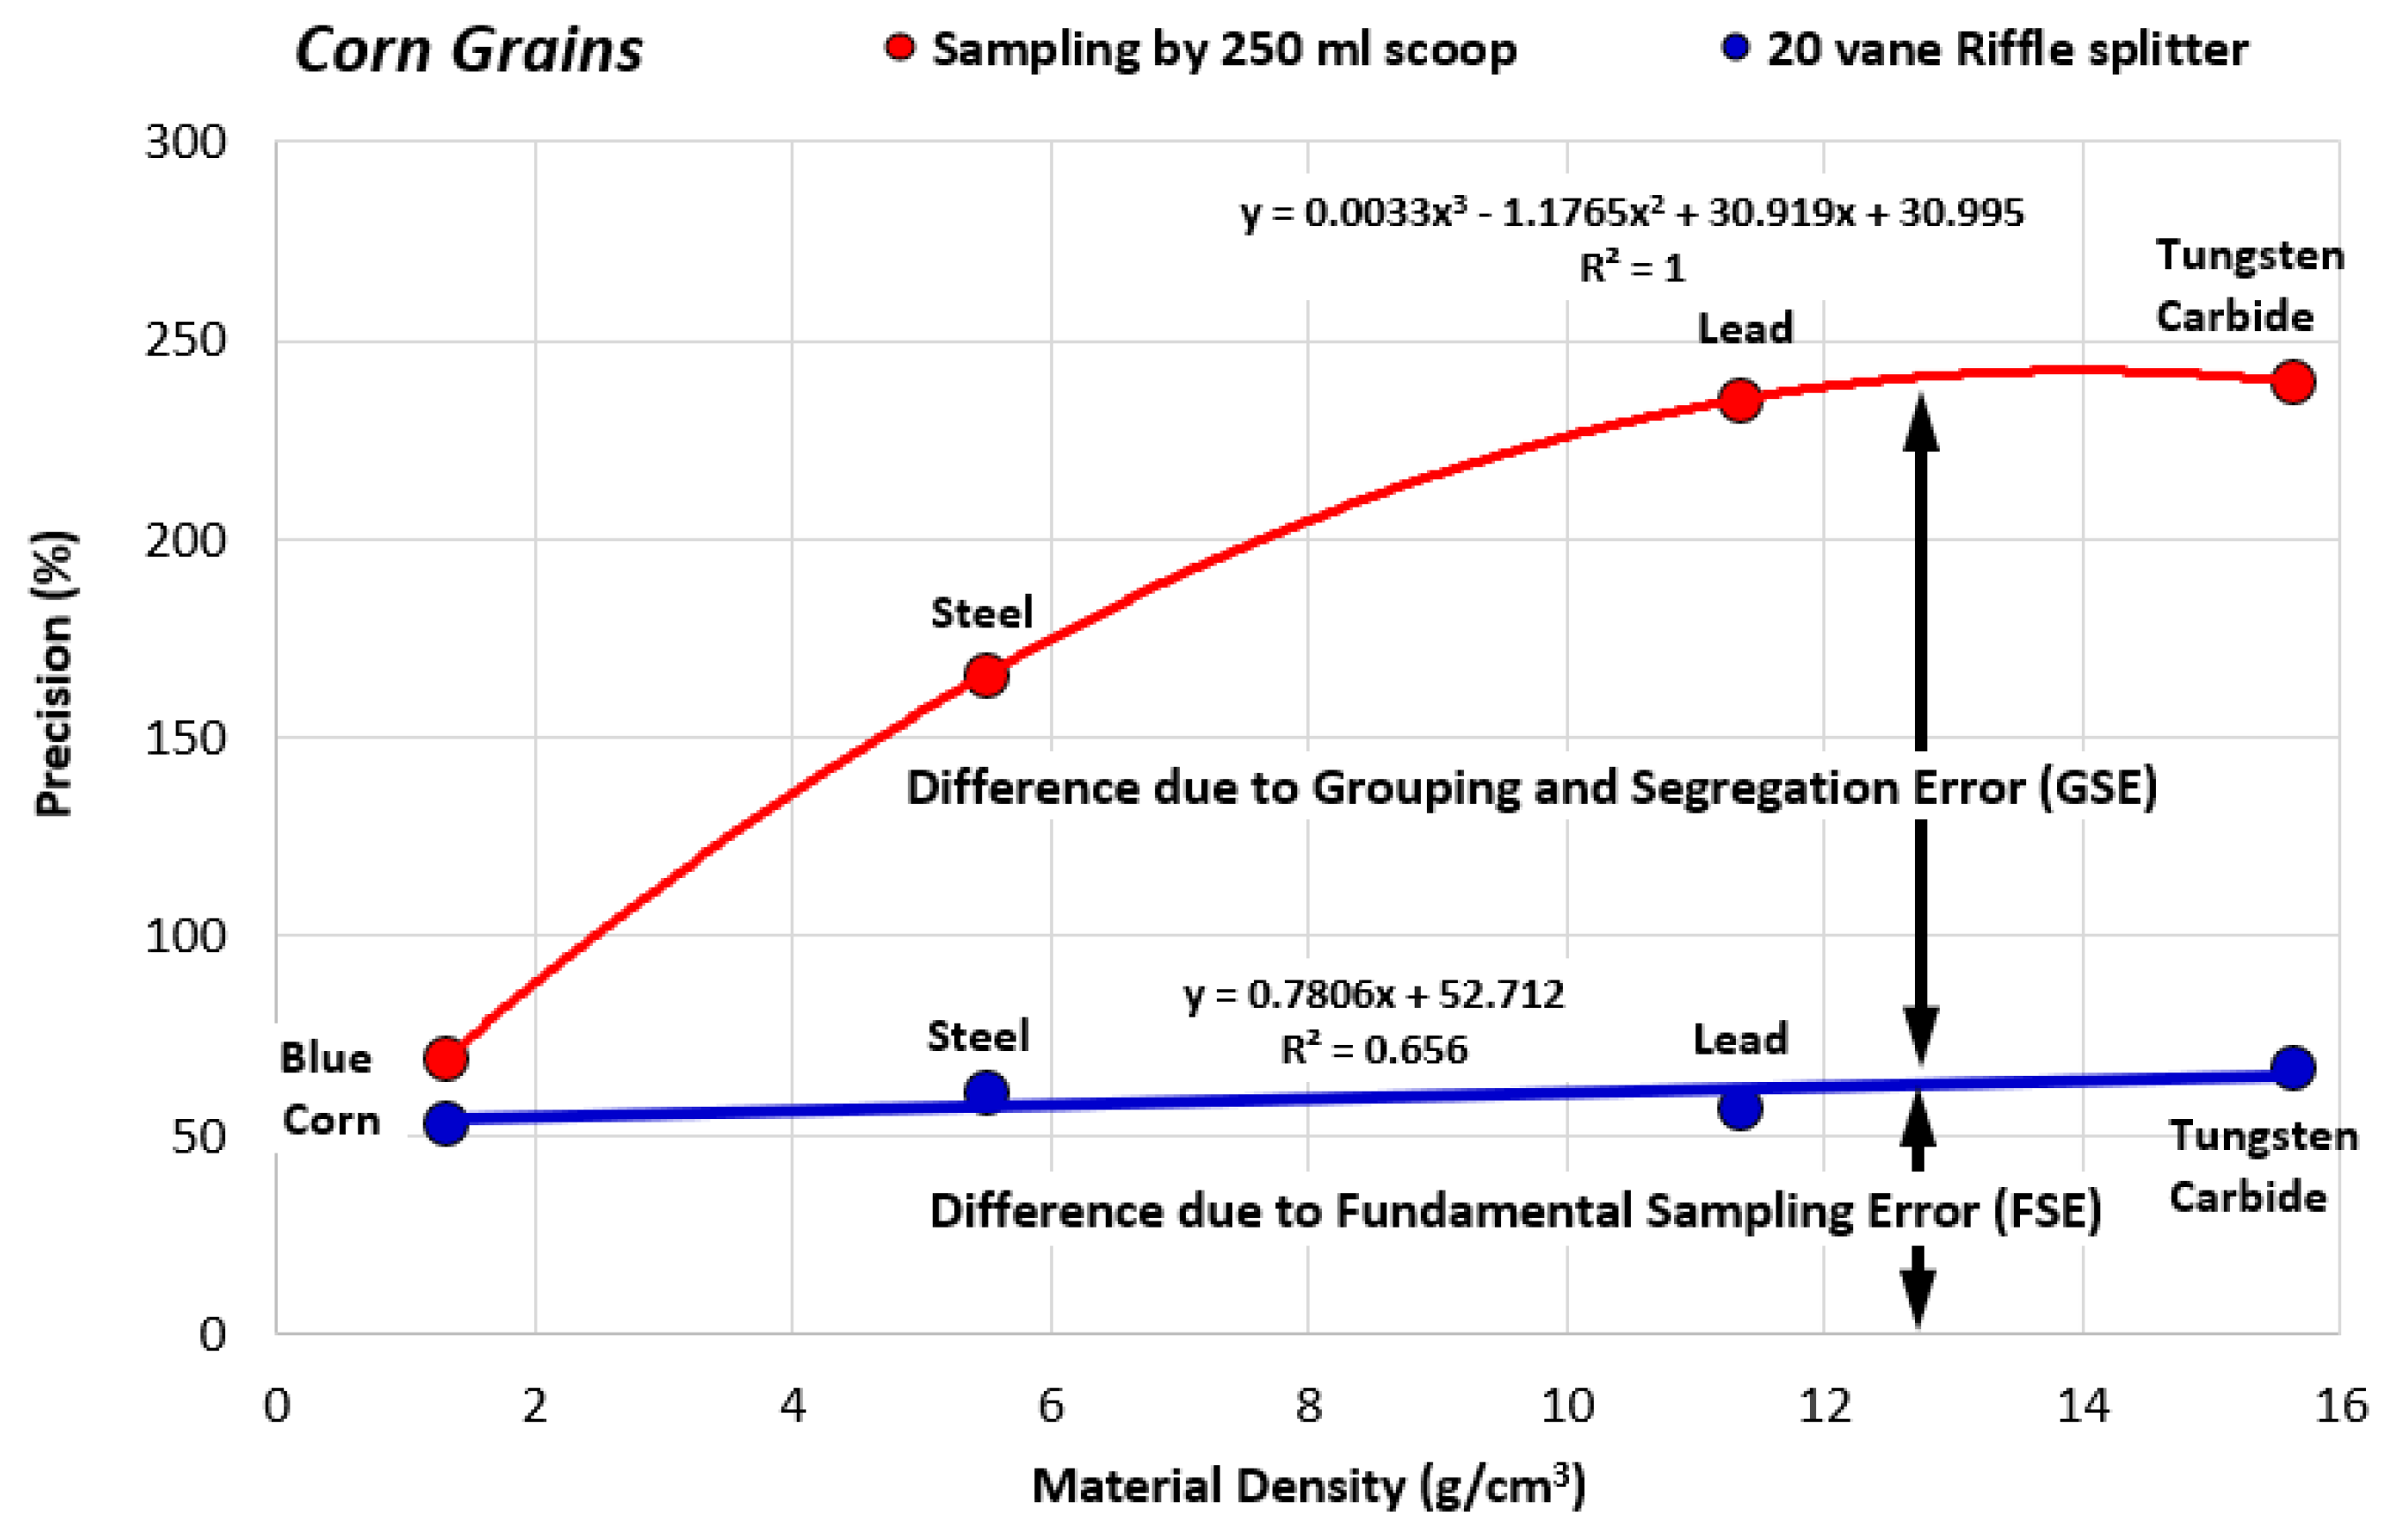
The overall precision for the 250 mL scoop sampling decreases from 191.5% to 59.8% when using a riffle splitter. For the individual analytes, the decrease in precision from scooping to splitting is marked, and the extent of the decrease is strongly related to the density of the analyte (Table 2).
A plot of the precision against the density of the target analyte in Figure 4 is modelled by a third-order polynomial with an R2 of 1, indicating a strong correlation between material density and sampling precision by scooping for the four materials considered here.
Data for the corn grain lot in Table 5 indicate that blue corn has the lowest precision (69.7%), whereas the tungsten carbide has the highest precision (240.9%), for the lot sampled using a 250 mL scoop. The size and shape of the blue corn are almost identical to the lead balls, whereas the steel balls and tungsten carbide grains are less than half the size of the corn grains. These differences in size may contribute to the differences in precision between the different sampling modes. The primary link between sampling precision and material density is considered to be largely due to the GSE, with the denser materials being more highly segregated.
5.2. The Rice Experiment
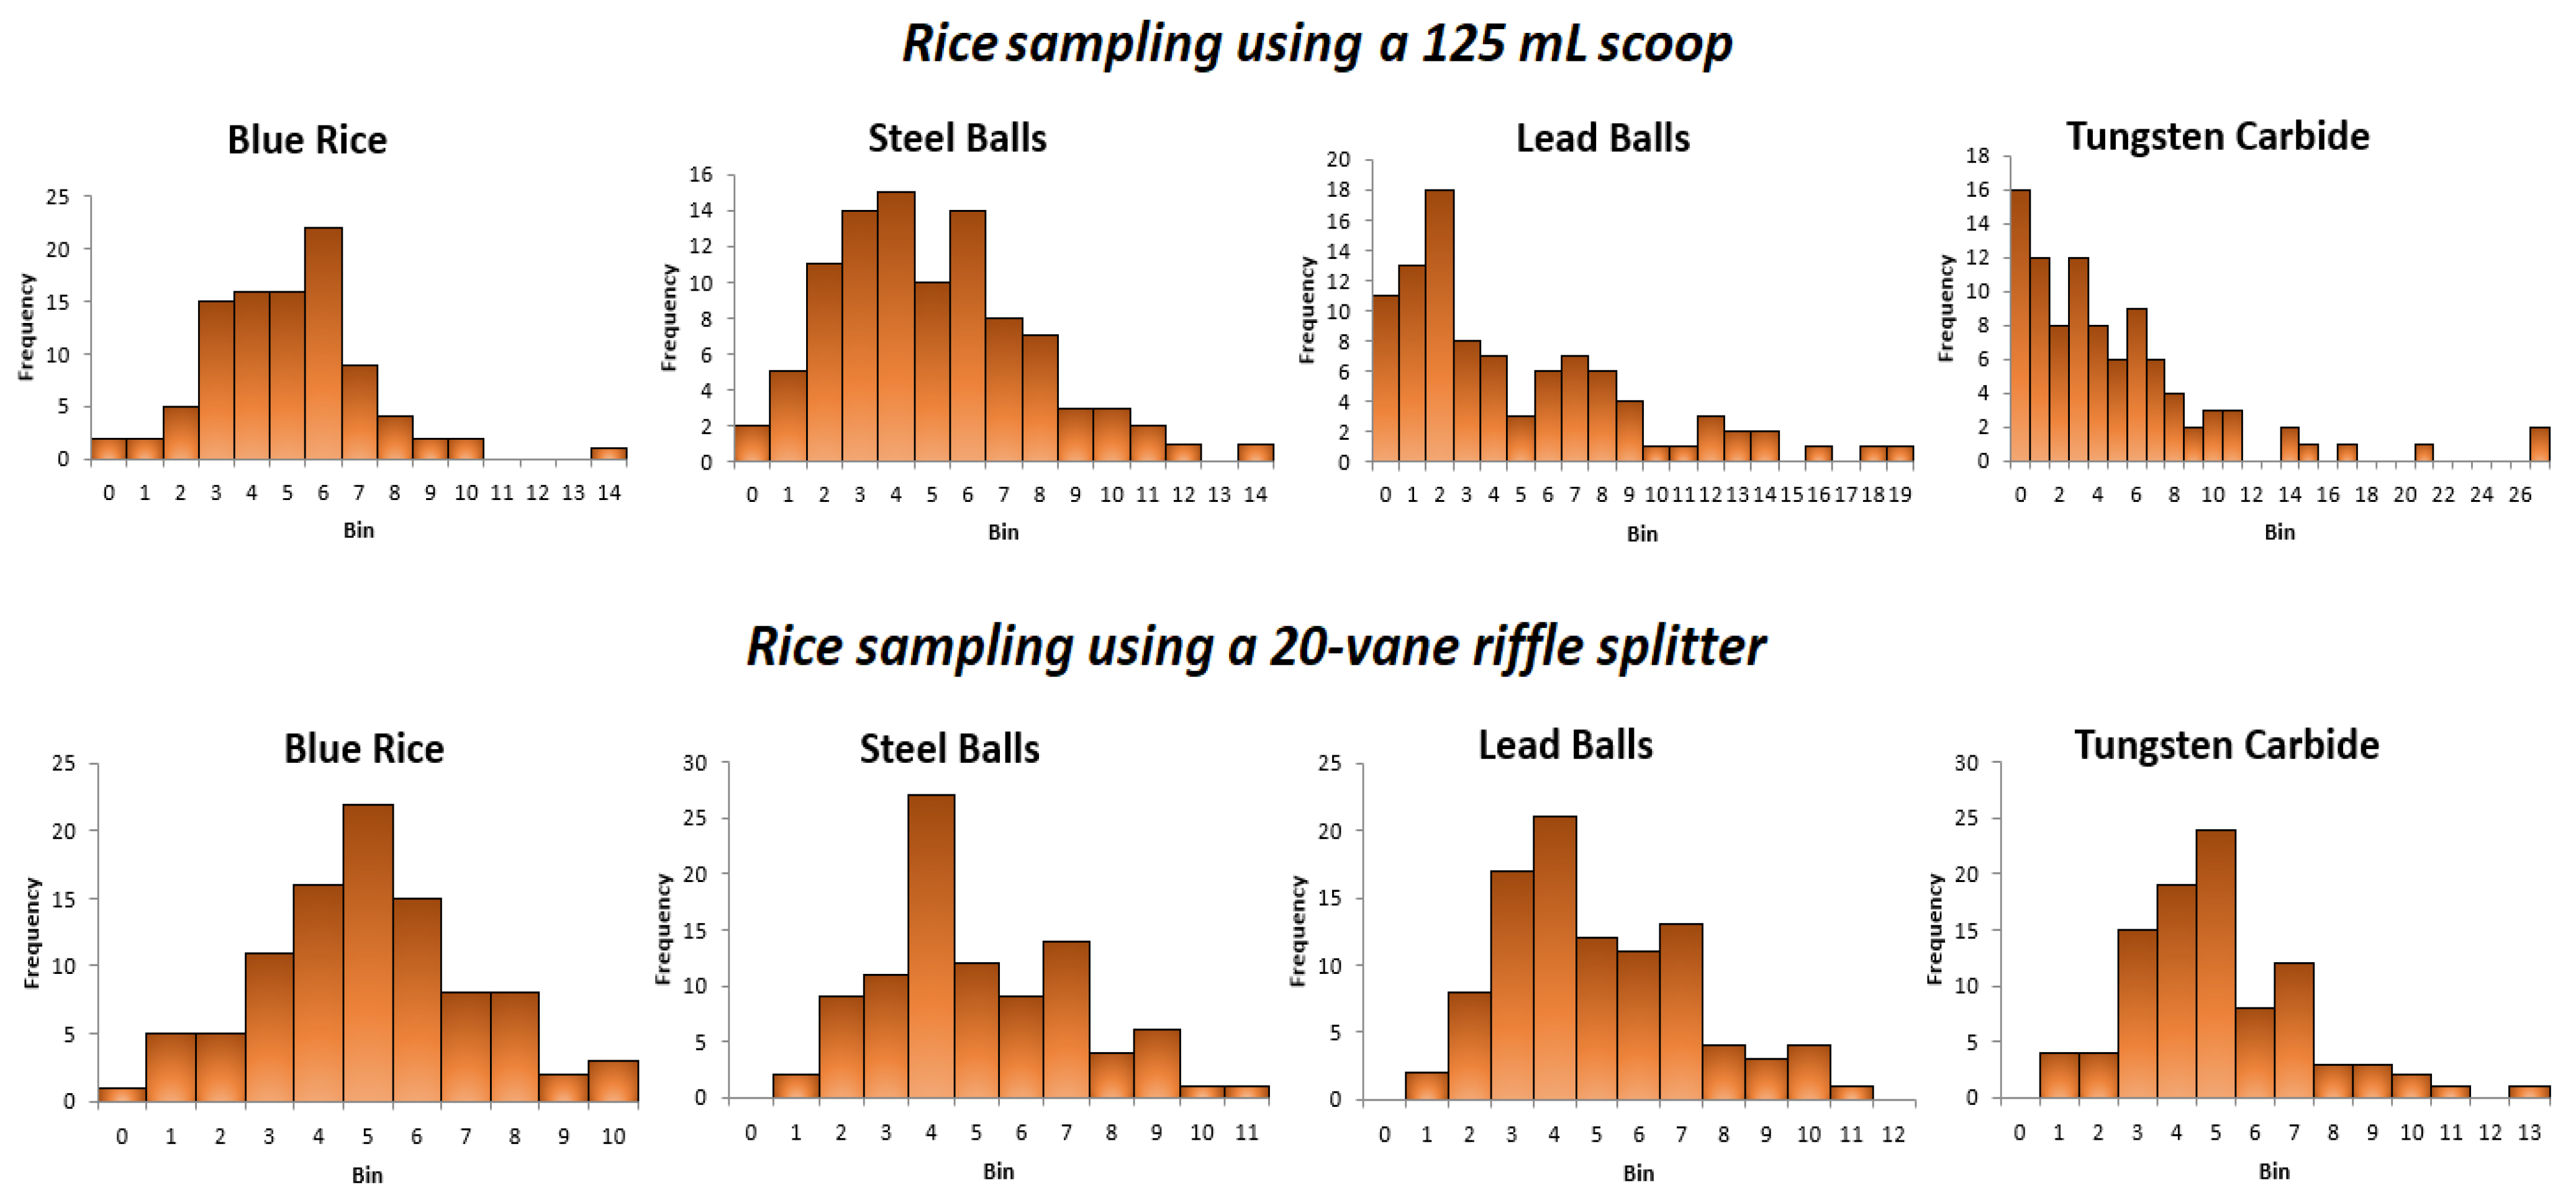
Histograms shown in Figure 5 compare the effects of sampling in the rice lot with a scoop (upper panel) and sampling using a riffle splitter (lower panel). In the case of each of the different materials, the positively skewed distributions derived from scooping samples take on a more normal distribution when sampled by means of a riffle splitter (Figure 5, lower panel).
Descriptive statistics for the results of sampling by a 125 mL scoop and riffle splitter are provided in Table 3. The average concentration of the target analytes in the lot are approximately 0.1%; true representation of the lot occurs when exactly five grains of the analyte are collected in a 125 mL scoop. Results for the rice scooping experiment listed in Table A3, Appendix B, indicate that the likelihood of extracting exactly five grains of blue rice by scoop sampling is small; only 5 out of 96 samples gave a correct estimate of the mean, while others vary considerably around the mean value of 5. The overall precision for scoop sampling decreases from 85.1% to 43.7% when using a riffle splitter.
Table 3.
Descriptive statistics for three repetitions (96 samples) of sampling of white rice containing 160 grains each of blue rice, steel, lead and tungsten carbide grains by a 125 mL scoop and riffle splitter, without replacement.
Table 3.
Descriptive statistics for three repetitions (96 samples) of sampling of white rice containing 160 grains each of blue rice, steel, lead and tungsten carbide grains by a 125 mL scoop and riffle splitter, without replacement.
| Material | 125 mL Scoop | 20 Vane Riffle Splitter | ||||||
|---|---|---|---|---|---|---|---|---|
| Blue Rice | Steel | Lead | Tungsten | Blue Rice | Steel | Lead | Tungsten | |
| Density (g/cm3) | 1.45 | 7.6 | 11.34 | 15.63 | 1.45 | 7.6 | 11.34 | 15.63 |
| Number of grains | 480 | 480 | 480 | 480 | 480 | 480 | 480 | 480 |
| Number of samples | 96 | 96 | 96 | 96 | 96 | 96 | 96 | 96 |
| Mean (μ) | 5.0 | 5.0 | 5.0 | 5.0 | 5.0 | 5.0 | 5.0 | 5.0 |
| Standard deviation | 2.20 | 2.78 | 5.13 | 5.80 | 2.14 | 2.16 | 2.24 | 2.20 |
| Variance | 4.84 | 7.73 | 26.27 | 33.64 | 4.59 | 4.65 | 5.01 | 4.84 |
| Relative variance | 0.19 | 0.31 | 1.05 | 1.35 | 0.18 | 0.19 | 0.20 | 0.19 |
| Precision (CV%) | 44.0% | 55.6% | 102.5% | 116.0% | 42.8% | 43.1% | 44.8% | 44.0% |
| Overall precision | 85.1% | 43.7% | ||||||
The strong correlation between the relative variance and the density of the target analyte in the rice grain lot shown in Figure 6 is modelled by a third-order polynomial with an R2 of one, indicating a good correlation between material density and sampling precision by scooping for the four target analyte materials considered here (Table 3). Blue rice has the lowest precision, whereas the tungsten carbide has the highest precision for the rice lot sampled using a 125 mL scoop. The size and shape of the blue rice, steel, lead, and tungsten carbide grains are marginally different, but it is unlikely that these characteristics would account for such large differences in precision between the sampling modes. Again, the primary link between sampling precision and material density is considered to be largely due to the GSE, with the denser materials making a greater contribution to GSE.
The difference in the sampling modes, scooping versus incremental sampling, strongly reflects changes in the density of the target analyte compared to that of the white rice lot. That increases in precision with increasing density of the target analyte as shown in Figure 6 are due to the GSE is validated by the fact that the difference in precision between scoop and incremental sampling of blue rice is negligible as is the density between blue rice and white rice. As the density of the target analyte increases, the difference in precision for the two sampling modes increases along a third-order polynomial curve. The use of the riffle splitter completely removes the influence of density differences in the various analytes, the overall precision decreasing from 85.1% to 43.7% (Table 3). Thus, the identity and size of the GSE as a function of the density of the target analyte are established. What is noteworthy is that the difference in precision for tungsten carbide by scoop and riffle sampling, largely as a result of GSE, is 72% (116.0–44.0, Table 3), almost double that arising from the FSE at approximately 43.7%.
5.3. The Dolomite Sand Experiment
Histograms of the sampling results for black glass, steel balls, lead balls and tungsten carbide are shown for the two modes of sampling corn grains, namely scooping and incremental sampling, in Figure 7.
Sampling by use of a 15 mL scoop yields distributions for each target analyte that are positively skewed (Figure 7, upper panel), while incremental sampling acts to dampen the extent of the positive skew. All of the histograms of results derived by incremental sampling tend towards normal distributions (lower panel of Figure 7) as a result of the effects of the central limit theorem [18].
The experiments on the dolomite sand by scooping and splitting were replicated three times to give 96 samples for each mode of sampling; descriptive statistics are summarised in the in Table 4. Problems identifying dolomite grains that were coloured were overcome to some extent by replacing coloured dolomite with black glass beads with a density approximately equal to that of dolomite sand. The mean values of the target analytes for the scooping and riffle splitting methods are marginally different due to analytical error during counting of the number of grains in the samples.
Table 4.
Descriptive statistics for three repetitions (96 samples) of sampling of dolomite sand containing 120 grains each of black glass beads, steel, lead and tungsten carbide grains by 15 mL scoop and riffle splitter, without replacement.
Table 4.
Descriptive statistics for three repetitions (96 samples) of sampling of dolomite sand containing 120 grains each of black glass beads, steel, lead and tungsten carbide grains by 15 mL scoop and riffle splitter, without replacement.
| Material | 15 mL Scoop | 16 Vane Laboratory Scale Riffle Splitter | ||||||
|---|---|---|---|---|---|---|---|---|
| Black Glass | Steel | Lead | Tungsten | Black Glass | Steel | Lead | Tungsten | |
| Density (g/cm3) | 2.5 | 4.4 | 11.34 | 15.63 | 2.5 | 7.6 | 11.34 | 15.63 |
| Number of grains | 120 | 118 | 121 | 119 | 119 | 121 | 120 | 121 |
| Number of samples | 96 | 96 | 96 | 96 | 96 | 96 | 96 | 96 |
| Mean (m) | 3.819 | 3.777 | 3.872 | 3.798 | 3.719 | 3.792 | 3.750 | 3.771 |
| Standard deviation | 2.99 | 1.90 | 4.07 | 4.11 | 1.66 | 1.87 | 1.79 | 2.07 |
| Variance | 8.96 | 3.62 | 16.58 | 16.91 | 4.140 | 2.186 | 3.125 | 2.947 |
| Relative variance | 0.614 | 0.254 | 1.106 | 1.172 | 0.299 | 0.152 | 0.222 | 0.207 |
| Precision (CV%) | 78.36% | 50.38% | 105.15% | 108.26% | 54.71% | 38.99% | 47.14% | 45.53% |
| Overall precision | 88.68% | 46.93% | ||||||
Use of the riffle splitter reduces the overall precision for the 15 mL scoop sampling of dolomite sand from 89% to 47% (Figure 8). Again, the effects of material density have a significant impact on sampling precision when scooping, compared to incremental sampling with a riffle splitter.
In this particular experiment, the outcome for the analysis of the steel balls is quite different from that which was expected. In this case, the CV% for steel balls (50.38%) is less than that for the black glass beads (78.36%) as shown in Table 4. The reason for this behaviour is unclear but it suggests that the steel balls are more evenly distributed in the dolomite sand than the glass beads. This may be a function of the relatively strong cohesion between the particles of dolomite sand.
6. Comparing Distributions for Scooping and Riffle Splitting
The rice experiment models the probability of selecting discrete random variables (X) from a fixed volume without replacement when there is no physical difference except colour to distinguish between the analyte and the substrate. The blue-coloured corn grains, rice grains, and the black glass beads act as the ‘experimental control’, allowing one to compare differences between the scooping and riffle splitting sample methods because both distributions are approximately normal. In such cases, the hypergeometric, binomial and Poisson models for the behaviour of the analyte are applicable. However, if the significant difference in density of the analyte causes it to segregate in the substrate, the probability of selection becomes strongly positively skewed and the typical hypergeometric, binomial and Poisson models no longer apply. Because sampling is from a fixed volume without replacement, the mean grade of the analyte in the lot remains constant for both sampling methods.
The primary meter for differences between scooping and riffle splitting sampling methods is CV%. However, the extreme density-induced skewness in the sampling distributions could be a disqualifier of CV% as a measure of the difference between the sampling methods. Since the primary aim of these experiments is to illustrate reduced GSE by incremental sampling, the behaviour of moments for discrete distributions was also considered. Details of the analysis of discrete distributions have been examined and indicate that the relative sampling variance and the CV% are virtually identical, providing strong support for the simple use of the coefficient of variation or precision (CV%, σ/μ*100), as a measure of sampling efficiency.
7. Results
The experiment compares sampling precision with material density for target analytes, steel, lead, and tungsten carbide grains using two distinctly different sampling methods with the aim of identifying and quantifying the GSE. Theoretically, GSE is mitigated by extracting as many small increments from the lot as is feasible with the equipment and time available for the task. The lowly Jones riffle splitter, often considered a rather primitive piece of technology, is an excellent stationary tool for demonstrating that incremental sampling mitigates GSE, significantly reducing sampling precision to acceptable levels. Recent work on the inducement of segregation as a result of using riffle splitters [7] indicates that where the particle size distribution is narrow, as is the case in all of these experiments, riffle splitting is not responsible for segregation; for wider particle size distributions, it may be. Results shown in Table 2, Table 3 and Table 4 are summarised in Table 5 and illustrate improved sampling precision for dense materials in particulate lots using incremental sampling by use of a riffle splitter.
Table 5.
Summary of sampling precision for corn, rice, and dolomite sand with target analytes, steel, lead, and tungsten carbide grains, showing reduced and improved sampling precision between scooping and the Jones riffle splitter.
Table 5.
Summary of sampling precision for corn, rice, and dolomite sand with target analytes, steel, lead, and tungsten carbide grains, showing reduced and improved sampling precision between scooping and the Jones riffle splitter.
| Corn | Rice | Dolomite Sand | |||||
|---|---|---|---|---|---|---|---|
| Material | Density (g/cm3) | Scoops | Riffle | Scoops | Riffle | Scoops | Riffle |
| Blue grains | 1.304; 1.45; 2.5 | 69.7% | 53.0% | 44.0% | 42.8% | 78.4% | 54.7% |
| Steel | 4.5 | 166.9% | 60.7% | 55.6% | 43.1% | 50.4% | 39.0% |
| Lead | 11.34 | 236.4% | 57.3% | 102.5% | 44.8% | 105.2% | 47.1% |
| Tungsten | 15.63 | 240.9% | 67.5% | 116.0% | 44.0% | 108.3% | 45.5% |
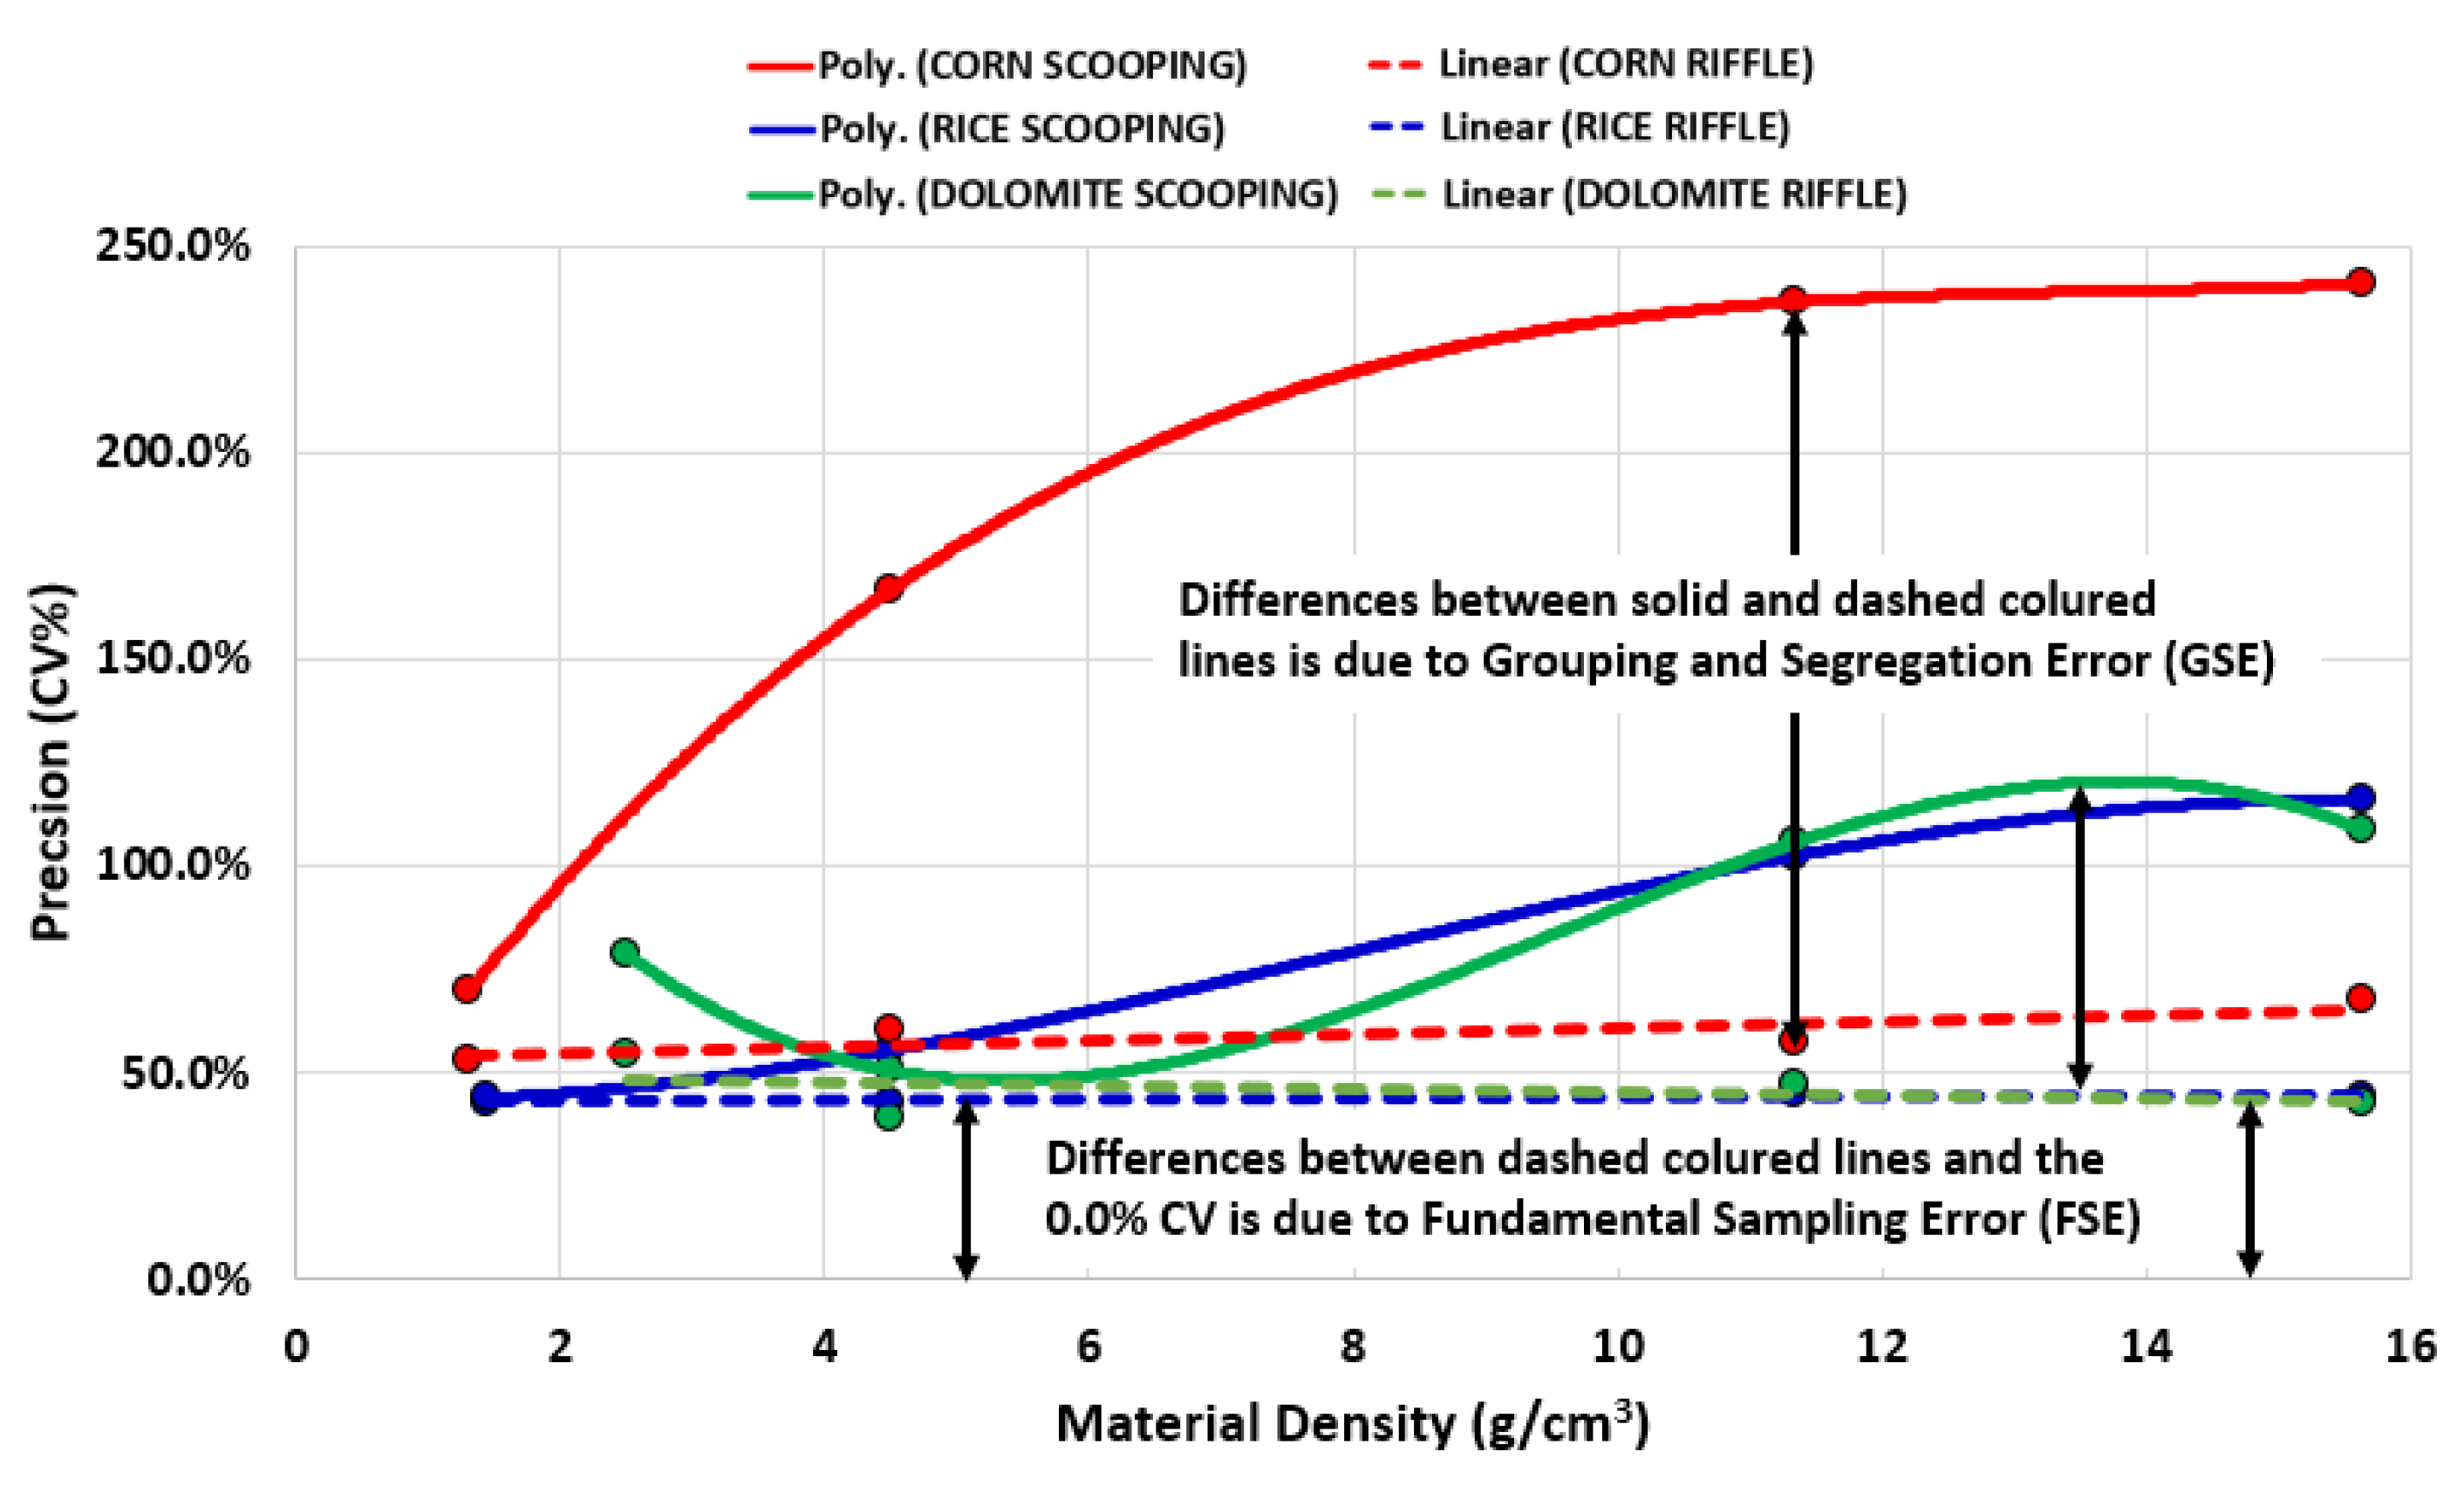
The precision of scoop sampling for the different analytes in different substrates is shown in Figure 9 for corn, rice and dolomite sand, with increasing sampling precision related to increasing density of the target analytes. The separation between the third-order polynomial trend lines for the scooping and riffle splitting is widest for the corn kernels and smallest for the rice grains (Figure 9). The very much higher CV% values for scoop sampling of corn kernels compared to rice and dolomite sand may be related to their very hard and smooth surface and relatively large diameter (5–7 mm dia.). This means the interstices between the kernels are large, and with little or no cohesion between the grains, lead balls (6 mm dia.) with a high density can easily group and segregate in the corn lot.
The similar precision for scoop sampling in the rice and dolomite sand lots shown as solid green and blue lines in Figure 9 is remarkable. Precision for scooping in the rice and dolomite lots increases from lows of 44.0% for blue rice, to 116.0% for tungsten carbide, in rice, respectively (Table 5). The similarity in scoop sampling behaviour for the rice and dolomite lots maybe due to their greater cohesion than the corn lot.
The precision of the target analytes in the corn, rice, and dolomite sand lots using riffle sampling of the materials is shown as the red, blue, and green dashed lines in Figure 9. The average precision for all target analytes is 59.85% in the corn lot, 43.69% in the rice lot, and 46.45% in dolomite (Figure 9). These near-horizontal dashed lines (linear trend lines) indicate very little change in precision as the density of the target analytes increases.
Since scoop sampling includes both FSE and GSE, and incremental sampling is the primary method for removing GSE, the summary of results in Figure 9 indicates that the riffle splitter removes virtually all GSE; only FSE remains. Sampling by riffle splitter is equivalent to incremental sampling, which is shown here as proof that it is the primary method for overcoming GSE. Just to make a point, once the GSE is removed, the remaining precision is entirely due to FSE, and we should note that DH >> CH. For narrow particle size distributions, riffle splitting tends not to introduce segregation error [7].
8. Discussion and Conclusions
The reader may find it instructive to consult two treatments of the intricate relationships between FSE and GSE and the sampling mode (grab sampling vs. composite sampling) published by Minkkinen and Esbensen [14,19], containing in-depth theoretical analysis as well as extensive, carefully designed in silico simulation experiments. The results and conclusions herein match the experimental results in the present study with powerful complementarity.
Scoop sampling reveals that high-density target analytes are strongly segregated in the lot, while incremental sampling using a standard 20 vane riffle splitter, results in the almost complete removal of segregation. The experiment demonstrates the effectiveness of a riffle splitter in overcoming segregation, compared to scoop sampling.
The contribution of the fundamental sampling error (FSE) as measured by sampling precision is a function of the size, shape, density, liberation factor, mineralogical composition factor and the mass of the materials being sampled. At an industry scale operation, this error can never be eliminated, but careful heterogeneity tests can ensure that samples of the correct mass and fragment size are collected to minimise the FSE.
This paper investigates the improvement in precision as a result of riffle splitting as a sampling method compared to using a scoop, effectively grab sampling. Assuming that there is very little in the way of increment delimitation error (DE), extraction error (EE), preparation error (PE) and weighting error (WE) and accepting that there is minimal analytical error (AE), the measured precision is largely due to a combination of sampling errors associated with the inherent cohesion and characteristic variability of the material itself, namely FSE and GSE.
The GSE remains elusive in that it is difficult to identity and the size, in terms of its contribution to the overall sampling error, is difficult to measure. In general, GSE can affect both grade and sizing of materials, with the principle means of overcoming such effects being the use of mixing and incremental sampling. The scoop sampling experiments at a classroom level indicate that the precision increases for all lot types—corn, rice, and dolomite sand—as the density of the target analyte increases. Such increases include both the FSE and GSE of the materials. In general, the empirical precision of the FSE for the many rice experiments conducted in classroom settings lies between 32% and 50%, so any additional precision above this level is probably due to the GSE.
A summary of the precision for the experiments performed, listed in Table 5, indicates that the largest changes in precision are for the lead (179%) and tungsten carbide (173%), the densest of the materials used, in the corn lot. In the case of the steel, lead, and tungsten carbide, the precision is drastically reduced by using the riffle splitter, whereas for the coloured corn, rice and glass beads, the change is only marginal (Table 5).
Figure 9 is a succinct summary of the effects seen in the experiments demonstrating the significant improvement of precision by riffle splitting (shown by the blue line), compared to scooping (shown by the red line). The overall effect of sampling by riffle splitting is equivalent to incremental sampling (composite sampling), the very well-known effective means of reducing the effects from GSE.
The remarkable conclusion from this experiment is that GSE, generally considered a somewhat ephemeral sampling error, can in fact be identified, measured, and mitigated. Furthermore, in the extreme case, the precision of the GSE is shown to be approximately four times as large as that for the FSE. Although the Theory of Sampling (TOS) makes use of specific coefficients for the grouping factor and the segregation factor, experimental characterisation such as the rice experiment, does not allow one to identify or measure these components of the GSE individually—in complete agreement with the conclusions reached by Minkkinen and Esbensen [14,20]. Segregation in the corn kernel lot is much higher than for either the rice or dolomite sand lots and is believed to be related to the larger grain size of, and the almost total absence of cohesion between the kernels.
Funding
This research received no external funding.
Data Availability Statement
Acknowledgments
The help and assistance of HR Minnitt in capturing data and analysis of the samples are acknowledged.
Conflicts of Interest
The author declares no conflict of interest.
Appendix A. Counts of Blue Corn, Steel Balls, Lead Shot and Tungsten Carbide Grains in 96 Samples of Corn Taken to Extinction and without Replacement, with a 250 mL Scoop and a 20 Vane Riffle Splitter
Table A1.
Counts of blue corn, steel balls, lead shot and tungsten carbide grains in 96 yellow corn samples taken to extinction with a 250 mL scoop, without replacement.
Table A1.
Counts of blue corn, steel balls, lead shot and tungsten carbide grains in 96 yellow corn samples taken to extinction with a 250 mL scoop, without replacement.
| No. | Blue Corn | Steel | Lead | Tungsten | No. | Blue Corn | Steel | Lead | Tungsten | No. | Blue Corn | Steel | Lead | Tungsten |
|---|---|---|---|---|---|---|---|---|---|---|---|---|---|---|
| 1 | 3 | 0 | 27 | 2 | 33 | 4 | 4 | 0 | 1 | 65 | 8 | 5 | 5 | 3 |
| 2 | 6 | 0 | 0 | 0 | 34 | 6 | 10 | 27 | 6 | 66 | 6 | 1 | 0 | 1 |
| 3 | 1 | 0 | 0 | 0 | 35 | 7 | 3 | 1 | 0 | 67 | 8 | 2 | 5 | 2 |
| 4 | 4 | 0 | 1 | 1 | 36 | 1 | 6 | 1 | 4 | 68 | 3 | 15 | 47 | 12 |
| 5 | 4 | 1 | 2 | 3 | 37 | 3 | 1 | 0 | 0 | 69 | 4 | 4 | 0 | 1 |
| 6 | 3 | 0 | 1 | 0 | 38 | 2 | 18 | 25 | 22 | 70 | 2 | 2 | 3 | 0 |
| 7 | 2 | 3 | 1 | 1 | 39 | 2 | 3 | 4 | 4 | 71 | 7 | 10 | 0 | 2 |
| 8 | 4 | 7 | 2 | 7 | 40 | 4 | 15 | 16 | 6 | 72 | 2 | 9 | 10 | 9 |
| 9 | 5 | 36 | 1 | 40 | 41 | 6 | 2 | 0 | 0 | 73 | 3 | 1 | 3 | 1 |
| 10 | 0 | 1 | 0 | 2 | 42 | 3 | 3 | 1 | 3 | 74 | 3 | 3 | 0 | 0 |
| 11 | 0 | 2 | 0 | 2 | 43 | 1 | 1 | 0 | 0 | 75 | 9 | 2 | 0 | 4 |
| 12 | 4 | 5 | 4 | 2 | 44 | 2 | 0 | 0 | 0 | 76 | 3 | 6 | 4 | 2 |
| 13 | 2 | 1 | 0 | 0 | 45 | 2 | 1 | 1 | 1 | 77 | 5 | 0 | 0 | 0 |
| 14 | 6 | 3 | 2 | 1 | 46 | 1 | 0 | 0 | 0 | 78 | 3 | 0 | 0 | 0 |
| 15 | 1 | 0 | 2 | 6 | 47 | 1 | 5 | 8 | 0 | 79 | 4 | 1 | 0 | 0 |
| 16 | 3 | 2 | 2 | 3 | 48 | 2 | 0 | 3 | 0 | 80 | 7 | 2 | 0 | 1 |
| 17 | 1 | 2 | 18 | 3 | 49 | 5 | 2 | 1 | 0 | 81 | 1 | 1 | 4 | 4 |
| 18 | 5 | 5 | 0 | 1 | 50 | 2 | 4 | 3 | 7 | 82 | 2 | 3 | 6 | 2 |
| 19 | 2 | 5 | 28 | 8 | 51 | 7 | 3 | 0 | 1 | 83 | 2 | 3 | 2 | 1 |
| 20 | 3 | 1 | 0 | 0 | 52 | 10 | 5 | 6 | 2 | 84 | 1 | 1 | 2 | 0 |
| 21 | 4 | 1 | 0 | 0 | 53 | 4 | 1 | 2 | 2 | 85 | 6 | 1 | 0 | 0 |
| 22 | 3 | 3 | 0 | 4 | 54 | 5 | 0 | 0 | 0 | 86 | 1 | 0 | 0 | 1 |
| 23 | 2 | 4 | 1 | 4 | 55 | 1 | 0 | 0 | 0 | 87 | 1 | 2 | 0 | 0 |
| 24 | 3 | 3 | 1 | 3 | 56 | 1 | 0 | 0 | 0 | 88 | 0 | 0 | 0 | 5 |
| 25 | 2 | 0 | 0 | 0 | 57 | 3 | 0 | 0 | 0 | 89 | 0 | 1 | 4 | 1 |
| 26 | 3 | 1 | 1 | 2 | 58 | 3 | 0 | 0 | 0 | 90 | 2 | 0 | 0 | 0 |
| 27 | 4 | 0 | 1 | 0 | 59 | 6 | 0 | 0 | 0 | 91 | 0 | 1 | 0 | 0 |
| 28 | 5 | 0 | 0 | 0 | 60 | 2 | 4 | 0 | 1 | 92 | 0 | 0 | 0 | 0 |
| 29 | 1 | 1 | 2 | 1 | 61 | 1 | 0 | 1 | 0 | 93 | 1 | 2 | 0 | 2 |
| 30 | 1 | 3 | 0 | 2 | 62 | 2 | 0 | 0 | 0 | 94 | 2 | 1 | 1 | 0 |
| 31 | 4 | 0 | 0 | 0 | 63 | 1 | 7 | 0 | 41 | 95 | 3 | 3 | 3 | 3 |
| 32 | 5 | 0 | 1 | 1 | 64 | 4 | 3 | 2 | 1 | 96 | 1 | 21 | 1 | 43 |
Table A2.
Counts of blue corn, steel balls, lead shot and tungsten carbide grains in 96 yellow corn samples taken to extinction and without replacement using a 20 vane riffle splitter.
Table A2.
Counts of blue corn, steel balls, lead shot and tungsten carbide grains in 96 yellow corn samples taken to extinction and without replacement using a 20 vane riffle splitter.
| No. | Blue Corn | Steel | Lead | Tungsten | No. | Blue Corn | Steel | Lead | Tungsten | No. | Blue Corn | Steel | Lead | Tungsten |
|---|---|---|---|---|---|---|---|---|---|---|---|---|---|---|
| 1 | 3 | 2 | 7 | 3 | 33 | 2 | 4 | 2 | 2 | 65 | 1 | 2 | 4 | 4 |
| 2 | 2 | 3 | 3 | 4 | 34 | 2 | 5 | 3 | 5 | 66 | 5 | 2 | 4 | 1 |
| 3 | 7 | 5 | 2 | 3 | 35 | 4 | 5 | 6 | 4 | 67 | 2 | 3 | 4 | 3 |
| 4 | 3 | 2 | 3 | 2 | 36 | 1 | 6 | 2 | 3 | 68 | 1 | 4 | 3 | 4 |
| 5 | 4 | 2 | 0 | 0 | 37 | 3 | 2 | 1 | 1 | 69 | 2 | 1 | 0 | 4 |
| 6 | 2 | 2 | 3 | 2 | 38 | 6 | 3 | 3 | 3 | 70 | 2 | 3 | 9 | 3 |
| 7 | 1 | 1 | 2 | 2 | 39 | 2 | 3 | 2 | 1 | 71 | 2 | 1 | 1 | 3 |
| 8 | 0 | 5 | 5 | 1 | 40 | 3 | 1 | 3 | 4 | 72 | 6 | 5 | 2 | 3 |
| 9 | 4 | 3 | 2 | 4 | 41 | 1 | 1 | 3 | 4 | 73 | 5 | 1 | 3 | 4 |
| 10 | 5 | 2 | 7 | 3 | 42 | 4 | 7 | 2 | 7 | 74 | 1 | 3 | 3 | 2 |
| 11 | 6 | 1 | 3 | 2 | 43 | 1 | 1 | 5 | 4 | 75 | 3 | 3 | 0 | 2 |
| 12 | 2 | 6 | 4 | 4 | 44 | 4 | 3 | 3 | 4 | 76 | 5 | 3 | 3 | 7 |
| 13 | 3 | 2 | 2 | 6 | 45 | 5 | 6 | 4 | 2 | 77 | 5 | 2 | 4 | 3 |
| 14 | 2 | 3 | 1 | 1 | 46 | 4 | 4 | 1 | 1 | 78 | 5 | 2 | 7 | 0 |
| 15 | 2 | 6 | 5 | 3 | 47 | 3 | 3 | 0 | 0 | 79 | 4 | 2 | 4 | 2 |
| 16 | 4 | 3 | 0 | 3 | 48 | 3 | 2 | 3 | 1 | 80 | 4 | 6 | 4 | 1 |
| 17 | 5 | 6 | 2 | 5 | 49 | 1 | 0 | 5 | 2 | 81 | 3 | 2 | 3 | 0 |
| 18 | 2 | 2 | 1 | 5 | 50 | 3 | 6 | 8 | 1 | 82 | 5 | 1 | 1 | 8 |
| 19 | 3 | 2 | 3 | 6 | 51 | 1 | 1 | 1 | 2 | 83 | 1 | 4 | 4 | 0 |
| 20 | 7 | 6 | 2 | 3 | 52 | 3 | 3 | 6 | 3 | 84 | 3 | 7 | 3 | 0 |
| 21 | 5 | 3 | 4 | 1 | 53 | 4 | 2 | 4 | 8 | 85 | 5 | 1 | 5 | 8 |
| 22 | 3 | 3 | 2 | 5 | 54 | 4 | 3 | 4 | 6 | 86 | 2 | 2 | 1 | 0 |
| 23 | 3 | 2 | 5 | 2 | 55 | 1 | 5 | 2 | 3 | 87 | 2 | 3 | 3 | 0 |
| 24 | 5 | 6 | 3 | 2 | 56 | 5 | 3 | 4 | 3 | 88 | 5 | 2 | 4 | 4 |
| 25 | 0 | 1 | 3 | 5 | 57 | 1 | 2 | 2 | 5 | 89 | 1 | 5 | 2 | 0 |
| 26 | 5 | 1 | 4 | 4 | 58 | 5 | 2 | 5 | 3 | 90 | 3 | 4 | 0 | 4 |
| 27 | 3 | 3 | 3 | 3 | 59 | 7 | 1 | 1 | 5 | 91 | 4 | 7 | 4 | 0 |
| 28 | 1 | 9 | 2 | 1 | 60 | 5 | 6 | 2 | 3 | 92 | 3 | 4 | 1 | 10 |
| 29 | 2 | 3 | 5 | 5 | 61 | 3 | 3 | 2 | 2 | 93 | 3 | 4 | 2 | 3 |
| 30 | 0 | 0 | 2 | 3 | 62 | 4 | 2 | 4 | 1 | 94 | 3 | 2 | 3 | 6 |
| 31 | 2 | 0 | 4 | 1 | 63 | 3 | 4 | 4 | 2 | 95 | 3 | 3 | 4 | 6 |
| 32 | 4 | 0 | 6 | 3 | 64 | 2 | 2 | 3 | 5 | 96 | 1 | 5 | 5 | 3 |
Appendix B. Counts of Blue Rice, Steel Balls, Lead Shot and Tungsten Carbide Grains in 96 Samples of Rice Taken to Extinction, with a 125 mL Scoop and a 20 Vane Riffle Splitter
Table A3.
Counts of blue rice, steel balls, lead shot and tungsten carbide grains in 96 rice samples taken to extinction with 125 mL scoops, without replacement.
Table A3.
Counts of blue rice, steel balls, lead shot and tungsten carbide grains in 96 rice samples taken to extinction with 125 mL scoops, without replacement.
| No. | Blue Grains | Steel | Lead | Tungsten | No. | Blue Grains | Steel | Lead | Tungsten | No. | Blue Grains | Steel | Lead | Tungsten |
|---|---|---|---|---|---|---|---|---|---|---|---|---|---|---|
| 1 | 4 | 3 | 1 | 2 | 33 | 6 | 4 | 3 | 1 | 65 | 8 | 5 | 9 | 8 |
| 2 | 5 | 1 | 6 | 3 | 34 | 0 | 5 | 2 | 1 | 66 | 7 | 5 | 5 | 6 |
| 3 | 7 | 7 | 4 | 4 | 35 | 3 | 4 | 8 | 14 | 67 | 5 | 6 | 8 | 9 |
| 4 | 7 | 8 | 7 | 8 | 36 | 3 | 2 | 8 | 6 | 68 | 8 | 8 | 4 | 11 |
| 5 | 6 | 6 | 9 | 5 | 37 | 3 | 2 | 2 | 1 | 69 | 3 | 6 | 2 | 3 |
| 6 | 5 | 4 | 7 | 11 | 38 | 3 | 7 | 7 | 7 | 70 | 5 | 5 | 12 | 21 |
| 7 | 6 | 8 | 8 | 6 | 39 | 4 | 6 | 6 | 11 | 71 | 4 | 7 | 13 | 7 |
| 8 | 5 | 4 | 10 | 4 | 40 | 8 | 7 | 12 | 5 | 72 | 0 | 8 | 18 | 14 |
| 9 | 6 | 11 | 19 | 26 | 41 | 4 | 6 | 16 | 17 | 73 | 5 | 7 | 8 | 8 |
| 10 | 3 | 2 | 2 | 1 | 42 | 7 | 4 | 2 | 3 | 74 | 7 | 4 | 9 | 4 |
| 11 | 4 | 10 | 11 | 10 | 43 | 2 | 14 | 31 | 38 | 75 | 7 | 9 | 7 | 7 |
| 12 | 3 | 2 | 6 | 5 | 44 | 4 | 8 | 3 | 0 | 76 | 2 | 5 | 4 | 9 |
| 13 | 4 | 5 | 3 | 4 | 45 | 6 | 6 | 4 | 1 | 77 | 6 | 3 | 7 | 5 |
| 14 | 1 | 2 | 7 | 6 | 46 | 7 | 6 | 0 | 0 | 78 | 7 | 2 | 8 | 4 |
| 15 | 5 | 8 | 13 | 10 | 47 | 3 | 10 | 6 | 5 | 79 | 4 | 4 | 6 | 3 |
| 16 | 2 | 3 | 1 | 2 | 48 | 4 | 6 | 3 | 6 | 80 | 5 | 5 | 4 | 6 |
| 17 | 6 | 3 | 4 | 3 | 49 | 6 | 5 | 1 | 1 | 81 | 5 | 3 | 1 | 7 |
| 18 | 4 | 4 | 2 | 0 | 50 | 3 | 6 | 7 | 3 | 82 | 4 | 12 | 1 | 2 |
| 19 | 4 | 3 | 1 | 5 | 51 | 5 | 2 | 2 | 0 | 83 | 4 | 2 | 5 | 3 |
| 20 | 6 | 6 | 3 | 6 | 52 | 4 | 10 | 12 | 15 | 84 | 5 | 6 | 14 | 4 |
| 21 | 1 | 7 | 6 | 7 | 53 | 6 | 3 | 1 | 3 | 85 | 3 | 4 | 2 | 6 |
| 22 | 2 | 11 | 9 | 8 | 54 | 3 | 4 | 0 | 0 | 86 | 5 | 2 | 0 | 0 |
| 23 | 3 | 4 | 1 | 1 | 55 | 3 | 0 | 1 | 0 | 87 | 5 | 6 | 0 | 3 |
| 24 | 6 | 8 | 2 | 6 | 56 | 5 | 9 | 2 | 1 | 88 | 2 | 3 | 5 | 0 |
| 25 | 6 | 2 | 4 | 0 | 57 | 3 | 0 | 1 | 0 | 89 | 3 | 7 | 1 | 2 |
| 26 | 4 | 5 | 2 | 7 | 58 | 14 | 1 | 0 | 3 | 90 | 6 | 7 | 2 | 0 |
| 27 | 9 | 4 | 2 | 0 | 59 | 9 | 4 | 0 | 1 | 91 | 5 | 3 | 3 | 0 |
| 28 | 8 | 3 | 1 | 3 | 60 | 6 | 1 | 3 | 1 | 92 | 5 | 4 | 0 | 0 |
| 29 | 6 | 6 | 2 | 3 | 61 | 6 | 2 | 2 | 4 | 93 | 6 | 3 | 2 | 4 |
| 30 | 6 | 3 | 2 | 2 | 62 | 6 | 5 | 0 | 1 | 94 | 7 | 6 | 0 | 0 |
| 31 | 10 | 3 | 3 | 0 | 63 | 10 | 1 | 1 | 1 | 95 | 6 | 1 | 0 | 2 |
| 32 | 6 | 3 | 2 | 2 | 64 | 4 | 9 | 14 | 10 | 96 | 6 | 4 | 0 | 2 |
Table A4.
Counts of blue rice, steel balls, lead shot and tungsten carbide grains in 96 rice samples taken using a 20 vane Riffle Splitter.
Table A4.
Counts of blue rice, steel balls, lead shot and tungsten carbide grains in 96 rice samples taken using a 20 vane Riffle Splitter.
| No. | Blue Grains | Steel | Lead | Tungsten | No. | Blue Grains | Steel | Lead | Tungsten | No. | Blue Grains | Steel | Lead | Tungsten |
|---|---|---|---|---|---|---|---|---|---|---|---|---|---|---|
| 1 | 5 | 4 | 6 | 4 | 33 | 5 | 4 | 1 | 5 | 65 | 6 | 6 | 3 | 1 |
| 2 | 5 | 3 | 6 | 2 | 34 | 4 | 4 | 4 | 5 | 66 | 4 | 3 | 4 | 4 |
| 3 | 3 | 9 | 2 | 6 | 35 | 5 | 3 | 5 | 3 | 67 | 6 | 2 | 7 | 3 |
| 4 | 4 | 10 | 5 | 5 | 36 | 4 | 7 | 10 | 8 | 68 | 5 | 2 | 4 | 3 |
| 5 | 8 | 4 | 7 | 6 | 37 | 3 | 7 | 6 | 5 | 69 | 5 | 4 | 6 | 4 |
| 6 | 8 | 7 | 5 | 4 | 38 | 7 | 7 | 3 | 4 | 70 | 10 | 5 | 7 | 6 |
| 7 | 8 | 4 | 3 | 5 | 39 | 6 | 3 | 4 | 7 | 71 | 3 | 4 | 7 | 4 |
| 8 | 6 | 3 | 6 | 6 | 40 | 4 | 4 | 5 | 5 | 72 | 2 | 3 | 7 | 5 |
| 9 | 5 | 4 | 10 | 9 | 41 | 5 | 5 | 7 | 10 | 73 | 4 | 7 | 6 | 2 |
| 10 | 5 | 2 | 5 | 7 | 42 | 2 | 4 | 8 | 9 | 74 | 8 | 4 | 8 | 5 |
| 11 | 7 | 4 | 8 | 10 | 43 | 5 | 7 | 4 | 2 | 75 | 2 | 2 | 2 | 11 |
| 12 | 5 | 3 | 10 | 4 | 44 | 4 | 4 | 4 | 4 | 76 | 7 | 5 | 3 | 4 |
| 13 | 6 | 7 | 4 | 1 | 45 | 3 | 9 | 4 | 5 | 77 | 8 | 4 | 3 | 3 |
| 14 | 4 | 7 | 4 | 1 | 46 | 7 | 5 | 2 | 5 | 78 | 10 | 8 | 3 | 5 |
| 15 | 3 | 3 | 4 | 5 | 47 | 6 | 6 | 7 | 3 | 79 | 3 | 4 | 7 | 4 |
| 16 | 4 | 4 | 2 | 7 | 48 | 5 | 1 | 6 | 3 | 80 | 5 | 5 | 9 | 4 |
| 17 | 8 | 4 | 6 | 6 | 49 | 2 | 5 | 9 | 5 | 81 | 3 | 5 | 4 | 4 |
| 18 | 1 | 9 | 2 | 5 | 50 | 6 | 6 | 3 | 4 | 82 | 5 | 7 | 4 | 5 |
| 19 | 5 | 4 | 3 | 4 | 51 | 1 | 2 | 7 | 7 | 83 | 3 | 11 | 3 | 3 |
| 20 | 5 | 8 | 4 | 3 | 52 | 8 | 7 | 3 | 3 | 84 | 9 | 4 | 1 | 13 |
| 21 | 4 | 5 | 5 | 7 | 53 | 3 | 5 | 5 | 8 | 85 | 4 | 8 | 5 | 6 |
| 22 | 1 | 5 | 4 | 4 | 54 | 9 | 4 | 3 | 4 | 86 | 4 | 2 | 4 | 5 |
| 23 | 5 | 2 | 2 | 7 | 55 | 4 | 6 | 3 | 2 | 87 | 1 | 4 | 3 | 6 |
| 24 | 6 | 4 | 5 | 3 | 56 | 5 | 3 | 4 | 9 | 88 | 7 | 7 | 7 | 7 |
| 25 | 4 | 7 | 4 | 5 | 57 | 6 | 2 | 4 | 7 | 89 | 4 | 5 | 6 | 5 |
| 26 | 7 | 3 | 4 | 7 | 58 | 8 | 5 | 3 | 6 | 90 | 5 | 7 | 11 | 5 |
| 27 | 6 | 3 | 4 | 3 | 59 | 3 | 4 | 8 | 4 | 91 | 5 | 8 | 7 | 7 |
| 28 | 0 | 4 | 7 | 3 | 60 | 7 | 7 | 3 | 4 | 92 | 6 | 6 | 3 | 5 |
| 29 | 5 | 6 | 2 | 5 | 61 | 6 | 9 | 6 | 5 | 93 | 10 | 4 | 5 | 5 |
| 30 | 5 | 1 | 10 | 5 | 62 | 2 | 2 | 3 | 1 | 94 | 4 | 4 | 4 | 3 |
| 31 | 6 | 6 | 5 | 3 | 63 | 6 | 9 | 9 | 3 | 95 | 1 | 4 | 2 | 7 |
| 32 | 6 | 9 | 6 | 8 | 64 | 7 | 6 | 7 | 4 | 96 | 3 | 6 | 5 | 7 |
Appendix C. Counts of Glass Beads, Steel Balls, Lead Shot and Tungsten Carbide Grains in 96 Samples of Dolomite Sand Taken to Extinction, with a 15 mL Scoop and a 16 Vane Laboratory Scale Riffle Splitter
Table A5.
Counts of black glass beads, steel balls, lead shot and tungsten carbide grains in 96 dolomite sand samples taken to extinction with a 15 mL scoop, without replacement.
Table A5.
Counts of black glass beads, steel balls, lead shot and tungsten carbide grains in 96 dolomite sand samples taken to extinction with a 15 mL scoop, without replacement.
| No. | Bead | Steel | Lead | Tungsten | No. | Bead | Steel | Lead | Tungsten | No. | Bead | Steel | Lead | Tungsten |
|---|---|---|---|---|---|---|---|---|---|---|---|---|---|---|
| 1 | 3 | 6 | 17 | 11 | 33 | 2 | 0 | 0 | 0 | 65 | 7 | 2 | 2 | 2 |
| 2 | 5 | 2 | 4 | 5 | 34 | 4 | 3 | 1 | 0 | 66 | 2 | 5 | 4 | 1 |
| 3 | 3 | 3 | 1 | 2 | 35 | 1 | 5 | 1 | 1 | 67 | 4 | 4 | 2 | 2 |
| 4 | 0 | 5 | 2 | 1 | 36 | 9 | 4 | 1 | 0 | 68 | 6 | 2 | 4 | 7 |
| 5 | 17 | 2 | 0 | 0 | 37 | 0 | 3 | 0 | 3 | 69 | 8 | 2 | 1 | 0 |
| 6 | 7 | 4 | 0 | 4 | 38 | 3 | 3 | 6 | 0 | 70 | 3 | 5 | 6 | 7 |
| 7 | 0 | 3 | 3 | 4 | 39 | 10 | 6 | 1 | 0 | 71 | 9 | 4 | 1 | 1 |
| 8 | 4 | 4 | 0 | 1 | 40 | 7 | 3 | 1 | 2 | 72 | 9 | 6 | 5 | 3 |
| 9 | 0 | 4 | 5 | 2 | 41 | 5 | 6 | 8 | 6 | 73 | 4 | 2 | 3 | 3 |
| 10 | 6 | 4 | 0 | 0 | 42 | 10 | 9 | 2 | 0 | 74 | 4 | 2 | 0 | 0 |
| 11 | 6 | 1 | 0 | 2 | 43 | 8 | 1 | 2 | 1 | 75 | 2 | 9 | 11 | 5 |
| 12 | 0 | 4 | 4 | 2 | 44 | 1 | 4 | 4 | 8 | 76 | 2 | 4 | 5 | 0 |
| 13 | 7 | 8 | 1 | 0 | 45 | 3 | 2 | 3 | 4 | 77 | 3 | 1 | 7 | 5 |
| 14 | 10 | 4 | 3 | 4 | 46 | 6 | 3 | 4 | 1 | 78 | 3 | 3 | 4 | 2 |
| 15 | 3 | 3 | 1 | 0 | 47 | 1 | 7 | 7 | 11 | 79 | 3 | 7 | 0 | 6 |
| 16 | 2 | 3 | 2 | 3 | 48 | 8 | 3 | 5 | 3 | 80 | 5 | 3 | 1 | 3 |
| 17 | 3 | 2 | 3 | 4 | 49 | 4 | 4 | 0 | 0 | 81 | 2 | 1 | 20 | 27 |
| 18 | 1 | 5 | 0 | 3 | 50 | 7 | 4 | 6 | 5 | 82 | 2 | 2 | 3 | 5 |
| 19 | 5 | 3 | 1 | 7 | 51 | 6 | 4 | 1 | 0 | 83 | 2 | 3 | 1 | 0 |
| 20 | 1 | 4 | 3 | 1 | 52 | 2 | 7 | 0 | 3 | 84 | 4 | 3 | 0 | 1 |
| 21 | 4 | 4 | 12 | 11 | 53 | 2 | 0 | 14 | 13 | 85 | 4 | 5 | 3 | 3 |
| 22 | 7 | 7 | 3 | 0 | 54 | 3 | 4 | 0 | 0 | 86 | 1 | 8 | 1 | 3 |
| 23 | 8 | 5 | 6 | 6 | 55 | 4 | 3 | 0 | 1 | 87 | 5 | 6 | 1 | 2 |
| 24 | 0 | 2 | 5 | 5 | 56 | 2 | 5 | 12 | 10 | 88 | 6 | 3 | 3 | 3 |
| 25 | 0 | 1 | 2 | 6 | 57 | 2 | 6 | 1 | 2 | 89 | 5 | 3 | 1 | 3 |
| 26 | 3 | 2 | 13 | 5 | 58 | 0 | 3 | 2 | 7 | 90 | 2 | 4 | 6 | 3 |
| 27 | 5 | 3 | 6 | 13 | 59 | 3 | 2 | 0 | 2 | 91 | 4 | 7 | 5 | 1 |
| 28 | 6 | 4 | 3 | 1 | 60 | 2 | 2 | 11 | 12 | 92 | 5 | 7 | 9 | 4 |
| 29 | 0 | 1 | 7 | 3 | 61 | 0 | 2 | 11 | 7 | 93 | 2 | 6 | 7 | 8 |
| 30 | 1 | 4 | 3 | 1 | 62 | 1 | 2 | 12 | 10 | 94 | 3 | 3 | 4 | 7 |
| 31 | 2 | 5 | 3 | 5 | 63 | 2 | 4 | 0 | 1 | 95 | ||||
| 32 | 0 | 4 | 9 | 5 | 64 | 1 | 3 | 6 | 10 | 96 |
Table A6.
Counts of blue rice, steel balls, lead shot and tungsten carbide grains in 96 dolomite sand samples taken using a 20 vane Riffle Splitter.
Table A6.
Counts of blue rice, steel balls, lead shot and tungsten carbide grains in 96 dolomite sand samples taken using a 20 vane Riffle Splitter.
| No. | Bead | Steel | Lead | Tungsten | No. | Bead | Steel | Lead | Tungsten | No. | Bead | Steel | Lead | Tungsten |
|---|---|---|---|---|---|---|---|---|---|---|---|---|---|---|
| 1 | 5 | 1 | 2 | 4 | 33 | 2 | 6 | 3 | 3 | 65 | 4 | 4 | 6 | 5 |
| 2 | 4 | 3 | 3 | 3 | 34 | 1 | 6 | 2 | 3 | 66 | 2 | 4 | 5 | 3 |
| 3 | 2 | 6 | 3 | 6 | 35 | 3 | 6 | 1 | 4 | 67 | 3 | 5 | 4 | 4 |
| 4 | 4 | 5 | 2 | 5 | 36 | 4 | 3 | 5 | 5 | 68 | 4 | 4 | 5 | 4 |
| 5 | 3 | 3 | 6 | 3 | 37 | 1 | 5 | 3 | 6 | 69 | 1 | 4 | 4 | 3 |
| 6 | 1 | 3 | 5 | 4 | 38 | 4 | 3 | 3 | 0 | 70 | 2 | 2 | 2 | 4 |
| 7 | 7 | 1 | 2 | 2 | 39 | 4 | 5 | 1 | 6 | 71 | 4 | 5 | 4 | 5 |
| 8 | 2 | 3 | 3 | 3 | 40 | 3 | 4 | 4 | 2 | 72 | 3 | 4 | 3 | 1 |
| 9 | 7 | 4 | 7 | 4 | 41 | 3 | 4 | 2 | 2 | 73 | 4 | 3 | 2 | 2 |
| 10 | 3 | 1 | 4 | 2 | 42 | 3 | 2 | 3 | 3 | 74 | 4 | 3 | 4 | 3 |
| 11 | 3 | 3 | 2 | 2 | 43 | 1 | 2 | 4 | 5 | 75 | 8 | 5 | 2 | 2 |
| 12 | 2 | 4 | 5 | 3 | 44 | 3 | 2 | 6 | 6 | 76 | 1 | 6 | 4 | 7 |
| 13 | 5 | 1 | 8 | 2 | 45 | 7 | 6 | 2 | 4 | 77 | 4 | 5 | 5 | 1 |
| 14 | 3 | 5 | 1 | 2 | 46 | 5 | 4 | 3 | 3 | 78 | 4 | 3 | 2 | 6 |
| 15 | 3 | 4 | 1 | 4 | 47 | 4 | 3 | 3 | 3 | 79 | 3 | 5 | 3 | 5 |
| 16 | 5 | 5 | 5 | 3 | 48 | 4 | 3 | 4 | 6 | 80 | 4 | 3 | 2 | 3 |
| 17 | 6 | 3 | 2 | 3 | 49 | 4 | 5 | 4 | 3 | 81 | 2 | 2 | 3 | 6 |
| 18 | 6 | 4 | 2 | 4 | 50 | 3 | 3 | 4 | 4 | 82 | 3 | 4 | 6 | 2 |
| 19 | 7 | 4 | 3 | 7 | 51 | 7 | 4 | 4 | 6 | 83 | 7 | 6 | 2 | 2 |
| 20 | 3 | 3 | 3 | 5 | 52 | 2 | 3 | 5 | 2 | 84 | 4 | 0 | 4 | 5 |
| 21 | 7 | 4 | 6 | 3 | 53 | 7 | 2 | 2 | 6 | 85 | 8 | 2 | 4 | 2 |
| 22 | 1 | 7 | 6 | 1 | 54 | 6 | 6 | 7 | 2 | 86 | 0 | 5 | 6 | 5 |
| 23 | 1 | 5 | 7 | 2 | 55 | 3 | 3 | 4 | 6 | 87 | 3 | 3 | 4 | 4 |
| 24 | 2 | 4 | 6 | 7 | 56 | 2 | 6 | 4 | 3 | 88 | 2 | 5 | 3 | 2 |
| 25 | 1 | 3 | 1 | 5 | 57 | 3 | 5 | 3 | 1 | 89 | 7 | 3 | 6 | 4 |
| 26 | 5 | 6 | 2 | 6 | 58 | 10 | 2 | 6 | 6 | 90 | 4 | 5 | 1 | 5 |
| 27 | 3 | 5 | 4 | 3 | 59 | 5 | 4 | 4 | 3 | 91 | 3 | 4 | 11 | 5 |
| 28 | 2 | 3 | 3 | 2 | 60 | 2 | 2 | 6 | 2 | 92 | 1 | 3 | 3 | 5 |
| 29 | 7 | 5 | 6 | 5 | 61 | 2 | 3 | 4 | 3 | 93 | 2 | 6 | 4 | 4 |
| 30 | 4 | 3 | 3 | 5 | 62 | 2 | 2 | 4 | 5 | 94 | 3 | 2 | 2 | 2 |
| 31 | 1 | 4 | 4 | 5 | 63 | 5 | 1 | 6 | 3 | 95 | 9 | 2 | 2 | 6 |
| 32 | 4 | 6 | 4 | 3 | 64 | 5 | 5 | 3 | 4 | 96 | 5 | 6 | 2 | 3 |
References
- Pitard, F.F. Pierre Gy’s Sampling Theory and Sampling Practice. In Heterogeneity, Sampling Correctness, and Statistical Process Control, 2nd ed.; CRC Press: Boca Raton, FL, USA, 1993. [Google Scholar]
- Gy, P.M. L’echantillonnage des Lots de Matiere en Vue de Leur Analyse; Masson: Paris, France, 1996. [Google Scholar]
- Gy, P.M. Sampling of discrete materials: II, Quantitative approach—Sampling of zero-dimensional objects. Chemom. Intell. Lab. Syst. 2004, 74, 25–38. [Google Scholar]
- Gy, P.M. Sampling of discrete materials—A new introduction to the theory of sampling: I, Qualitative approach. Chemom. Intell. Lab. Syst. 2004, 74, 7–24. [Google Scholar] [CrossRef]
- Gy, P.M. Sampling of Particulate Materials: Theory and Practice; Elsevier: Amsterdam, The Netherlands, 1982; p. 431. [Google Scholar]
- Ottino, J.M.; Shinbrot, T. Comparing extremes: Mixing of fluids, mixing of solids. In Mixing: Chaos and Turbulence; NATO Science Series; Chate, H., Villermaux, E., Chomaz, J.-M., Eds.; Kluwer Academic Publisher: New York, NY, USA; Plenum: New York, NY, USA, 1999; pp. 86–163. [Google Scholar]
- Devriendt, L.; Gatumel, C.; Berthiaux, H. Experimental evidence of mixture segregation by particle size distribution. Particluate Sci. Technol. 2013, 31, 653–657. [Google Scholar] [CrossRef]
- Akiyama, A.; Aoki, K.M.; Yamamoto, K.; Yoshikawa, T. Experimental study on vibration-induced convection and heaping in granular beds. Granul. Matter 1998, 1, 15–20. [Google Scholar] [CrossRef]
- Engblom, N.; Saxen, H.; Zevenhoven, R.; Nylander, H.; Enstad, G.G. Segregation of powder mixtures at filling and complete discharge of silos. Powder Technol. 2012, 215–216, 104–116. [Google Scholar] [CrossRef]
- Ottino, J.M.; Khakhar, D.V. Fundamental research in heaping, mixing and segregation of granular materials: Challenges and perspectives. Powder Technol. 2001, 121, 117–122. [Google Scholar] [CrossRef] [Green Version]
- Rahman, M.; Shinohara, K.; Zhu, H.P.; Yu, A.B.; Zulli, P. Size segregation mechanism of binary mixture in forming a conical pile. Chem. Eng. Sci. 2011, 66, 6089–6098. [Google Scholar] [CrossRef]
- Ottino, J.M.; Khakhar, D.V. Mixing and segregation of granular materials. Annu. Rev. Fluid Mech. 2000, 32, 55–91. [Google Scholar] [CrossRef] [Green Version]
- Sona, M.; Dube, J.-S. Sampling particulate matter for analysis-Controlling uncertainty and bias using the theory of sampling. Anal. Chim. Acta 2021, 1185, 338982. [Google Scholar] [CrossRef] [PubMed]
- Minkkinen, P.O.; Esbensen, K.H. Grab vs. composite sampling of particulate materials with significant spatial heterogeneity—A simulation study of “correct sampling erros”. Anal. Chim. Acta 2009, 653, 59–70. [Google Scholar] [CrossRef] [PubMed]
- Karababa, E. Physical properties of popcorn kernels. J. Food Eng. 2006, 72, 100–107. [Google Scholar] [CrossRef]
- Petersen, L.; Dahl, C.K.; Esbensen, K.H. Representative mass reduction in sampling—A critical survey of techniques and hardware. In Special Issue: 50 Years of Pierre Gy’s Theory of Sampling, Proceedings of the First World Confernce on Sampling and Blending (WCSB1), Esbjerg, Denmark, 28 November 2004; Elsevier B.V.: Amsterdam, The Netherlands.
- Rawle, A. Representative sampling—Another Cinderella of particle size analysis. In Proceedings of the 7th World Congress on Particle Technology, New Paradigm of Particle Science and Technology (WCPT7), Bejing, China, 19–22 May 2014; Elsevier: Amsterdam, The Netherlands, 2015. [Google Scholar]
- Fischer, H. A History of the Central Limit Theorem From Classical to Modern Probability Theory; Katholische Universität Eichstätt-Ingolstadt Mathematisch-Geographische Fakultät D-85072; Katholische Universität Eichstätt-Ingolstadt: Eichstätt, Germany, 2011. [Google Scholar]
- Esbensen, K.H. The Theory and Practice of Sampling; IM Publications Open LLP 2020: Chichester, West Sussex, UK, 2020. [Google Scholar]
- Minkkinen, P.O.; Esbensen, K.H. Sampling of particulate materials with significant spatial heterogeneity—Theoretical modification of grouping and segregation factors involved with correct sampling errors: Fundamental Sampling Error and Grouping and Segregation Error. Anal. Chim. Acta 2019, 1049, 47–64. [Google Scholar] [CrossRef] [PubMed]
Figure 1.
Particulate materials before mixing, showing (a) a corn grain lot with 100 blue-coloured rice, steel balls, lead balls and tungsten carbide fragments, (b) a rice grain lot with 160 blue-coloured rice, steel balls, lead balls and tungsten carbide fragments, and (c) a dolomite sand lot with 120 black glass beads, 120 steel balls, 120 lead balls and 120 tungsten carbide chips.

Figure 2.
Top panel shows scoops with materials: (a) 250 mL scoop with popcorn mielies, (b) 125 mL scoop with rice, and (c) dolomite sand with 15 mL scoop. Middle panel shows (d) steel balls, 2.6 mm dia., (e) lead balls, 1.5–2.0 mm dia., and (f) tungsten carbide chips, 3–4 mm dia. Lower panel shows (g) 20 vane riffle splitter and (h) 16 vane desktop riffle splitter.


Figure 3.
Histograms of the distribution for blue corn, steel balls, lead shot and tungsten carbide grains sampled from a yellow corn lot using a 250 mL scoop (upper panel) and a 20-vane riffle splitter (lower panel).
Figure 3.
Histograms of the distribution for blue corn, steel balls, lead shot and tungsten carbide grains sampled from a yellow corn lot using a 250 mL scoop (upper panel) and a 20-vane riffle splitter (lower panel).

Figure 4.
Precision (CV%) as a measure of sampling efficiency in the corn grain lot using a 250 mL scoop (red points and line) and incremental sampling (blue points and line) versus density of blue corn, steel balls, lead balls and tungsten carbide chips.
Figure 4.
Precision (CV%) as a measure of sampling efficiency in the corn grain lot using a 250 mL scoop (red points and line) and incremental sampling (blue points and line) versus density of blue corn, steel balls, lead balls and tungsten carbide chips.

Figure 5.
Histograms of the distribution for blue rice, steel balls, lead shot and tungsten carbide grains sampled from a white rice lot using a 125 mL scoop (upper panel) and a 20 vane riffle splitter (lower panel).
Figure 5.
Histograms of the distribution for blue rice, steel balls, lead shot and tungsten carbide grains sampled from a white rice lot using a 125 mL scoop (upper panel) and a 20 vane riffle splitter (lower panel).

Figure 6.
Precision as a measure of sampling efficiency versus density of blue rice, steel balls, lead balls and tungsten carbide chips in a rice grain lot for scooping and splitting; differences in precision for steel, lead and tungsten carbide are due to the GSE.
Figure 6.
Precision as a measure of sampling efficiency versus density of blue rice, steel balls, lead balls and tungsten carbide chips in a rice grain lot for scooping and splitting; differences in precision for steel, lead and tungsten carbide are due to the GSE.

Figure 7.
Histograms of the distribution for glass beads, steel balls, lead shot and tungsten carbide grains sampled from a dolomite sand lot using a 15 mL scoop (upper panel) and a 16-vane laboratory scale riffle splitter (lower panel).
Figure 7.
Histograms of the distribution for glass beads, steel balls, lead shot and tungsten carbide grains sampled from a dolomite sand lot using a 15 mL scoop (upper panel) and a 16-vane laboratory scale riffle splitter (lower panel).

Figure 8.
Precision as a measure of sampling efficiency versus density of black glass beads, steel balls, lead balls and tungsten carbide chips in dolomite sand; differences in precision for steel, lead and tungsten carbide are due to the GSE.
Figure 8.
Precision as a measure of sampling efficiency versus density of black glass beads, steel balls, lead balls and tungsten carbide chips in dolomite sand; differences in precision for steel, lead and tungsten carbide are due to the GSE.

Figure 9.
Changes in sampling precision for corn, rice, and dolomite sand with increasing density of the target analytes.
Figure 9.
Changes in sampling precision for corn, rice, and dolomite sand with increasing density of the target analytes.

Table 1.
Characteristics of the corn, rice, and dolomite sand lots used in the experiments.
| Detail | Corn | Rice | Crushed Dolomite |
|---|---|---|---|
| Mass of lot (g) | 7712 | 3151 | 612 |
| Number of grains in lot | 38,560 | 160,450 | ~304,000 |
| Density (g/cm3) | 1.304 | 1.45 | 2.5 |
| Approximate mass of a single grain (g) | 0.20 | 0.01964 | 0.00237 |
| Grain size | 5 mm wide, 10 mm long | 2 mm wide, 5 mm long | 1000 μm dia. |
| Scoop size (mL) | 250 | 125 | 15 |
| Number of scoops | 32 | 32 | 32 |
| Number of grains per scoop | 1205 | 5014 | 9500 |
| Mass of grains per scoop (g) | 241 | 98 | 19 |
| Number of coloured grains, concentration and density (g/cm3) | 100; 0.26%; 1.304 | 160; 0.10%; 1.45 | 120; 0.04%; 2.5 |
| Number of steel balls, concentration and density (g/cm3) | 100; 0.26%, 4.5 | 160; 0.10%, 4.5 | 120; 0.04%; 4.5 |
| Number of lead balls, concentration and density (g/cm3) | 100; 0.26% | 160; 0.10% | 120; 0.04% |
| Number of tungsten carbide grains concentration and density (g/cm3) | 100; 0.26% | 160; 0.10% | 120; 0.04% |
| Number of grains per scoop to reflect true lot grade | 3.125 | 5 | 3.75 |
| Shape and habit | Hard elongated pale-orange grains with very little cohesion and large interstices between grains. | Brittle elongated white grains with minor cohesion and small interstices between grains. | Angular dolomite grains with fairly strong cohesion and very small interstices between grains. |
Publisher’s Note: MDPI stays neutral with regard to jurisdictional claims in published maps and institutional affiliations. |
© 2022 by the author. Licensee MDPI, Basel, Switzerland. This article is an open access article distributed under the terms and conditions of the Creative Commons Attribution (CC BY) license (https://creativecommons.org/licenses/by/4.0/).
Share and Cite
MDPI and ACS Style
Minnitt, R. The Grouping and Segregation Error in the Rice Experiment. Minerals 2022, 12, 335. https://0-doi-org.brum.beds.ac.uk/10.3390/min12030335
AMA Style
Minnitt R. The Grouping and Segregation Error in the Rice Experiment. Minerals. 2022; 12(3):335. https://0-doi-org.brum.beds.ac.uk/10.3390/min12030335
Chicago/Turabian StyleMinnitt, Richard. 2022. "The Grouping and Segregation Error in the Rice Experiment" Minerals 12, no. 3: 335. https://0-doi-org.brum.beds.ac.uk/10.3390/min12030335
Note that from the first issue of 2016, this journal uses article numbers instead of page numbers. See further details here.