Article

Natural Radionuclide Levels and Radiological Hazards of Khour Abalea Mineralized Pegmatites, Southeastern Desert, Egypt

1
Nuclear Materials Authority, El Maadi, Cairo P.O. Box 530, Egypt
2
Department of Geology, Faculty of Science, Al-Azhar University, Cairo P.O. Box 11884, Egypt
3
Department of Physics, Taibah University, Almadinah Al-Munawarah 42353, Saudi Arabia
4
Department of Physics, Faculty of Science, Isra University, Amman 11622, Jordan
5
Department of Nuclear Medicine Research, Institute for Research and Medical Consultations (IRMC), Imam Abdulrahman Bin Faisal University (IAU), P.O. Box 1982, Dammam 31441, Saudi Arabia
6
Department of Physics, College of Science, Princess Nourah Bint Abdulrahman University, P.O. Box 84428, Riyadh 11671, Saudi Arabia
7
Institute of Physics and Technology, Ural Federal University, St. Mira, 19, 620002 Yekaterinburg, Russia
*
Authors to whom correspondence should be addressed.
Submission received: 13 February 2022 / Revised: 2 March 2022 / Accepted: 9 March 2022 / Published: 15 March 2022
(This article belongs to the Special Issue Radionuclides and Radiation Exposure in Mine Sites)

Abstract

:
Arranged from oldest to youngest, the main granitic rock units exposed in Khour Abalea are metagabbros, cataclastic rocks, ophiolitic melange, granitic rocks, pegmatite and lamprophyre dykes. The presence of radioactivity associated with the heavy bearing minerals in construction materials—like granite—increased interest in the extraction process. As it turns out, granitic rocks play an important economic part in the examination of an area’s surroundings. The radionuclide content is measured by using an NaI (Tl)-detector. In the mineralized pegmatites, U (326 to 2667 ppm), Th (562 to 4010 ppm), RaeU (495 to 1544 ppm) and K (1.38 to 9.12%) ranged considerably with an average of 1700 ppm, 2881.86 ppm, 1171.82 ppm and 5.04%, respectively. Relationships among radioelements clarify that radioactive mineralization in the studied pegmatites is magmatic and hydrothermal. A positive equilibrium condition confirms uranium addition to the studied rocks. This study determined 226Ra, 232Th and 40K activity concentrations in pegmatites samples and assessed the radiological risks associated with these rocks. The activity concentrations of 226Ra (13,176 ± 4394 Bq kg−1), 232Th (11,883 ± 5644 Bq kg−1) and 40K (1573 ± 607 Bq kg−1) in pegmatites samples (P) are greater than the global average. The high activity of the mineralized pegmatite is mainly attributed to the presence of uranium mineral (autunite), uranophane, kasolite and carnotite, thorium minerals (thorite, thorianite and uranothorite) as well as accessories minerals—such as zircon and monazite. To assess the dangerous effects of pegmatites in the studied area, various radiological hazard factors (external, internal hazard indices, radium equivalent activity and annual effective dose) are estimated. The investigated samples almost surpassed the recommended allowable thresholds for all of the environmental factors.

1. Introduction

Human exposure to ionizing radiation has piqued the public’s interest. After all, natural-source radiation accounts for most of the human population’s overall radiation exposure [1]. Natural uranium and thorium can be detected in different proportions in all terrestrial materials, depending on the geology of each area [2,3,4].
The radiological hazard associated with exposure to building materials has received much attention in recent years [5]. Terrestrial radionuclides and their decay products donate to the background radiation value in the environment. The mineral, geochemical and physicochemical factors recreate a role in their environment [5,6].
In addition, the public’s radiological influence is a major subject of radioecological research [7,8]. Indeed, many previous investigations have been conducted to report the radiation risk; they found that building materials account for much of the annual dosage of natural radioactivity [7,9,10]. Conducting a radiological effect evaluation for building materials to assess and manage the impact of radioactive chains on the environment is a complicated undertaking. That is because any evaluation must adhere to the requirements of sustainable development. Moreover, the effects of radiation should be evaluated utilizing quantifiable values, which can also be used as input factors when depicting environmental transmission and estimating radiation dose [11,12]. Because people nowadays spend 80% of their time indoors on average, it is critical to determine how much radiation is emitted by the building materials. One can assess the possible radiological threats to people who reside in houses made of these materials by knowing the natural radionuclides concentrations in construction materials [13]. The Khour Abalea area is located in Egypt’s Eastern Desert, and it is bounded by the Nugrus thrust fault, a prominent shear zone. The shear zone divides the Ghadir block’s ophiolitic and low-grade volcanic complexes to the northeast from high-temperature metamorphic rocks from the Hafafit complex in the southwest [14]. Khour Abalea is considered an unusual case of mineralization that includes economically important rare metals [15]. Inhabited in cataclastic rocks, the pluton core is characterized from the NW orientation by porphyritic biotite granites, distorted biotite granites and two mica granites. In addition, muscovite granites formed the SE half of the pluton [16]. Pegmatites have become more essentially a source of several significant minor and trace elements utilized in modern technology, such as lithium, scandium, cesium, tantalum, niobium, tin and rare earth elements. They also contain quartz, mica, feldspar and a plethora of highly valuable and colourful gem minerals [17,18]. Pegmatites in the Khour Abalea area are categorised into mineralised pegmatites parallel to the foliation (NNW-SSE and dip 10–30 due WSW) and emplaced barren pegmatites (NE-SW and dip nearly vertical) which cut the cataclastic rocks. Except for quartzites, in cataclastic rocks, mineralized pegmatites are intermittent and scattered, ranging in width from 20 cm to 50 cm. They occasionally feature boudins structure, which is found primarily in tectonic zones [19]. Using pegmatite samples collected from Khour Abalea area, this study examined the natural radionuclides distribution and assessed the radiation hazard indices.

2. Materials and Methods

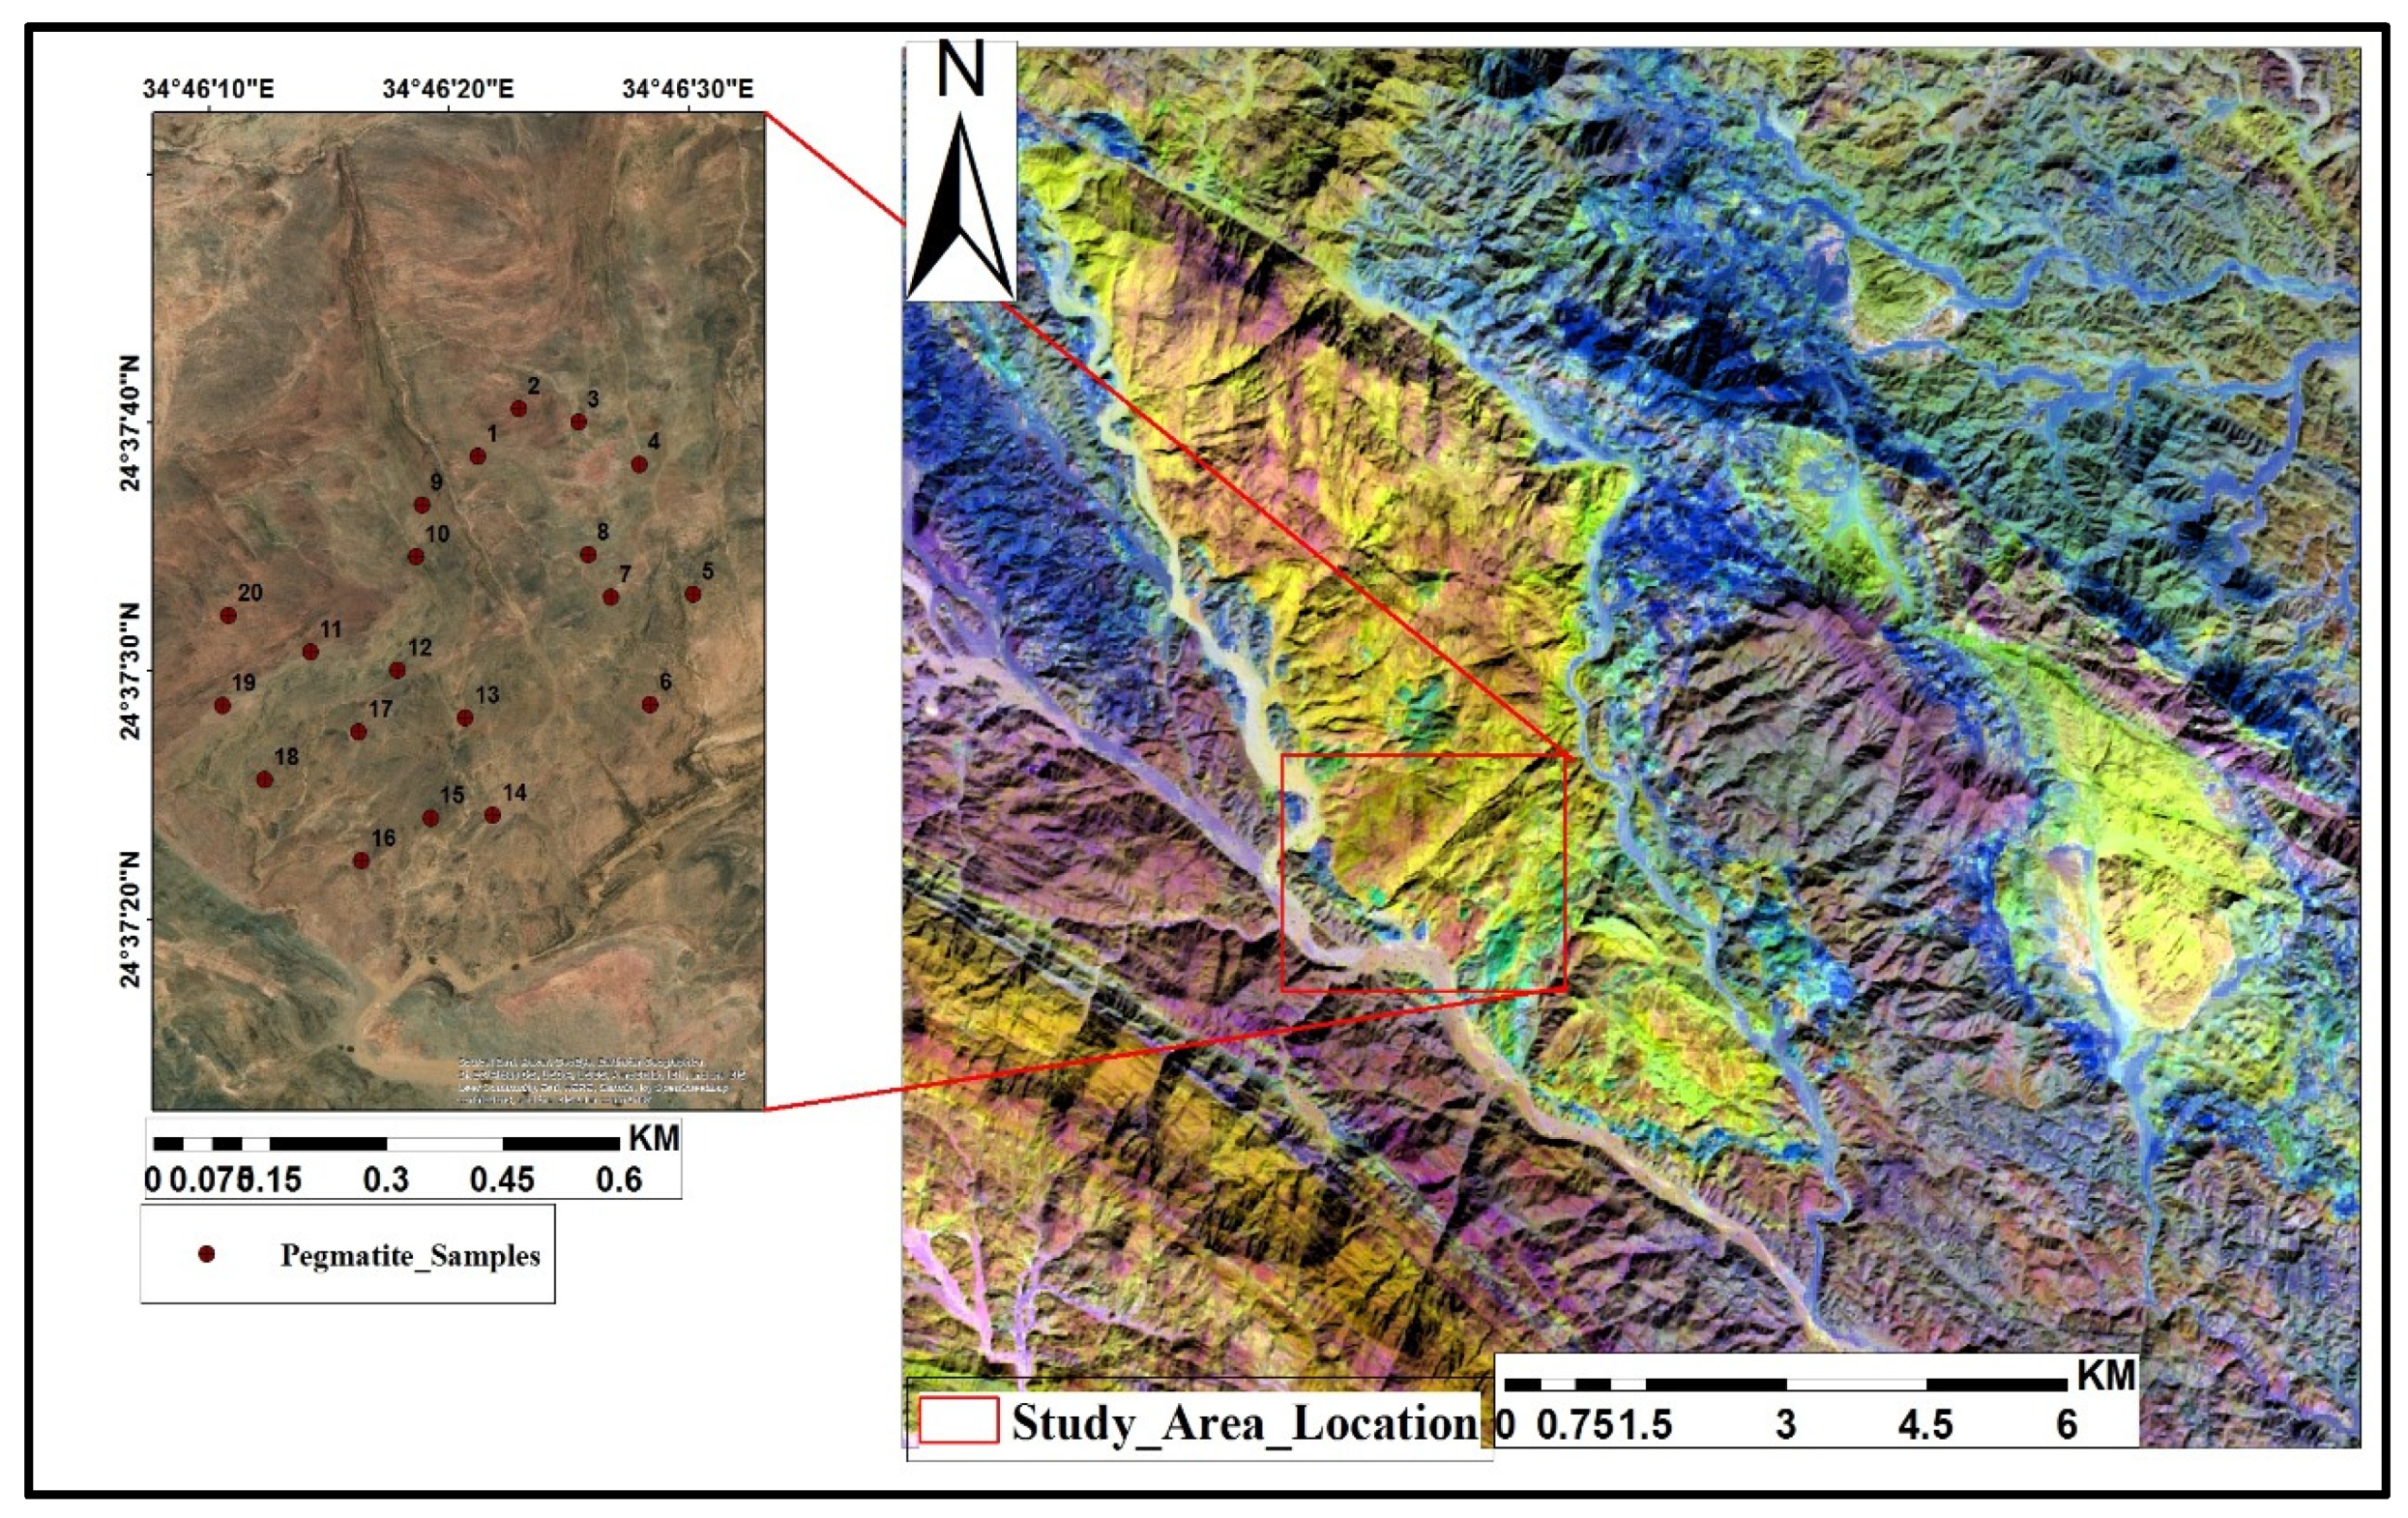
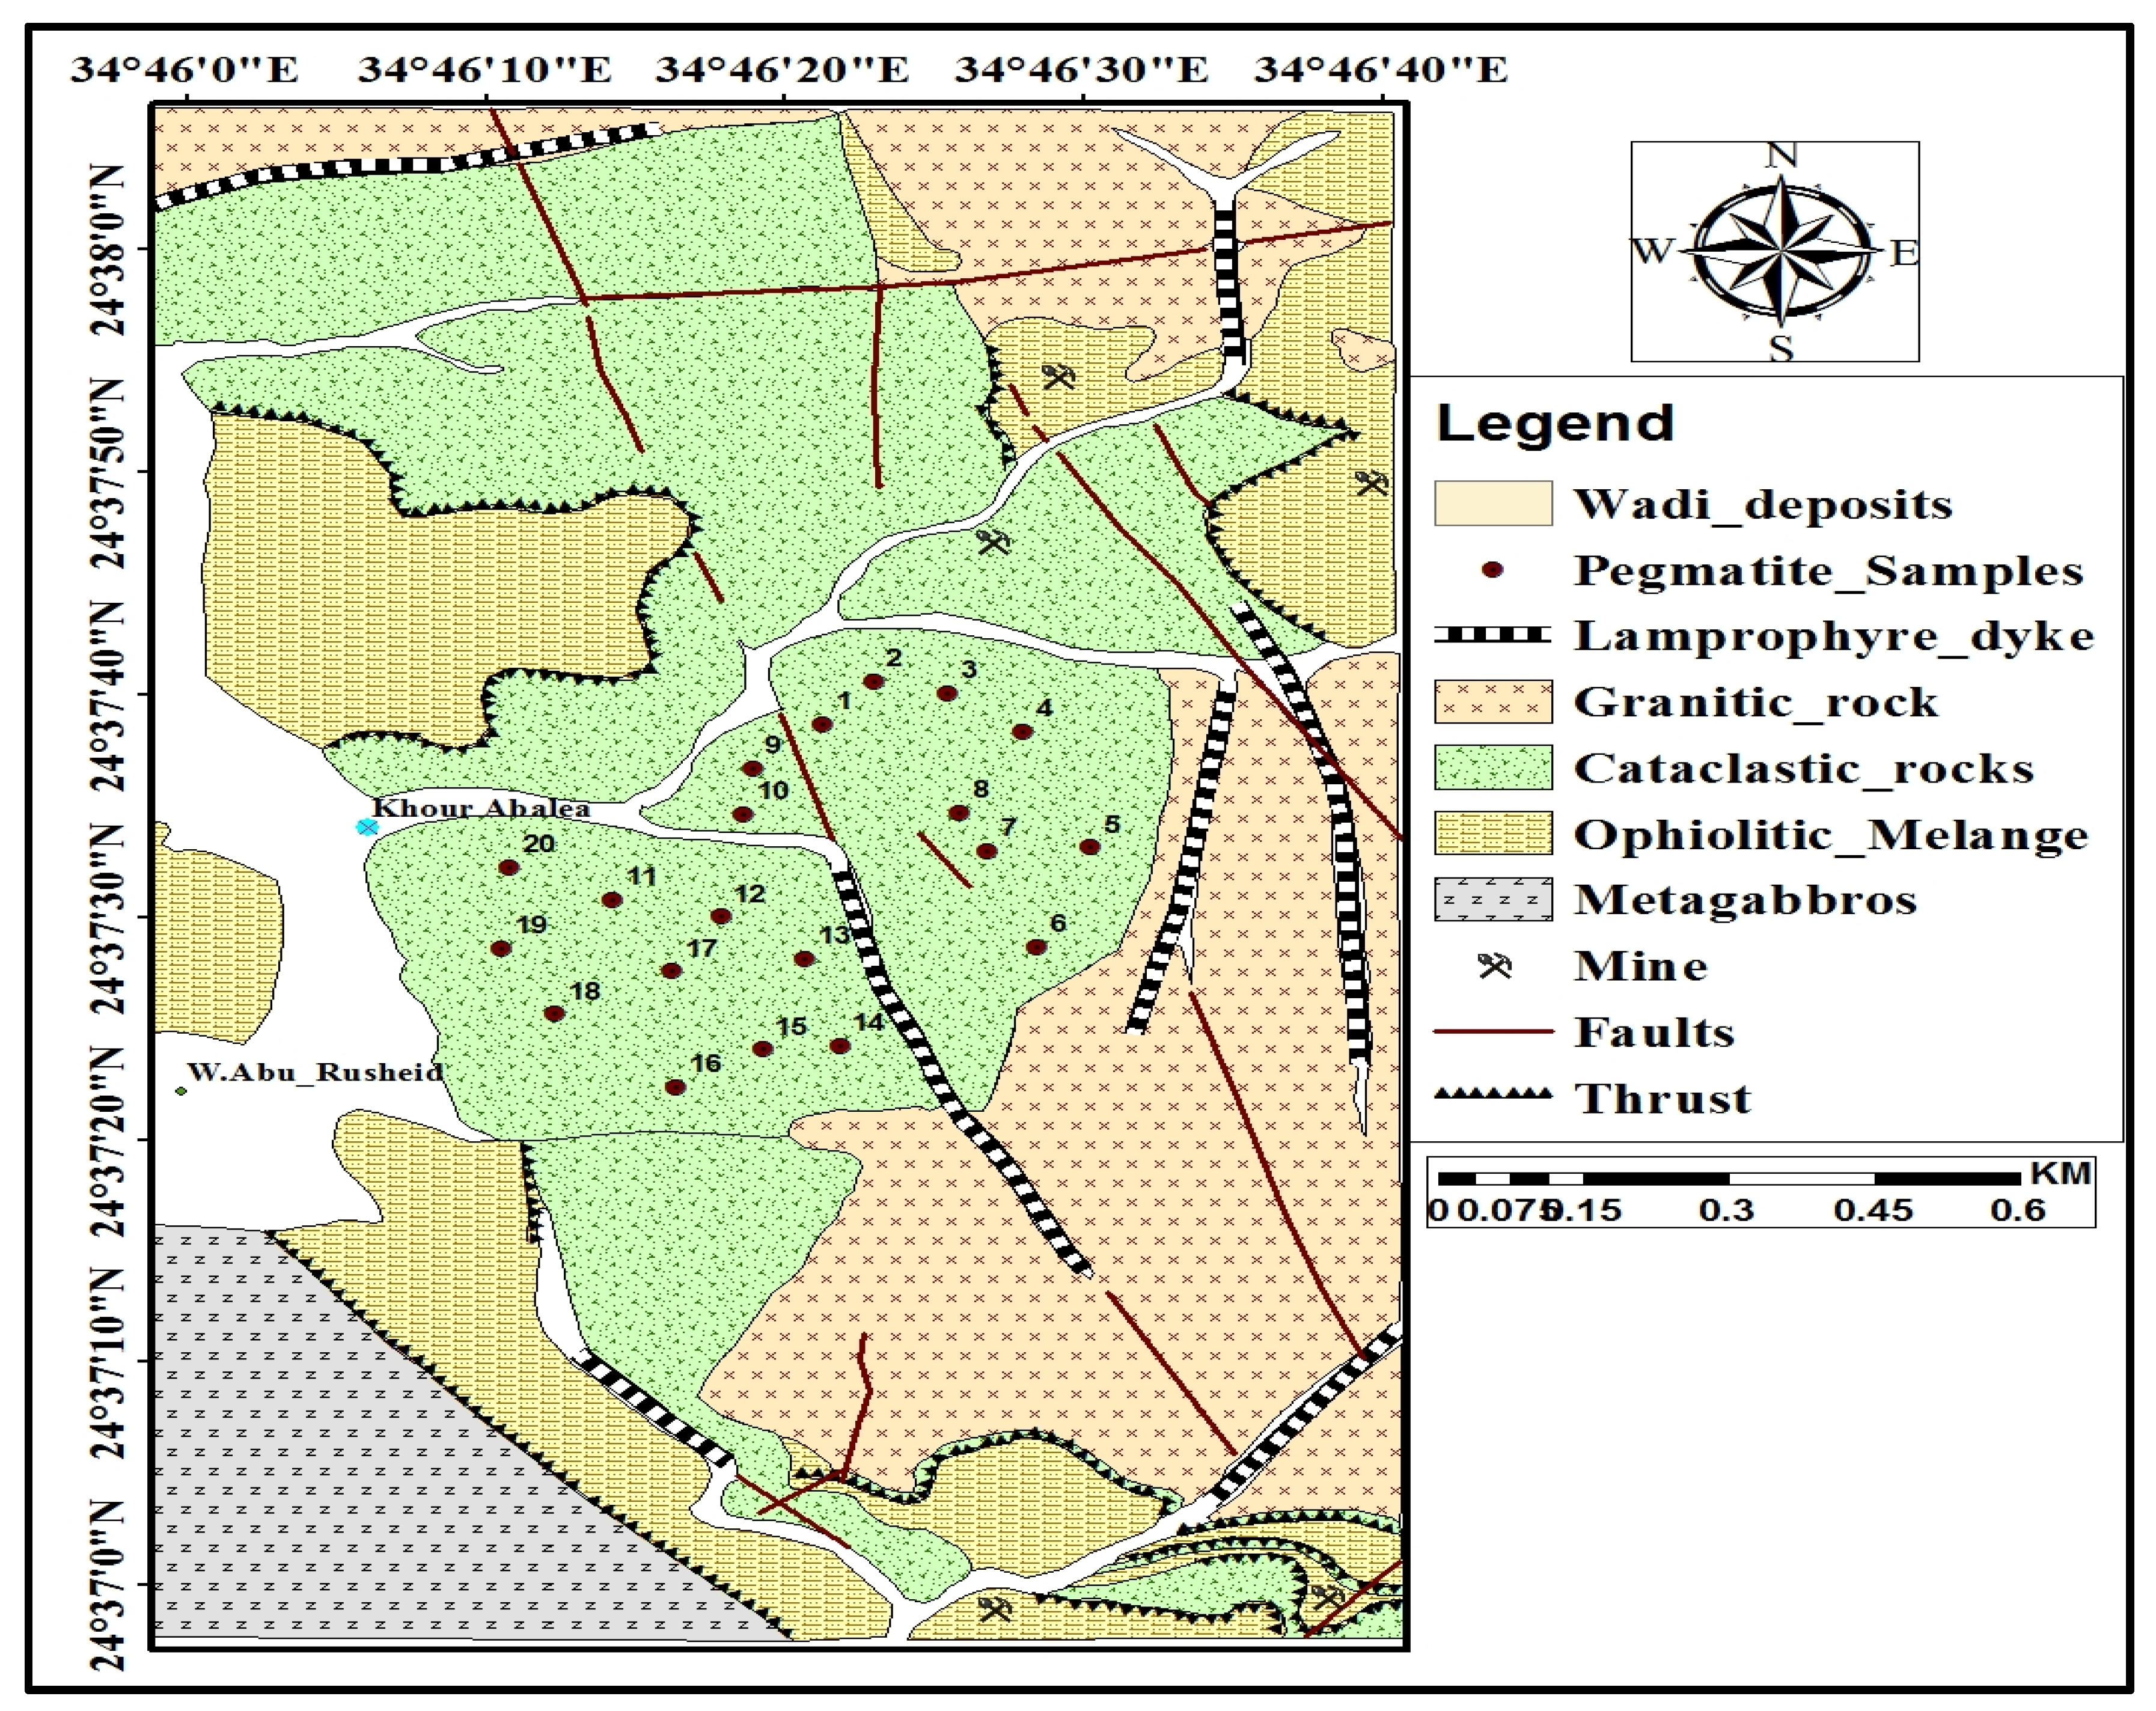
2.1. Geological Setting

Khour Abalea is located near the lower portions of Wadi Abu Rusheid in Egypt’s Eastern Desert. It is about 95 km southwest of Marsa Alam City on the Red Sea shore, passing via Wadi Al Gemal and then Wadi Nugrus (See Figure 1).
An old mineral zone rich in emeralds surrounds this region. It is also accessible by a new asphaltic road that runs between Idfu Marsa Alam Road and Sheikh Shadli further south, between latitudes 24°37′0″ and 24°38′0″ N and longitudes 34°46′0″ and 34°46′40″ E (Figure 2). Khour Abalea’s primary rock formations called metagabbros, ophiolitic melange, cataclastic rocks, granitic rocks, lamprophyre dykes and pegmatite are Precambrian rock that can be ordered chronologically from oldest to youngest. Granites of porphyritic biotite are followed by distorted biotite and two mica granites, and the Khour Abalea granitic pluton is extended in NW-SE direction (12 km—length) and photogenic in NE-SW direction (3 km—width) (abundant garnet and kyanite crystals).
The core of the granitic pluton is made up of cataclastic rocks from the Khour Abalea area. It is enormously sheared, wrapped and foliated (N-S) and is split by two non-parallel shear zones (NNW-SSE and E-W) patterns that span about 2 km2. The shear zones are 2–10 m wide and 400–1500 m long, with a vertical to inclined dip. Shear zones (NNW-SSE) displace E-W shear zones. Discontinuous and brecciated lamprophyre dikes intrude between the two shear zones.

2.2. Sampling and Preparation

Pegmatite samples were selected based on the separation process of the mineral portion. The samples were granulated, pulverized, subdivided and segregated to a size fraction of −60 to +120 meshes before being concentrated using a heavy liquids separation procedure with bromoform (specific gravity 2.85 gm/cm3). The magnetite was then separated using a hand magnet. The fractions of the heavy mineral were run through a Frantz Isodynamic Magnetic Separator (Model L-1) with a side tilt of 5° and a forward slope of 20° to segregate the residual magnetite and form multiple magnetic fractions at 0.2, 0.5, 0.7, 1 and 1.5 amperes. Binocular microscopes were used to identify minerals. They were then identified using EDX unit on an environmental scanning electron microscope (ESEM model Philips XL 30).
Twenty pegmatite samples were sent to the lab to be measured for radioactive concentration in order to assess the radiological risks. Each sample weighed about 250 g and was put in clearly labelled polythene bags before being delivered to Cairo’s Nuclear and Radiological Regulatory Authority’s Radiation Protection Laboratory (Cairo, Egypt) for analysis. The samples were air dried for 72 h at 25 °C at ambient temperature. The dry materials were pulverized, sieved (to a depth of 2000 m) and homogenized extensively. To avoid radon leakage, around 185 ± 10 g of the homogenized material was placed carefully into well-labelled plastic containers and properly sealed. The enclosed containers were held for 28 days to accomplish radioactive equilibrium between parents and their nuclide’s daughters.
A NaI (Tl) scintillation detector with a crystal that has a square shape with a length of 7.6 cm was applied to estimate the radioelements content (eRa, eTh and K%) in pegmatite samples in ppm. The measurements were identified by the activity concentration in Bq kg−1 by applying the conversion factors (11.1 Bq kg−1/1ppm, 4.04 Bq kg−1/ 1ppm and 313 Bq kg−1/% for the aforementioned radioelements respectively) [20]. The detector was set up in a shield in cylindrical lead form with: (diameter = 157 mm), (length = 205 mm) and (thickness = 37 mm) with an attenuation factor of 0.16 for 2.6 MeV γ-rays, to assure a low background measurement environment. A preamplifier and analyser were parts of the pulse analysis and information analysis equipment, which was connected to a software computer. The 226Ra, 232Th and 40K have gamma energies of 1.764 MeV (I = 15.30%) from 214Bi, 2.614 MeV (I = 99.754%) from 228Ac and 1.460 MeV (I = 10.66%) from 40K [21,22]. Certified reference materials (RGU-1, RGTh-1 and RGK-1) are employed and their densities after becoming pulverized concrete are comparable to those of the construction materials [23]. The vessel was designed such that the radioactivity in samples is dispersed uniformly. The samples are recorded to 2000 s, and the MDAs for 226Ra, 232Th and 40K are 2, 4 and 12 Bq kg−1, respectively. Through using the error propagation equation of systematic and random experimental error, the entire uncertainty of radiation data was estimated. The calibration efficiency has systematic inaccuracies of 0.5 to 2%, while the activity values have up to 5% random errors [24].

2.3. Radiological Hazards Assessment

2.3.1. Raeq

The Raeq is a radioactive variable that is widely employed to determine radiation threats to human health. To maintain the public’s annual effective dose under 1 mSv, Raeq values must be less than 370 Bq kg−1. The formula below can be used to estimate the Raeq [25]:
Ra eq = A ( 226 Ra ) + 1.43   A ( 232 Th ) + 0.077   A ( 40 K )
The value of annual effective dose of 370 Bq kg−1 can be achieved when the values of the 226Ra, 232Th and 40K activity concentrations will be 10, 7 and 130 Bq kg−1, respectively [26].

2.3.2. Dair and AED

The absorbed dose rate (Dair) is a radiometric factor performed to evaluate exposure to the released gamma rays from the radionuclides at distances greater than 1 m from the Earth’s surface. To estimate the Dair data we used:
D air = 0.430   A ( 226 Ra ) + 0.666   A ( 232 Th ) + 0.042   A ( 40 K )
As an outcome, the next Expression (3) was utilised to characterize the accumulated dosages for the public yearly (annual effective dose—AED in several options depending on the exposure is either outdoor or indoor [27,28]).
AEDout (mSv/y) = Dair × 0.2 × 8760 h × 0.7 Sv/Gy × 10−6
AEDin (mSv/y) = Dair × 0.8 × 8760 h × 0.7 Sv/Gy × 10−6

2.3.3. Hex and Hin Indices

To predict the effects of radiation from surface materials on human health, external and internal hazards (Hex and Hin) are employed. The following Equations (4) and (5) are utilised to compute the hazard index [29,30]:
H ex = A ( 226 Ra ) 370 + A ( 232 Th ) 259 + A ( 40 K ) 4810   1
H in = A ( 226 Ra ) 185 + A ( 232 Th ) 259 + A ( 40 K ) 4810   1
It’s not recommended that Hex and Hin’s principles be ahead of unity [31,32].

2.3.4. Annual Gonadal Dose Equivalent (AGDE)

The AGDE has been used to detect Dair by general organs, primarily the gonads, on a yearly basis. The AGDE values for 226Ra, 232Th, and 40K are determined based on the gamma radiation emitted [29]:
AGDE   ( μ Sv y 1 ) = 3.09 A ( 226 Ra ) + 4.18 A A ( 232 Th ) + 0.314 A ( 40 K )

2.3.5. Excess Lifetime Cancer (ELCR)

The carcinogenic effects of gamma ray-produced pegmatites can almost certainly be identified if occupants are exposed to them for an extended period of time, both outside and inside. As a result, the ELCR is calculated using the ICRP’s cancer risk parameter (RP = 0.05 Sv−1) and an outdoor annual effective dose (AEDout) over a lifetime (DL = 70 years) (namely international commission of radiation protection) [33].
ELCR =   AED   × DL   ×   RP

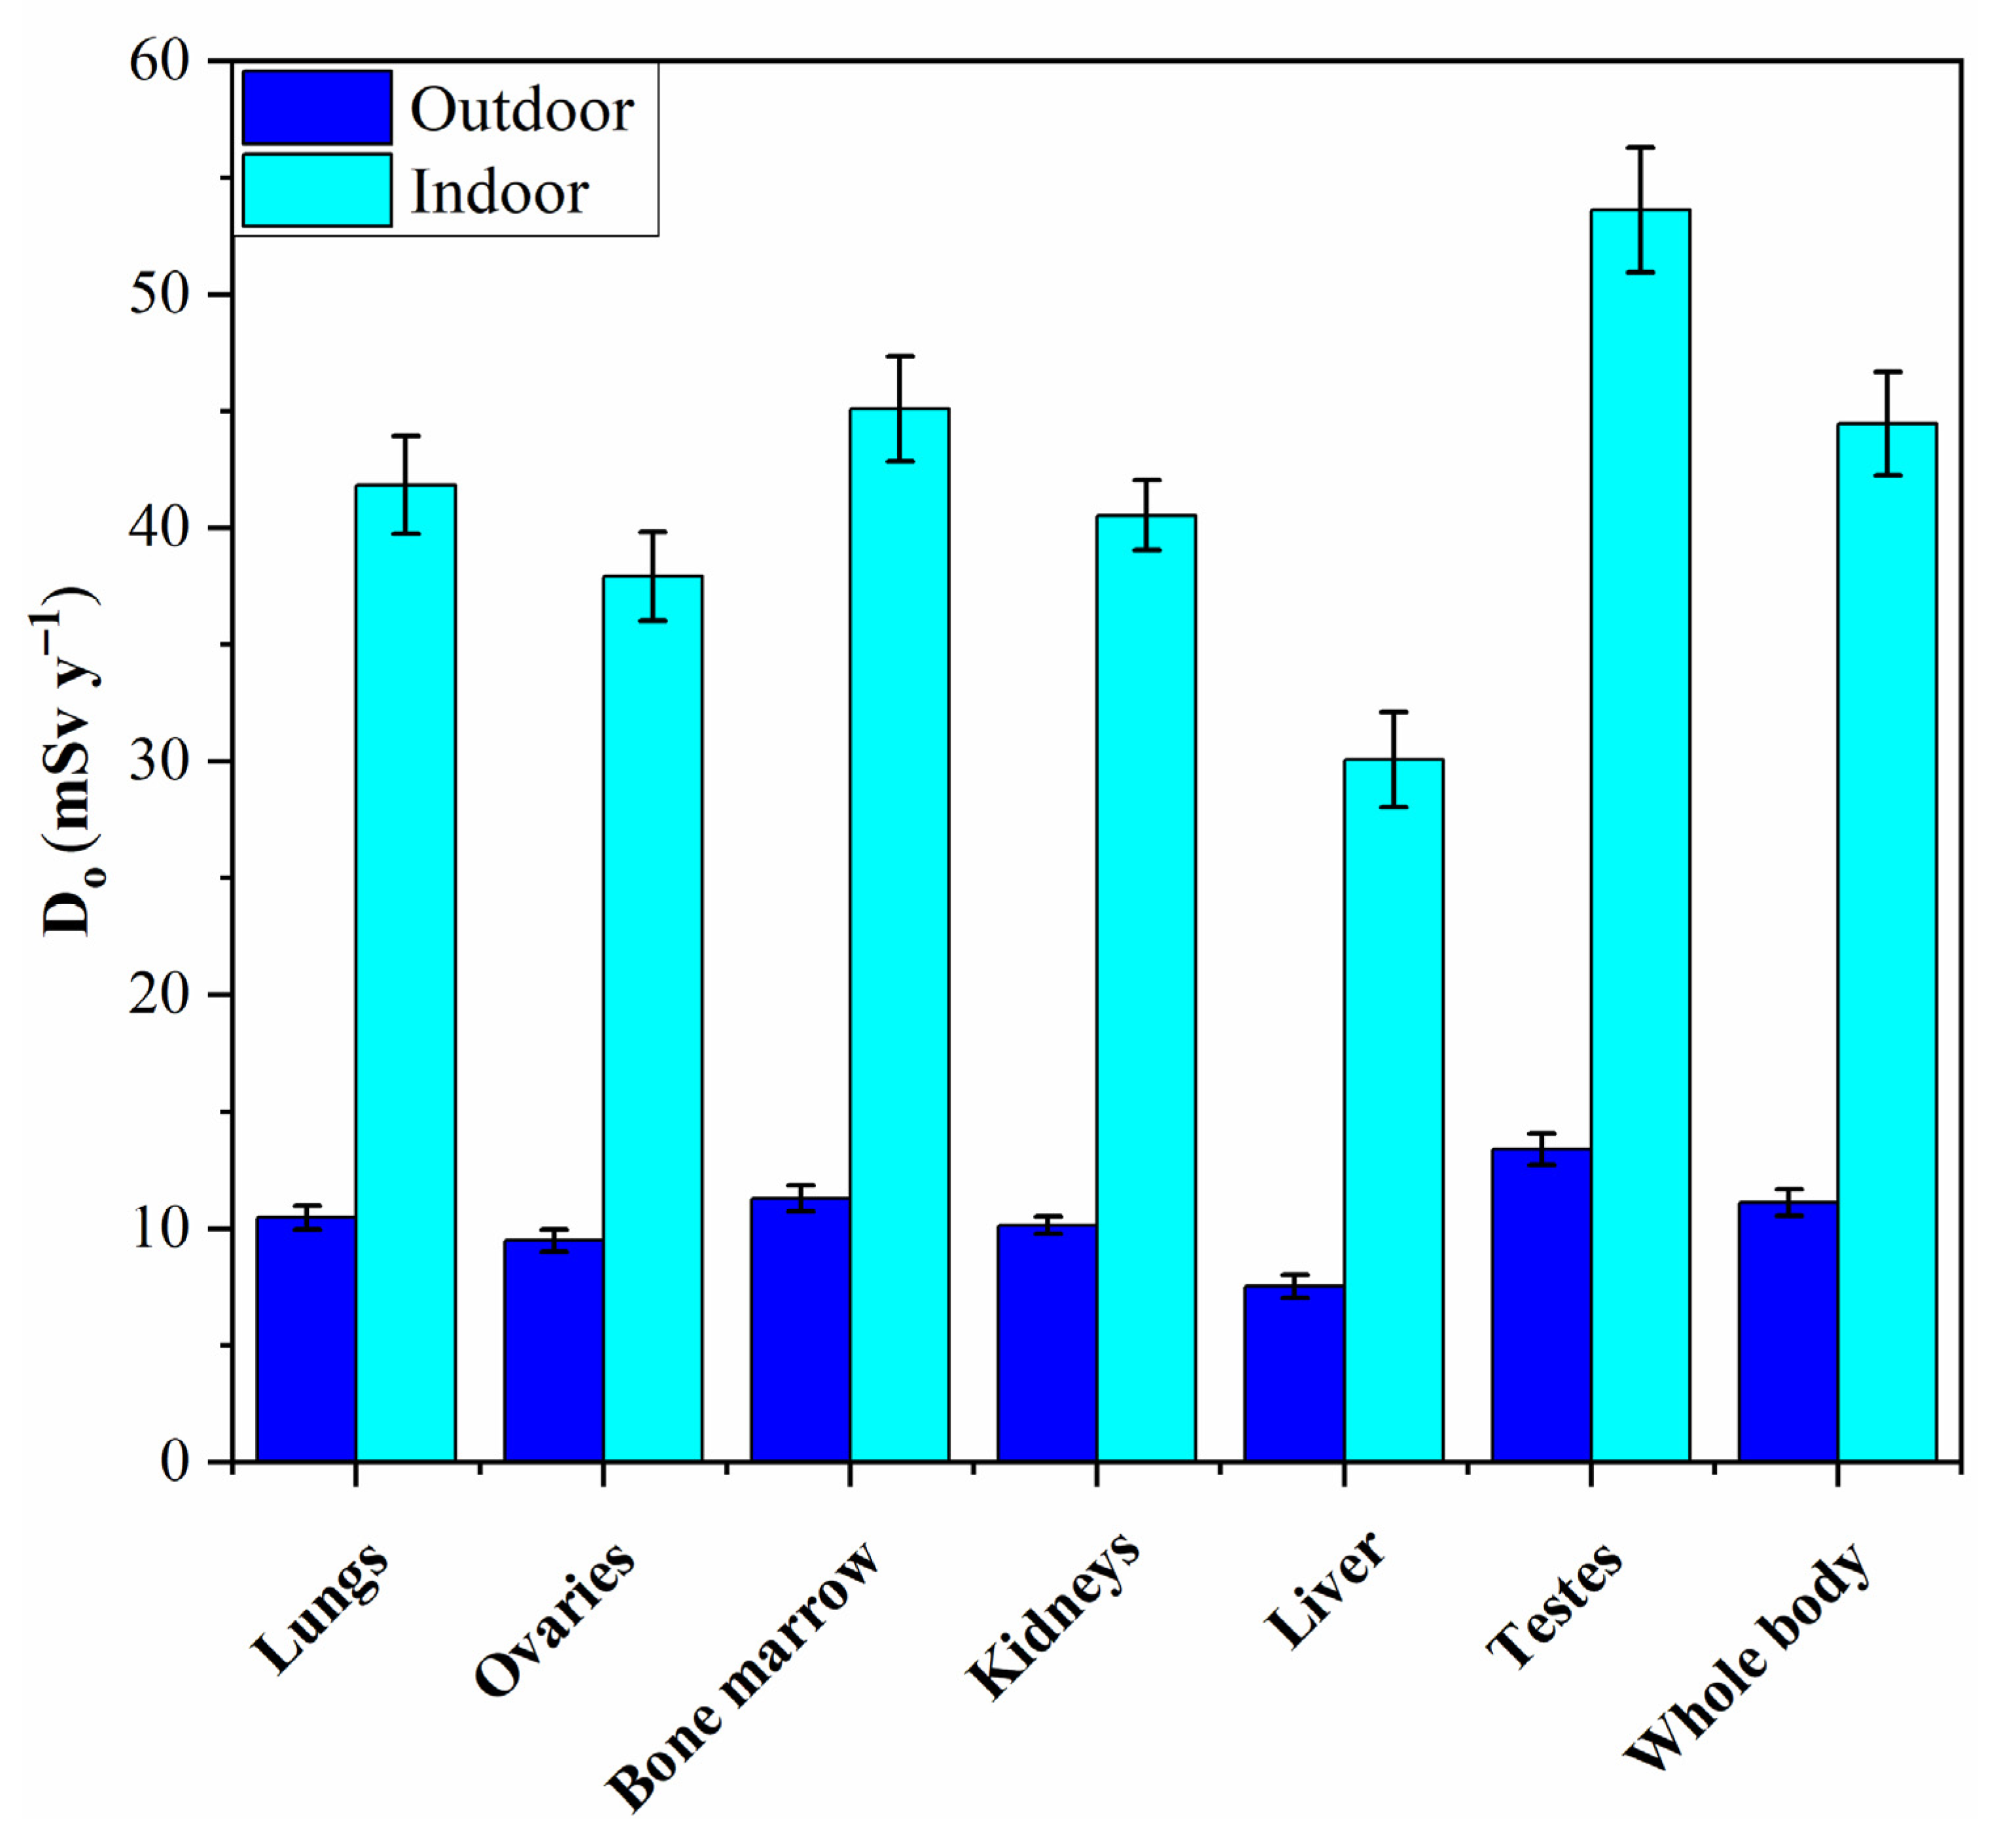
2.3.6. Effective Dose (Do) to Various Body Organs

The following formula is utilized to compute the effective dose rate furnished to a specific organ [34];
Do (mSvy−1) = AED × F
where AED is the annual effective dose with two exposure scenarios (outdoor and indoor), and F is the ingestion-to-organ dose conversion factor with values of 0.46, 0.58, 0.62, 0.64, 0.69, 0.82 and 0.68 for the Liver, Ovaries, Kidneys, Lungs, Bone Marrow, Testes and Whole Body, respectively, derived from the ICRP [35].

2.4. Multivariate Statistical Analysis (MSA)

These analyses are used to show and emphasize the relationship between radioactive variables, especially the impact of predicted radiological danger parameters on the distribution of radionuclide concentrations in pegmatites. The Varimax normalized technique was used to evaluate the data for PCA. PCA has the advantage of compressing data by reducing the number of dimensions while retaining as much information as feasible. EMB-SPSS Version 21.0 was used to analyse the data statistically.

3. Results and Discussion

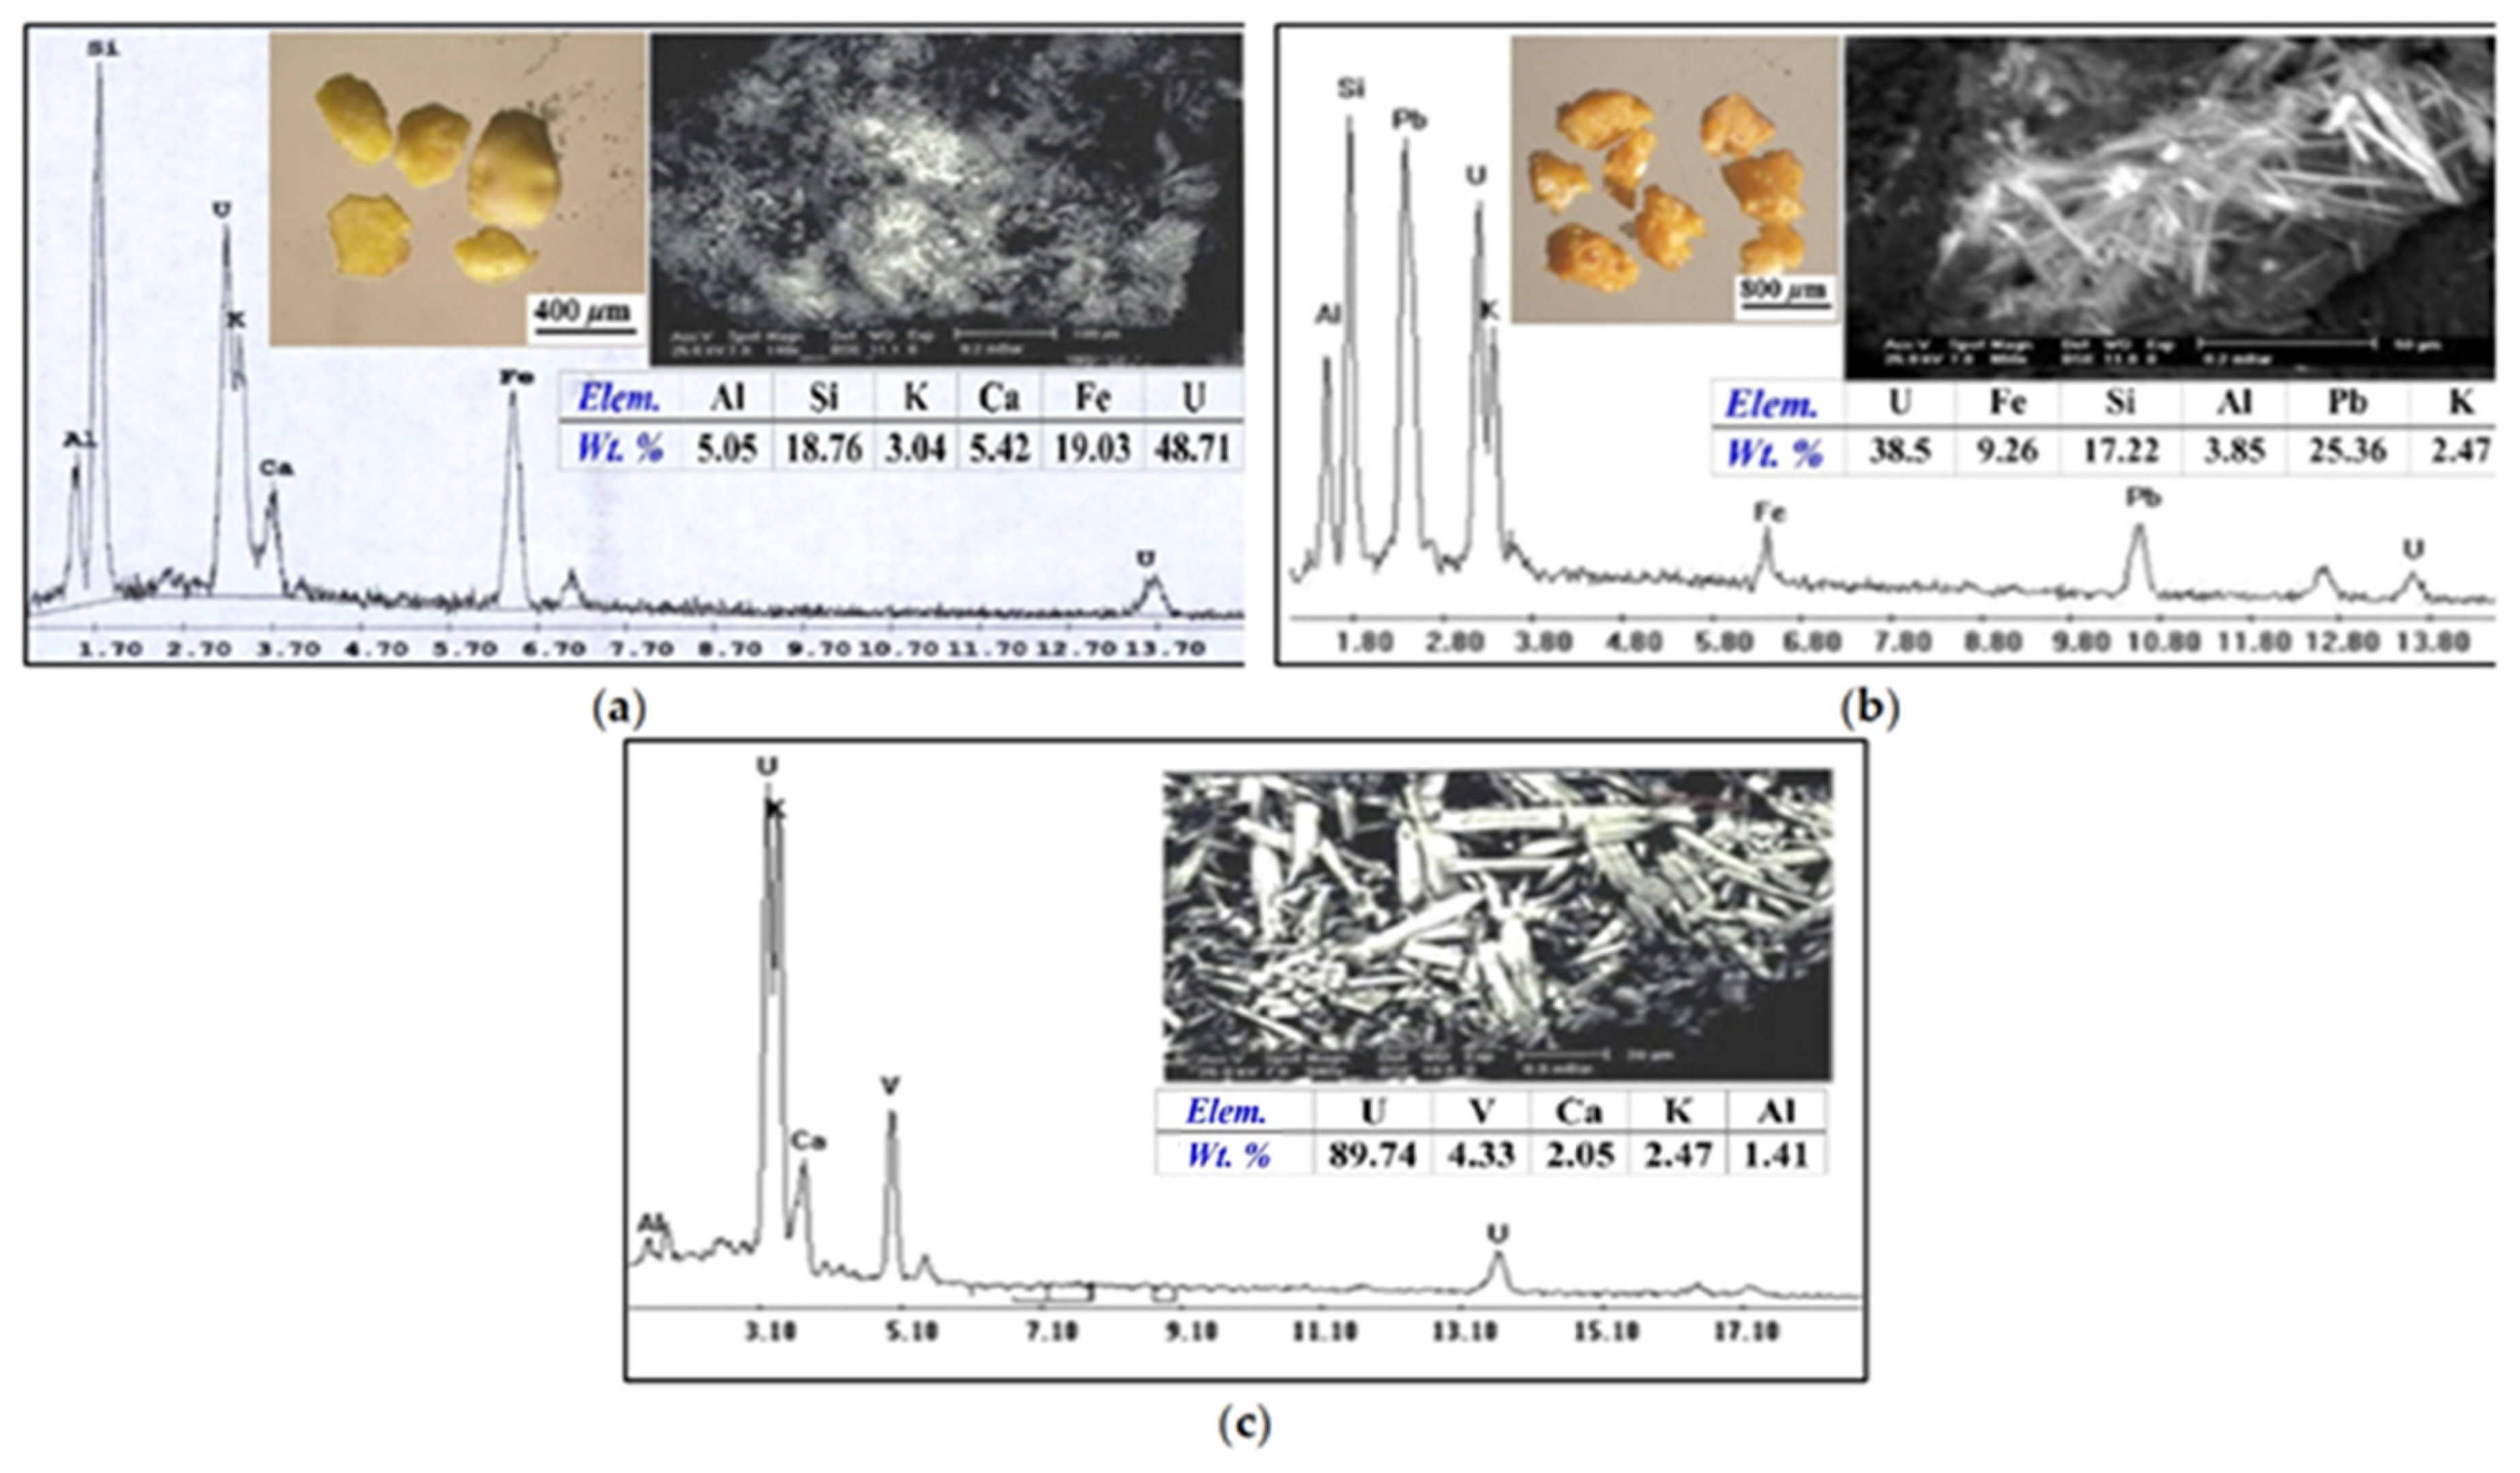
3.1. Mineral Analysis

The high activity of the mineralized pegmatite is at most attributed to the presence of uranium mineral (autunite), thorium minerals and accessories minerals such as monazite, zircon, xenotine, fluorite, samarskite and columbite [36]. In addition to the previously detected minerals, we recorded uranophane [Ca (UO2)2(SiO3OH)2.5H2O], kasolite and carnotite [K2 (UO2) (VO4)2.3H2O].

3.1.1. Uranophane

Uranophane is the most widespread calcium uranium silicate formed primarily in oxidation zones of uranium ore deposits and results from the oxidation-hydration weathering of uraninite in environments rich in Si4+ [Ca (UO2)2(SiO3OH)2.5H2O] [37]. Uranophane crystallizes in the monoclinic system with variable colours such as yellow, lemon yellow, canary yellow, straw yellow and orange–yellow and is transparent to translucent with vitreous to silky lustre. Hardness is 2–3 on the Moho’s scale. It is found mostly as fibrous radiating aggregates or felted coatings. Binocular microscope image, SEM analysis and back-scattered electron imaging (BSE) (Figure 3a) indicate that uranophane grains are mainly composed of U (86.80%), Si (3.26%) and Ca (6.53%) and K (2.45%).

3.1.2. Kasolite

Kasolite is the only identified uranyl silicate containing lead, together with the lead uranyl oxides (Pb (UO2) (SiO4).H2O). It is a secondary mineral that forms when meteoric water containing silica reacts with already created secondary uranium minerals. Kasolite is found as collected crystals with a lath-like to needle-like form, with iron oxide staining on occasion. Kasolite is characterized by monoclinic system, bright colours and a resinous or greasy lustre. This mineral is relatively harder when compared to other secondary uranium minerals; the hardness is 4–5 in the Moho’s scale. The SEM and BSE (Figure 3b) and the EDX analysis data of kasolite indicate the presence of U (38.5%), Fe (9.26%), Si (17.22%), Al (3.85%), Pb (25.36%) and K (2.47%).

3.1.3. Carnotite [K2 (UO2) (VO4)2.3H2O]

Carnotite occurs as rod and needle-like shape crystals (Figure 3c); the EDX analysis data of carnotite indicate the presence of U (89.74%), V (4.33%), Ca (2.05%) and K (2.47%).

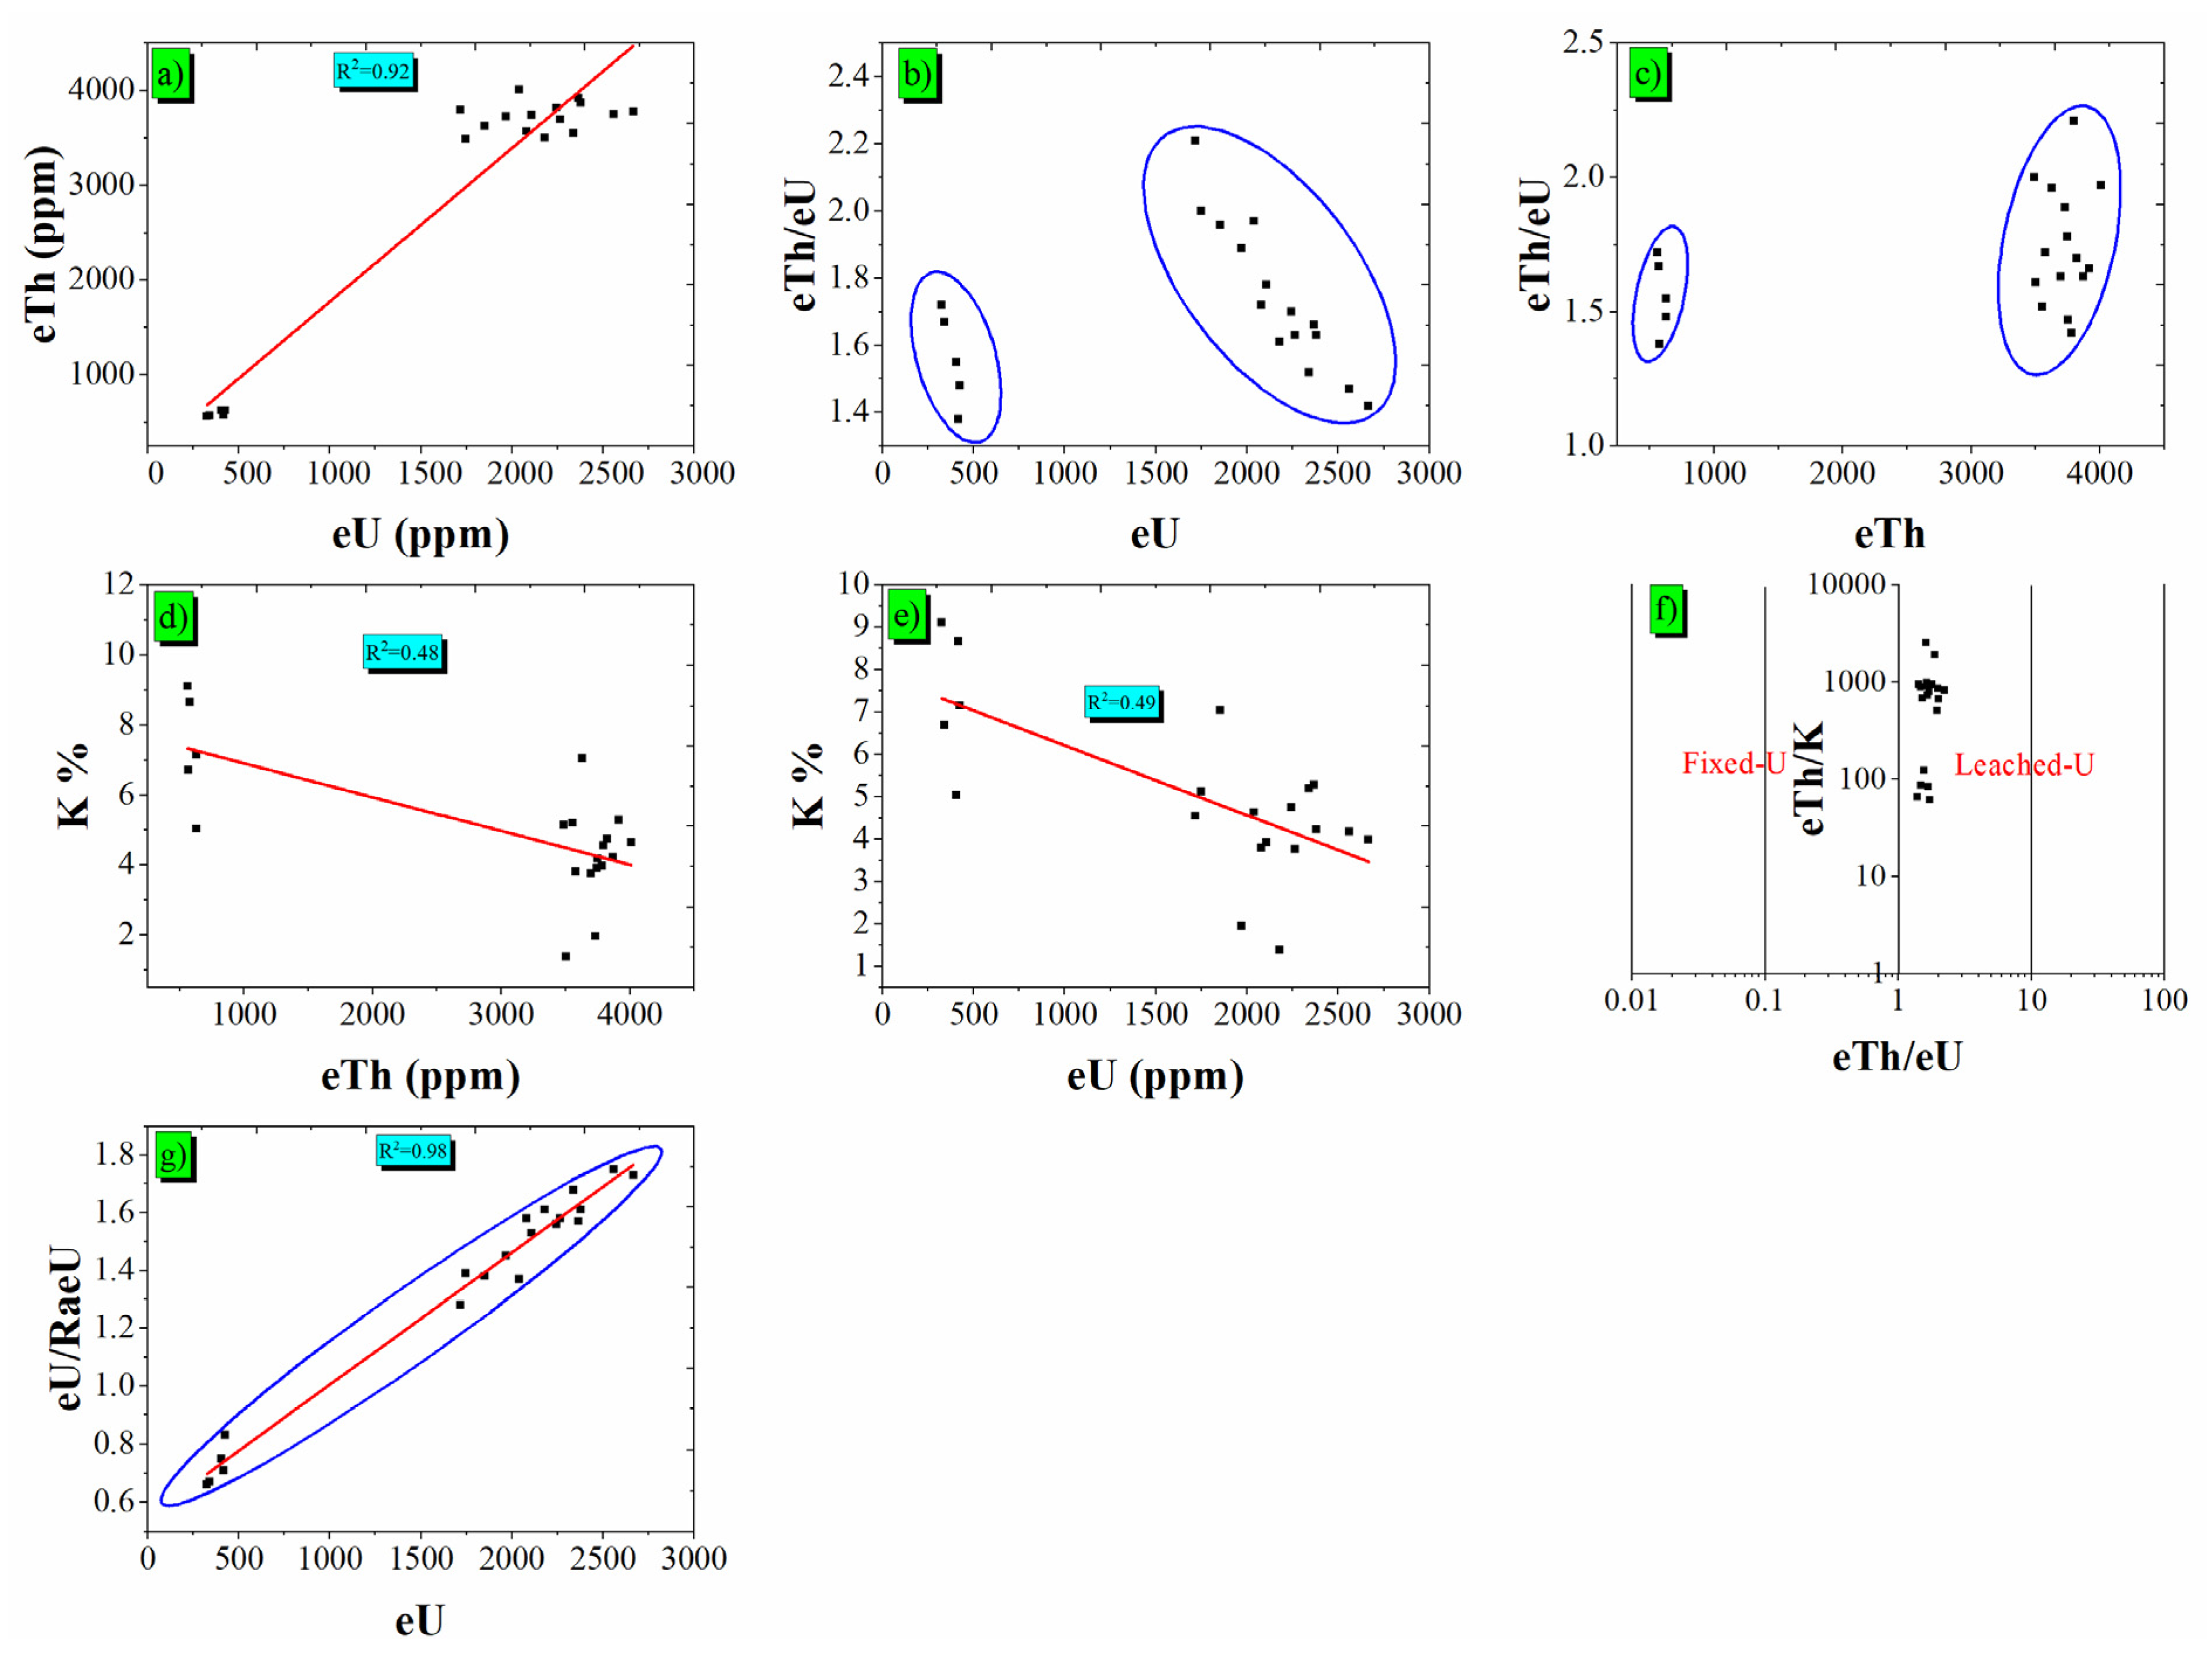
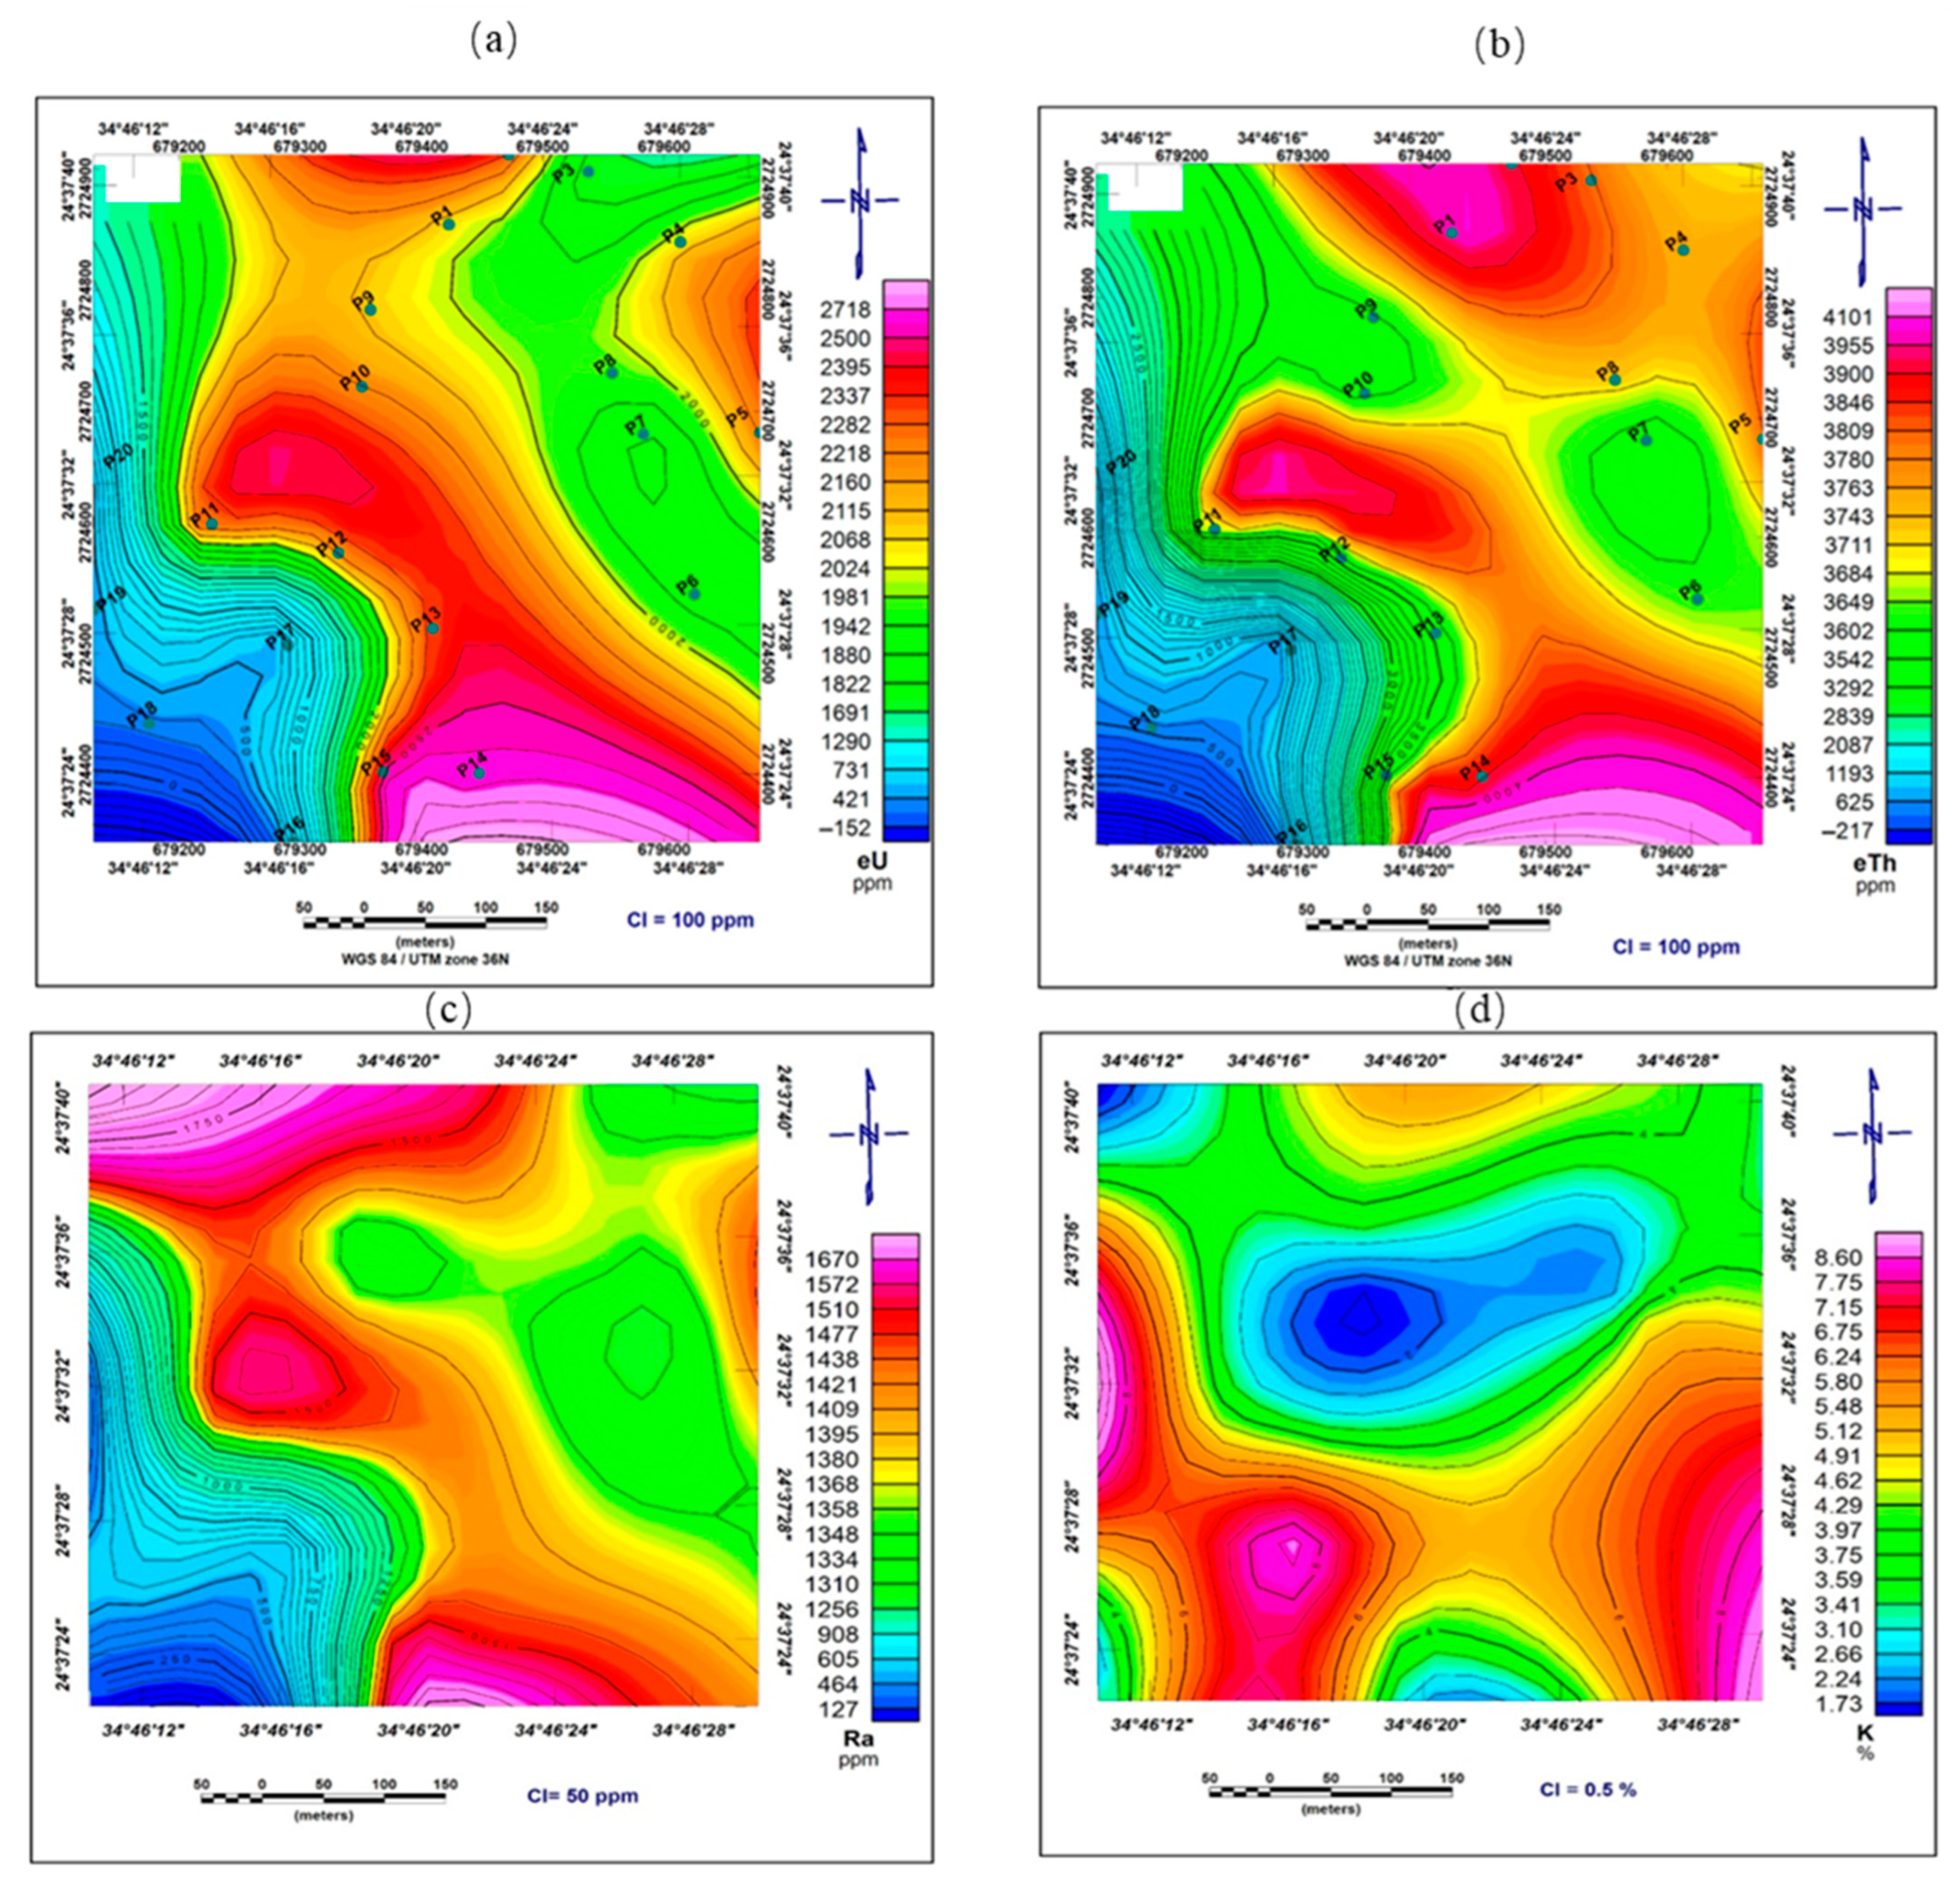
3.2. Radioelement Distribution

Radionuclide concentrations of the studied pegmatites are tabulated in Table 1. U, Th, RaeU and K ranged from 326 to 2667 ppm, 562 to 4010 ppm, 495 to 1544 ppm and 1.38 to 9.12% with an average of 1700 ppm, 2881.86 ppm, 1171.82 ppm and 5.04%, respectively. The mean U and Th levels of the examined pegmatites are considerably enriched in both U and Th mean levels 1700.91 ppm and 2881.86 ppm, respectively, as compared to the ranges and averages of Reference [38], (1–6 ppm U and 1–23 ppm Th) [39] and (3 ppm U and 8–17 ppm Th) [40]. eTh/eU ratios in igneous rocks are 3 or 4:1 [41]; however, eTh/eU ratios of the studied mineralized pegmatites have average ratios of 1.7, which is lower than the average of igneous rocks, suggesting uranium enrichment. Some radioelements’ inter-relationships could clarify the geochemistry of uranium and thorium. The eTh-eU intercept indicates that the magmatic processes play an essential role in uranium and thorium mineralization; while the eU and eTh relations with eTh/eU show ill-defined trends resulting from the colonization of the pegmatite samples in two groups. The groups include very high and moderate concentrations, which may indicate the presence of more than one pulse of mineralization (Figure 4a–c). A negative correlation of eU and eTh with K may be related to the alteration processes of feldspars pegmatites leading to uranium leaching and thorium adsorption of thorium on the resulting clay minerals leading to the deficiency in U and Th [42,43], (Figure 4d,e). eTh/eU-eTh/K relation manifests in the studied rock samples lying in the moderate sector between fixed and leached zones, indicating partial uranium and thorium mobilization closer to the fixed zone, suggesting they are hazardous if used as construction or decorative materials (Figure 4f).

Authigenic U (Migration Parameter)

The Wignall and Meyers formula (1988) [44] could be used to compute authigenic U enrichment: (Ua) = (U) − (Th)/3.5, where the square brackets signify concentration given in ppm. The estimated uranium values in the mineralized pegmatites are all positive, indicating that the uranium in the investigated granites is authigenic (Table 1).

3.3. Radioactive Equilibrium

Radioactive equilibrium in the study area can be estimated by the equilibrium factor (P), which was suggested by Reference [45] and applied by [41,42,43,46]. If the P-factor is ≥1, uranium is being added or removed. The inclusion and removal of uranium are attributed to geological processes such as alteration, which disrupts the equilibrium condition. In addition, groundwater may interact with some uranium deposits, causing uranium to be leached from its initial location and redeposited in new locations. The emission of radon gas, which is one of the uranium products, is another component that affects the equilibrium state. The solubility of radon in water makes it easy to leak through pore spaces, fissures and other fractures. The studied pegmatite samples show disequilibrium conditions where the average of eU/RaeU is 1.32, manifesting uranium addition (Figure 4g and Table 1).
Depending on the radionuclide concentration of the measured samples, radioelements distribution maps were constructed for detecting the sites of anomalous concentrations of U, Th, RaeU ppm and K%, (Figure 5a–d). The distribution maps indicate that the anomalous sites between U, Th and RaeU are matched. The highest values of these elements occur in the west but near the central, northwest and southeast parts of the mapped area, whereas potassium’s highest values are located in the east, southeast and southwest.

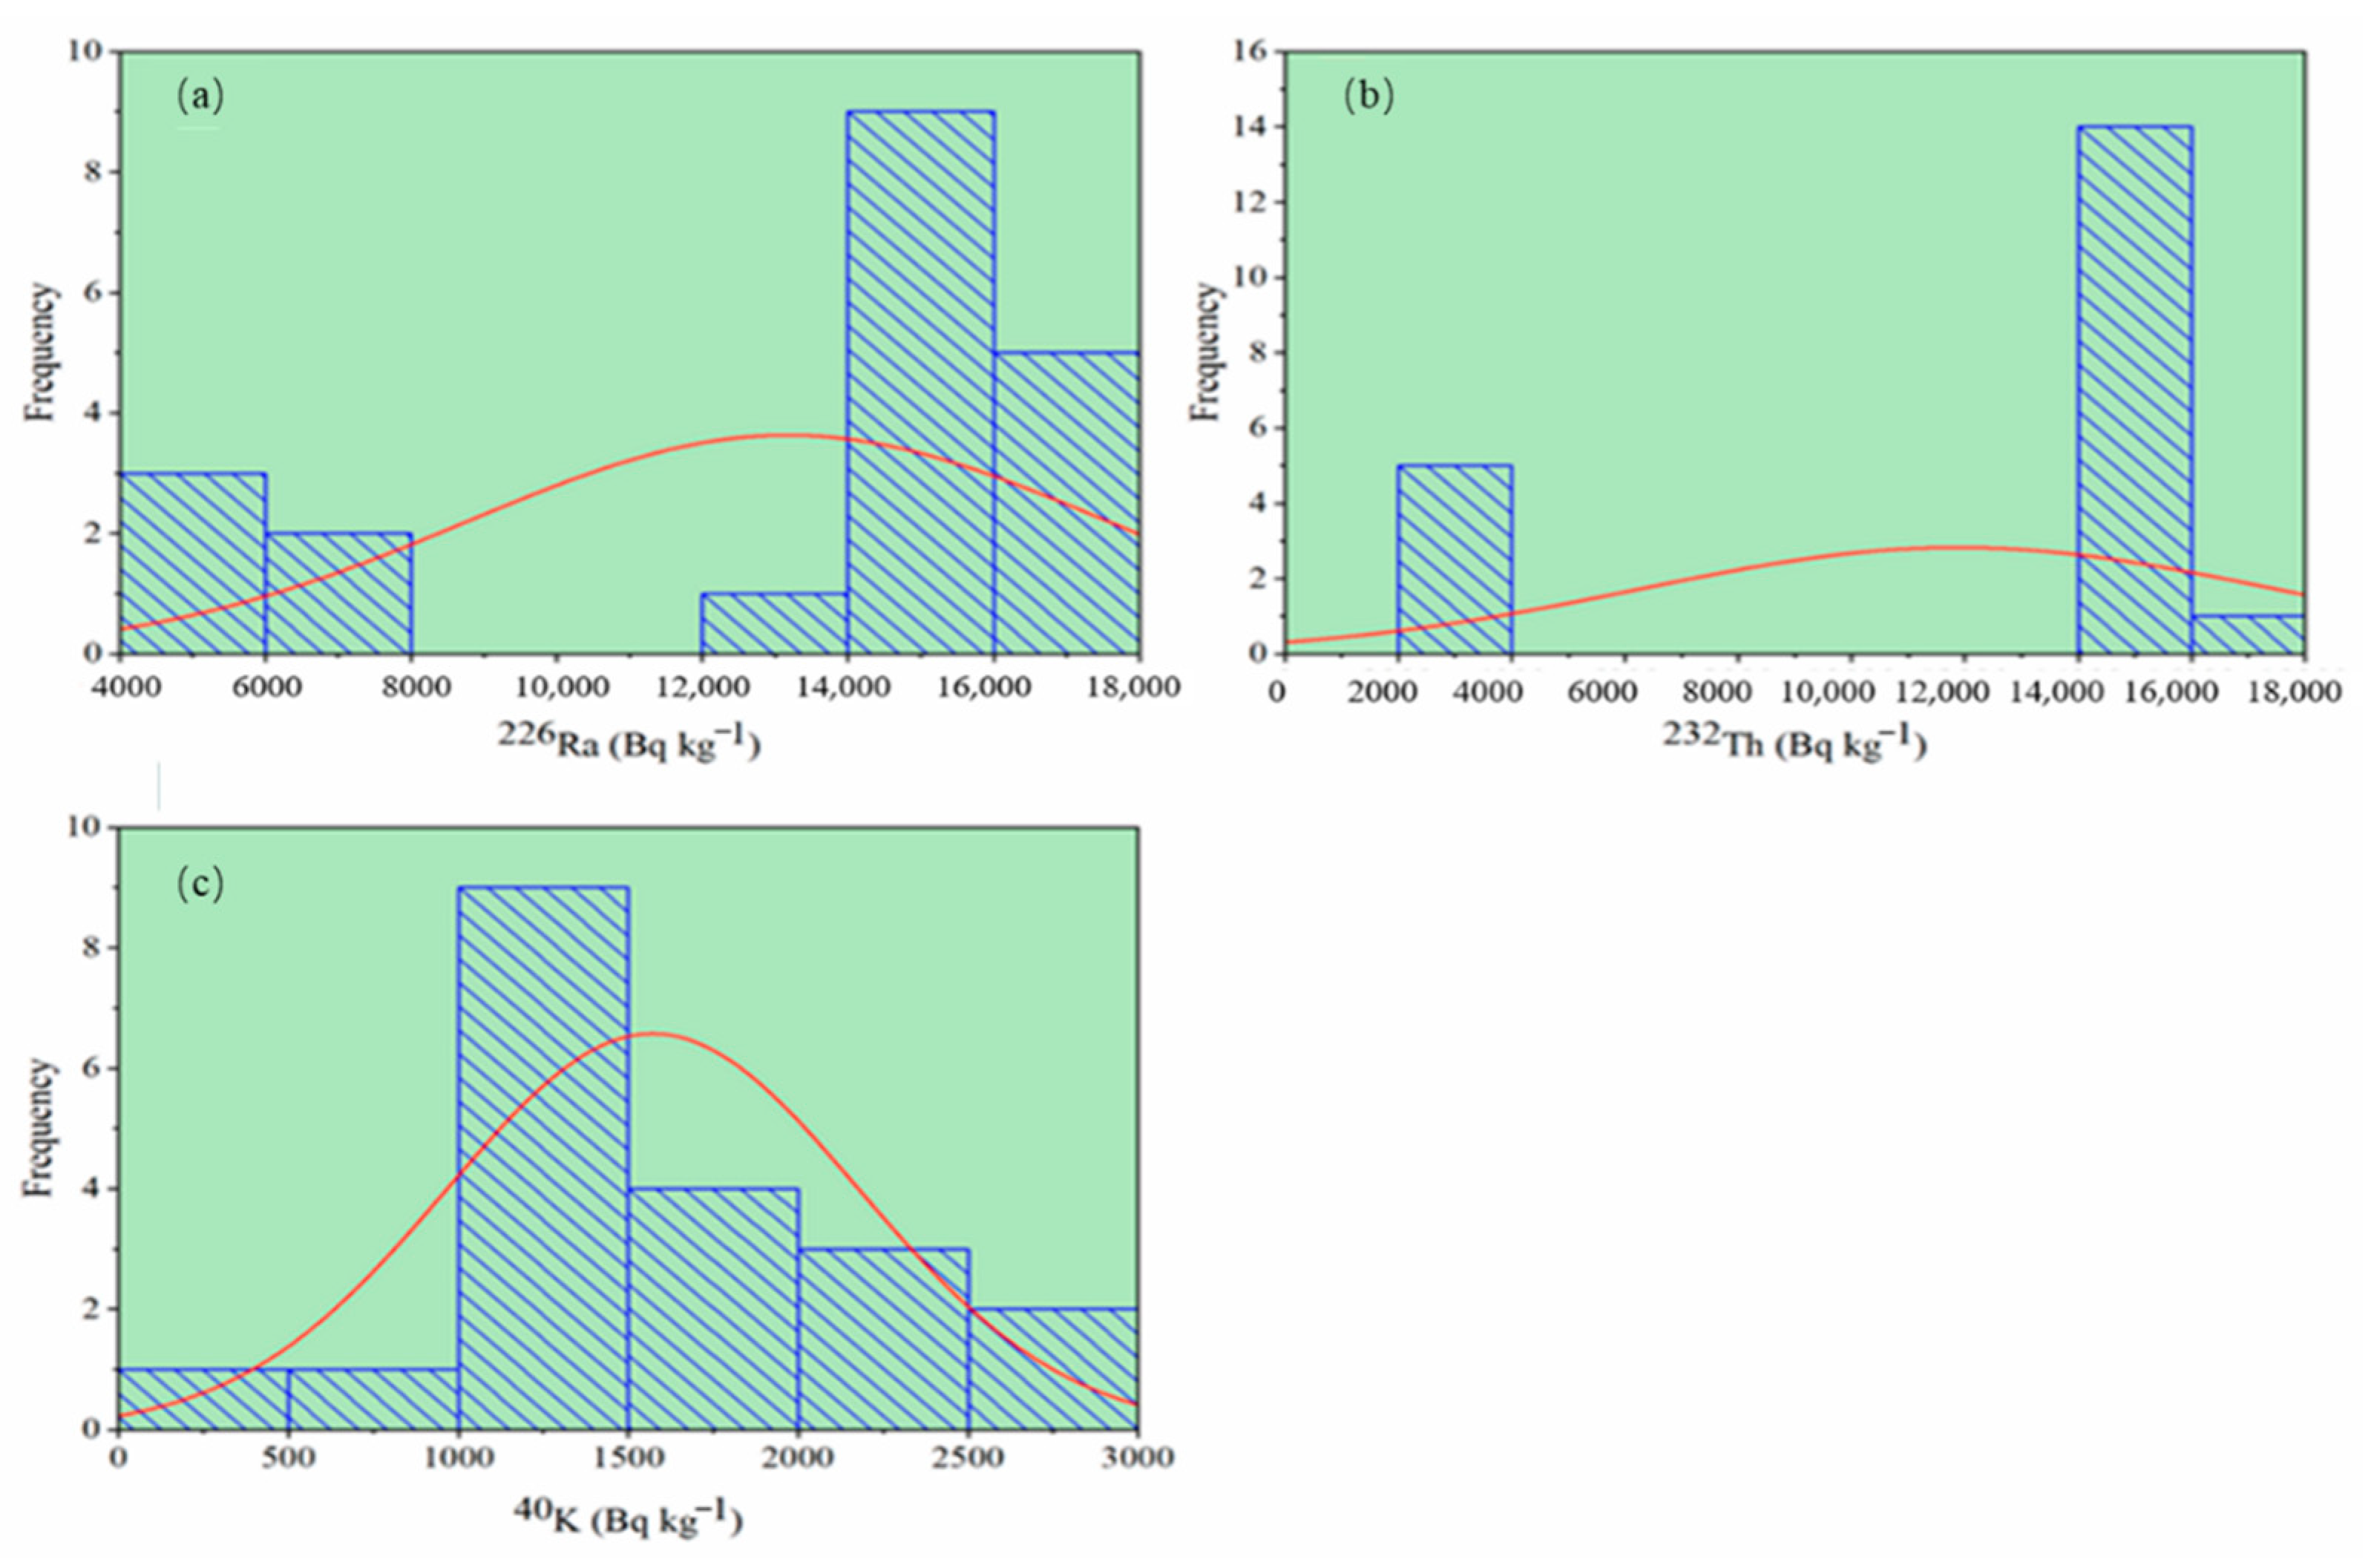
3.4. 226Ra, 232Th and 40K Activity Concentrations

The measurement data of the 226Ra, 232Th and 40K activity concentrations of 20 collected pegmatites samples are listed in Table 2.
Table 3 summarises descriptive statistics of radionuclides activity concentrations in the pegmatites. The radioactive concentrations data, as shown in Table 1, are as follows: The mean ± SD (Min/Max) activity concentrations of 226Ra, 232Th and 40K are 13176 ± 4394 (5495/17,138) Bqkg−1, 11,883 ± 5644 (2270/16,200) Bqkg−1 and 1573 ± 607 (432/2855) Bq kg−1, respectively. The mean values of Ra-226, Th-232 and K-40 activity concentrations in the pegmatites samples are much greater than the approved worldwide average of 32, 45 and 412 Bqkg−1, respectively [4]. Table 3 summarized the descriptive statistical analysis for the acquired activity levels corresponding to 226Ra, 232Th and 40K in the pegmatites samples.
The frequency of the distribution was determined by analyzing all related radionuclides (histograms are shown in Figure 6a–c). The normal distribution was obtained to 40K in Figure 6a–c, while 226Ra and 232Th distributions were displayed in several multi-modality levels.
The feature of multimodal for radioelements 226Ra and 232Th is owing to the complication of minerals in the pegmatites samples. The confirmation of normal distribution was done by applying the Kolmogorov–Smirnov (KS) test, which illustrates that the distribution of the data was normal (Table 4).
The p-value was lower than 5%, implying that the distribution of 226Ra and 232Th radionuclides activity in pegmatites is not normal, established on the null hypothesis of KS test. The geological nature of the samples under investigation, which contains uranium-enriched silica and shear zone dykes, is linked to the high content of 238U [47]. Furthermore, the existence of U and Th in the chemical compositions of heavy minerals like fluorite, zircon, apatite, uraninite and thorianite determined in granitic and basaltic rocks could be responsible for high levels of radioactivity [48,49].
With positive results suggesting the asymmetric distribution, the skewness anticipated the asymmetric distribution, which conformed to the key descriptive statistics of radioelement activity concentrations. Their negative findings allude to the tail of the asymmetric distribution. As a result, negative skewness data for 226Ra and 232Th activity concentrations reflect a negative value with the tail of the asymmetric nature, but positive skewness data for 40K activity concentrations allude a positive asymmetric nature. Second, the kurtosis data show the Preakness of the probability distribution. The radioelements 226Ra and 232Th have negative kurtosis coefficients, which means that their distributions are flat. While the 40K kurtosis coefficient was positive, indicating that the probability distribution’s Preakness was present. Table 3 shows that the standard deviation values for all investigated radionuclides are less than the mean, indicating that the predicted radionuclides in the pegmatites samples have a high level of uniformity. Table 3 shows that the identified radionuclides 226Ra, 232Th and 40K had moderate CV values of 33%, 47% and 39%, respectively. This may be denoted by the presence of introduce radioactive minerals in the pegmatites samples. It was discovered that 75% of the pegmatites samples had higher activity of 226Ra than the mean value, while 45% of the samples had higher activity of 40K than the mean value.
The difference among the activity concentrations for the investigated radionuclides with the recent literature is described in Table 5. The present data display much higher than the previous data.

3.5. Radiological Hazard Impacts

The gamma emitter of gathered pegmatites samples is used to detect the consequences of risk risks using the aforementioned criteria. Table 2 shows the Hex and Hin indices, as well as the Raeq, for each pegmatite sample. The Raeq mean value is 30,291 Bq kg−1, which is greater above the specified limit of 370 Bq kg−1, and the results in the tested pegmatites samples varied between 8961 and 39,829 Bq kg−1.
Raeq’s most recent findings show the presence of radium and thorium in pegmatites collections with high activity concentrations. The permitted limit (1) is recognized for all external and internal danger indicators related with the collected pegmatites samples. The Hex values range from 24 to 108, with an average of 82, while the Hin data ranges from 39 to 152, with an average of 117. As a result, severe health concerns can be discovered as a result of external gamma radiation exposure [59]. Table 2 shows the associated statistics for the calculated Dair data. The maximum Dair value (17,491 nGy h−1) is significantly greater than the previously reported limit (59 nGy h−1) for pegmatites from sample P1. Dair data has a statistical range of 4027 to 17,491 nGy h−1, with a mean value of 13,330 nGy h−1, which is higher than the given limit [4,60]. The AED values for AEDout and AEDin are enlisted in Table 2.
The AEDout data ranged from 4.9 to 21.5 mSv, with a mean of 16.3 mSv, which is greater than the 0.07 mSv reported previously in the literature [4], The AEDin’s Min and Max data are 20 and 86 mSv, respectively, with a mean value of 65 mSv, which is over 158 times higher than the UN-SCEAR recommended level of 0.41 mSv. This implies that long-term high-dose exposure can result in cancer, DNA in genes, tissue degradation, or coronary heart disease [61]. The AGDE data range alternated between 27 (P1) and 119 (P20) mSvy−1 with the mean value of 91 mSvy−1, which much greater than the approved limit of 0.3 mSvy−1 (Table 2) [4]. Thus, the pegmatite in the examined area is not suitable for construction materials or infrastructure use. The Min and Max values of ELCR for the examined pegmatites samples are 0.017 to 0.75, and the mean value is 0.057, which would be 196 times higher than the allowed range (0.00029) [33]. This reveals that long-term exposure to the studied pegmatites can cause cancer in the general populace.
Figure 7 shows the effective dose rate supplied to the various organs, where the DO calculates how much radiation is accumulated in the different human tissues and organs after a person has been exposed to it for a year. The received dose by the testes organ was observed to be the highest with average values of 13 and 54 mSvy−1 for outdoor and indoor, respectively, while the received dose by the liver was the lowest with average values of 8 and 30 mSvy−1 for outdoor and indoor, respectively. According to these findings, the projected doses to the various organs investigated are all higher than the acceptable worldwide level dose intake to the body organ of 1.0 mSv yearly. The testes have a higher dose than the other organs, while the liver has lower values of Do, which is justified by the rate of food nutrient absorption [62]. This demonstrates that exposure to gamma rays from the pegmatites at the studied area significantly affects the radiation dosage to these adult organs.

3.6. Pearson Correlation Matrix (PCM)

The PCM was determined in the present investigation to determine the intensity of the association among the radioactive factors (Table 6). The correlation intensity was divided into four categories as follows: (0.00–0.19), (0.2–0.39), (0.4–0.79) and (0.8–1.00) for weak, moderate, high and extremely strong, respectively [63]. Table 6 shows a high positive (R2 = 0.99) association between 226Ra and 232Th. This can be explained according to the existence of two radionuclides in nature simultaneously [64,65]. The moderate negative correlations are expected between 226Ra and 40K (R2 = 0.69) as well as 232Th and 40K (R2 = 0.70), demonstrating its origin from several radioactive decay series in nature. Furthermore, the radiological hazard variables have a strong positive and considerable connection with the 226Ra and 232Th. This is due to the association of radiological variables with the radionuclides that have been identified in nature as mostly gamma-ray emitting sources.

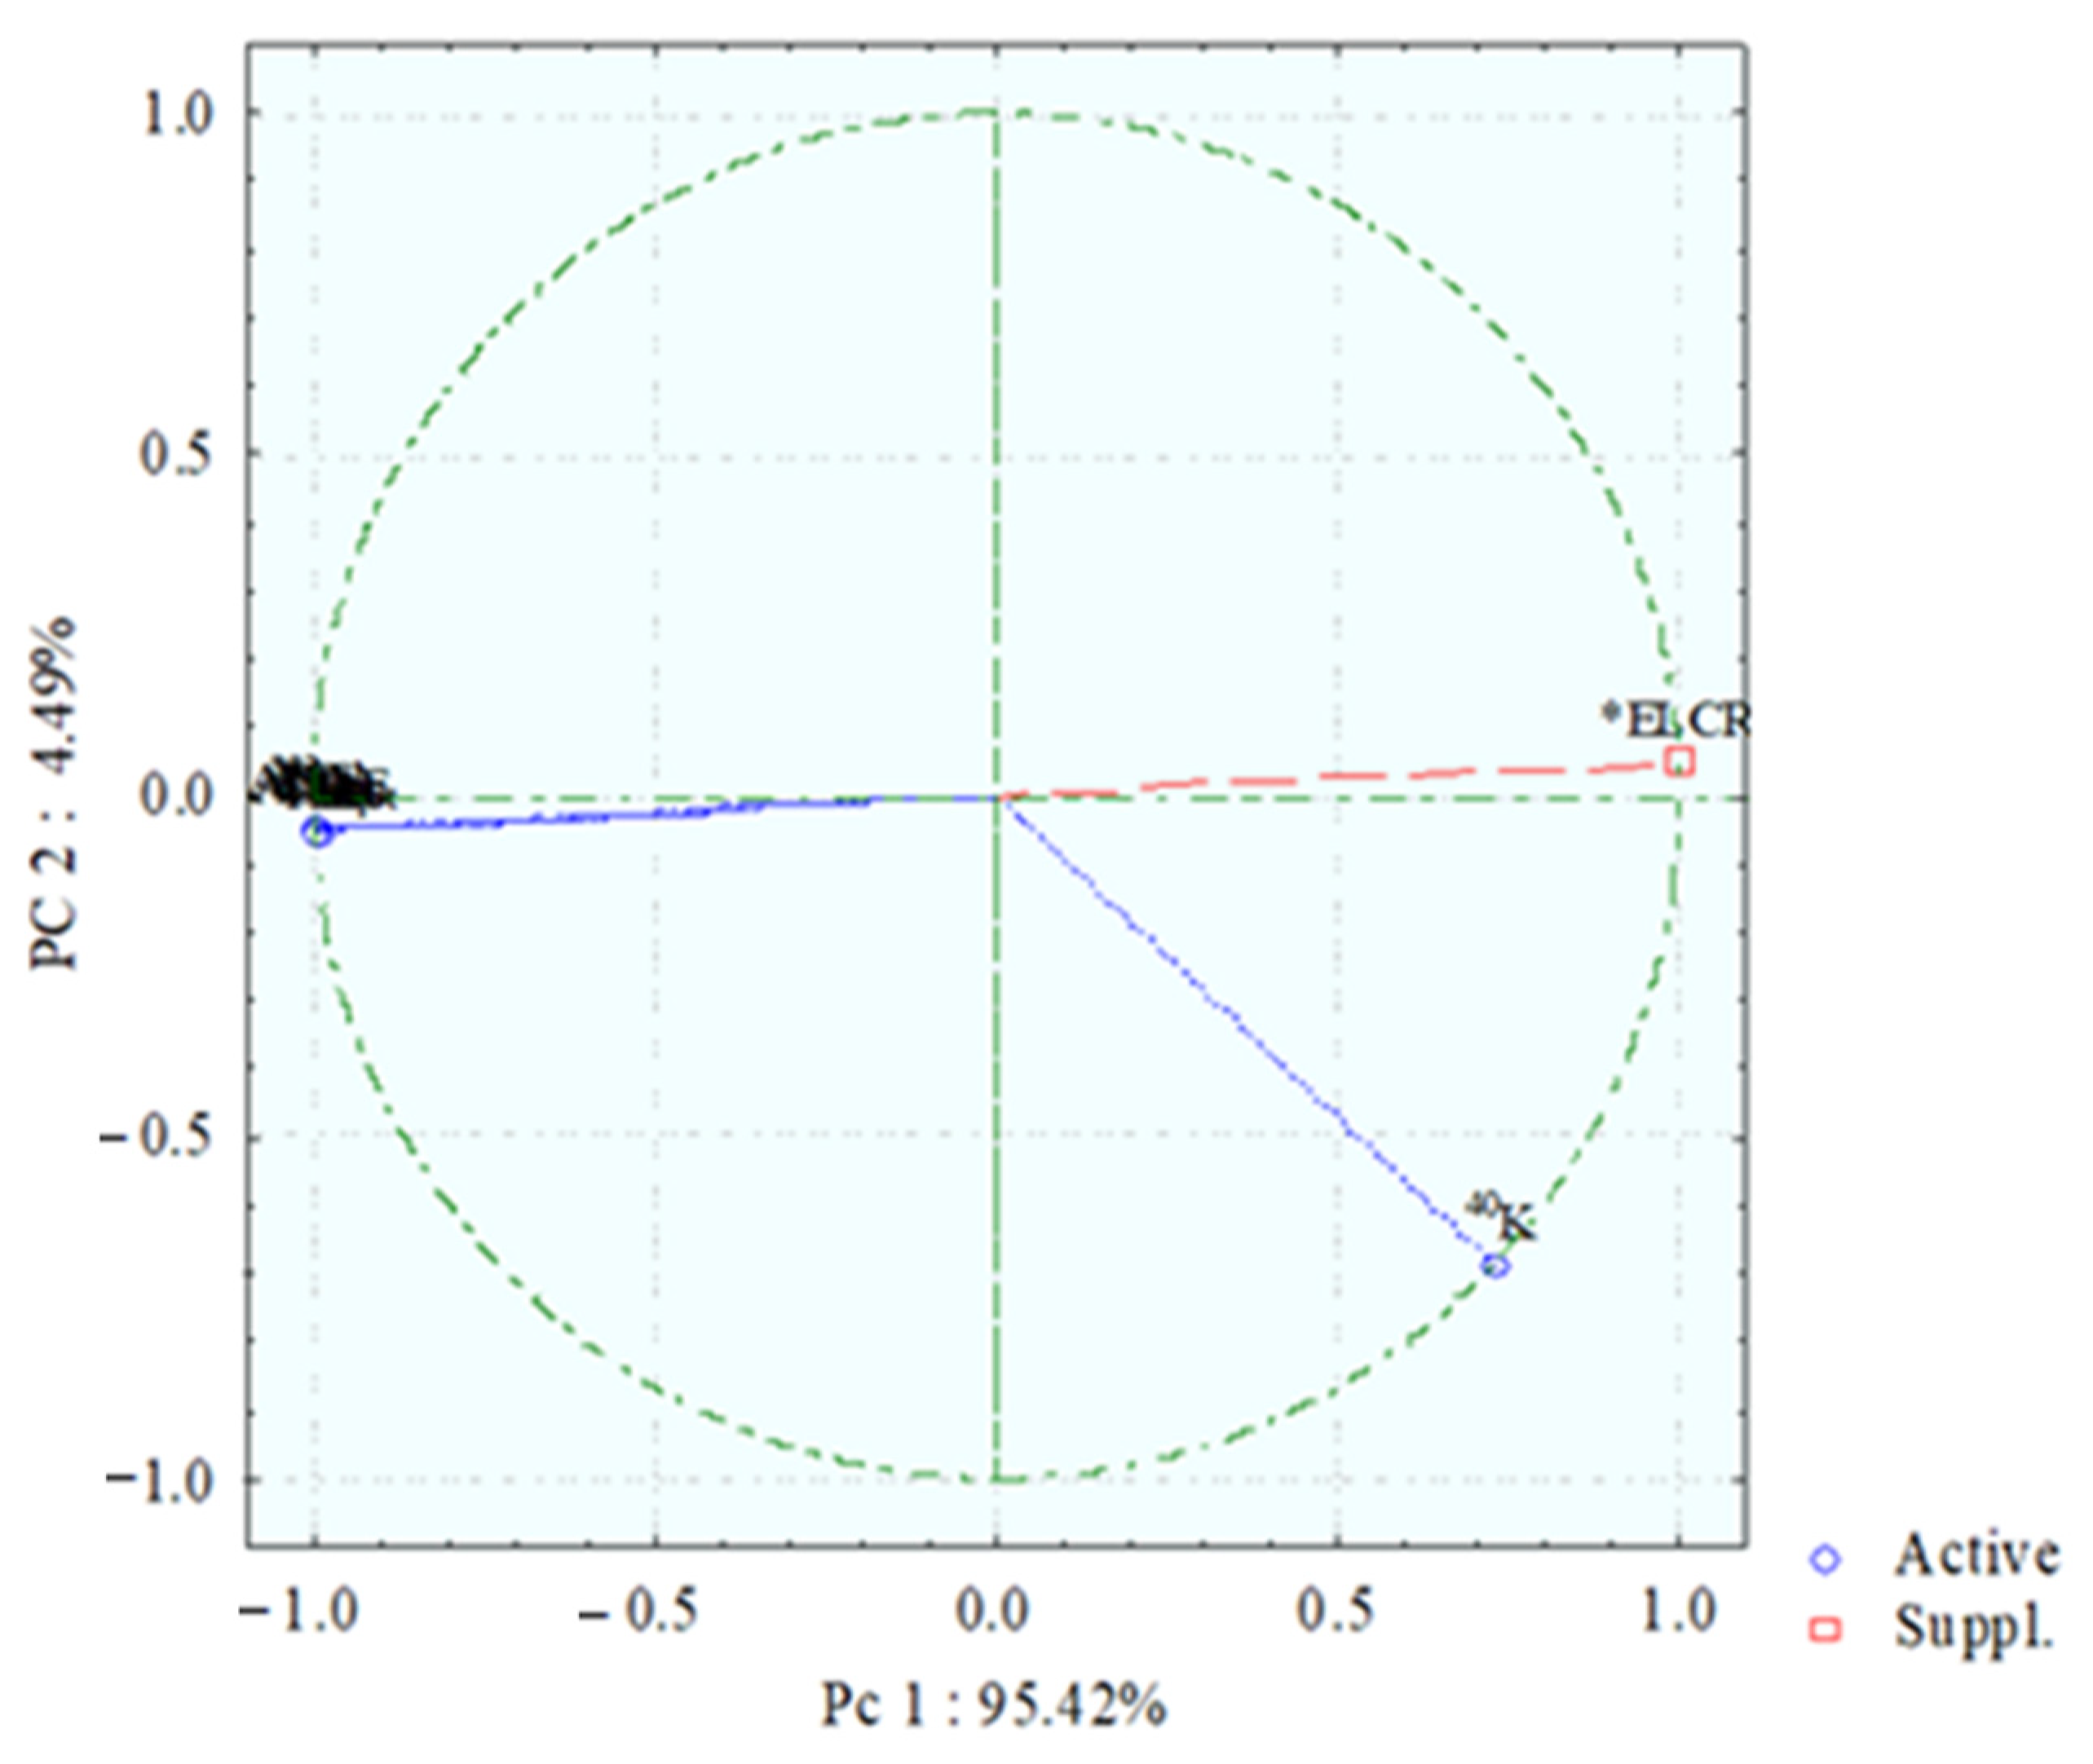
3.7. Principal Component Analysis

On the basis of varimax rotations, the PCA proceeded with the matrix correlation between various components. Eigenvectors and eigenvalues describe the major components, and the percent of the variance is explained among the correlation matrix data (Figure 8). The PC1 is differentiated by the strong positive loading of 226Ra and 232Th activity concentrations, accounting for 95.42% of the total variance explained. The PC2 was found to explain 4.49% of the overall variance, which is linked to the positive loading of 40K. As a result, 226Ra and 232Th are the major gamma-emitting sources in all pegmatites in the examined area. Furthermore, the mineral analysis verified the existence of radioactive carrying minerals in the tested pegmatites.

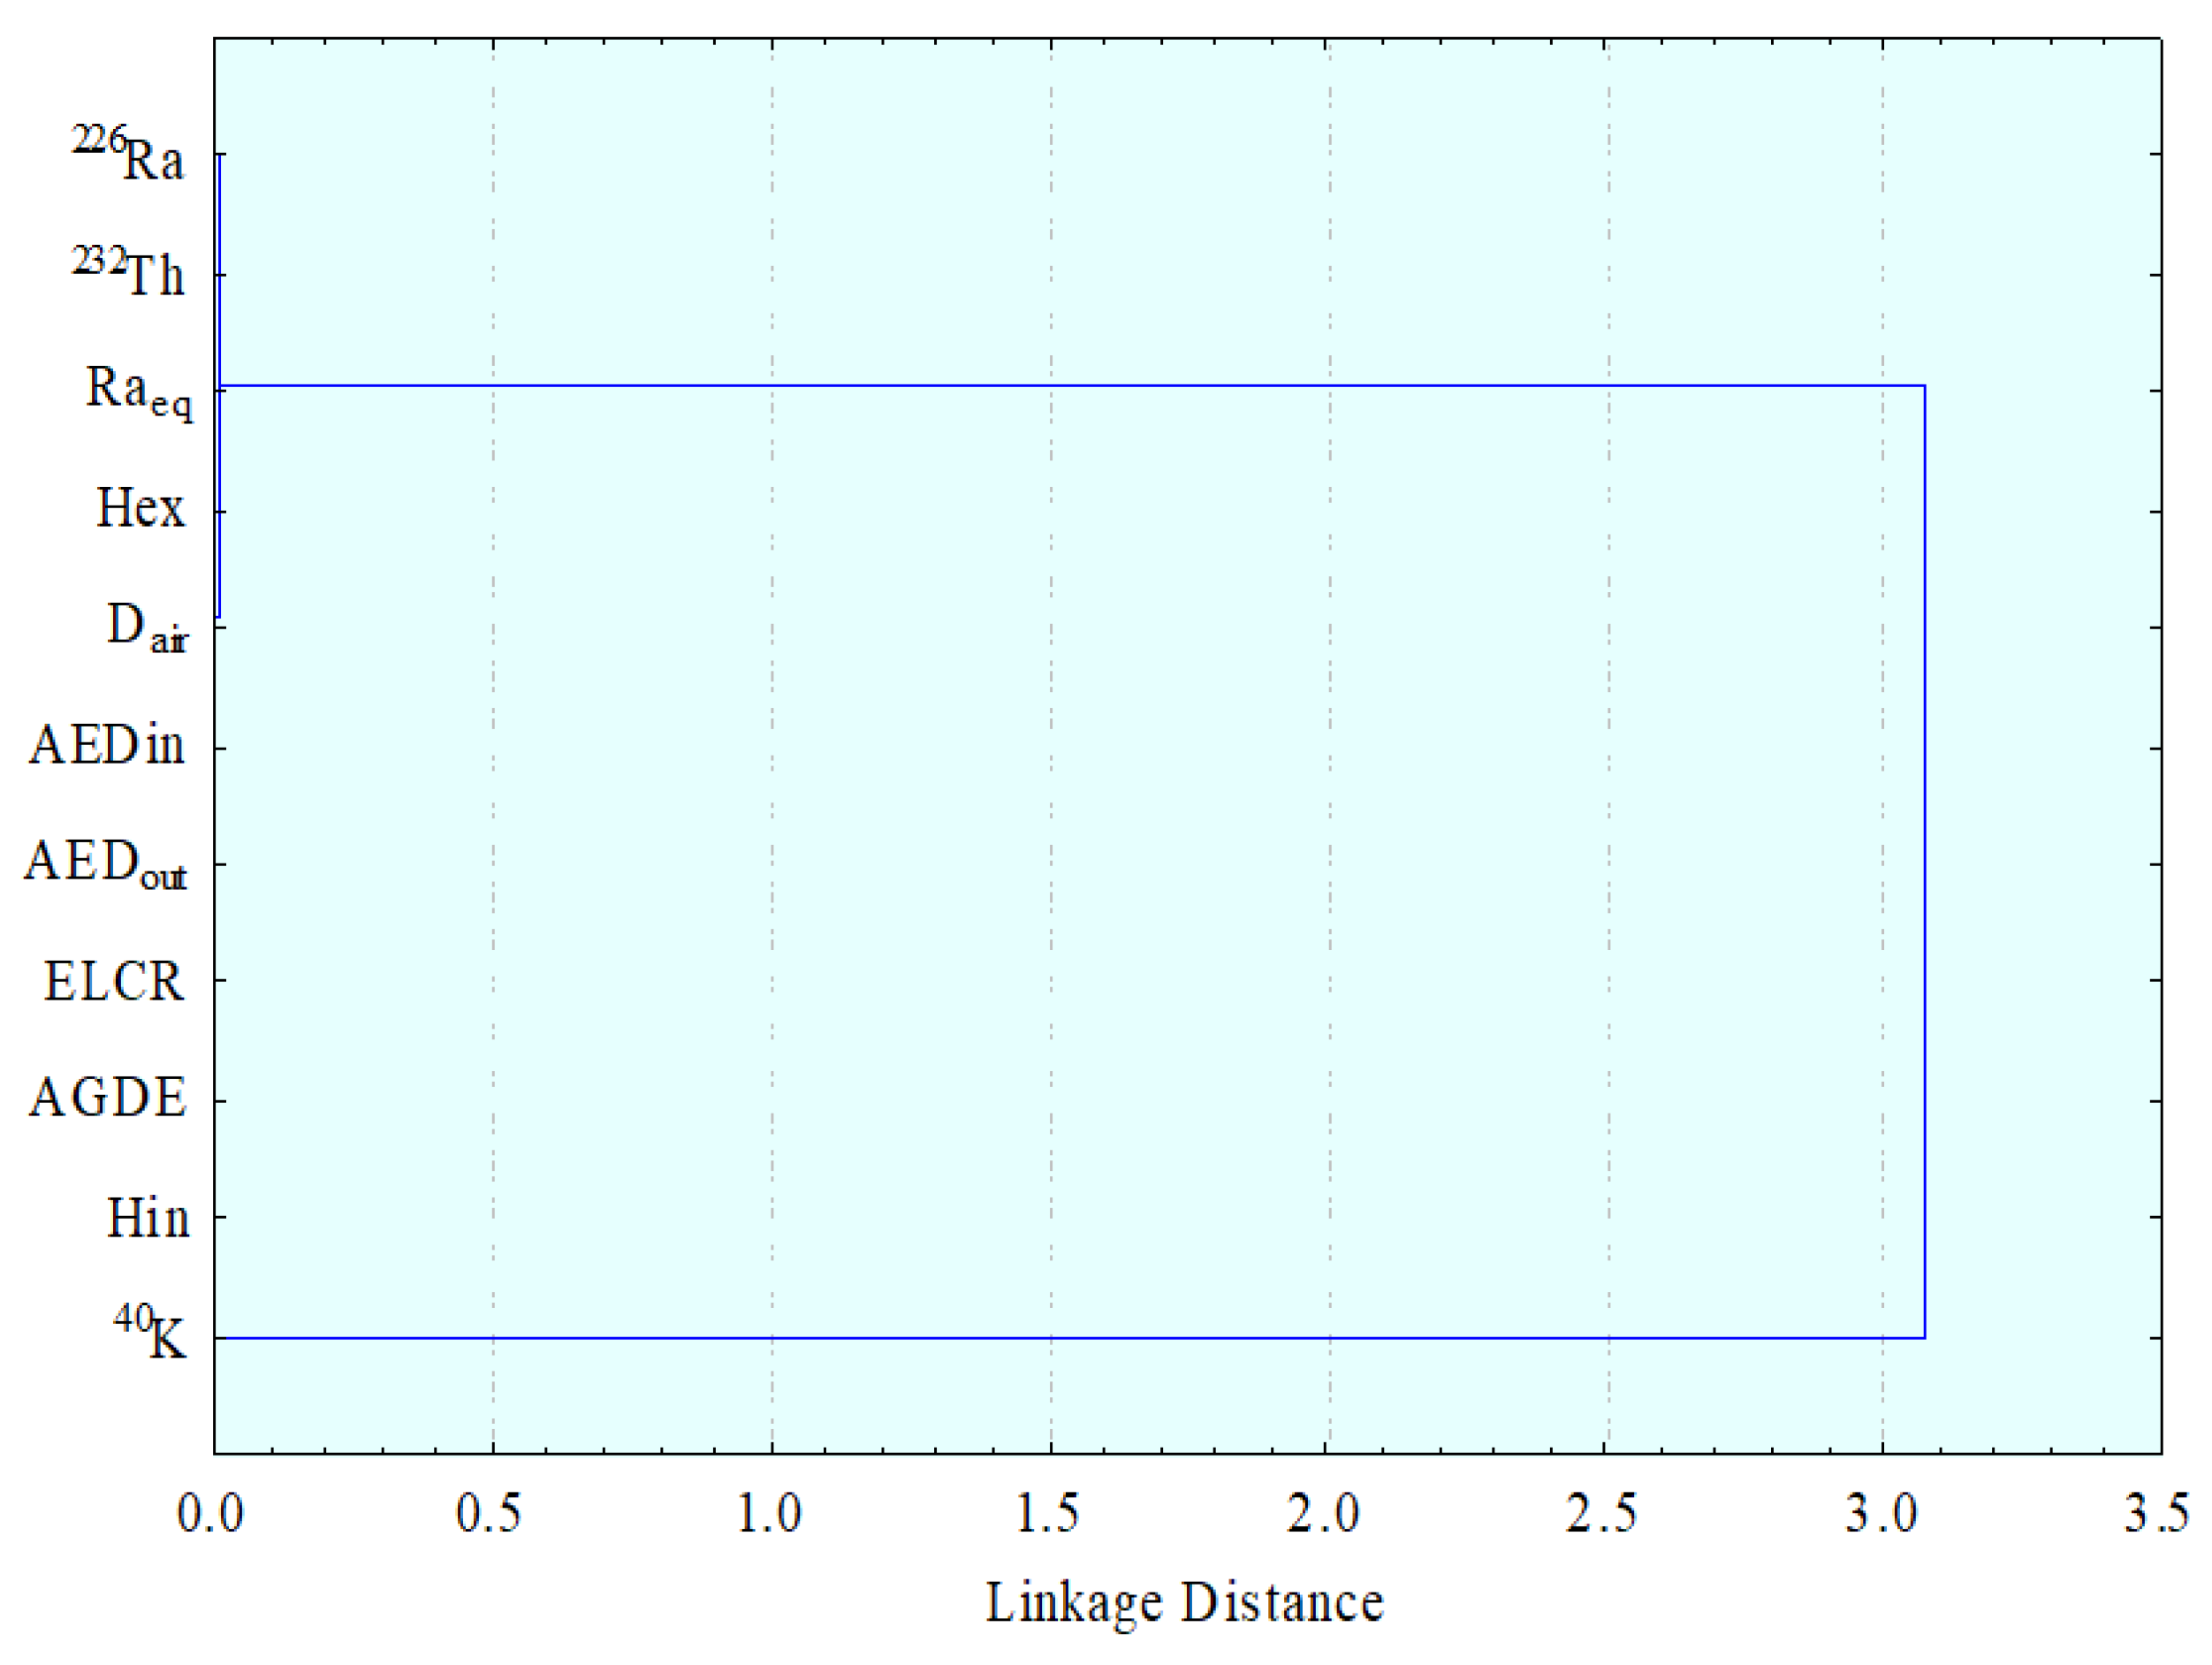
3.8. Hierarchical Clustering Analysis

The HCA is used to look at the links among the radiological factors, as shown in Figure 9. In the dendrogram of the examined data, two primary clusters are described. The 40K is represented by Cluster I, linked to Cluster II, which includes the 226Ra, 232Th and the remainder of the radioactive danger factors. This is explained by the radiological hazard characteristics in the pegmatites of the analysed area being connected to the primary gamma radiation sources (226Ra and 232Th). Previous statistical investigations such as Pearson analysis and PCA agree with the HCA.

4. Conclusions

The radionuclide distribution shows that Abu Rusheid pegmatites are high in uranium high thorium rocks. Relationships among radioelements clarify that the radioactive mineralization in the studied pegmatites is magmatic and hydrothermal. The positive equilibrium condition confirms uranium addition to the studied rocks. Comparisons of the minerals against the other rocks show their enrichment in the radioelements. The radioelements’ distribution maps indicate that there is a matching in the anomalous sites between U, Th and RaeU, where the highest values of these elements occur in the west and near to the central, northwest and southeast parts of the mapped area, whereas potassium’s highest values are located in the east, southeast and southwest. The obtained data displayed for the 226Ra, 232Th and 40K activity concentrations are 13,176 ± 4394, 11,883 ± 5644 and 1573 ± 607 Bq kg−1, respectively, which are higher than the approved worldwide values 33, 45 and 412 Bq kg−1. The high activity of the mineralized pegmatite is mainly attributed to uranium mineral (autunite), uranophane, kasolite and carnotite, thorium minerals and accessories minerals as allanite, monazite, zircon, xenotine, columbite, fluorite and samarskite. The radium equivalent content, absorbed dose rate and different radiological hazard variables were estimated. Besides, the values of mean for the annual gonadal dosage equivalent (91 mSvy−1) and the raised lifetime cancer risk (ELCR) (57 × 10−3) were estimated. Multivariate statistical strategies are employed and displayed that the 226Ra and 232Th principal contributions are predominant in the radioactivity of pegmatites rocks.

Author Contributions

Conceptualization, R.M.A.E.R., S.A.T. and M.S.M.; methodology, R.M.A.E.R. and M.S.M.; software, M.Y.H. validation, M.I.S. and Z.Z.A.F.; formal analysis, S.A.T. and M.Y.H.; investigation, Z.Z.A.F., M.S.M. and M.Y.H.; resources, R.M.A.E.R. and S.A.T.; data curation, M.S.M. and M.Y.H.; writing—original draft preparation, R.M.A.E.R., S.A.T., N.A. and M.Y.H.; writing—review and editing, S.A.T. and M.Y.H.; visualization, M.S.M. and Z.Z.A.F.; supervision, M.I.S.; project administration, R.M.A.E.R. and M.S.M.; funding acquisition, N.A. All authors have read and agreed to the published version of the manuscript.

Funding

The authors express their gratitude to Princess Nourah bint Abdulrahman University Researchers Supporting Project number (PNURSP2022R111), Princess Nourah bint Abdulrahman University, Riyadh, Saudi Arabia.

Institutional Review Board Statement

Not applicable.

Informed Consent Statement

Not applicable.

Data Availability Statement

Not applicable.

Acknowledgments

The authors express their gratitude to Princess Nourah bint Abdulrahman University Researchers Supporting Project number (PNURSP2022R111), Princess Nourah bint Abdulrahman University, Riyadh, Saudi Arabia.

Conflicts of Interest

The authors declare no conflict of interest.

References

  1. UNSCEAR. Sources and Effects of Ionizing Radiation: United Nations Scientific Committee on the Effects of Atomic Radiation; UNSCEAR 2000 Report to the General Assembly; United Nations Publication: New York, NY, USA, 2000; pp. 1–10. [Google Scholar]
  2. Zaim, N.; Atlas, H. Assessment of radioactivity levels and radiation hazards using gamma spectrometry in soil samples of Edirne, Turkey. J. Radioanal. Nucl. Chem. 2016, 310, 959–967. [Google Scholar] [CrossRef]
  3. Bramha, S.; Sahoo, S.K.; Subramanian, V.; Venkatraman, B.; Rath, P. Application of multivariate technique to evaluate spatial distribution of natural radionuclides along Tamil Nadu coastline, east coast of India. SN Appl. Sci. 2019, 1, 689. [Google Scholar] [CrossRef] [Green Version]
  4. UNSCEAR. Sources and Effects of Ionizing Radiation—Exposures of the Public and Workers from Various Sources of Radiation; UNSCEAR 2008 Report; United Nations Publication: New York, NY, USA, 2010; Volume 1, ISBN 9789211422740. [Google Scholar]
  5. Boumala, D.; Mavon, C.; Belafrites, A.; Tedjani, A.; Groetz, J.E. Evaluation of radionuclide concentrations and external gamma radiation levels in phosphate ores and fertilizers commonly used in Algeria. J. Radioanal. Nucl. Chem. 2018, 317, 501–510. [Google Scholar] [CrossRef]
  6. Hassan, N.M.; Mansour, N.A.; Fayez-Hassan, M.; Sedqy, E. Assessment of natural radioactivity in fertilizers and phosphate ores in Egypt. J. Taibah Univ. Sci. 2016, 10, 296–306. [Google Scholar] [CrossRef] [Green Version]
  7. Calin, M.R.; Radulescu, I.; Calin, M.A. Measurement and evaluation of natural radioactivity in phosphogypsum in industrial areas from Romania. J. Radioanal. Nucl. Chem. 2015, 304, 1303–1312. [Google Scholar] [CrossRef]
  8. Hanfi, M.Y.M. Radiological assessment of gamma and radon dose rates at former uranium mining tunnels in Egypt. Environ. Earth Sci. 2019, 78, 113. [Google Scholar] [CrossRef]
  9. La Verde, G.; Raulo, A.; D’Avino, V.; Roca, V.; Pugliese, M. Radioactivity content in natural stones used as building materials in Puglia region analysed by high resolution gamma-ray spectroscopy: Preliminary results. Constr. Build. Mater. 2020, 239, 117668. [Google Scholar] [CrossRef]
  10. Sahoo, B.K.; Nathwani, D.; Eappen, K.P.; Ramachandran, T.V.; Gaware, J.J.; Mayya, Y.S. Estimation of radon emanation factor in Indian building materials. Radiat. Meas. 2007, 42, 1422–1425. [Google Scholar] [CrossRef]
  11. Sabbarese, C.; Ambrosino, F.; Onofrio, A.D.; Roca, V. Radiological characterization of natural building materials from the Campania region (Southern Italy). Constr. Build. Mater. 2020, 268, 121087. [Google Scholar] [CrossRef]
  12. Imani, M.; Adelikhah, M.; Shahrokhi, A.; Azimpour, G.; Yadollahi, A.; Kocsis, E.; Toth-Bodrogi, E.; Kovács, T. Natural radioactivity and radiological risks of common building materials used in Semnan Province dwellings, Iran. Environ. Sci. Pollut. Res. 2021, 28, 41492–41503. [Google Scholar] [CrossRef]
  13. Calmet, D.; Ameon, R.; Bombard, A.; Forte, M.; Fournier, M.; Herranz, M.; Jerome, S.; Kwakman, P.; Llaurado, M.; Tokonami, S. ISO standards on test methods for water radioactivity monitoring. Appl. Radiat. Isot. 2013, 81, 21–25. [Google Scholar] [CrossRef] [PubMed] [Green Version]
  14. EL-Mezayen, A.M.; Falham, O.; Abu Zeid, E.; Mahmoud, M.A.M.; Shalan, A.S. Petrology and Uranium Potentiality of Abu-Rusheid Subsurface Gneisses, Southeastern Desert, Egypt. Al-Azhar Bull. Sci. 2015, 26, 51–68. [Google Scholar] [CrossRef]
  15. Siachoque, A.; Garcia, R.; Vlach, S.R.F. Occurrence and composition of columbite-(Fe) in the reduced a-type desemborque pluton, graciosa province (s-se Brazil). Minerals 2020, 10, 411. [Google Scholar] [CrossRef]
  16. Ibrahim, M.E.; Saleh, G.M.; Dawood, N.A.; Aly, G.M. Ocellar lamprophyre dyke bearing mineralization, Wadi Nugrus, Eastern Desert, Egypt: Geology, mineralogy and geochemical implications. Chin. J. Geochem. 2010, 29, 383–392. [Google Scholar] [CrossRef]
  17. Turhan, Ş. Estimation of possible radiological hazards from natural radioactivity in commercially-utilized ornamental and countertops granite tiles. Ann. Nucl. Energy 2012, 44, 34–39. [Google Scholar] [CrossRef]
  18. Moussa, H.E.; Asimow, P.D.; Azer, M.K.; Abou El Maaty, M.A.; Akarish, A.I.M.; Yanni, N.N.; Mubarak, H.S.; Wilner, M.J.; Elsagheer, M.A. Magmatic and hydrothermal evolution of highly-fractionated rare-metal granites at Gabal Nuweibi, Eastern Desert, Egypt. Lithos 2021, 400–401, 106405. [Google Scholar] [CrossRef]
  19. Ragab, A.A. Geochemistry and Radioactivity of Mineralized Pegmatite from Abu Rusheid Area, South Eastern Desert, Egypt. J. King Abdulaziz Univ. Earth Sci. 2011, 22, 99–130. [Google Scholar] [CrossRef]
  20. Tzortzis, M.; Tsertos, H. Determination of thorium, uranium and potassium elemental concentrations in surface soils in Cyprus. J. Environ. Radioact. 2004, 77, 325–338. [Google Scholar] [CrossRef] [Green Version]
  21. Arunima, S.; Lekshmi, R.; Jojo, P.J.; Mayeen Uddin, K. A study on leaching of primordial radionuclides 232Th and 40K to water bodies. Radiat. Phys. Chem. 2021, 188, 109658. [Google Scholar] [CrossRef]
  22. Monica, S.; Jojo, P.J.; Khandaker, M.U. Radionuclide concentrations in medicinal florae and committed effective dose through Ayurvedic medicines. Int. J. Radiat. Biol. 2020, 96, 1028–1037. [Google Scholar] [CrossRef]
  23. Iqbal, M.; Tufail, M.; Mirza, S.M. Measurement of natural radioactivity in marble found in Pakistan using a NaI(Tl) gamma-ray spectrometer. J. Environ. Radioact. 2000, 51, 255–265. [Google Scholar] [CrossRef]
  24. Papadopoulos, A.; Christofides, G.; Koroneos, A.; Papadopoulou, L.; Papastefanou, C.; Stoulos, S. Natural radioactivity and radiation index of the major plutonic bodies in Greece. J. Environ. Radioact. 2013, 124, 227–238. [Google Scholar] [CrossRef] [PubMed]
  25. Ravisankar, R.; Vanasundari, K.; Chandrasekaran, A.; Rajalakshmi, A.; Suganya, M.; Vijayagopal, P. Measurement of natural radioactivity in building materials of Namakkal, Tamil Nadu, India using gamma-ray spectrometry. Appl. Radiat. Isot. 2012, 70, 699–704. [Google Scholar] [CrossRef] [PubMed]
  26. Senthilkumar, R.D.; Narayanaswamy, R. Assessment of radiological hazards in the industrial effluent disposed soil with statistical analyses. J. Radiat. Res. Appl. Sci. 2016, 9, 449–456. [Google Scholar] [CrossRef] [Green Version]
  27. Abdel-Razek, Y.A.; Masoud, M.S.; Hanfi, M.Y.; El-Nagdy, M.S. Effective radiation doses from natural sources at Seila area South Eastern Desert, Egypt. J. Taibah Univ. Sci. 2016, 10, 271–280. [Google Scholar] [CrossRef] [Green Version]
  28. Asaduzzaman, K.; Mannan, F.; Khandaker, M.U. Assessment of natural radioactivity levels and potential radiological risks of common building materials used in bangladeshi dwellings. PLoS ONE 2015, 10, e0140667. [Google Scholar] [CrossRef] [Green Version]
  29. Sivakumar, S.; Chandrasekaran, A.; Senthilkumar, G.; Suresh Gandhi, M.; Ravisankar, R. Determination of radioactivity levels and associated hazards of coastal sediment from south east coast of Tamil Nadu with statistical approach. Iran. J. Sci. Technol. Trans. A Sci. 2018, 42, 601–614. [Google Scholar] [CrossRef]
  30. Yasmin, S.; Barua, B.S.; Khandaker, M.U.; Kamal, M.; Rashid, A.; Sani, S.F.A.; Ahmed, H.; Nikouravan, B.; Bradley, D.A. The presence of radioactive materials in soil, sand and sediment samples of potenga sea beach area, Chittagong, Bangladesh: Geological characteristics and environmental implication. Results Phys. 2018, 8, 1268–1274. [Google Scholar] [CrossRef]
  31. Yalcin, S.; Gurler, O. The radioactivity measurements in soil, coal and water in south Marmara region of Turkey. Radiat. Meas. 2007, 42, 281–285. [Google Scholar] [CrossRef]
  32. UNSCEAR. Exposures from Natural Radiation Sources; UNSCEAR 2000 Report to the General Assembly; United Nations Publication: New York, NY, USA, 2000. [Google Scholar]
  33. Qureshi, A.A.; Tariq, S.; Kamal, U.; Manzoor, S.; Calligaris, C.; Waheed, A. ScienceDirect Evaluation of excessive lifetime cancer risk due to natural radioactivity in the rivers sediments of Northern Pakistan. J. Radiat. Res. Appl. Sci. 2014, 7, 438–447. [Google Scholar] [CrossRef] [Green Version]
  34. OʼBrien, K.; Sanna, R. The Distribution of Absorbed Dose-rates in Humans from Exposure to Environmental Gamma Rays. Health Phys. 1976, 30, 71–78. [Google Scholar] [CrossRef] [PubMed]
  35. ICRP. Age-Dependent Doses to Members of the Public from Intake of Radionuclides—Part 4 Inhalation Dose Coefficients; ICRP Report; ICRP Publication: Pergamon, Turkey, 1996; Volume 71. [Google Scholar]
  36. Ragab, A.A. Geochemical behavior of rare earth elements in hydrothermally altered rhyolite of Um Safi volcanics, Central Eastern Desert, Egypt. Al-Azhar Bull. Sci. 2010, 21, 61–80. [Google Scholar]
  37. Plášil, J. Oxidation-hydration weathering of uraninite: The current state-of-knowledge. J. Geosci. 2014, 59, 99–114. [Google Scholar] [CrossRef] [Green Version]
  38. Adams, S.S.; Bough, R.G.; Cliffe, E.E.; Lessel, B.; Mills, R.F.N. Absorption, distribution and toxicity of ibuprofen. Toxicol. Appl. Pharmacol. 1969, 15, 310–330. [Google Scholar] [CrossRef]
  39. Turekian, K.K.; Wedepohl, K.H. Distribution of the Elements in Some Major Units of the Earth’s Crust. Geol. Soc. Am. Bull. 1961, 172, 175–192. [Google Scholar] [CrossRef]
  40. Clark, R.L.; Hickey, R.C.; Butler, J.J.; Ibanez, M.L.; Ballantyne, A.J. Thyroid cancer discovered incidentally during treatment of an unrelated head and neck cancer: Review of 16 cases. Ann. Surg. 1966, 163, 665–671. [Google Scholar] [CrossRef]
  41. El-Feky, M.G. Mineralogical, REE-geochemical and fluid inclusion studies on some uranium occurrences, Gabal Gattar, Northeastern Desert, Egypt. Chin. J. Geochem. 2011, 30, 430–443. [Google Scholar] [CrossRef]
  42. El Mezayen, A.M.; Ibrahim, E.M.; El-Feky, M.G.; Omar, S.M.; El-Shabasy, A.M.; Taalab, S.A. Physico-chemical conditions controlling the radionuclides mobilisation in various granitic environments. Int. J. Environ. Anal. Chem. 2022, 102, 970–986. [Google Scholar] [CrossRef]
  43. El-Fekya, M.G.; Mohammed, H.S.; El-Shabasy, A.M.; Ahmed, M.R.; Abdel-Monem, Y.K.; Mira, H.I. Mobilisation of radionuclides during uranium and gold processing of granitic rock at El-Missikate area, central Eastern Desert, Egypt. Int. J. Environ. Anal. Chem. 2021, 1–14. [Google Scholar] [CrossRef]
  44. Wignall, P.B.; Myers, K.J. Interpreting benthic oxygen levels in mudrocks: A new approach. Geology 1988, 16, 452–455. [Google Scholar] [CrossRef]
  45. Hussein, H.A.; Abdel-Monem, A.A.; Mahdy, M.A.; El-Aassy, I.E.; Dabbour, G.A. On the genesis of surficial uranium occurrences in West Central Sinai, Egypt. Ore Geol. Rev. 1992, 7, 125–134. [Google Scholar] [CrossRef]
  46. El Feky, M.G.; El Mowafy, A.A.; Abdel, A.W. Mineralogy, geochemistry, radioactivity and environmental impacts of Gabal Marwa granites, southeastern Sinai, Egypt. Chin. J. Geochem. 2011, 30, 175–186. [Google Scholar] [CrossRef]
  47. Abdel Gawad, A.E.; Ibrahim, E.M. Activity ratios as a tool for studying uranium mobility at El Sela shear zone, southeastern Desert, Egypt. J. Radioanal. Nucl. Chem. 2016, 308, 129–142. [Google Scholar] [CrossRef]
  48. Pavlidou, S.; Koroneos, A.; Papastefanou, C. Natural radioactivity of granites used as building materials. J. Environ. Radioact. 2006, 89, 48–60. [Google Scholar] [CrossRef]
  49. Gaafar, I.; Cuney, M.; Gawad, A.A. Mineral Chemistry of Two-Mica Granite Rare Metals: Impact of Geophysics on the Distribution of Uranium Mineralization at. Open J. Geol. 2014, 4, 137–160. [Google Scholar] [CrossRef]
  50. Senthilkumar, G.; Raghu, Y.; Sivakumar, S.; Chandrasekaran, A.; Prem Anand, D.; Ravisankar, R. Natural radioactivity measurement and evaluation of radiological hazards in some commercial flooring materials used in Thiruvannamalai, Tamilnadu, India. J. Radiat. Res. Appl. Sci. 2014, 7, 116–122. [Google Scholar] [CrossRef]
  51. Abbasi, A. Calculation of gamma radiation dose rate and radon concentration due to granites used as building materials in Iran. Radiat. Prot. Dosim. 2013, 155, 335–342. [Google Scholar] [CrossRef]
  52. Sharaf, J.M.; Hamideen, M.S. Measurement of natural radioactivity in Jordanian building materials and their contribution to the public indoor gamma dose rate. Appl. Radiat. Isot. 2013, 80, 61–66. [Google Scholar] [CrossRef]
  53. Akpanowo, M.A.; Umaru, I.; Iyakwari, S.; Joshua, E.O.; Yusuf, S.; Ekong, G.B. Determination of natural radioactivity levels and radiological hazards in environmental samples from artisanal mining sites of Anka, North-West Nigeria. Sci. Afr. 2020, 10, e00561. [Google Scholar] [CrossRef]
  54. Thabayneh, K.M. Measurement of natural radioactivity and radon exhalation rate in granite samples used in palestinian buildings. Arab. J. Sci. Eng. 2013, 38, 201–207. [Google Scholar] [CrossRef]
  55. Guillén, J.; Tejado, J.J.; Baeza, A.; Corbacho, J.A.; Muñoz, J.G. Assessment of radiological hazard of commercial granites from Extremadura (Spain). J. Environ. Radioact. 2014, 132, 81–88. [Google Scholar] [CrossRef] [PubMed]
  56. AlZahrani, J.H.; Alharbi, W.R.; Abbady, A.G.E. Radiological impacts of natural radioactivity and heat generation by radioactive decay of phosphorite deposits from Northwestern Saudi Arabia. Aust. J. Basic Appl. 2011, 5, 683–690. [Google Scholar]
  57. Aykamiş, A.Ş.; Turhan, Ş.; Aysun Ugur, F.; Baykan, U.N.; Kiliç, A.M. Natural radioactivity, radon exhalation rates and indoor radon concentration of some granite samples usedas construction material in Turkey. Radiat. Prot. Dosim. 2013, 157, 105–111. [Google Scholar] [CrossRef] [PubMed]
  58. Amin, R.M. Gamma radiation measurements of naturally occurring radioactive samples from commercial Egyptian granites. Environ. Earth Sci. 2012, 67, 771–775. [Google Scholar] [CrossRef]
  59. Yalcin, F.; Ilbeyli, N.; Demirbilek, M.; Yalcin, M.G.; Gunes, A.; Kaygusuz, A.; Ozmen, S.F. Estimation of natural radionuclides’ concentration of the plutonic rocks in the Sakarya zone, Turkey using multivariate statistical methods. Symmetry 2020, 12, 1048. [Google Scholar] [CrossRef]
  60. Hanfi, M.Y.; Emad, B.M.; Sayyed, M.I.; Khandaker, M.U.; Bradley, D.A. Natural radioactivity in the prospecting tunnel in Egypt: Dose rate and risk assessment. Radiat. Phys. Chem. 2021, 187, 109555. [Google Scholar] [CrossRef]
  61. USEPA EPA. Radiogenic Cancer Risk Models and Projections for the U.S. Population; EPA 402-R-11-001; EPA: Washington, DC, USA, 2011. [Google Scholar]
  62. Ababneh, Z.Q.; Alyassin, A.M.; Aljarrah, K.M.; Ababneh, A.M. Measurement of natural and artificial radioactivity in powdered milk consumed in Jordan and estimates of the corresponding annual effective dose. Radiat. Prot. Dosim. 2009, 138, 278–283. [Google Scholar] [CrossRef]
  63. Abedin, M.J.; Karim, M.R.; Khandaker, M.U.; Kamal, M.; Hossain, S.; Miah, M.H.A.; Bradley, D.A.; Faruque, M.R.I.; Sayyed, M.I. Dispersion of radionuclides from coal-fired brick kilns and concomitant impact on human health and the environment. Radiat. Phys. Chem. 2020, 177, 109165. [Google Scholar] [CrossRef]
  64. Adam, A.M.A.; Eltayeb, M.A.H. Multivariate statistical analysis of radioactive variables in two phosphate ores from Sudan. J. Environ. Radioact. 2012, 107, 23–43. [Google Scholar] [CrossRef]
  65. Tanasković, I.; Golobocanin, D.; Miljević, N. Multivariate statistical analysis of hydrochemical and radiological data of Serbian spa waters. J. Geochem. Explor. 2012, 112, 226–234. [Google Scholar] [CrossRef]
Figure 1. Khour Abalea location map and technological samples.
Minerals 12 00353 g001
Figure 2. A geological map of Khour Abalea area, Southeastern Desert, Egypt [16].
Minerals 12 00353 g002
Figure 3. (a) Binocular microscope images, BSE images and EDX analysis for Uranophane mineral; (b) Kasolite mineral; and (c) Carnotite mineral.
Minerals 12 00353 g003
Figure 4. Correlations between: (a) eTh and eU, (b) eTh/eU and eU, (c) eTh/eU and eTh, (d) K and eTh, (e) K and Eu, (f) eTh/K and eTh/eU, (g) eU/RaeU and eU.
Minerals 12 00353 g004
Figure 5. Radioelements’ distribution maps the accumulation of high concentrations of (a) uranium, eU ppm, (b) thorium, eTh ppm, (c) radium Ra ppm and (d) potassium, K%.
Minerals 12 00353 g005
Figure 6. The histogram frequency distribution of: (a) 226Ra, (b) 232Th and (c) 40K activity concentrations.
Minerals 12 00353 g006
Figure 7. The effective dose rate associated with the particular organs from air dose, indoor and outdoor.
Minerals 12 00353 g007
Figure 8. Principal component analysis for the radionuclides and radiological factors.
Minerals 12 00353 g008
Figure 9. Linkage between different statistical radiological hazard indices among the tested samples.
Minerals 12 00353 g009
Table 1. Results of radionuclide concentrations of some computed ratios for pegmatite samples.
S. No.eU
(ppm)
eTh
(ppm)
Ra
(ppm)
K
(%)
eTh/eUeU/Ra(eU)eTh/KeU-eTh/3.5
12039.004010.001491.004.641.971.37864.22893.29
22366.003916.001509.005.291.661.57740.261247.14
31718.003796.001339.004.552.211.28834.29633.43
42106.003746.001373.003.911.781.53958.061035.71
52244.003821.001439.004.751.701.56804.421152.29
61852.003627.001340.007.041.961.38515.20815.71
71747.003488.001259.005.132.001.39679.92750.43
81968.003729.001356.001.961.891.451902.55902.57
92080.003576.001316.003.801.721.58941.051058.29
102180.003501.001351.001.381.611.612536.961179.71
112379.003870.001481.004.221.631.61917.061273.29
122265.003696.001436.003.771.631.58980.371209.00
132339.003553.001393.005.201.521.68683.271323.86
142560.003751.001464.004.181.471.75897.371488.29
152667.003781.001544.003.981.421.73950.001586.71
16426.00629.00512.007.151.480.8387.97246.29
17419.00579.00594.008.661.380.7166.86253.57
18404.00628.00541.005.041.550.75124.60224.57
19342.00570.00508.006.711.670.6784.95179.14
20326.00562.00495.009.121.720.6661.62165.43
Min326.00562.00495.001.381.380.6661.62165.43
Max2667.004010.001544.009.122.211.752536.961586.71
Mean1700.912881.861171.825.041.711.32828.62880.49
Table 2. Activity concentrations of radionuclides in Bq kg−1 and the computed environmental parameters in the pegmatite of Khour Abalea area.
Samples226Ra232Th40KRaeqHinHexDairAEDoutAEDinAGDE
(mSv)
ELCR
×10−3
(nGy/h)(mSv)(mSv)
P116,55016,200145239,82915210817,49121.58611975
P216,75015,821165639,50115210717,36221.38511875
P314,86315,336142436,90314010016,18819.97911069
P415,24015,134122436,97614110016,23219.98011170
P515,97315,437148738,16214610316,76420.68211472
P614,87414,653220435,9981379715,81319.47810868
P713,97514,092160634,2491309315,03418.47410365
P815,05215,06561336,6421409916,07819.77911069
P914,60814,447118935,3581359615,52319.07610667
P1014,99614,14443235,2551369515,48919.07610666
P1116,43915,635132138,89915010517,09221.08411773
P1215,94014,932118037,38314410116,43120.28111271
P1315,46214,354162836,1141399815,88019.57810868
P1416,25015,154130838,02114710316,71420.58211472
P1517,13815,275124639,07815210617,19521.18411774
P165683254122389489412642525.2212918
P1765932339271110,147452745705.6223120
P186005253715789755432643715.4213019
P195639230321009094402540825.0202818
P205495227028558961392440274.9202717
Min.549522704328961392440274.9202717
Max17,13816,2002854.5639,82915210817,49121.58611975
Average13,17611,883157330,2911178213,33016.3659157
SD4394564460712,407453454106.6273723
Table 3. Statistics of the data corresponding to the activity of radionuclides.
226Ra232Th40K
N202020
Mean13,17611,8831573
SD43945644607
Min54952270432
Max17,13816,2002855
Skewness−1.14−1.220.44
Kurtosis−0.57−0.520.42
CV, %334739
GM12,20894981448
Table 4. Results of the Kolmogorov-Smirnov test for normality.
RadionuclideKS *
DFStatisticp
226Ra200.330.02
232Th200.400.00
40K200.200.38
* Lilliefors significance correction.
Table 5. Comparison of 226Ra, 232Th and 40K activity concentration in the pegmatites samples in Khour Abalea area with numerous studies from the literature from different countries around the world.
Country226Ra232Th40KReferences
Greek7485881[24]
India25.8842.82560.6[50]
Iran77.444.51017.2[51]
Jordan41.558.4897[52]
Nigeria63.29226.6832.5[53]
Palestine7182780[54]
Spain84421138[55]
Saudi Arabia28.834.8665.08[56]
Turkey80101974[57]
Egypt137821082[58]
Egypt13,17611,8831573Present study
Table 6. The Pearson correlation matrix (PCM) of the radionuclides 226Ra, 232Th, 40K concentrations and the radiological hazard indices.
226Ra232Th40KRaeqHinHexDairAEDoutAEDinAGDEELCR
226Ra1
232Th0.991
40K−0.69−0.701
Raeq0.990.99−0.691
Hin0.990.99−0.690.991
Hex0.990.99−0.690.990.991
Dair0.990.99−0.690.990.990.991
AEDout0.990.99−0.690.990.990.990.991
AEDin0.990.99−0.690.990.990.990.990.991
ELCR0.990.99−0.690.990.990.990.990.990.991
AGDE0.990.99−0.690.990.990.990.990.990.990.991
Publisher’s Note: MDPI stays neutral with regard to jurisdictional claims in published maps and institutional affiliations.

