
Mineralogical Fingerprint of Iron Ore Tailings in Paraopeba River Bedload Sediments after the B1 Dam Failure in Brumadinho, MG (Brazil)

 ,
, 
Abstract
:1. Introduction
2. Study Area
3. Materials and Methods
3.1. Sampling
3.2. Analytical Procedures
3.2.1. Macroscopic Description
3.2.2. Sampling and Physicochemical Characterization
3.2.3. Mineralogy
4. Results
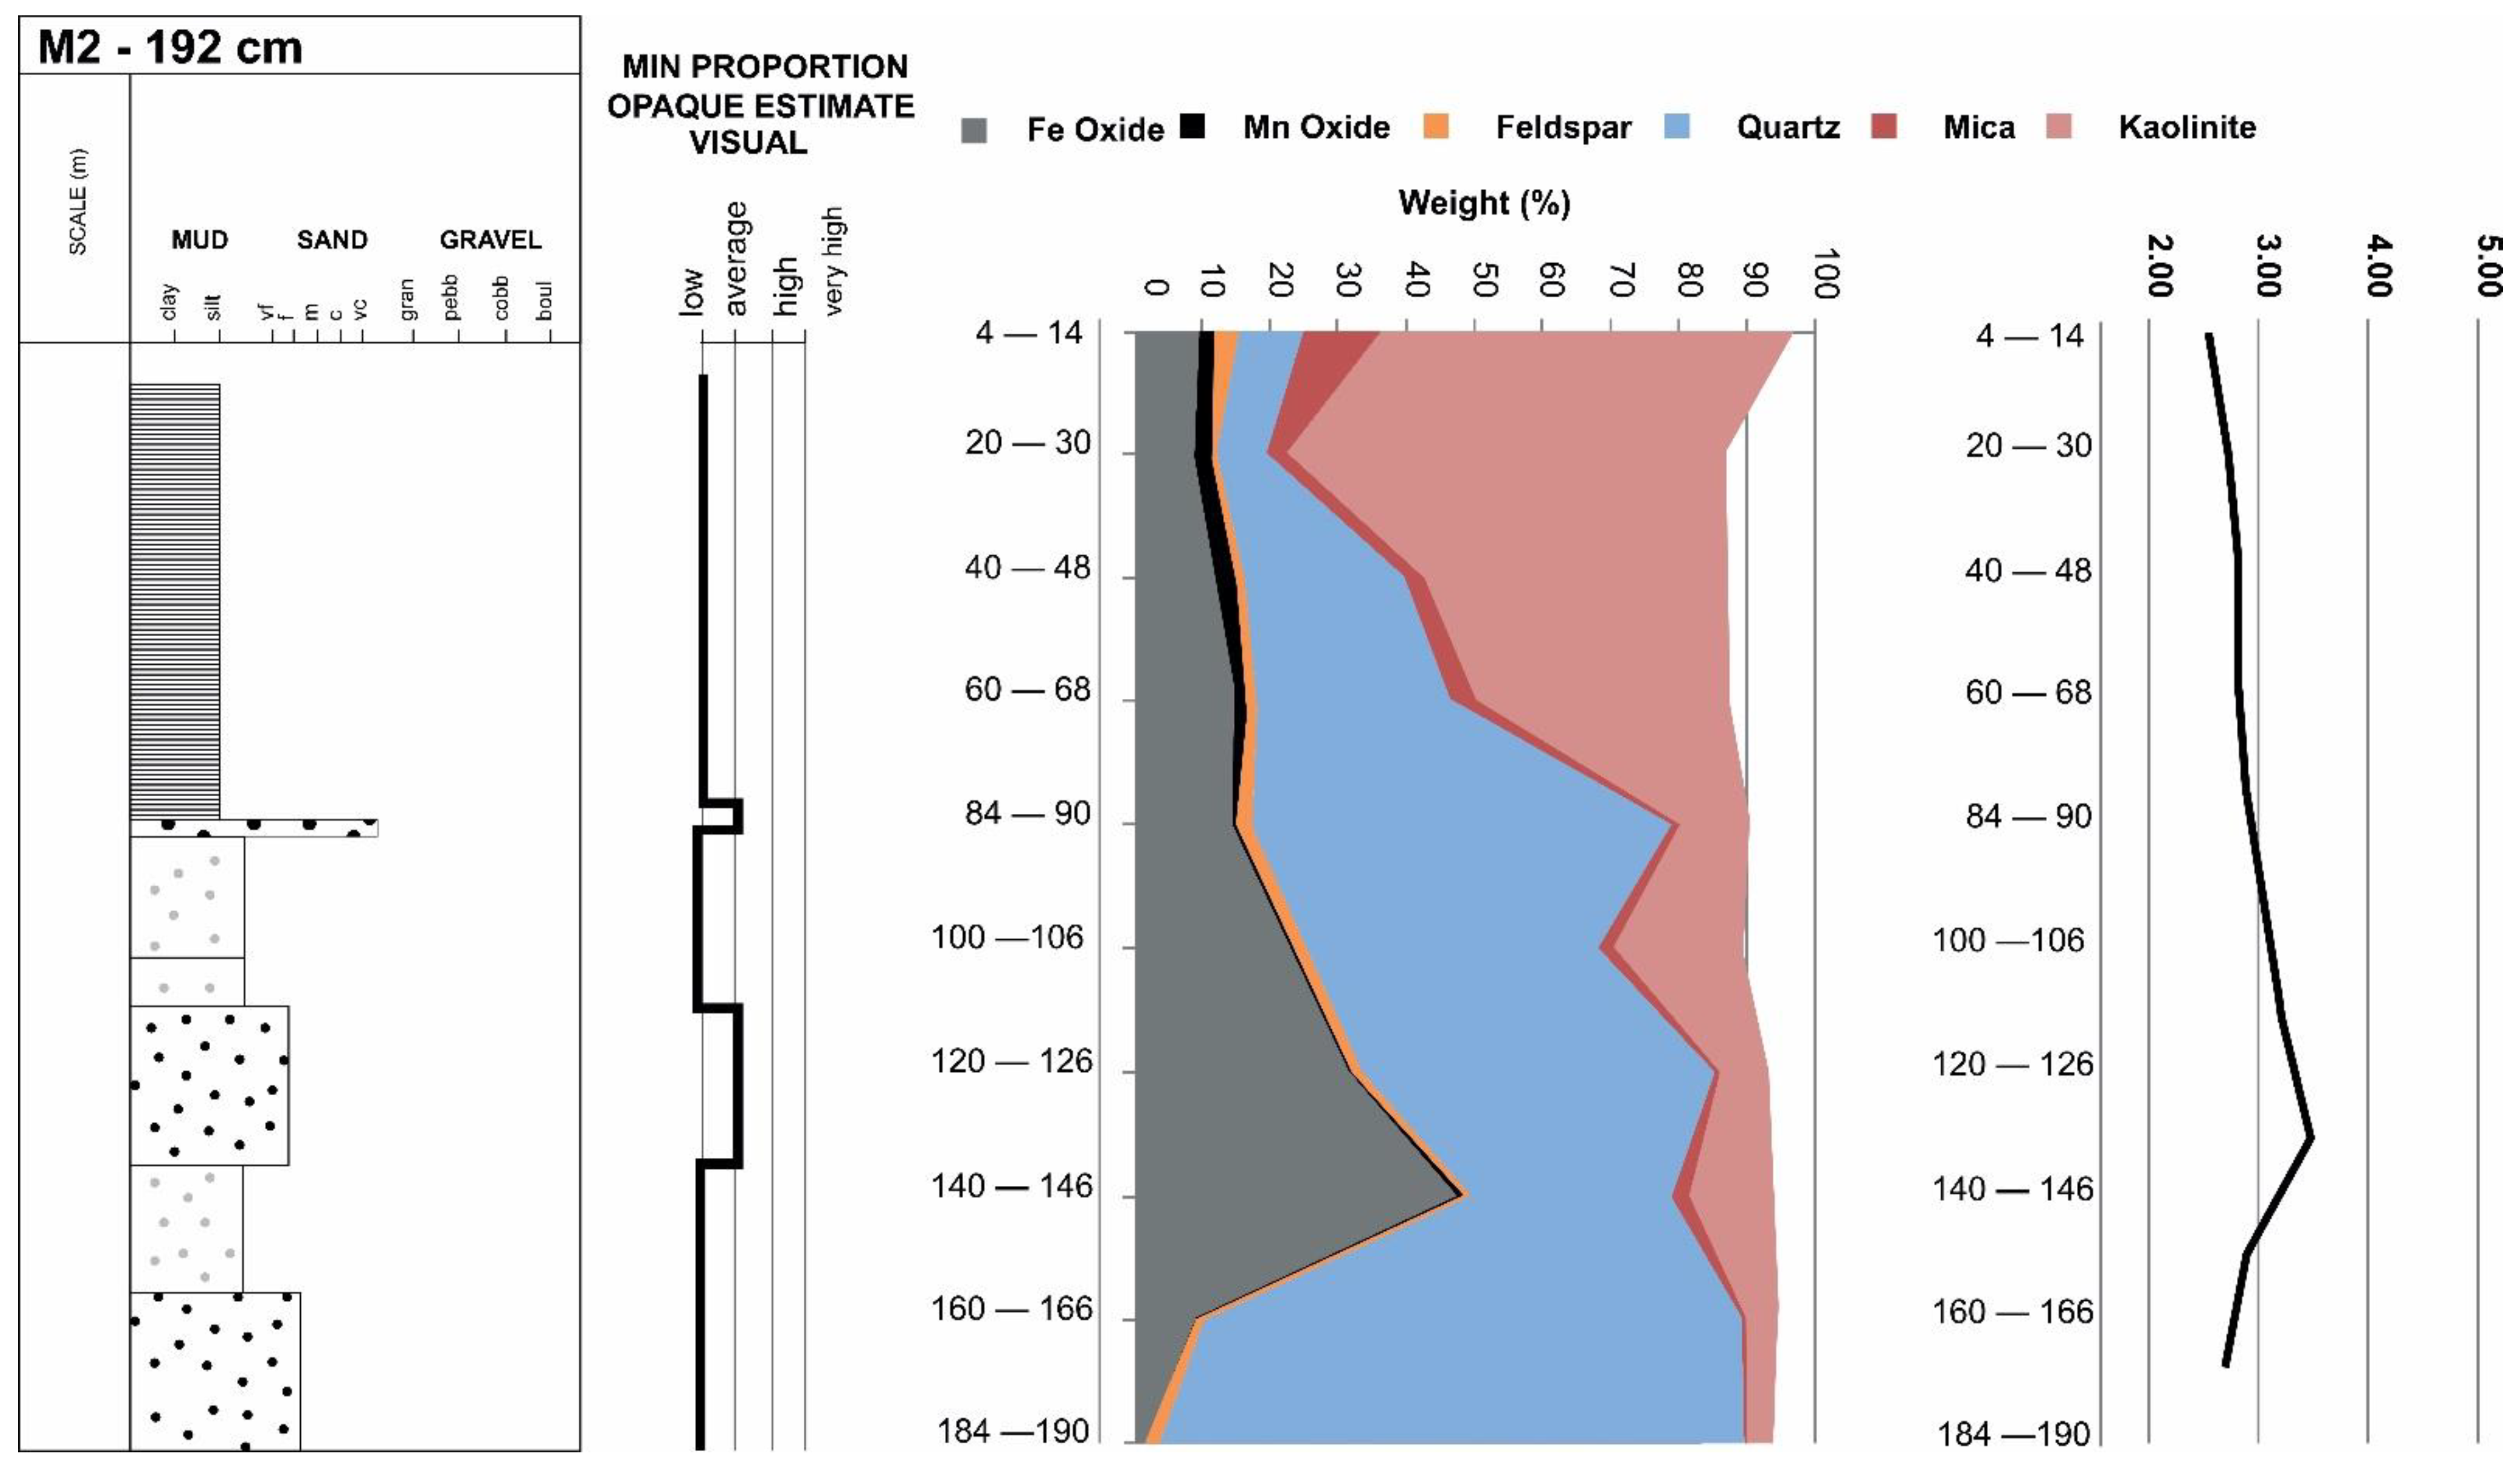
4.1. M2
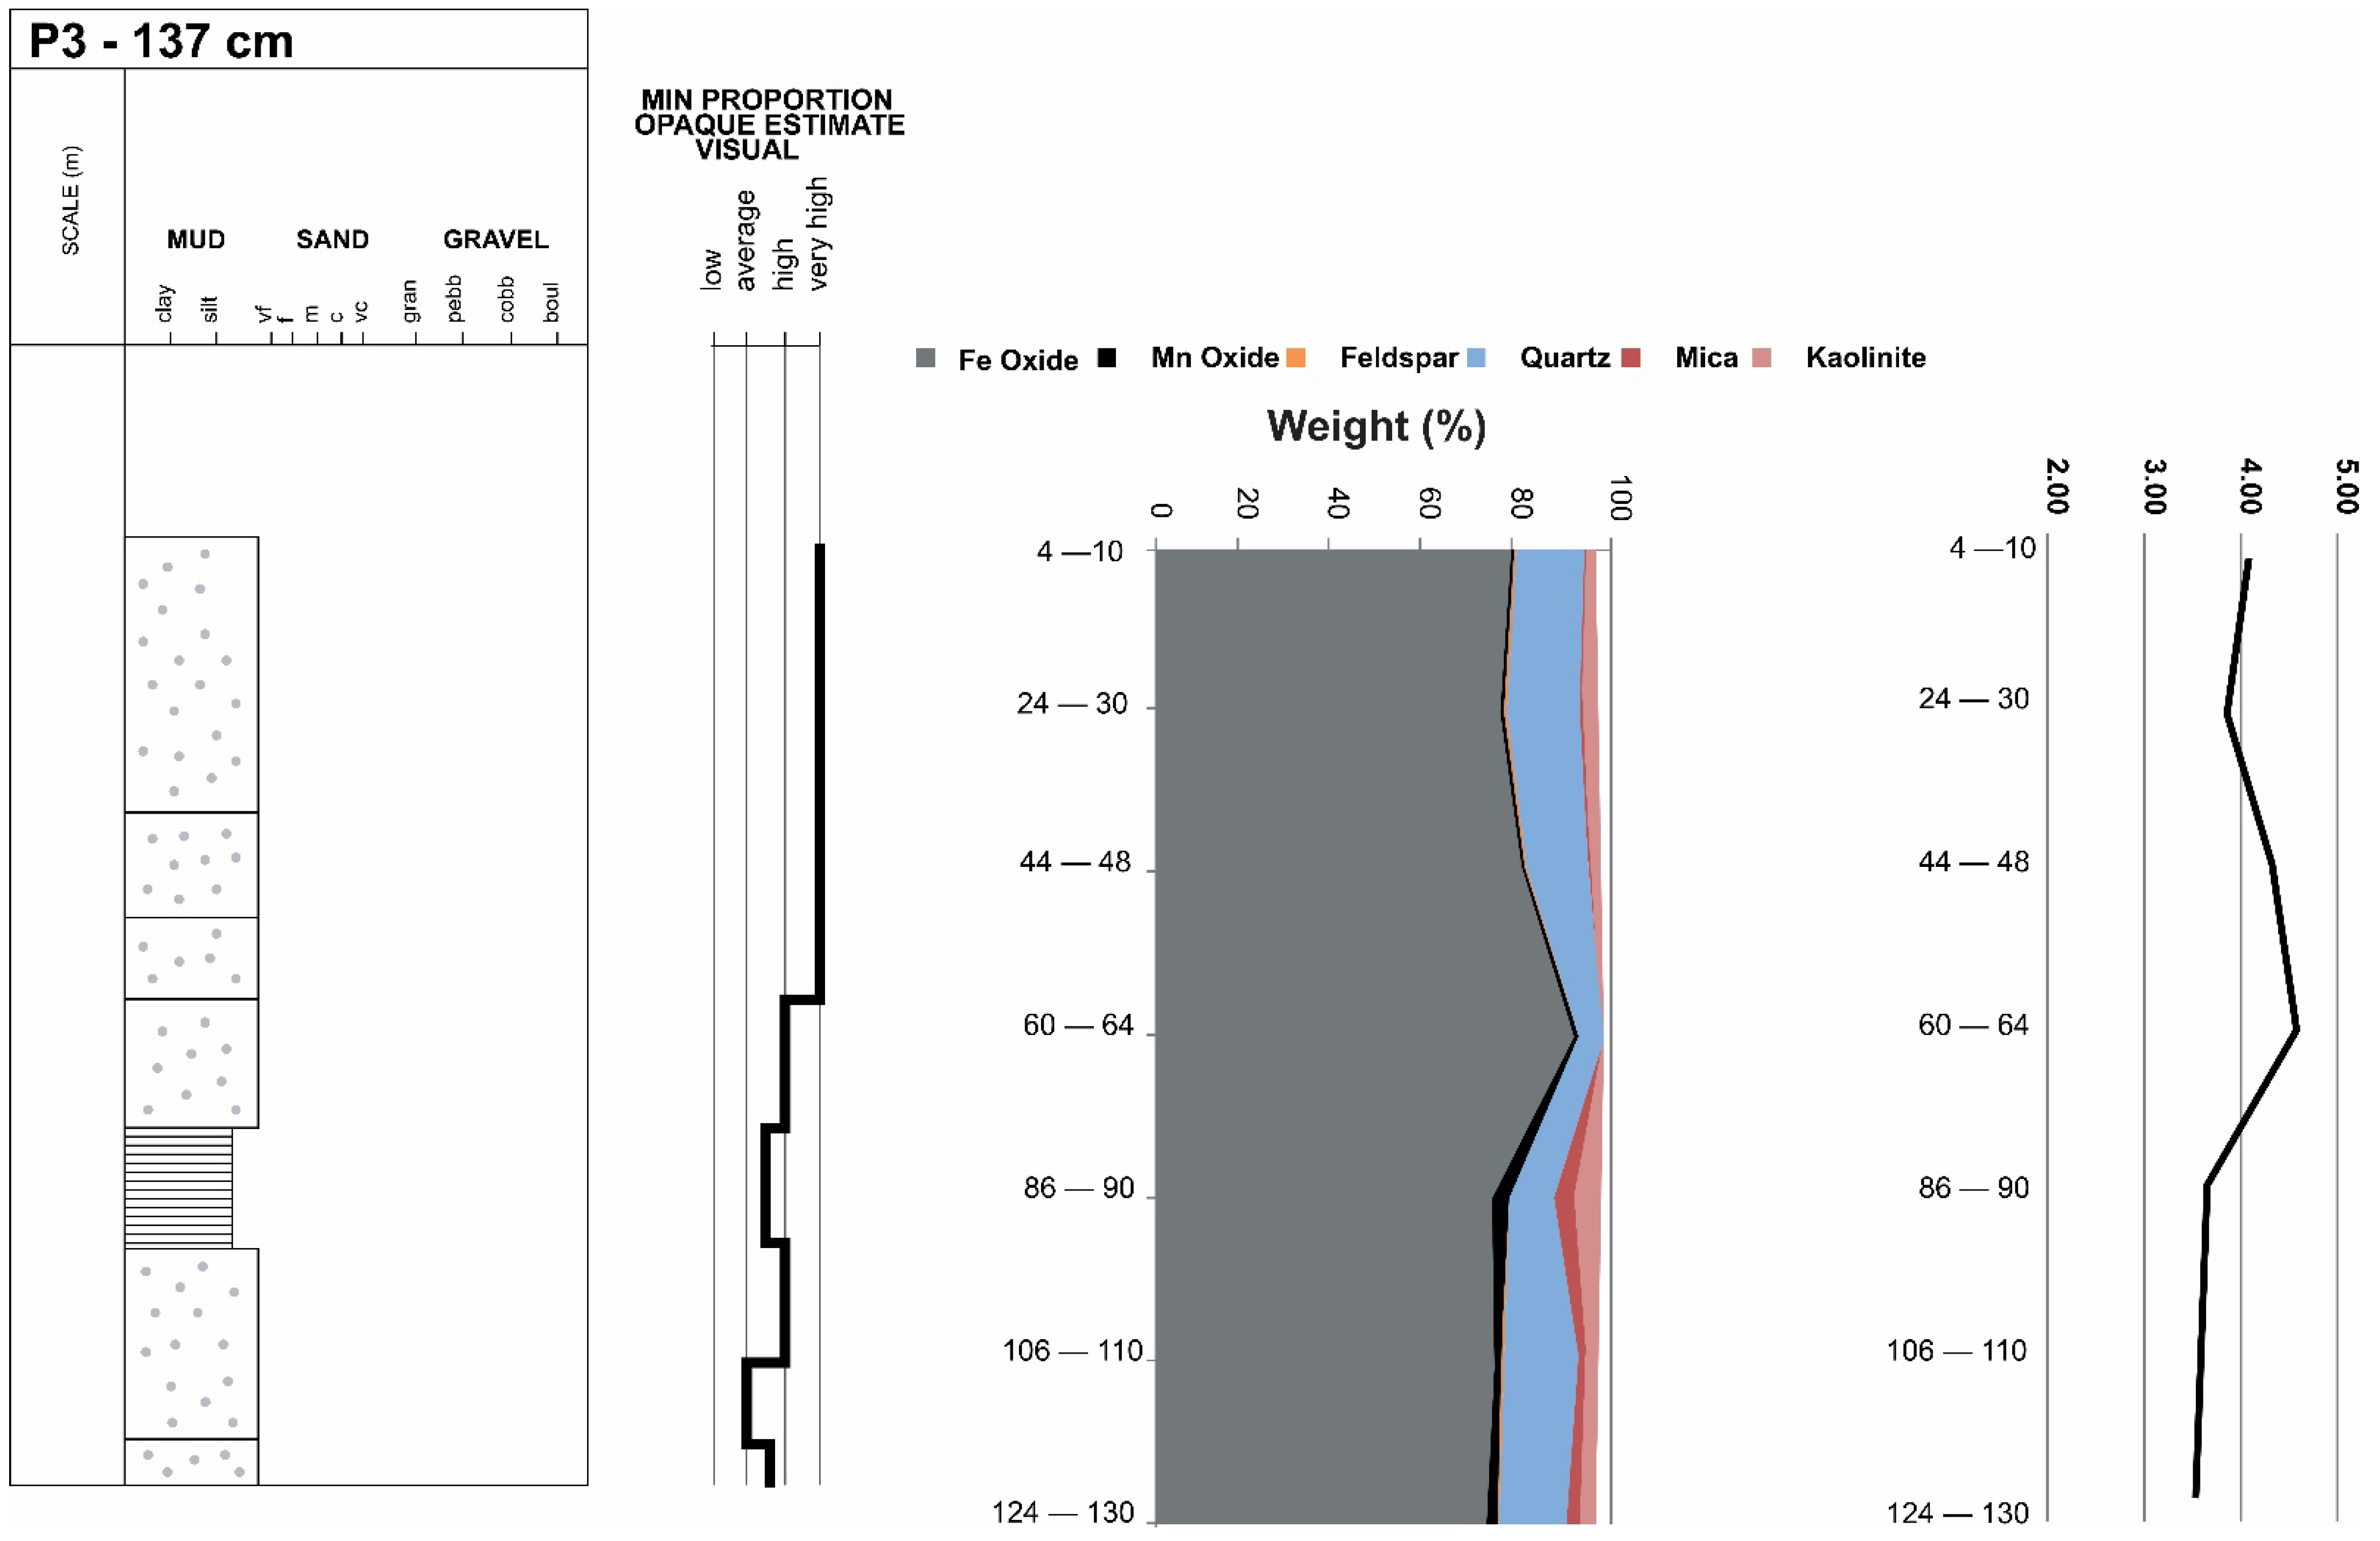
4.2. P3
4.3. P8
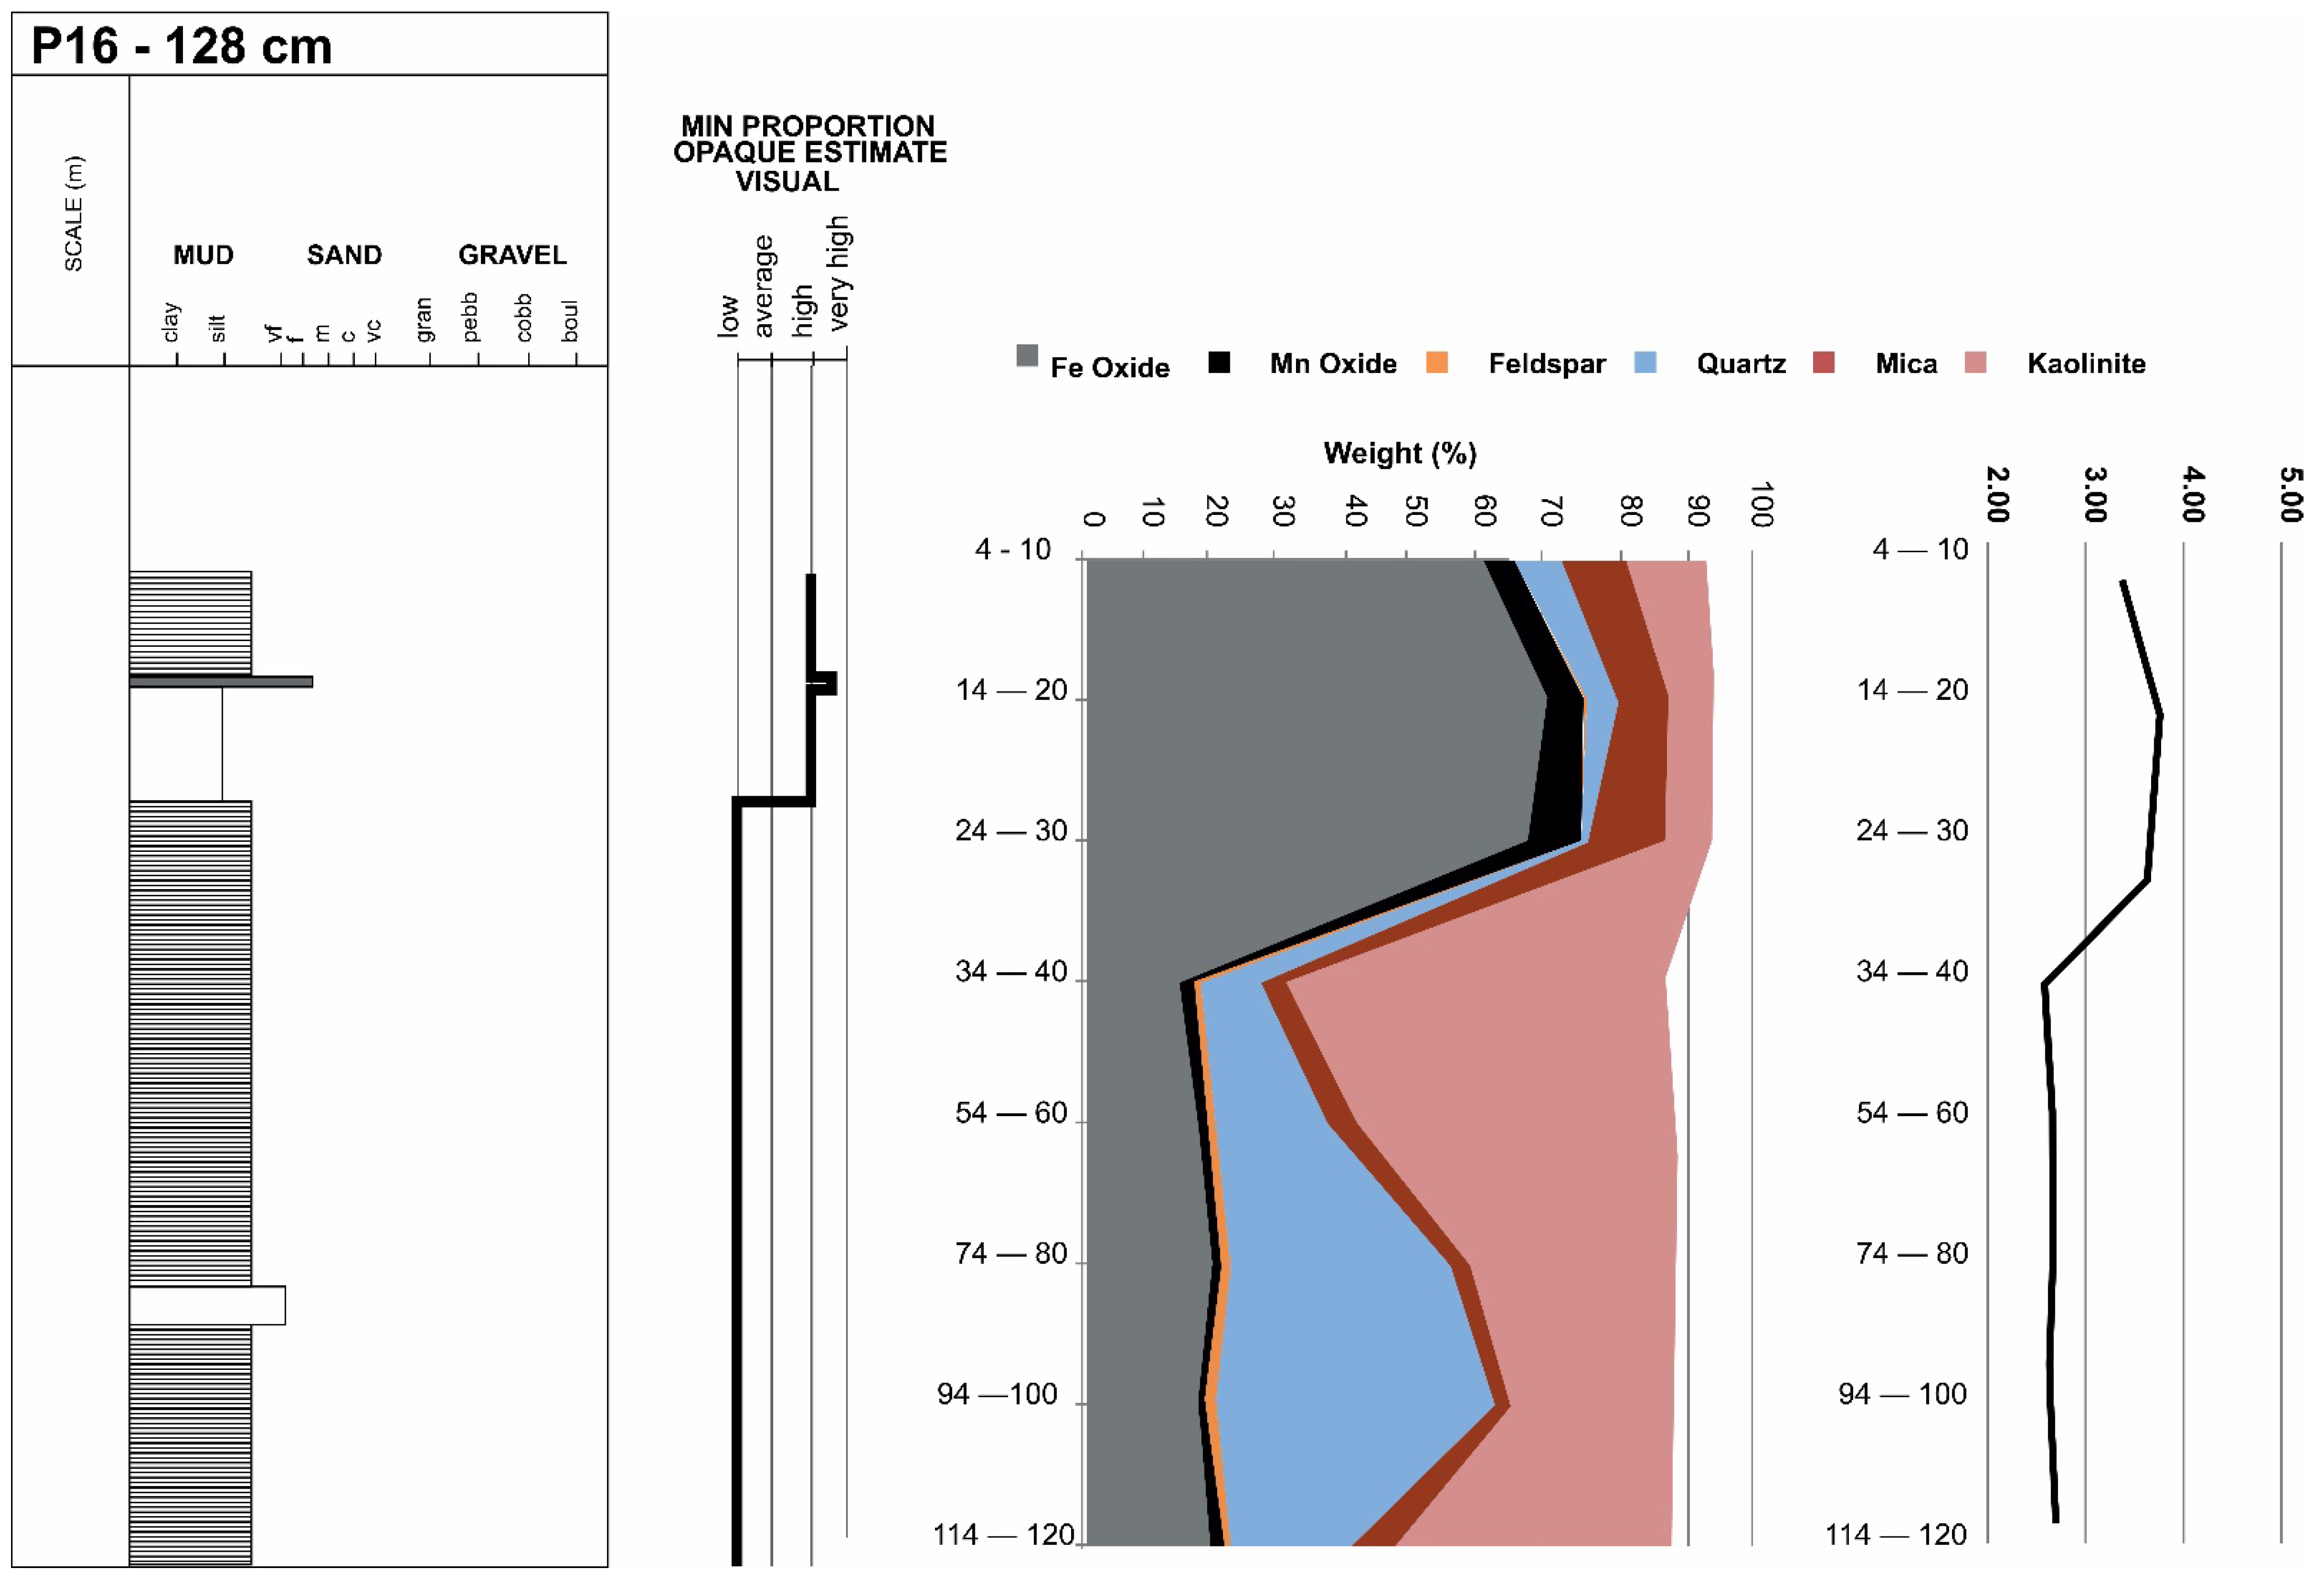
4.4. P16
4.5. P19
4.6. P22
4.7. Mineralogical Data
5. Discussion and Interpretations
6. Conclusions
Author Contributions
Funding
Data Availability Statement
Acknowledgments
Conflicts of Interest
References
- Protasio, F.N.M.; Ribeiro de Avillez, R.; Letichevsky, S.; De Adreade Silva, F. The use of iron ore tailings obtained from Germano dam in the production of a sustainable concrete. J. Clean. Prod. 2021, 278, 123929. [Google Scholar] [CrossRef]
- Diehl, P. Wise Uranium Project. Tailings Dam Safety. 2019. Available online: http://www.wise-uranium.org/mdaf.html (accessed on 10 December 2021).
- Armstrong, M.; Petter, R.; Petter, C. Why have so many tailings dams failed in recent years? Resour. Policy 2019, 63, 101412. [Google Scholar] [CrossRef]
- Lumbroso, D.; McElroy, C.; Goff, C.; Collell, M.R.; Petkovsek, G.; Wetton, M. The potential to reduce the risks posed by tailings dams using satellite-based information. Int. J. Disaster Risk Reduct. 2019, 38, 101209. [Google Scholar] [CrossRef]
- Liu, J.; Li, Y.; Zhang, B.; Cao, J.; Cao, Z.; Domagalski, J. Ecological risk of heavy metals in sediments of the Luan River source water. Ecotoxicology 2009, 18, 748–758. [Google Scholar] [CrossRef]
- Orlando, M.T.D.; Rangel, C.V.G.T.; Galvao, E.S.; Orlando, C.G.P.; Bastos, A.C.; Quaresma, V.S. Characterization of Sediments from the Fundao Dam Failure. In Proceedings of the 9th Workshop of Crystallography Applied to Materials Science and Engineering, Guarapari, Brazil, 10 May 2019; Blucher: Sao Paulo, Brazil, 2019; pp. 1–6. [Google Scholar] [CrossRef] [Green Version]
- Tamim, U.; Khan, R.; Jolly, Y.N.; Das, K.F.S.; Naher, K.; Islam, M.A.; Islam, S.M.A.; Hossain, S.M. Elemental distribution of metals in urban river sediments near an industrial effluent source. Chemosphere 2016, 155, 509–518. [Google Scholar] [CrossRef]
- Kruopiene, J. Distribution of heavy metals in sediments of the Nemunas River (Lithuania). Pol. J. Environ. Stud. 2007, 16, 715–722. [Google Scholar]
- Ferreira, A.; Inácio, M.; Morgado, P.; Batista, M.; Pereira, V.; Pinto, M. Low-density geochemical mapping in Portugal. Appl. Geochem. 2001, 16, 1323–1331. [Google Scholar] [CrossRef]
- Casas, J.M.; Rosas, H.; Solé, M.; Lao, C. Heavy metals and metalloids in sediments from the Llobregat basin, Spain. Environ. Geol. 2003, 44, 325–332. [Google Scholar]
- Çevik, F.; Göksu, M.; Derici, O.; Fındık, Ö. An assessment of metal pollution in surface sediments of Seyhan dam by using enrichment factor, geoaccumulation index and statistical analyses. Environ. Monit. Assess. 2009, 152, 309–317. [Google Scholar] [CrossRef]
- Jahan, S.; Strezov, V. Assessment of trace elements pollution in sea ports of New South Wales (NSW), Australia using macrophytobenthic plant Ecklonia radiata as a bio-indicator. Chemosphere 2019, 218, 643–651. [Google Scholar] [CrossRef]
- Leão, L.P.; da Costa, R.d.V.F.; Leite, M.G.P.; Nalini Júnior, H.A.; Fonseca, R.M.F. Distribution and Assessment of Trace Elements Contamination in Sediments of Conceição River Basin, Brazil. Geosciences 2021, 11, 236. [Google Scholar] [CrossRef]
- Matschullat, J.; Ottenstein, R.; Reimann, C. Geochemical background—Can we calculate it? Environ. Geol. 2000, 39, 990–1000. [Google Scholar] [CrossRef]
- Leão, L.P.; De Vicq, R.; Nalini Jr, H.A.; Leite, M.G.P. Mapeamento Geoquímico do Manganês e Avaliação da Qualidade de Sedimentos Fluviais e Águas Superficiais do Quadrilátero Ferrífero, Brasil. Anuário Inst. Geociências-UFRJ 2019, 42, 444–455. [Google Scholar] [CrossRef]
- TEC3—Geotecnia e Recursos Hídricos. Estudo Conceitual Mina Córrego do Feijão: Estimativa do Volume de Rejeitos Depositado em Trechos do Rio Paraopeba em Decorrência do Rompimento da Barragem B-I; Relatório Técnico T19098-026-RE–Rev. 1; TEC3—Geotecnia e Recursos Hídricos: Belo Horizonte, Brazil, 2020. [Google Scholar]
- Thompson, F.; de Oliveira, B.C.; Cordeiro, M.C.; Masi, B.P.; Rangel, T.P.; Paz, P.; Freitas, T.; Lopes, G.; Silva, B.S.; Cabral, A.S.; et al. Severe impacts of the Brumadinho dam failure (Minas Gerais, Brazil) on the water quality of the Paraopeba River. Sci. Total Environ. 2020, 705, 135914. [Google Scholar] [CrossRef]
- Vergilio, C.D.S.; Lacerda, D.; Oliveira, B.C.V.D.; Sartori, E.; Campos, G.M.; Pereira, A.L.D.S.; Aguiar, D.B.D.; Souza, T.D.S.; Almeida, M.G.D.; Thompson, F.; et al. Metal concentrations and biological effects from one of the largest mining disasters in the world (Brumadinho, Minas Gerais, Brazil). Sci. Rep. 2020, 10, 5936. [Google Scholar] [CrossRef]
- Pacheco, F.A.L.; do Valle Junior, R.F.; de Melo Silva, M.M.A.P.; Pissarra, T.C.T.; Carvalho de Melo, M.; Valera, C.A.; Sanches Fernandes, L.F. Prognosis of metal concentrations in sediments and water of Paraopeba River following the collapse of B1 tailings dam in Brumadinho (Minas Gerais, Brazil). Sci. Total Environ. 2021, 24, 151–157. [Google Scholar] [CrossRef]
- da Silva Souza, T.; Barone, L.D.S.F.; Lacerda, D.; dos Santos Vergilio, C.; de Oliveira, B.C.V.; de Almeida, M.G.; de Rezende, C.E. Cytogenotoxicity of the water and sediment of the Paraopeba River immediately after the iron ore mining dam disaster (Brumadinho, Minas Gerais, Brazil). Sci. Total Environ. 2021, 775, 145–193. [Google Scholar] [CrossRef]
- Parente, C.E.T.; Lino, A.S.; Carvalho, G.O.; Pizzochero, A.C.; Azevedo-Silva, C.E.; Freitas, M.O.; Teixeira, C.; Moura, R.L.; Ferreira Filho, V.J.M.; Malm, O. First year after the Brumadinho tailings’ dam collapse: Spatial and seasonal variation of trace elements in sediments, fishes and macrophytes from the Paraopeba River, Brazil. Environ. Res. 2021, 193, 110526. [Google Scholar] [CrossRef]
- Matos, F.; Dias, R. Water resources management in the state of Minas Gerais and the situation of the Paraopeba river basin. Gest. Reg. 2012, 28, 21–34. (In Portuguese) [Google Scholar]
- Comitê da Bacia Hidrográfica do Rio São Francisco (CBHSF). Available online: https://cbhsaofrancisco.org.br (accessed on 9 December 2021).
- Durães, M.F.; de Mello, C.R.; Beskow, S. Estresse hidrológico: Aplicação às bacias dos rios Paraopeba e Sapucaí, Minas Gerais. Rev. Bras. Recur. Hídricos 2015, 20, 352–359. [Google Scholar] [CrossRef]
- Schvartzman, A.S.; Nascimento, N.D.O.; von Sperling, M. Outorga e cobrança pelo uso de recursos hídricos: Aplicação à bacia do rio Paraopeba, MG. Rev. Bras. Recur. Hídricos 2002, 7, 103–122. [Google Scholar] [CrossRef]
- do Brasil, C.S.G. Monitoramento Especial da Bacia do Rio Paraopeba-Relatório IV; CPRM: Belo Horizonte, Brazil, 2019. Available online: http://www.cprm.gov.br/sace/conteudo/paraopeba/RT_01_2019_PARAOPEBA.pdf (accessed on 9 December 2021).
- Baltazar, O.F.; Zucchetti, M. Lithofacies associations and structural evolution of the Archean Rio das Velhas greenstone belt, Quadrilátero Ferrífero, Brazil: A review of the setting of gold deposits. Ore Geol. Rev. 2007, 32, 471–499. [Google Scholar] [CrossRef]
- Rosière, C.A.; Spier, C.A.; Rios, F.J.; Suckau, V.E. The itabirites of the Quadrilátero Ferrífero and related high-grade iron ore deposits: An overview. Rev. Econ. Geol. 2008, 15, 223–254. [Google Scholar]
- Babinski, M.; Chemale, F., Jr.; Van Schmus, W.R. The Pb/Pb age of the Minas Supergroup carbonate rocks, Quadrilátero Ferríffero, Brazil. Precambrian Res. 1995, 72, 235–245. [Google Scholar] [CrossRef]
- Machado, N.; Schrank, A.; Noce, C.M.; Gauthier, G. Ages of detrital zircon from Archean-Paleoproterozoic sequences: Implications for Greenstone Belt setting and evolution of a Transamazonian foreland basin in Quadrilitero Ferrifero, southeast Brazil. Earth Planet. Sci. Lett. 1996, 141, 259–276. [Google Scholar] [CrossRef]
- Spier, C.A.; de Oliveira, S.M.B.; Sial, A.N.; Rios, F.J. Geochemistry and genesis of the banded iron formations of the Cauê Formation, Quadrilátero Ferrífero, Minas Gerais, Brazil. Precambrian Res. 2007, 152, 170–206. [Google Scholar] [CrossRef]
- Lobato, L.M.; Ribeiro-Rodrigues, L.C.; Zucchetti, M.; Noce, C.M.; Baltazar, O.F.; Silva, L.C.; Pinto, C.P. Brazil's premier gold province: Part I. The tectonic, magmatic, and structural setting of the Archean Rio das Velhas greenstone belt, Quadrilátero Ferrífero. Miner. Depos. 2001, 36, 228–248. [Google Scholar] [CrossRef]
- Lopes, F.A.; Lana, C.E.; Castro, P.T.A. Sedimentologia e geocronologia aplicadas a investigação da influência da mineração de ferro no assoreamento de afluentes do rio Paraopeba, oeste do quadrilátero ferrífero, MG, Brasil. Anuário IGEO 2019, 42, 149–158. [Google Scholar] [CrossRef]
- Companhia de Pesquisa de Recursos Minerias—CPRM. Boletins de Monitoramento—Bacia do Rio Paraopeba. Available online: http://www.cprm.gov.br/sace/index_rio_paraopeba.php (accessed on 10 December 2021).
- Vicq, R.; Matschullat, J.; Leite, M.G.P.; Nalini Jr, H.A.; Mendonça, F.P.C. Iron Quadrangle stream sediments, Brazil: Geochemical maps and reference values. Environ. Earth Sci. 2015, 7, 25–35. [Google Scholar] [CrossRef]
- Gomes, M.A. Caracterização Tecnológica no Aproveitamento do Rejeito de Minério de Ferro. Master’s Thesis, Mineral Engineering Department, Federal University of Ouro Preto, Ouro Preto, Brazil, 2009. [Google Scholar]
- Companhia Ambiental do Estado de São Paulo. Guia Nacional de Coleta e Preservação de Amostras: Água, Sedimento, Comunidades Aquáticas e Efluentes Líquidos; Companhia Ambiental do Estado de São Paulo: São Paulo, Brazil, 2011; p. 325.
- Switzer, A.D. Measuring and Analyzing Particle Size in a Geomorphic Context; Academic Press: San Diego, CA, USA, 2013; Volume 14, pp. 224–242. [Google Scholar]
- Wentworth, C.K. A scale of grade and class terms for clastic sediments. J. Geol. 1922, 30, 377–392. [Google Scholar] [CrossRef]
- Powers, M.C. A new roundness scale for sedimentary particles. J. Sediment. Res. 1953, 23, 117–119. [Google Scholar] [CrossRef]
- Harrel, J. A visual comparator for degree of sorting in thin and plane sections. J. Sediment. Res. 1984, 54, 646–650. [Google Scholar] [CrossRef]
- Terry, R.D.; Chilingar, G.V. Summary of “Concerning some additional aids in studying sedimentary formations,” by M. S. Shvetsov. J. Sediment. Res. 1955, 25, 229–234. [Google Scholar] [CrossRef]
- Kwitko-Ribeiro, R. New sample preparation developments to minimize mineral segregation in process mineralogy. In Proceedings of the 10th International Congress for Applied Mineralogy (ICAM), Trondheim, Norway, 1–5 August 2011; Broekmans, M.A.T.M., Ed.; Springer: Berlin, Heidelberg, 2012; pp. 411–417. [Google Scholar] [CrossRef]
- de Lima, R.E.; de Lima, P.J.; da Silva, A.F.; Acordes, F. An anthropogenic flow type gravitational mass movement: The Córrego do Feijão tailings dam disaster, Brumadinho, Brazil. Landslides 2020, 17, 2895–2906. [Google Scholar] [CrossRef]
- Vicq, R.; Matschullat, J.; Leite, M.G.P.; Nalini, H.A., Jr.; Leão, L.P. Geochemical mapping of potentially hazardous elements in surface waters and stream sediments of the Quadrilátero Ferrífero, Brazil. Geochim. Bras. 2018, 32, 243–267. [Google Scholar]
- Larizzatti, J.H.; Marques, E.D.; Silveira, F.V. Mapeamento Geoquímico do Quadrilátero Ferrífero e seu Entorno—MG; CPRM–Geological Survey of Brazil: Brasilia, Brazil, 2014; p. 208.


Publisher’s Note: MDPI stays neutral with regard to jurisdictional claims in published maps and institutional affiliations. |
© 2022 by the authors. Licensee MDPI, Basel, Switzerland. This article is an open access article distributed under the terms and conditions of the Creative Commons Attribution (CC BY) license (https://creativecommons.org/licenses/by/4.0/).
Share and Cite
Laureano, F.V.; Kwitko-Ribeiro, R.; Guimarães, L.; Leão, L.P. Mineralogical Fingerprint of Iron Ore Tailings in Paraopeba River Bedload Sediments after the B1 Dam Failure in Brumadinho, MG (Brazil). Minerals 2022, 12, 716. https://0-doi-org.brum.beds.ac.uk/10.3390/min12060716
Laureano FV, Kwitko-Ribeiro R, Guimarães L, Leão LP. Mineralogical Fingerprint of Iron Ore Tailings in Paraopeba River Bedload Sediments after the B1 Dam Failure in Brumadinho, MG (Brazil). Minerals. 2022; 12(6):716. https://0-doi-org.brum.beds.ac.uk/10.3390/min12060716
Chicago/Turabian StyleLaureano, Fernando Verassani, Rogerio Kwitko-Ribeiro, Lorena Guimarães, and Lucas Pereira Leão. 2022. "Mineralogical Fingerprint of Iron Ore Tailings in Paraopeba River Bedload Sediments after the B1 Dam Failure in Brumadinho, MG (Brazil)" Minerals 12, no. 6: 716. https://0-doi-org.brum.beds.ac.uk/10.3390/min12060716