
Reduction of Acid Iron Ore Pellets under Simulated Wall and Center Conditions in a Blast Furnace Shaft


1
Process Metallurgy Research Unit, University of Oulu, P.O. Box 4300, FI-90014 Oulu, Finland
2
VDEh-Betriebsforschungsinstitut GmbH, Sohnstraße 69, DE-40237 Düsseldorf, Germany
*
Author to whom correspondence should be addressed.
Minerals 2022, 12(6), 741; https://0-doi-org.brum.beds.ac.uk/10.3390/min12060741
Submission received: 10 May 2022
/
Revised: 1 June 2022
/
Accepted: 6 June 2022
/
Published: 10 June 2022
(This article belongs to the Special Issue Iron Ore Reactions and Phenomena in a Blast Furnace)
Abstract
:The operational conditions, including temperature and gas composition, vary along the radial position in a blast furnace. Nevertheless, very few studies can be found in the literature that discuss how the reduction behavior of the ferrous burden varies along the radial position. In this study, the effect of the radial charging position on the reducibility of acid iron ore pellets was investigated using a laboratory-scale, high-temperature furnace in CO-CO2-N2 and CO-CO2-H2-H2O-N2 atmospheres up to 1100 °C. The experimental conditions were accumulated based on earlier measurements from a multi-point vertical probing campaign that was performed for a center-working European blast furnace. The main finding of this study is that the pellet reduction proceeded faster under simulated blast furnace conditions resembling those in the center area, compared to the wall area, because of a higher share of CO and H2 in the gas. Therefore, the pellet charging position affects its reduction path in a blast furnace. Additionally, it was shown that the presence of H2 and H2O in the reducing gas enhanced the progress of reduction reactions significantly and enhanced the formation of cracks slightly, both of which are desirable in blast furnace operation. The reducibility data attained in this study are important in understanding how temperature and gas composition is connected to the reduction degree under realistic process conditions.
Keywords:
blast furnace; center; hydrogen; ironmaking; iron ore; multi-point vertical probe; pellet; reduction; wall1. Introduction
A blast furnace (BF) is still the dominant process for making iron in the world. According to the World Steel Association [1], 73.2% of global crude steel was produced via the blast furnace–oxygen steelmaking route in 2020. However, a future megatrend will be the reduction of CO2 emissions in steelmaking [2]. For example, the European Green Deal has announced the goal of supporting breakthrough technologies for zero-carbon steelmaking by 2030 and of a carbon neutral society by 2050 [3]. Hydrogen has shown a great potential to replace fossil-based reducing agents, such as coke and coal, in ironmaking [4]. Hydrogen that is produced by water electrolysis, using CO2-lean electricity, enables carbon-free reduction in a shaft furnace by 100% hydrogen operation [5,6]. Before the transition to new, zero-carbon technologies, a utilization of hydrogen-rich injectants has a great potential to mitigate the CO2 emissions of the traditional blast furnace process [7]. Low to medium injection rates of hydrogen-rich gases, such as natural gas (NG) and coke oven gas (COG), is already a state-of-the-art technology that is applied mainly in North American, Russian, and Ukrainian blast furnaces.
A blast furnace is a large-sized shaft furnace, in which iron oxides are reduced to metallic molten iron while descending. Hematite (Fe2O3) and magnetite (Fe3O4) are found in run-of-mine ores, but wüstite (FeO) is not present in nature. The reduction of iron oxides can take place either by CO or H2, as shown in Equations (1)–(8), respectively [8]. The reduction takes place via the following three intermediate stages: from hematite to magnetite (Equations (1) and (5)), from magnetite to wüstite (Equations (2) and (6)), and finally from wüstite to metallic iron (Equations (3) and (7)). The overall reduction reaction from hematite to metallic iron is shown in Equation (4) by CO and in Equation (8) by H2. The reaction enthalpies were calculated using HSC Chemistry software [9] between 25 and 1100 °C, taking into account that wüstite cannot exist at temperatures below 570 °C. Whether the reaction enthalpy generates positive values–indicating an endothermic reaction–or negative values–indicating an exothermic reaction–is marked after each reaction equation. It is noteworthy that the overall reduction reaction from hematite to metallic iron by CO releases energy (exothermic reaction), but that additional energy is needed as hematite is reduced to metallic iron by H2 (endothermic reaction).
The reduction of iron oxides by CO (Equations (1)–(4)) are as follows:
The reduction of iron oxides by H2 (Equations (5)–(8)) are as follows:
The operational conditions, including temperature and gas composition, vary along the radial position in a blast furnace. Loo and Bristow [10] pointed out that the phenomena occurring in a blast furnace are extremely complex, mainly because the conditions are significantly different in localized areas. The top gas in the center of the furnace contains high levels of CO at a high temperature because of center coke charging. However, the burden near the walls is significantly cooler and contains less CO, partly because the gas loses much of its temperature to heat losses via the cooling system near the walls. Additionally, the burden thickness is usually at its highest across the radius in the wall area because of a higher pellet to coke ratio near the wall, compared to the center area. This also indicates that a BFs center area has the highest permeability and, therefore, the highest gas flow rates as the gas takes the route with the lowest resistance and the highest permeability [11].
By now, the extensive use of sensors along the blast furnace has become rather common [12]. Additionally, a set of special measurement devices is available; these measurements are mainly to enable process R&D to gain a deeper insight inside the blast furnace process. The most prominent system is the multi-point vertical probe (MPVP), which provides the gas and temperature distribution over the blast furnace cross-section from the top to the bottom in an operational state, by sending gas sampling devices down into the blast furnace [13,14]. The radial gas flow in a blast furnace shaft has been measured, for example, by Bachhofen et al. [15] and Beppler et al. [16]. They used vertical, horizontal, and inclined horizontal probes in a blast furnace (Schwelgern BF No. 1, Thyssen Krupp Stahl AG, Duisburg, Germany). Following dissection studies of blast furnaces, the visualization of the in-furnace conditions–which was enabled by the development of various types of probes, information systems that utilized sensors mounted in various parts of the blast furnace, and the development of simulation models–has led to advances in monitoring the inner state of blast furnaces in operation [17].
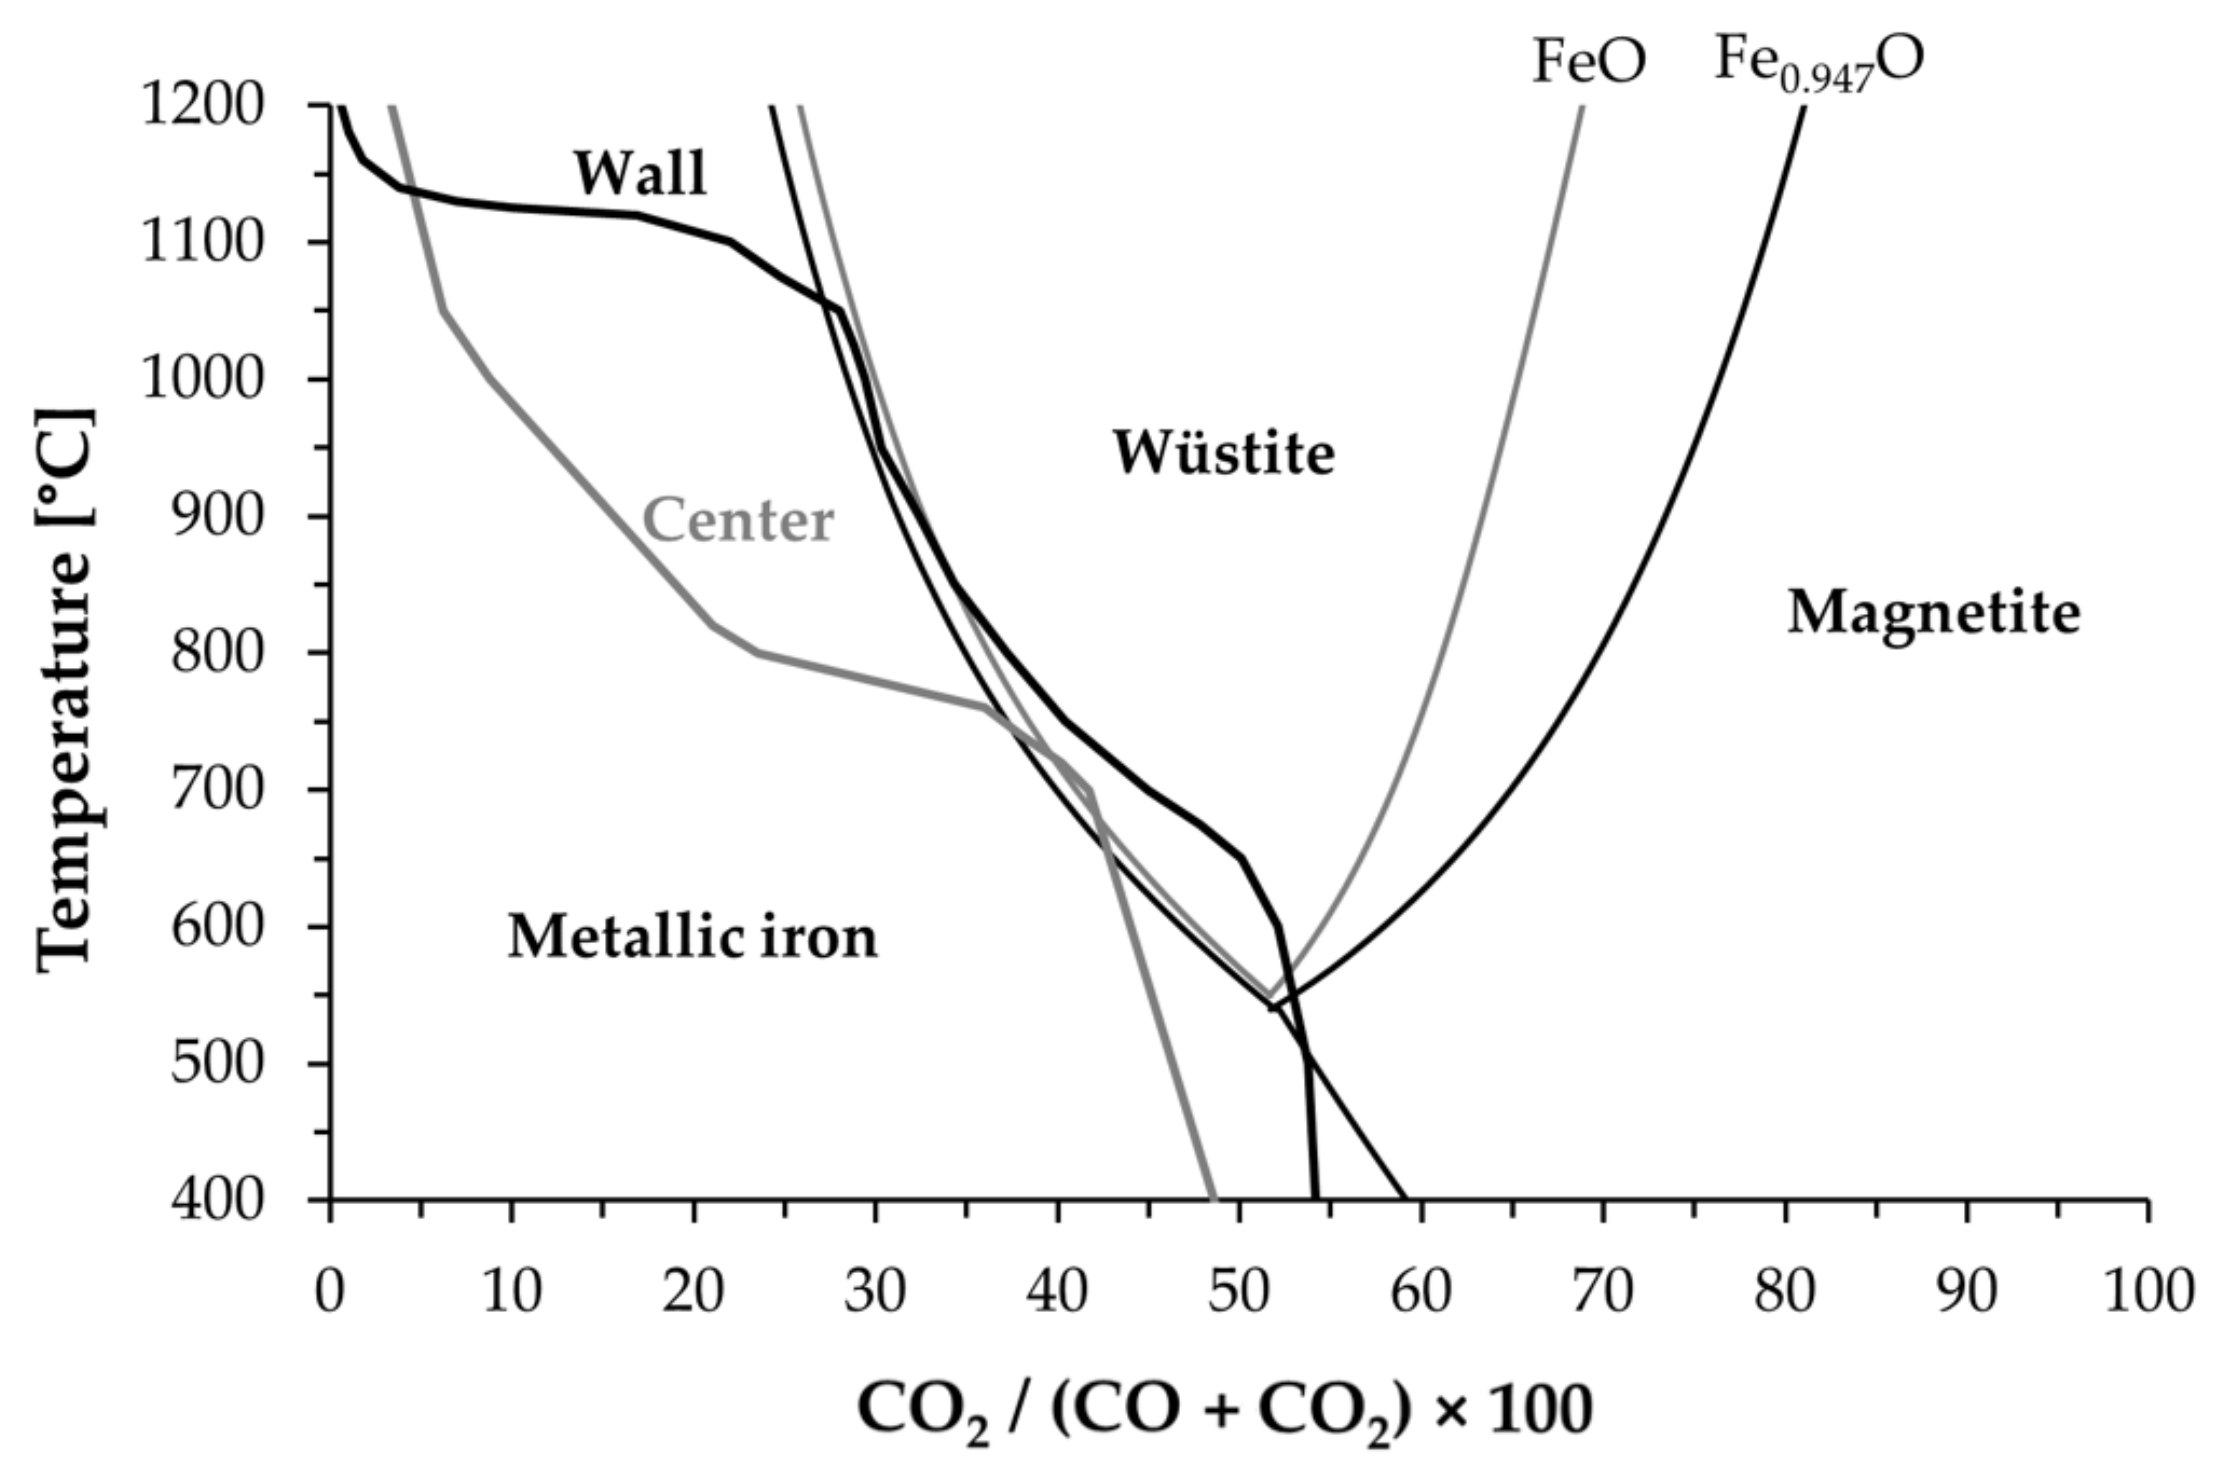
The equilibrium between the various iron oxides (magnetite and wüstite) and the metallic iron with the gas is shown in Figure 1, which is generally known as a Baur-Glaessner diagram [18]. The y-axis in the figure is the utilization for CO gas, and it is calculated using Equation (9). Similarly, the utilization for H2 gas can be calculated using Equation (10). The hematite to magnetite reduction occurs at a relatively low temperature and a low percentage of CO, and that is why the stability area for hematite is not visible in Figure 1. The Baur-Glaessner diagram shows at what level of temperature and gas composition that the further gas reduction of the ferrous burden is no longer possible. The reduction of wüstite to metallic iron requires a gas with a relatively high percentage of CO. Because of reaction kinetics, magnetite is not able to reduce directly to metallic iron at temperatures below 570 °C in a blast furnace, although, from a thermodynamic point of view it is possible. The typical gas composition and temperature data for wall and center gas flows in an operating BF have also been plotted after the multi-point vertical probing campaigns, reported by Geerdes et al. [11].
This study compared the reduction degrees and the rates of the blast furnace pellets charged to the center area and to the wall area, under simulated BF atmospheres with temperatures between 700 and 1100 °C. The results of the isothermal tests are important in understanding how the temperature and gas composition and the reduction degree are connected to each other under realistic process conditions. Additionally, non-isothermal experiments were carried out to study the reduction and cracking phenomena under simulated BF conditions. The experimental conditions were accumulated from a European BF using a multi-point vertical probe. The high-temperature experiments were carried out in CO-CO2-N2 and CO-CO2-H2-H2O-N2 atmospheres to estimate how introducing hydrogen to a blast furnace would affect the reduction kinetics. Commercial acid iron ore pellets, within a narrow size range, were used to obtain representative results. The pellets’ microstructures were studied after reduction to show the differences in the reduction extents under different conditions.
2. Materials and Methods
2.1. Iron Ore Pellets
Iron ore pellets, as well as sinter and lump ores, are commonly used as ferrous burden in blast furnaces. The pellets are small, hard, spherical particles that have been agglomerated from a fine iron ore concentrate. Their diameter is usually 10–16 mm and they are hardened at high temperatures to attain sufficient mechanical strength. Fired pellets are durable and easy to handle, and they perform well in blast furnaces with good permeability and reducibility. A high iron content and a low gangue content is favorable for blast furnace pellets [19,20,21,22].
Commercial acid iron ore pellets were used in the investigations. The chemical composition of the pellets was analyzed by an accredited laboratory and is shown in Table 1. The total iron content (Fetot) and the oxidation stage of the iron were determined using a titration method. The sulphur content was determined via firing. The contents of other elements were measured via X-ray fluorescence (XRF). Basicity is a universal ratio for the description of pellet chemistry. Different kinds of basicity values are widely used. B2 is the basicity based on two components (CaO and SiO2), and B4 is the basicity based on four components (CaO, SiO2, MgO, and Al2O3), as illustrated in Equations (11) and (12), respectively. They are as follows:
2.2. Reduction Test
A high-temperature furnace, called a BFS (Blast Furnace Simulator), was used here to study the reducibility of the pellets under conditions resembling those near the wall and the center area in a working blast furnace. The BFS has been previously used to investigate the reduction behavior of ferrous burden materials under simulated BF conditions [23,24,25,26,27,28,29,30,31,32,33,34]. The BFS, a tube furnace with an inner diameter of 95 mm, is capable of producing complex time and temperature-dependent atmosphere profiles according to pre-determined programs. With a BFS, it is possible to carry out both isothermal and non-isothermal tests. The furnace tube and the sample basket are both made of heat-resistant steel, thus limiting the continuous operating temperature to 1100 °C. The weight of the sample, together with the basket, is continuously measured with the scales and is recorded in the computer system in 10 s intervals. The operational description and the layout of the BFS were first presented by Iljana et al. [23]. Modifications made to the water vapor feeding system of the BFS were presented later by Abdelrahim et al. [34].
In this study, isothermal and non-isothermal reduction experiments were carried out in CO-CO2-N2 and CO-CO2-H2-H2O-N2 atmospheres, simulating the reducing conditions in an industrial blast furnace. For our experimental work, we used the results of a multi-point vertical probe trial, performed at No. 4 BF of ROGESA (Roheisengesellschaft), in Dillingen, Germany. The blast furnace, with an inverted-V-shaped cohesive zone, was on center-working operation, which is the most common operational practice of blast furnaces. The MPVP, equipped with six temperature measuring and gas sampling points, was introduced into the blast furnace, deposited above the burden surface, and then descended with the burden downwards. During the descent of the probe, the radial temperature mapping and gas analyses were determined, including the contents of CO, CO2, and H2. In addition to these gas components, there was also a high content of H2O and N2, which are always present in the BF shaft gas, however, these were not measured. Because of this, for the design of the experiment, the H2O content was estimated and calculated using thermodynamic software (HSC Chemistry version 9.6) [9], so that the partial equilibrium pressure of the oxygen for the carbon dioxide and water vapor formation reactions were equal in CO-CO2-N2 and CO-CO2-H2-H2O-N2 atmospheres. Furthermore, the reduction potential of CO and H2 was equal during the reduction as CO/CO2 and H2/H2O were thermodynamically balanced to achieve this. The remainder of the gas was assumed to be N2. The same MPVP campaign and a similar approach to the design of the experiments have also been the starting point in studies by Abdelrahim et al. [34] on pellet reduction and in studies by Heikkilä et al. [35] on coke gasification.
The experimental programs were separately designed for the conditions resembling those near the wall and the center area of the blast furnace. During the MPVP trial, the thermocouples were functioning for the whole shaft area up to 1100 °C or higher, except for the thermocouple located closest the BF wall, which was already broken at 925 °C. The wall conditions were designed based on the working thermocouple closest to the blast furnace wall and the center conditions were based on the thermocouple located in the center of the BFs cross-section. Time information for the non-isothermal tests were also retrieved from the MPVP trial.
A total of 20 isothermal experiments were carried out. These tests were performed in CO-CO2-N2 and CO-CO2-H2-H2O-N2 atmospheres at 700, 800, 900, 1000, and 1100 °C, using both the wall and center profiles. Additionally, four non-isothermal experiments were performed, simulating the ferrous burden descending in the shaft down to the 1100 °C isotherm. The time information and gas profiles in the CO-CO2-N2 and CO-CO2-H2-H2O-N2 atmospheres are shown in Table 2 and Table 3 for the wall and the center profile, respectively. However, it must be noted that the time information is valid only for the non-isothermal tests. Additionally, the oxygen partial pressures (pO2) in each isothermal reduction experiment were calculated and are marked in the tables.
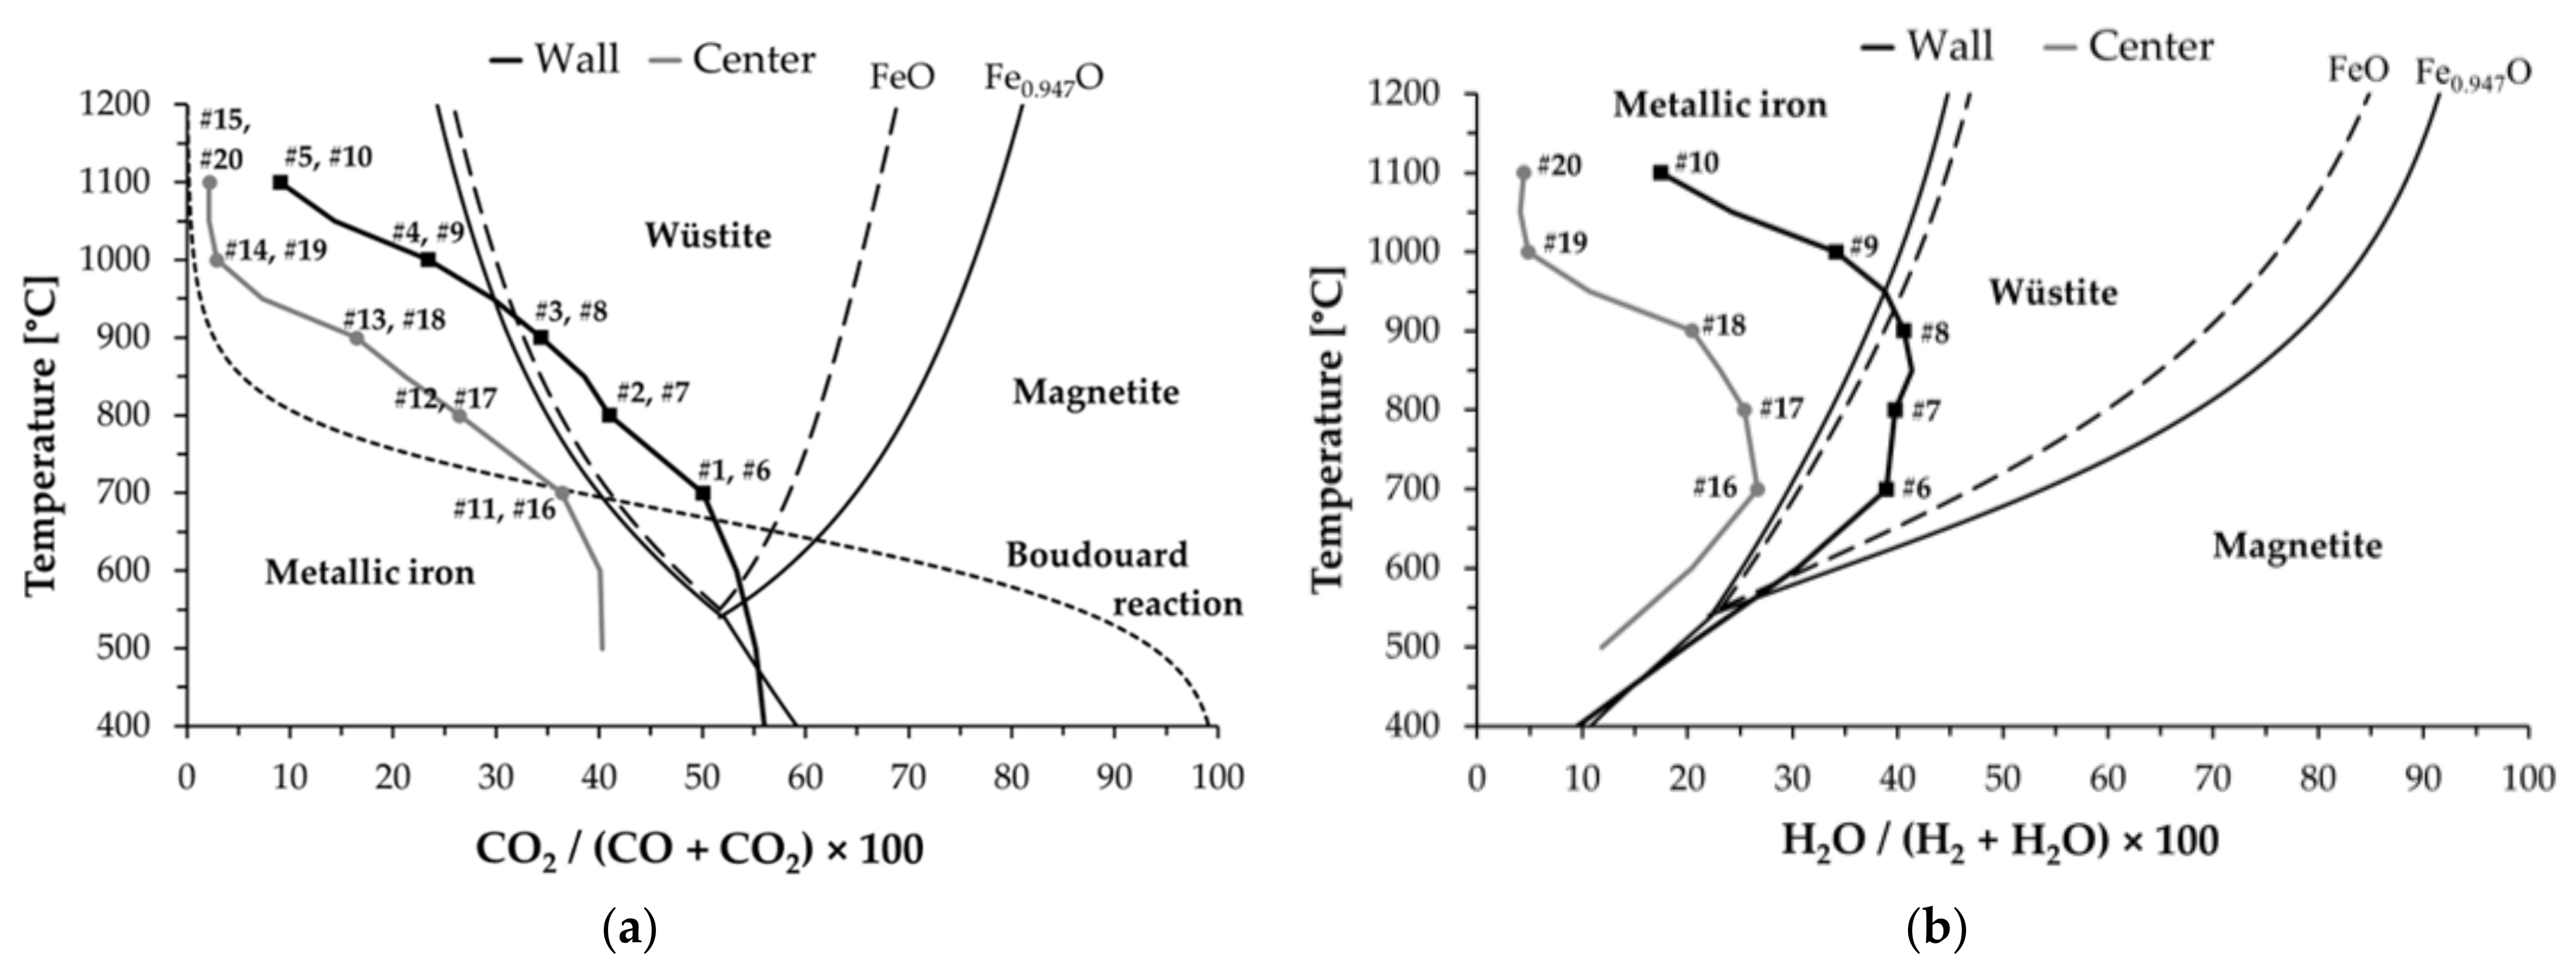
The contents of the gas components under the non-isothermal test conditions for the wall and center profiles in CO-CO2-N2 and CO-CO2-H2-H2O-N2 atmospheres are presented in Figure 2. The reducing conditions are also illustrated in the Fe-O-C and Fe-O-H phase stability diagrams (generally known as Baur-Glaessner diagrams) in Figure 3. The operation line describes the non-isothermal test conditions, whereas the isothermal test conditions are marked with dots. Additionally, a Boudouard reaction line has been drawn on the Fe-O-C diagram. The Fe-O-C and Fe-O-H phase diagrams and the Boudouard reaction line have been drawn from the collected data, using HSC Chemistry [9]. The most stable phase in each experimental setup, shown in the Baur-Glaessner diagrams, would have been reached if the duration of the experiment had been sufficient.
Before the experiments, the pellets were classified into different particle sizes using a shaking sieve, and 30 crack-free pellets–in the size range of 10–12.5 mm, weighing a total of 100 ± 0.1 g–were randomly selected for each experiment. In each isothermal reduction experiment, the 30 selected pellets were placed in the sample basket in a single layer (see Figure 4). In the isothermal experiments, the sample basket, which was connected to the scales via a wire, was first placed in the BFS furnace at room temperature, and then the temperature was elevated up to the test temperature in an N2 flow to avoid reduction during heating. Subsequently, the gas composition was changed to simulate either the BF wall or the center conditions for 300 min (5 h). For a stationary state, temperature fluctuations of ±10 °C were considered acceptable. The preparations for the non-isothermal experiments were performed similarly, however, during the reduction phase the temperature was increased from either 400 or 500 °C, up to 1100 °C, and the composition for the reducing gas was altered using the wall and center programs. In each experiment, the total gas flow rate used in the reduction phase was 15 L/min, at normal temperature and pressure (NTP) conditions. After the reduction phase, the cooling was carried out in an N2 atmosphere until the sample temperature reached 200 °C, to avoid re-oxidation. The cooling phase took 10–20 min, depending on the temperature at the end of the test.
2.3. Formation of Reduction Curves
The sample weight loss during each reduction experiment is illustrated as a reduction curve. Calculating the reduction degrees at a time interval of 10 s enabled us to draw reduction curves as a function of the experimental time and/or temperature. The reduction degrees were calculated based on the weight change during the test, which was retrieved from the TG data and the total iron and divalent iron content was retrieved from the chemical analysis. The reduction degree (RD) is represented by the ratio of the amount of oxygen removed from iron oxides to the amount bound to iron oxides, and is calculated based on the ISO 7215 standard [36], using Equation (13), as follows:
where m1 is the sample weight before reduction, m2 is the sample weight after or during reduction, w1 is the divalent iron content, and w2 is the total iron content. Values for w1 and w2 were taken from the chemical analysis of the fired pellets before reduction.
2.4. Microscopic Study
Polished sections of the reduced samples, mounted in epoxy, were prepared for a microscopic study. A high-resolution Olympus DSX1000 digital microscope, equipped with a motorized X-Y stage, was used to study the pellet microstructure and to visually detect different iron phases by obtaining mosaic images of the cross-section areas of the reduced samples. Images that were 9 × 9, with a 10% overlap, were taken from each polished section, and those were automatically stitched through the microscope software to cover a full pellet cross-section, with an approximate area of 15 × 15 mm.
3. Results
3.1. Original Sample
A similar unreduced pellet sample was characterized in another study, which was conducted by Abdelrahim et al. [34]. The XRD results showed that hematite was the dominating phase in the original pellets and that hardly any magnetite existed before reduction. Moreover, a negligible FeO content (<0.1) in the original pellets revealed that the hematite was the major iron oxide phase in the studied pellets.
3.2. Isothermal Reduction
The pellet samples were photographed after the reduction experiments. The pellet images after the non-isothermal reduction are shown in Figure 5, simulating the wall and center conditions in CO-CO2-N2 and CO-CO2-H2-H2O-N2 atmospheres. The pellets reduced at 1100 °C were slightly stuck together, which indicates a formation of first liquids. Furthermore, it seems that H2-H2O enhanced crack formation in the pellets and was the most intensive at 1100 °C.
The reduction curves for the pellets under isothermal conditions, using wall and center profiles, are shown in Figure 6 and Figure 7, in CO-CO2-N2 and in CO-CO2-H2-H2O-N2 atmospheres, respectively. The reduction degree corresponding to the theoretical complete reduction from the original state (hematite) to magnetite was 11.1% for the studied pellets. The reduction degree corresponding to the theoretical complete reduction of the original pellets to wüstite depended on the nonstoichiometry of wüstite. The reduction degree was at the range of 29.7% (the nonstoichiometry of wüstite was considered, wüstite being as Fe0.947O) and 33.3% (the nonstoichiometry of wüstite was not considered, wüstite being as FeO) as the pellets used in this study were completely reduced to wüstite, based on an assumption that only two different iron oxides can exist simultaneously in a microstructure. Dashed lines at the reduction degrees of 11.1% and 29.7% presumably show when the pellets are reduced completely to magnetite and wüstite, respectively.
It is of the utmost importance to look at the Baur-Glaessner diagrams as the reduction curves are discussed, because these diagrams describe the thermodynamic requirements for the progress of the reduction reactions. It can be deduced from the Baur-Glaessner diagrams, shown in Figure 3, that the reduction would have progressed to metallic iron at each of the studied temperatures, using the center profile, if the experimental time (kinetic requirement) had been sufficient. However, at wall conditions the thermodynamic stable phase was metallic iron at temperatures between 1000 and 1100 °C, but it was wüstite at temperatures between 700 and 900 °C. It must be noted that 11 experiments out of a total of 20 isothermal tests (#1, #4, #6, #9, #11, #12, #13, #14, #16, #17, and #18) would have needed a longer time to reach the thermodynamically stable phase.
At each studied temperature, the pellets reduced faster using the center profile, compared to the wall profile because of a higher reducing potential in the gas (higher values for etaCO and etaH2), which can also be seen in the Baur-Glaessner diagrams. The difference was the highest at temperatures of 900 and 1000 °C. Another important implication that can be drawn from the reduction curves is that the pellets reduced faster as H2-H2O appeared in the reducing gas, compared to the CO-CO2-N2 gas.
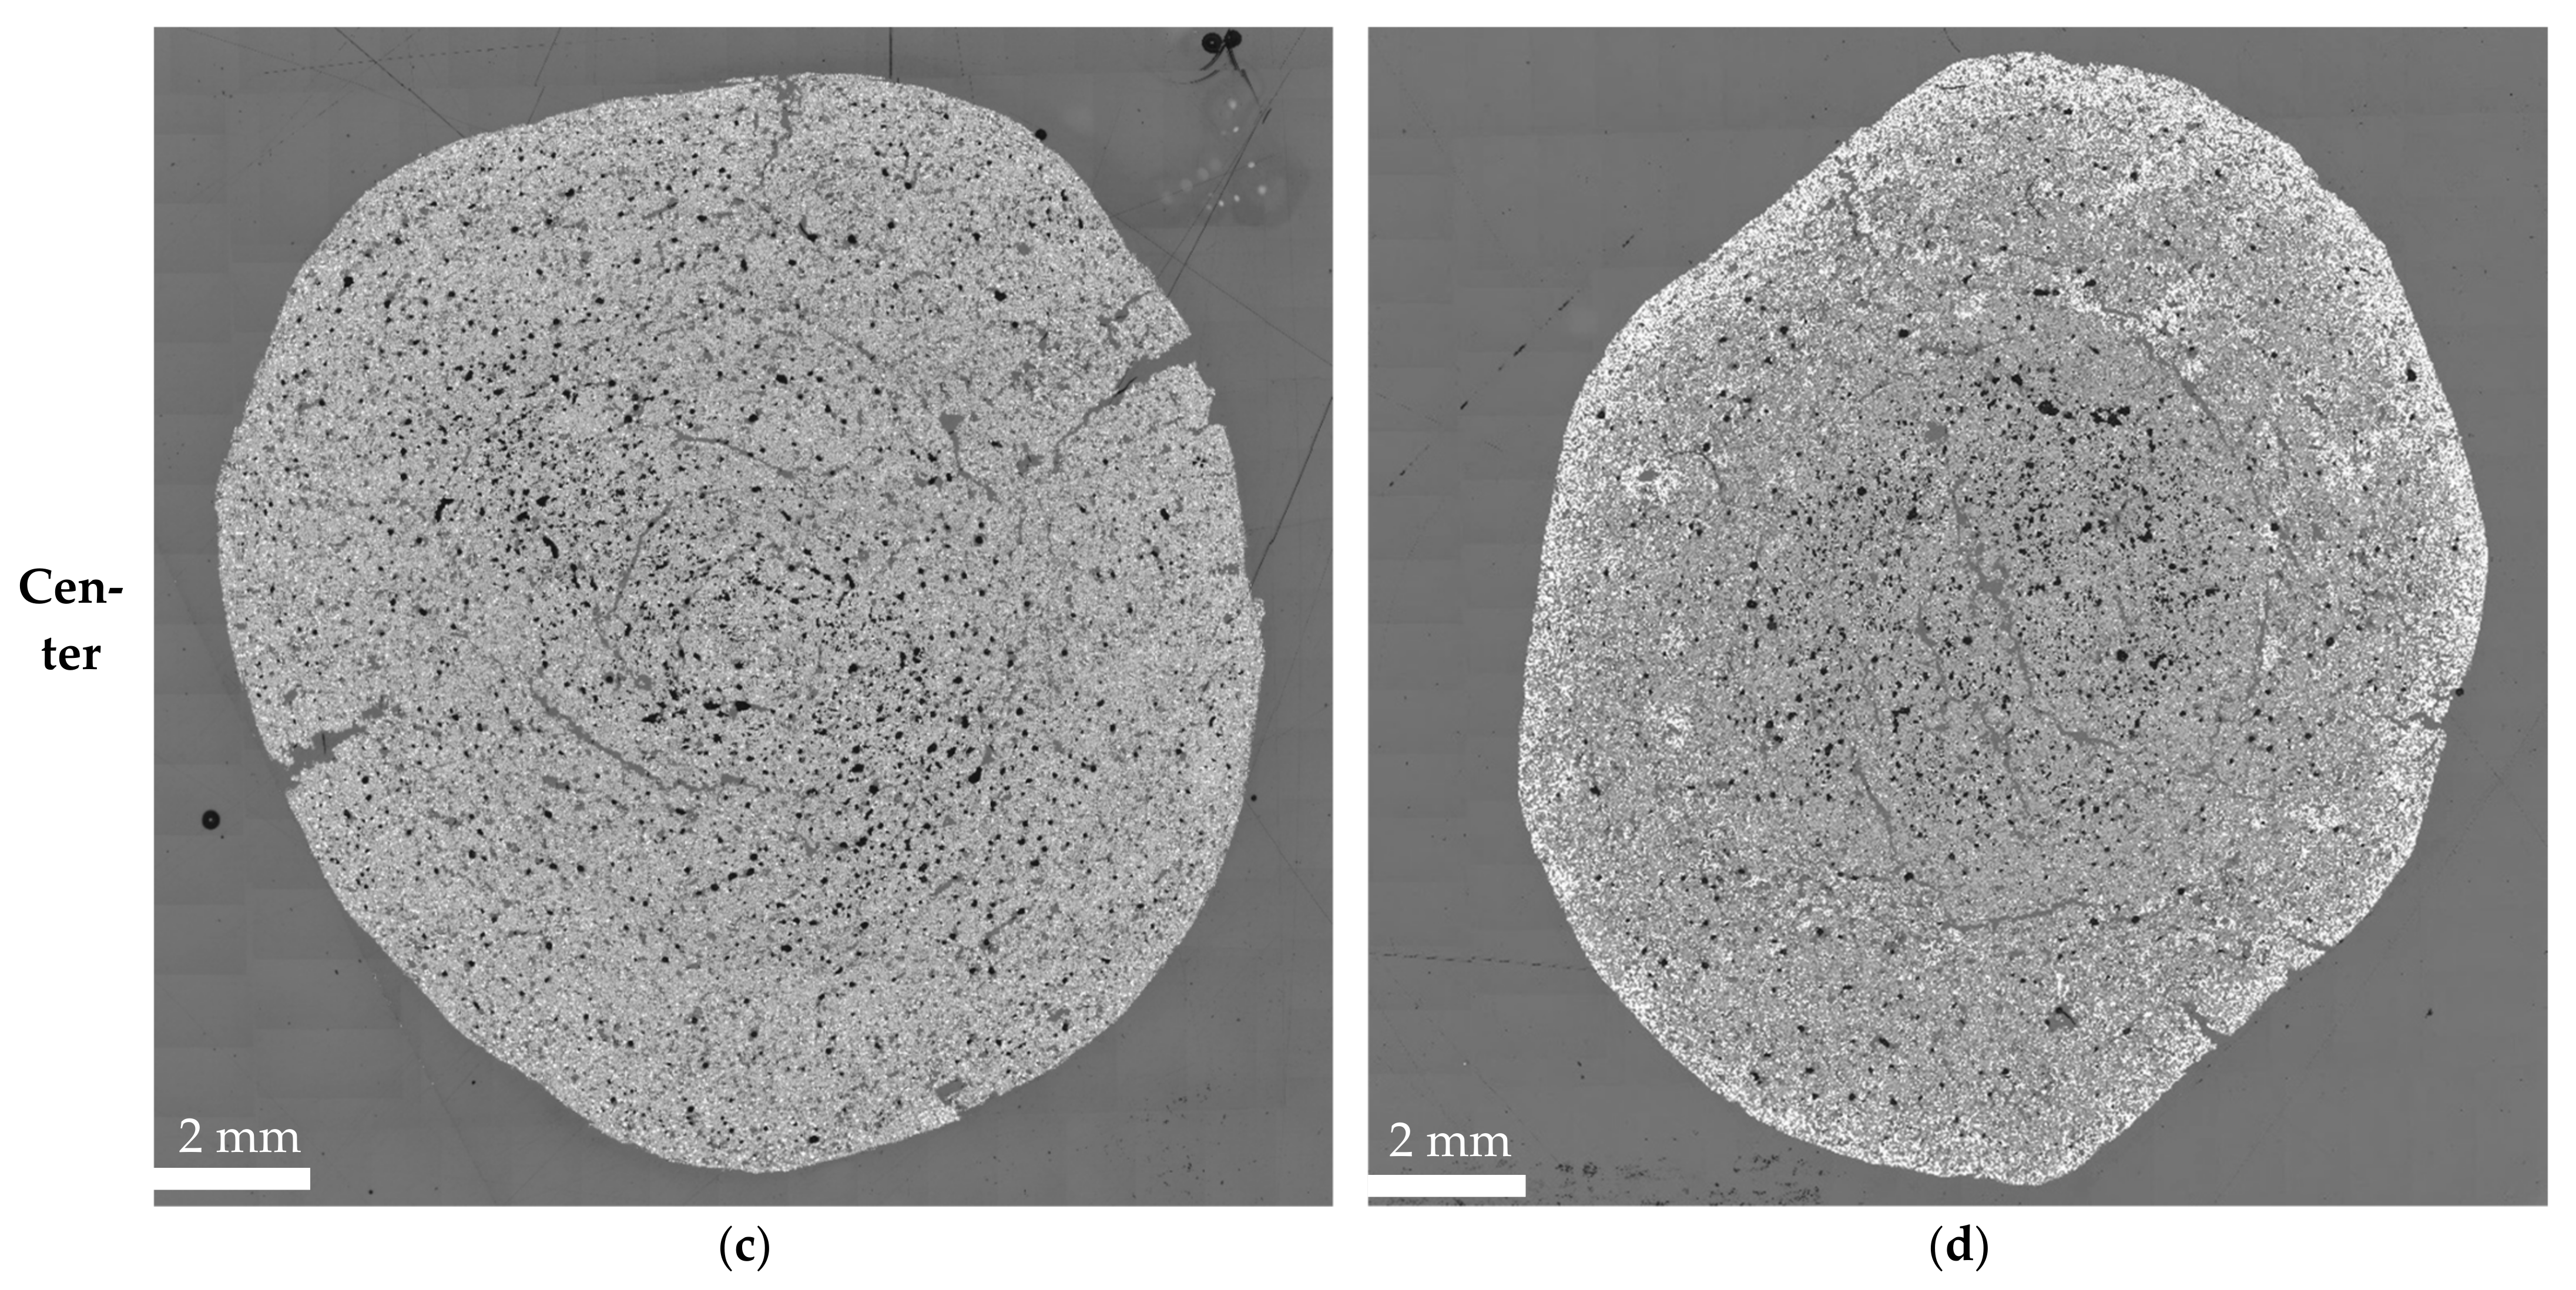
Cross-sectional images of the reduced pellets were obtained using an Olympus digital microscope. Please note that the cross-sectional images for the pellets reduced at 700 and 1100 °C are not shown in this paper. The pellets reduced at 700 °C consisted mainly of magnetite and/or wüstite, and those cannot be visually separated in the LOM images. At 1100 °C, all four pellets in different scenarios were fully reduced to metallic iron, and there were no differences in the existence of iron phases. The pellet cross-sectional images for the reduction temperatures of 800, 900, and 1000 °C are shown in Figure 8, Figure 9 and Figure 10. At these points, the metallic iron can be seen in white and the wüstite can be seen in light grey, while the epoxy can be seen in dark grey and the pores that are not mounted in epoxy can be seen in black.
At 800 °C, seen in Figure 8, both wall profile pellets were fully reduced to wüstite. A minor amount of metallic iron can be seen at the surface of the pellet reduced in CO-CO2-N2 gas, using the center profile. In a similar test, which was carried out in CO-CO2-H2-H2O-N2 gas, the reduction zone of wüstite to metallic iron proceeded further to the mid-radius area in the pellet cross-section.
At 900 °C, seen in Figure 9, the differences between the different scenarios appear to be at the highest. Under the simulated wall conditions, the pellets reduced to wüstite in CO-CO2-N2 and CO-CO2-H2-H2O-N2 atmospheres. However, when simulating the center gas flow, metallic iron formed, and wüstite only existed in the pellet core area, as the pellets were reduced to the highest reduction extent in CO-CO2-H2-H2O-N2 gas.
At 1000 °C, seen in Figure 10, both wüstite and metallic iron existed when the wall profile was used in reduction. However, the pellets reduced under the simulated center conditions were practically fully reduced.
3.3. Non-Isothermal Reduction
The pellet images after the non-isothermal reduction are shown in Figure 11 for CO-CO2-N2 and CO-CO2-H2-H2O-N2 atmospheres, using the BF wall and center profiles. It can be seen that the simulated charging position (wall/center) did not affect the pellet cracking. However, the presence of H2 and H2O in the gas enhanced the formation of minor cracks on the pellet surface; although, only a few large-sized cracks were formed, even in the CO-CO2-H2-H2O-N2 gas.
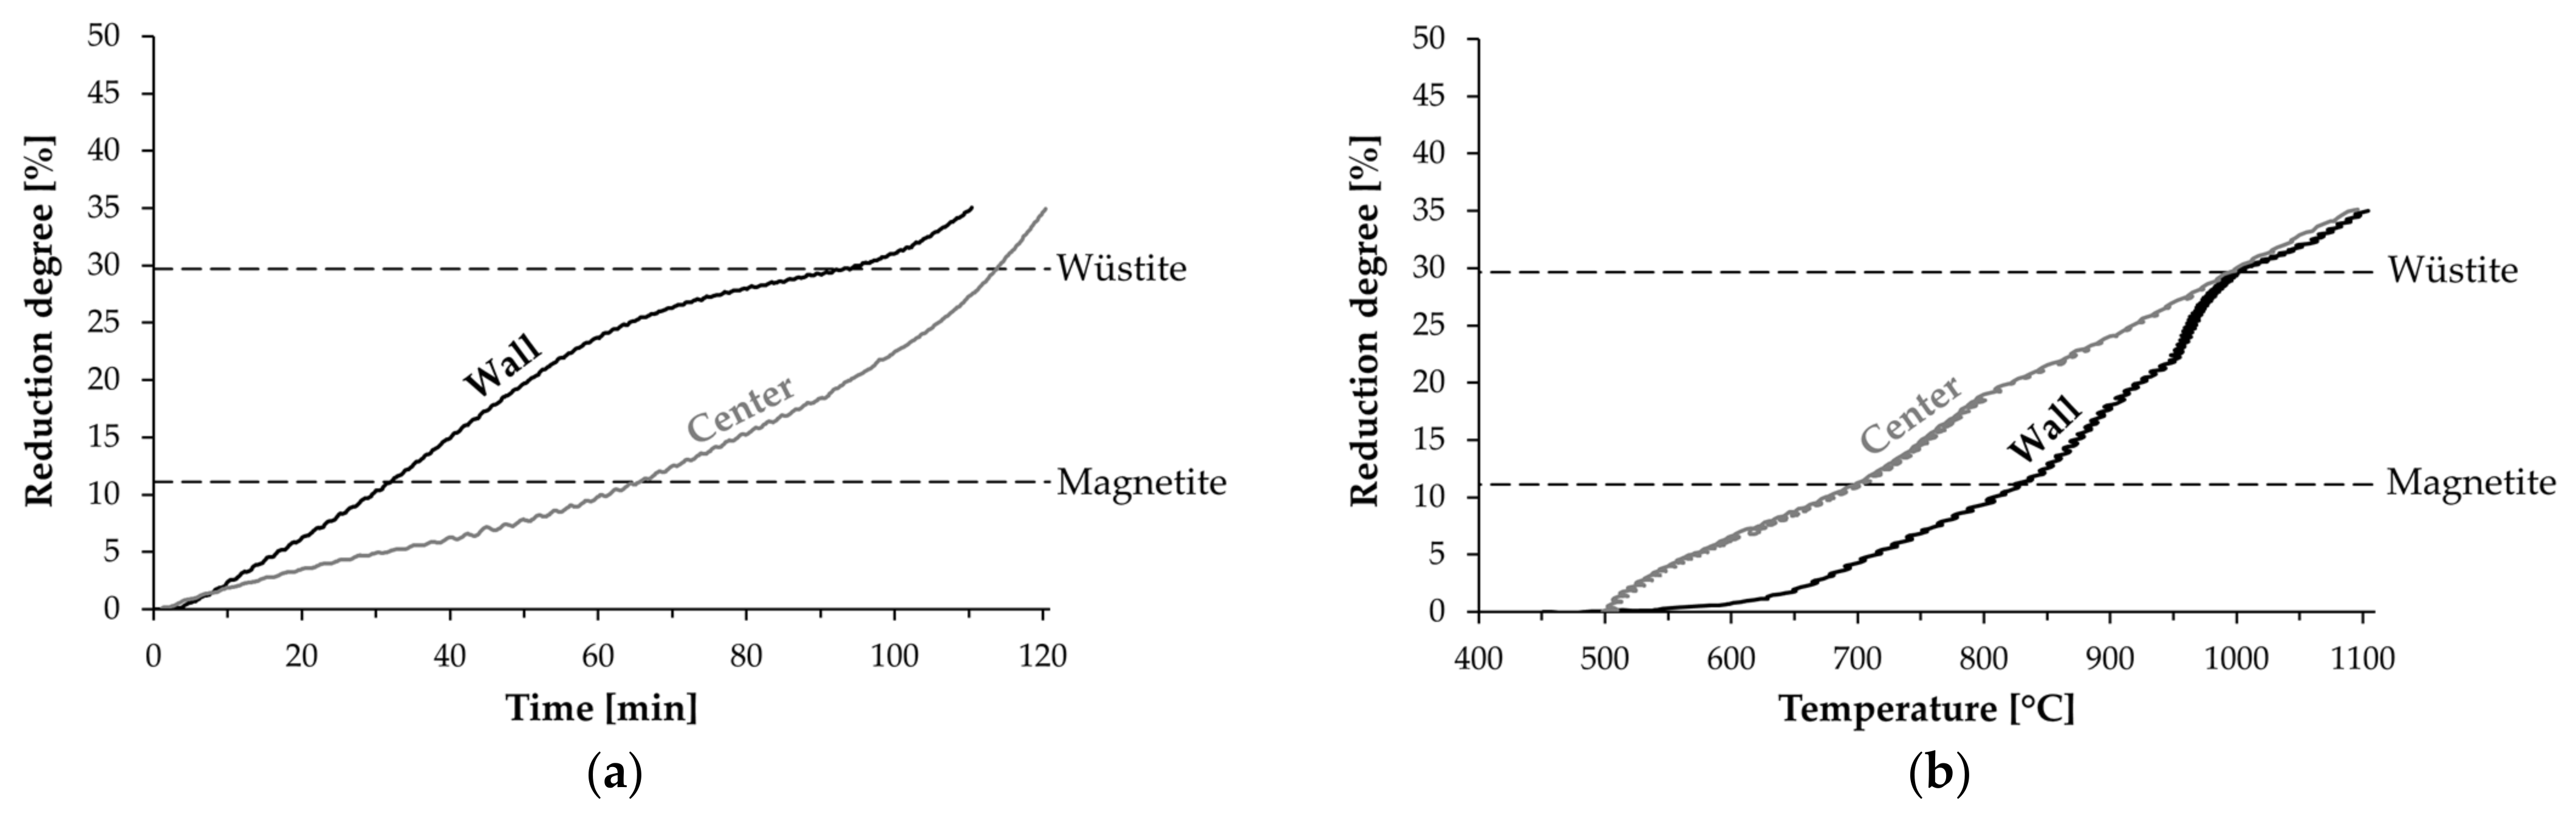
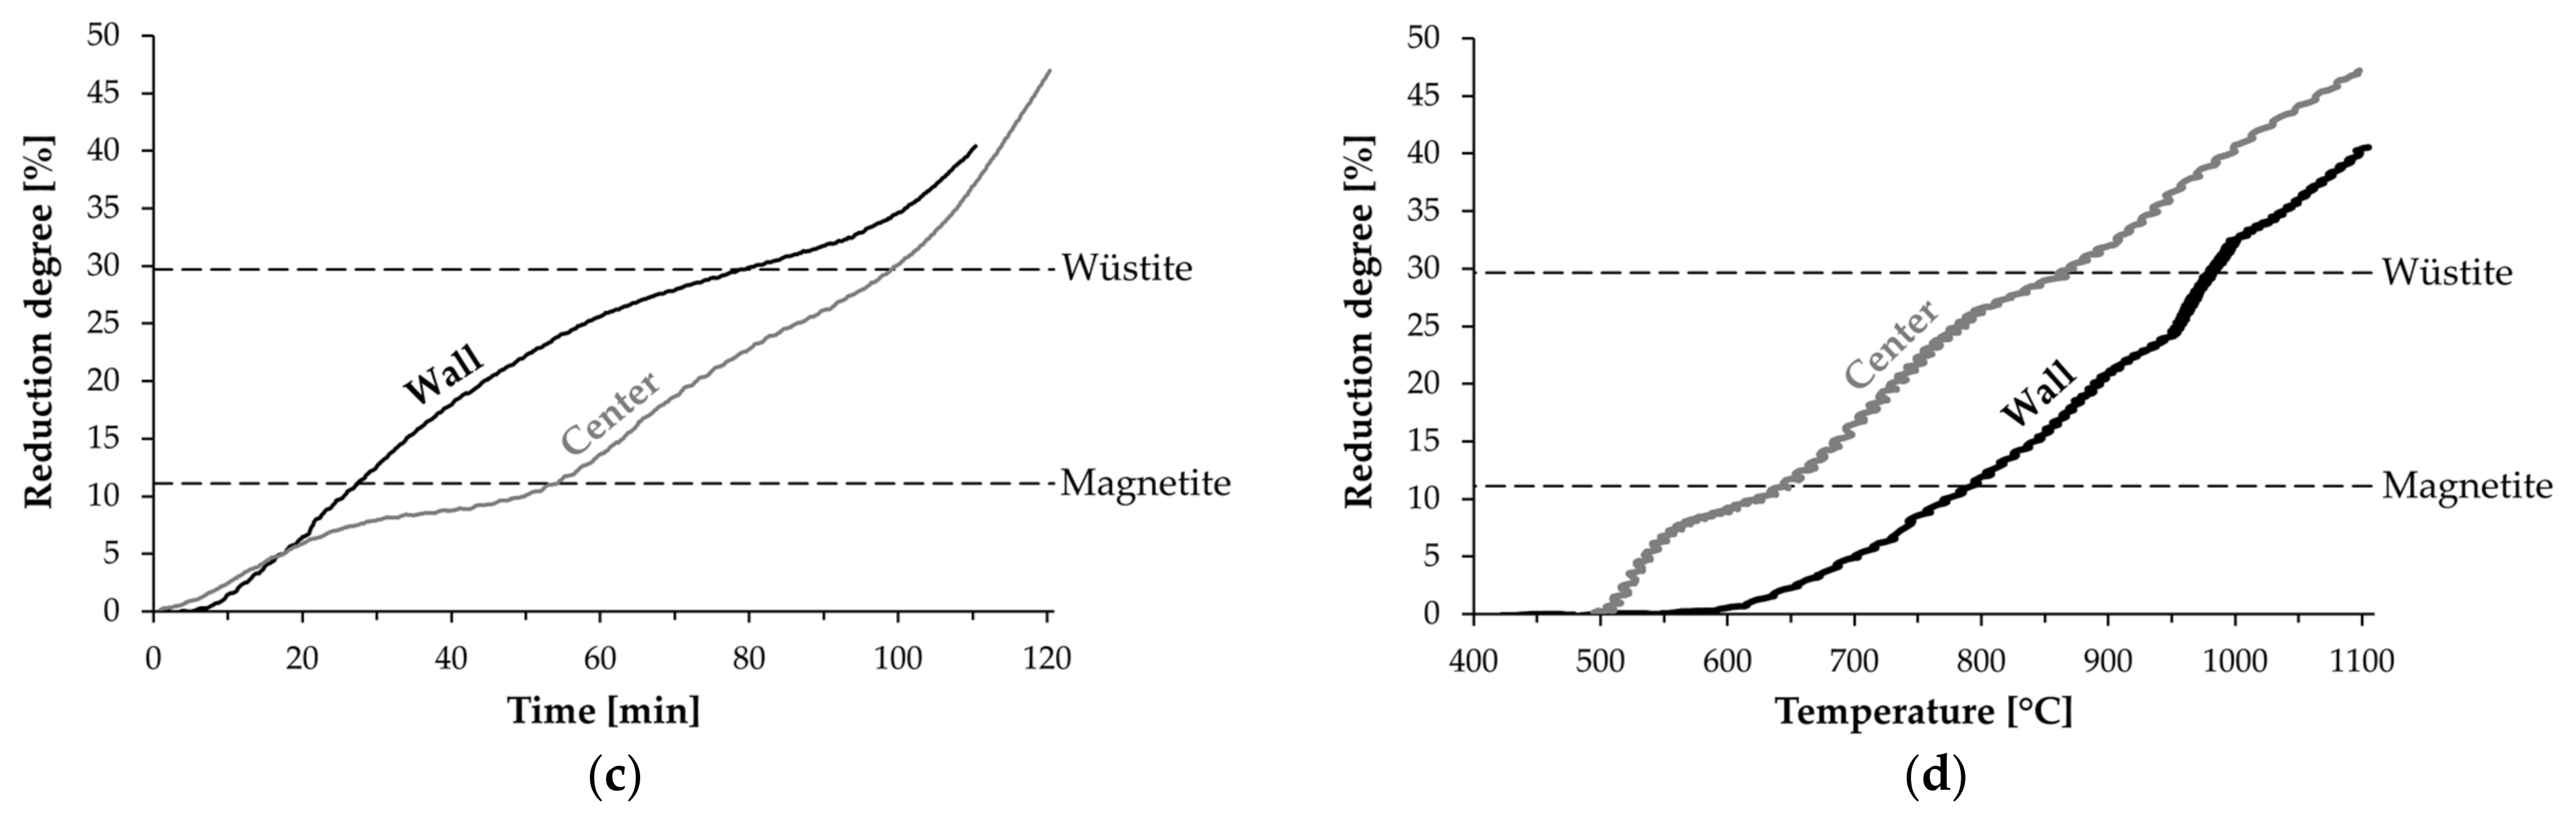
Figure 12 shows the pellet reduction degree as a function of the experimental time and the sample temperature in the non-isothermal reductions, simulating the BF wall and center conditions in CO-CO2-N2 and CO-CO2-H2-H2O-N2 atmospheres. Especially in the gas containing H2-H2O, the pellets achieved a higher reduction degree using the center profile, compared to the wall profile. Additionally, the final reduction degrees attained in the non-isothermal experiments are shown in Table 4.
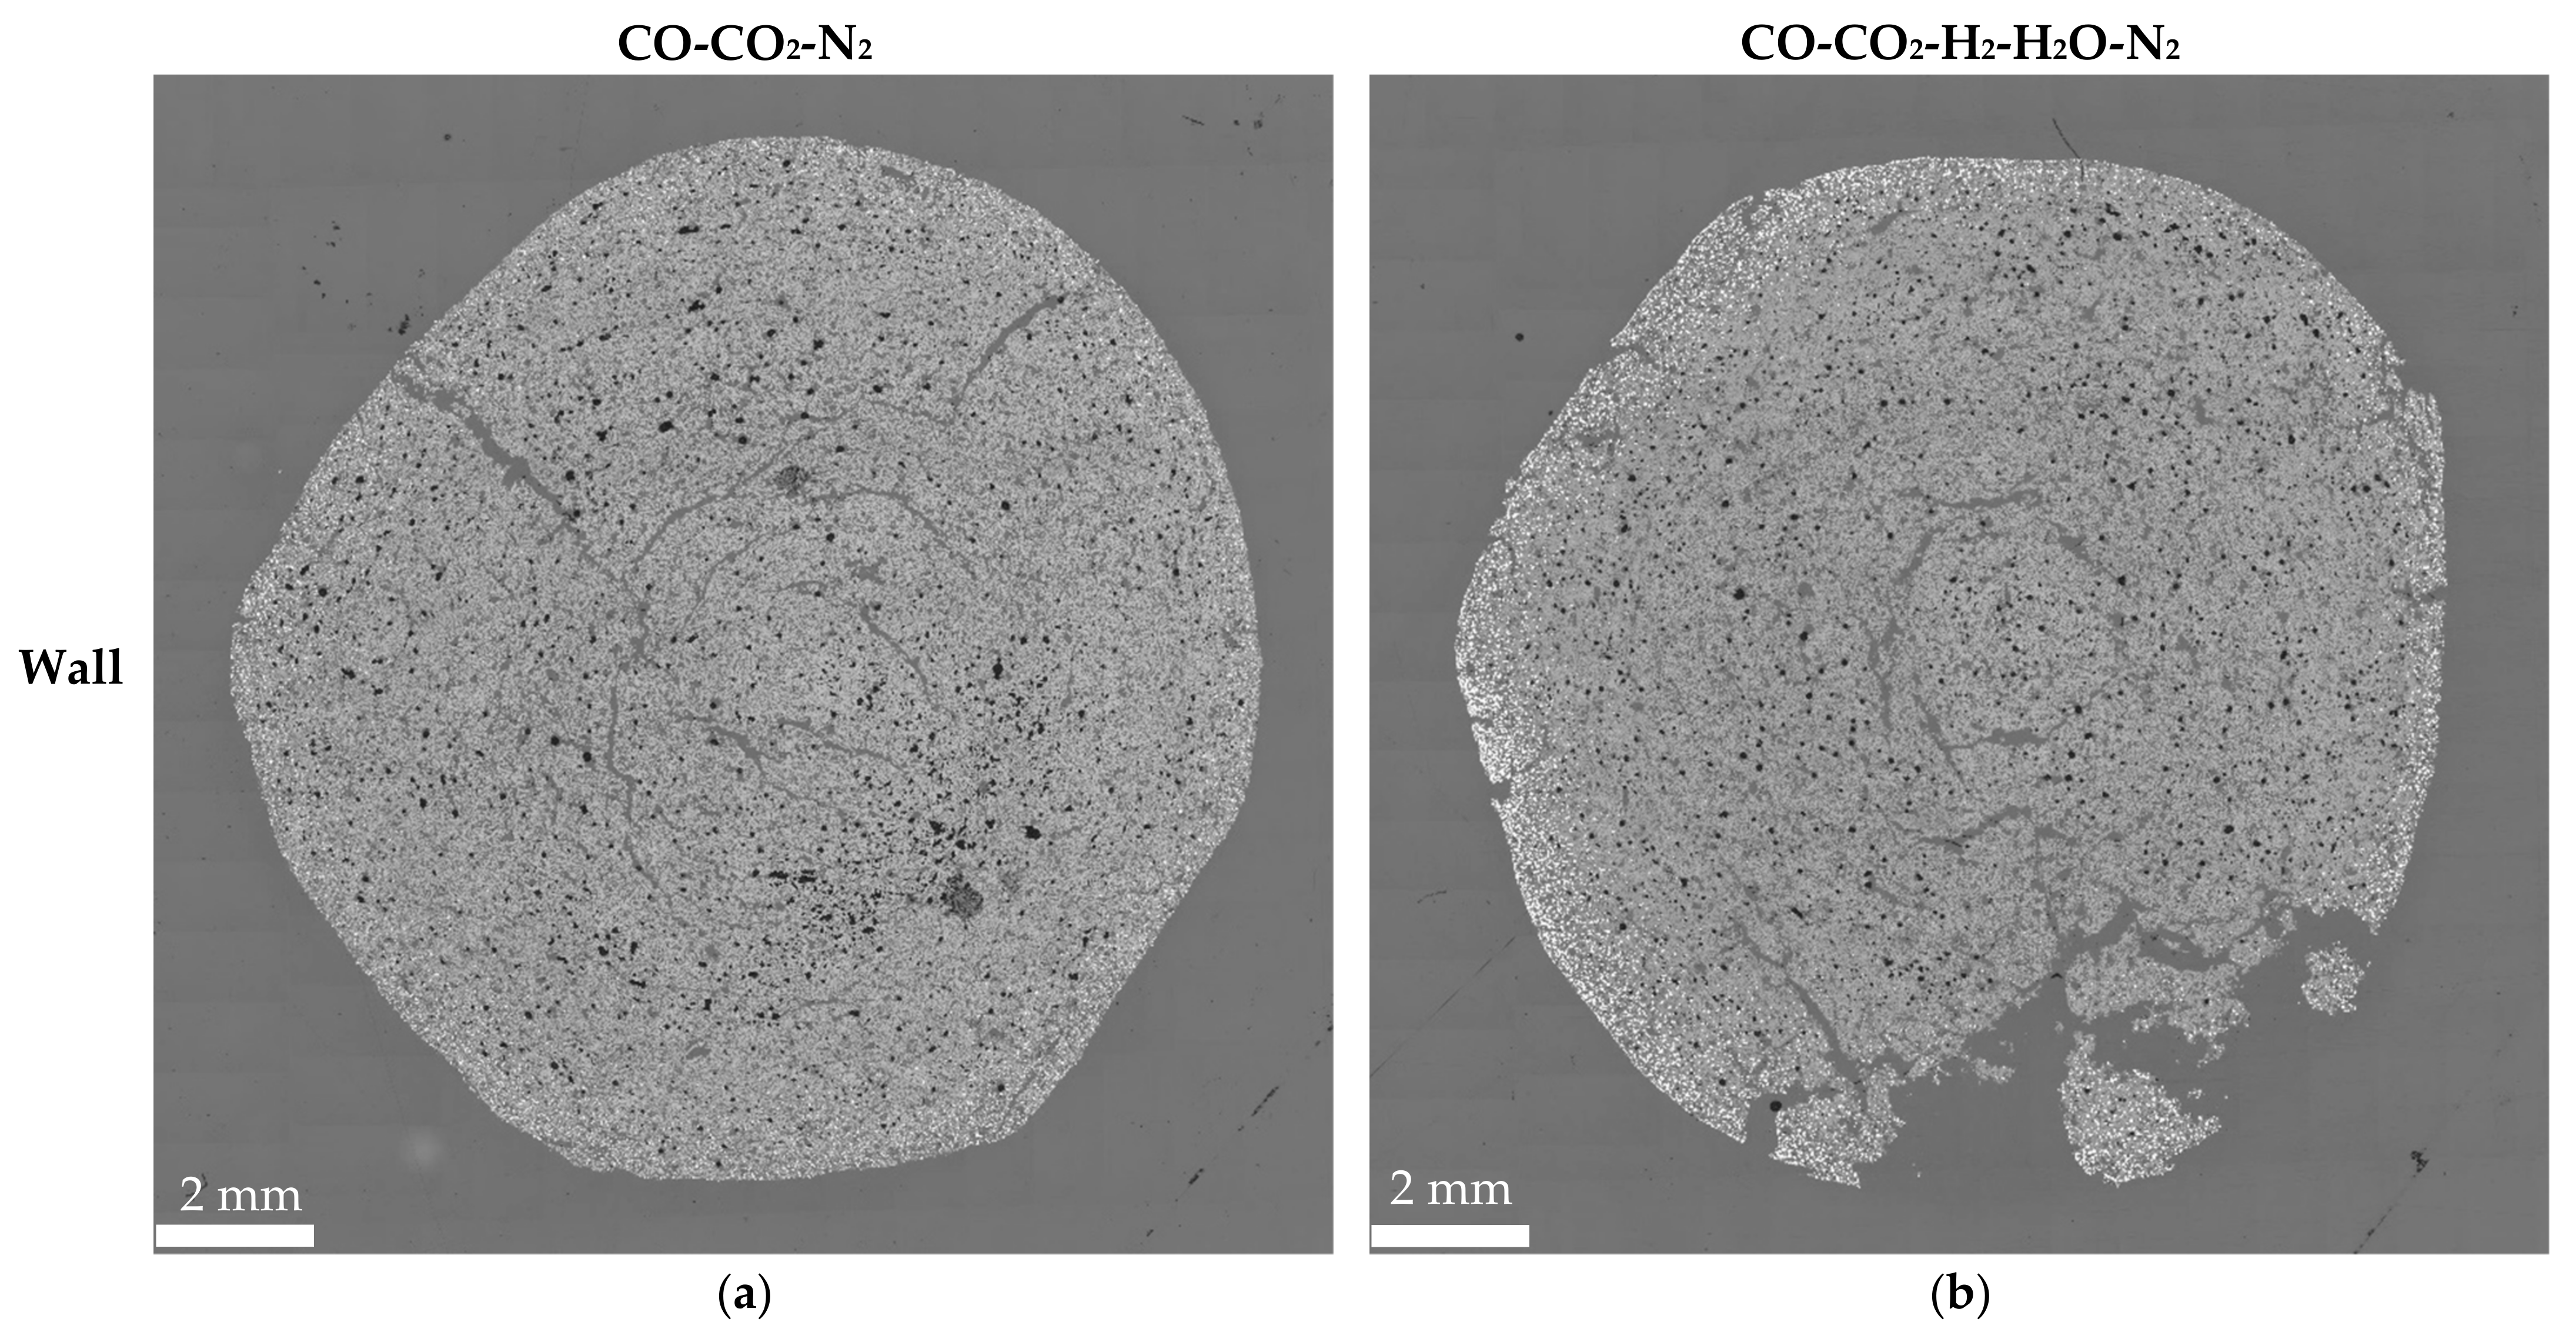
Figure 13 shows the pellet cross-section areas after the non-isothermal reduction in different scenarios. From these cross-section images, it can be seen that the reduction proceeded topochemically, from the pellet surface toward the pellet core, and that wüstite is the main phase for Fe after the non-isothermal reduction. Additionally, some metallic iron can be seen to exist at the pellet surface. When comparing different reduction scenarios, it can also be seen that more metallic iron exists near the pellet surface in the reducing gas containing H2-H2O, compared to the CO-CO2-N2 gas.
4. Discussion
Only a small number of studies were found in the literature that discuss how the radial position in the blast furnace affects the reduction behavior of the ferrous burden. One of these studies is a Swedish doctoral thesis by Jerker Sterneland [37], in which he studied the reduction and softening behavior of olivine pellets in a laboratory scale, in CO-CO2-H2-N2 gas, using a new reduction under load (RUL) furnace. He conducted high-temperature experiments under varying reducing conditions (different temperature profiles, and reducing atmospheres and mechanical loads), and by simulating different radial positions (wall, mid-radius, and center). The study was also conducted in a medium-sized, center-working blast furnace that had an inverted-V-shaped cohesive zone, which is the most common practice of blast furnace operation. The parameters—including the rate of temperature increase, the reducing gas composition, and the mechanical load—at different radial positions in the blast furnace were derived from the literature concerning various measurements in blast furnaces during the operation, the dissection of blast furnaces, and the modelling of the conditions in the blast furnace (see Table 5). However, Sterneland and Lahiri [38] pinpointed that it is important to bear in mind that temperature and gas composition profiles and burden load vary widely from furnace to furnace, and also from time to time in the same blast furnace.
Sterneland [37] discovered that the reduction was fastest for the center profile samples and slowest for the mid-radius profile samples, while the wall profile samples had an intermediate reduction behavior. Similar to the results in our study, the reduction progressed faster when the center conditions were experimentally simulated than when using the wall profile. However, in our study the mid-radius conditions were not experimentally simulated. It would have been possible and even informative to also derive the reduction conditions from the MPVP data for the mid-radius profile, however, only wall and center profiles were included in the design of the experiments. Sterneland and Lahiri [38] concluded that the degree of reduction is not only dependent on the reducing atmosphere but also on the temperature cycle under which the material is treated.
Loo and Bristow [10,40] have experimentally studied the reduction behavior of sinter, pellets, and lump ores in three BHP Steel blast furnaces (BF No. 5 located in Port Kembla, NSW, Australia; BF No. 4 in Newcastle, NSW, Australia; and BF No. 2 in Whyalla, SA, Australia). For each furnace, wall and center profiles were simulated in the experimental program. Loo and Bristow did not compare the differences in the progress of reduction between the wall and center profiles. However, they observed lower reducibility rates under wall and center conditions, compared to the standardized JIS (Japanese Industrial Standard) reducibility test. Additionally, the ranking of the materials was different to that obtained using the JIS 8713 standard test [10,40].
Peripheral and central temperature programs have been used to simulate the reactions occurring in Ijmuiden blast furnaces in the Netherlands (now owned by Tata Steel, Mumbai, Maharashtra, India) since the 1980s. In addition to CO and CO2, hydrogen and water vapor also exist in the reducing gas of their blast furnace simulation test, named HOSIM [41]. The experiments carried out in an EU project–named “Improvement of blast furnace burden quality”–showed that hydrogen has a beneficial effect on the blast furnace reduction process. It appeared that the reaction rate by H2 is higher than the reaction rate by CO. Additionally, a decrease in reduction degradation appeared to be mainly caused by less whisker formation, as H2 was present in the reducing gas [41]. Their finding concerning the effect of H2 on reduction rates is similar to the finding in our study. Likewise, an experimental blast furnace (EBF) trial in Luleå, Sweden, revealed that the reduction degree in the upper shaft increased compared to the normal operation as hydrogen-rich gases, such as COG, were injected [42].
Jaffarullah et al. [43] studied the reduction behavior of sinter under simulated vertical probe (VP) trial conditions. More than 10 VP trials from the wall, mid-radius and center positions were conducted in BF No. 5 of Bokaro Steel Plant (BSL), located in Bokaro Steel City, Jharkhand, India. The probe measured the composition, temperature, and pressure of the ascending gases along the height of the blast furnace from the stockline to the cohesive zone at three radial points (wall, mid-radius, and center) during its operation. The focus of the paper was on comparing the reduction and degradation behavior of sinter, under simulated vertical probe trial conditions to softening-melting test conditions. The sinter reducibility was notably lower under the simulated vertical probe trial conditions, compared to the results obtained using the softening-melting test conditions.
As discussed earlier, only a few studies were found in the literature that discuss how the radial position in the blast furnace affects the reduction behavior of the ferrous burden. In some studies, the red line has been different, focusing more on comparing the reduction behavior under simulated radial conditions to standard test conditions, or to the conditions used in the steel plant’s own reducibility or reduction-softening tests. It appears that there is an intensifying need for research of the type presented in this paper, as hydrogen-rich gases will be injected into blast furnaces more and more in the near future.
5. Conclusions
In this study, the effect of the radial charging position on the reducibility of iron ore pellets in a blast furnace was investigated in CO-CO2-N2 and CO-CO2-H2-H2O-N2 atmospheres, up to 1100 °C. The experimental conditions were accumulated from a European BF, using a multi-point vertical probing technology. The effect of a reducing gas containing a mixture of CO-CO2-H2-H2O-N2 was compared to a reducing gas containing only CO-CO2-N2, with the same oxygen partial pressure. A total of twenty isothermal and four non-isothermal reduction tests were carried out under simulated blast furnace wall and center conditions, using a high-temperature vertical tube furnace, called a Blast Furnace Simulator, at the University of Oulu. The experimental results obtained in this study are summarized as follows:
- The reduction proceeded faster under simulated blast furnace conditions resembling those in the center area, compared to the wall area in an isothermal reduction because of the higher proportion of CO and H2 in the gas. Similarly, the pellets reduced to a higher final reduction degree in the non-isothermal experiments using the BF center profile compared to the wall profile, especially in the gas containing H2-H2O. Therefore, the pellet charging position affects its reduction path in a blast furnace.
- The presence of H2-H2O in the reducing gas enhanced the progress of reduction reactions, which is desirable in the blast furnace process.
- The presence of H2-H2O in the reducing gas enhanced the formation of cracks. However, the cracking was minor and will not deteriorate blast furnace operation. On the contrary, a minor cracking of pellets can be beneficial as it provides space for gases to penetrate more easily inward to the pellet core.
- The experimental results are important in understanding how process conditions (temperature and gas composition) are connected to the reduction degree under realistic conditions in a blast furnace shaft.
Author Contributions
Conceptualization, M.I.; methodology, M.I.; software, M.I.; formal analysis, M.I.; investigation, A.A. and M.I.; resources, T.F.; writing—original draft preparation, M.I.; writing—review and editing, M.I., A.A., H.B. and T.F.; visualization, M.I.; supervision, M.I. and T.F.; project administration, M.I., H.B. and T.F.; funding acquisition, M.I., H.B. and T.F. All authors have read and agreed to the published version of the manuscript.
Funding
This research was funded by the Research Fund for Coal and Steel (RFCS) of the European Union (EU) as a part of the Online Blast Furnace Stack Status Monitoring (StackMonitor) project, grant number 709816. The APC was funded by Business Finland as a part of the Towards Fossil-free Steel (FFS) research program, grant number 45774/31/2020.
Institutional Review Board Statement
Not applicable.
Informed Consent Statement
Not applicable.
Data Availability Statement
Not applicable.
Acknowledgments
Tommi Kokkonen, a special laboratory technician at the University of Oulu, is acknowledged for his technical support in the experimental part of this study.
Conflicts of Interest
Mikko Iljana, the corresponding author, acts as a post-doctoral researcher at the University of Oulu, Finland, and declares no personal conflict of interest. Ahmed Abdelrahim, a co-author, acts as a doctoral researcher at the University of Oulu and declares no personal conflict of interest. Hauke Bartusch, a co-author, acts as a senior researcher at VDEh-Betriebsforschungsinstitut (BFI), in Düsseldorf, Germany, and declares no personal conflict of interest. Timo Fabritius, a co-author, acts as a professor at the University of Oulu. Professor Fabritius is a member in the steering group of the FFS research program and has participated in the decision making to publish the results. The funders had no role in the design of the study; in the collection, analyses, or interpretation of data; in the writing of the manuscript; or in the decision to publish the results.
References
- World Steel Association. World Steel in Figures 2021; World Steel Association: Brussels, Belgium, 2021. [Google Scholar]
- Vogl, V.; Åhman, M.; Nilsson, L.J. Assessment of hydrogen direct reduction for fossil-free steelmaking. J. Clean. Prod. 2018, 203, 736–745. [Google Scholar] [CrossRef]
- European Commission. The European Green Deal; European Commission: Brussels, Belgium, 2019; p. 640. [Google Scholar]
- Heidari, A.; Niknahad, N.; Iljana, M.; Fabritius, T. A Review on the Kinetics of Iron Ore Reduction by Hydrogen. Materials 2021, 14, 7540. [Google Scholar] [CrossRef] [PubMed]
- Spreitzer, D.; Schenk, J. Reduction of Iron Oxides with Hydrogen—A Review. Steel Res. Int. 2019, 90, 1900108. [Google Scholar] [CrossRef] [Green Version]
- Patisson, F.; Mirgaux, O. Hydrogen Ironmaking: How It Works. Metals 2020, 10, 922. [Google Scholar] [CrossRef]
- Agrawal, A.K.; Kinzel, K.P.; Rösner, B.; Kappes, H.; Bermes, P.; Micheletti, L.; Castagnola, C. The Blast furnace in view of past, current and future CO2 saving technologies. In Proceedings of the METEC & 4th European Steel Technology and Application Days (ESTAD), Düsseldorf, Germany, 24–28 June 2019; Steel Institute VDEh: Düsseldorf, Germany, 2019. [Google Scholar]
- Babich, A.; Senk, D.; Gudenau, H.W. Ironmaking; Verlag Stahleisen GmbH: Düsseldorf, Germany, 2016; ISBN 978-3-514-00819-9. [Google Scholar]
- Roine, A. HSC Chemistry; Version 9.6; Outotec Research Oy: Pori, Finland, 2018. [Google Scholar]
- Loo, C.E.; Bristow, N.J. Properties of iron bearing materials under simulated blast furnace indirect reduction conditions: Part 1 Review and experimental procedure. Ironmak. Steelmak. 1998, 25, 222–232. [Google Scholar]
- Geerdes, M.; Chaigneau, R.; Kurunov, I.; Lingiardi, O.; Ricketts, J. Modern Blast Furnace Ironmaking, 3rd ed.; IOS Press BV: Amsterdam, The Netherlands, 2015; ISBN 978-1-61499-498-5. [Google Scholar]
- Stumper, J.; Krüssmann, M.; Bodeving, C.; Cruz, D.B.M. Blast furnace process improvements with probes and measurement systems. In Proceedings of the 44th Ironmaking and Raw Materials Seminar, 15th Brazilian Symposium on Iron Ore and 2nd Brazilian Symposium on Agglomeration of Iron Ore, Belo Horizonte, Brazil, 15–18 September 2014; Brazilian Metallurgy, Materials and Mining Association (ABM): Belo Horizonte, Brazil, 2014; pp. 1162–1175. [Google Scholar]
- Lecacheux, B.; Bailly, J.-L.; Sert, D.; Bolsigner, J.-P.; Iezzi, J.; Maurice, Y.; Eymond, J.-L.; Lusson, F.; Degrave, S.; Daelman, A.; et al. Characterization of Blast Furnace Operation by means of Multi-Points Vertical Probing Technology. In Proceedings of the 6th European Coke and Ironmaking Congress (ECIC), Düsseldorf, Germany, 27 June–1 July 2011; Steel Institute VDEh: Düsseldorf, Germany, 2011. [Google Scholar]
- Rausch, H.; Böhnisch, S.; Sert, D. EUR 21948—Extended Blast Furnace Permeability Monitoring; European Communities: Luxembourg, 2006; ISBN 92-79-01091-3. [Google Scholar]
- Bachhofen, H.-J.; Beppler, E.; Kowalski, W.; Mülheims, K.; Wachsmuth, H. Measurement of the Radial Gas Flow in the Upper Shaft and its Influence on Blast Furnace Performance. In EUR 18360—Measuring Techniques in Blast Furnace Ironmaking and Their Benefits for Industrial Practice; Poos, A., Ed.; European Communities: Luxembourg, 1998; pp. 61–70. ISBN 92-828-4281-9. [Google Scholar]
- Beppler, E.; Kannappel, M.; Kowalski, W.; Langner, K.; Müllheims, K.; Wachsmuth, H. Measurement of the Vertical Gas Flow and its Importance for the Blast Furnace. In EUR 18360—Measuring Techniques in Blast Furnace Ironmaking and Their Benefits for Industrial Practice; Poos, A., Ed.; European Communities: Luxembourg, 1998; pp. 111–120. ISBN 92-828-4281-9. [Google Scholar]
- Naito, M.; Takeda, K.; Matsui, Y. Ironmaking Technology for the Last 100 Years: Deployment to Advanced Technologies from Introduction of Technological Know-how, and Evolution to Next-generation Process. ISIJ Int. 2015, 55, 7–35. [Google Scholar] [CrossRef] [Green Version]
- Von Bogdandy, L.; Engell, H.-J. The Reduction of Iron Ores: Scientific Basis and Technology, 1st ed.; Springer: Berlin/Heidelberg, Germany, 1971; ISBN 978-3-662-10402-6. [Google Scholar]
- Zhu, D.; Pan, J.; Lu, L.; Holmes, R.J. Iron ore pelletization. In Iron Ore: Mineralogy, Processing and Environmental Sustainability; Elsevier: Amsterdam, The Netherlands, 2015; pp. 435–473. [Google Scholar]
- Umadevi, T.; Kumar, P.; Lobo, N.F.; Mahapatra, P.C.; Prabhu, M.; Ranjan, M. Effect of Iron Ore Pellet Size on its Properties and Microstructure. Steel Res. Int. 2009, 80, 709–716. [Google Scholar] [CrossRef]
- Jonckbloedt, R. Pelletizing of iron ores. In Proceedings of the International Online Seminar Iron Ores, 20–21 April 2021; Steel Institute VDEh: Düsseldorf, Germany, 2021. [Google Scholar]
- Walker, R.D. Modern Ironmaking Methods; Institute of Metals: London, UK, 1986; ISBN 978-0-901462-27-5. [Google Scholar]
- Iljana, M.; Mattila, O.; Alatarvas, T.; Visuri, V.-V.; Kurikkala, J.; Paananen, T.; Fabritius, T. Dynamic and Isothermal Reduction Swelling Behaviour of Olivine and Acid Iron Ore Pellets under Simulated Blast Furnace Shaft Conditions. ISIJ Int. 2012, 52, 1257–1265. [Google Scholar] [CrossRef] [Green Version]
- Iljana, M.; Mattila, O.; Alatarvas, T.; Kurikkala, J.; Paananen, T.; Fabritius, T. Effect of Circulating Elements on the Dynamic Reduction Swelling Behaviour of Olivine and Acid Iron Ore Pellets under Simulated Blast Furnace Shaft Conditions. ISIJ Int. 2013, 53, 419–426. [Google Scholar] [CrossRef] [Green Version]
- Iljana, M.; Kemppainen, A.; Paananen, T.; Mattila, O.; Pisilä, E.; Kondrakov, M.; Fabritius, T. Effect of adding limestone on the metallurgical properties of iron ore pellets. Int. J. Miner. Process. 2015, 141, 34–43. [Google Scholar] [CrossRef]
- Iljana, M. Iron Ore Pellet Properties under Simulated Blast Furnace Conditions. Investigation on Reducibility, Swelling and Softening. Ph.D. Thesis, University of Oulu, Oulu, Finland, 2017. [Google Scholar]
- Kemppainen, A.; Iljana, M.; Heikkinen, E.-P.; Paananen, T.; Mattila, O.; Fabritius, T. Reduction behavior of cold-bonded briquettes under simulated blast furnace conditions. ISIJ Int. 2014, 54, 1539–1545. [Google Scholar] [CrossRef] [Green Version]
- Kemppainen, A.; Ohno, K.-I.; Iljana, M.; Mattila, O.; Paananen, T.; Heikkinen, E.-P.; Maeda, T.; Kunitomo, K.; Fabritius, T. Softening Behaviors of Acid and Olivine Fluxed Iron Ore Pellets in the Cohesive Zone of a Blast Furnace. ISIJ Int. 2015, 55, 2039–2046. [Google Scholar] [CrossRef] [Green Version]
- Kemppainen, A. Limiting Phenomena Related to the Use of Iron Ore Pellets in a Blast Furnace. Ph.D. Thesis, University of Oulu, Oulu, Finland, 2015. [Google Scholar]
- Kemppainen, A.; Iljana, M.; Heikkinen, E.-P.; Paananen, T.; Mattila, O.; Fabritius, T. Recent development in the evaluation of the high-temperature properties of iron ore pellets. In Proceedings of the 5th International Conference on Process Development in Iron and Steelmaking (SCANMET V), Luleå, Sweden, 12–15 June 2016; Swerea MEFOS: Luleå, Sweden, 2016. ISBN 978-91-639-1233-7. [Google Scholar]
- Kemppainen, A.; Mousa, E.; Wang, C.; Suopajärvi, H.; Iljana, M.; Heikkinen, E.-P.; Fabritius, T. Introduction of biomass lignin to blast furnace process as cement substitute in cold bonded briquettes. In Proceedings of the 1st International Conference on Energy and Material Efficiency and CO2 Reduction in the Steel Industry (EMECR 2017), Kobe, Japan, 11–13 October 2017; The Iron and Steel Institute of Japan (ISIJ): Tokyo, Japan, 2017; pp. 386–389. [Google Scholar]
- Heikkilä, A.; Iljana, M.; Bartusch, H.; Fabritius, T. Reduction of iron ore pellets, sinter and lump ore under simulated blast furnace conditions. In Proceedings of the METEC & 4th European Steel Technology and Application Days (ESTAD), Düsseldorf, Germany, 24–28 June 2019; Steel Institute VDEh: Düsseldorf, Germany, 2019. [Google Scholar]
- Heikkilä, A.; Iljana, M.; Bartusch, H.; Fabritius, T. Reduction of Iron Ore Pellets, Sinter, and Lump Ore under Simulated Blast Furnace Conditions. Steel Res. Int. 2020, 91, 2000047. [Google Scholar] [CrossRef] [Green Version]
- Abdelrahim, A.; Iljana, M.; Omran, M.; Vuolio, T.; Bartusch, H.; Fabritius, T. Influence of H2–H2O content on the reduction of acid iron ore pellets in a CO-CO2-N2 reducing atmosphere. ISIJ Int. 2020, 60, 2206–2217. [Google Scholar] [CrossRef]
- Heikkilä, A.M.; Koskela, A.M.; Iljana, M.O.; Lin, R.; Bartusch, H.; Heikkinen, E.-P.; Fabritius, T.M.J. Coke Gasification in Blast Furnace Shaft Conditions with H2 and H2O Containing Atmospheres. Steel Res. Int. 2021, 92, 2000456. [Google Scholar] [CrossRef]
- ISO 7215; 2015 Iron Ores for Blast Furnace Feedstocks—Determination of the Reducibility by the Final Degree of Reduction Index; International Organization for Standardization (ISO): Geneva, Switzerland, 2015; pp. 1–11.
- Sterneland, J. Some Aspects on the Reduction of Olivine Pellets in Laboratory Scale and in an Experimental Blast Furnace. Ph.D. Thesis, Royal Institute of Technology (KTH), Stockholm, Sweden, 2002. [Google Scholar]
- Sterneland, J.; Lahiri, A.K. Contraction and meltdown behaviour of olivine iron ore pellets under simulated blast furnace conditions. Ironmak. Steelmak. 1999, 26, 339–348. [Google Scholar] [CrossRef]
- Sterneland, J.; Lahiri, A. New Equipment for Simulation of Blast Furnace Reduction. In Proceedings of the 58th Ironmaking Conference, Chicago, IL, USA, 21–24 March 1999; Iron and Steel Society: Warrendale, PA, USA, 1999; pp. 467–483. [Google Scholar]
- Loo, C.E.; Bristow, N.J. Properties of iron bearing materials under simulated blast furnace indirect reduction conditions: Part 3 Reducibility. Ironmak. Steelmak. 1998, 25, 366–373. [Google Scholar]
- Rengersen, J. EUR 12637—Improvement of Blast Furnace Burden Quality; European Communities: Luxembourg, 1990; ISBN 92-826-1284-8. [Google Scholar]
- Watakabe, S.; Miyagawa, K.; Matsuzaki, S.; Inada, T.; Tomita, Y.; Saito, K.; Osame, M.; Sikström, P.; Ökvist, L.S.; Wikstrom, J.-O. Operation trial of hydrogenous gas injection of COURSE50 project at an experimental blast furnace. ISIJ Int. 2013, 53, 2065–2071. [Google Scholar] [CrossRef] [Green Version]
- Jaffarullah, R.; Arumugam, A.; Jha, V.K.; Narayanan, V. Reduction and degradation behaviour of sinter under simulated vertical probe trial condition. ISIJ Int. 2008, 48, 918–924. [Google Scholar] [CrossRef] [Green Version]
Figure 1.
A typical gas composition—temperature operation line for wall and center gas flows in an operating furnace, shown in a Fe-O-C phase diagram, in the manner of Geerdes et al. [11] (p. 120).
Figure 1.
A typical gas composition—temperature operation line for wall and center gas flows in an operating furnace, shown in a Fe-O-C phase diagram, in the manner of Geerdes et al. [11] (p. 120).

Figure 2.
Gas composition and temperature as a function of time in non-isothermal reduction, using (a) the wall profile in CO-CO2-N2 gas, (b) the wall profile in CO-CO2-H2-H2O-N2 gas, (c) the center profile in CO-CO2-N2 gas, and (d) the center profile in CO-CO2-H2-H2O-N2 gas.
Figure 2.
Gas composition and temperature as a function of time in non-isothermal reduction, using (a) the wall profile in CO-CO2-N2 gas, (b) the wall profile in CO-CO2-H2-H2O-N2 gas, (c) the center profile in CO-CO2-N2 gas, and (d) the center profile in CO-CO2-H2-H2O-N2 gas.

Figure 3.
Experimental conditions shown in Baur-Glaessner diagrams in relation to (a) etaCO, and (b) etaH2.
Figure 3.
Experimental conditions shown in Baur-Glaessner diagrams in relation to (a) etaCO, and (b) etaH2.

Figure 4.
A pellet sample in the BFS basket before reduction.

Figure 5.
Pellets photographed in the sample basket after isothermal reduction, using the wall and center profiles in CO-CO2-N2 and CO-CO2-H2-H2O-N2 gases.
Figure 5.
Pellets photographed in the sample basket after isothermal reduction, using the wall and center profiles in CO-CO2-N2 and CO-CO2-H2-H2O-N2 gases.

Figure 6.
Reduction curves for the pellets reduced isothermally at (a) 700, (b) 800, (c) 900, (d) 1000, and (e) 1100 °C, simulating the wall and center conditions in a CO-CO2-N2 gas.
Figure 6.
Reduction curves for the pellets reduced isothermally at (a) 700, (b) 800, (c) 900, (d) 1000, and (e) 1100 °C, simulating the wall and center conditions in a CO-CO2-N2 gas.

Figure 7.
Reduction curves for the pellets reduced isothermally at (a) 700, (b) 800, (c) 900, (d) 1000, and (e) 1100 °C, simulating the wall and center conditions in a CO-CO2-H2-H2O-N2 gas.
Figure 7.
Reduction curves for the pellets reduced isothermally at (a) 700, (b) 800, (c) 900, (d) 1000, and (e) 1100 °C, simulating the wall and center conditions in a CO-CO2-H2-H2O-N2 gas.

Figure 8.
Pellet cross-sections after isothermal reduction at 800 °C, using (a) the wall profile in CO-CO2-N2 gas, (b) the wall profile in CO-CO2-H2-H2O-N2 gas, (c) the center profile in CO-CO2-N2 gas, and (d) the center profile in CO-CO2-H2-H2O-N2 gas.
Figure 8.
Pellet cross-sections after isothermal reduction at 800 °C, using (a) the wall profile in CO-CO2-N2 gas, (b) the wall profile in CO-CO2-H2-H2O-N2 gas, (c) the center profile in CO-CO2-N2 gas, and (d) the center profile in CO-CO2-H2-H2O-N2 gas.


Figure 9.
Pellet cross-sections after isothermal reduction at 900 °C, using (a) the wall profile in CO-CO2-N2 gas, (b) the wall profile in CO-CO2-H2-H2O-N2 gas, (c) the center profile in CO-CO2-N2 gas, and (d) the center profile in CO-CO2-H2-H2O-N2 gas.
Figure 9.
Pellet cross-sections after isothermal reduction at 900 °C, using (a) the wall profile in CO-CO2-N2 gas, (b) the wall profile in CO-CO2-H2-H2O-N2 gas, (c) the center profile in CO-CO2-N2 gas, and (d) the center profile in CO-CO2-H2-H2O-N2 gas.


Figure 10.
Pellet cross-sections after isothermal reduction at 1000 °C, using (a) the wall profile in CO-CO2-N2 gas, (b) the wall profile in CO-CO2-H2-H2O-N2 gas, (c) the center profile in CO-CO2-N2 gas, and (d) the center profile in CO-CO2-H2-H2O-N2 gas.
Figure 10.
Pellet cross-sections after isothermal reduction at 1000 °C, using (a) the wall profile in CO-CO2-N2 gas, (b) the wall profile in CO-CO2-H2-H2O-N2 gas, (c) the center profile in CO-CO2-N2 gas, and (d) the center profile in CO-CO2-H2-H2O-N2 gas.


Figure 11.
Pellets photographed in the sample basket after the non-isothermal reduction, using (a) the wall profile in CO-CO2-N2 gas, (b) the wall profile in CO-CO2-H2-H2O-N2 gas, (c) the center profile in CO-CO2-N2 gas, and (d) the center profile in CO-CO2-H2-H2O-N2 gas.
Figure 11.
Pellets photographed in the sample basket after the non-isothermal reduction, using (a) the wall profile in CO-CO2-N2 gas, (b) the wall profile in CO-CO2-H2-H2O-N2 gas, (c) the center profile in CO-CO2-N2 gas, and (d) the center profile in CO-CO2-H2-H2O-N2 gas.

Figure 12.
Reduction curves against (a) the experimental time in a CO-CO2-N2 gas, (b) the sample temperature in a CO-CO2-N2 gas, (c) the experimental time in a CO-CO2-H2-H2O-N2 gas, and (d) the sample temperature in a CO-CO2-H2-H2O-N2 gas, for non-isothermal reductions, simulating the BF wall and center conditions.


Figure 13.
Pellet cross-sections after non-isothermal reduction, using (a) the wall profile in CO-CO2-N2 gas, (b) the wall profile in CO-CO2-H2-H2O-N2 gas, (c) the center profile in CO-CO2-N2 gas, and (d) the center profile in CO-CO2-H2-H2O-N2 gas.
Figure 13.
Pellet cross-sections after non-isothermal reduction, using (a) the wall profile in CO-CO2-N2 gas, (b) the wall profile in CO-CO2-H2-H2O-N2 gas, (c) the center profile in CO-CO2-N2 gas, and (d) the center profile in CO-CO2-H2-H2O-N2 gas.


Table 1.
Chemical composition (in wt.%) and basicity of the pellets.
| Fetot | FeO | SiO2 | CaO | MgO | Al2O3 | S | Na2O | K2O | B2 | B4 |
|---|---|---|---|---|---|---|---|---|---|---|
| 64.6 | <0.1 | 6.0 | 1.2 | 0.73 | 0.39 | 0.007 | 0.09 | 0.05 | 0.20 | 0.30 |
Table 2.
Experimental program for the wall profile. Time information is cumulative and valid only for non-isothermal tests (numbered 1–10).
Table 2.
Experimental program for the wall profile. Time information is cumulative and valid only for non-isothermal tests (numbered 1–10).
| Time [min] | Temp [°C] | # | CO [vol.%] | CO2 [vol.%] | N2 [vol.%] | # | CO [vol.%] | CO2 [vol.%] | H2 [vol.%] | H2O [vol.%] | N2 [vol.%] | pO2 [atm] |
|---|---|---|---|---|---|---|---|---|---|---|---|---|
| 0 | 400 | 21.48 | 27.35 | 51.17 | 20.87 | 26.57 | 2.51 | 0.33 | 49.72 | |||
| 3.3 | 500 | 22.03 | 27.13 | 50.84 | 21.32 | 26.25 | 2.59 | 0.64 | 49.20 | |||
| 6.1 | 600 | 23.10 | 26.36 | 50.54 | 22.17 | 25.30 | 2.79 | 1.22 | 48.52 | |||
| 15.7 | 700 | 1 | 24.79 | 24.84 | 50.37 | 6 | 23.53 | 23.58 | 3.11 | 1.98 | 47.80 | 5.74 × 10⁻²² |
| 27.6 | 800 | 2 | 29.70 | 20.65 | 49.65 | 7 | 27.81 | 19.34 | 3.82 | 2.52 | 46.51 | 1.85 × 10⁻¹⁹ |
| 34.3 | 850 | 31.01 | 19.45 | 49.54 | 28.89 | 18.12 | 4.01 | 2.82 | 46.16 | |||
| 46.3 | 900 | 3 | 32.56 | 17.01 | 50.43 | 8 | 30.03 | 15.69 | 4.61 | 3.15 | 46.52 | 2.29 × 10⁻¹⁷ |
| 54.5 | 950 | 33.87 | 14.31 | 51.82 | 30.99 | 13.09 | 5.20 | 3.30 | 47.42 | |||
| 93.3 | 1000 | 4 | 37.25 | 11.36 | 51.39 | 9 | 34.09 | 10.40 | 5.59 | 2.90 | 47.02 | 7.30 × 10⁻¹⁶ |
| 102.9 | 1050 | 41.12 | 6.89 | 51.99 | 37.88 | 6.35 | 5.96 | 1.91 | 47.90 | |||
| 109.6 | 1100 | 5 | 43.49 | 4.34 | 52.17 | 10 | 40.22 | 4.02 | 6.22 | 1.32 | 48.22 | 3.75 × 10⁻¹⁵ |
Table 3.
Experimental program for the center profile. Time information is cumulative and valid only for non-isothermal tests (numbered 11–20).
Table 3.
Experimental program for the center profile. Time information is cumulative and valid only for non-isothermal tests (numbered 11–20).
| Time [min] | Temp [°C] | # | CO [vol.%] | CO2 [vol.%] | N2 [vol.%] | # | CO [vol.%] | CO2 [vol.%] | H2 [vol.%] | H2O [vol.%] | N2 [vol.%] | pO2 [atm] |
|---|---|---|---|---|---|---|---|---|---|---|---|---|
| 0 | 500 | 28.66 | 19.32 | 52.02 | 27.41 | 18.48 | 3.82 | 0.51 | 49.78 | |||
| 43.4 | 600 | 29.16 | 19.52 | 51.32 | 27.44 | 18.37 | 4.69 | 1.21 | 48.29 | |||
| 64.4 | 700 | 11 | 30.69 | 17.53 | 51.78 | 16 | 28.56 | 16.31 | 5.10 | 1.85 | 48.18 | 1.86 × 10⁻²² |
| 90.9 | 800 | 12 | 36.37 | 13.07 | 50.56 | 17 | 33.69 | 12.10 | 5.50 | 1.87 | 46.84 | 4.95 × 10⁻²⁰ |
| 96.8 | 850 | 38.35 | 10.29 | 51.36 | 35.41 | 9.50 | 5.88 | 1.77 | 47.44 | |||
| 102.8 | 900 | 13 | 40.15 | 7.88 | 51.97 | 18 | 37.07 | 7.28 | 6.11 | 1.57 | 47.97 | 3.24 × 10⁻¹⁸ |
| 108.7 | 950 | 44.00 | 3.49 | 52.51 | 40.73 | 3.23 | 6.63 | 0.79 | 48.62 | |||
| 112.9 | 1000 | 14 | 47.25 | 1.41 | 51.34 | 19 | 43.56 | 1.30 | 7.43 | 0.38 | 47.33 | 6.99 × 10⁻¹⁸ |
| 116.3 | 1050 | 48.85 | 1.09 | 50.06 | 44.96 | 1.00 | 7.64 | 0.33 | 46.07 | |||
| 119.8 | 1100 | 15 | 49.41 | 1.09 | 49.50 | 20 | 45.44 | 1.00 | 7.67 | 0.36 | 45.53 | 1.83 × 10⁻¹⁶ |
Table 4.
Final reduction degrees for the pellets in the non-isothermal experiments.
| Program | CO-CO2-N2 Gas | CO-CO2-H2-H2O-N2 Gas |
|---|---|---|
| Wall | 35.3 | 40.7 |
| Center | 35.2 | 47.2 |
Publisher’s Note: MDPI stays neutral with regard to jurisdictional claims in published maps and institutional affiliations. |
© 2022 by the authors. Licensee MDPI, Basel, Switzerland. This article is an open access article distributed under the terms and conditions of the Creative Commons Attribution (CC BY) license (https://creativecommons.org/licenses/by/4.0/).
Share and Cite
MDPI and ACS Style
Iljana, M.; Abdelrahim, A.; Bartusch, H.; Fabritius, T. Reduction of Acid Iron Ore Pellets under Simulated Wall and Center Conditions in a Blast Furnace Shaft. Minerals 2022, 12, 741. https://0-doi-org.brum.beds.ac.uk/10.3390/min12060741
AMA Style
Iljana M, Abdelrahim A, Bartusch H, Fabritius T. Reduction of Acid Iron Ore Pellets under Simulated Wall and Center Conditions in a Blast Furnace Shaft. Minerals. 2022; 12(6):741. https://0-doi-org.brum.beds.ac.uk/10.3390/min12060741
Chicago/Turabian StyleIljana, Mikko, Ahmed Abdelrahim, Hauke Bartusch, and Timo Fabritius. 2022. "Reduction of Acid Iron Ore Pellets under Simulated Wall and Center Conditions in a Blast Furnace Shaft" Minerals 12, no. 6: 741. https://0-doi-org.brum.beds.ac.uk/10.3390/min12060741
Note that from the first issue of 2016, this journal uses article numbers instead of page numbers. See further details here.